Article

AGRI-YOLO: A Lightweight Model for Corn Weed Detection with Enhanced YOLO v11n

1
College of Mathematics and Statistics, North China University of Water Resources and Electric Power, Zhengzhou 450046, China
2
College of Water Resources, North China University of Water Resources and Electric Power, Zhengzhou 450046, China
*
Author to whom correspondence should be addressed.
Agriculture 2025, 15(18), 1971; https://doi.org/10.3390/agriculture15181971
Submission received: 21 July 2025 / Revised: 11 September 2025 / Accepted: 17 September 2025 / Published: 18 September 2025
(This article belongs to the Section Artificial Intelligence and Digital Agriculture)

Abstract

Corn, as a globally significant food crop, faces significant yield reductions due to competitive growth from weeds. Precise detection and efficient control of weeds are critical technical components for ensuring high and stable corn yields. Traditional deep learning object detection models generally suffer from issues such as large parameter counts and high computational complexity, making them unsuitable for deployment on resource-constrained devices such as agricultural drones and portable detection devices. Based on this, this paper proposes a lightweight corn weed detection model, AGRI-YOLO, based on the YOLO v11n architecture. First, the DWConv (Depthwise Separable Convolution) module from InceptionNeXt is introduced to reconstruct the C3k2 feature extraction module, enhancing the feature extraction capabilities for corn seedlings and weeds. Second, the ADown (Adaptive Downsampling) downsampling module replaces the Conv layer to address the issue of redundant model parameters; The LADH (Lightweight Asymmetric Detection) detection head is adopted to achieve dynamic weight adjustment while ensuring multi-branch output optimization for target localization and classification precision. Experimental results show that the AGRI-YOLO model achieves a precision rate of 84.7%, a recall rate of 73.0%, and a mAP50 value of 82.8%. Compared to the baseline architecture YOLO v11n, the results are largely consistent, while the number of parameters, G FLOPs, and model size are reduced by 46.6%, 49.2%, and 42.31%, respectively. The AGRI-YOLO model significantly reduces model complexity while maintaining high recognition precision, providing technical support for deployment on resource-constrained edge devices, thereby promoting agricultural intelligence, maintaining ecological balance, and ensuring food security.

1. Introduction

As one of the three primary staple crops globally, corn holds a crucial position in safeguarding the steady functioning of agricultural markets and preserving national food security [1]. In China, corn accounts for 33.6% of the total area planted with staple crops and 36.1% of total grain production [2]. Yield reductions associated with weeds constitute roughly 3 million tons of the annual grain output [3]. During the growth stages of corn, particularly when it has 3 to 5 leaves, weed proliferation can lead to a significant decline in corn yield. Currently, herbicides, as the main means of weed control, are commonly used for their low cost and effectiveness [4]. However, overuse not only affects crop yields but also causes ecological issues such as non-point source pollution and soil contamination [5]. Accurate identification of crops and weeds is key to intelligent weed control. This technology not only increases crop yields but also significantly reduces pesticide use through precise application. It has irreplaceable strategic value in reducing agricultural nonpoint source pollution, safeguarding the ecological environment and advancing sustainable agricultural growth.
In recent years, weed identification technologies powered by machine learning and deep learning have emerged as the dominant method for effective weed detection. In agricultural applications, the methods used in machine learning cover multivariate data analysis [6], principal component analysis [7], template matching [8], and random forests [9], which still primarily rely on characteristics like color, texture, and morphology that crops and weeds exhibit in the images to distinguish between different classes of targets. However, from a practical application perspective, recognition precision remains low and cannot meet the strict requirements for precision farming in agricultural production. The advent of Convolutional Neural Networks (CNNs) can be traced back to the pioneering work of LeCun et al. [10] and have been widely applied to tasks including image segmentation, crop classification, disease detection, and weed identification. OLSEN et al. [11] built the DeepWeeds dataset for multi-class weeds, and this dataset was applied to train the InceptionV3 and ResNet-50 models for weed identification. Ahmad et al. [12] evaluated the weed recognition performance of three popular models, with the VGG-16 model achieving the highest precision. Herrera et al. [13] presented an approach to tell monocotyledonous and dicotyledonous weeds apart, with the precision reaching 85.8%. Peteinatos et al. [14] Convolutional neural networks were employed to develop a deep learning-oriented weed recognition framework, with the improved weed recognition model achieving an mAP exceeding 74%.
The aforementioned studies have widely employed multi-layer deep convolutional neural network architectures that were leveraged to accomplish target feature extraction and recognition objectives. Nonetheless, these deep learning models are plagued by challenges like substantial model size, an abundance of parameters, and suboptimal detection efficiency, which hinder their effective deployment on compact mobile devices. Therefore, scholars have started to direct their attention to lightweight optimization approaches for object detection models. Zhang et al. [15] proposed the model of F-YOLOv8n-seg-CDA achieves precise localization of the apical meristem of weeds through instance segmentation, reducing floating-point operations by 26.7% and model size by 38.2%. Zuo et al. [16]. designed the LBDC-YOLO model in an experiment to detect broccoli heads, which reduced the computational complexity by 32.1%, parameters by 47.8%, and model size by 44.4%. Jia et al. [17] put forward the ADL-YOLOv8 model, which brought about a 15.77% scaling down of the model size and a 10.98% decrease in computational complexity during the execution of weed recognition tasks. Ma et al. [18] proposed YOLO-CWD model achieves detection of crops and weeds with an mAP50 value of 0.751, has 3.49 million parameters, and requires 9.6 GFLOPS of computing resources. Wang et al. [19] applied the v5s_FasterNet_CBAM_WIoU model in a straw-covered environment, and the parameters were reduced by 50.36%, and the GFLOPs were decreased by 53.16%. Tao et al. [20] proposed that STBNA-YOLOv5 for weed identification of rapeseed can achieve good precision, F1-score, and mAP@0.5, achieving scores of 0.644, 0.825, and 0.908, as shown in Table 1.
Although the aforementioned research has made some progress, despite the progress made in the aforementioned research, there remain gaps in the field of lightweight technology studies within corn cultivation environments. First, corn seedlings and weeds are intertwined, and complex background noise severely affects detection precision; second, existing methods perform poorly when detecting small targets; finally, the model is hindered by excessive parameters, large size, and slow detection speed, making it difficult to deploy smoothly on mobile devices. In response to these challenges, this study develops the AGRI-YOLO, an efficient lightweight weed recognition model built upon YOLO v11n. The main contributions of this study are as follows:
(1) In terms of feature extraction, the DWConv was introduced to reconstruct the C3k2 module, optimizing the parameter configuration of the convolutional layer while retaining the feature fusion capabilities of the C3k2 module, enhancing the feature representation capabilities of corn seedlings and weeds.
(2) All convolutional layers responsible for downsampling in the P3 layer and subsequent layers of the backbone network are replaced by ADown modules. While preserving key features, this approach captures weed characteristics across different scales, effectively mitigating detail loss caused by excessive downsampling. It enhances detection efficiency for complex-textured weed images and resolves issues of redundant model parameters and insufficient feature extraction capabilities.
(3) The LADH lightweight detection head enables dynamic weight adjustment, ensuring optimized multi-channel output. This enhances target localization and classification accuracy, reduces the number of parameters, and improves recognition precision for small targets.
(4) Through comparative experiments with mainstream models such as YOLO v5, YOLO v8, YOLO v9, and YOLO v10, the strengths of the AGRI-YOLO model with regard to detection precision, model lightweighting, and real-time performance were validated, offering theoretical and technical backing for real-time weed detection, reducing dependence on chemical herbicides, improving crop yields, and maintaining ecological balance.

2. Dataset

2.1. Data Collection and Dataset Construction

In this study, our focus was placed on maize seedlings and their associated weeds, with the selection of the Experimental Field for Efficient Agricultural Water Use and Irrigation at North China University of Water Resources and Electric Power, located in Zhengzhou, Henan Province, China (34°78 N, 113°79 E), to complete the construction of the dataset. The acquisition of images was mainly accomplished in July 2024 at 9:00–11:00 a.m. and 17:00–19:00 p.m. using an iPhone 12 Promax, 30–50 cm above the ground. This growth stage represents a critical period during corn’s 3–5 leaf development phase, coinciding with the most intense competition between maize and weeds. In total, 867 images were acquired, including 161 images depicting Cirsium setosum, 179 images featuring Sedge, 171 images showing Digitaria sanguinalis, 174 images of Chenopodium album, and 182 images of corn seedlings. The geographic location of the study area is shown in Figure 1.

2.2. Dataset Divisions

In this study, all original images in the dataset were standardized to a 640 × 640 pixel resolution while preserving the target scale. In addition, to enhance the model’s capacity to generalize across diverse scenarios, the dataset underwent a systematic splitting process. It was allocated into three subsets—training, validation, and test sets, with their proportions set to 70%, 20%, and 10% in that order. The comprehensive details of this dataset partitioning, including the distribution of samples and key statistical metrics, are meticulously documented in Table 2.

2.3. Data Enhancement

To enhance the model’s detection precision and robustness for corn weeds in complex agricultural field environments, a data enhancement strategy was employed in the research. Python 3.10, as a programming language, leverages Python’s core libraries and image processing libraries. These include os, numpy, random, argparse, and PIL. The data enhancement strategy mainly consists of HSV random transformation [21] (as shown in Figure 2b), which generates random gain coefficients for each channel, randomly shifts the hue setting within a range of ±0.5, and randomly scales the saturation and brightness in the range of 0.5 to 1.5 times, so as to simulate color variations under diverse lighting conditions and crop growth phases; A salt-and-pepper noise [22] enhancement model with a noise injection ratio of 0.03 was used to adapt the model to image sensor noise (as shown in Figure 2c); A fuzzy transformation with a maximum convolution kernel size of 15 was employed to enhance robustness in blurry environments [23] (as shown in Figure 2d); horizontal flipping [24] was applied to maintain spatial relationships between targets while expanding data diversity (as shown in Figure 2e); brightness adjustment [25] was combined with a brightness factor of 0.6 to simulate different weather conditions (as shown in Figure 2f).
After completing data enhance processing, the dataset was partitioned. The number of samples corresponding to each target category is shown in Table 3. The final dataset contains a total of 4335 images. Among them, there are 805 images of Cirsium setosum, 895 images of Sedge, 855 images of Digitaria sanguinalis, 870 images of Chenopodium album, and 910 images of Corn.

2.4. Dataset Labeling

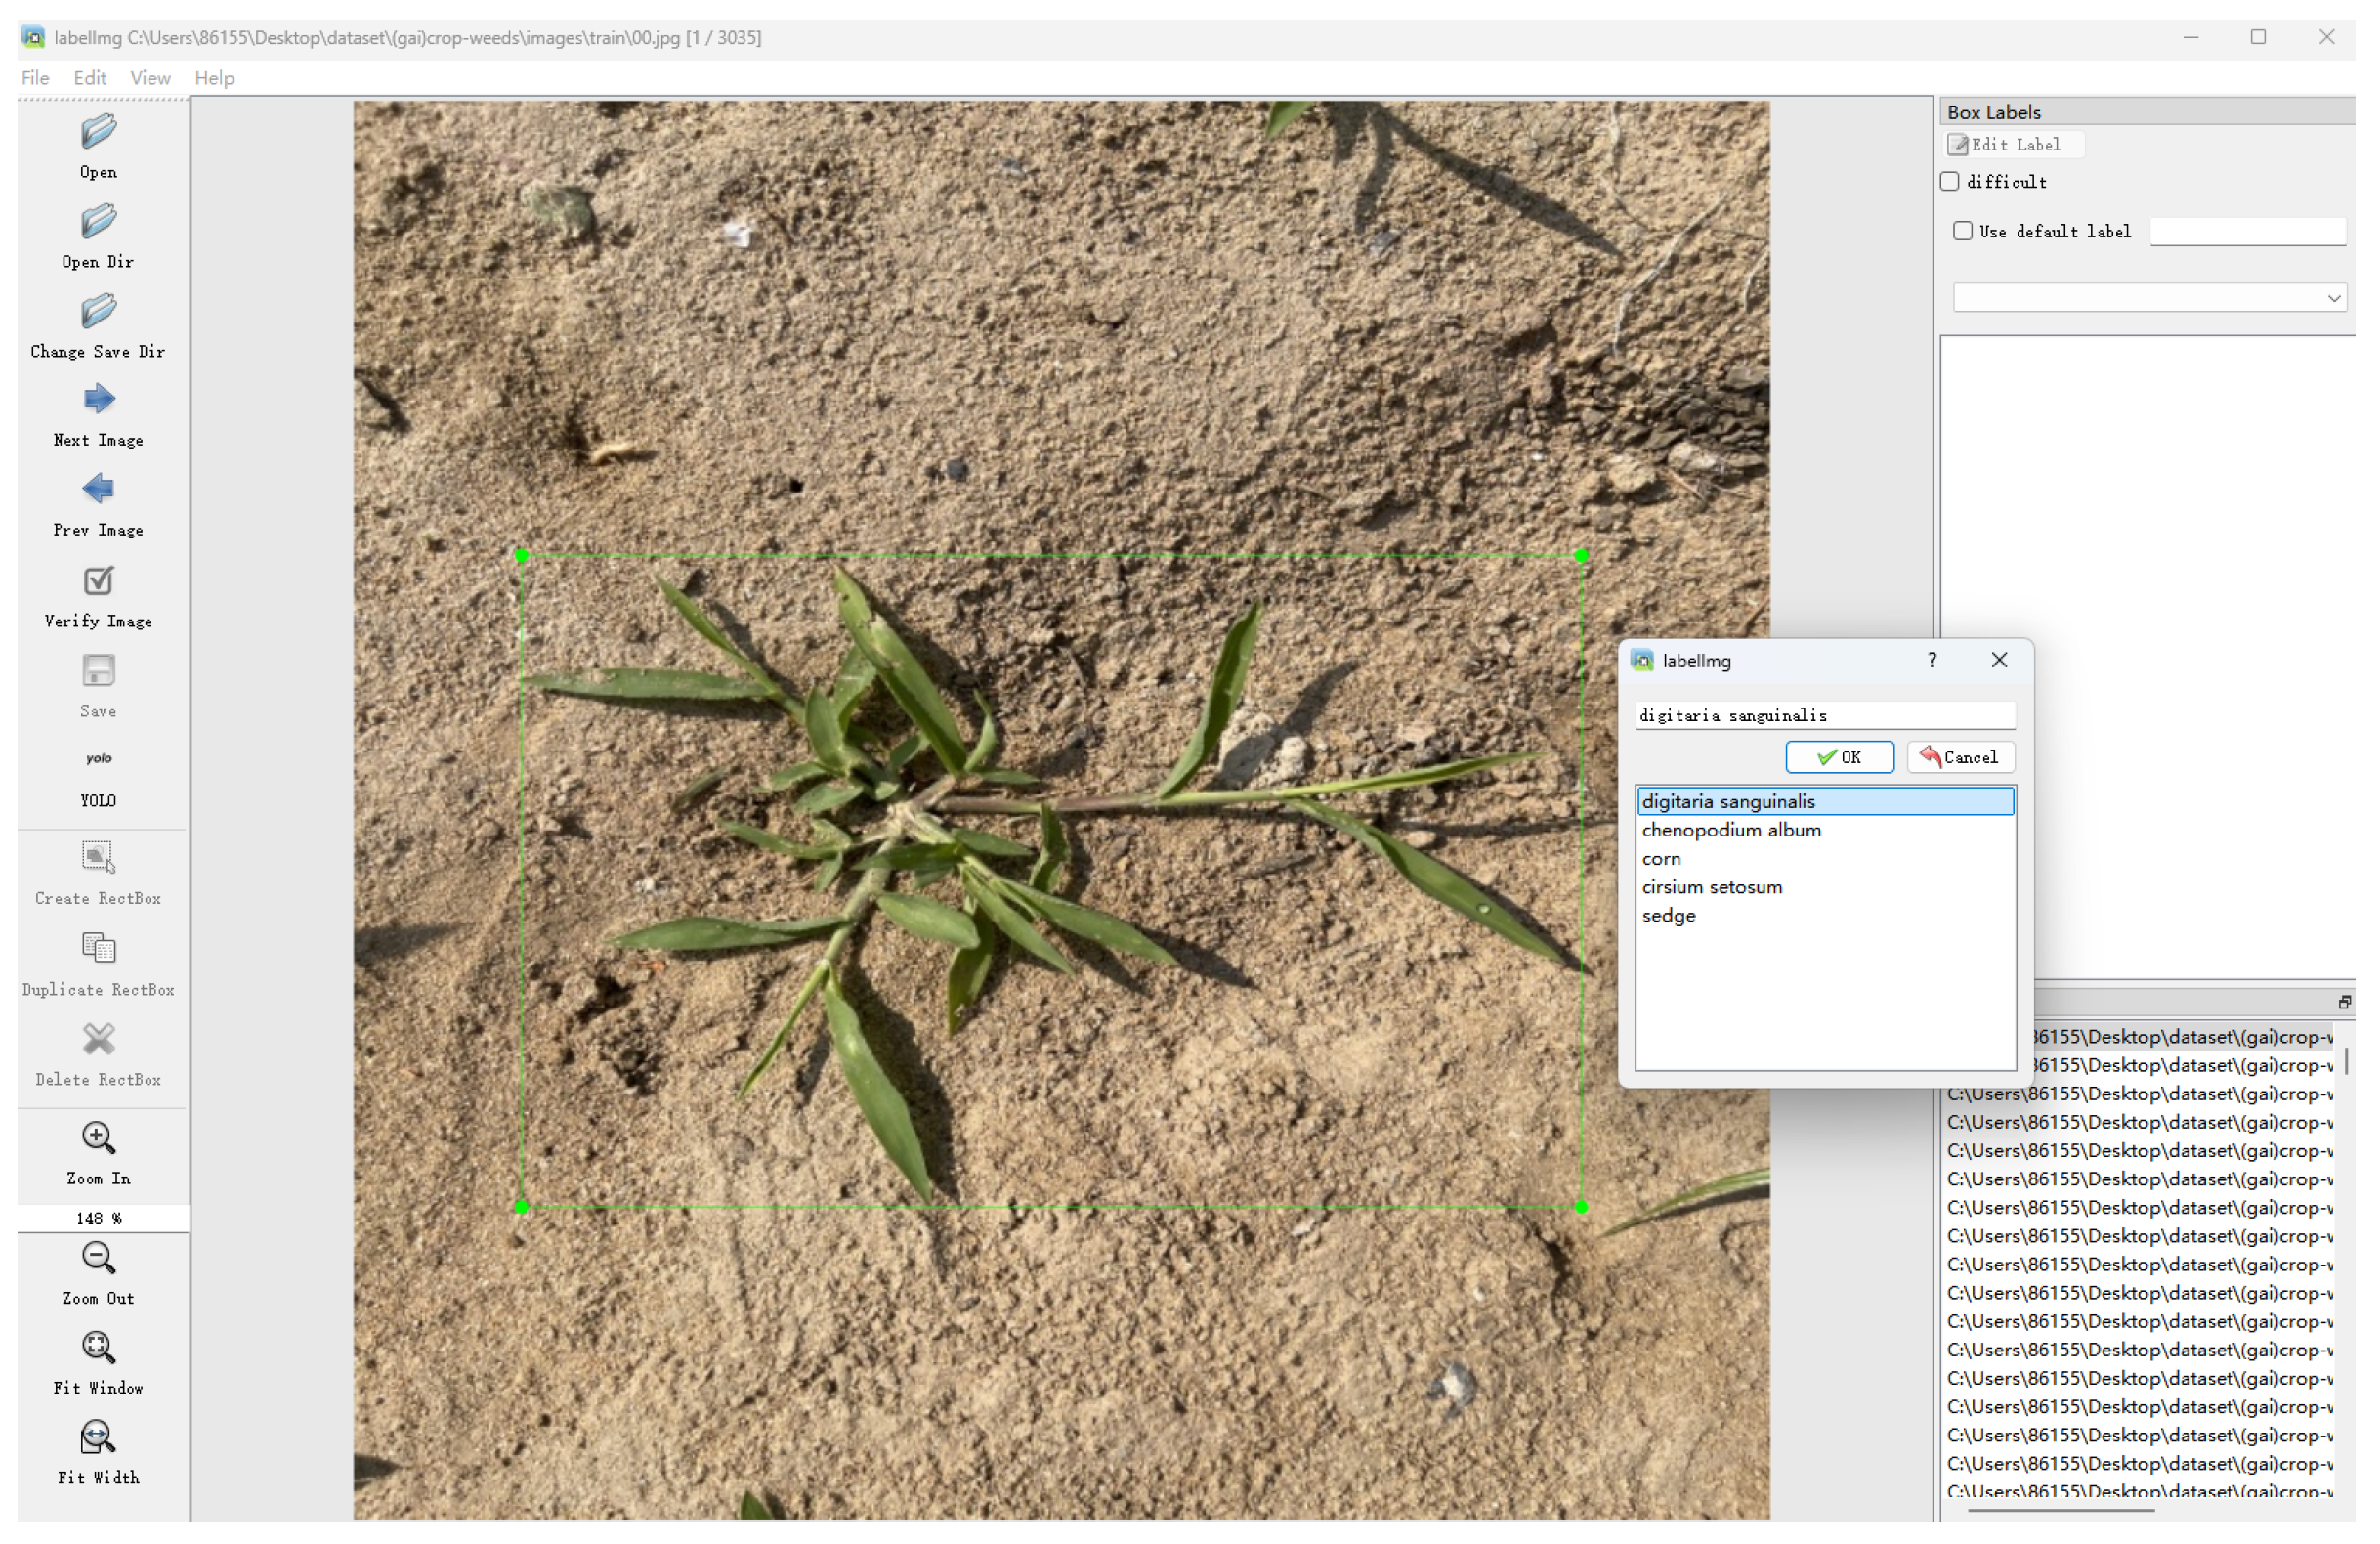
To ensure dataset precision and standardization, this study employed Labellmg (version: 1.8.6) annotation software to manually annotate the created dataset. The labeling was done in YOLO format. The labeling categories were divided into five categories, namely Corn, Digitaria sanguinalis, Sedge, Cirsium setosum, and Chenopodium album. During enhanced, for clearly visible individual plants, the annotation box must closely follow the plant’s edge. For clustered or partially obscured targets, the annotation box must cover the complete visible contour, and annotation is only performed when the obscured proportion is ≤30%. The annotation sequence follows a fixed path of “left to right, top to bottom”, avoiding duplicate annotations or missed targets. The annotation process underwent cross-validation by two agricultural engineering professionals, achieving a 99.7% object annotation accuracy rate with no errors or omissions. This approach prevents model training bias caused by annotation errors. The process of using Labellmg for annotation is shown in Figure 3.

3. Methods

3.1. Lightweight Model Improved Based on YOLO v11n

In 2024, the Ultralytics team rolled out YOLO v11; this model is structured around three pivotal components [26]. The biggest advantage is that C3k2 supports flexible selection of custom convolutional kernel sizes, achieving a balance between feature extraction efficiency and model configuration flexibility. Additionally, a new C2PSA layer has been added after the SPPF layer [27]. The YOLO v11n network structure diagram is shown in Figure 4.
While YOLO v11 demonstrates robust performance in generic object detection, it exhibits notable limitations in corn weed detection scenarios. Moreover, it demonstrates inadequate adaptability to complex backgrounds and small-scale targets, thus failing to satisfy the demands of corn weed detection. This paper proposes the AGRI-YOLO model based on the YOLO v11n model. In terms of feature extraction, the DWConv from the InceptionNeXt model was introduced to reconstruct the C3k2 module, optimizing the parameter configuration of the convolutional layer while retaining the feature fusion capabilities of the C3k2 module. Subsequently, the convolutional layers responsible for downsampling in the P3 layer and subsequent layers of the main network are replaced with the ADown module. The ADown module dynamically determines the feature transmission path, capturing weed features at different scales while retaining key features. This effectively reduces detail loss caused by excessive downsampling, improves detection efficiency for complex textured weed images, and addresses issues of model parameter redundancy and insufficient feature extraction capability. Finally, the LADH detection head is adopted to achieve dynamic weight adjustment, ensuring multi-branch output optimization to enhance target localization and classification precision, reduce parameter count, and improve small target recognition precision. The ultimate goal of the research is to provide a reliable technical tool for “precision weeding”, through high-precision detection of corn weeds, to assist in the subsequent application of drugs only to weed areas, reducing the amount of pesticides, to provide technical support for mechanical weeding in precision agriculture, reduce agricultural production costs, reduce environmental pollution, and promote the landing of smart agriculture. The improved network structure diagram is shown in Figure 5.

3.2. Reconstructing the C3k2 Feature Extraction Module

Conventional convolution essentially entails conducting convolutional operations applied to each channel of the input feature map with a quantity of convolution kernels equivalent to the number of input channels [28]. Meanwhile, it simultaneously integrates information across both spatial and channel dimensions. The convolution kernels span all channels of the input feature map, causing information from distinct channels to intermingle during the convolution process. In contrast, DWConv first performs independent convolutional operations on each channel of the input feature map, propagating spatial information while explicitly avoiding cross-channel feature mixing. This is then followed by a 1 × 1 convolution layer to achieve channel-wise information fusion. DWConv broadens the model’s receptive field through the employment of large kernels, allowing it to capture more extensive spatial information within images. The working mechanism of DWConv is depicted in Figure 6.
In the InceptionNeXt model, the DWConv operates primarily by dividing the input feature map X along the channel dimension. The input is split into four groups, corresponding to small square convolutional kernels, orthogonal striped convolutional kernels, and identity mappings [29]. Inception deep convolution is an improved version of DWConv. Since not all input channels require computationally intensive deep convolution operations, the large kernel depth convolution is decomposed into four parallel branches. Input X is split into four groups, namely X h w ,   X w ,   X h   and   X i d , along the channel dimension. The split input is sent to different parallel branches X h w ,   X w ,   X h   and   X i d . X h w is the input feature for the small square kernel branch. After undergoing a 3 × 3 depth-separable convolution, it yields X h w . X w is the input for the horizontal strip kernel branch, yielding X w after processing. X h corresponds to the vertical band kernel branch input, yielding X h after processing. X i d undergoes an identity mapping to produce X i d . Eventually, the outputs from these four branches are merged along the channel dimension, thus boosting model efficiency while retaining precision, as shown in Equations (1)–(5).
X h w = D W C o n v k s × k s g g g X h w
X w = D W C o n v 1 × k b g g g X w
X h = D W C o n v k b × 1 g g g X h
X i d = X i d
X = C o n c a t X h w , X w , X h , X i d
Here, g represents the number of channels in the convolutional layer. The symbol ks signifies the size of the small square kernel, with a default value of 3; kb denotes the size of the strip kernel, and its default value is 11.
Yu et al. [29] have demonstrated that the 3 × 3 convolution kernel can efficiently extract local spatial information within the separable convolution architecture of Inception, capturing local features without significantly increasing the overall computational load. Therefore, this paper selects the DWConv3 × 3 performs local feature extraction in the spatial dimension of the input image, capturing basic features such as texture and shape within a relatively small range in corn seedlings and weed images. Although 11 is a relatively large size, striped kernel convolution using 11 × 1 and 1 × 11 kernels is computationally more efficient than traditional large square kernels (e.g., 7 × 7, 9 × 9, 11 × 11) for depthwise separable convolution. The 1 × 11 DWConv has a larger receptive field in the width direction, enabling it to capture features related to the lateral distribution of corn seedlings and weeds, such as the spread of leaves and the details of their lateral arrangement, which helps identify features such as the width of leaves and the density of their distribution. The 11 × 1 DWConv complements the 1 × 11 convolution kernel in terms of direction and has a large receptive field in the height direction, enabling it to extract longitudinal features of corn seedlings and weeds. The identity mapping does not alter the input data, preserving the original feature information, balancing the feature changes caused by different convolution operations, and preventing the loss of important information due to excessive feature transformation, as shown in Figure 7.

3.3. ADown Downsampling Module

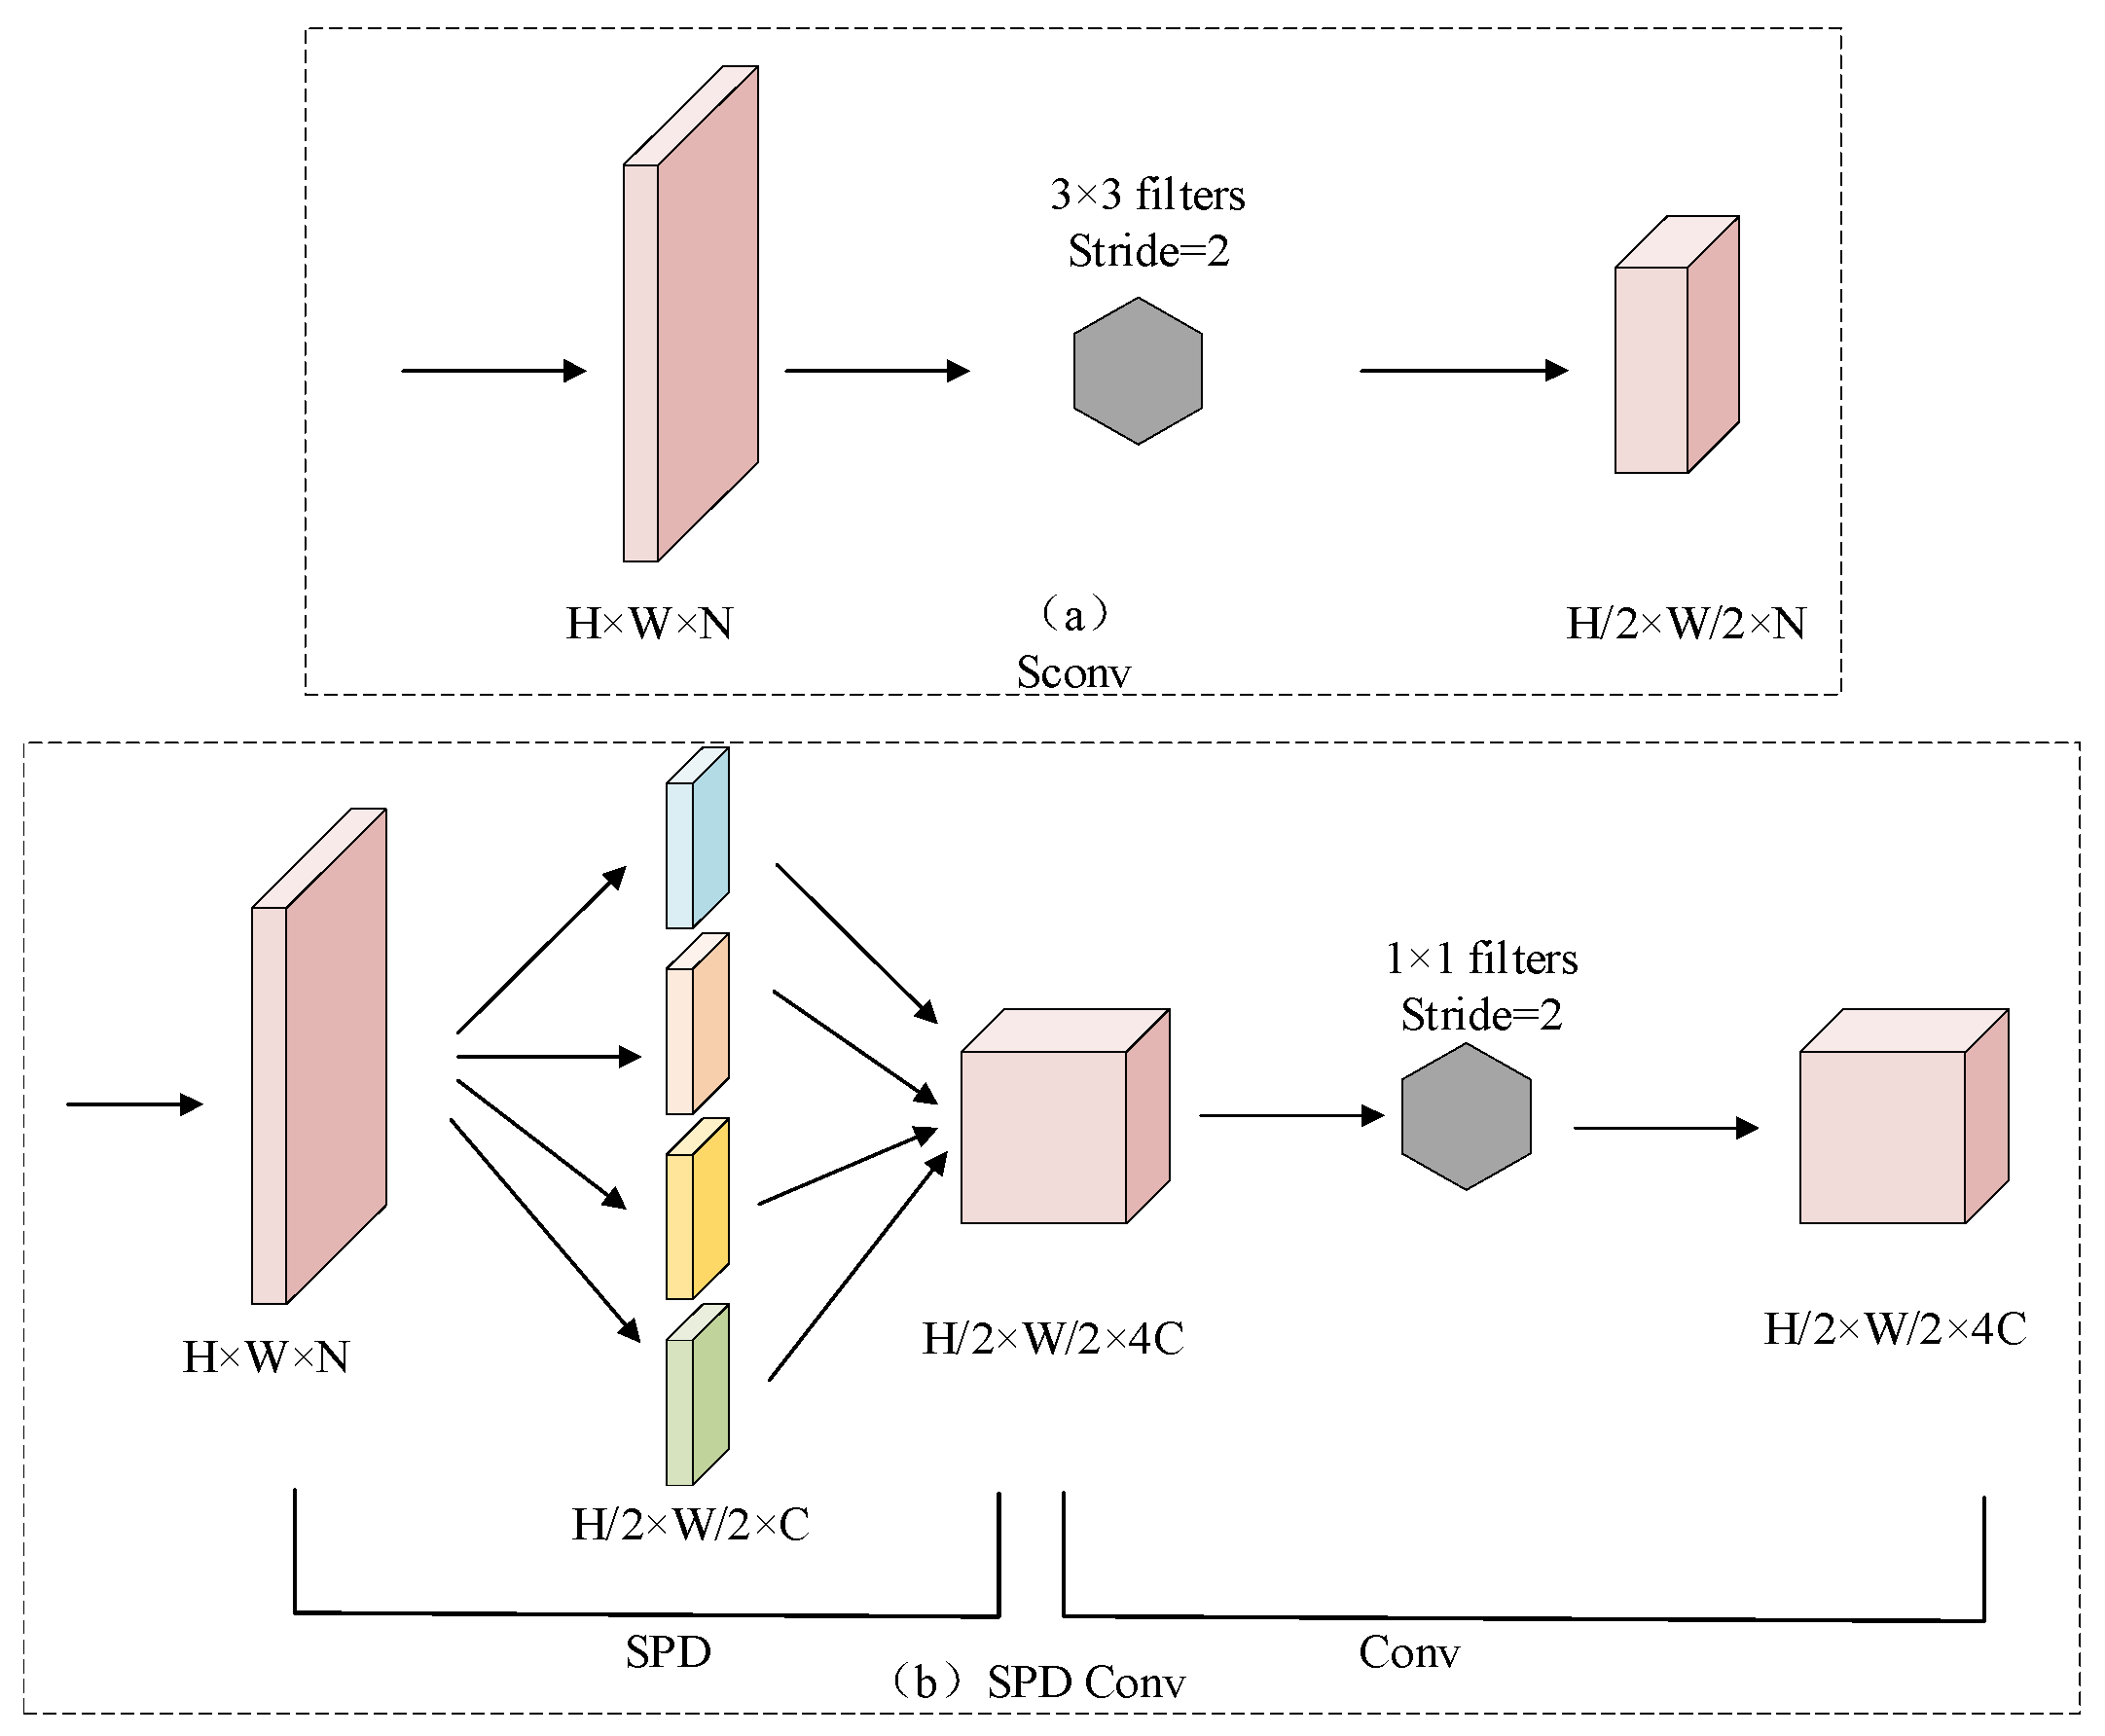
In deep learning architectures, downsampling serves as a critical operation that diminishes the spatial dimensions of feature maps. This process enhances computational efficiency while expanding the receptive field. By doing so, downsampling facilitates more effective capture of crucial information and mitigates the risk of overfitting, among other benefits. Taking SPD Conv as an example [30], it incorporates an SPD layer that performs a spatial-to-depth mapping and a non-strided convolution layer. Taking double downsampling as an example, Figure 8 illustrates the downsampling process of strided convolution and SPDConv [31]. SConv compresses the input feature map using a 3 × 3 convolution kernel with a stride of 2, thereby halving the width and height of the feature map compared to the original. This operation directly filters out certain feature information, as illustrated in Figure 8a. SPDConv splits the input feature map into segments, producing four sub-maps through double downsampling. These four sub-maps retain the original image’s global spatial information. The sub-maps are concatenated along the channel dimension, after which channel adjustment is performed via a convolution layer with no stride. SPDConv preserves the global spatial feature information within the channel dimension, as depicted in Figure 8b.
However, SPDConv frequently faces challenges like information loss, inaccurate localization, and fixed feature selection during the processing of smaller targets. These issues can negatively impact the overall performance of the weed recognition model. In YOLO v11n, downsampling is primarily achieved through the Conv layer. The Conv downsampling layer, which uses fixed convolution kernels and strides, can lead to missed detections when compressing feature maps. It also causes blurring of weed edge details and loss of texture features, such as corn leaf veins, and struggles to adaptively handle morphological variations in crops and weeds across different growth stages. To tackle this problem, this research incorporates the ADown downsampling module from YOLO v9 to substitute for the conventional downsampling operation [32].
The ADown module is capable of dynamically determining feature transmission paths by leveraging the information variability across regionally diverse parts of the input feature map. This mechanism effectively addresses challenges like lighting fluctuations and occlusion problems frequently encountered in weed identification scenarios. It can automatically suppress noisy regions while dynamically retaining key features and capturing weed features at different scales, thereby effectively reducing detail loss associated with oversampling and improving detection efficiency in weed images containing complex textures or small targets. The workflow of the ADown module is to receive an input image with dimensions C × H × W, pass it through the average pooling layer Avg_pool2d, calculate the average value of the pixels within the pooling window, extract global context information to enhance the model’s understanding of complex backgrounds, and reduce the impact of complex backgrounds on detection results. The output dimensions are changed to C/2 × H × W, with the number of channels halved for each part to further reduce computational overhead. Next, the data is split into two parts, X1 and X2, both with dimensions C/2 × H × W, via the split operation. X1 undergoes spatial downsampling of sub-features through the Conv layer (k = 3, s = 2, p = 1) to achieve feature map dimension compression. Owing to the small-sized convolution kernel and a stride of 2, this pathway effectively diminishes the spatial dimension. It simultaneously extracts local features like edges and textures of maize seedlings and weeds, boasting an output dimension of C/2 × H/2 × W/2. X2 first passes through the Maxpool2d max pooling layer, then through the Conv layer with k = 1, s = 1, p = 0, using 1 × 1 Conv and stride = 1 to perform channel reorganization, enhancing the correlation and detail capture capabilities of cross-channel features, with the output dimension also being C/2 × H/2 × W/2. Finally, the results of the two parts are concatenated through the Concat operation, allowing the model to comprehensively utilize multiple feature representations. This process generates an image with an output dimension of C × H/2 × W/2 for corn seedling and weed recognition, providing a basis for determining whether the input image contains corn seedlings or weeds. The structure of the ADown module is shown in Figure 9.

3.4. LADH Lightweight Detection Head Module

The detection head functions as a critical element in the object detection network, wielding a significant impact on the model’s comprehensive performance, precision, and efficiency. While the detection head in YOLO v11n has been improved to enhance its ability to detect small objects, it still exhibits certain recognition errors when faced with complex and variable agricultural scenarios, as it primarily relies on traditional feature layers to capture objects of different sizes. In contrast, the LADH-Head detection head employs a dynamic weight adjustment mechanism, enabling it to effectively identify objects of various sizes on a single feature map [33]. It can handle issues such as changes in lighting, occlusions, and weed interference in agricultural environments, maintaining stable recognition performance under various complex conditions. Additionally, the LADH-Head detection head can more accurately capture subtle differences between different plants, enabling precise identification of crops such as corn, Cirsium setosum, sedge, Digitaria sanguinalis and Chenopodium album.
After obtaining the data, the LADH detection head adopts a parallel structure. The top and bottom branches first pass through two convolution layers with kernel size K = 1, while the intermediate branches pass through three deep separable convolution layers with kernel size K = 3. Each branch extracts features independently. The top-level branch outputs class-related features (Cls) with dimensions H × W × C; the bottom-level branch outputs object location regression-related features (Reg) with dimensions H × W × 4; the features output by the middle branch are further processed through a K = 1 convolutional layer to obtain intersection-over-union (IoU)-related features, with dimensions H × W × 1. This design enables parallel extraction of multi-aspect features through different convolution operations, which helps improve the performance of object detection. The network architecture of the LADH asymmetric detection head is illustrated in Figure 10.

3.5. Loss Function

The CIoU function takes into account the overlap and distance between the predicted bounding box and the ground truth bounding box, as well as the similarity of their shapes. When faced with the same IOU value, it can judge the difference in the intersection of the target boxes based on the aspect ratio. The formula is as follows:
L C l o U = 1 I o U + ρ 2 b , b g t c 2 + α v
In this formula, b denotes the center coordinates of the target prediction box, bgt represents the center point coordinates of the label box, and c represents the straight-line distance from the lower-left corner to the upper-right corner of the outer frame formed by combining the two target detection boxes. The calculation expression for the weight function α is shown in Formula (7), while v is used to measure the similarity of the aspect ratio, w and h usually represent the width and height of the predicted bounding box, with the calculation formula as follows:
α = v 1 I o U + v
v = 4 π 2 a r c t a n w g t h g t a r c t a n w h 2

3.6. Model Performance Evaluation

To evaluate how well different models perform, this research utilizes the subsequent assessment criteria: Precision (P), Recall (R), Average Precision (AP), Mean Average Precision (mAP), parameter count (Params), and Giga Floating Operations Per Second (GFLOPs).
Precision (P) calculates the proportion of accurately forecast positive cases among all instances that are predicted to be positive, thus showing how dependable the model’s predictions are. Recall (R) gauges the percentage of correctly predicted positive instances out of all actually existing positive cases, demonstrating the model’s capability to identify positive instances. Mean Average Precision (mAP) acts as the key indicator for detection precision, assessing the model’s comprehensive performance in multi-class object detection tasks. It is computed based on Average Precision (AP), which stands for the area beneath the Precision–Recall (P-R) curve in single-category detection. As the average value of APs across all categories, mAP offers an overall evaluation of performance. The computational formula is listed below:
P = T P T P + F P × 100 %
R = T P T P + F N × 100 %
A P = 0 1 P R d R
m A P = 1 m i = 1 m A P i
TP represents the number of correctly predicted positive instances; FP denotes the number of incorrectly predicted positive instances; FN signifies the number of positive instances that were not correctly identified; n is the total number of detection categories; APi denotes the average precision of the i-th category. In addition, the quantity of parameters functions as a vital gauge for evaluating the efficiency of a model. Generally speaking, a model with a smaller number of parameters indicates a lighter-weight model. The computational burden is measured using GFLOPs, which is used to quantify the number of floating-point operations carried out per second.

3.7. Experimental Environment and Parameter Settings

In this study, based on the Windows system and relying on the Pycharm platform, Python language and Pytorch deep learning framework were used to conduct relevant experiments. The detailed system configuration and parameter settings are presented in Table 4.
This section focuses on constructing the AGRI-YOLO lightweight corn weed detection model. Based on the YOLO v11n architecture, it addresses issues such as poor adaptability to complex backgrounds, insufficient small object detection capability, and model redundancy in corn weed detection. Technical solutions are proposed from three aspects: network structure optimization, performance evaluation system construction, and core module design: (1) The core components are optimized by introducing InceptionNeXt’s DWConv (Deep Separable Convolution) to reconstruct the C3k2 feature extraction module. Multi-branch convolutions enhance feature representation for corn seedlings and weeds while reducing computational overhead. The P3 layer and subsequent downsampling convolutional layers of the backbone network are replaced by the ADown module. This dynamically preserves key features through average pooling, branch convolutions, and feature concatenation, minimizing detail loss caused by oversampling. Designing LADH to output category, location regression, and Intersection over Union (IoU) features via parallel branch structures improves small target recognition precision in complex scenarios. (2) Optimizing bounding box regression with the CIoU loss function accelerates prediction convergence and improves localization precision by introducing center distance and aspect ratio similarity constraints. This establishes the AGRI-YOLO model architecture, balancing detection performance and lightweight requirements, laying the methodological foundation for subsequent experiments to validate and practical applications. (3) Model performance evaluation metrics, including Precision, Recall, AP, mAP, parameters, and GFLOPs, are defined, providing calculation formulas for each metric to establish standardized, quantifiable performance benchmarks.

4. Experimental Results and Analysis

4.1. Comparative Experiments with Different Backbone Networks

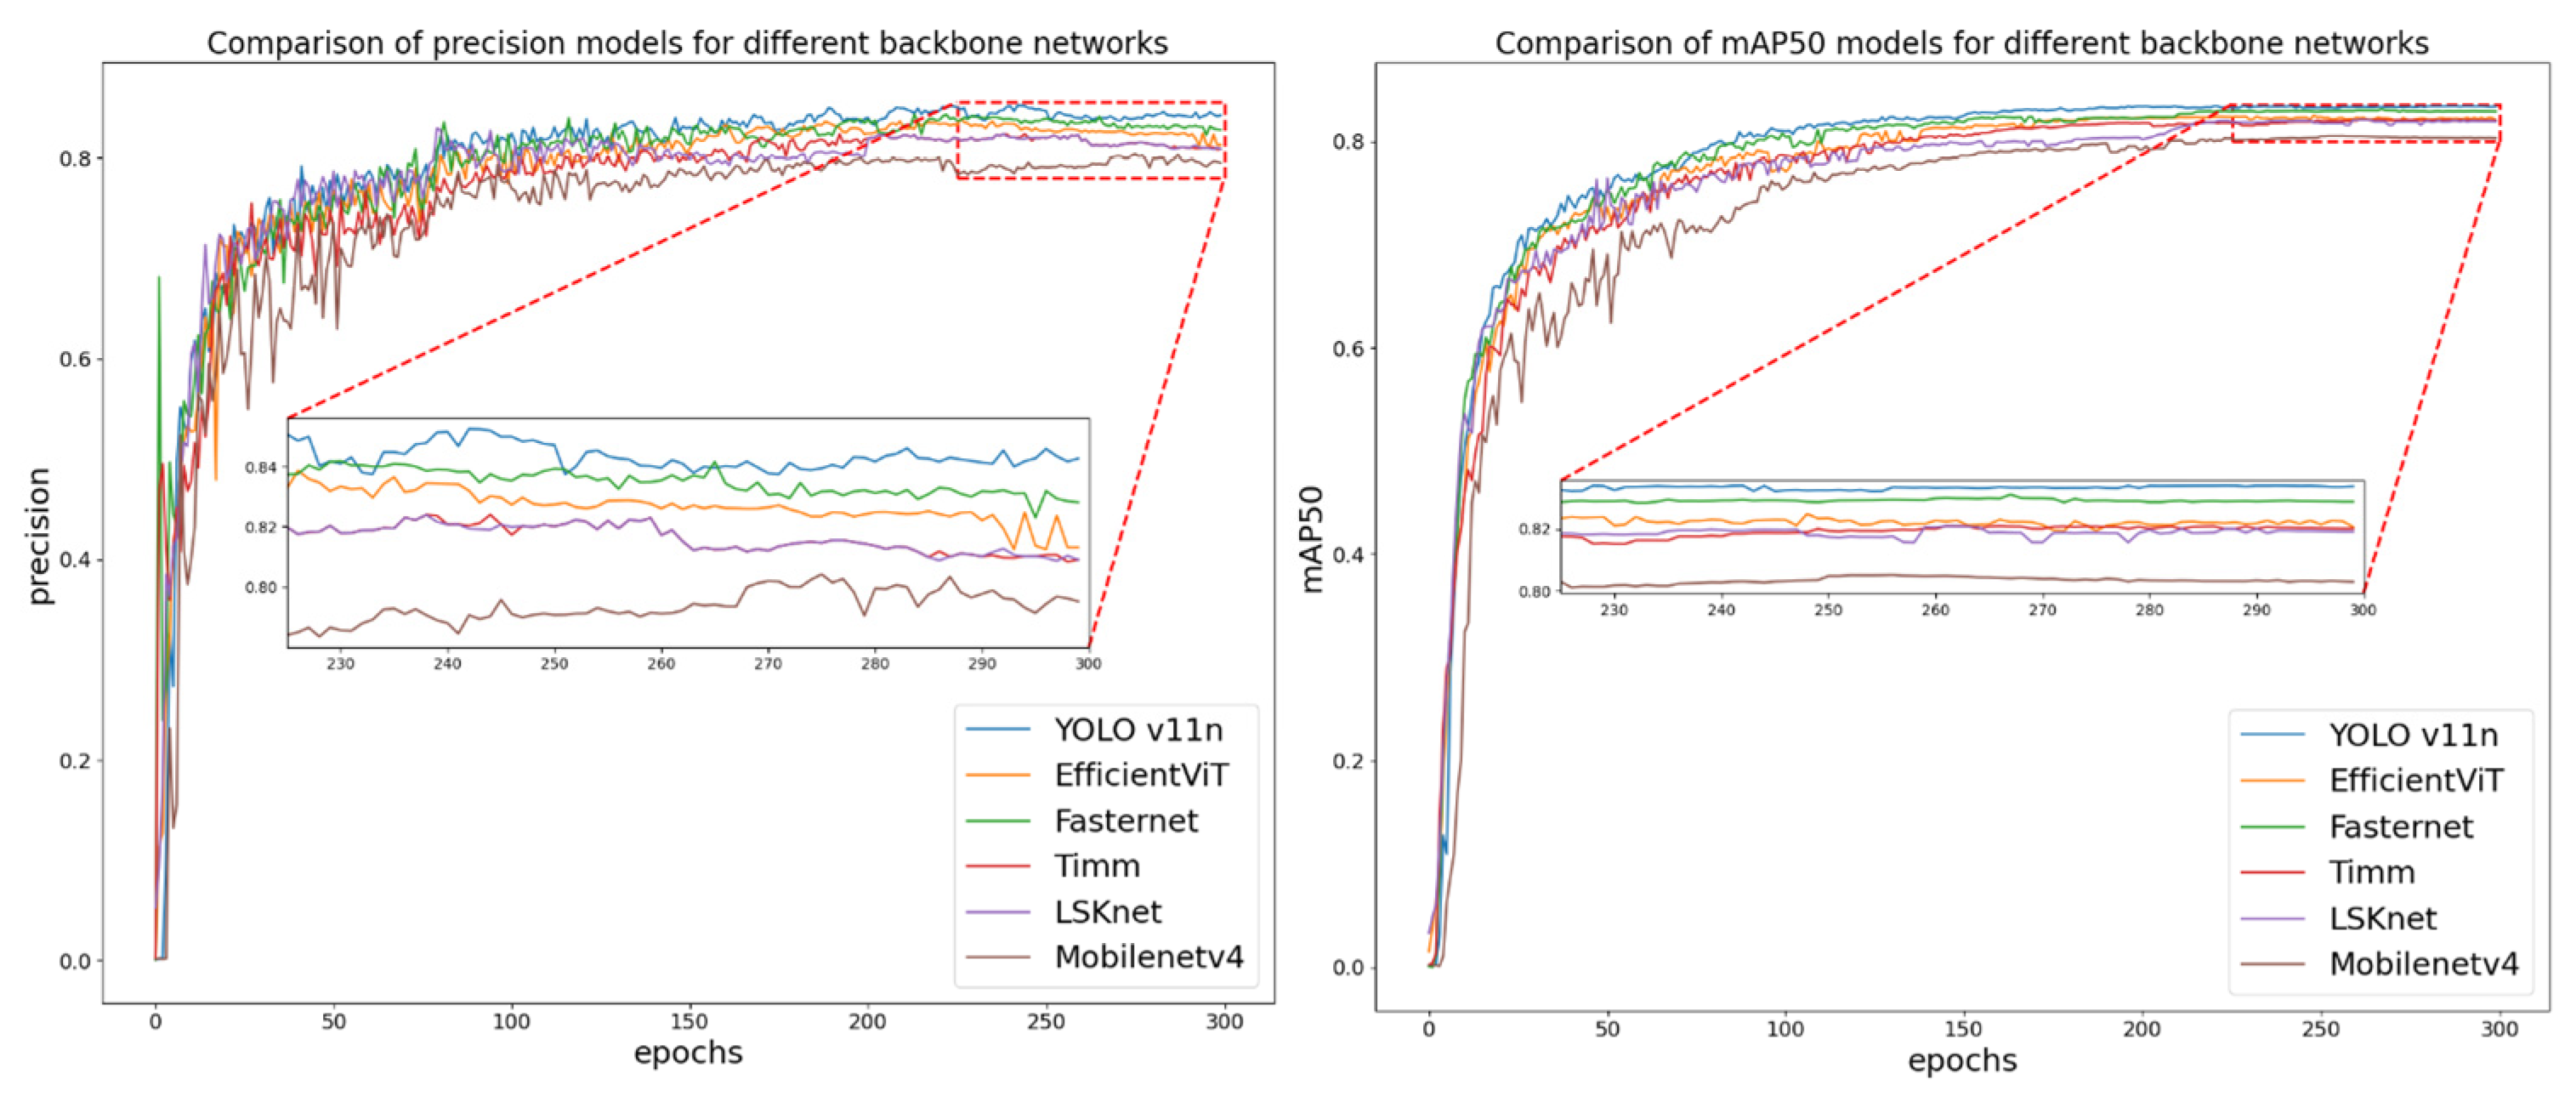
To further enhance the performance of object detection models in comprehensive feature extraction tasks and optimize their multi-scale feature fusion effects, this study uses YOLO v11n as the baseline detection model. We selected mainstream backbone networks such as EfficientViT, MobileNetv4, Fasternet, the Timm series models, and LSKNet for comparative experiments with the native backbone of YOLO v11n. By systematically comparing the impact of different backbone networks on YOLO v11n’s feature extraction capabilities and feature fusion efficiency, the optimal backbone network structure compatible with the YOLO v11 detection framework was ultimately selected. The visual Transformer design of EfficientViT enhances the model’s ability to extract comprehensive features and optimizes multi-scale feature fusion, thereby enriching the feature representation of sparsely distributed weeds. The depth-separable convolutions of MobileNetV4 optimize computational efficiency and improve detection response for small target weeds. The dynamic routing mechanism of FasterNet enables adaptive processing of targets of different scales, balancing detection precision and speed. Timm primarily combines ConvNeXt and Transformer in a hybrid architecture to enhance the multi-scale feature pyramid’s ability to distinguish between corn and weeds, particularly improving the identification of small weeds in complex field environments; LSKNet integrates large-scale convolutional kernels to adaptively capture contextual information of targets at different scales, significantly improving the segmentation and detection precision of dense weed communities. The experimental results are shown in Figure 11.
As shown in Figure 11, in terms of the core evaluation metrics of precision and mAP50 for the object detection task, the baseline model YOLO v11n demonstrates significantly superior performance compared to the comparison models that use EfficientViT, MobileNetv4, Fasternet, Timm series models, and LSKNet as their backbone networks. The precision, mAP50, number of parameters, Gflops, and model size of each model are shown in Table 5. As shown by the experimental results, the baseline model corresponding to the native backbone network of YOLO v11n demonstrates superiority over other candidate backbone networks in terms of precision, mAP50, number of parameters, computational complexity, and model size. Further analysis indicates that replacing the native backbone network of YOLO v11n makes it difficult to achieve the core objective of lightweight model design. Based on this, this study ultimately retains the original backbone network of YOLO v11n and uses it as the foundation to construct a lightweight model suitable for corn weed detection scenarios.

4.2. Comparative Experiments with Different Feature Extraction Modules

To enhance the model’s feature extraction capabilities, employ mechanisms such as multi-scale context modeling, dynamic convolutional kernel adaptation, and cross-modal feature interaction to achieve a synergistic optimization of the feature extraction layer’s expressive power and computational efficiency. Select algorithms such as ConvFormer, CTA, DBB, AKConv, ContextGuided, GhostDynamicConv, and AdditiveBlock to reconstruct the C3k2 module. The experimental results are shown in Table 6.
The experimental results demonstrate that the C3k2-IDWC module outperforms ConvFormer, CTA, DBB, AKConv, ContextGuided, GhostDynamicConv, and AdditiveBlock in terms of precision, recall, mAP50, parameter counts, GFLOPs, and model size. The parameters have been reduced by 11.07%, 17.57%, 16.36%, 12.99%, 0.95%, 2.99% and 17.74%, respectively. The model sizes were, respectively, reduced by 10.20%, 38.03%, 37.14%, 13.73%, 2.22%, 4.35%, and 20.00%.
The C3k2-IDWC module introduces DWConv from InceptionNeXt for reconstruction. The core design is “channel grouping + multi-branch convolution”, dividing the input feature map into 4 groups by channel (Figure 7). Each group captures local textures through a dedicated convolution kernel of 3 × 3 DWConv. Each group captures local textures through a dedicated convolution kernel of 3 × 3 DWConv, 1 × 11 DWConv is suitable for the lateral distribution of weeds, 11 × 1 DWConv enhances longitudinal features, and identity mapping retains the original information for independent feature extraction, avoiding cross-channel information interference. Subsequently, information fusion between channels is achieved through convolution. It retains the exclusive features of each branch while completing global integration.

4.3. Comparative Experiments with Different Sampling Layers

To examine the impact of sampling layers on the efficiency of lightweight corn weed detection architectures, we systematically designed multiple sampling layer experiments to address issues such as large target scale differences and high model lightweighting requirements in complex corn field scenarios. In the downsampling stage, three methods were introduced: ADown, SRFD (Spatial Redundancy Feature Compression Downsampling), and SPDConv (Sparse Pyramid Dynamic Convolution Downsampling). These methods aim to reduce computational complexity while preserving key semantic information through dynamic receptive field adjustment, feature redundancy filtering, and sparse computation; in the upsampling stage, CARAFE (Content-Aware Feature Reorganization and Upsampling) and Dysample (Dynamic scale-adaptive upsampling) were employed. These methods enhance the ability to restore details of small-scale weeds and corn seedlings through dynamic feature fusion and scale-adaptive mechanisms; additionally, in the cross-scale feature fusion path, WaveletPool (Wavelet Pooling Up/Downsampling) is introduced, leveraging the multi-resolution characteristics of the wavelet transform to achieve multi-scale decoupling and reconstruction of features, thereby enhancing the model’s ability to characterize weeds and corn seedlings at different growth stages. Through comparative experiments, the comprehensive impact of each sampling layer on model precision, parameter count, GFLOPs, and model size is examined. The experimental comparison results are shown in Table 7.
Traditional sampling schemes have obvious defects. For example, SPDConv splits the feature map through space-depth mapping (Figure 8), but the fixed split ratio makes it easy to split the features of small targets, and the number of parameters is 2.2 times that of ADown, resulting in serious computational redundancy. CARAFE relies on the reorganization of local feature weights and has poor robustness to the complex background of farmland, with an mAP50 of only 80.3%. YOLO v11n’s native Conv downsampling uses 3 × 3 convolution + stride 2 to compress the feature map, which directly filters edge details such as the outline of weed leaves, resulting in an increased missed detection rate of small targets. The ADown module implements “dynamic retention of key features + filtering of redundant information” through the structure of “average pooling + dual-branch feature processing + feature splicing”. It first extracts global background information through AvgPool2d and halves the number of channels to reduce the amount of computation. Then, the data is split into two branches (Figure 9). The dual-branch design significantly reduces the missed detection rate of dense weeds, while the average pooling and channel halving operations reduce redundant computation. Experimental data (Table 7) show that the average pooling and channel halving operations can significantly reduce the missed detection rate of dense weeds. Table 7 shows that ADown improves recall by 1.4–2.8% compared to other modules, reduces parameters by 4.46–54.14%, and reduces GFLOPs by 5.36–53.10%.

4.4. Comparative Experiments with Different Loss Functions

In the YOLO framework, the design of the loss function not only influences the model’s convergence speed but also directly determines the key metrics of object detection. Through multi-task joint optimization, the three major objectives of “localization-confidence-classification” are converted into quantifiable numerical differences, providing a clear optimization direction for model training. To investigate the impact of the CIoU loss function on the model’s optimization process, this study systematically compared it with alternative bounding box regression loss functions such as GIoU, EIoU, SIoU, DIoU, PIoU, and ShapeIoU, addressing challenges such as significant variations in target sizes in cornfields, strong background interference, and difficulties in detecting small targets. The experimental comparison results are shown in Table 8.
GIoU optimizes the IoU by calculating the minimum bounding rectangle area between the predicted and ground-truth boxes. However, when the two boxes do not overlap, the gradient tends to vanish, resulting in slow convergence. DIoU introduces a center point distance constraint but does not consider differences in box aspect ratios, such as the morphological difference between the “broad and flat” corn leaves and the “slender and long” weed leaves, which can easily lead to deviations in the positioning box shape. SIoU, while incorporating an angle loss, is computationally complex and susceptible to interference from farmland background noise, leading to unstable model training. The CIoU loss function optimizes bounding box regression using a triple constraint mechanism: IoU overlap, center point distance, and aspect ratio similarity. This ensures a minimum overlap between the predicted and ground-truth boxes based on the IoU overlap (1-IoU). Experimental results (Table 8) show that CIoU improves accuracy by 1.1–2.9% and mAP50 by 0.7–1.2% compared to other loss functions such as GIoU and DIoU.

4.5. Ablation Experiment

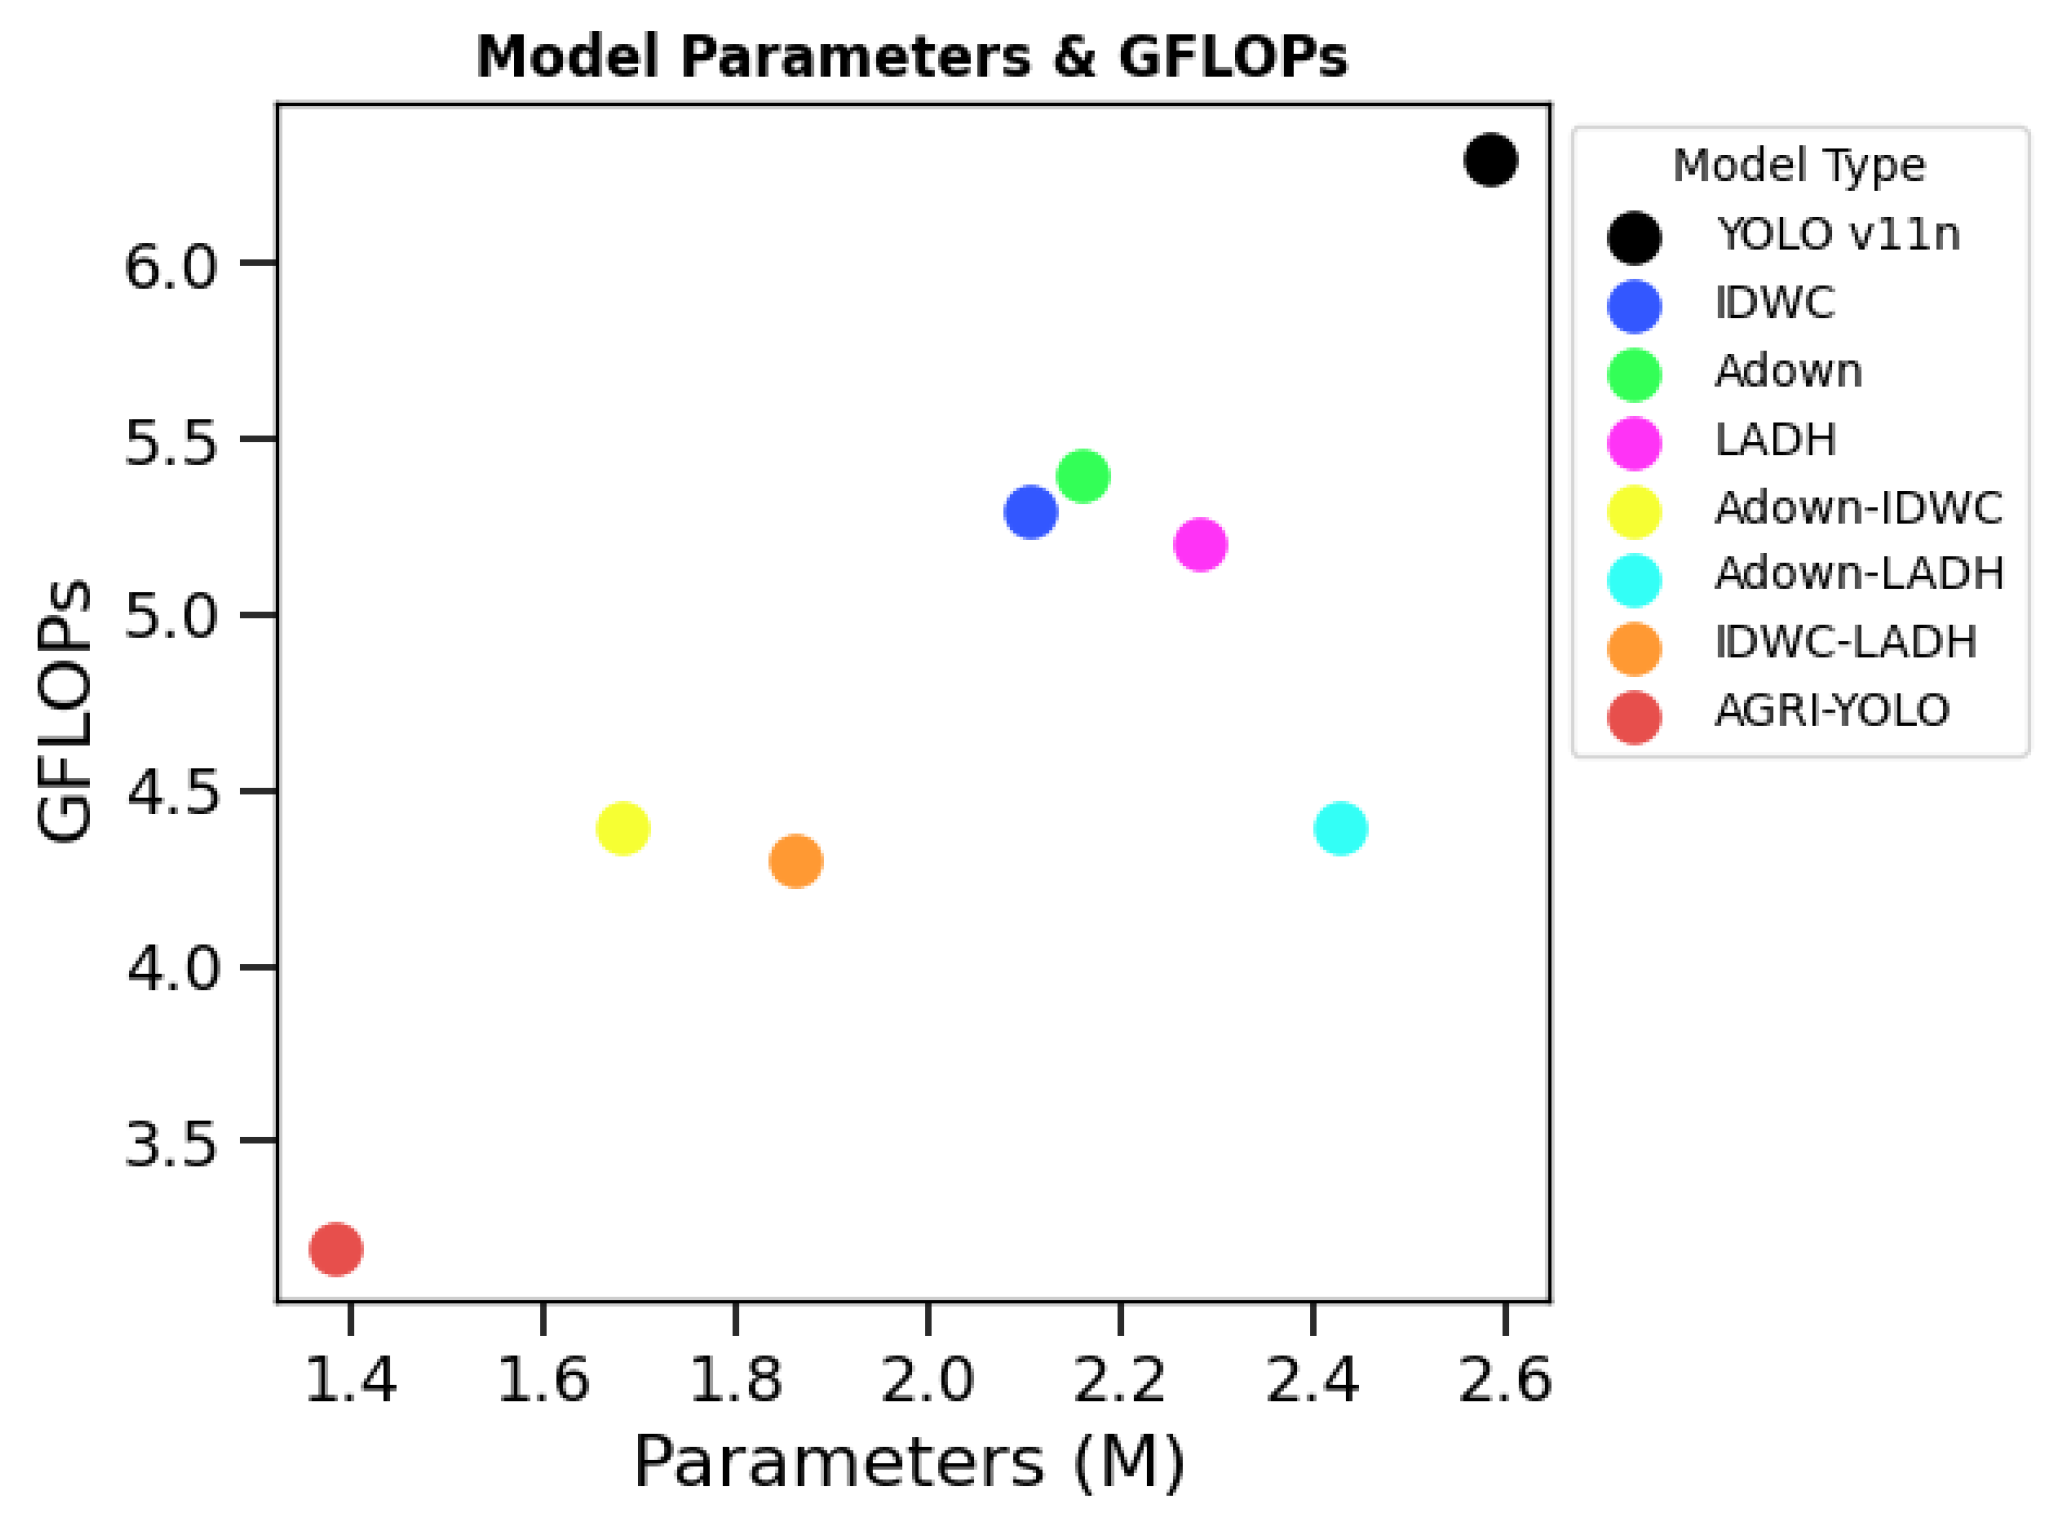
In order to verify the influence of the Adown, IDWC, and LADH modules on the lightweight algorithm for corn weed detection, ablation tests were performed using YOLO v11n as the baseline. The results of the experiments can be seen in Figure 12.
There are obvious limitations to the improvement of a single module. Although adding only the ADown module can reduce parameters by 18.6% and GFLOPs by 15.9%, the accuracy will drop by 0.8%. The lack of an efficient feature extraction module leads to insufficient feature expression after downsampling. Adding only the IDWC module can enhance feature extraction capabilities and maintain 83.3% accuracy, but the parameters are still higher than the three-module combination, and the redundancy of downsampling and detection heads is not optimized. Adding only the LADH module can increase the recall rate of small target detection from 72.9% to 74.5%, but it cannot significantly reduce parameters and computational complexity, making it difficult to achieve the lightweight goal. AGRI-YOLO, on the other hand, uses DWConv based on InceptionNeXt to reconstruct C3k2 to implement multi-branch deep separable convolution to enhance the fine-grained feature differentiation of corn and weeds. The ADown module uses average pooling to extract global context and dual-branch differentiation to process local and significant features, avoiding the loss of key features extracted by IDWC during sampling while significantly reducing computational redundancy. The lightweight detection head adopts a parallel structure, with dual 1 × 1 convolutional branches responsible for class classification (Cls) and bounding box regression (Reg), respectively. Three depthwise separable convolutional branches calculate the intersection over union (IoU). Dynamically adjusting the weights of each branch improves localization accuracy and small object recognition, reducing parameters by 30% compared to traditional detection heads. Experiment 8 in Table 9 shows that AGRI-YOLO’s precision and recall are essentially the same as those of the baseline model, with only a 0.5% decrease in mAP50. This, combined with a 46.6% reduction in parameters, a 49.2% reduction in GFLOPs, and a 42.3% reduction in model size, significantly outperforms the improvements achieved by a single module.

4.6. Comparative Experiments Using Different Models

In order to systematically analyze the performance differences in various models on the same task, identify performance bottlenecks, validate optimization directions, and provide scientific model selection criteria for practical applications, this paper compares AGRI-YOLO with mainstream object detection algorithms such as YOLO v5, YOLO v8, YOLO v9, and YOLO v10 to validate its superiority in corn seedling and weed target detection tasks. The experimental results are shown in Table 10.
Analysis of the experimental data in Table 8 shows that AGRI-YOLO demonstrates significant overall advantages in the corn weed detection task. Compared to YOLO v11n, AGRI-YOLO achieves a 46.6% reduction in parameter count, a 49.2% decrease in GFLOPs, and a 42.31% reduction in model size through lightweight architecture optimization, while maintaining comparable precision, recall rate, and mAP50 values. This effectively alleviates computational pressure on edge devices. When compared to mainstream models such as YOLO v5, YOLO v8, YOLO v9, and YOLO v10, the AGRI-YOLO model achieves precision improvements of 0.3%, 0.5%, 0.2%, and 7.2%, respectively; the number of parameters has been reduced by 44.87%, 54.09%, 30.00%, and 39.10%, respectively; GFLOPs have been reduced by 54.93%, 60.49%, 57.89%, and 50.77%, respectively; and model size has been reduced by 40.00%, 50.00%, 31.82%, and 45.45%, respectively. These data clearly demonstrate that AGRI-YOLO, through its dynamic routing mechanism and efficient feature extraction structure, significantly optimizes computational efficiency and model compactness while preserving high detection precision, offering a more competitive solution for resource-constrained scenarios like agricultural drone inspections and embedded intelligent devices.
To determine the statistical significance of performance differences between AGRI-YOLO and other models, this study conducted statistical tests. Test data originated from the same test set, with all models trained and evaluated under identical experimental conditions and hyperparameters. This ensured the model architecture was the sole variable, satisfying the conditions for a paired t-test. Three core metrics reflecting detection capability—precision, recall, and mAP50—were selected. The null hypothesis H0 (no statistically significant difference between AGRI-YOLO and comparison models, with variations attributable to random factors) and alternative hypothesis H1 (performance differences stem from model architecture optimization) were established at a significance level of α = 0.05. A paired t-test was applied: first, performance records for each model were collected on a per-sample basis to compute differences. Then, based on these differences, the test statistic was calculated and the p-value obtained. This determined whether performance differences were attributable to random factors, providing evidence to validate the reliability of AGRI-YOLO’s performance improvement. Specific results are shown in Table 11.
Statistical validation of performance differences in Table 8 via paired t-tests validated that AGRI-YOLO exhibits statistically significant improvements (p < 0.05 or p < 0.01) over YOLO v5, v8, and v10 in core metrics. These differences stem from model architecture optimization rather than random factors. Performance differences with YOLO v9 and v11n were not statistically significant, aligning with the research objective of “lightweight optimization without compromising core precision”.
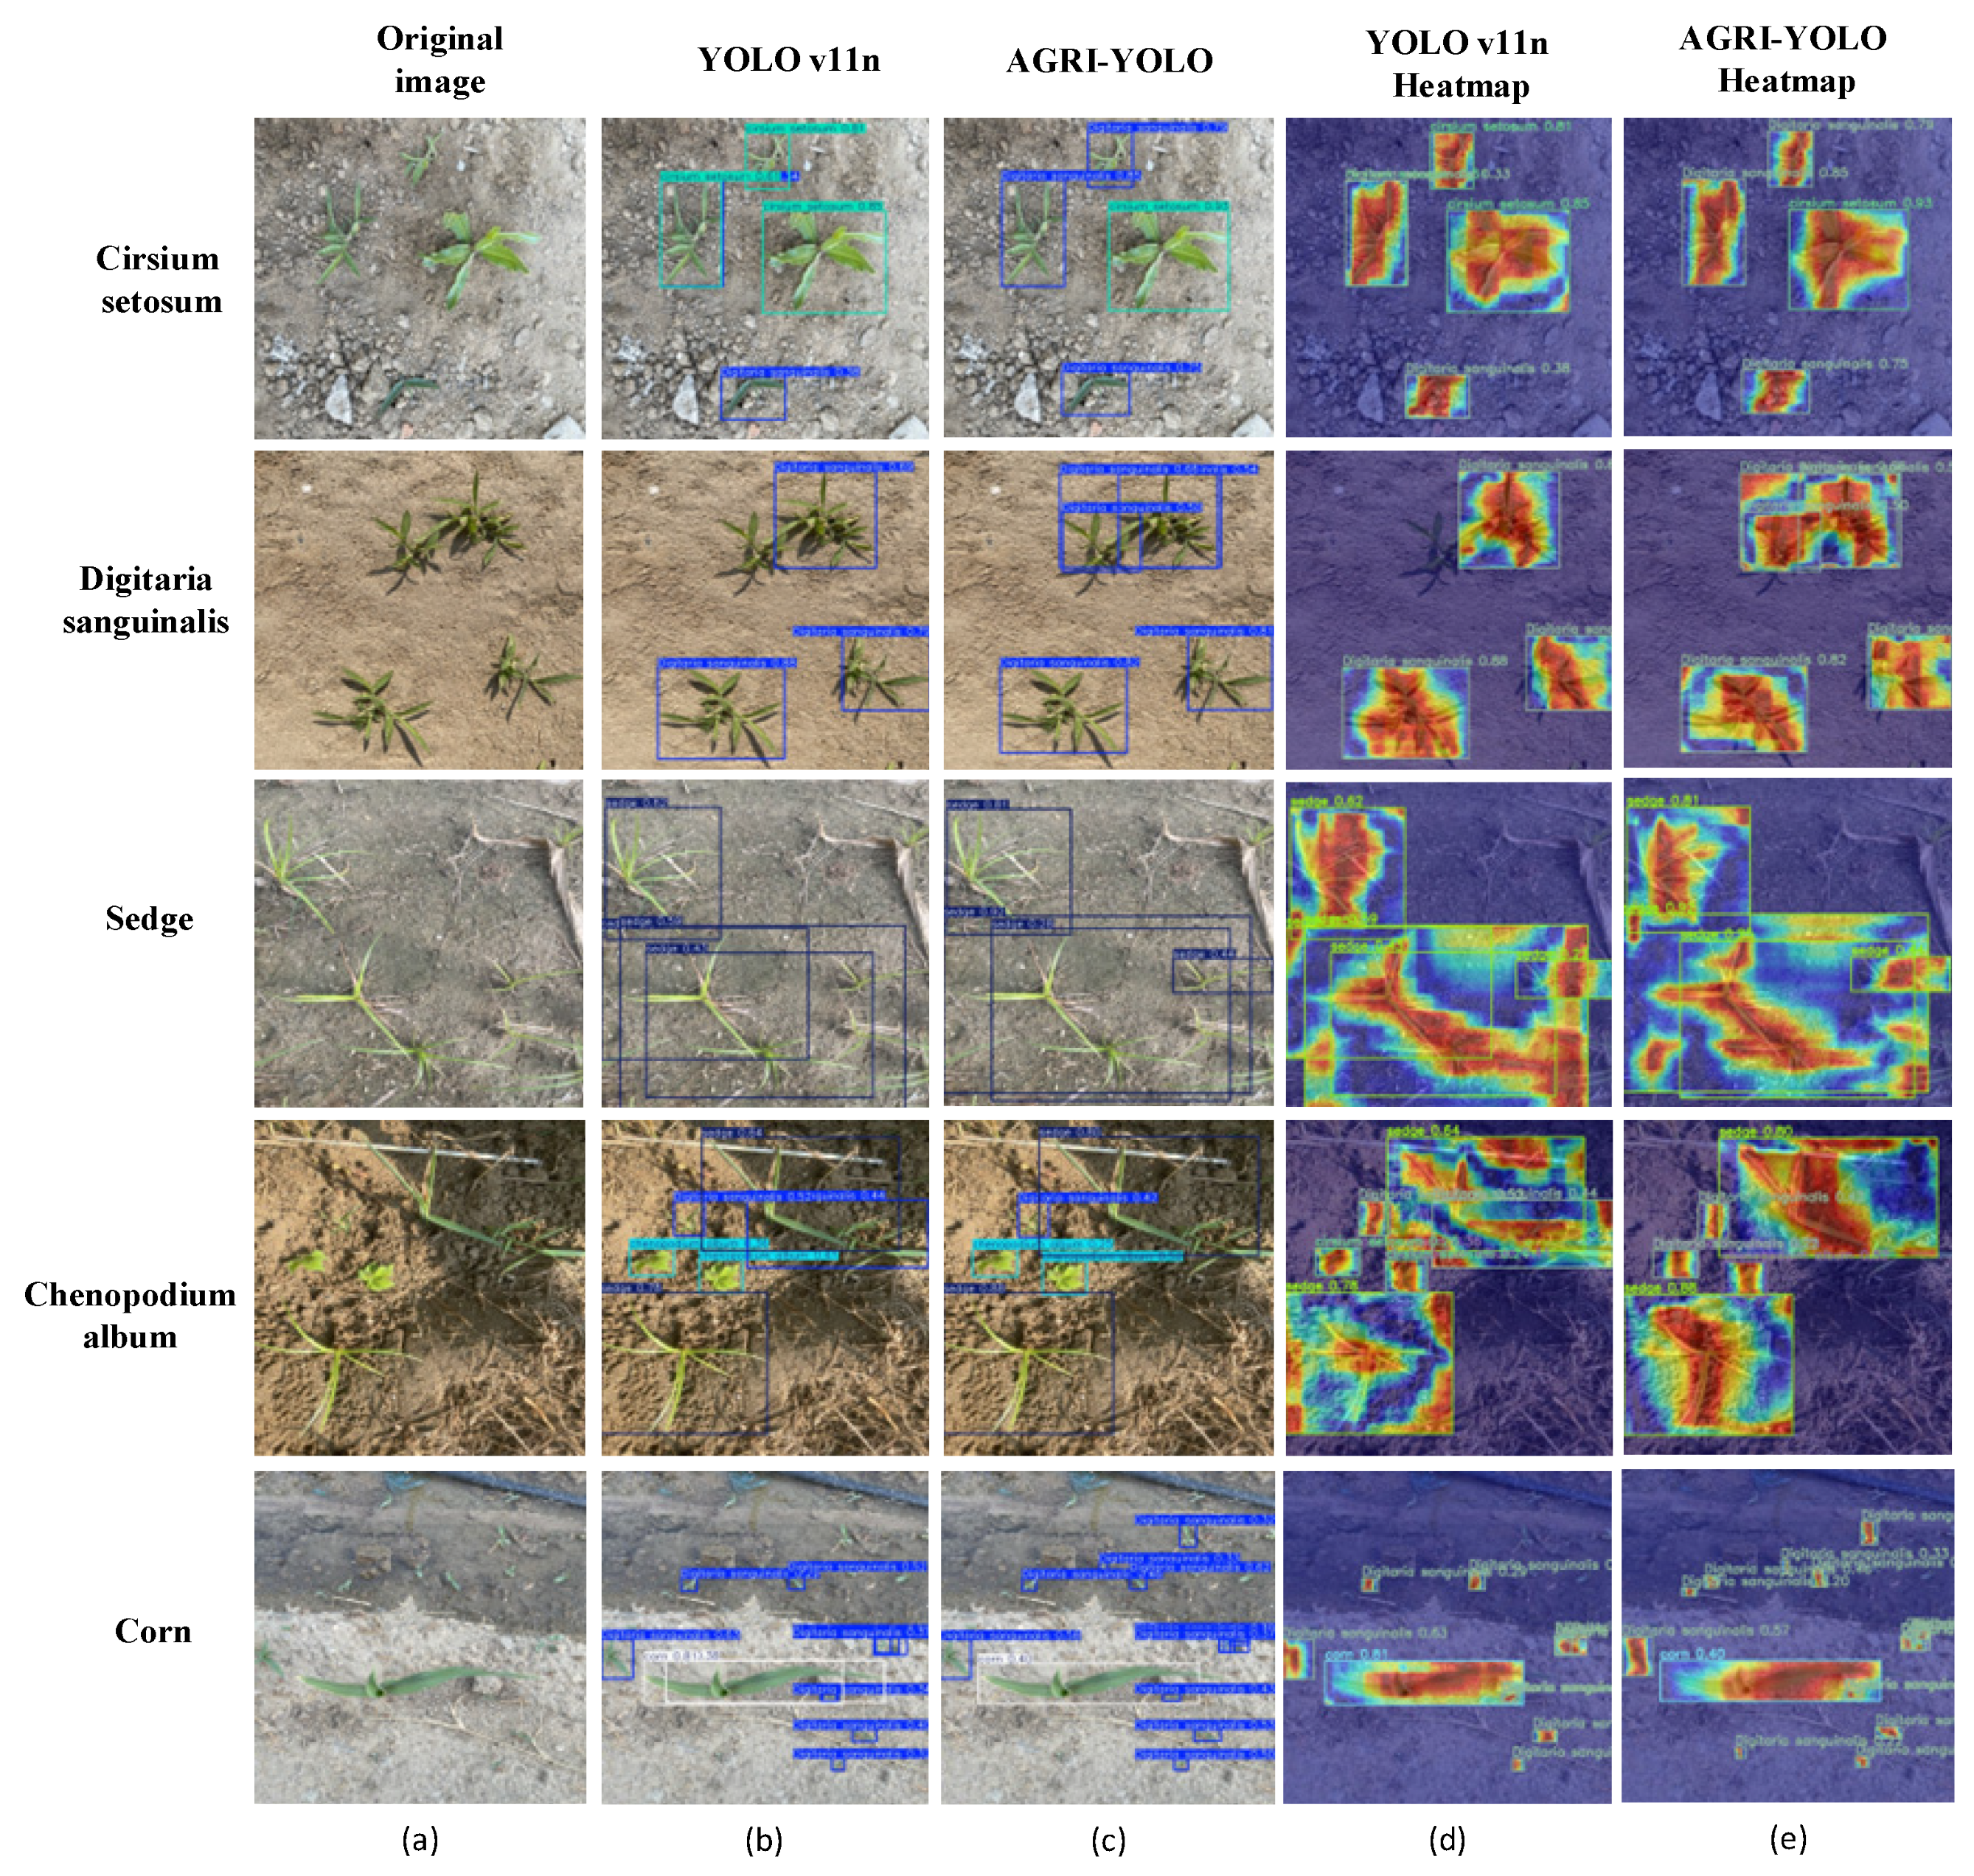
To further validate the recognition performance of AGRI-YOLO in complex agricultural field scenarios, the experiment utilized heatmap visualization technology to visually analyze the detection results. The blue areas on this heatmap indicate regions where the target appearance probability is below 20%, while red areas with a confidence level exceeding 85% precisely pinpoint high-probability target zones, as shown in Figure 13.
Analysis of Figure 13 reveals that both (d) YOLO v11n and (e) AGRI-YOLO produce false positives when detecting Chenopodium album. The core reason lies in the high morphological similarity between certain Digitaria sanguinalis specimens and Chenopodium album. Specifically, the false positives in (b) YOLO v11n for Cirsium setosum detection also stem from the dual morphological and color similarities with misclassified Digitaria sanguinalis. This similarity obscures subtle distinguishing features, hindering the model’s ability to accurately capture key identification information such as the unique texture and shape of weed leaves. Additionally, both (b) YOLO v11n and (c) AGRI-YOLO exhibit false negatives when detecting corn, primarily due to insufficient edge detection capabilities. When targets suffer severe occlusion, morphological distortion, or uneven lighting, the LADH detection head’s dynamic weight adjustment mechanism fails to adapt promptly to these complex scene variations, ultimately causing deviations in target localization and classification.

5. Discussion

5.1. Application of Lightweight Models in Detecting Weeds in Agricultural Fields

To tackle the challenge of lightweight model design, this paper introduces the AGRI-YOLO efficient lightweight weed recognition model, which is built upon YOLO v11n. In the aspect of feature extraction, the DWC method is employed to enhance C3k2. This refinement not only fortifies the feature representation of corn seedlings and weeds but also enhances the model’s recognition performance in cluttered background environments. Consistent with the approach of Fan et al. [50] in optimizing feature maps using the DWConv module, this study confirms the effectiveness of deep separable convolutions in enhancing feature expression and improving model efficiency. During the structural optimization of the model, the introduction of the ADown downsampling module decreases the parameter count of the model. Meanwhile, it can effectively extract image feature information, enhance the sensitivity to weed features. Furthermore, it significantly improves computational efficiency while maintaining recognition precision. This is consistent with the results obtained by Luo et al. [51]. The LADH lightweight detection head serves to efficiently analyze and handle the features extracted from the backbone network, allowing for precise localization of weeds in images while boosting the recognition precision of small-sized targets. This result aligns with Zhao et al. [52] application of the LADH-Head in complex scene detection. This further validates the application value and technical feasibility of lightweight models in real-time weed detection in agricultural fields.

5.2. Limitations of This Study and Future Research Directions

Although the AGRI-YOLO model has achieved certain results in real-time weed detection, this study still has some limitations. First, the model’s robustness in extremely complex environments still needs to be verified. The current study is mainly based on conventional farmland scene data for training, and the detection precision of the model under extreme conditions, such as severe weather and drastic changes in lighting, has not yet been tested. Additionally, there are shortcomings in data diversity. The dataset used in this study covers a relatively limited range of weed species and corn growth stages, which may lead to weak generalization capabilities when identifying rare weed species or distinguishing between corn and weeds at different growth stages.
Future research will focus on enhancing the robustness of weed detection in complex scenarios and improving its implementation capabilities on the device side. To address the issue of insufficient robustness in visual detection caused by complex scenarios in farmland—such as cloud cover, overlapping crop obstructions, and soil reflections—we plan to introduce multi-sensor fusion technology. This approach will correlate data and fuse features from visual sensors (RGB cameras) with environmental perception sensors (infrared thermal imaging sensors and LiDAR). Specifically, infrared sensors enhance target differentiation by leveraging temperature differences between crops and weeds, while LiDAR provides 3D spatial information to resolve target localization in occluded scenarios. A multimodal feature attention fusion module is designed to dynamically allocate weights across sensor features, thereby improving weed detection precision in complex environments. To address computational constraints on mobile devices, a combined strategy of “structured pruning + knowledge distillation + quantization compression” is employed to significantly reduce model size while maintaining precision. A mobile app supporting offline detection and weed density statistics is concurrently developed. For drone platforms, a dynamic resolution adaptation module and adaptive flight path planning algorithm are designed to generate weed distribution heatmaps and provide application recommendations.

6. Conclusions

This study addresses issues such as the large number of weed species in corn fields, large model parameters, large volume, and difficulty in running smoothly on mobile devices. The proposed AGRI-YOLO model achieves a balance between performance and efficiency through multi-stage structural optimization.
This study introduced the DWConv module from InceptionNeXt to reconstruct the C3k2 module. Employing channel grouping and multi-branch convolutions, it enhances the ability to distinguish between the fine leaf patterns of corn seedlings and weeds while avoiding cross-channel information interference, thereby resolving the “feature aliasing” issue inherent in traditional convolutions. Replacing YOLO v11n’s Conv downsampling layer with the ADown module employs average pooling to extract global background information. Its dual-branch mechanism dynamically selects between differential processing of local features and feature splicing fusion, reducing edge detail loss caused by fixed convolutional kernels or strides while minimizing model parameter redundancy. This balances adaptability to complex farmland scenarios with computational efficiency. LADH employs a dual 1 × 1 convolution branch for category classification and bounding box regression, alongside a three-depth separable convolution branch for parallel IoU calculation. This architecture enables dynamic weight adjustment, enhancing recognition accuracy for small weeds while resolving traditional detection heads’ reliance on single feature layers and poor multi-scale target adaptation.
AGRI-YOLO achieves comparable detection accuracy to the baseline model YOLO v11n (Precision 84.7%, Recall 73.0%, mAP50 82.8%) while reducing parameters by 46.6%, lowering GFLOPs by 49.2%, and compressing model size to 3.0 MB. Compared to mainstream models like YOLO v5/v8/v9/v10, AGRI-YOLO achieves a 0.2–7.2% accuracy improvement while reducing parameters and computational load by 30–60.5%. Model size is reduced by 31.8–50%.
This research holds significant importance for advancing the mechanization and intelligent development of weed control in agricultural fields. In future research, the AGRI-YOLO model structure will be further improved according to actual application needs, embedded in terminal equipment systems for application, and combined with spraying robots to achieve precise application of pesticides, thereby advancing the development of intelligent agriculture, providing technical support for maintaining the dynamic balance of agricultural ecosystems, and offering theoretical support for establishing a scientific and technological guarantee mechanism for food security.

Author Contributions

Conceptualization, K.W. and G.P.; methodology, K.W.; software, K.W.; validation, G.P., K.W. and B.C.; formal analysis, K.W.; investigation, B.C.; resources, G.P.; data curation, D.W.; writing—original draft preparation, K.W.; writing—review and editing, G.P.; visualization, K.W.; supervision, B.C.; project administration, J.M.; funding acquisition, J.M. All authors have read and agreed to the published version of the manuscript.

Funding

This research was supported by the Key R&D projects in Henan Province (241111112600), the North China University of Water Resources, and this project received funding from the Master’s Innovation Capacity Enhancement Program at North China University of Water Resources and Electric Power in Henan Province (NCWUYC-202416087).

Data Availability Statement

The data that support the findings of this study are available from the corresponding author upon reasonable request.

Acknowledgments

We would like to thank DeepSeek (https://chat.deepseek.com/, accessed on 15 October 2024) for its assistance in proofreading and refining this paper.

Conflicts of Interest

The authors declare no conflicts of interest.

References

  1. Sun, W.; Xu, M.; Xu, K.; Chen, D.; Wang, J.; Yang, R.; Chen, Q.; Yang, S. CSGD-YOLO: A Corn Seed Germination Status Detection Model Based on YOLOv8n. Agronomy 2025, 15, 128. [Google Scholar] [CrossRef]
  2. Wang, B.; Yan, Y.; Lan, Y.; Wang, M.; Bian, Z. Accurate Detection and Precision Spraying of Corn and Weeds Using the Improved YOLOv5 Model. IEEE Access 2023, 11, 29868–29882. [Google Scholar] [CrossRef]
  3. Zhou, P.; Zhu, Y.; Jin, C.; Gu, Y.; Kong, Y.; Ou, Y.; Yin, X.; Hao, S. A new training strategy: Coordinating distillation techniques for training lightweight weed detection model. Crop Prot. 2025, 190, 107124. [Google Scholar] [CrossRef]
  4. Liu, H.; Hou, Y.; Zhang, J.; Zheng, P.; Hou, S. Research on Weed Reverse Detection Methods Based on Improved You Only Look Once (YOLO) v8: Preliminary Results. Agronomy 2024, 14, 1667. [Google Scholar] [CrossRef]
  5. Lytridis, C.; Pachidis, T. Recent Advances in Agricultural Robots for Automated Weeding. AgriEngineering 2024, 6, 3279–3296. [Google Scholar] [CrossRef]
  6. Gonzalez-Gonzalez, M.G.; Blasco, J.; Cubero, S.; Chueca, P. Automated Detection of Tetranychus urticae Koch in Citrus Leaves Based on Colour and VIS/NIR Hyperspectral Imaging. Agronomy 2021, 11, 1002. [Google Scholar] [CrossRef]
  7. Rahman, M.; Robson, A.; Salgadoe, S.; Walsh, K.; Bristow, M. Exploring the Potential of High Resolution Satellite Imagery for Yield Prediction of Avocado and Mango Crops. Proceedings 2019, 36, 154. [Google Scholar] [CrossRef]
  8. Daga, A.P.; Garibaldi, L. GA-Adaptive Template Matching for Offline Shape Motion Tracking Based on Edge Detection: IAS Estimation from the SURVISHNO 2019 Challenge Video for Machine Diagnostics Purposes. Algorithms 2020, 13, 33. [Google Scholar] [CrossRef]
  9. Palumbo, M.; Pace, B.; Cefola, M.; Montesano, F.F.; Serio, F.; Colelli, G.; Attolico, G. Self-Configuring CVS to Discriminate Rocket Leaves According to Cultivation Practices and to Correctly Attribute Visual Quality Level. Agronomy 2021, 11, 1353. [Google Scholar] [CrossRef]
  10. LeCun, Y.; Boser, B.; Denker, J.S.; Henderson, D.; Howard, R.E.; Hubbard, W.; Jackel, L.D. Backpropagation Applied to Handwritten Zip Code Recognition. Neural Comput. 1989, 1, 541–551. [Google Scholar] [CrossRef]
  11. Olsen, A.; Konovalov, D.A.; Philippa, B.; Ridd, P.; Wood, J.C.; Johns, J.; Banks, W.; Girgenti, B.; Kenny, O.; Whinney, J.; et al. DeepWeeds: A Multiclass Weed Species Image Dataset for Deep Learning. Sci. Rep. 2019, 9, 2058. [Google Scholar] [CrossRef] [PubMed]
  12. Ahmad, A.; Saraswat, D.; Aggarwal, V.; Etienne, A.; Hancock, B. Performance of deep learning models for classifying and detecting common weeds in corn and soybean production systems. Comput. Electron. Agric. 2021, 184, 106081. [Google Scholar] [CrossRef]
  13. Herrera, P.J.; Dorado, J.; Ribeiro, A. A novel approach for weed type classification based on shape descriptors and a fuzzy decision-making method. Sensors 2014, 14, 15304–15324. [Google Scholar] [CrossRef]
  14. Peteinatos, G.G.; Reichel, P.; Karouta, J.; Andújar, D.; Gerhards, R. Weed Identification in Maize, Sunflower, and Potatoes with the Aid of Convolutional Neural Networks. Remote Sens. 2020, 12, 4185. [Google Scholar] [CrossRef]
  15. Zhang, D.; Lu, R.; Guo, Z.; Yang, Z.; Wang, S.; Hu, X. Algorithm for Locating Apical Meristematic Tissue of Weeds Based on YOLO Instance Segmentation. Agronomy 2024, 14, 2121. [Google Scholar] [CrossRef]
  16. Zuo, Z.; Gao, S.; Peng, H.; Xue, Y.; Han, L.; Ma, G.; Mao, H. Lightweight Detection of Broccoli Heads in Complex Field Environments Based on LBDC-YOLO. Agronomy 2024, 14, 2359. [Google Scholar] [CrossRef]
  17. Jia, Z.; Zhang, M.; Yuan, C.; Liu, Q.; Liu, H.; Qiu, X.; Zhao, W.; Shi, J. ADL-YOLOv8: A Field Crop Weed Detection Model Based on Improved YOLOv8. Agronomy 2024, 14, 2355. [Google Scholar] [CrossRef]
  18. Ma, C.; Chi, G.; Ju, X.; Zhang, J.; Yan, C. YOLO-CWD: A novel model for crop and weed detection based on improved YOLOv8. Crop Prot. 2025, 192, 107169. [Google Scholar] [CrossRef]
  19. Wang, X.; Wang, Q.; Qiao, Y.; Zhang, X.; Lu, C.; Wang, C. Precision Weed Management for Straw-Mulched Maize Field: Advanced Weed Detection and Targeted Spraying Based on Enhanced YOLO v5s. Agriculture 2024, 14, 2134. [Google Scholar] [CrossRef]
  20. Tao, T.; Wei, X. STBNA-YOLOv5: An Improved YOLOv5 Network for Weed Detection in Rapeseed Field. Agriculture 2024, 15, 22. [Google Scholar] [CrossRef]
  21. Liu, W.; Anguelov, D.; Erhan, D.; Szegedy, C.; Reed, S.; Fu, C.-Y.; Berg, A.C. SSD: Single shot multibox detector. In Proceedings of the 14th European Conference on Computer Vision, Amsterdam, The Netherlands, 11–14 October 2016; pp. 21–37. [Google Scholar]
  22. Zhang, H.; Zhu, Y.; Zheng, H. NAMF: A nonlocal adaptive mean filter for removal of salt-and-pepper noise. Math. Probl. Eng. 2021, 2021, 4127679. [Google Scholar] [CrossRef]
  23. Cubuk, E.D.; Zoph, B.; Shlens, J.; Le, Q.V. Randaugment: Practical automated data augmentation with a reduced search space. In Proceedings of the 2020 IEEE/CVF Conference on Computer Vision and Pattern Recognition Workshops, Seattle, WA, USA, 14–19 June 2020; pp. 702–703. [Google Scholar]
  24. Krizhevsky, A.; Sutskever, I.; Hinton, G. Imagenet classification with deep convolutional neural networks. Adv. Neural Inf. Process. Syst. 2012, 25, 1–9. Available online: https://proceedings.neurips.cc/paper_files/paper/2012/file/c399862d3b9d6b76c8436e924a68c45b-Paper.pdf (accessed on 15 October 2024). [CrossRef]
  25. Kandel, I.; Castelli, M.; Manzoni, L. Brightness as an augmentation technique for image classification. Emerg. Sci. J. 2022, 6, 881–892. [Google Scholar] [CrossRef]
  26. Ultralytics. Ultralytics yolov11. 2024. Available online: https://docs.ultralytics.com/models/yolo11/ (accessed on 15 October 2024).
  27. Mallick, S. Yolo-learnopencv. 2024. Available online: https://learnopencv.com/yolo11/ (accessed on 15 October 2024).
  28. Shi, L.; Wei, Z.; You, H.; Wang, J.; Bai, Z.; Yu, H.; Ji, R.; Bi, C. OMC-YOLO: A Lightweight Grading Detection Method for Oyster Mushrooms. Horticulturae 2024, 10, 742. [Google Scholar] [CrossRef]
  29. Yu, W.; Zhou, P.; Yan, S.; Wang, X. InceptionNeXt: When Inception Meets ConvNeXt. In Proceedings of the 2024 IEEE/CVF Conference on Computer Vision and Pattern Recognition (CVPR), Seattle, WA, USA, 16–22 June 2024; pp. 5672–5683. [Google Scholar]
  30. Sunkara, R.; Luo, T. No More Strided Convolutions or Pooling: A New CNN Building Block for Low-Resolution Images and Small Objects. In Proceedings of the European Conference, ECML PKDD 2022, Grenoble, France, 19–23 September 2023; pp. 443–459. [Google Scholar] [CrossRef]
  31. Wu, T.; Miao, Z.; Huang, W.; Han, W.; Guo, Z.; Li, T. SGW-YOLOv8n: An Improved YOLOv8n-Based Model for Apple Detection and Segmentation in Complex Orchard Environments. Agriculture 2024, 14, 1958. [Google Scholar] [CrossRef]
  32. Wang, C.-Y.; Yeh, I.H.; Mark Liao, H.-Y. YOLOv9: Learning What You Want to Learn Using Programmable Gradient Information. In Proceedings of the 18th European Conference, Milan, Italy, 29 September–4 October 2024; pp. 1–21. [Google Scholar] [CrossRef]
  33. Zhang, X.; Yang, W.; Tang, X.; Liu, J. A Fast Learning Method for Accurate and Robust Lane Detection Using Two-Stage Feature Extraction with YOLO v3. Sensors 2018, 18, 4308. [Google Scholar] [CrossRef]
  34. Liu, X.; Peng, H.; Zheng, N.; Yang, Y.; Hu, H.; Yuan, Y. EfficientViT: Memory Efficient Vision Transformer with Cascaded Group Attention. In Proceedings of the 2023 IEEE/CVF Conference on Computer Vision and Pattern Recognition (CVPR), Vancouver, BC, Canada, 17–24 June 2023; pp. 14420–14430. [Google Scholar]
  35. Qin, D.; Leichner, C.; Delakis, M.; Fornoni, M.; Luo, S.; Yang, F.; Wang, W.; Banbury, C.; Ye, C.; Akin, B. MobileNetV4: Universal models for the mobile ecosystem. In Proceedings of the 18th European Conference, Milan, Italy, 29 September–4 October 2024; pp. 78–96. [Google Scholar]
  36. Chen, J.; Kao, S.h.; He, H.; Zhuo, W.; Wen, S.; Lee, C.H.; Chan, S.H.G. Run, Don’t Walk: Chasing Higher FLOPS for Faster Neural Networks. In Proceedings of the 2023 IEEE/CVF Conference on Computer Vision and Pattern Recognition (CVPR), Vancouver, BC, Canada, 17–24 June 2023; pp. 12021–12031. [Google Scholar]
  37. Wightman, R.; Touvron, H.; Jégou, H. Resnet strikes back: An improved training procedure in timm. arXiv 2021. [Google Scholar] [CrossRef]
  38. Li, Y.; Hou, Q.; Zheng, Z.; Cheng, M.M.; Yang, J.; Li, X. Large Selective Kernel Network for Remote Sensing Object Detection. In Proceedings of the 2023 IEEE/CVF International Conference on Computer Vision (ICCV), Paris, France, 1–6 October 2023; pp. 16748–16759. [Google Scholar]
  39. Yu, W.; Si, C.; Zhou, P.; Luo, M.; Zhou, Y.; Feng, J.; Yan, S.; Wang, X. MetaFormer Baselines for Vision. IEEE Trans. Pattern Anal. Mach. Intell. 2023, 46, 896–912. [Google Scholar] [CrossRef] [PubMed]
  40. Dai, T.; Wang, J.; Guo, H.; Li, J.; Wang, J.; Zhu, Z. FreqFormer: Frequency-aware transformer for lightweight image super-resolution. In Proceedings of the 33rd International Joint Conference on Artificial Intelligence, Jeju, Republic of Korea, 3–9 August 2024; pp. 731–739. [Google Scholar]
  41. Ding, X.; Zhang, X.; Han, J.; Ding, G. Diverse Branch Block: Building a Convolution as an Inception-like Unit. In Proceedings of the 2021 IEEE/CVF Conference on Computer Vision and Pattern Recognition (CVPR), Nashville, TN, USA, 20–25 June 2021; pp. 10881–10890. [Google Scholar]
  42. Zhang, X.; Song, Y.; Song, T.; Yang, D.; Ye, Y.; Zhou, J.; Zhang, L. LDConv: Linear deformable convolution for improving convolutional neural networks. Image Vis. Comput. 2024, 149, 105190. [Google Scholar] [CrossRef]
  43. Wu, T.; Tang, S.; Zhang, R.; Cao, J.; Zhang, Y. CGNet: A Light-Weight Context Guided Network for Semantic Segmentation. IEEE Trans. Image Process. 2021, 30, 1169–1179. [Google Scholar] [CrossRef] [PubMed]
  44. Han, K.; Wang, Y.; Guo, J.; Wu, E. ParameterNet: Parameters are All You Need for Large-Scale Visual Pretraining of Mobile Networks. In Proceedings of the 2024 IEEE/CVF Conference on Computer Vision and Pattern Recognition (CVPR), Seattle, WA, USA, 16–22 June 2024; pp. 15751–15761. [Google Scholar] [CrossRef]
  45. Zhang, T.; Li, L.; Zhou, Y.; Liu, W.; Qian, C.; Hwang, J.-N.; Ji, X. Cas-vit: Convolutional additive self-attention vision transformers for efficient mobile applications. arXiv 2024. [Google Scholar] [CrossRef]
  46. Lu, W.; Chen, S.-B.; Tang, J.; Ding, C.H.Q.; Luo, B. A Robust Feature Downsampling Module for Remote-Sensing Visual Tasks. IEEE Trans. Geosci. Remote Sens. 2023, 61, 4404312. [Google Scholar] [CrossRef]
  47. Wang, J.; Chen, K.; Xu, R.; Liu, Z.; Loy, C.C.; Lin, D. CARAFE: Content-Aware ReAssembly of FEatures. In Proceedings of the 2019 IEEE/CVF International Conference on Computer Vision (ICCV), Seoul, Republic of Korea, 27 October–2 November 2019; pp. 3007–3016. [Google Scholar]
  48. Liu, W.; Lu, H.; Fu, H.; Cao, Z. Learning to Upsample by Learning to Sample. In Proceedings of the 2023 IEEE/CVF International Conference on Computer Vision (ICCV), Paris, France, 1–6 October 2023; pp. 6004–6014. [Google Scholar]
  49. Williams, T.; Li, R. Wavelet pooling for convolutional neural networks. In Proceedings of the International Conference on Learning Representations, Vancouver, BC, Canada, 30 April–3 May 2018. [Google Scholar]
  50. Fan, X.; Sun, T.; Chai, X.; Zhou, J. YOLO-WDNet: A lightweight and accurate model for weeds detection in cotton field. Comput. Electron. Agric. 2024, 225, 109317. [Google Scholar] [CrossRef]
  51. Luo, W.; Chen, Q.; Wang, Y.; Fu, D.; Mi, Z.; Wang, Q.; Li, H.; Shi, Y.; Su, B. Real-time identification and spatial distribution mapping of weeds through unmanned aerial vehicle (UAV) remote sensing. Eur. J. Agron. 2025, 169, 127699. [Google Scholar] [CrossRef]
  52. Zhao, P.; Chen, J.; Li, J.; Ning, J.; Chang, Y.; Yang, S. Design and Testing of an autonomous laser weeding robot for strawberry fields based on DIN-LW-YOLO. Comput. Electron. Agric. 2025, 229, 109808. [Google Scholar] [CrossRef]
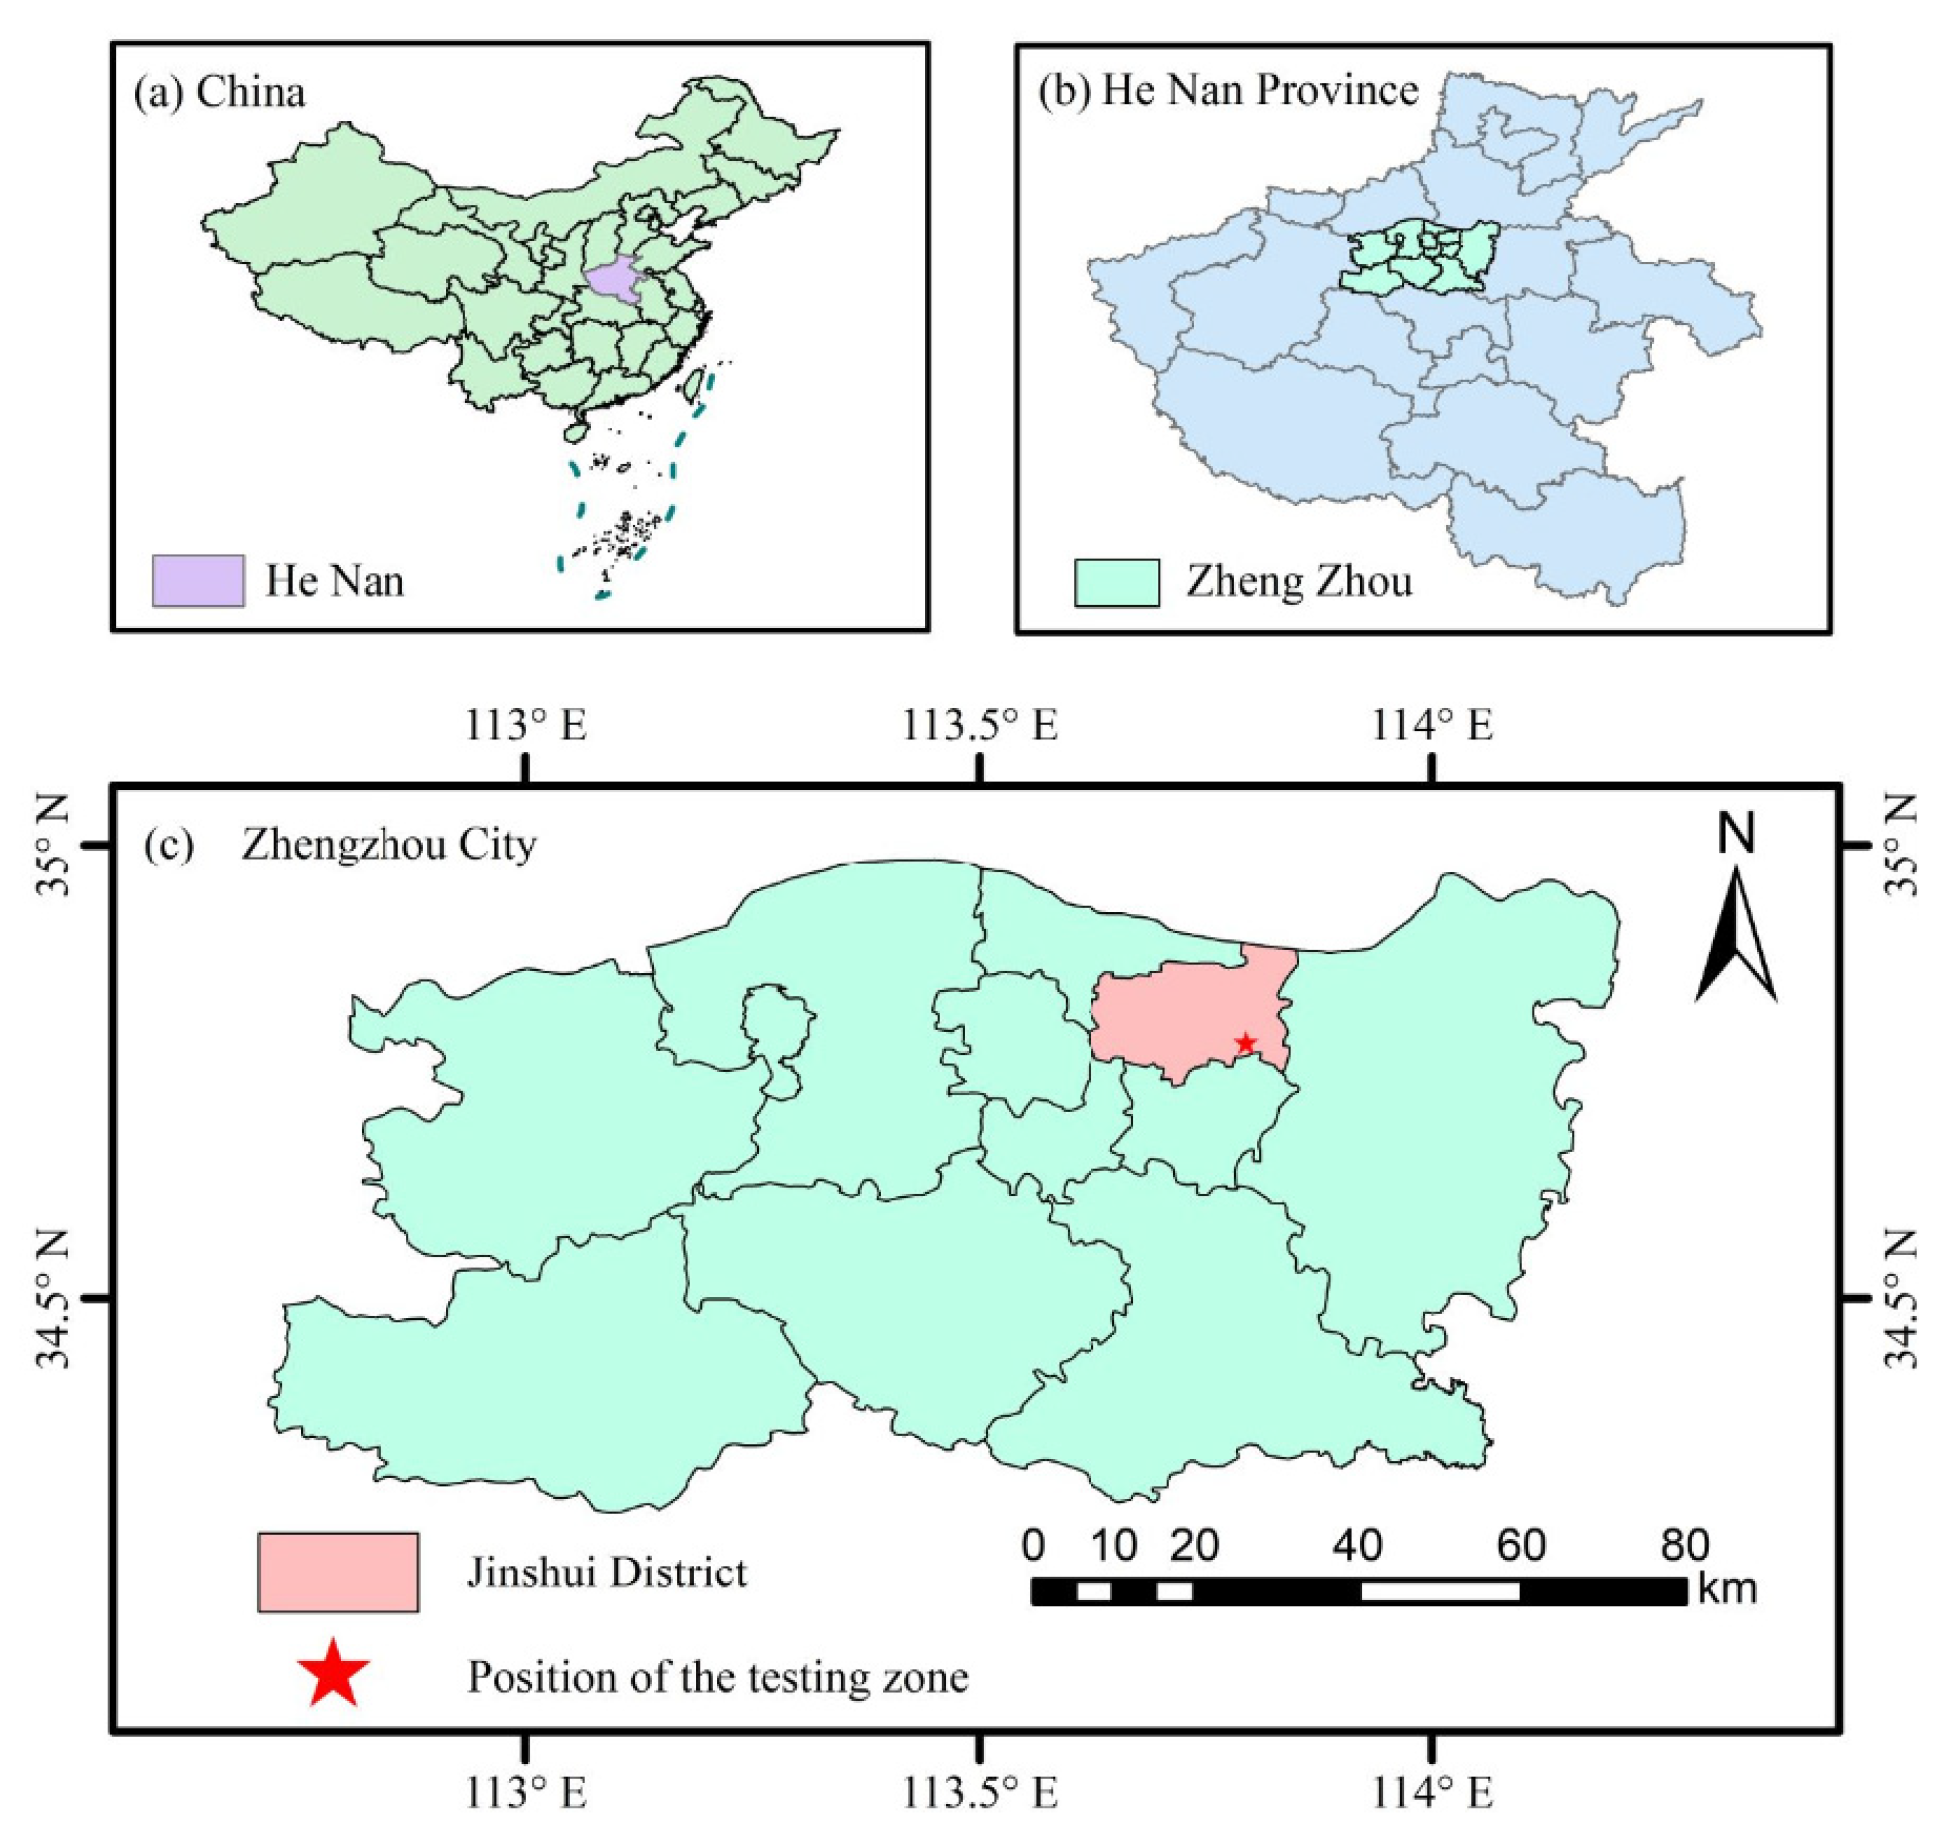
Figure 1. Schematic representation of the location of the study area. (a) Location of Henan Province within China; (b) Location of Zhengzhou City within Henan Province; (c) Location of Zhengzhou City and the test site—Jinshui District.
Agriculture 15 01971 g001
Figure 2. Effect after data enhancement. (a) Original image; (b) HSV random transformation; (c) Salt and pepper noise; (d) Fuzzy transformation; (e) Horizontal flip; (f) Brightness adjustment.
Agriculture 15 01971 g002
Figure 3. Enhanced images using LabelImg.
Agriculture 15 01971 g003
Figure 4. Network structure of the YOLO v11n.
Agriculture 15 01971 g004
Figure 5. Network structure of the AGRI-YOLO.
Agriculture 15 01971 g005
Figure 6. Structure of the conventional DWConv module.
Agriculture 15 01971 g006
Figure 7. Structure of the DWConv module of the InceptionNeXt model.
Agriculture 15 01971 g007
Figure 8. Structure of the SPD Conv downsampling module.
Agriculture 15 01971 g008
Figure 9. Network structure of Adown.
Agriculture 15 01971 g009
Figure 10. Network structure of the asymmetric lightweight detection head LADH-Head.
Agriculture 15 01971 g010
Figure 11. Model comparison experiments between different backbone networks.
Agriculture 15 01971 g011
Figure 12. Ablation experiment results.
Agriculture 15 01971 g012
Figure 13. Visualization of results. (a) Original image; (b) YOLO v11n; (c) AGRI-YOLO; (d) YOLO v11n Heatmap; (e) AGRI-YOLO Heatmap.
Agriculture 15 01971 g013
Table 1. Performance comparison of references [15,16,17,18,19,20] in crop and weed detection tasks.
ModelsDatasetsWhether Used Data EnhancementPrecisionmAP50Parameters
/M
GFLOPsSize/MB
F-YOLOv8n-seg-CDA [15] Calystegia hederacea Wall
Self: 248
Public: 5998

Self Enhanced to 980
81.0%-2.018.94.2
LBDC-YOLO [16]Broccoli Heads
Self: 839

Enhanced to 2013
97.65%94.44%1.936.53.5
ADL-YOLOv8 [17]Crop Weed
Self and Public: 4398

Enhanced to 7966
92.13%94.71%-7.35.02
YOLO-CWD [18]CropAndWeed
Public: 4800
81.3%71.5%3.499.6-
v5s-FasterNet-CBAM_WioU [19]Weeds in straw-covered
Self: 2088

Enhanced to 5000
90.3%91.4%6.87.46.8
STBNA-YOLOv5 [20]Rapeseed weed
Self: 5000
-64.4%90.8%---
Notes: “√” indicates data enhancement was used; “-” indicates data augmentation was not used or the original text did not provide relevant metric information.
Table 2. Number of samples in each of the dataset divisions.
CategoriesTotal SampleTraining (70%)Validation (20%)Test (10%)
Corn1821273619
Digitaria sanguinalis1711203417
Sedge1791253618
Cirsium setosum1611133216
Chenopodium album1741223517
Total86760717387
Table 3. Number of samples in each dataset partition after data enhancement.
CategoriesTotal SampleTraining (70%)Validation (20%)Test (10%)
Corn91063518095
Digitaria sanguinalis85560017085
Sedge89562518090
Cirsium setosum80556516080
Chenopodium album87061017585
Total43353035865435
Table 4. Environment and parameter settings.
ProgramParameters
Operating systemWindows
ARM16 GB
CPUi5-12400F
GPU12 GB NVIDIA 3060
PlatformPycharm
Base modelYOLO v11n
Programming languagesPython 3.10
Deep learning frameworkPytorch 2.01
CUDA version11.8
OptimizerSGD
Learning rate0.001
Epochs300
Table 5. Comparison of experimental results using models with different backbone networks.
ModelsPrecisionRecallmAP50ParametersGFLOPsSize/MB
EfficientViT [34]82.4%73.5%82.2%37388317.97.9
Mobilenetv4 [35]79.3%68.4%79.4%543044721.010.7
Fasternet [36]82.8%73.2%82.5%39358609.37.8
Timm [37]81.3%74.1%81.8%1305678333.625.2
LSKNet [38]80.6%71.9%81.5%562457318.211.1
YOLO v11n84.7%72.9%83.3%25831276.35.2
Table 6. Comparison of experimental results using models with different C3k2 modules.
ModelsPrecisionRecallmAP50ParametersGFLOPsSize/MB
C3k2-ConvFormer [39]82.4%71.1%80.6%24293116.54.9
C3k2-CTA [40]82.7%71.2%80.5%26209696.77.1
C3k2-DBB [41]82.8%73.2%81.3%25831276.77.0
C3k2-AKConv [42]80.3%73.1%81.5%24829036.35.1
C3k2-ContextGuided [43]81.6%71.6%80.2%21811765.54.5
C3k2-GhostDynamicConv [44]79.1%71.6%80.3%22276075.44.6
C3k2-AdditiveBlock [45]82.0%71.4%80.3%26262876.75.5
C3k2-IDWC83.3%73.6%82.2%21604235.44.4
Table 7. Comparison results of different upsampling and downsampling modules.
ModelsPrecisionRecallmAP50ParametersGFLOPsSize/MB
SRFD [46]81.2%72.1%80.5%25879287.75.8
CARAFE [47]83.3%71.9%80.3%27563526.85.6
Dysample [48]82.2%72.9%82.6%26286006.55.4
WaveletPool [49]82.9%72.5%81.8%22019925.64.6
SPDConv84.1%72.6%82.9%458760711.38.8
ADown84.0%74.1%82.9%21038955.34.3
Table 8. Comparison results of different loss functions.
ModelLoss FunctionsPrecisionRecallmAP50
YOLO v11nGiou83.0%73.9%82.1%
Eiou81.9%73.5%82.1%
Siou82.8%73.3%82.2%
Diou81.8%74.8%82.6%
Piou82.1%73.9%82.2%
Shapeiou83.6%73.6%82.5%
Ciou84.7%72.9%83.3%
Table 9. The results of ablation experiment.
Experiment NumberAdownIDWCLADHPrecisionRecallmAP50ParametersGFLOPsSize/MB
1---84.7%72.9%83.3%25831276.35.2
2--83.9%74.0%82.9%21038955.34.3
3--83.3%73.4%82.1%21604235.44.4
4--82.9%74.5%83.1%22823275.24.8
5-85.5%74.3%84.1%16811914.43.5
6-83.8%74.9%83.5%24286314.43.8
7-82.9%72.6%81.2%18596234.33.9
884.7%73.0%82.8%13803913.23.0
Notes: “√” indicates that the corresponding module was used during the experiment; “-” indicates that the corresponding module was not used during the experiment.
Table 10. Comparison results between different models.
ModelsPrecisionRecallmAP50ParametersGFLOPsSize/MB
YOLO v584.4%73.1%83.0%25039197.15.0
YOLO v884.2%74.0%84.2%30066238.16.0
YOLOv984.5%75.3%84.3%19717597.64.4
YOLO v1077.5%71.1%79.4%22661436.55.5
YOLO v11n84.7%72.9%83.3%25831276.35.2
AGRI-YOLO84.7%73.0%82.8%13803913.23.0
Table 11. Performance Comparison of Different YOLO Models with Statistical Analysis.
ModelsPerformance MetricsARGI-YOLOComparison Model PerformancePerformance Differencet-Statisticp-Value
YOLO v5Precision84.7%84.4%+0.32.310.021
Recall73.0%73.1%−0.10.450.652
mAP5083.0%83.0%001.000
YOLO v8Precision84.7%84.2%+0.52.870.004
Recall73.0%74.0%−1.03.120.002
mAP5083.0%84.2%−1.23.59<0.001
YOLOv9Precision84.7%84.5%+0.21.960.051
Recall73.0%75.3%−2.34.87<0.001
mAP5083.0%84.3%−1.34.15<0.001
YOLO v10Precision84.7%77.5%+7.212.63<0.001
Recall73.0%71.1%+1.95.24<0.001
mAP5083.0%79.4%+3.68.91<0.001
YOLO v11nPrecision84.7%84.7%001.000
Recall73.0%72.9%+0.10.380.703
mAP5082.8%83.3%−0.51.890.060
Disclaimer/Publisher’s Note: The statements, opinions and data contained in all publications are solely those of the individual author(s) and contributor(s) and not of MDPI and/or the editor(s). MDPI and/or the editor(s) disclaim responsibility for any injury to people or property resulting from any ideas, methods, instructions or products referred to in the content.