Article

LWCD-YOLO: A Lightweight Corn Seed Kernel Fast Detection Algorithm Based on YOLOv11n

1
School of Information and Communication Engineering, Hainan University, Haikou 570228, China
2
Mechanical and Electrical Engineering College, Hainan University, Haikou 570228, China
3
Key Laboratory of Tropical Intelligent Agricultural Equipment, Ministry of Agriculture and Rural Affairs, Haikou 570228, China
4
Information Technology Research Center, Beijing Academy of Agriculture and Forestry Sciences, Beijing 100097, China
5
Haikou Experimental Station, Chinese Academy of Tropical Agricultural Sciences, Haikou 571101, China
*
Author to whom correspondence should be addressed.
Agriculture 2025, 15(18), 1968; https://doi.org/10.3390/agriculture15181968
Submission received: 10 August 2025 / Revised: 13 September 2025 / Accepted: 17 September 2025 / Published: 18 September 2025
(This article belongs to the Section Artificial Intelligence and Digital Agriculture)

Abstract

As one of the world’s most important staple crops providing food, feed, and industrial raw materials, corn requires precise kernel detection for seed phenotype analysis and seed quality examination. In order to achieve precise and rapid detection of corn seeds, this study proposes a lightweight corn seed kernel rapid detection model based on YOLOv11n (LWCD-YOLO). Firstly, a lightweight backbone feature extraction module is designed based on Partial Convolution (PConv) and an efficient multi-scale attention module (EMA), which reduces model complexity while maintaining model detection performance. Secondly, a cross layer multi-scale feature fusion module (MSFFM) is proposed to facilitate deep feature fusion of low-, medium-, and high-level features. Finally, we optimized the model using the WIOU bounding box loss function. Experiments were conducted on the collected Corn seed kernel detection dataset, and LWCD-YOLO only required 1.27 million (M) parameters and 3.5 G of FLOPs. Its precision (P), mean Average Precision at 0.50 (mAP0.50), and mean Average Precision at 0.50:0.95 (mAP0.50:0.95) reached 99.978%, 99.491%, and 99.262%, respectively. Compared to the original YOLOv11n, the model size, parameter count, and computational complexity were reduced by 50%, 51%, and 44%, respectively, and the FPS was improved by 94%. The detection performance, model complexity, and detection efficiency of LWCD-YOLO are superior to current mainstream object detection models, making it suitable for fast and precise detection of corn seeds. It can provide guarantees for achieving seed phenotype analysis and seed quality examination.

1. Introduction

Corn is one of the world’s three major staple crops, and ensuring its yield is vital for global food security [1]. To increase the yield of maize, it is necessary not only to cultivate excellent maize varieties but also to select high-quality seeds. Accurately extracting the seed kernel region is particularly important in the process of variety identification and seed quality assessment. This not only provides counts for calculating the 100-kernel weight and 1000-kernel weight of seeds, but also automatically provides kernel images for obtaining seed phenotypic information and seed variety identification. Therefore, seed kernel region detection has become a hot topic in agricultural research in recent years.
In the early research, the detection of target areas of seed grains was mainly achieved through traditional image processing, such as the erosion and dilation method [2], the particle contour curvature method [3,4], the watershed segmentation algorithm [5], and the feature point matching method [6]. Although these methods can achieve good detection results, they are only applicable to the situation where the seeds are not adhered or blocked and have the limitations of manually designed features. In the agricultural sector, Machine and Deep Learning have emerged as powerful tools that allow algorithms to learn from data and make predictions (e.g., regression, classification), leading to advancements in a wide range of applications [7,8]. With the rapid development of deep learning technology, due to the powerful feature extraction ability of convolutional neural networks, people have been gradually applying it to the research of seed detection. Velesaca et al. [9] used the original Mask R-CNN algorithm to segment the corn seeds in the population, providing a guarantee for subsequent seed quality classification. Zhao et al. [10] designed a wheat dense spike segmentation model based on transfer learning and YOLOv4 was proposed, and the segmentation accuracy reached 93.7% under dense conditions. Wang et al. [11] proposed a wheat ear grain segmentation method based on Mask R-CNN, and realized 94.13% mAP. Although image segmentation methods can accurately screen out target areas, the model is complex and the detection efficiency is slow. Therefore, relevant researchers began to use target detection models to detect seed kernels.
Compared with the two-stage target detection algorithm, the single-stage target detection algorithm does not need to generate candidate boxes but can directly generate the category probability and position coordinates of the target, and it is widely used in seed multi-grain detection tasks. Wang et al. [12] used the vibration principle to separate the wheat seeds to solve the problem of easy accumulation of grains. They used the transformer to build a feature extraction network based on the YOLOv7 target detection framework. The P reached more than 87% in the cases of sparse, medium adhesion and dense adhesion, but increased the complexity of the model and the detection time. In order to reduce the complexity of the model, Song et al. [13] used a combination of mixed depthwise convolutional (MDC) and Squeeze-and-Excitation (SE) Attention based on YOLOv5s to replace the convolution module of the feature extraction backbone network, thus reducing the complexity of the model. This method compared the effects of different color light sources, different shooting heights, and different shooting distances on the performance of rice seed grain detection. The results showed that under green light conditions the shooting height was 5 cm. Compared with YOLOv5s, the model size was reduced by 0.6 MB. To improve the model’s ability to perceive the small target features of seed grains, Zou et al. [14] used YOLOv5 as the backbone network and added a small target detection head while using transformers and coordinate attention modules. On a self-built rice seed grain dataset, the model’s mAP0.50 reached 99.20%. Liang et al. [15] put forward a rice grain detection model with a parameter of 4.6 M by using depth separation convolution and attention mechanism, combined with YOLOX framework, the mAP reached 97.55%. Chen et al. [16] proposed a lightweight rice grain detection model based on YOLOv5s model and realized the detection performance of 98.81% mAP for rice grains when the model parameters were reduced by 70.8% and only 2.05 M. Ma et al. [17] realized 99.3% detection effect of mAP on wheat grains while reducing model parameters by 20% based on YOLOv8n framework by designing lightweight detection head and combining attention mechanism.
Although the above methods have achieved good research results, there are still the following problems: (a) Existing studies mainly focus on rice and wheat seed grains. The shape differences between the grains of these crops are small. The shape of corn seed grains varies within the same variety and between different varieties. It is not appropriate to directly apply the grain detection model of crops such as rice and wheat to the grain detection task of corn seeds. (b) Existing studies mainly aim to improve the model detection performance by increasing the complexity of the model. Although some studies have improved the detection performance of the model while reducing the model complexity, the reduction in model complexity does not prove that the detection efficiency of the model has been improved.
In order to solve the above problems, this paper proposes a lightweight corn seed kernel fast detection algorithm based on YOLOv11n, which reduces the model complexity while improving the detection performance and efficiency of the model. First, to meet different usage requirements, a dataset of two environments was established: one in which the kernels were not adhered to each other and were not blocked, and the other in which the kernels were adhered to each other and blocked. In the backbone network, to reduce the extraction of redundant features, a new lightweight backbone network based on PConv and EMA was proposed. This reduces both redundant features and model complexity. Regarding feature fusion, to enhance the ability to fuse features of different scales and levels, MSFFM was designed to achieve deep fusion of features of different scales. This reduces model complexity and computational effort, and also correspondingly reduces the computational effort and complexity of the detection head. Finally, WIOU was selected to improve the model’s detection performance.

2. Materials and Methods

2.1. Construction of Corn Seed Detection Dataset

2.1.1. Corn Seed Material

As shown in Figure 1, six corn varieties with a wide planting range and representative grain shapes in China were selected, namely Longping 206 (LP206), Longping 208 (LP208), Zhongyu 303 (ZY303), Zhengdan 958 (ZD958), Lianghe 367 (LH367) and Chaoshi 5 (CS5). They are commercial corn seeds without a coating agent. Among them, LP206, LP208, and ZY303 were purchased from the corn commercial seeds produced in 2024 by Anhui Longping High-Tech Seed Co., Ltd., Hefei, China, ZD958 was purchased from Hebei Dayu Seed Co., Ltd., Cangzhou, China, LH367 was purchased from Yunnan Lianghe Seed Co., Ltd., Kunming, China, and Chaoshi No. 5 was derived from a new variety under trial. The initial moisture content of all samples was about 12–13%.

2.1.2. Image Acquisition

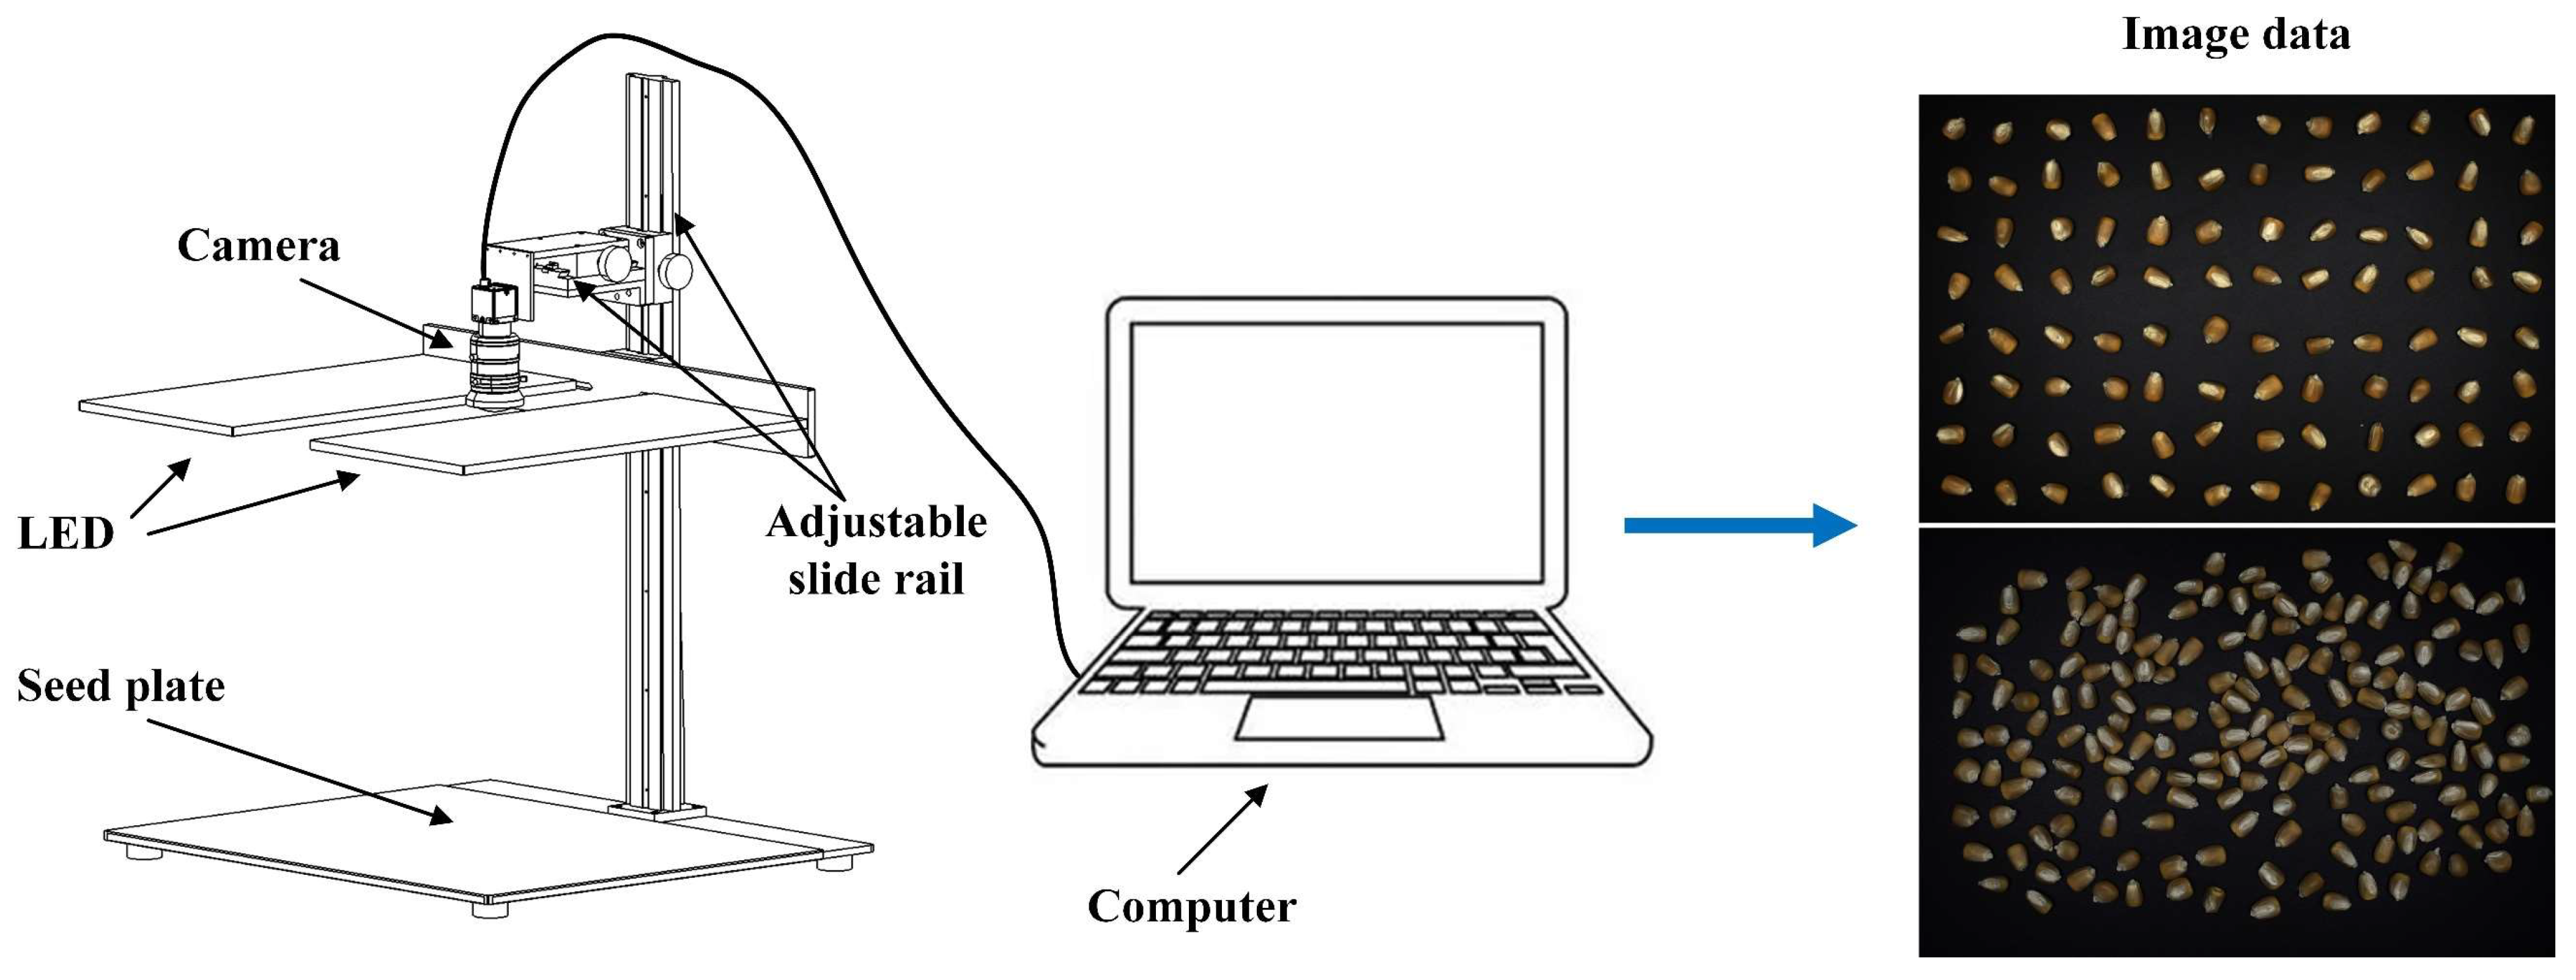
To acquire RGB images of corn seeds, a corn seed kernel image acquisition platform, as shown in Figure 2, was designed and constructed. This platform includes a camera, an LED light source, an adjustable slide, and a seed platform. This data acquisition platform includes an The camera used is a industrial camera (Hik-vision MV-CS2000-10UC, with a lens model MVL-KF1224M-25MP, Hangzhou, China). The adjustable slide allows for adjustment of the camera’s height and distance to meet data acquisition requirements. The LED light source provides illumination during data acquisition, meeting the required lighting conditions. Because images captured by optical cameras often exhibit edge distortion, an image area of 4448 × 3000 pixels was selected as the capture size.

2.1.3. Data Preprocessing

Based on the image acquisition platform, images of corn seed kernels were collected in two environments as shown in Figure 2. One is a simple environment where the kernels are fixedly distributed and there is no adhesion or obstruction between the kernels. The other is an environment where the kernels are randomly spread on the acquisition platform and there is adhesion and obstruction between the kernels. A total of 244 images, totaling 27,978 kernels, were collected for six varieties of corn seeds. Labeling annotation software (https://gitcode.com/gh_mirrors/labe/labelImg/?utm_source=artcal_gitcode&index=top&type=card&webUrl) (accessed on 3 January 2025) was used to annotate all collected images. In this study, the kernel area of each corn seed variety was annotated with the same label, while the remaining unlabeled areas were defaulted to background. When annotating the data, the region of interest was annotated using a minimum bounding rectangle to minimize background influence and positioning errors. The annotated label file is in XML format and contains the coordinates of the seed center and the width and height of the rectangle. The XML file is then converted to the txt annotation file required by YOLO.
In order to fully reflect the performance and generalization of the proposed method in corn kernel detection refer to the following papers [16,18,19]. This paper divided the dataset into two parts: training set and test set. Two varieties, LP206 and CS5, were randomly selected from the six varieties as the test set, and the remaining four varieties were used as the training set. Details of the dataset are shown in Table 1. The training set consists of 161 images with 18,659 bounding boxes, while the test set consists of 83 images with 9319 bounding boxes. Corn seed kernels exhibit a wide variety of scales and positions within images, and their brightness, size, and posture also vary during data collection. To adapt to diverse recognition environments, improve the model’s generalization capabilities, and avoid inadequate model network training due to data size, we augment the training set data using random combinations of rotation, scaling, flipping, contrast changes, and cropping. As shown in Figure 3, each image is augmented 10-fold. After augmentation, the total number of images in the training set is 1610, and the number of target boxes is 186,590. No data augmentation is performed on the test set.

2.2. The Network Structure of LWCD-YOLO

2.2.1. The Object Detection Framework

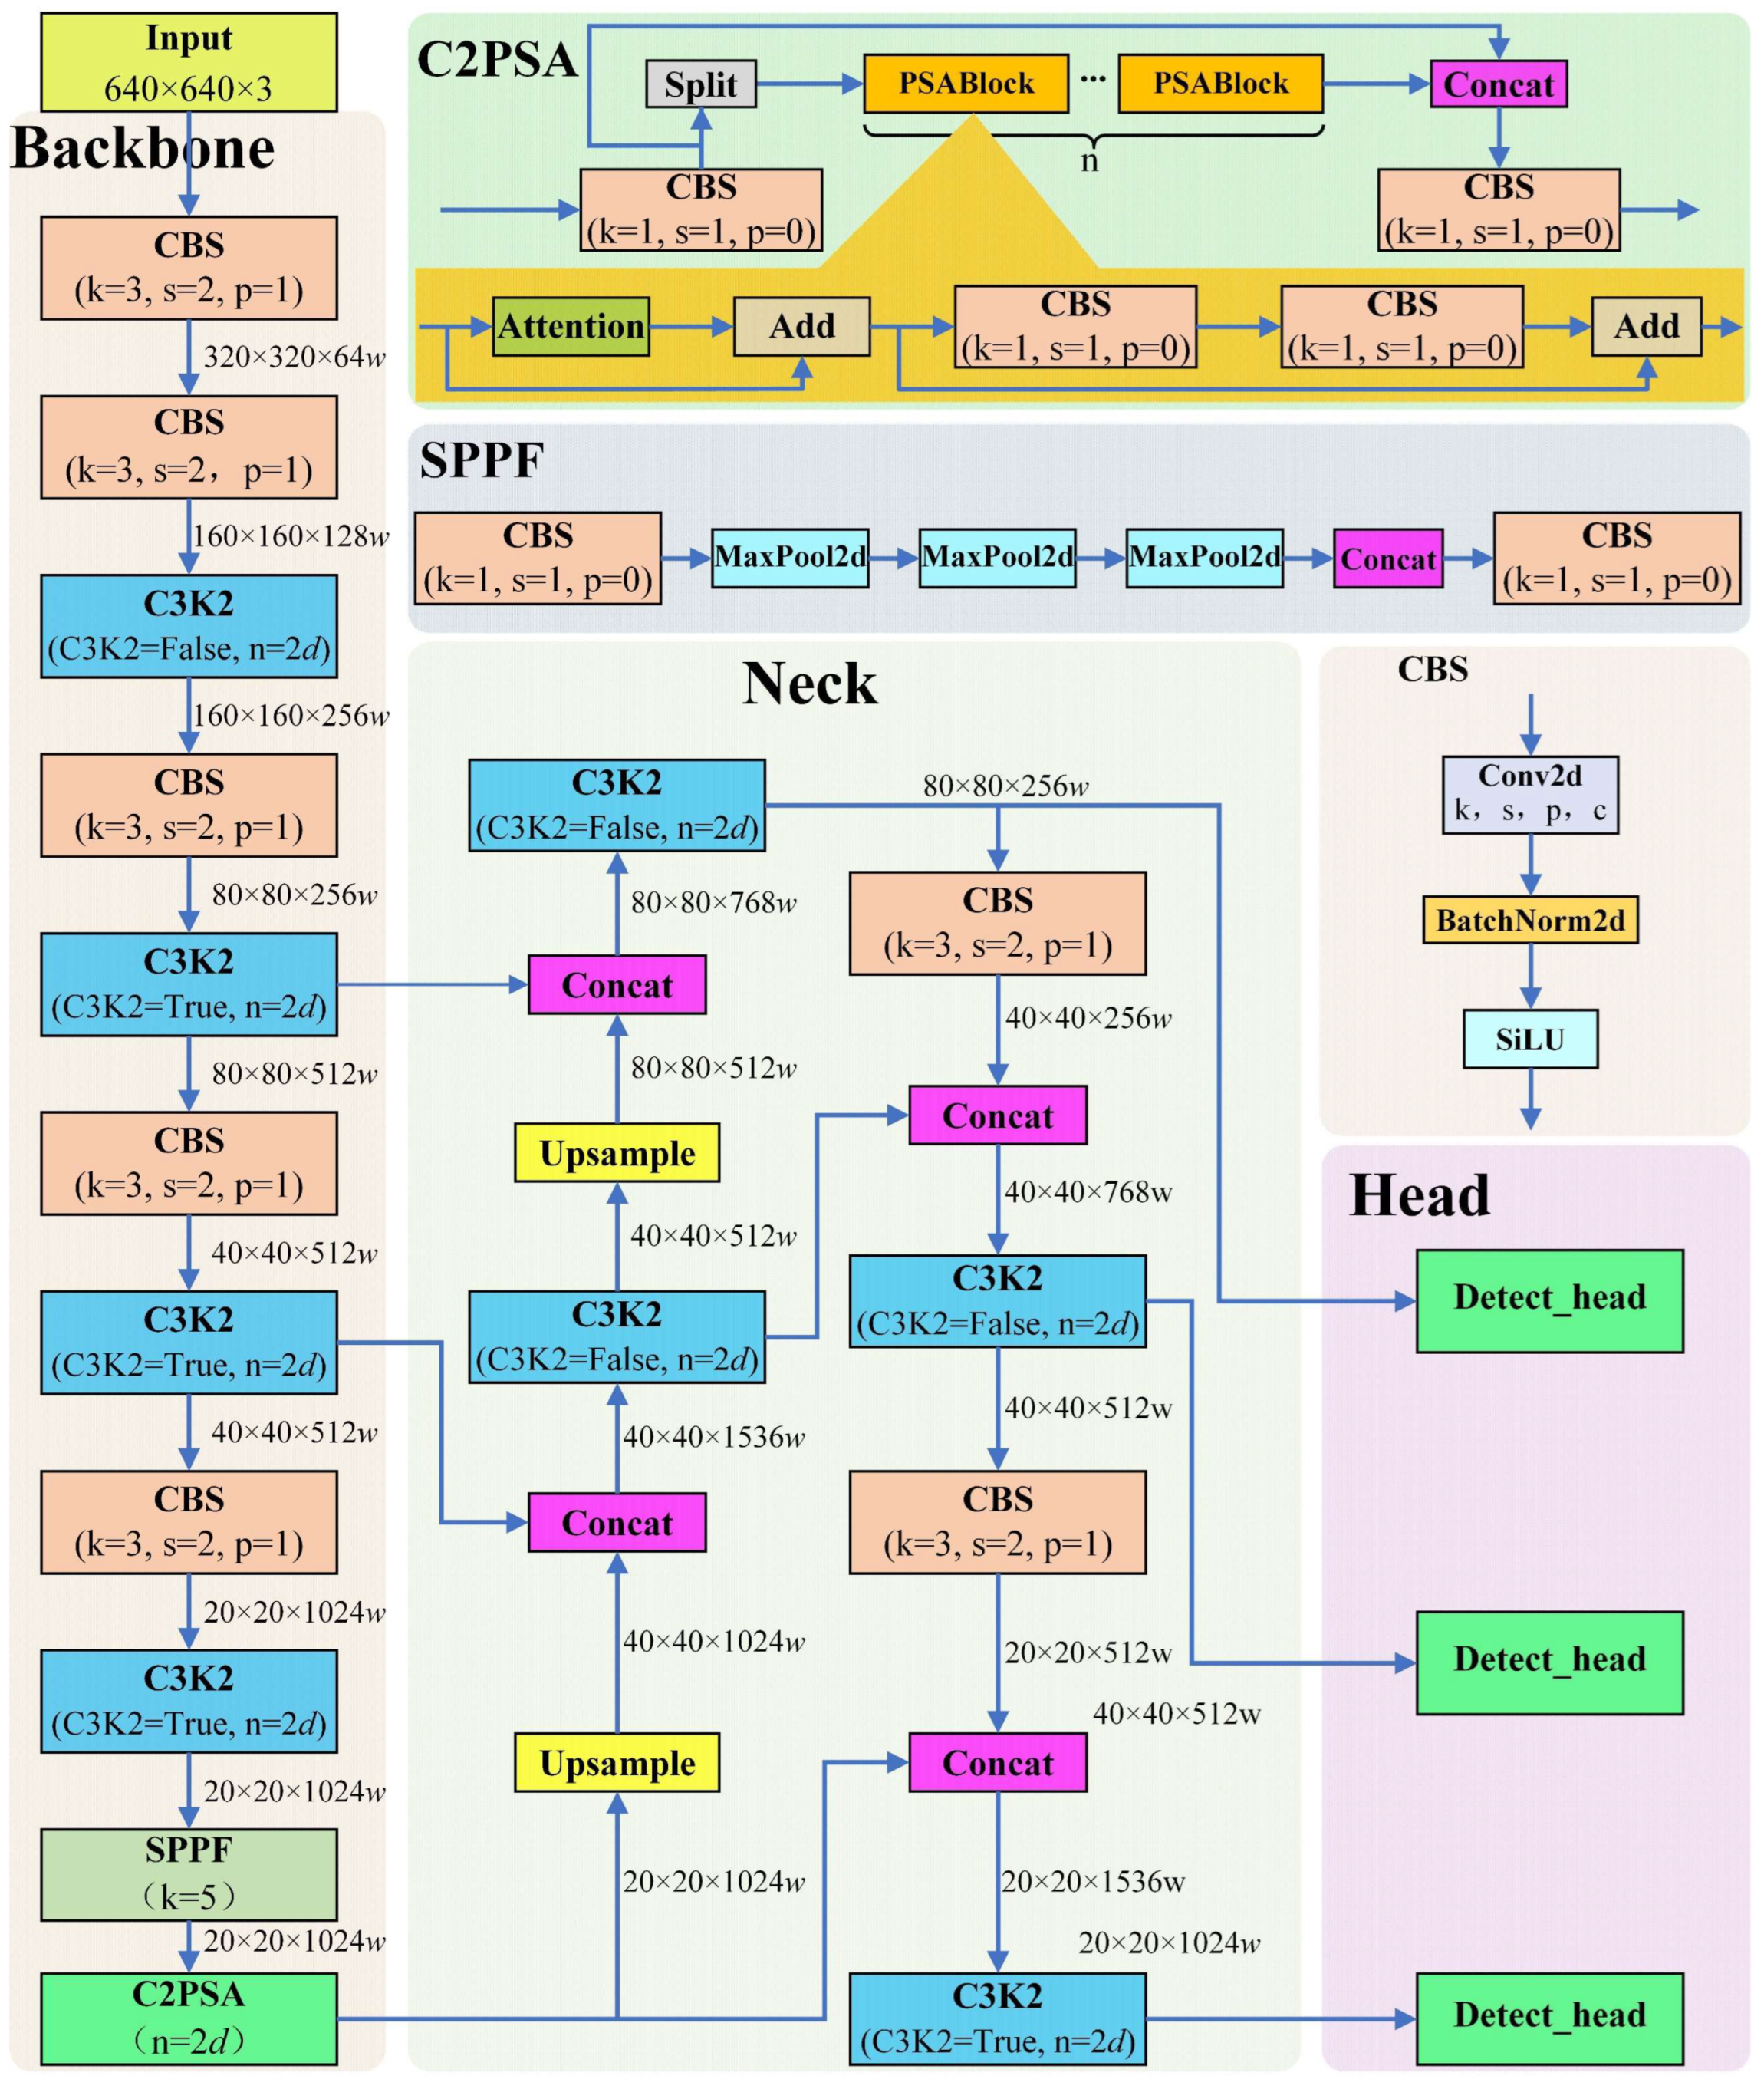
Currently, object detection models can be divided into single-stage and two-stage models. Compared to two-stage networks, single-stage network models have faster inference speed and higher efficiency. In the corn kernel detection task, there are certain requirements for detection efficiency while ensuring detection performance. Therefore, a single-stage network was chosen as the base model for this study. Although the latest version of YOLO object detection is YOLOv13, YOLOv11 offers advantages such as strong detection performance, high computational efficiency, and robustness [20]. Based on model size, YOLOv11 [21] can be divided into five versions: n, s, m, l, and x. YOLOv11n is the least complex and most efficient of the five versions, so this paper selects YOLOv11n as the baseline model for improvement. The YOLOv11n model architecture is shown in Figure 4. It mainly consists of three components: feature extraction backbone module, neck network, and detection head.
As shown in Figure 4, the feature extraction module primarily consists of C3K2, a CBS (Conv + BN + SiLU) module with a stride of 2, Fast Spatial Pyramid Pooling (SPPF) [22], and C2PSA module. C3K2 is the feature extraction unit within the module, fully extracting spatial and semantic features from the feature map. CBS primarily downsamples the feature map, reducing its size while extracting features, thereby reducing the complexity of the deep network. The SPPF module enables the perception of multi-scale spatial features. The C2PSA module combines the Cross Stage Partial (CSP) architecture with the Pyramid Squeeze Attention (PSA) mechanism to further enhance multi-scale feature extraction capabilities. The neck network, consisting of a Feature Pyramid Network (FPN) and a Path Aggregation Network (PAN), fuses shallow and deep feature information through a combination of bottom-up and top-down approaches to improve detector performance. The detection head mainly obtains target category information and target location information from the fused features.
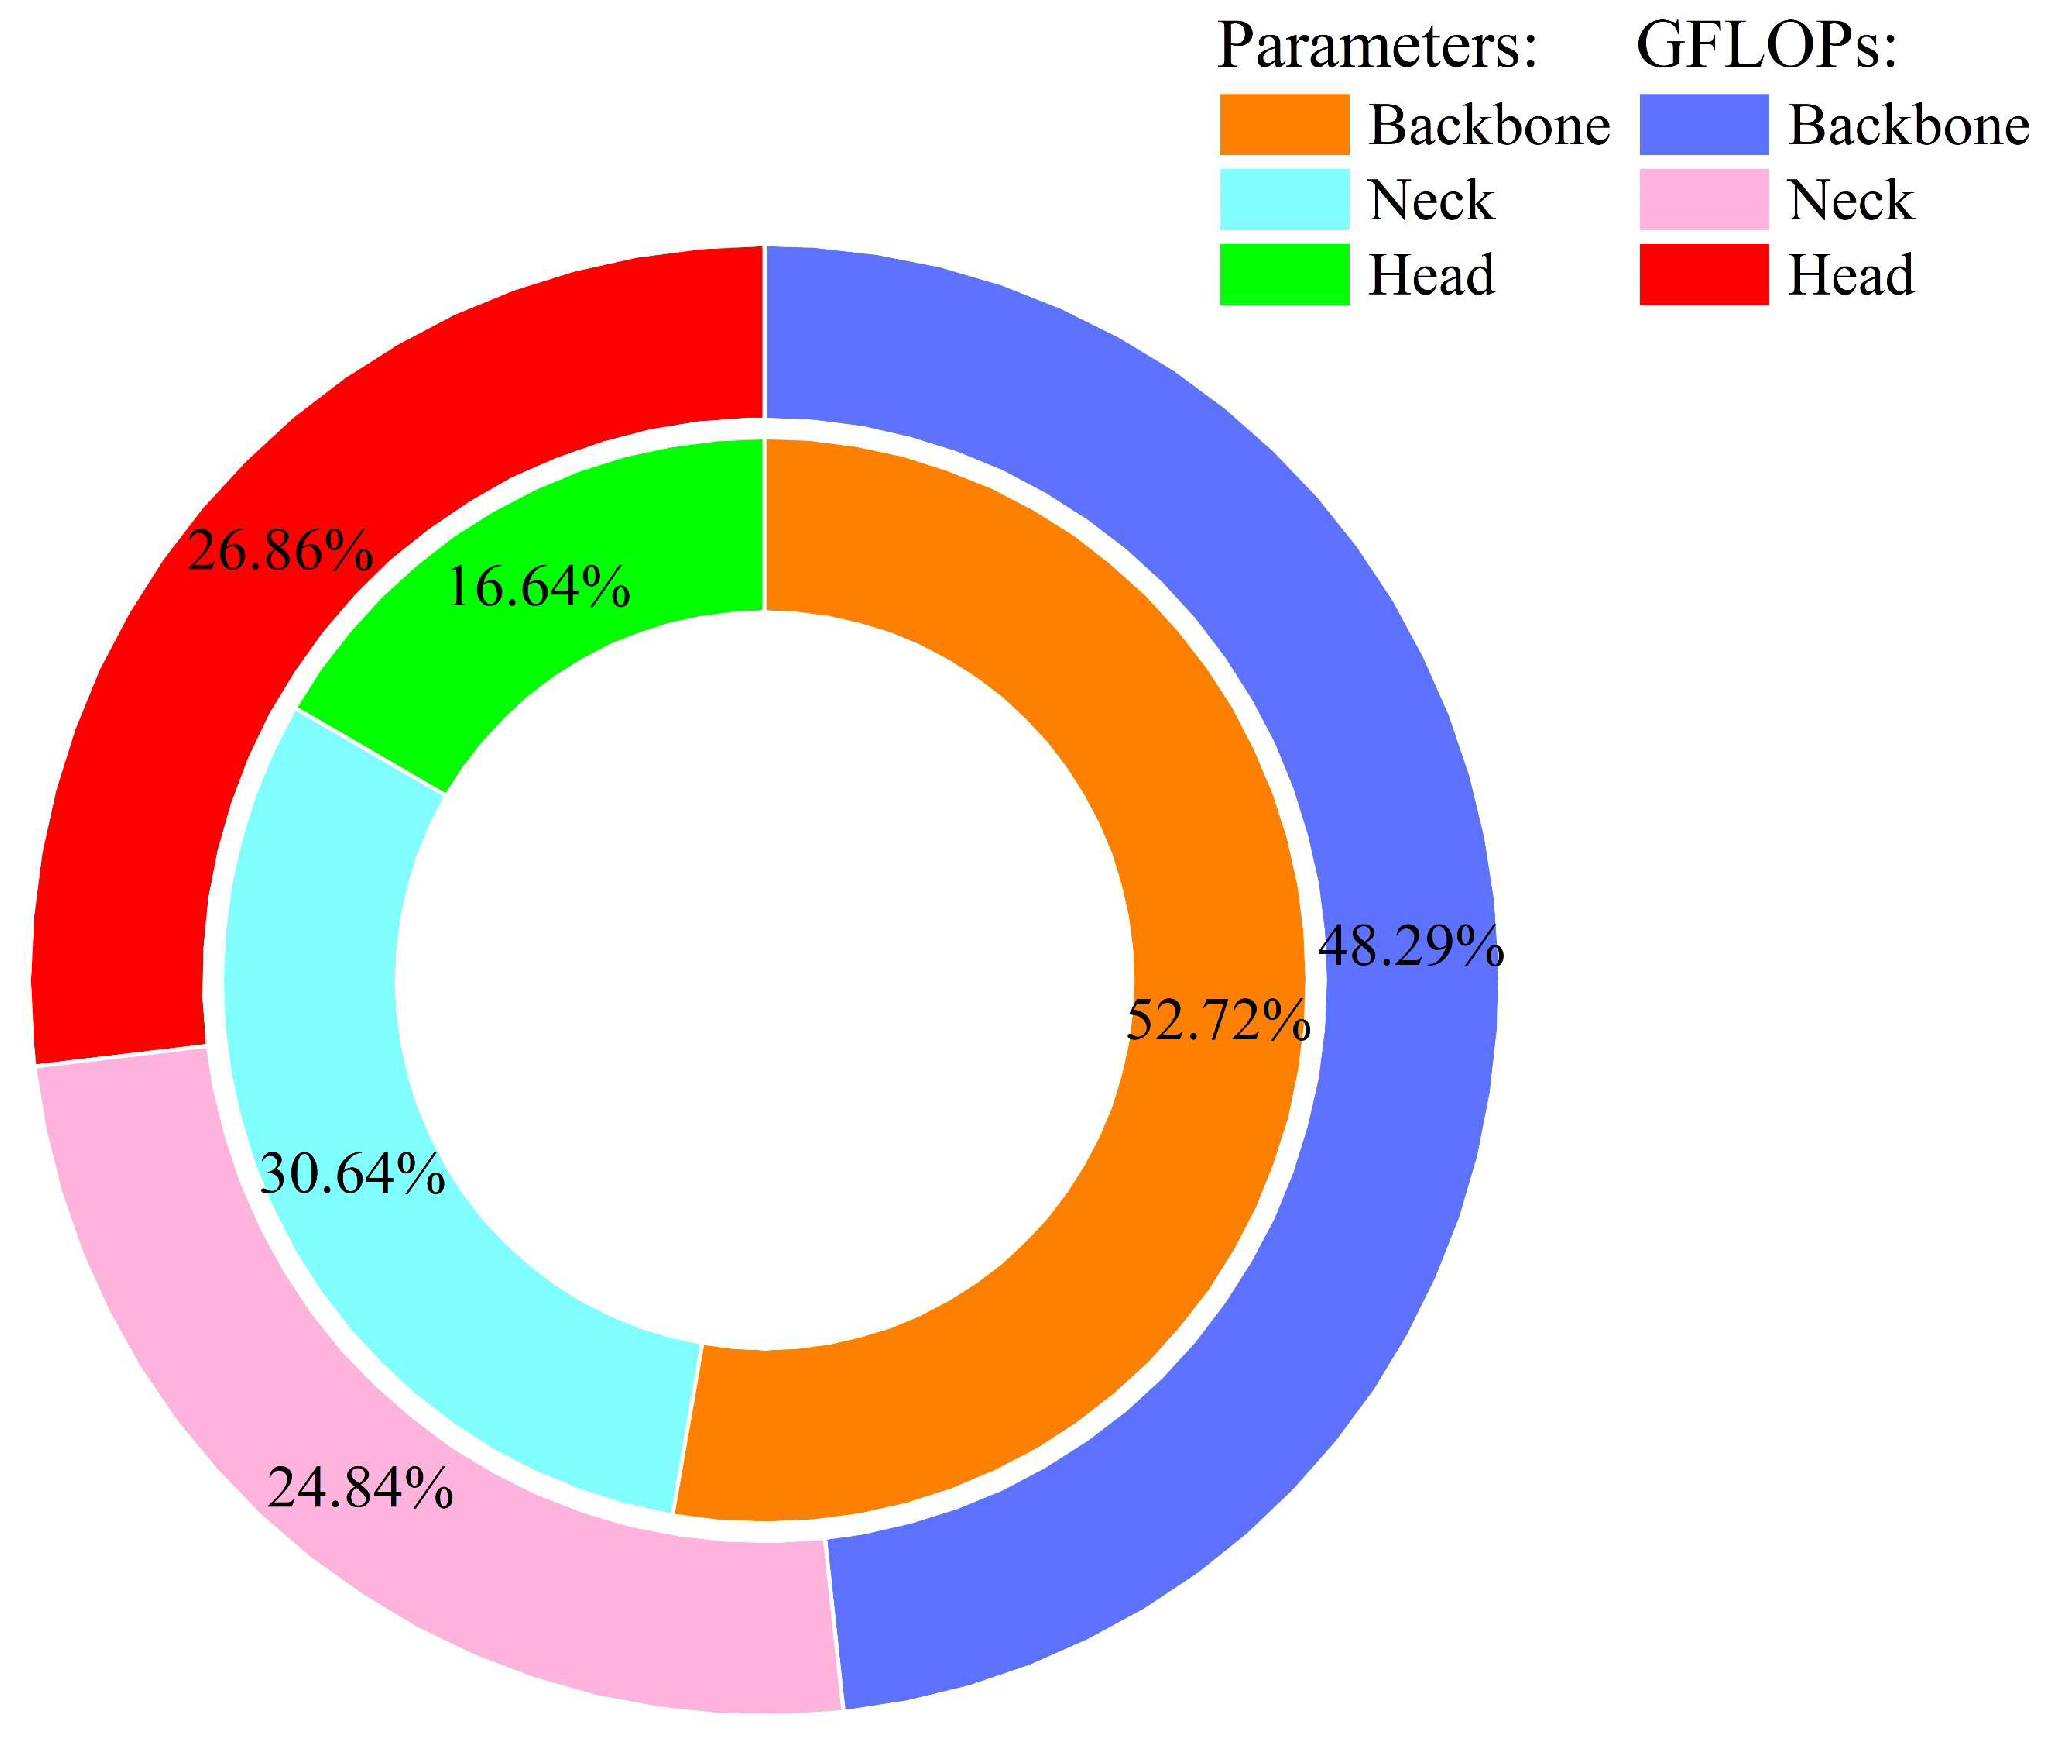
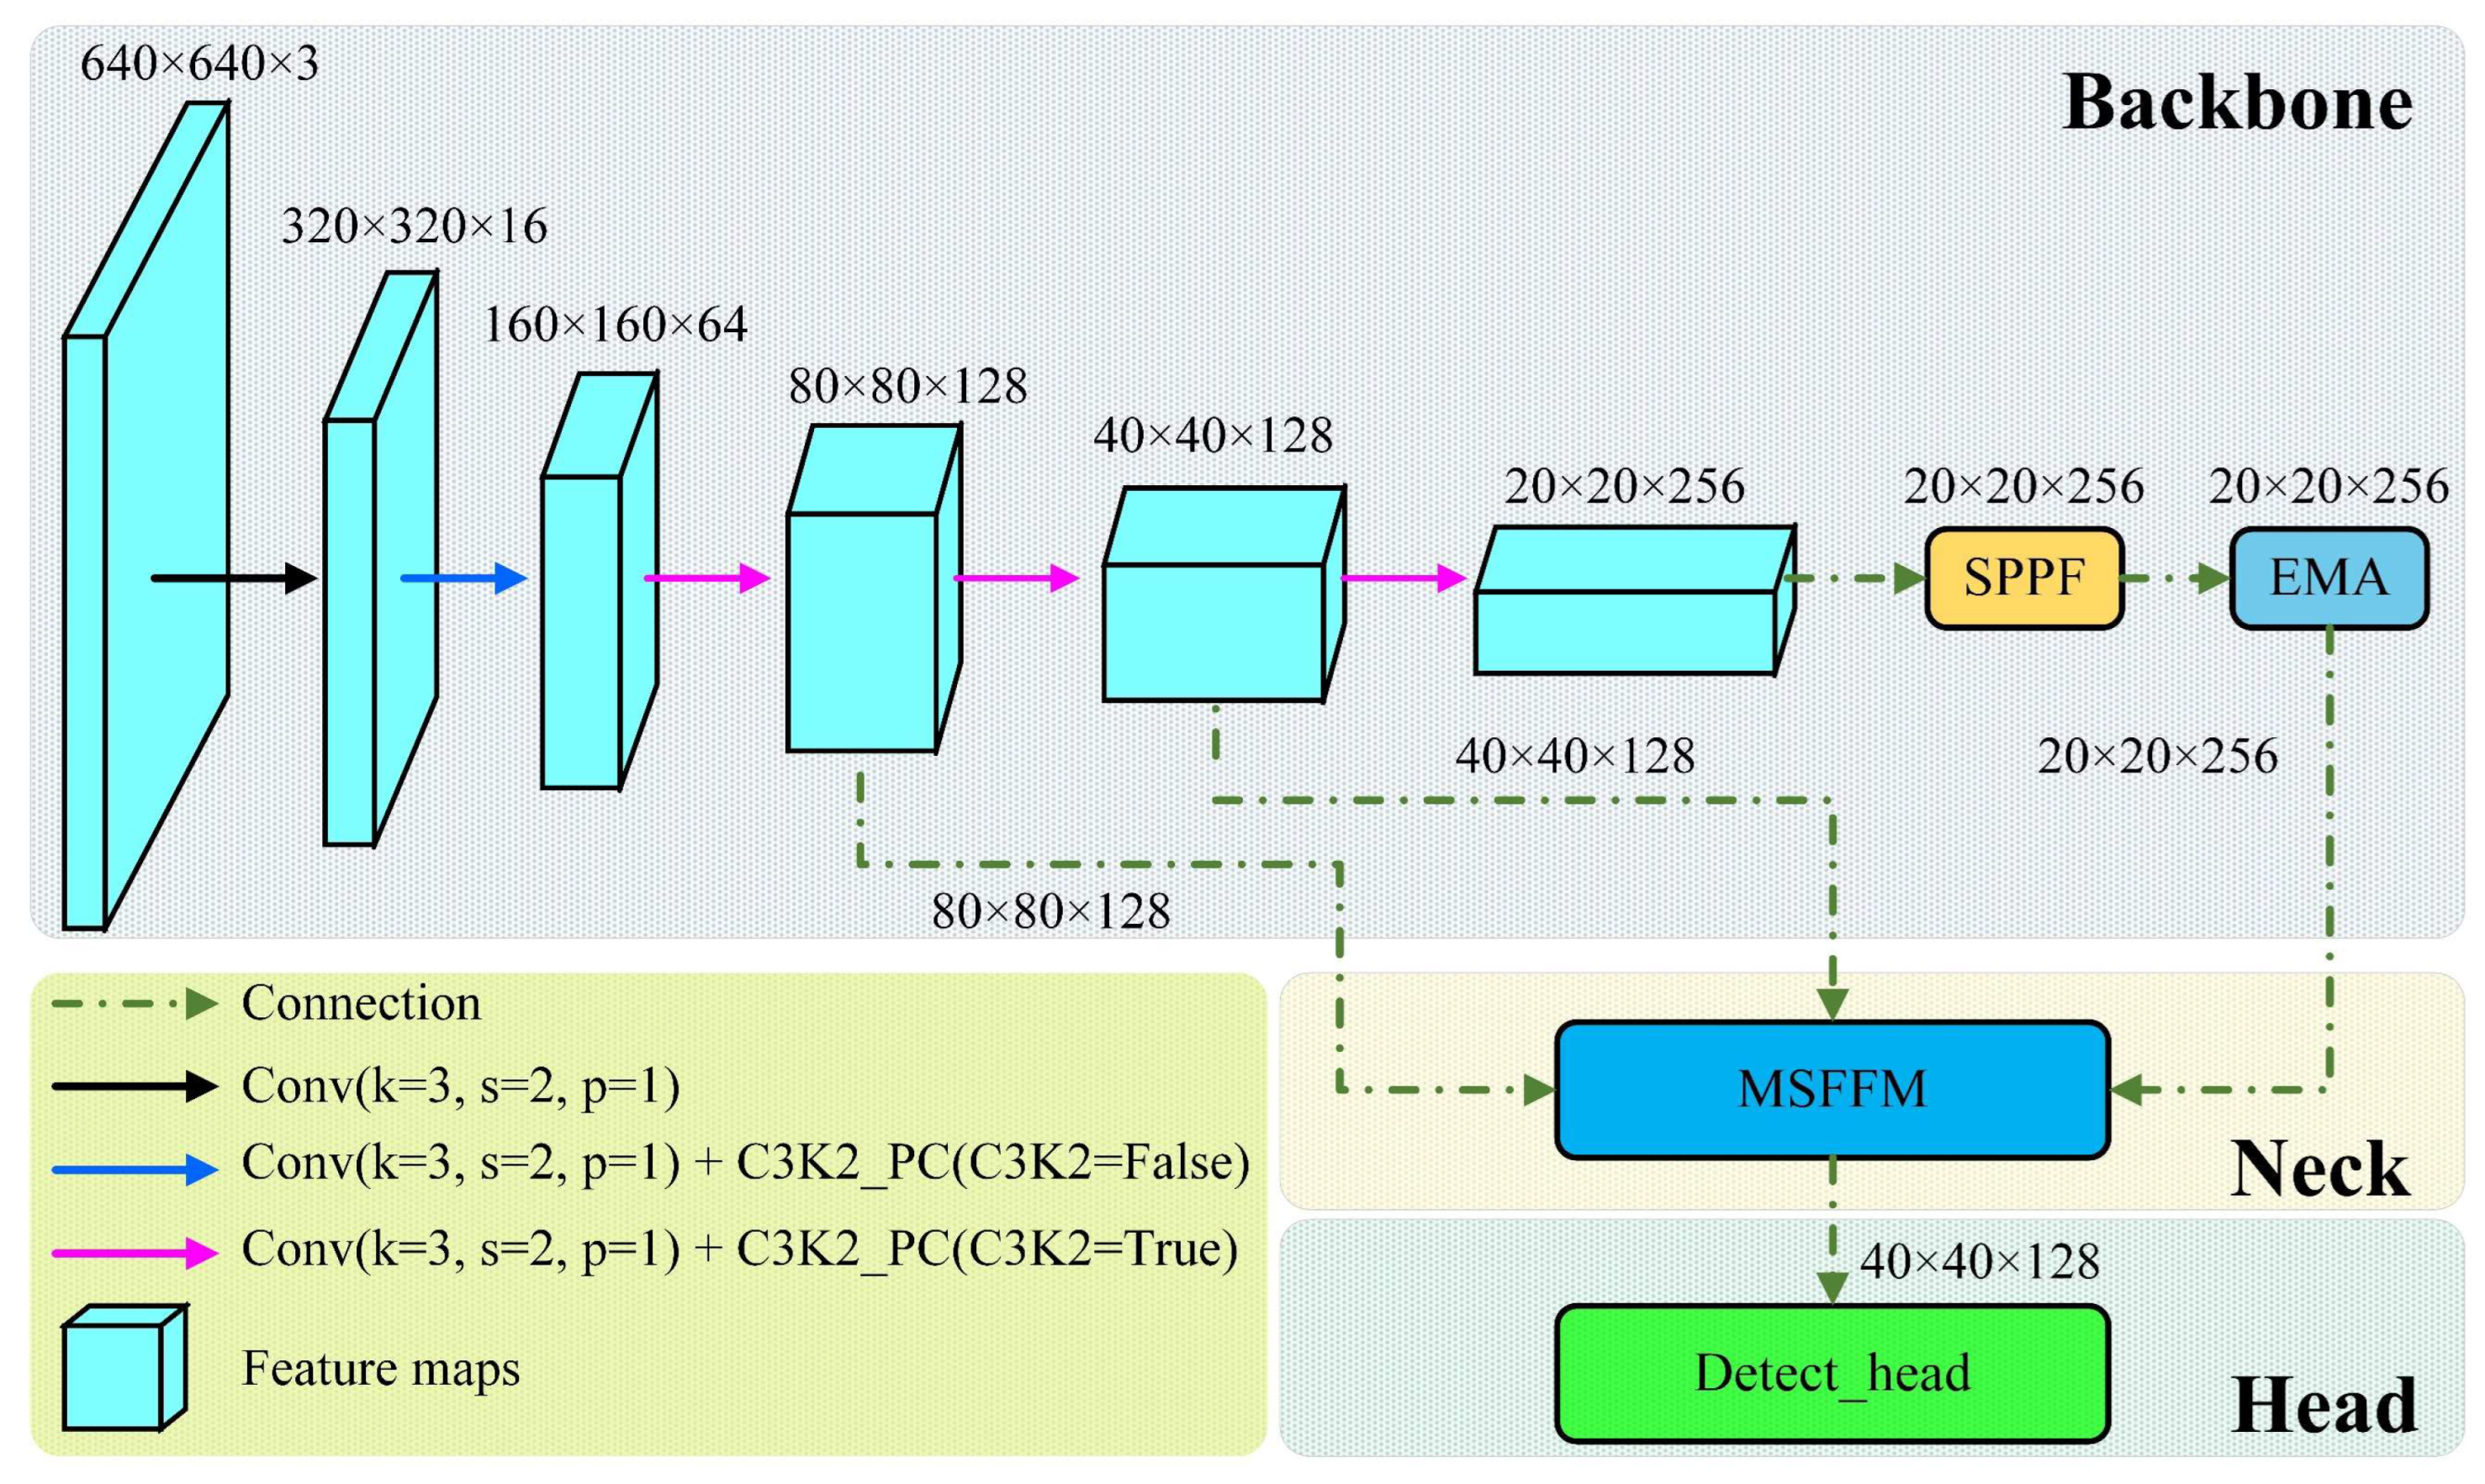
YOLOv11n was primarily designed for general object detection tasks. The model parameters and computational complexity of its three components are shown in Figure 5. As shown in Figure 4 and Figure 5, the majority of YOLOv11n’s computational complexity and parameters are concentrated in the Backbone module, and the detection head utilizes three identical detection modules to detect objects of varying scales. Compared with general target detection tasks, the target box size scale in corn seed kernel detection tasks varies less. Although directly applying the general target detection network model to corn seed kernel detection can also achieve good detection performance and efficiency, its complex network structure added a large number of redundant features. Obtaining these redundant features consumes a lot of computing resources and reduces the model detection efficiency. In order to ensure the lightweight and real-time detection performance of the model and improve the model’s feature extraction ability for small targets, a lightweight object detection algorithm for corn kernel regions of interest based on YOLOv11n was proposed. As shown in Figure 6, this study proposed LWCD-YOLO by optimizing Backbone, Neck, and loss functions. In the backbone network, in order to reduce the extraction of redundant features, a lightweight backbone network based on PConv [23] and EMA [24] was proposed, thereby reducing redundant features and reducing model complexity. In the feature fusion module, in order to enhance the fusion of features of different scales and levels, MSFFM was designed to achieve deep fusion of features of different scales, reducing model complexity and computational complexity, and correspondingly reducing the computational complexity and complexity of the detection head. Finally, the WIoU loss function, which is more suitable for small object detection, was selected for model optimization, thereby improving the model’s perception of difficult targets.

2.2.2. Lightweight Backbone Feature Extraction Network

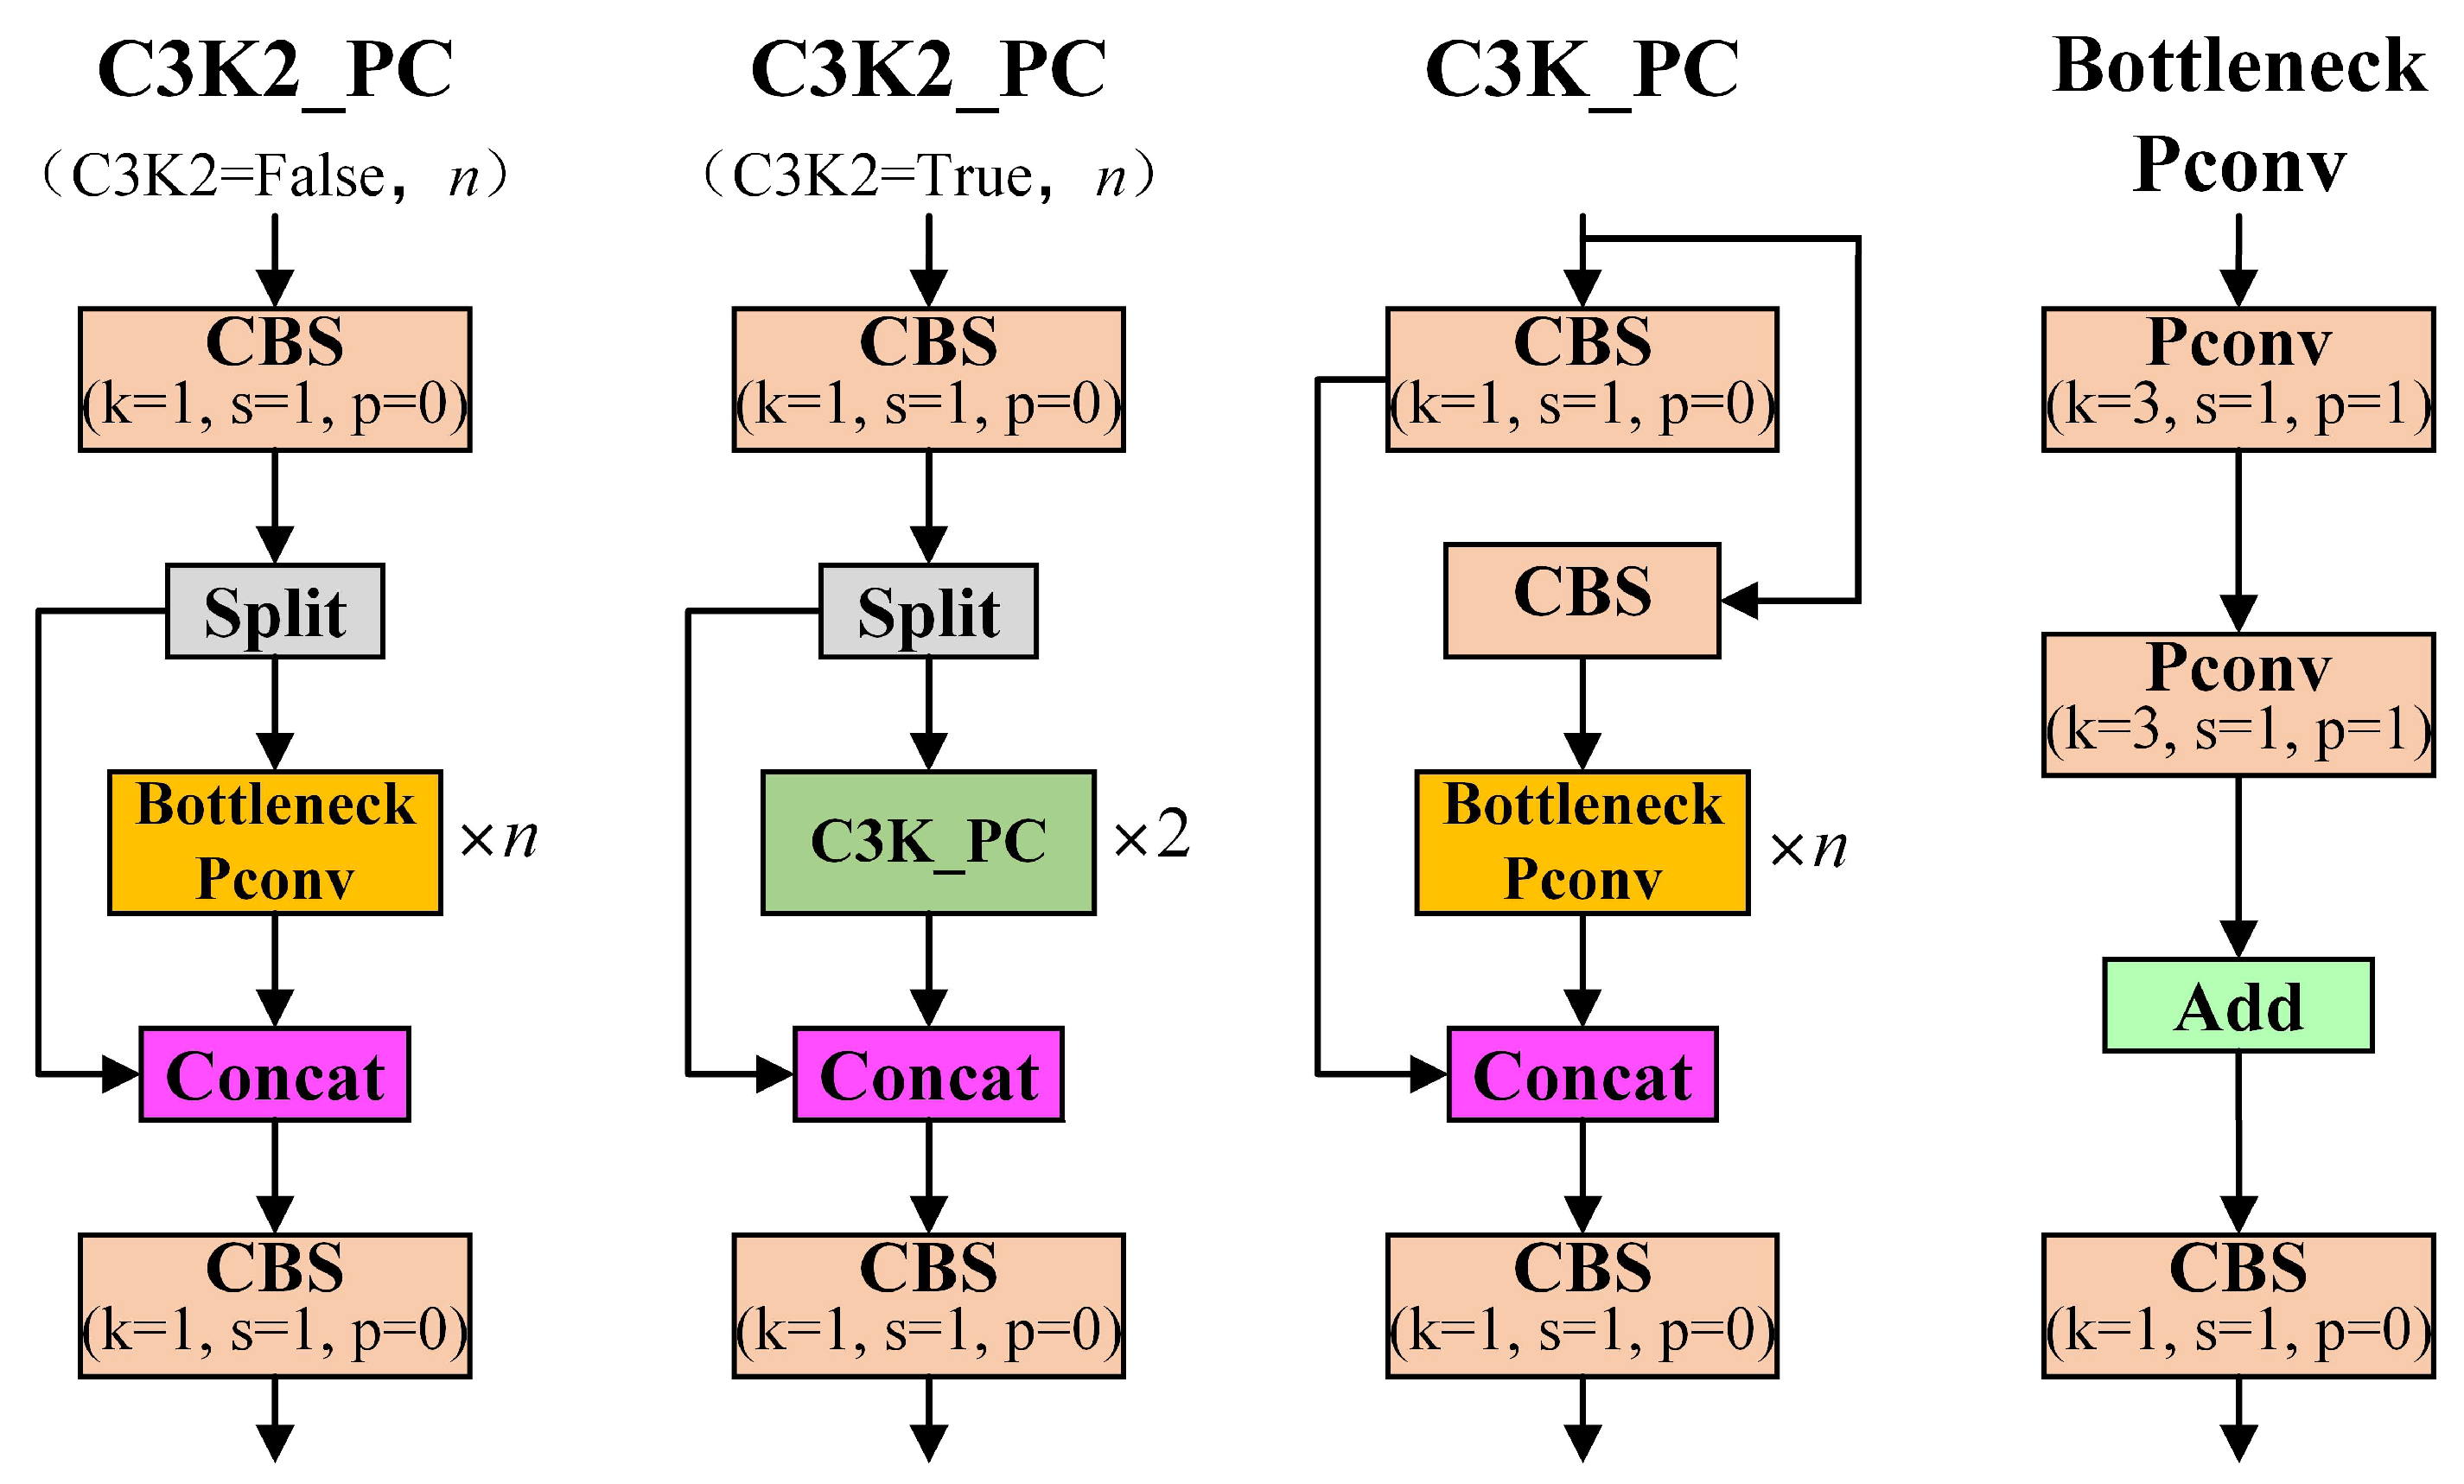
In the YOLOv11n backbone network, the C3K2 module is its smallest feature extraction unit, which is composed of residual units connected in series with multiplen 3 × 3 standard convolutions. The series connection of multiple 3 × 3 standard convolutions can, to a certain extent, avoid the problem of large model parameters caused by the use of large convolution kernels, and can also extract rich features. However, there is a large amount of similar or repeated information between different channels of the feature map. The series connection module of multiple standard convolutions, while extracting a large number of redundant features, also brings about an increase in model complexity. To reduce model complexity and mitigate the impact of redundant features on model performance, a PConv-based C3K2_PC module is proposed to replace C3K2 and thus reduce model complexity. The structure of C3K2_PC is shown in Figure 7, where n is 1. C3K2_PC reduces model complexity by replacing the standard convolutions in C3K2.
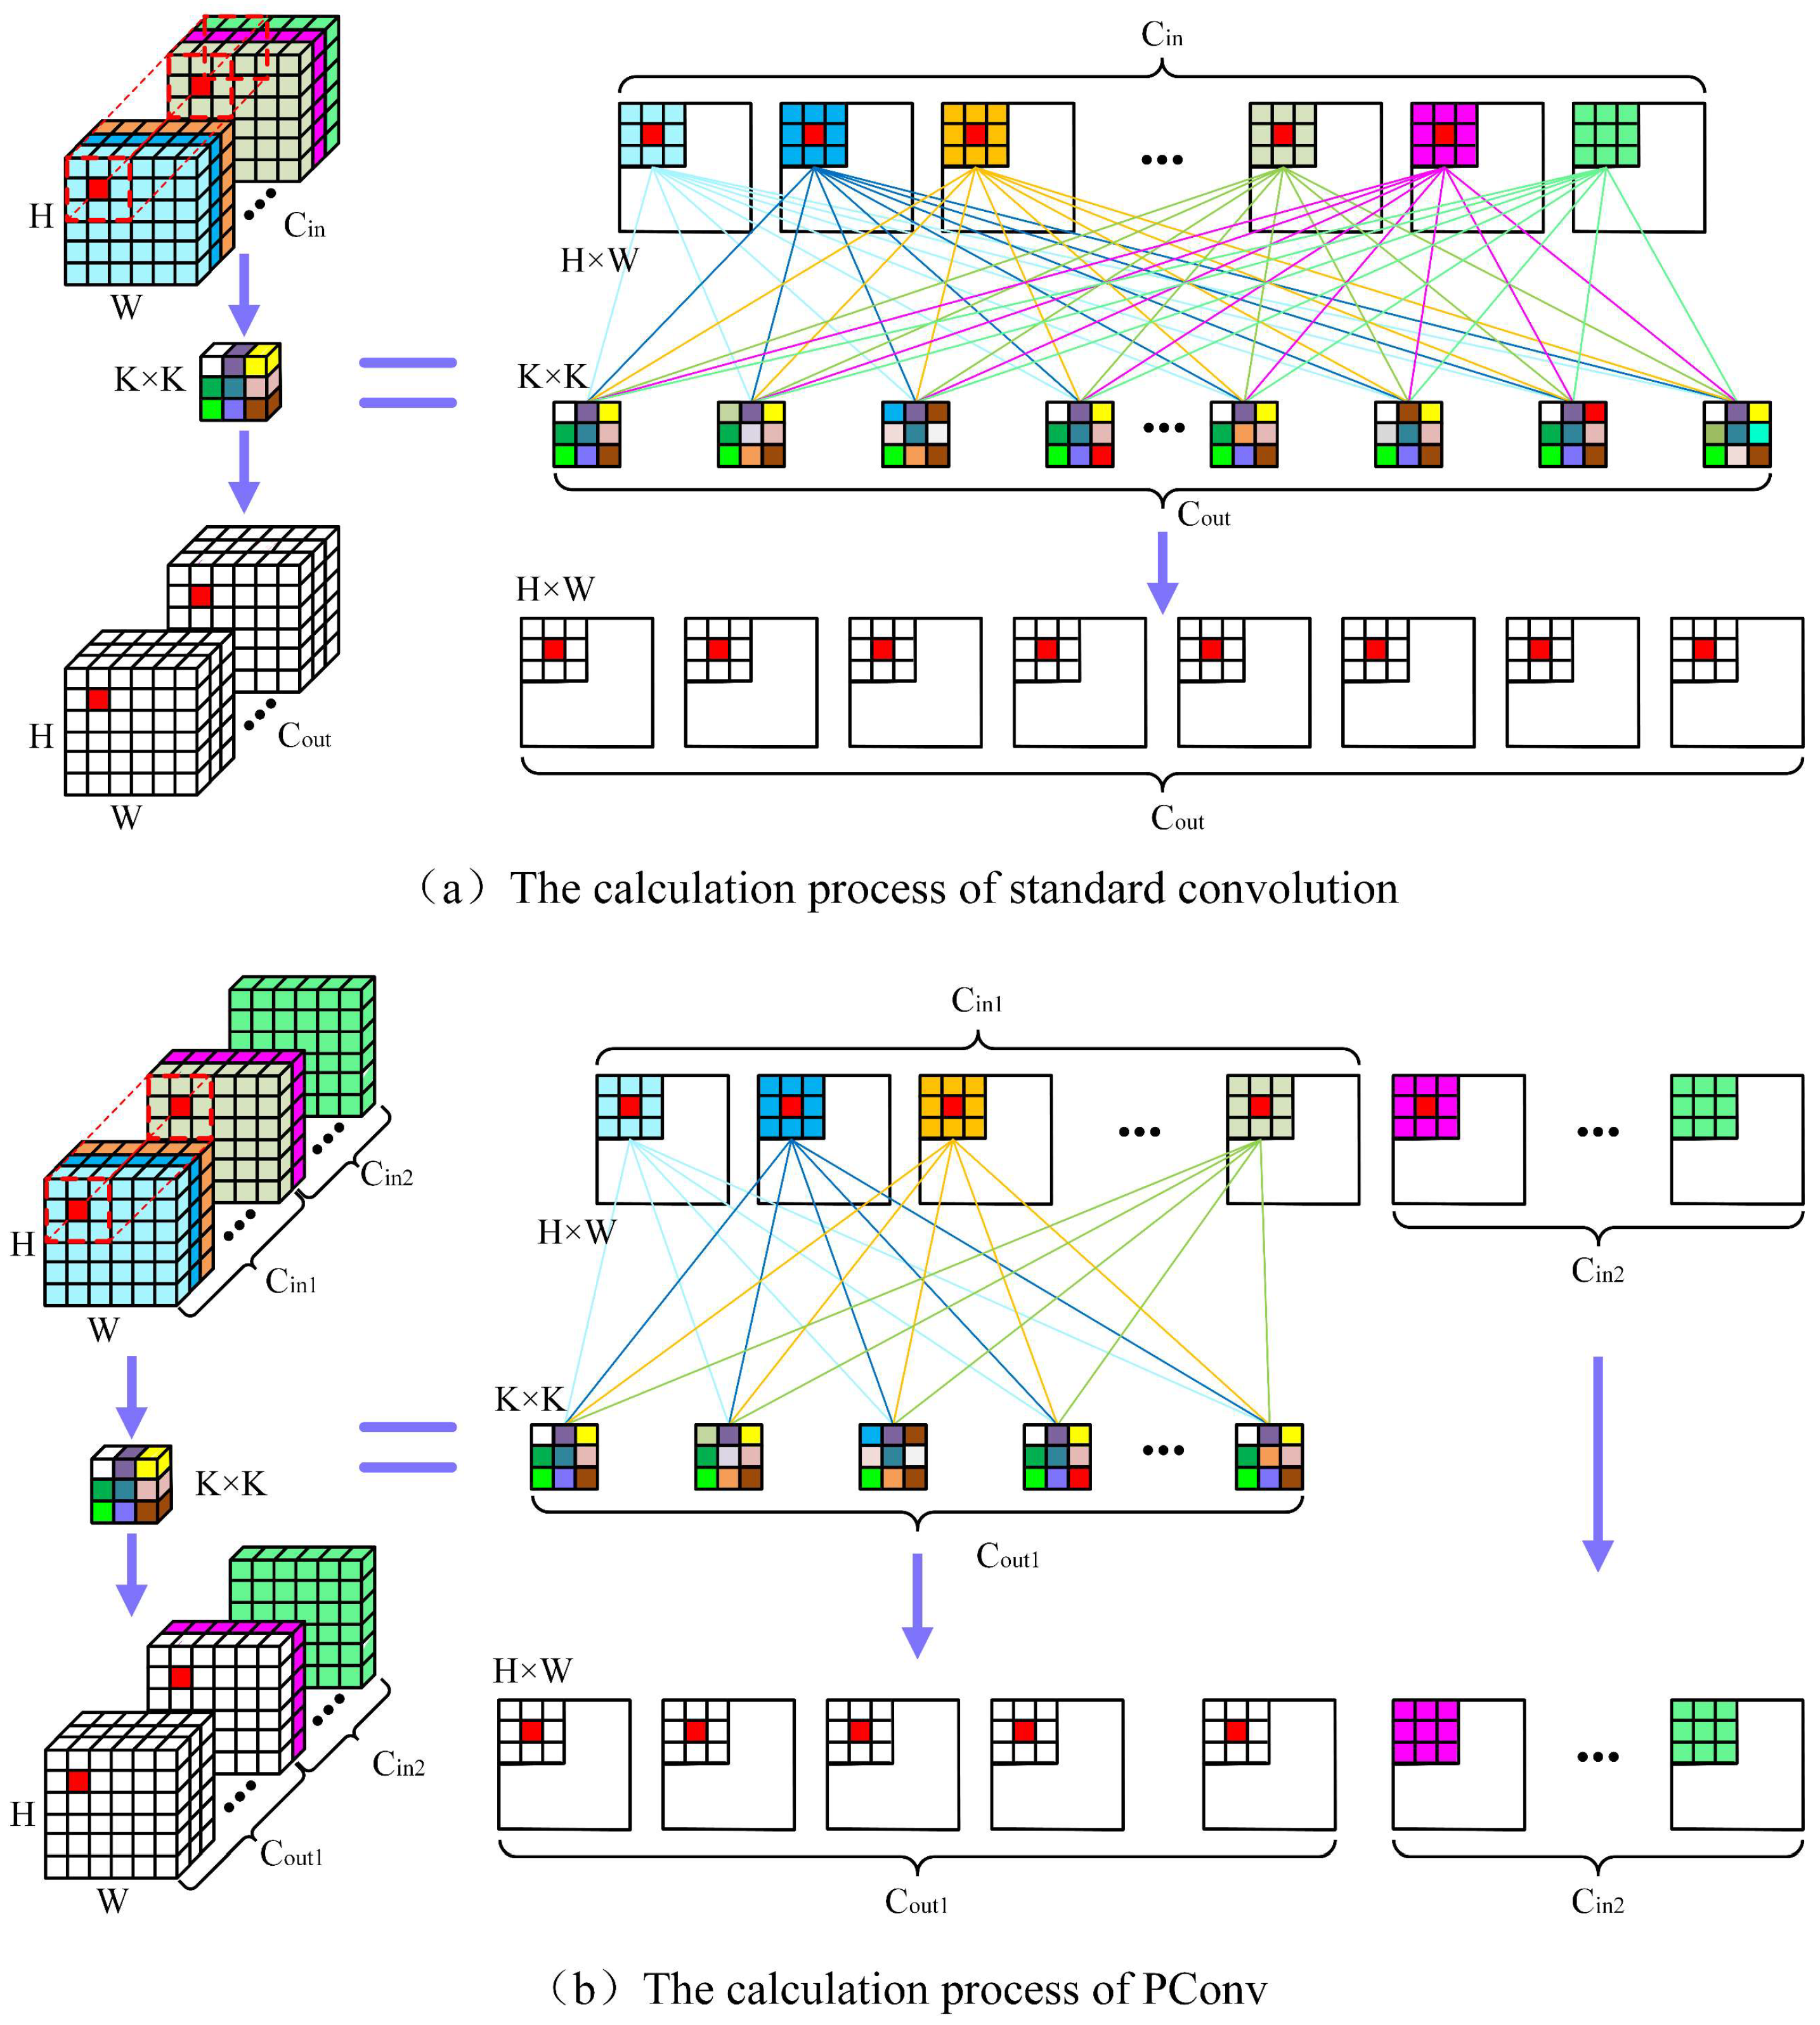
PConv is a lightweight convolution. Compared with traditional convolution, its calculation process is shown in Figure 8b. The standard convolution calculation process is shown in Figure 8a. The information at a certain position on the output feature map is obtained by convolving all channels of the corresponding position in the input feature map and then adding them together. As shown in Figure 8b, PConv uses a lightweight convolution operation, which only performs convolution operations on some channels of the input feature map, while the feature maps on the remaining channels remain unchanged, and then concatenates them in the channel dimension to obtain the final output feature map.
The computational complexity and parameter count formulas for standard convolutions and PConv are as follows:
F S C = C i n × W × H × C o u t × k × k
P S C = C i n × C o u t × k × k
F p c = C i n 1 × W × H × k × k × C o u t 1
P p c = C i n 1 × k × k × C o u t 1
where FSC and PSC represent the computational complexity and parameter size of standard convolution, FPC and PPC represent the computational complexity and parameter size of PConv, W, H and Cin represent the width, height, and number of input channels of the input feature map, Cout represents the number of channels of the output feature map after the standard convolution operation, Cin1 represents the number of channels of the input feature map before the PConv operation, Cin1 ∈ [1, Cin], Cout1 is the number of channels of the output feature map after the PConv operation, Cout1 ∈ [1, Cout]. The ratio of the parameter size and computational complexity of standard convolution to PConv is:
r F = F p c F S C = C i n 1 × W × H × k × k × C o u t 1 C i n × W × H × C o u t × k × k = C i n 1 × C o u t 1 C i n × C o u t
r p = P p c P S C = C i n 1 × k × k × C o u t 1 C i n × C o u t × k × k = C i n 1 × C o u t 1 C i n × C o u t
where r F is the ratio of the amount of calculation, r p is the ratio of the amount of parameters, in the C3K2_PC module, Cin1 = 1/4 Cin, Cout1 = 1/4 Cout, r F = r p = 1/16.
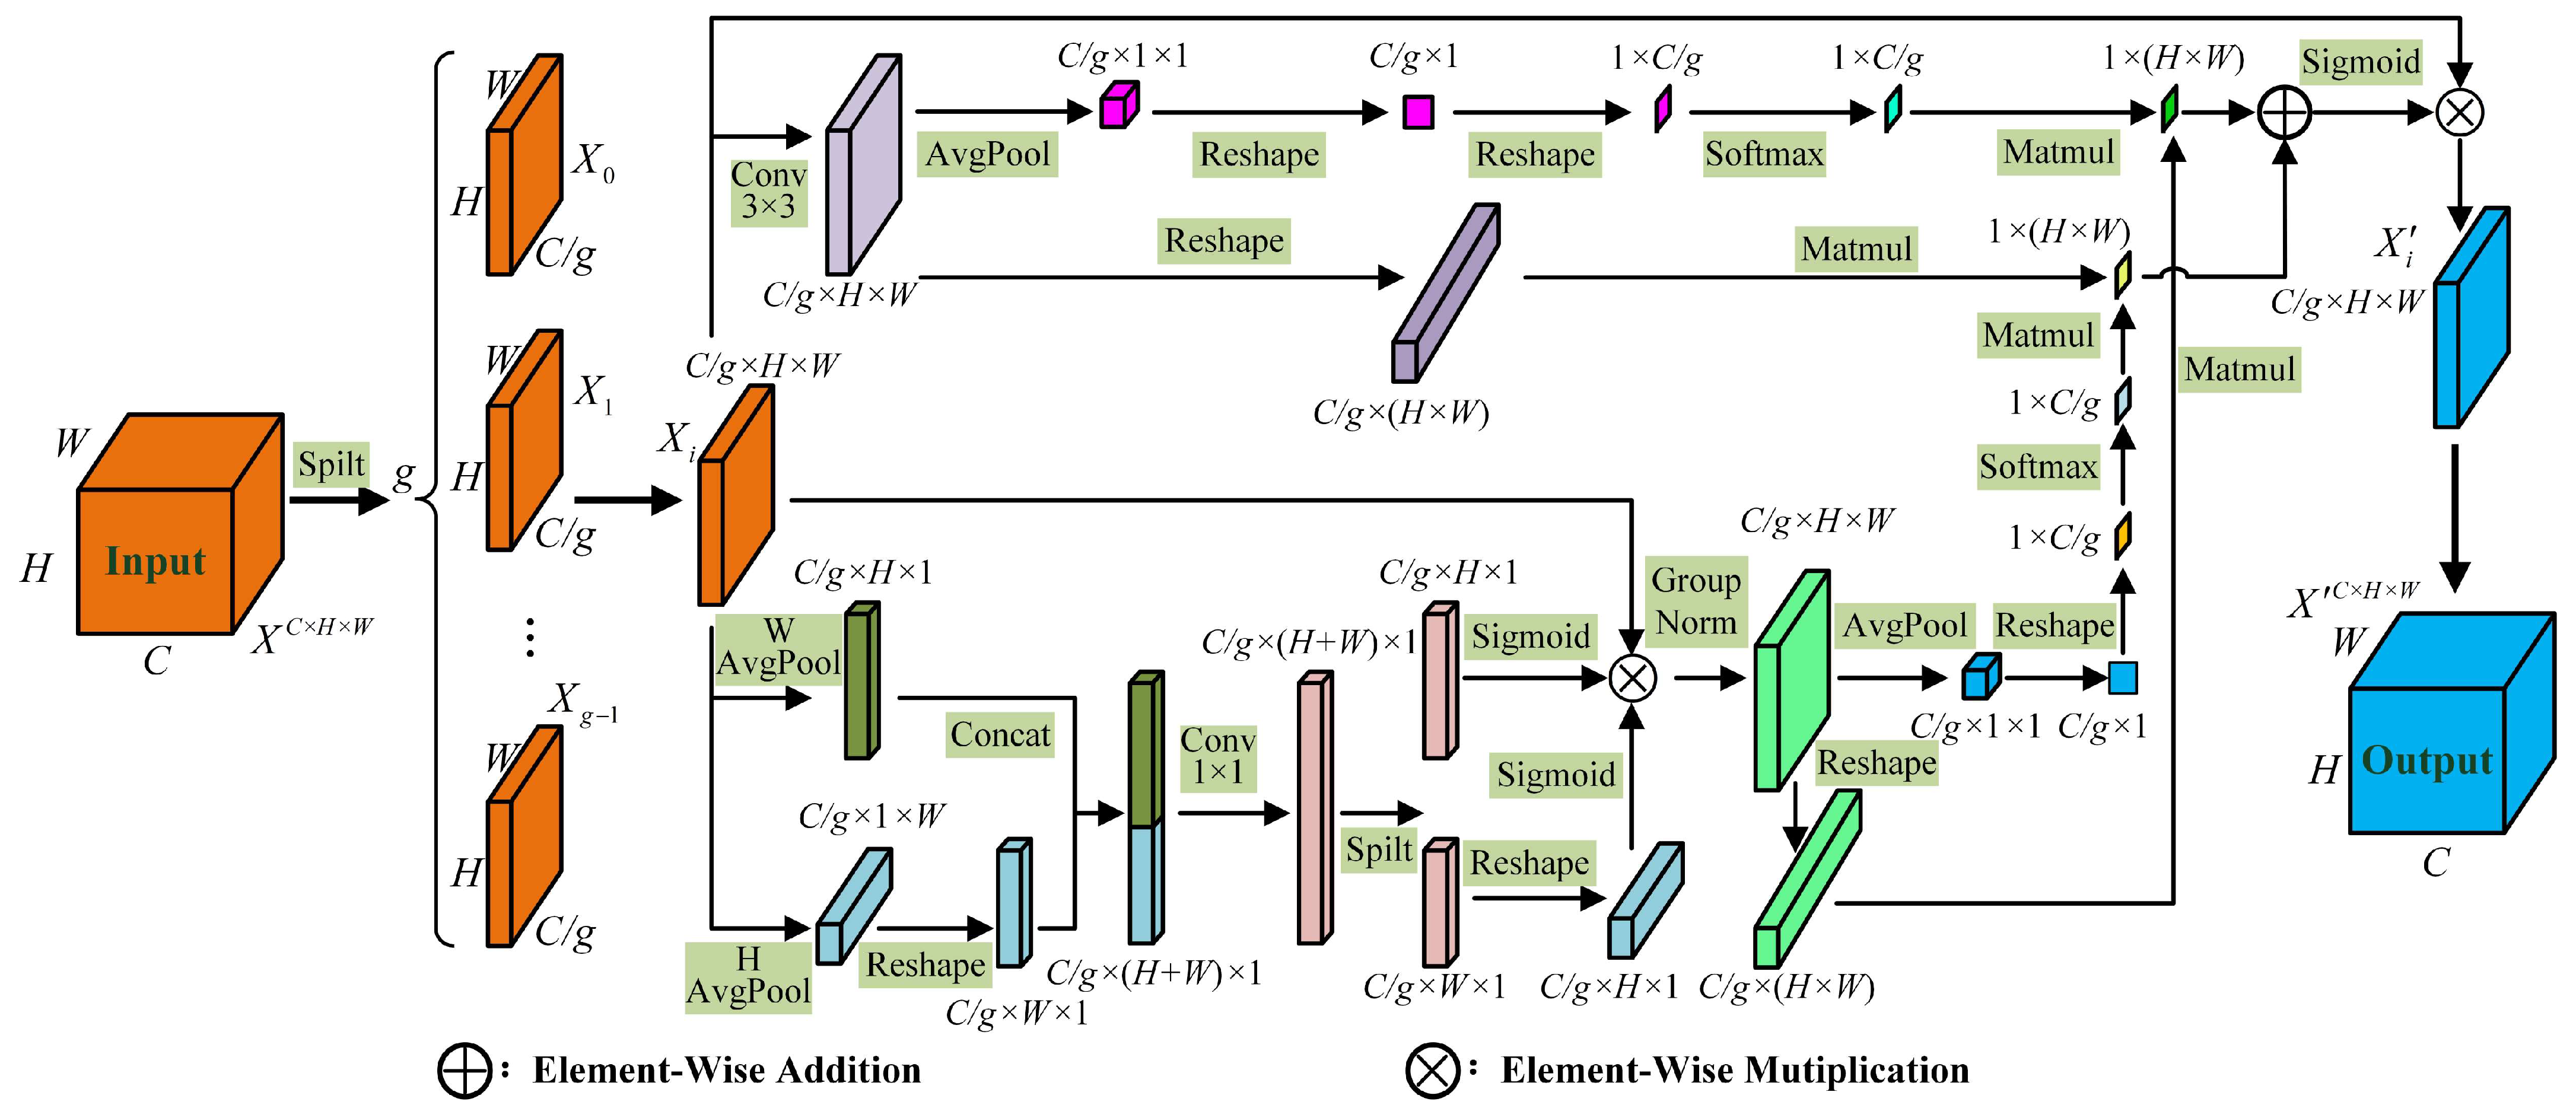
In the original YOLOV11n, the C2PSA self-attention module was employed. This module combines PSA (Pointwise Spatial Attention) to extract multi-scale features. Corn kernel detection falls under small object detection tasks. The input feature map size for C2PSA is 20 × 20, resulting in more semantic features but relatively fewer spatial features. On the other hand, as the number of network layers increases, higher-level networks predominantly capture semantic features. To enhance deep networks’ ability to extract both channel and spatial information simultaneously, the original C2PSA module is replaced with EMA. This approach emphasizes channel semantic information and spatial information while improving the model’s ability to model long-range dependencies and reducing model complexity. The structure of the EMA is shown in Figure 9.
As shown in Figure 9, the EMA attention module achieves more efficient feature representation by integrating channel and spatial information, adopting a multi-scale parallel subnetwork architecture, and optimizing the coordinate attention mechanism. First, the EMA combines channel and spatial information to preserve channel-level information while reducing computational burden. This integration enhances information exchange between channels without diminishing the channel dimension, thereby improving the model’s representational capacity. Second, the EMA employs a parallel subnetwork architecture with one 1 × 1 convolution and one 3 × 3 convolution. This effectively captures cross-dimensional interactions and establishes dependencies between different dimensions, thereby enhancing feature representation capabilities. Third, the EMA embeds positional information into the channel attention map, achieving fusion of cross-channel and spatial information. Finally, the parallel subnetwork design of the EMA facilitates feature aggregation and interaction, thereby improving the model’s ability to model long-range dependencies. In this paper, g was set to 8. The original EMA code can be found in Reference [24].
Based on C3K2 and EMA, the structural parameters of the lightweight backbone network are shown in Table 2. By replacing the original feature extraction network with the lightweight backbone network architecture, we reduce the number of model parameters while improving both inference efficiency and performance.

2.2.3. MSFFM Module

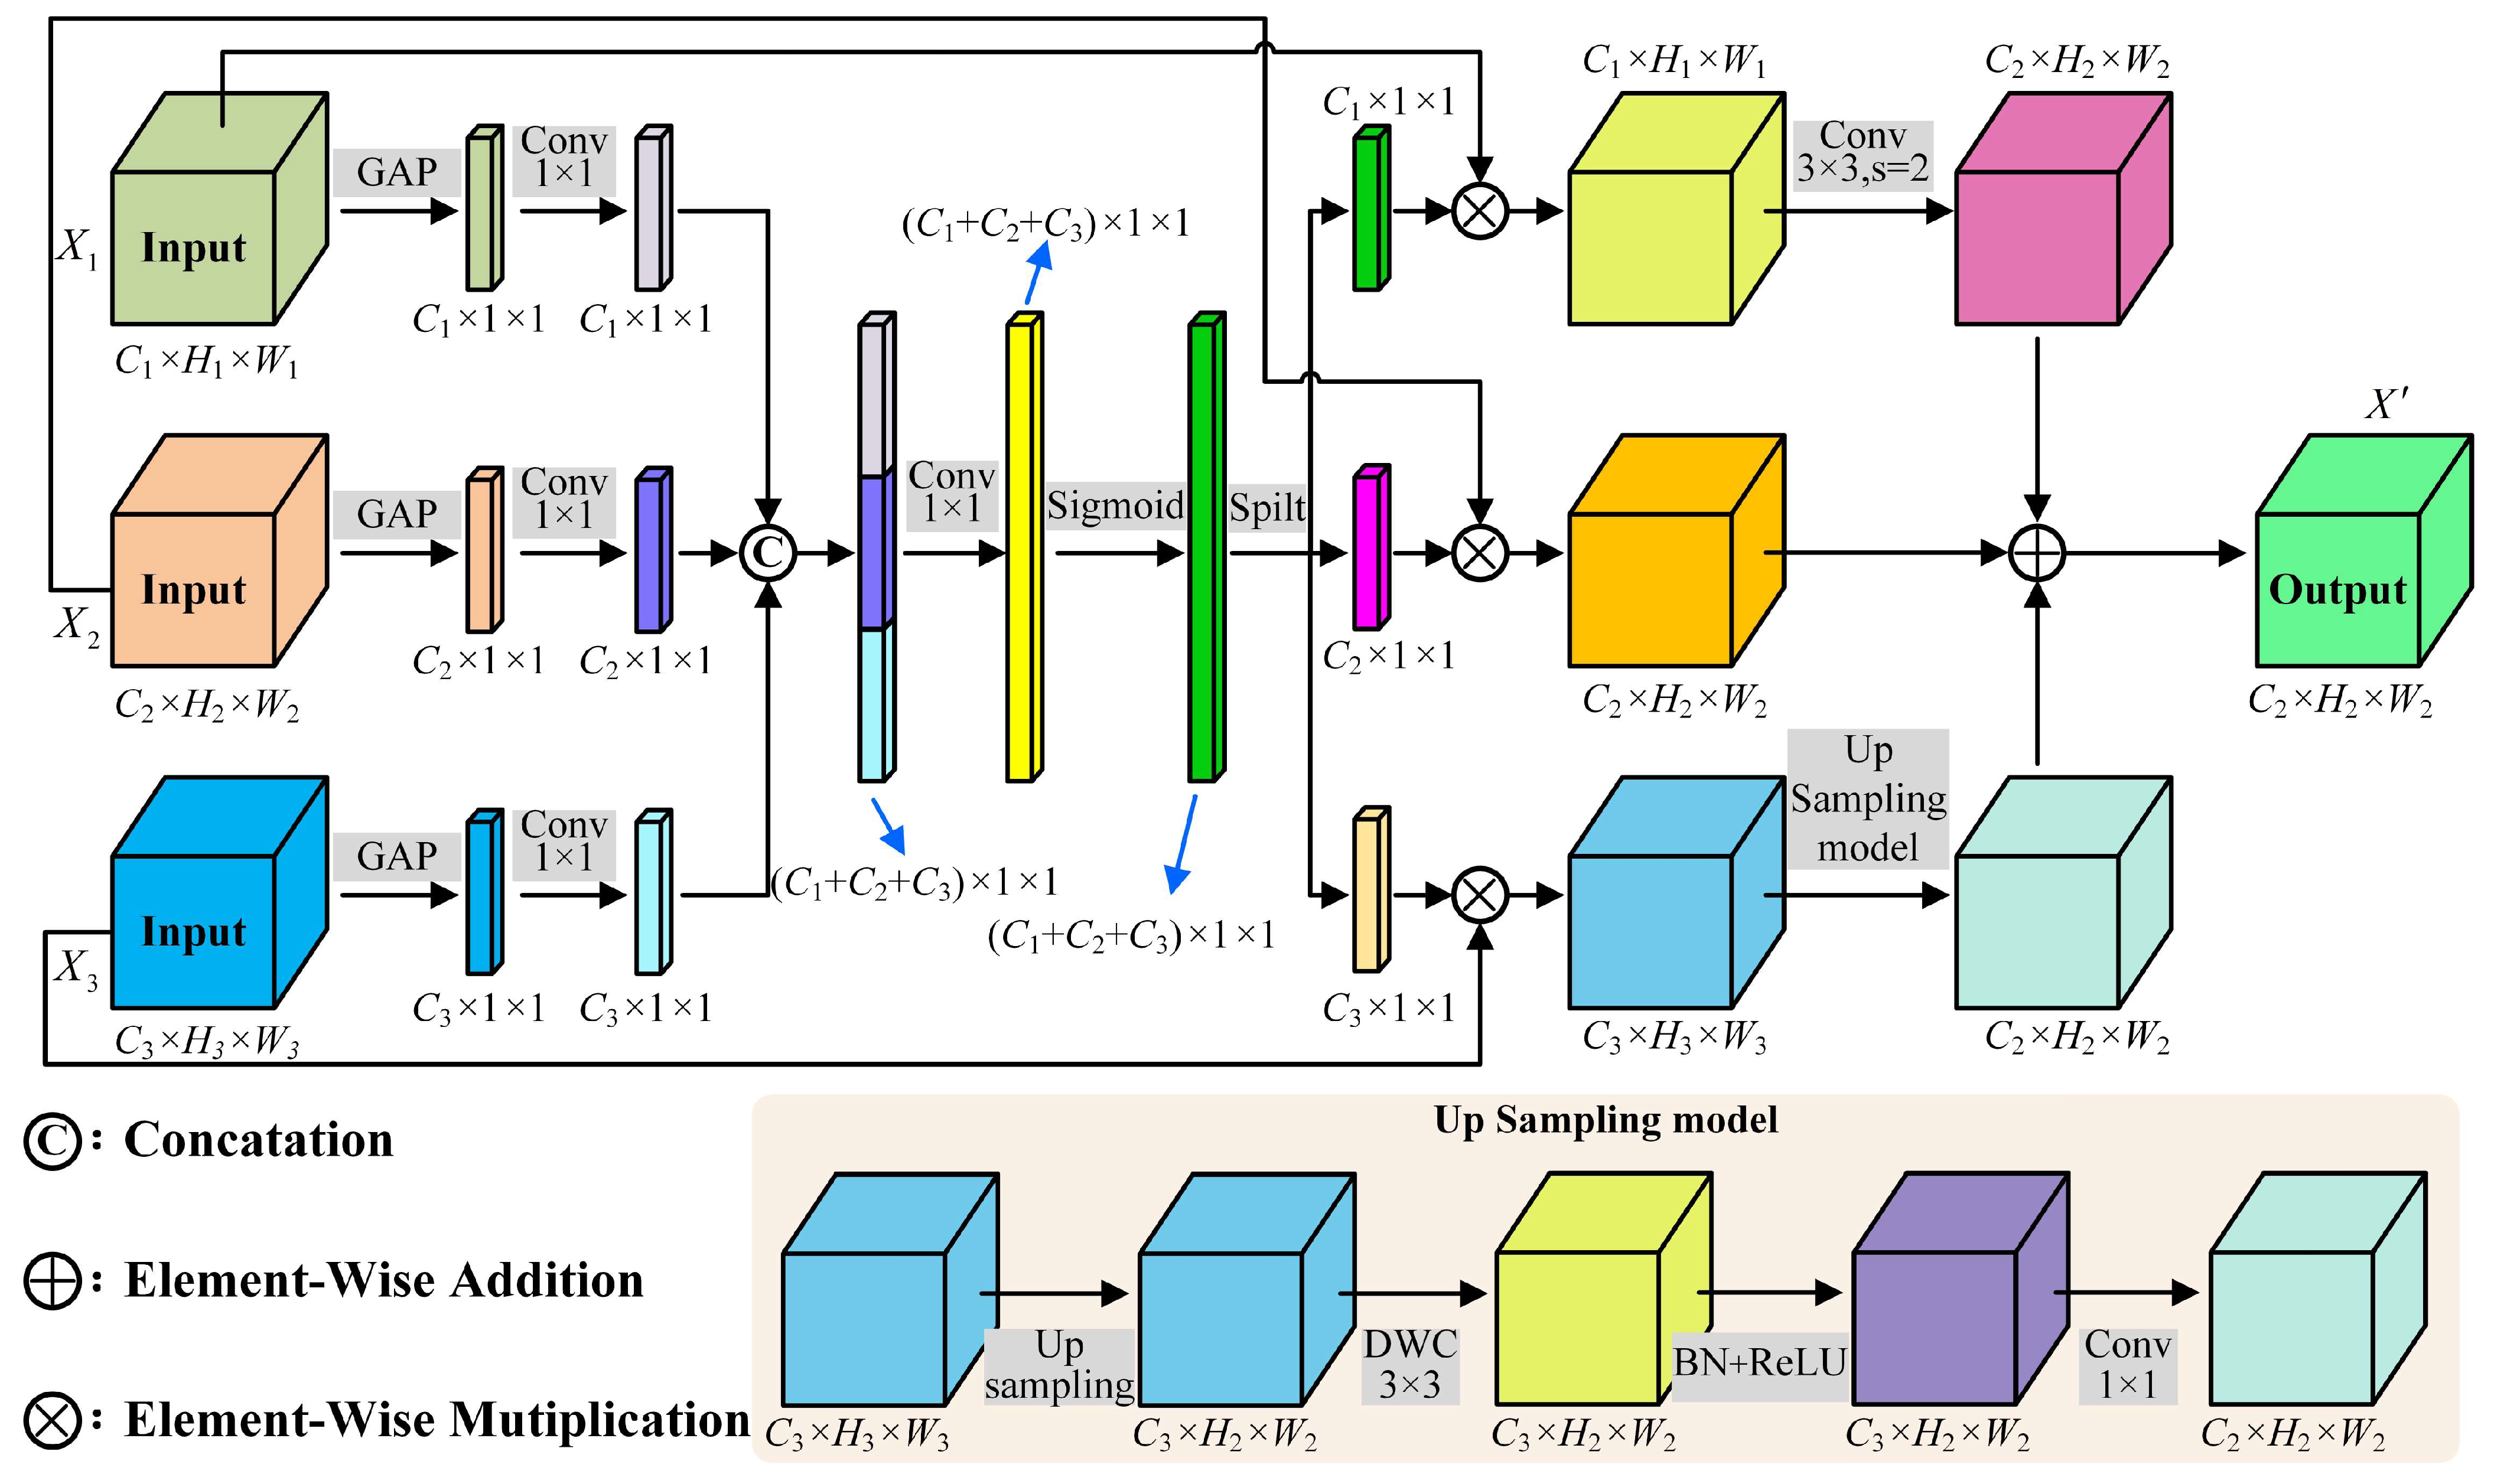
In YOLOv11, the Neck network consists of the FPN and PAN, capable of fusing features across different levels to produce feature maps of varying sizes—20 × 20, 40 × 40, and 80 × 80—supplying a composite set of features for the subsequent detection head to identify target bounding box categories and position information. While the Neck network can marginally enhance the input detection head’s feature expression capacity, its top-down architecture utilizes an indirect connection approach with the main feature extraction network, which can lead to redundancy in features to a certain degree. Additionally, the way it fuses features involves treating all input data equally, using direct channel Concatenation without considering the alignment of features at different levels, thus disregarding the spatial characteristics of shallow features and the semantic characteristics of deep features. On the other hand, three feature maps of different hierarchical sizes are input to the detection head to achieve detection of targets of different sizes. A 20 × 20 size feature map can theoretically detect a minimum target size ratio of 1/20 of the original image, a 40 × 40 size feature map can theoretically detect a minimum target size ratio of 1/40 of the original image, and an 80 × 80 size feature map can theoretically detect a minimum target size ratio of 1/80 of the original image. This study focuses on detecting small and medium-sized objects. The dataset does not contain single large objects, and using three detection heads presents the problem of head redundancy. Based on the above analysis and inspired by papers [25,26], this paper designs the MSFFM, shown in Figure 10, to replace the neck network in the original network. The MSFFM not only strengthens feature fusion but also reduces model complexity, enhancing detection performance. Unlike SENet’s action on individual feature maps, the MSFFM takes three-level feature maps from the backbone network as inputs and dynamically interacts with all channel features across the three levels. It learns the interrelation information between the features, there by acquiring weight information for different channels of the features to be fused. It aligns semantic information across different layers of feature maps, optimizing the features to be fused. Eventually, the aligned feature maps from the three levels are summed up to yield the final fused feature, with a feature map size of 40 × 40. Finally, the fused single feature is fed into the detection head for category classification and extraction of position information.

2.2.4. Loss Function Optimization

In object detection, the overall loss value L is mainly composed of three parts: the regression box localization error loss Lbls, the confidence loss Ldfl, and the object category loss Lcls, with the following calculation formula:
L = λ 1 L b l s + λ 2 L s f l + λ 3 L c l s
where λ 1 , λ 2 and λ 3 are the hyperparameters for the corresponding loss functions, with default values of 7.5, 1.5, and 0.5.
In YOLOv11n, the original regression box localization loss Lbls utilizes the CIoU metric [27], which primarily focuses on factors such as the overlap, concavity, and distance between the centroids of the bounding boxes. However, it does not account for the balance between easy and difficult samples. At the same time, it lacks sufficient adaptability to the background environment around the target, especially for adhesion and occlusion, which leads to reduced detection performance. The calculation formula of CIoU is as follows:
C I o U = I o U ρ 2 b , b g t w c + ( h c ) + α v
α = v 1 I o U + v
v = 4 π a r c t a n w g t h g t a r c t a n w h
where w and h represent the width and height of the predicted box, w g t and h g t represent the width and height of the real box, b and b g t represent the center points of the boundaries of the predicted box and the real box, respectively, ρ 2 b , b g t represents the Euclidean distance between b and b g t , w c and h c are the width and height of the minimum bounding rectangle of the predicted box and the real box, and IoU is the intersection-over-union ratio.
To improve the model’s detection performance, the WIoU loss function is used to optimize the model training. Compared to CIoU, the WIoU loss function introduces a weight mechanism that can adjust the loss calculation process based on the weight of each pixel, thereby more accurately identifying the seed grain area and effectively improving the model’s detection accuracy. At the same time, a dynamic monotonic focusing mechanism is used to evaluate the quality of the anchor box, combined with gradient gain to reduce the impact of harmful gradients on network training. The calculation formula for WIoU is as follows:
L W I o U = R W I o U L I o U
R W I o U = e x p x x g t 2 + y y g t 2 w c 2 + h c 2
L I o U = β δ α β δ 1 I o U
β = L I o U L ¯ I o U
where β is the outlier score; smaller values indicate higher anchor box quality. α and δ are hyperparameters used to adjust the weights of different loss terms. The superscript * indicates that the term is not involved in backpropagation, effectively avoiding the generation of harmful gradients. L ¯ I o U is a normalization factor, representing the sliding average of the increments.

2.2.5. Model Evaluation Metrics

The evaluation indicators used in this study include detection performance, model complexity, and detection efficiency. The detection performance indicators of the model include precision (P), recall (R), average precision (AP), mean average precision (mAP), and F1 (F1-Measure). Among them, mAP0.50 refers to the average precision when the IoU threshold is 0.50, mAP0.75 refers to the average precision when the IoU threshold is 0.75, while mAP0.50:0.95 indicates the mean average precision calculated over an IoU range from 0.50 to 0.95 with an increment of 0.05. The calculation method is shown in Formulas (15) to (19):
P = T P T P + F P × 100 %
R = T P T P + F N × 100 %
F 1 = 2 × P × R P + R
A P = 0 1 P r d r
m A P = 1 m 1 m A P
where TP represents the number of correctly detected object boxes, FN represents object boxes detected as other objects, FP represents other objects incorrectly identified as object boxes, P(r) represents the P-R curve, and m represents the number of categories. To ensure consistency in model performance comparisons, the optimal combination of P, R, mAP0.50, and mAP0.50:0.95, using weights of 0, 0, 0.1, and 0.9, is used as the test set result for the best trained model.
This article primarily considers three metrics when evaluating model complexity: model parameter count, floating-point operations (FLOPs), and model size. Model parameter count refers to the number of model parameters, while model size refers to the amount of space occupied by the model. The detection efficiency is the number of images detected per second, i.e., frames per second (FPS).

2.3. Experimental Environment and Parameters

The model training and testing were conducted on a 64-bit Ubuntu 22.04 operating system, utilizing two Intel 8488C CPU and 512 GB of memory. The network model used the PyTorch 2.3.1 framework, with the software platform being Visual Studio Code 1.90.1. The GPU used was an NVIDIA GeForce RTX 4090, featuring 16,384 CUDA cores and 24 GB of GDDR6, with a CUDA version of 12.1. The experiments were implemented in Python 3.8.19, leveraging its standard scientific computing libraries (e.g., NumPy, math, cv2) for data manipulation and analysis.
All experiments in this study were conducted under the same conditions, with YOLOv11n selected as the baseline model. The training images were resized to 640 × 640, and the model was optimized using the Stochastic Gradient Descent (SGD) algorithm. The momentum factor is set to 0.937, the initial learning rate is 0.02, and the final learning rate is 0.00001, and decay coefficient is 0.0005. The training was configured for 1000 epochs, with a batch size of 32 and 8 worker threads. Mosaic data augmentation was disabled to ensure environmental consistency, and pre-trained weights were not loaded. An early stopping strategy is used during training. If the model’s mAP0.50:0.90 on the test set does not significantly improve within 100 consecutive epochs, training is automatically stopped. This prevents overfitting of the training data and conserves computing resources. Other parameters retain their default values.

3. Results

3.1. LWCD-YOLO Test Results and Analysis

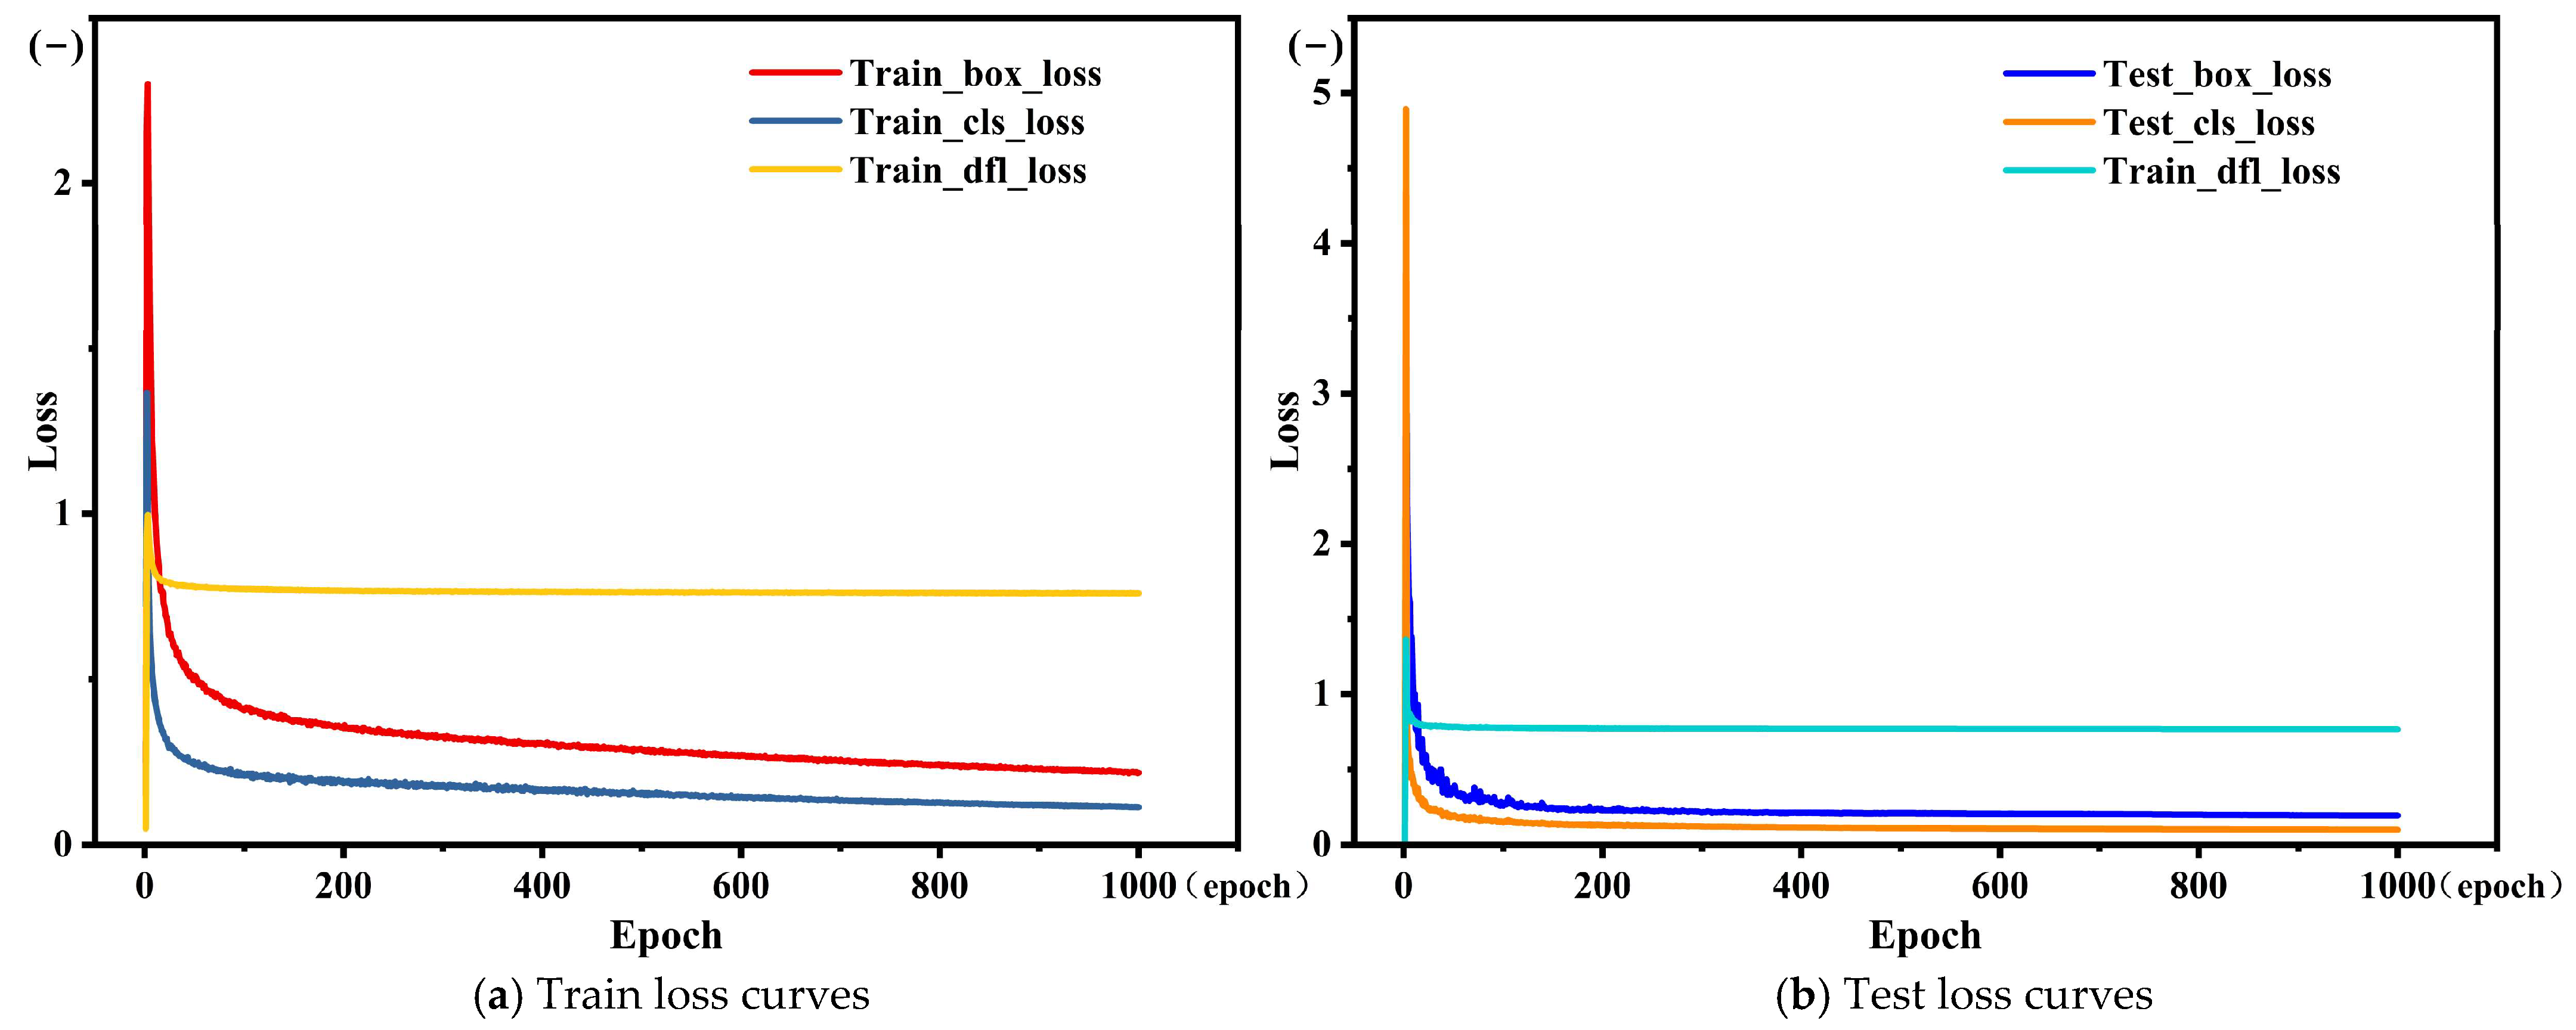
To validate the effectiveness of the proposed model, LWCD-YOLO was trained on the augmented training set and tested on the test set. During training process, the model’s detection performance was evaluated on the test set after each training epoch. The change in the loss function during training is shown in Figure 11. Here, Train_box_loss, Train_cls_loss, and Train_dfl_loss represent the change curves for the training data, whereas Test_box_loss, Test_cls_loss, and Test_dfl_loss correspond to those for the testing data.
As shown in Figure 11, there are three types of loss functions in the model training process. According to the change curve of the loss function during the training process, in the early stage of training, due to the use of the default initial learning of 0.1 for pre-training for 3 epochs and then training according to the self-set learning rate, the loss value in both the training set and the test set first decreased and then increased. However, as the number of model training epoch increased, the model gradually converged and tended to be stable. Within 200 epochs, the test set loss function showed large fluctuations, but as the number of training epoch increased, it gradually stabilized and remained basically unchanged. The loss function eventually stabilized, indicating that the model has been fully trained.
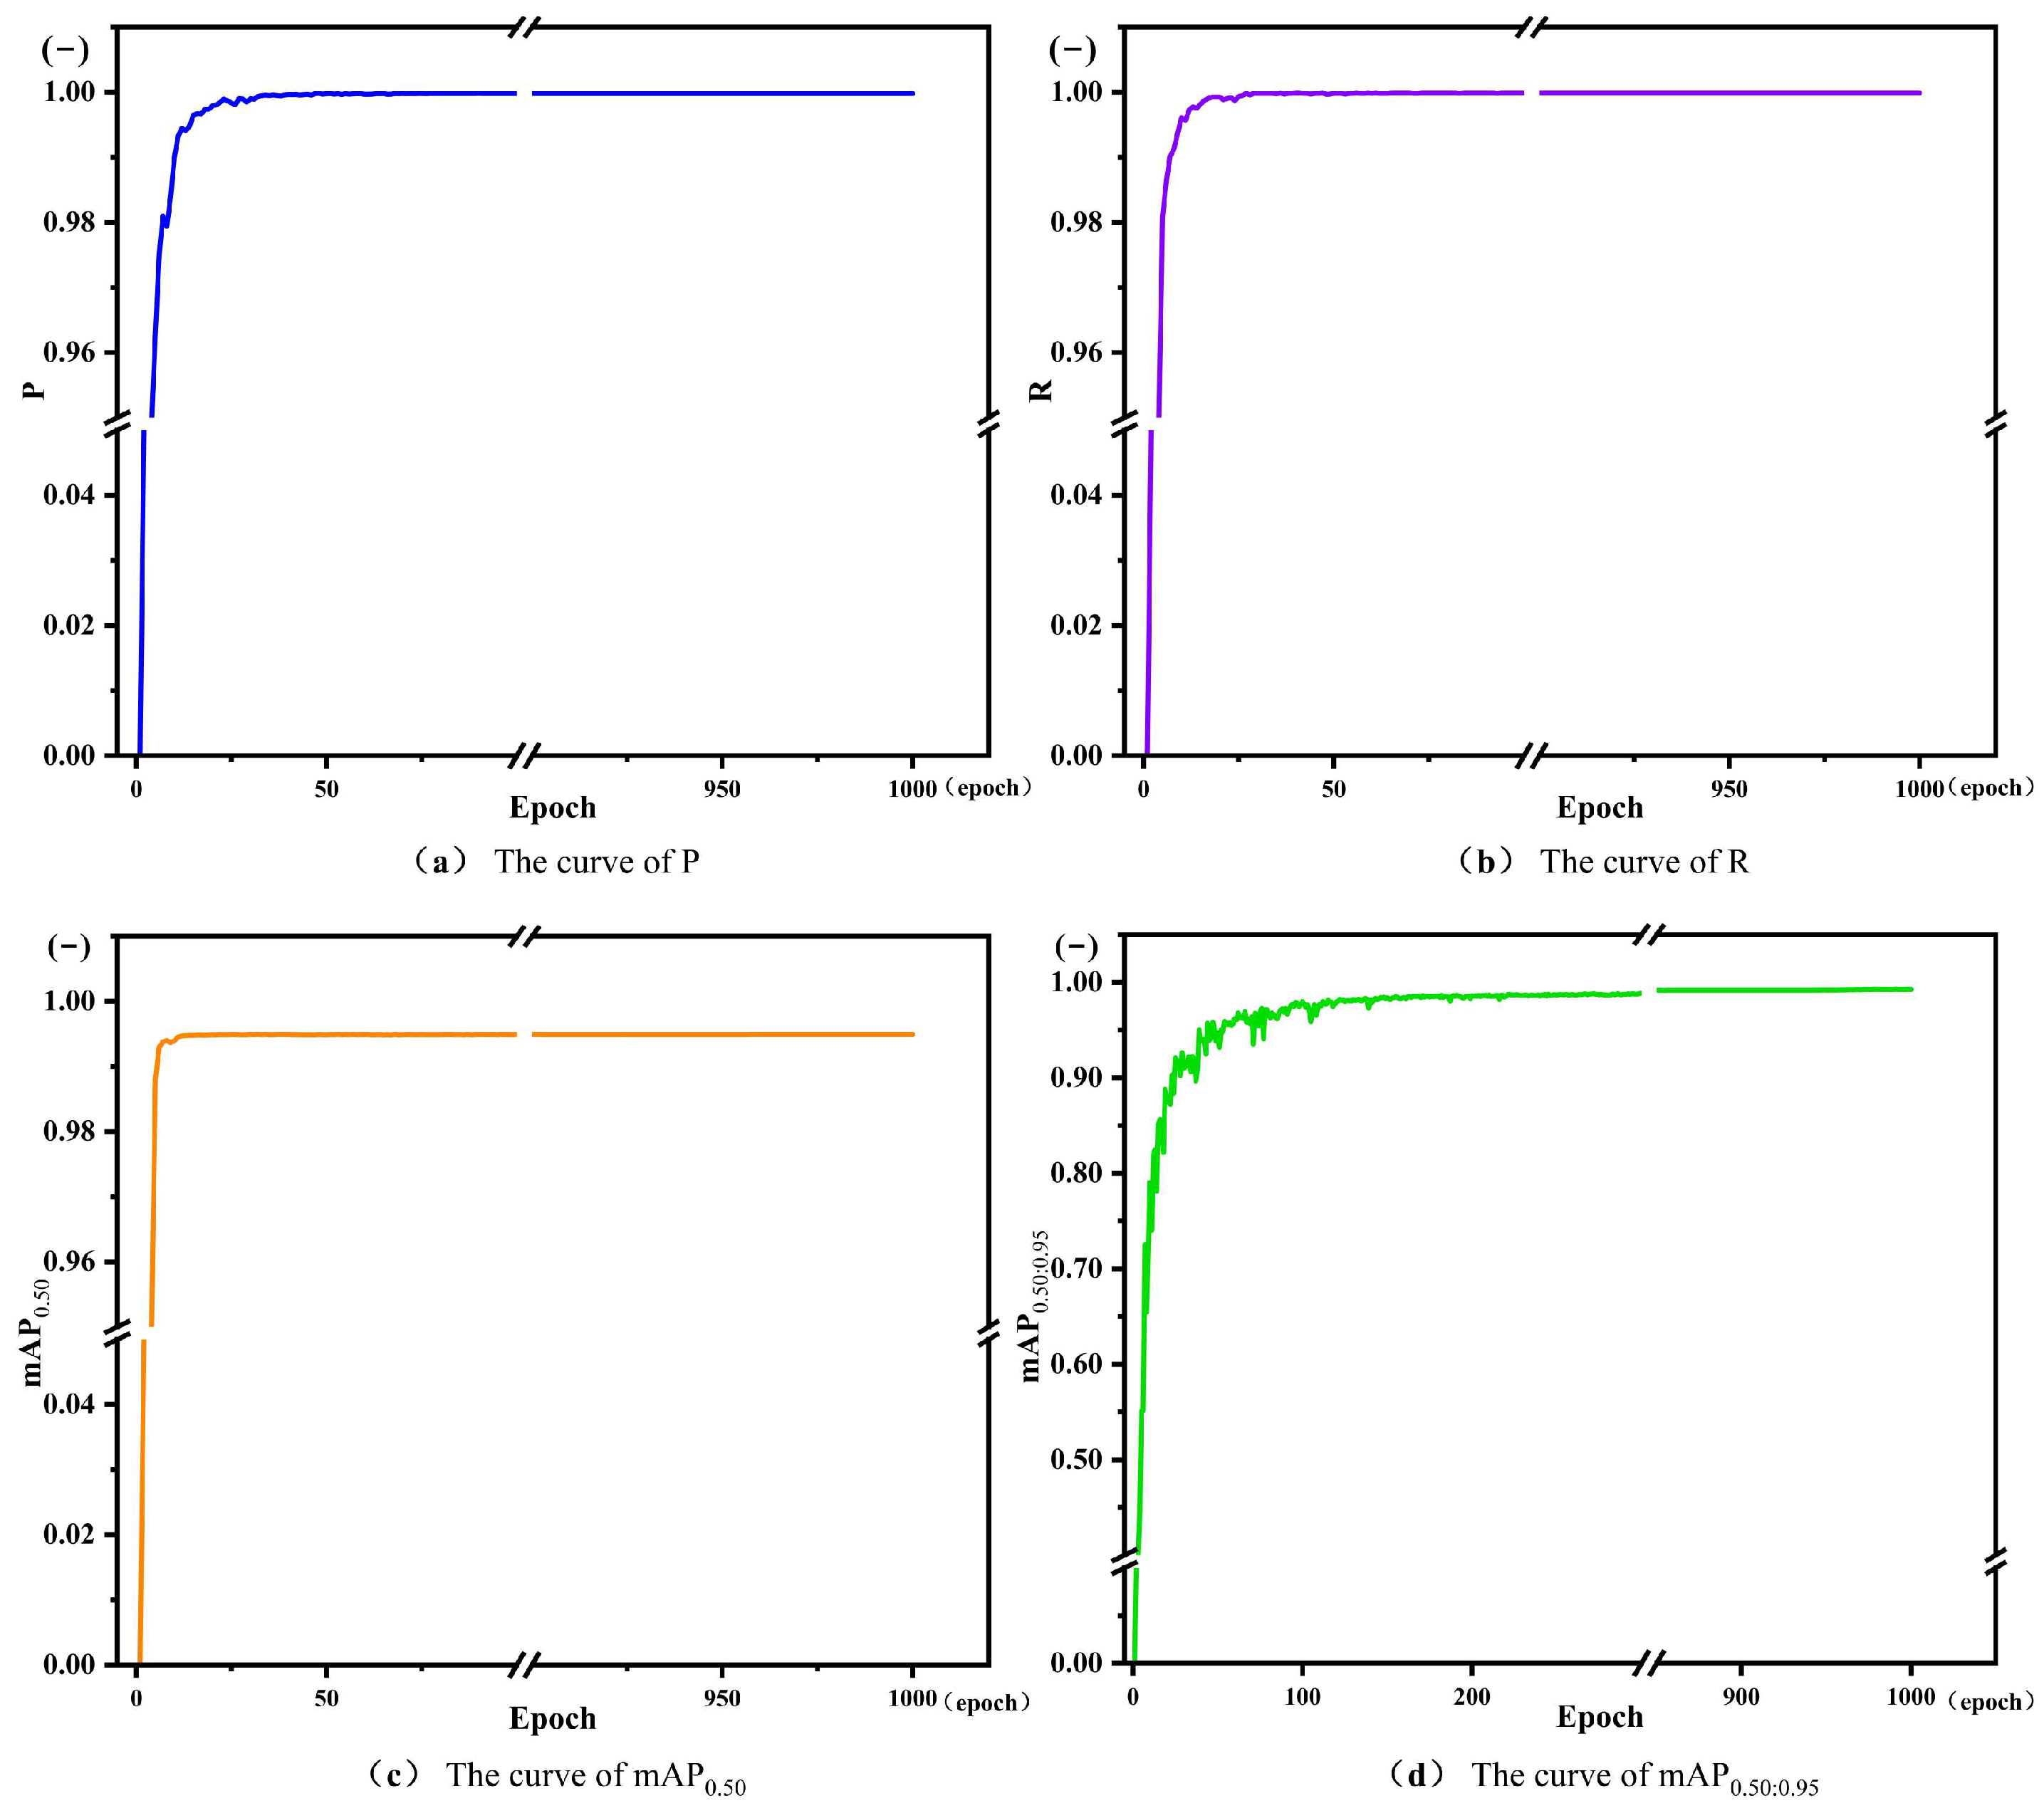
After each epoch of training on the training set, the model is tested on the test set to verify the detection results of corn seed kernels. Figure 12 shows the evolution of P, R, mAP0.50:0.95, and mAP0.50 on the test set during training. Overall, at the end of training, P, R, mAP0.50:0.95, and mAP0.50 all maintained a high performance of 0.95. After approximately 100 epochs of training, P, R, and mAP0.50 showed little fluctuation and remained generally stable, while mAP0.50:0.95 still showed some fluctuation. As the number of training epochs increased, mAP0.50:0.95 showed a trend of continued slow growth, ultimately stabilizing at around 99.262%.
In order to verify the effectiveness of the proposed model, the detection performance and model complexity of the original YOLOv11n, YOLOv11s and LWCD-YOLO are compared. The specific results are shown in Table 3.
As shown in Table 3, in the corn seed kernel detection task the original YOLOv11n can still achieve good detection results. This is because the detection task is relatively simple, the YOLOv11 model has strong object detection capabilities, and the sample size of the test set is large, with 9319 target boxes and data samples from two different environments. Therefore, the overall detection performance of the model is high, but there is still room for improvement. The LWCD-YOLO achieves 99.978%, 99.989%, 99.984%, 99.491%, 99.491%, and 99.262% in six performance indicators, including P, R, F1, mAP0.50, mAP0.75, and mAP0.50:0.95, compared to the original model. Except for a 0.001% decrease in P, all other indicators are higher than the original YOLOv11n model, with the most important mAP0.50:0.95 increasing by 0.103%. In terms of model complexity, the number of parameters is only 1.27 M, the computational overhead is 3.5 G, the model size is 2.36 MB, and the FPS reaches 280. Compared with the original YOLOv11n, the number of parameters is reduced by 51%, the computational overhead is reduced by 44%, the model size is reduced by 50%, and the FPS is improved by 94%. Compared with YOLOv11s, the detection performance of the proposed model in this paper is higher than that of YOLOv11s, with mAP0.50:0.95 increasing by 0.076% and FPS increasing by approximately 200%. This proves the effectiveness of the proposed model and achieves the expected results.
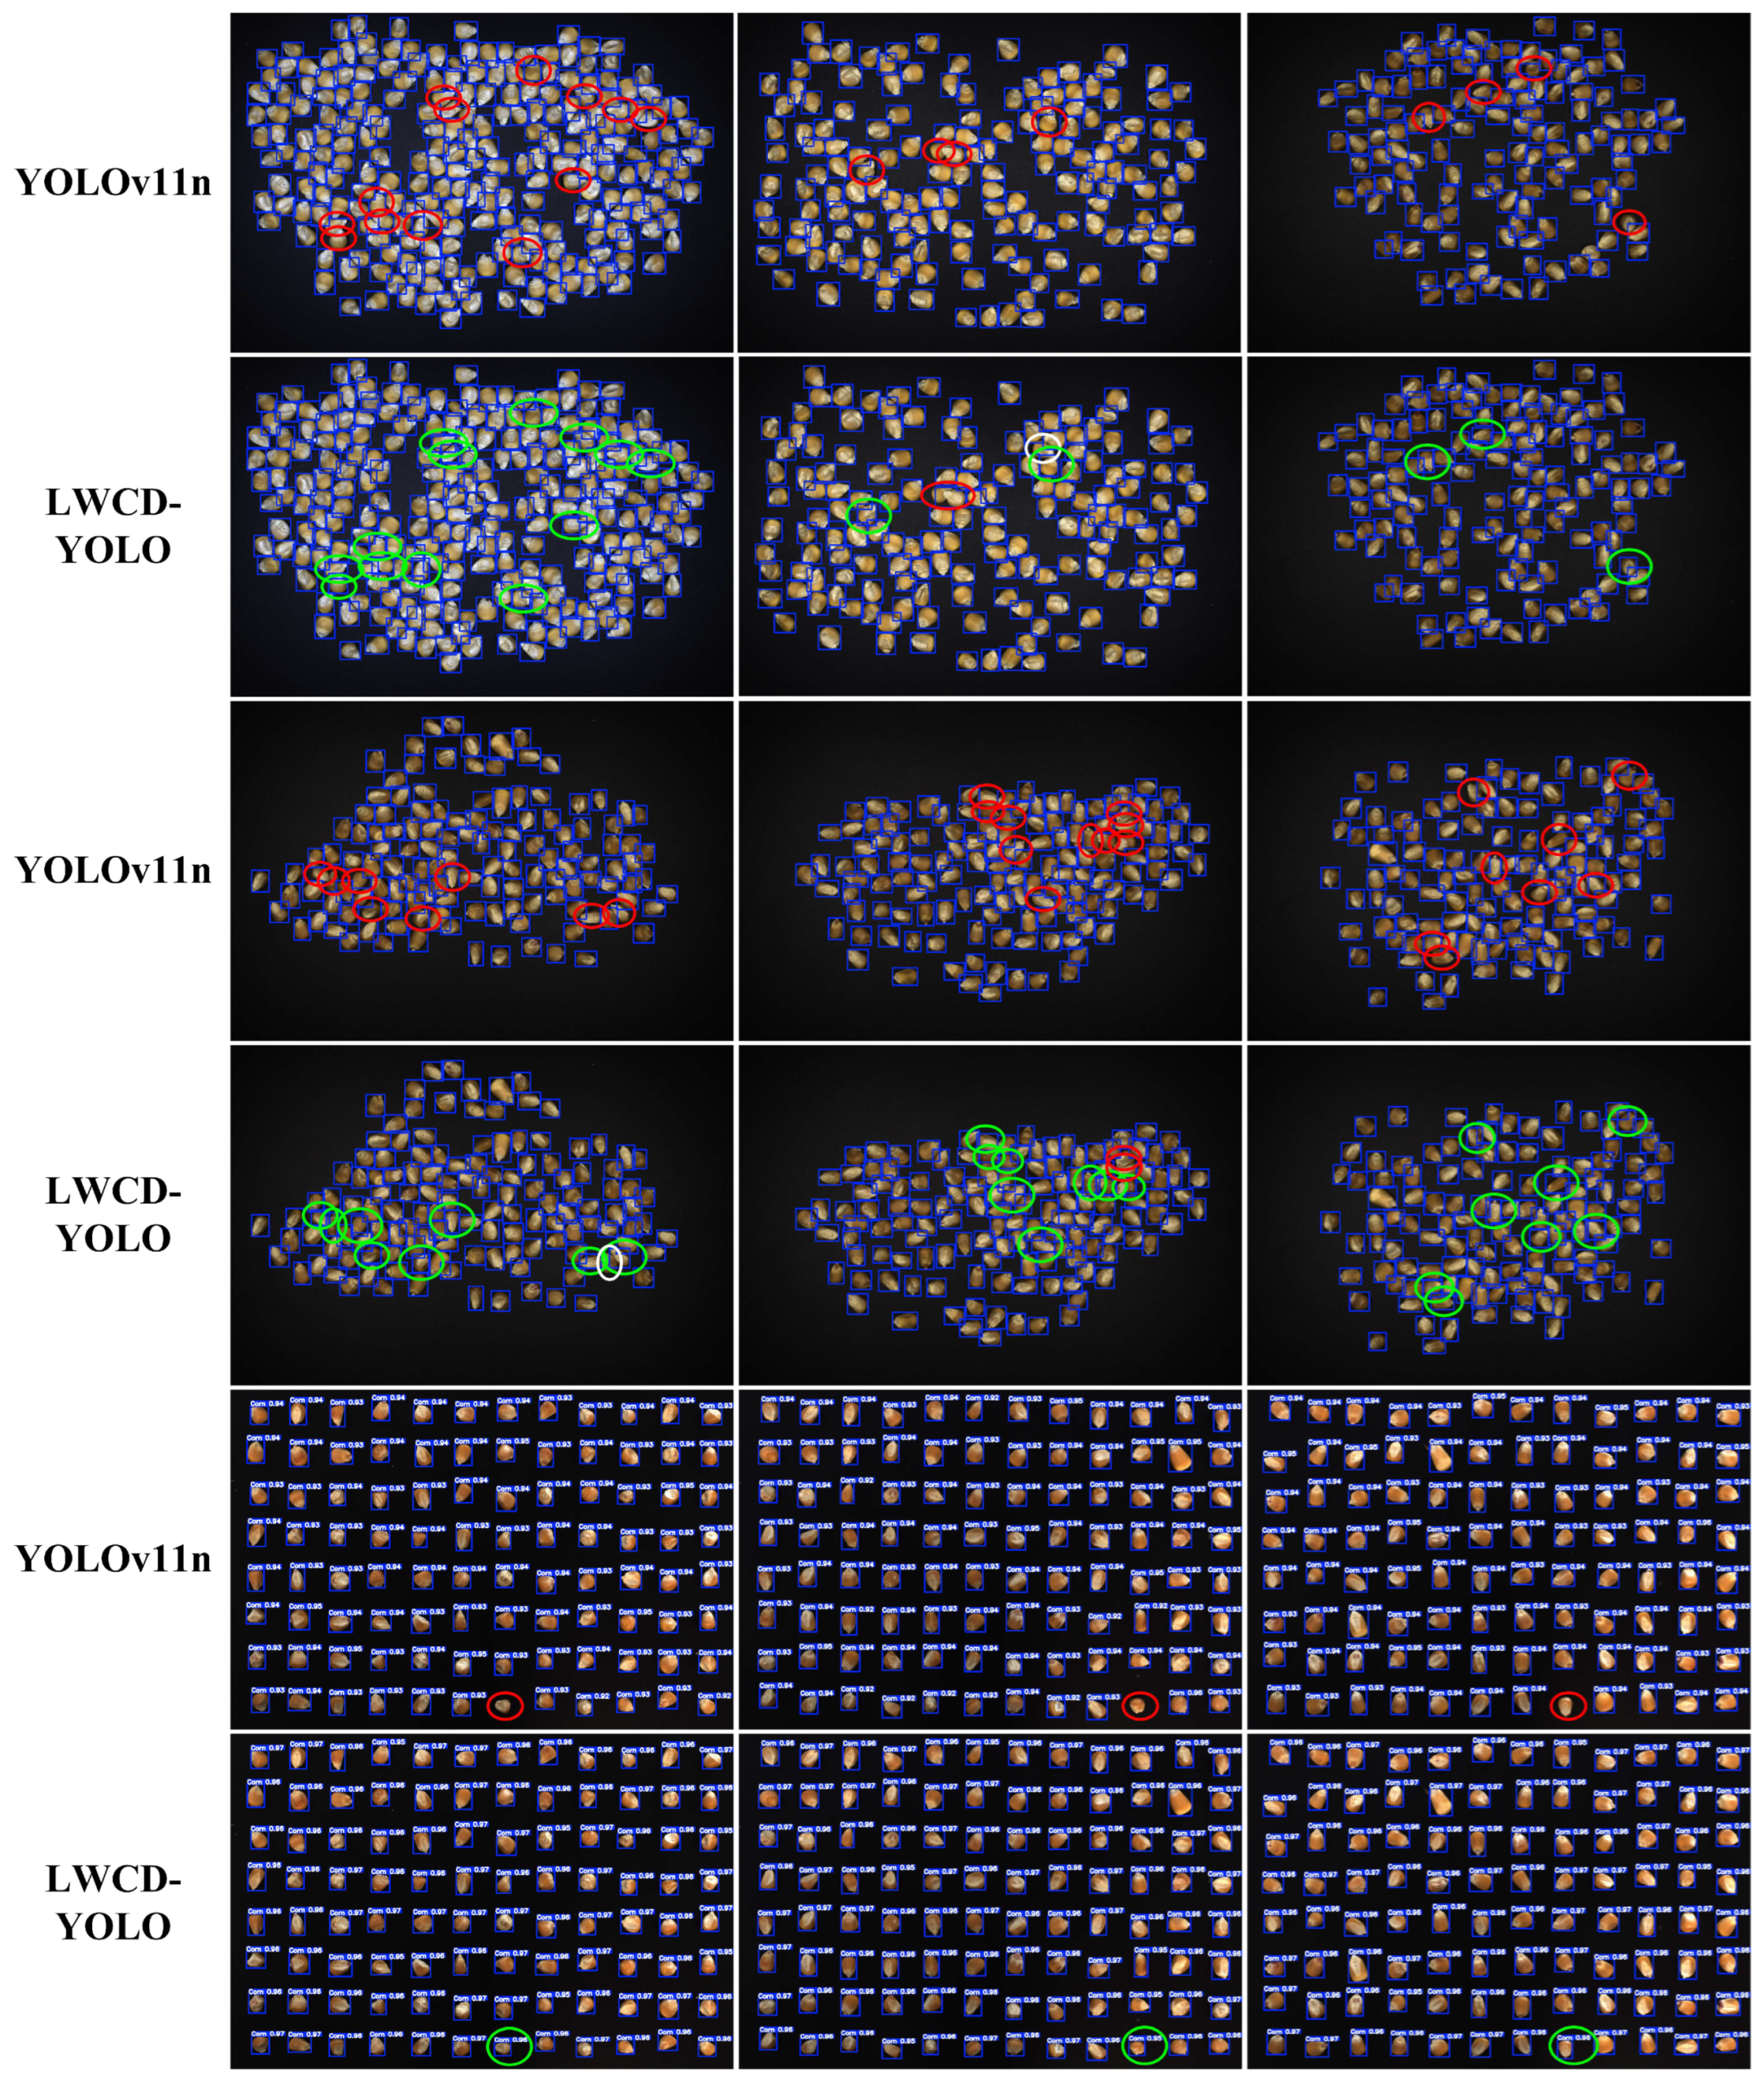
In order to better distinguish the performance differences between LWCD-YOLO and the original model, the detection results were visualized on the test dataset. In order to better distinguish the detection effect, the confidence threshold is set to 0.92 and the IoU is set to 0.20 for detection. The detection effect is shown in Figure 13. The red circle represents undetected corn kernels, the green circle represents successfully detected corn kernels, and the white circle represents that the original model was able to detect corn kernels, but LWCD-YOLO did not detect them.
As shown in Figure 13, it can be seen that the original YOLOv11n model has strong detection ability for corn seed detection, but there are also cases where corn seeds are not detected. After training the detection model proposed in this paper, most of the missed seeds were detected, but there were also cases where some seeds were not detected and missed again. However, the overall confidence level increased by about 0.03, indicating that the model proposed in this paper is more accurate in detecting target regions in seeds.
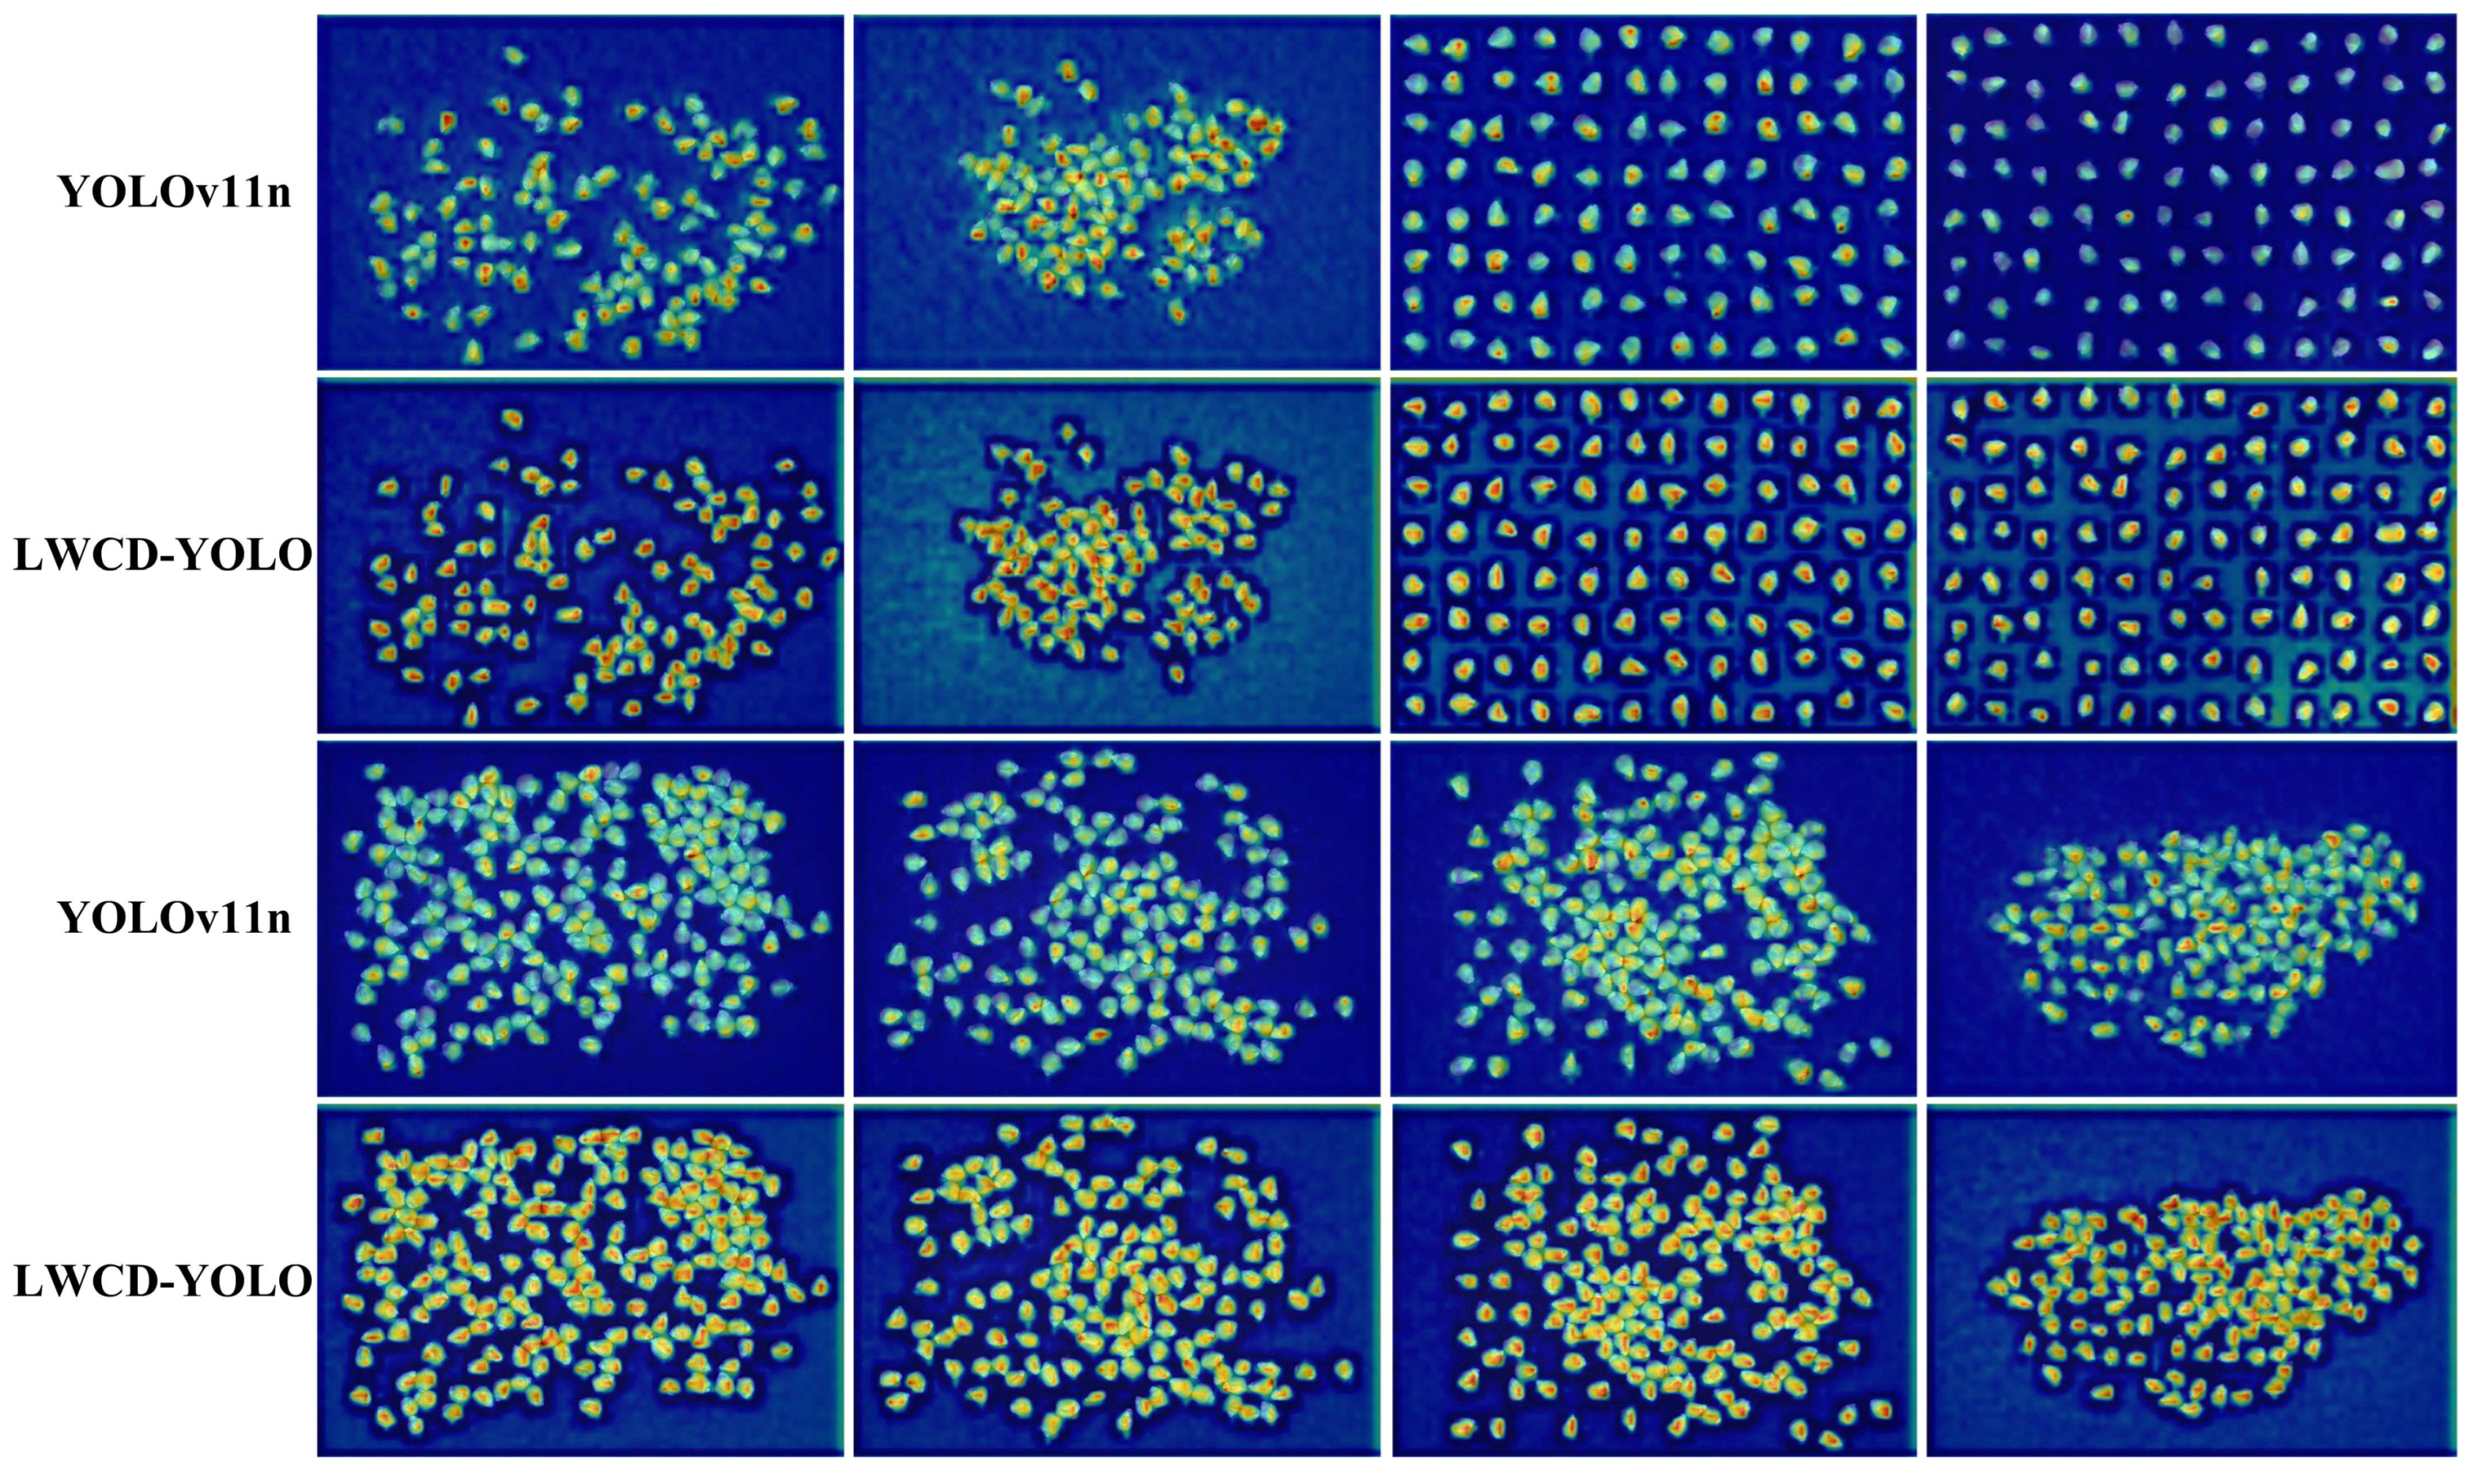
To further demonstrate that the proposed model has a strong ability to identify corn seeds, this study used Grad-CAM [28] to generate heat maps of the original YOLOv11n and LWCD-YOLO on the test dataset and compared the degree of attention paid to the target area by the two models, so as to intuitively measure their performance. The generated heat map is shown in Figure 14. The darker the color, the closer to red, the higher the network’s attention to the area, and the lower the color, the lower the network’s attention to the area. As shown in Figure 14, the original YOLOv11n model also pays attention to seeds to a certain extent, but the attention to some seed areas is not very high and the attention area is only part of the seed, which can easily lead to missed detection or incorrect object detections. When using LWCD-YOLO, the attention to the seed area is significantly improved, and the attention area covers the entire area of the seed, so that the seed can be identified more accurately.

3.2. Performance Comparison of The-State-of-the-Art Models

To validate the effectiveness of the proposed model, training and testing were performed on the currently popular single-object detection models YOLOv5n [29], YOLOv8n [30], YOLOv9t [31], YOLOv10n [32], YOLOv11n, YOLOv12n [33], and YOLOv13n. To ensure consistency in the experiments, no pre-trained weight parameters were loaded during training. The results on the test set are shown in Table 4.
As shown in Table 4, the proposed LWCD-YOLO outperforms the current popular single-object detection models in terms of detection performance. Compared to YOLOv5n, YOLOv8n, YOLOv9t, YOLOv10n, YOLOv11n, YOLOv12n and YOLOv13n, mAP0.50:0.95 increased by 0.812%, 0.111%, 0.425%, 0.062%, 0.103%, 0.138% and 0.042%, respectively. Compared to the least complex YOLOv5n, the model size was reduced by 0.98 MB, the number of parameters reduced by 0.49 M, and the computational overhead by 0.6 G, while still achieving an improvement in FPS. This demonstrates that the proposed model maintains high detection performance while reducing model complexity and improving detection efficiency. This fully demonstrates the superiority of the proposed model in terms of model performance, complexity, and detection efficiency.

3.3. Ablation Experiment Results of Proposed Model

In order to further analyze the impact of the modules proposed in this paper on the model detection performance and verify the effectiveness of each module, ablation experiments on each module are carried out. The experimental results are shown in Table 5, where “A” represents the lightweight backbone network, “B” represents the proposed MSFFM, and “C” represents the optimization training of the model using the WIoU loss function. Table 5 shows that using the proposed lightweight backbone network increased the model’s most important mAP0.50:0.95 by 0.001%, decreased mAP0.50 by 0.002%, increased F1 by 0.004%, increased R by 0.012%, decreased P by 0.004%, decreased the number of parameters by 0.42 M, decreased the FLOPs by 0.6 G, decreased the model size by 0.84 MB, and increased FPS. This demonstrates that the proposed lightweight backbone network can improve detection efficiency while reducing model complexity without compromising the model’s overall detection performance. Using the MSFFM, compared to the original model, the model’s detection performance decreased P by 0.007%, increased R by 0.012%, increased F1 by 0.003%, increased mAP0.50 by 0.006%, increased mAP0.75 by 0.006%, and increased mAP0.50:0.95 by 0.001%. In terms of model complexity, the number of parameters was reduced by 0.89 MB, the FLOPs was reduced by 2.2 G, the model size was reduced by 1.82 MB, and the FPS was increased by 51%. The proposed MSFFM significantly reduced model complexity while also improving detection performance, validating the analysis in Section 2.2.3. After optimizing training using the WIOU loss function, the model’s detection performance improved, with mAP0.50:0.95 increasing by 0.048%. Although “A + C” and “B + C” did not improve detection performance compared to using “C” alone, they reduced model complexity and improved detection efficiency. Using the three improved modules A, B, and C simultaneously, the model achieved optimal detection performance, the lowest model complexity, and the highest detection efficiency.

3.4. Comparative Experiments on Different Attention Mechanisms in Backbone Networks

To analyze the impact of the attention module in the backbone network on the model, we compared the effects of different attention modules on the network model. We compared the performance of eight different attention mechanisms: Channel Prior Convolutional Attention (CPCA) [34], Multi-Path Coordinate Attention (MPCA) [35], Similarity-based Attention Module (SimAM) [36], Mixed Local Channel Attention (MLCA) [37], Convolution and Attention Fusion Module (CAFM) [38], Adaptive Fine-Grained Channel Attention (AFGA) [39], Efficient Channel Attention (ECA) [40], and Convolutional Block Attention Module (CBAM) [41]. Table 6 shows the results, where “D” represents the improved network structure in this paper, where the backbone network does not use EMA. All models are trained using the WIOU loss function.
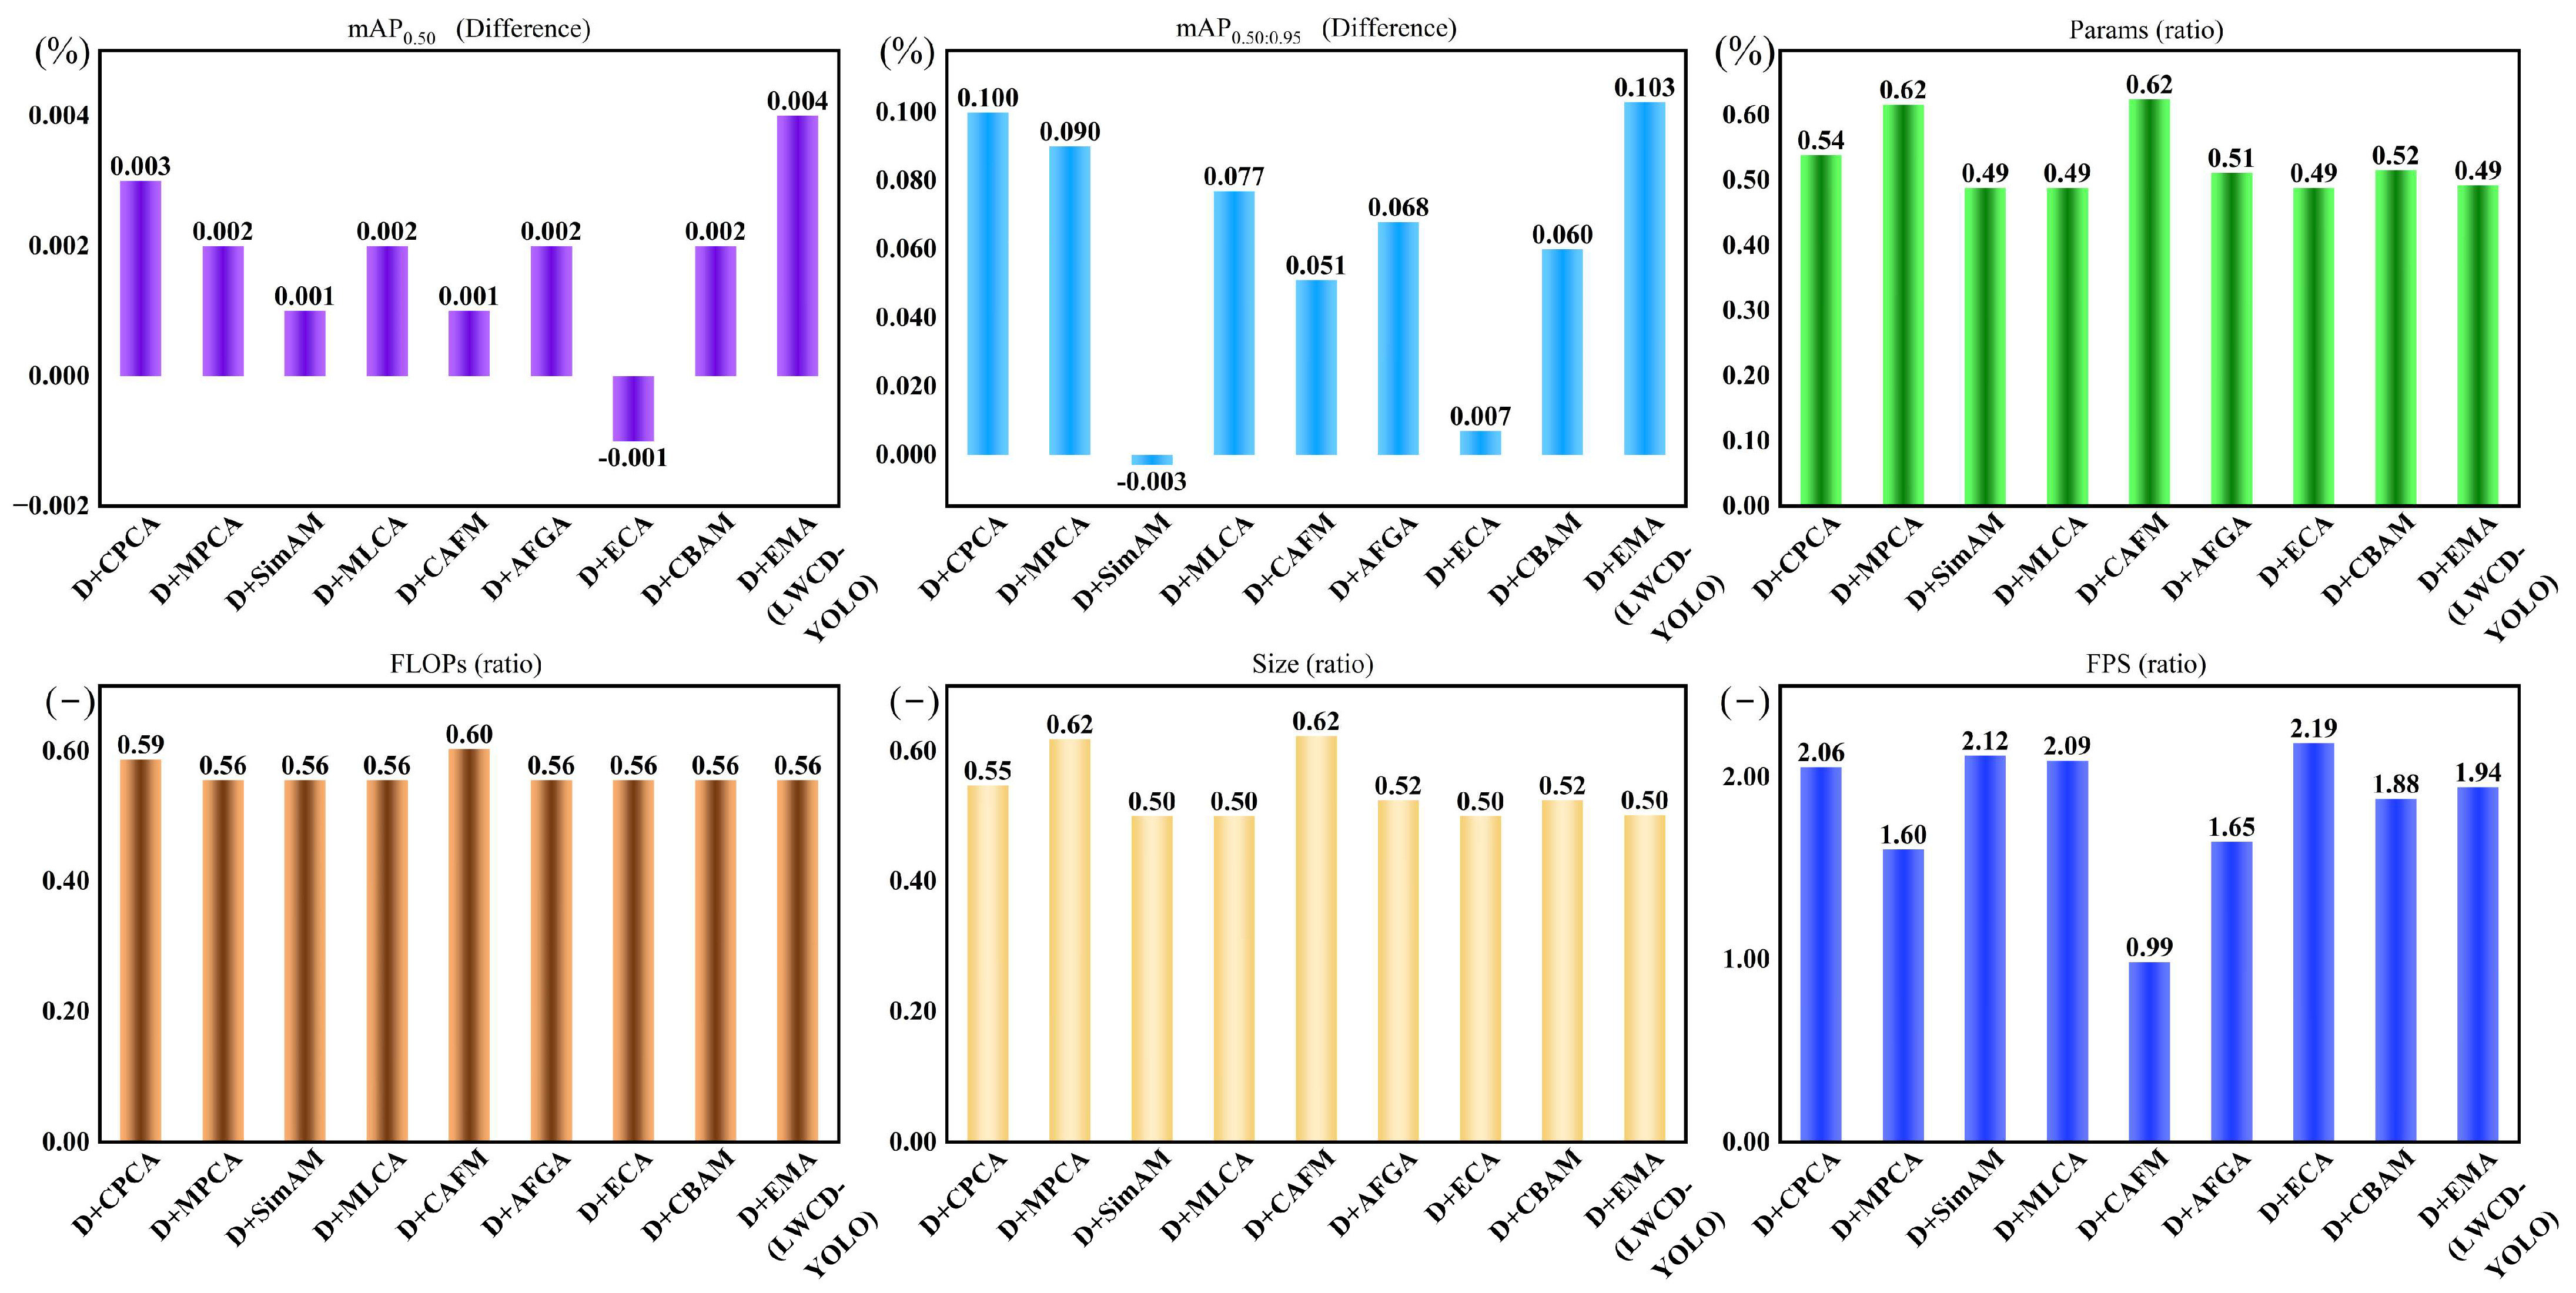
As can be seen from Table 6, when using different attention mechanisms, the mAP0.50:0.95 of the model is better than the original YOLOv11n. Except for the CAFM attention module, which causes the detection efficiency to be lower than the YOLOv11n model, the addition of the other seven attention modules will improve the FPS value. The EMA attention mechanism used in this article does not have the highest detection efficiency, but it is better than the other eight models in the three detection performance indicators of mAP0.50, mAP0.75, and mAP0.50:0.95, and The FPS value is also relatively good, achieving a balance between detection efficiency, model complexity and detection performance. To more intuitively analyze the impact of different attention mechanism modules on model performance, this paper compares changes in mAP0.50, mAP0.50–0.95, model complexity, and FPS relative to the original YOLOv11n model after applying various attention models, as shown in Figure 15. Here, “difference” denotes the gap between the model with the attention module and YOLOv11n, while “ratio” represents the ratio of the model with the attention module to YOLOv11n. As shown in Figure 14, after incorporating EMA, the model’s detection performance and computational complexity significantly outperform other attention mechanisms. Although the FPS is not optimal, it emerges as the best overall choice when comprehensively evaluated.

3.5. Comparative Experiments on Different Regression Box Localization Loss Functions

To analyze the impact of different regression box loss functions on LWCD-YOLO, comparative experiments were conducted on the training and test sets described in Table 1 under the same experimental conditions. Based on the improved module proposed in this paper, the model’s detection performance was compared using CIoU, Soft Intersection over Union (SIoU) [42], Generalized Intersection over Union (GIoU) [43], Enhanced Intersection over Union (EIoU) [44], Shape Intersection over Union (ShapeIoU) [45], Distance Intersection over Union (DIoU) [46], and WIoU training optimization. The experimental results are shown in Table 7, where “E” represents the proposed lightweight corn seed kernel fast detection model structure.
As shown in Table 7, compared to other regression box losses, the mAP0.50:0.95 achieved the best performance when trained using WIoU loss, indicating that the model trained with this loss exhibits optimal stability. Compared to the original CIoU loss, models trained using the other six loss functions all showed improved detection performance, demonstrating that CIoU is not suitable for model optimization training for corn seed kernel region of interest detection. While some detection metrics obtained from EIoU and DIoU training are higher than those from WIoU, the mAP0.50:0.95 is lower than WIoU. More importantly, WIoU achieves higher detection efficiency than the other loss functions, validating the applicability of the WIoU loss for corn seed kernel detection.

4. Discussion

Corn seed kernel detection is an important means for automated seed counting, variety identification, and phenotypic analysis. Designing an accurate and efficient detection method is crucial. Existing research has primarily focused on improving detection performance and reducing model complexity, neglecting detection efficiency. This paper proposes LWCD-YOLO by constructing a lightweight feature extraction module, enhancing the ability to fuse features at different scales, and improving the loss function. This approach improves model detection performance while reducing model complexity and increasing detection efficiency.
When constructing a lightweight backbone feature extraction network, this paper employs PConv and EMA to reduce model complexity and minimize redundant feature extraction. PConv achieves the goal of enhancing the performance of object detection models by reducing the extraction of redundant channel features, which is consistent with the conclusion of Wu et al. [47] that using PConv can reduce the complexity and computational complexity of the model. Regarding attention module selection, Table 6 indicates that the original C2PSA in YOLOv11 is not suitable for seed detection tasks. As demonstrated in [48], choosing an appropriate attention mechanism module is crucial for improving model detection performance. Furthermore, Table 6 indicates that reducing model complexity and parameter count does not necessarily improve computational efficiency, consistent with the findings in [49]. Therefore, network architecture design must be tailored to the specific requirements of the target task.
In terms of feature fusion, the original neck network was designed for general target detection tasks and is not suitable for a specific task. Papers [50,51] designed feature fusion modules to fit the detection requirements for sweet potato diseases or plants, and achieved good detection results. Therefore, in this study, we designed MSFFM based on the characteristics of the grain detection task. On the surface, it reduces the number of detection heads, but in fact, it removes large and small target detections based on the proportion of grains occupying the entire image, while retaining medium-sized target detection heads, thereby reducing the complexity of the model. At the same time, MSFFM also realizes the direct fusion of different-scale features at three different levels: high, medium, and low, avoiding the problem of low fusion caused by indirect fusion using FPN and PAN structures.
In terms of loss function optimization, this paper chooses the WIoU loss function, which is good at handling complex samples such as adhesion and occlusion. The results are the same as those in the paper [52]. As shown in Table 7, the WIoU result is the best, which also shows that choosing a loss function suitable for the research task has a significant effect on improving model performance.
In summary, the improvement strategy proposed in this study can be extended to other small and medium-sized object detection tasks. Compared with the YOLOv5s based rice grain detection model proposed by Chen et al. [16], LWCD-YOLO achieved an mAP0.50 of 99.49%, which is higher than their model’s 99.12%. This is mainly due to the smaller rice grain size, which requires higher accuracy for detection, but our model is more lightweight. Compared with the corn kernel detection model proposed by Yang et al. [53], the detection efficiency of the model proposed in this paper is faster and the model is also more lightweight.
Despite the good results achieved in this study, there are still some areas that can be improved. (1) In this study, due to the limitation of the number of data sets, the data sets were only divided into training sets and test sets, and no validation set was reserved. Although there are studies that have used this method, there may be a risk of data leakage. In subsequent studies, while collecting more data, the data sets will be divided into training sets, validation sets, and test sets as much as possible. (2) Establish a public seed and grain detection data level to enrich the categories and varieties of crops, so as to meet the needs of researchers to measure the performance of the model under a unified standard dataset, and thus better reflect the advantages of the model. (3) In this study, although the FPS indicator reflects the improvement in detection efficiency, the memory access volume and the model performance of the proposed model on different mobile edge devices are not analyzed. Further analysis can be conducted based on the model proposed in this article, and model compression techniques such as pruning and knowledge distillation can be used to make the model more lightweight. (4) Existing research mainly focuses on seeds of a single type of crop, which limits its application scenarios to a certain extent. Subsequent research can carry out seed detection research on multiple crop types to improve the generalization and applicability of the model.

5. Conclusions

To overcome the limitations of high computational complexity and low detection efficiency in existing corn kernel detection algorithms, this study focuses on three key improvements: the design of a lightweight backbone feature extraction network, the enhancement of multi-level feature fusion capability, and the optimization of the loss function. Based on these strategies, an accurate and efficient detection model, LWCD-YOLO, is proposed. Experimental results on the test dataset demonstrate that LWCD-YOLO achieves a mAP0.50 of 99.491% and a mAP0.50:0.95 of 99.262%, while improving inference speed by 94% to 280 FPS compared with the original YOLOv11n. These findings indicate that LWCD-YOLO provides a novel and effective solution for rapid corn seed counting and kernel region extraction, with significant potential for advancing seed phenotyping and seed quality evaluation.

Author Contributions

Conceptualization, W.S. and K.X. Methodology, W.S., D.L., S.Y. and R.Y.; Software, W.S., K.X. and D.C.; validation, W.S.; formal analysis, D.C., D.L., R.Y., R.W. and L.C.; investigation, W.S. and L.W.; resources, R.Y.; data curation, W.S., D.C., D.L., L.W. and L.C.; writing—original draft preparation, W.S., writing—review and editing, W.S., K.X., D.C., S.Y., R.W. and R.Y. visualization, W.S. and K.X.; supervision, R.Y.; project administration, R.Y.; funding acquisition, R.Y. and S.Y. All authors have read and agreed to the published version of the manuscript.

Funding

This research was funded by the National Key R&D Program of China under grant number 2023YFD2000400, and the National Talent Foundation Project of China (Grant No. T2019136).

Data Availability Statement

The original contributions presented in the study are included in the article, further inquiries can be directed to the corresponding author.

Conflicts of Interest

The authors declare no conflicts of interest.

References

  1. Song, P.; Yue, X.; Gu, Y.; Yang, T. Assessment of maize seed vigor under saline-alkali and drought stress based on low field nuclear magnetic resonance. Biosyst. Eng. 2022, 220, 135–145. [Google Scholar] [CrossRef]
  2. Shatadal, P.; Jayas, D.S.; Bulley, N.R. Digital image analysis for software separation and classification of touching grains: I. Disconnect algorithm. Trans. ASAE 1995, 38, 635–643. [Google Scholar] [CrossRef]
  3. Wang, Y.C.; Chou, J.J. Automatic segmentation of touching rice kernels with an active contour model. Trans. ASAE 2004, 47, 1803–1811. [Google Scholar] [CrossRef]
  4. Zhou, T.; Zhang, T.; Yang, L.; Zhao, J. Comparison of two algorithms based on mathematical morphology for segmentation of touching strawberry fruits. Trans. Chin. Soc. Agric. Eng. 2007, 23, 164–168. [Google Scholar] [CrossRef]
  5. Dougherty, E.R. Granulometric size density for segmented random-disk models. J. Math. Imaging Vis. 2002, 17, 271–281. [Google Scholar] [CrossRef]
  6. Lin, P.; Chen, Y.M.; He, Y.; Hu, G.W. A novel matching algorithm for splitting touching rice kernels based on contour curvature analysis. Comput. Electron. Agric. 2014, 109, 124–133. [Google Scholar] [CrossRef]
  7. Garofalo, S.P.; Ardito, F.; Sanitate, N.; De Carolis, G.; Ruggieri, S.; Giannico, V.; Rana, G.; Ferrara, R.M. Robustness of Actual Evapotranspiration Predicted by Random Forest Model Integrating Remote Sensing and Meteorological Information: Case of Watermelon (Citrullus lanatus, (Thunb.) Matsum. & Nakai, 1916). Water 2025, 17, 323. [Google Scholar] [CrossRef]
  8. Barrio-Conde, M.; Zanella, M.A.; Aguiar-Perez, J.M.; Ruiz-Gonzalez, R.; Gomez-Gil, J. A Deep Learning Image System for Classifying High Oleic Sunflower Seed Varieties. Sensors 2023, 23, 2471. [Google Scholar] [CrossRef]
  9. Velesaca, H.O.; Mira, R.; Suárez, P.L.; Larrea, C.X.; Sappa, A.D. Deep learning based corn kernel classification. In Proceedings of the IEEE/CVF Conference on Computer Vision and Pattern Recognition Workshops, Seattle, WA, USA, 14–19 June 2020; pp. 66–67. [Google Scholar] [CrossRef]
  10. Zhao, Y.; Wei, Y.; Shan, H.Y.; Mu, Z.M.; Zhang, J.X.; Wu, H.Y.; Zhao, H.; Hu, J.L. Wheat ear detection method based on deep learning. Intell. Agric. Agric. Mach. 2022, 24, 96–105. [Google Scholar] [CrossRef]
  11. Wang, Y.; LI, Y.; Chen, Y.; Ding, Q.; He, R. A Method for Testing Phenotype Parameters of Wheat Grains on Spike Based on Improved Mask R-CNN. Sci. Agric. Sin. 2024, 57, 2322–2335. [Google Scholar] [CrossRef]
  12. Wang, L.; Zhang, Q.; Feng, T.; Wang, Y.; Li, Y.; Chen, D. Wheat Grain Counting Method Based on YOLO v7-ST Model. Trans. Chin. Soc. Agric. Mach. 2023, 54, 188–197,204. [Google Scholar] [CrossRef]
  13. Wang, Y.; Duan, Y.; Song, L.; Han, M. Detection Method of Severe Adhesive Wheat Grain Based on YOLO v5-MDC Model. Trans. Chin. Soc. Agric. Mach. 2022, 53, 245–253. [Google Scholar] [CrossRef]
  14. Zou, Y.; Tian, Z.; Cao, J.; Ren, Y.; Zhang, Y.; Liu, L.; Zhang, P.; Ni, J. Rice grain detection and counting method based on TCLE–YOLO model. Sensors 2023, 23, 9129. [Google Scholar] [CrossRef]
  15. Liang, Z.; Xu, X.; Yang, D.; Liu, Y. The Development of a Lightweight DE-YOLO Model for Detecting Impurities and Broken Rice Grains. Agriculture 2025, 15, 848. [Google Scholar] [CrossRef]
  16. Chen, D.; Sun, W.; Xu, K.; Qing, Y.; Zhou, G.; Yang, R. A lightweight detection model for rice grain with dense bonding distribution based on YOLOv5s. Comput. Electron. Agric. 2025, 237, 110672. [Google Scholar] [CrossRef]
  17. Ma, N.; Su, Y.; Yang, L.; Li, Z.; Yan, H. Wheat Seed Detection and Counting Method Based on Improved YOLOv8 Model. Sensors 2024, 24, 1654. [Google Scholar] [CrossRef]
  18. Wang, X.; Li, C.; Zhao, C.; Jiao, Y.; Xiang, H.; Wu, X.; Chai, H. GrainNet: Efficient detection and counting of wheat grains based on an improved YOLOv7 modeling. Plant Methods 2025, 21, 44. [Google Scholar] [CrossRef]
  19. Xu, X.; Geng, Q.; Gao, F.; Xiong, D.; Qiao, H.; Ma, X. Segmentation and counting of wheat spike grains based on deep learning and textural feature. Plant Methods 2023, 19, 77. [Google Scholar] [CrossRef] [PubMed]
  20. Lei, M.; Li, S.; Wu, Y.; Hu, H.; Zhou, Y.; Zheng, X.; Ding, G.; Du, S.; Wu, Z.; Gao, Y. YOLOv13: Real-Time Object Detection with Hypergraph-Enhanced Adaptive Visual Perception. arXiv 2025, arXiv:2506.17733. [Google Scholar] [CrossRef]
  21. Khanam, R.; Hussain, M. Yolov11: An overview of the key architectural enhancements. arXiv 2024, arXiv:2410.17725. [Google Scholar] [CrossRef]
  22. He, K.; Zhang, X.; Ren, S.; Sun, J. Spatial pyramid pooling in deep convolutional networks for visual recognition. IEEE Trans. Pattern Anal. Mach. Intell. 2015, 37, 1904–1916. [Google Scholar] [CrossRef]
  23. Chen, J.; Kao, S.H.; He, H.; Zhuo, W.; Wen, S.; Lee, C.H.; Chan, S.-H. Run, don’t walk: Chasing higher flops for faster neural networks. In Proceedings of the 2023 IEEE/CVF Conference on Computer Vision and Pattern Recognition (CVPR), Vancouver, BC, Canada, 17–24 June 2023; pp. 12021–12031. [Google Scholar] [CrossRef]
  24. Ma, G.; Shen, X.; Yan, Y.; Ma, S.; Wang, H. Efficient multiscale attention feature infusion for enhancing MAC protocol identification in underwater acoustic networks. Ocean Eng. 2025, 320, 120226. [Google Scholar] [CrossRef]
  25. Hu, J.; Shen, L.; Sun, G. Squeeze-and-excitation networks. In Proceedings of the IEEE Conference on Computer Vision and Pattern Recognition, Salt Lake City, UT, USA, 18–23 June 2018; pp. 7132–7141. [Google Scholar] [CrossRef]
  26. Fan, M.; Xue, D.; Yan, Q.; Zhu, Y.; Sun, J.; Zhang, Y. Dim and Small Space Target Detection Method Based on Enhanced Information Representation. Chin. J. Comput. 2025, 48, 537–555. [Google Scholar] [CrossRef]
  27. Zheng, Z.; Wang, P.; Ren, D.; Liu, W.; Ye, R.; Hu, Q.; Zuo, W. Enhancing geometric factors in model learning and inference for object detection and instance segmentation. IEEE Trans. Cybern. 2021, 52, 8574–8586. [Google Scholar] [CrossRef]
  28. Selvaraju, R.R.; Cogswell, M.; Das, A.; Vedantam, R.; Parikh, D.; Batra, D. Grad-CAM: Visual Explanations from Deep Networks via Gradient-based Localization. arXiv 2016, arXiv:1610.02391. [Google Scholar] [CrossRef]
  29. Jocher, G.; Chaurasia, A.; Stoken, A.; Borovec, J.; Kwon, Y.; Michael, K.; Tao, X.; Fang, J.; Lorna; Zeng, Y.; et al. Ultralytics YOLOv5. 2020. Available online: https://zenodo.org/records/7347926 (accessed on 20 April 2025).
  30. Solawetz, J. Francesco, What Is YOLOv8? The Ultimate Guide.. 2023. Available online: https://roboflow.com/ (accessed on 20 May 2025).
  31. Wang, C.Y.; Yeh, I.H.; Liao, H.Y.M. Yolov9: Learning what you want to learn using programmable gradient information. arXiv 2024, arXiv:2402.13616. [Google Scholar] [CrossRef]
  32. Wang, A.; Chen, H.; Liu, L.; Chen, K.; Lin, Z.; Han, J.; Ding, G. YOLOv10: Real-Time End-to-End Object Detection. arXiv 2024, arXiv:2405.14458. [Google Scholar] [CrossRef]
  33. Tian, Y.; Ye, Q.; Doermann, D.S. YOLOv12: Attention-Centric Real-Time Object Detectors. arXiv 2025, arXiv:2502.12524. [Google Scholar] [CrossRef]
  34. Huang, H.; Chen, Z.; Zou, Y.; Lu, M.; Chen, C.; Song, Y.; Yan, F. Channel prior convolutional attention for medical image segmentation. Comput. Biol. Med. 2024, 178, 108784. [Google Scholar] [CrossRef]
  35. Wang, M.; Wang, J.; Liu, C.; Li, F.; Wang, Z. Spatial-coordinate attention and multi-path residual block based oriented object detection in remote sensing images. Int. J. Remote Sens. 2022, 43, 5757–5774. [Google Scholar] [CrossRef]
  36. Yang, L.; Zhang, R.Y.; Li, L.; Xie, X. Simam: A simple, parameter-free attention module for convolutional neural networks. In Proceedings of the 38th International Conference on Machine Learning, Virtual Event, 18–24 July 2021; pp. 11863–11874. Available online: https://proceedings.mlr.press/v139/yang21o (accessed on 20 May 2025).
  37. Wan, D.; Lu, R.; Shen, S.; Xu, T.; Lang, X.; Ren, Z. Mixed local channel attention for object detection. Eng. Appl. Artif. Intell. 2023, 123, 106442. [Google Scholar] [CrossRef]
  38. Palsson, F.; Ulfarsson, M.O.; Sveinsson, J.R. Hyperspectral image denoising using a sparse low rank model and dual-tree complex wavelet transform. In Proceedings of the 2014 IEEE Geoscience and Remote Sensing Symposium (IGARSS 2014), Quebec City, QC, Canada, 13–18 July 2014. [Google Scholar] [CrossRef]
  39. Sun, H.; Wen, Y.; Feng, H.; Zheng, Y.; Mei, Q.; Ren, D.; Yu, M. Unsupervised bidirectional contrastive reconstruction and adaptive fine-grained channel attention networks for image dehazing. Neural Netw. 2024, 176, 106314. [Google Scholar] [CrossRef]
  40. Wang, Q.; Wu, B.; Zhu, P.; Li, P.; Zuo, W.; Hu, Q. ECA-Net: Efficient Channel Attention for Deep Convolutional Neural Networks. In Proceedings of the 2020 IEEE/CVF Conference on Computer Vision and Pattern Recognition (CVPR), Seattle, WA, USA, 13–19 June 2020; pp. 11531–11539. [Google Scholar] [CrossRef]
  41. Woo, S.; Park, J.; Lee, J.Y.; Kweon, I.S. Cbam: Convolutional block attention module. In Proceedings of the European Conference on Computer Vision (ECCV), Munich, Germany, 8–14 September 2018; pp. 3–19. [Google Scholar] [CrossRef]
  42. Gevorgyan, Z. SIoU loss: More powerful learning for bounding box regression. arXiv 2022, arXiv:2205.12740. [Google Scholar] [CrossRef]
  43. Rezatofighi, H.; Tsoi, N.; Gwak, J.; Sadeghian, A.; Reid, I.; Savarese, S. Generalized Intersection Over Union: A Metric and a Loss for Bounding Box Regression. In Proceedings of the 2019 IEEE/CVF Conference on Computer Vision and Pattern Recognition (CVPR), Long Beach, CA, USA, 15–20 June 2019. [Google Scholar] [CrossRef]
  44. Yang, Z.; Wang, X.; Li, J. EIoU: An Improved Vehicle Detection Algorithm Based on VehicleNet Neural Network. J. Phys. Conf. Ser. 2021, 1924, 012001. [Google Scholar] [CrossRef]
  45. Zhang, H.; Zhang, S. Shape-IoU: More Accurate Metric considering Bounding Box Shape and Scale. arXiv 2023, arXiv:2312.17663. [Google Scholar] [CrossRef]
  46. Zheng, Z.; Wang, P.; Liu, W.; Li, J.; Ye, R.; Ren, D. Distance-IoU loss: Faster and better learning for bounding box regression. In Proceedings of the AAAI Conference on Artificial Intelligence, New York, NY, USA, 7–12 February 2020; Volume 34. [Google Scholar] [CrossRef]
  47. Wu, H.; Zhu, R.; Wang, H.; Wang, X.; Huang, J.; Liu, S. Flaw-YOLOv5s: A Lightweight Potato Surface Defect Detection Algorithm Based on Multi-Scale Feature Fusion. Agronomy 2025, 15, 875. [Google Scholar] [CrossRef]
  48. Liu, Z.; Guo, X.; Zhao, T.; Liang, S. YOLO-BSMamba: A YOLOv8s-Based Model for Tomato Leaf Disease Detection in Complex Backgrounds. Agronomy 2025, 15, 870. [Google Scholar] [CrossRef]
  49. Han, K.; Wang, Y.; Tian, Q.; Guo, J.; Xu, C.; Xu, C. Ghostnet: More features from cheap operations. In Proceedings of the IEEE/CVF Conference on Computer Vision and Pattern Recognition, Seattle, WA, USA, 13–19 June 2020; pp. 1580–1589. [Google Scholar] [CrossRef]
  50. Xu, K.; Hou, Y.; Sun, W.; Chen, D.; Lv, D.; Xing, J.; Yang, R. A Detection Method for Sweet Potato Leaf Spot Disease and Leaf-Eating Pests. Agriculture 2025, 15, 503. [Google Scholar] [CrossRef]
  51. Xu, K.; Sun, W.; Chen, D.; Qing, Y.; Xing, J.; Yang, R. Early Sweet Potato Plant Detection Method Based on YOLOv8s (ESPPD-YOLO): A Model for Early Sweet Potato Plant Detection in a Complex Field Environment. Agronomy 2024, 14, 2650. [Google Scholar] [CrossRef]
  52. Han, Y.; Ren, G.; Zhang, J.; Du, Y.; Bao, G.; Cheng, L.; Yan, H. DSW-YOLO-Based Green Pepper Detection Method Under Complex Environments. Agronomy 2025, 15, 981. [Google Scholar] [CrossRef]
  53. Yang, S.; Wang, B.; Ru, S.; Yang, R.; Wu, J. Maize Seed Damage Identification Method Based on Improved YOLOV8n. Agronomy 2025, 15, 710. [Google Scholar] [CrossRef]
Figure 1. Six corn varieties used in this article.
Agriculture 15 01968 g001
Figure 2. The platform for corn seed kernel image collection.
Agriculture 15 01968 g002
Figure 3. Examples of data enhancement.
Agriculture 15 01968 g003
Figure 4. The structures of YOLOv11n.
Agriculture 15 01968 g004
Figure 5. The computational complexity and parameter distribution of YOLOv11n.
Agriculture 15 01968 g005
Figure 6. The structures of LWCD-YOLO.
Agriculture 15 01968 g006
Figure 7. The structures of C3K2 and C3K2_PC.
Agriculture 15 01968 g007
Figure 10. The structure of MSFFM.
Agriculture 15 01968 g010
Figure 8. The calculation process of standard convolution and PConv.
Agriculture 15 01968 g008
Figure 9. The structure of EMA.
Agriculture 15 01968 g009
Figure 11. Train and test loss curves.
Agriculture 15 01968 g011
Figure 12. Test results in the test set during model training.
Agriculture 15 01968 g012
Figure 13. Comparison of detection results between YOLOv11n and LWCD-YOLO on the test set.
Agriculture 15 01968 g013
Figure 14. Visualization results of YOLOv11n and LWCD-YOLO heat maps.
Agriculture 15 01968 g014
Figure 15. Comparison of detection effects between different attention modules and original YOLOv11n.
Agriculture 15 01968 g015
Table 1. Details of the corn seed kernel detection dataset.
Data TypeVarietySimple EnvironmentComplex Environment
Number of ImagesNumber of Target BoxesNumber of ImagesNumber of Target Boxes
Training
dataset
LP208242303202790
ZY303242304152606
ZD958222101243124
LH367201920121511
total9086287110,031
Test
dataset
CS5242304151633
LP206242304203078
total484608354711
Table 2. Structural parameters of the lightweight backbone network.
Layer Network Layer
Architecture
Stride Number of Output Channels Number of Modules Params FLOPs
(G)
1CBS21614640.10
2CBS232146720.24
3C3K2_PC164145760.24
4CBS264136,9920.48
5C3K2_PC1128117,9200.23
6CBS2128114,7720.47
7C3K2_PC1128152240.17
8CBS22561295,4240.24
9C3K2_PC12561207,3600.17
10SPPF12561164,6080.13
11EMA1256110,3680.06
Table 3. Test results based on YOLOv11n and LWCD-YOLO.
ModelsP
(%)
R
(%)
F1
(%)
mAP0.50
(%)
mAP0.75
(%)
mAP0.50:0.95
(%)
Params
(M)
FLOPs
(G)
Size
(MB)
FPS
YOLOv11n99.97999.97799.97899.48799.48799.1592.586.35.34144
YOLOv11s99.97299.97999.97599.47999.46899.1869.4120.218.4196
LWCD-YOLO99.97899.98999.98499.49199.49199.2621.273.52.68280
Table 4. Comparison of detection performance of different models.
ModelsP
(%)
R
(%)
F1
(%)
mAP0.50
(%)
mAP0.75
(%)
mAP0.50:0.95
(%)
Params
(M)
FLOPs
(G)
Size
(MB)
FPS
YOLOv5n99.96899.95799.96399.49199.49198.4501.764.13.66250
YOLOv8n99.96699.98999.97899.48299.48299.1513.008.15.95132
YOLOv9t99.95299.97999.96599.49399.49098.8372.8011.76.594
YOLOv10n99.95799.92299.94099.48399.48399.2002.276.55.51121
YOLOv11n99.97999.97799.97899.48799.48799.1592.586.35.34144
YOLOv12n99.94699.94699.94699.48699.48599.1242.535.85.27125
YOLOv13n99.96499.97999.97299.48399.48299.2222.456.15.24112
LWCD-YOLO99.97899.98999.98499.49199.49199.2621.273.52.68280
Table 5. Ablation experiment results.
ModelsP
(%)
R
(%)
F1
(%)
mAP0.50
(%)
mAP0.75
(%)
mAP0.50:0.95
(%)
Params
(M)
FLOPs
(G)
Size
(MB)
FPS
YOLOv11n99.97999.97799.97899.48799.48799.1592.586.35.34144
+A99.97599.98999.98299.48599.48599.1602.165.74.50160
+B99.97299.98999.98199.49399.49399.1601.694.13.52218
+C99.97799.98999.98399.48999.48999.2072.586.35.34164
+A + B99.97899.98999.98499.49099.49099.2051.273.52.68257
+A + C99.96899.97999.97399.48299.48299.1702.165.74.50170
+B + C99.97899.97999.97899.49299.49199.1611.694.13.52245
+A + B + C
(LWCD-YOLO)
99.97899.98999.98499.49199.49199.2621.273.52.68280
Table 6. Comparative experimental results of different attention mechanisms.
ModelsP
(%)
R
(%)
F1
(%)
mAP0.50
(%)
mAP0.75
(%)
mAP0.50:0.95
(%)
Params
(M)
FLOPs
(G)
Size
(MB)
FPS
YOLOv11n99.97999.97799.97899.48799.48799.1592.586.35.34144
D + CPCA99.97899.98999.98499.49099.49099.2591.393.72.92296
D + MPCA99.97899.97999.97899.48999.48699.2491.593.53.30231
D + SimAM99.97899.89399.98499.48899.48899.1561.263.52.67305
D + MLCA99.97899.98999.98399.48999.48999.2361.263.52.67301
D + CAFM99.97599.97999.97799.48899.48899.2101.613.83.33142
D + AFGA99.97899.97999.97899.48999.48999.2271.323.52.80237
D + ECA99.97899.97999.97899.48699.48299.1661.263.52.67315
D + CBAM99.97899.97999.97899.48999.48099.2191.333.52.80271
D + EMA
(LWCD-YOLO)
99.97899.98999.98499.49199.49199.2621.273.52.68280
Table 7. Comparative experimental results of different regression box positioning loss functions.
ModelsP
(%)
R
(%)
F1
(%)
mAP0.50
(%)
mAP0.75
(%)
mAP0.50:0.95
(%)
FPS
E + CIoU99.97999.97799.97899.48799.48799.159257
E + SIoU99.97899.98999.98499.49199.49199.258275
E + GIoU99.97899.98999.98499.48999.48899.199267
E + EIoU99.97899.97999.97899.49699.49699.259273
E + DIoU99.97899.97999.97899.49399.49199.250261
E + ShapeIoU99.97899.98999.98499.49199.49199.200241
E + WIoU
(LWCD-YOLO)
99.97899.98999.98499.49199.49199.262280
Disclaimer/Publisher’s Note: The statements, opinions and data contained in all publications are solely those of the individual author(s) and contributor(s) and not of MDPI and/or the editor(s). MDPI and/or the editor(s) disclaim responsibility for any injury to people or property resulting from any ideas, methods, instructions or products referred to in the content.