Article

Design and Experiment of a Multi-Duct Air-Delivered Sprayer for Closed Apple Orchards

1
College of Agricultural Engineering, Shanxi Agricultural University, Jinzhong 030801, China
2
Dryland Farm Machinery Key Technology and Equipment Key Laboratory of Shanxi Province, Jinzhong 030801, China
*
Author to whom correspondence should be addressed.
Agriculture 2025, 15(18), 1958; https://doi.org/10.3390/agriculture15181958
Submission received: 9 August 2025 / Revised: 13 September 2025 / Accepted: 14 September 2025 / Published: 17 September 2025
(This article belongs to the Section Agricultural Technology)

Abstract

A self-propelled multi-duct air-delivered sprayer was developed to address the challenges of dense canopies and low pesticide utilization in closed-canopy apple orchards. It featured an intelligently adjustable spray bar and formed a directional air curtain via a centrifugal fan and a duckbill air outlet to improve droplet penetration. Using CFD simulations, the air duct size and the air outlet distance were optimized, and the field orthogonal test was carried out with driving speed, nozzle pressure, and nozzle type as factors. The results showed that the optimal parameters were an air duct size of 230 × 110 mm, an air outlet distance of 350 mm, and a fan speed of 2160 r/min. Compared to liquid pump independent operation, liquid pump–fan cooperative operation significantly increased droplet deposition density (p < 0.05) and reduced the degree of dispersion. All three factors significantly influenced deposition density (p < 0.05), and nozzle type had the greatest influence on deposition density, followed by nozzle pressure, and then driving speed. Optimal performance was obtained at a 0.3 m/s driving speed, a 3 MPa nozzle pressure, and a 6502 nozzle type. Under the optimal combination of operating parameters, field verification tests demonstrated that cooperative operation achieved higher average coverage (60.54% vs. 48.30%) and average deposition density (71.34 vs. 60.54 droplets/cm2), with a more uniform coefficient of variation in droplet coverage on leaves (a range of 13.37–19.07% vs. 9.70–22.67%). These results indicate that the sprayer exhibits strong penetration and provides good uniform coverage, effectively increasing droplet deposition across different canopy heights.

1. Introduction

As a deciduous leaf tree of the Rosaceae family [1], apple trees produce fruits that are rich in dietary fiber, vitamins, minerals, and polyphenols, with high nutritional value [2]. China is a global leader in apple cultivation and production [3], and its dominant apple-producing regions are in the Loess Plateau and Bohai Bay [4]. Shanxi Province, as a representative production region of the Loess Plateau [5], produces apples with regular shape and bright color, but most mountain orchards in this region adopt the planting mode of dense planting with standard rootstocks, which tends to cause problems such as canopy density and disorder with the growth of tree age [6]. In the closed orchard, the intertwined branches and narrow space make it difficult for large and medium-sized plant protection sprayers to gain access [7,8]; at present, plant protection is still primarily performed by manual labor [9], which has disadvantages such as high labor intensity, low operation efficiency [10], low pesticide utilization rate [11], and high health risks for operators [12]. As core equipment for orchard pest control, air-delivered sprayers can use high-velocity airflow to propel droplets into the canopy. This enhances droplet penetrability and coverage, reduces drift, improves deposit effectiveness, increases pesticide utilization, and raises operational efficiency [13,14,15,16].
In recent years, domestic and foreign scholars have made various improvements to sprayer structures to enhance the uniformity of droplet distribution and increase the utilization rate of pesticides. The air-delivered variable-rate sprayer developed by Zhu et al. [17] features a multi-channel cylindrical nozzle (with a PWM solenoid valve for flow control) and an inner diameter-adjustable fan, which enables the precise dual control of air volume and flow rate. However, its bulkiness and high cost make it difficult to be widely adopted in closed orchards. The COMMANDER sprayer improved by Gil et al. [18] reduces the drift by 90% and increases the driving speed to 12 km/h through the TWIN FORCE system. However, its operating performance on complex terrains has not been verified, no cost–benefit analysis has been conducted, and its energy consumption has not been quantified. The axial-flow air-delivered sprayer designed by Ru et al. [19] maintains an effective wind velocity of 1.5 m/s at a distance of 4 m by optimizing the guide vane structure and implementing multiple conical air outlets, resulting in a more uniform droplet distribution and a 15% reduction in pesticide usage. However, its parameter design targets only a single orchard condition without considering the dynamic airflow demands in heterogeneous canopy environments, which limits its popularization and applicability. The crawler self-propelled orchard sprayer developed by Jiang et al. [20] innovatively integrates ultrasonic sensors and the Internet of Things technology to create an adaptive automatic target spraying system. This system allows for the adjustment of operational parameters via a mobile terminal, enabling real-time target perception and remote control. Its travel system, featuring an omnidirectional steering crawler chassis with a minimum turning radius of only 1.5 m, adapts to narrow orchard terrain and improves passability in close-planted orchards. The optimized air delivery system has increased droplet deposition by 34.57%, the intelligent intermittent spraying mode has reduced pesticide residue, and overall working efficiency has increased by 40% compared with the traditional model. However, the ultrasonic sensor used in this machine is easily affected by shade from branches and leaves, as well as humidity changes in complex orchard environments, which limits the equipment’s applicability in closed orchards. Song et al. [21] elevated the top wind velocity to 17.7 m/s and reduced the coefficient of variation for airflow uniformity to less than 0.3% by optimizing the deflector angle and length of a tower-type air sprayer. However, the deflector adjustment relied on manual operation, which often resulted in airflow deviation. Zhang et al. [22] developed a double flexible air duct spraying device. Field tests showed that the average droplet density in the canopy was 35.38 droplets/cm2, with a distribution pattern of lower layer > middle layer > upper layer, conforming to the technical requirements for tall spindle-shaped fruit trees. Domestic and international studies on air-delivered sprayers focus on standard orchards, while there are relatively few studies on multi-duct air-delivered sprayers for closed mountain orchards.
At the same time, Chinese and foreign scholars have applied CFD simulation technology to the design of spraying machines and achieved notable results. Duga et al. [23,24] analyzed droplet deposition and drift rates by CFD simulation combined with fruit tree structure, canopy airflow, and nozzle velocity. They verified that the tunnel-type sprayer can effectively reduce crosswind interference and examined the influence of air outlet structures in three airflow-assisted systems. Delele et al. [25] used a transient CFD model combined with Lagrangian particle tracking and a moving boundary to simulate the dynamic characteristics of a sprayer, and the results showed that the transient velocity profile closely matched the experimental data. Endalew et al. [26] built a three-dimensional canopy structure model and incorporated CFD simulation to quantify the influence of canopies on airflow, accurately capture the characteristics of wind velocity distribution around canopies, and support the visualization of the flow field in areas of varying density. Yang et al. [27] applied a Laval nozzle as the air-assisted nozzle. The CFD simulation showed that the end wind velocity increased by a remarkable 152.42%, the standard deviation of uniformity was only 0.66, and the turbulence zone error was 8.5% according to the experimental verification. Niu et al. [28] designed a three-finger air-delivered sprayer for hilly citrus orchards and verified the uniformity of air distribution via CFD simulation. They found that the air delivery angle affected drift beyond 1 m, achieved a field deposition rate of 53.7%, and obtained a field deposition ratio between inner and outer layers of 0.444. To address the plant protection needs of hilly citrus orchards, Huang et al. [29] analyzed the airflow characteristics and droplet deposition effects of an air-delivered sprayer based on CFD simulation technology and appropriately matched the fan velocity, spray pressure, and spray distance, which optimized the droplet deposition effect, improved spray uniformity, and increased the pesticide utilization rate. The above analysis shows that CFD simulation technology can be used to describe the coupling characteristics between the complex airflow and droplet movement in orchard pesticide spraying and to provide data support for optimizing spraying parameters and equipment structural designs.
Based on the agronomic requirements of closed apple orchards, this study designed a multi-duct air-delivered sprayer, which is mainly composed of a high-pressure spraying waterway, an intelligently adjustable vertical spray bar, and a multi-duct air-delivery system. Powered by a tracked unmanned vehicle, this sprayer enables self-propelled operation with stepless speed change from 0 to 1.5 m/s. The spray bar width and height are adjusted via a multi-dimensional electric push rod. Utilizing flexible air ducts with duckbill outlets, the airflow further atomizes the liquid sprayed from the nozzles and directs it toward the fruit trees, enhancing droplet penetration and coverage uniformity. Single-sided or double-sided pesticide spraying can be remotely controlled via the control circuit. This makes the sprayer suitable for a closed orchard with varying row and plant spacing, as well as for trees of different ages.
In this paper, the air duct size, air outlet distance, and fan speed were optimized through CFD simulation to determine the optimal structural parameters, and a multi-duct air-delivered device was developed. A field orthogonal experiment was conducted, with driving speed, nozzle pressure, and nozzle type as factors, to obtain the leaf droplet deposition density under liquid pump–fan cooperative operation and liquid pump independent operation modes. The influence of the experimental factors on the droplet deposition density was analyzed, and the optimal combination of operating parameters was identified. Field verification tests were carried out under this parameter combination to explore the droplet penetration capacity and coverage uniformity under cooperative operation modes. This study provides a theoretical basis and technical support for the development of intelligent multi-duct air-delivered equipment in closed orchards, contributing to improved spraying uniformity and penetration.

2. Materials and Methods

2.1. Overall DesignComplete Machine Structure and Working Principles

2.1.1. Design Requirements

According to reference [30] and field investigation, it is established that the row spacing in closed orchards typically ranges from 2 to 4 m, the plant spacing from 1 to 3 m, and the tree height from 3 to 4 m; the effective working channel width is 1.2–1.8 m, the canopy leaf area index is 3.8–4.5, the soil moisture content is 15–25%, the crown width is 3 m, the crowns are overlapping, and the height from the ground is less than 1.2 m. With reference to the Evaluating Regulations for the Operation and Spraying Quality of Sprayers in the Field (GB/T 17997-2008) [31], Operating Quality for Sprayers (NY/T 650-2013 Sprayers) [32], and Agricultural and Forestry Machinery-Inspection of Sprayers in Use (GB/T 32250.1-2022) [33], the designed multi-duct air-delivered sprayer should meet the following technical requirements tailored to the planting agronomic mode and the agronomic requirements for fruit tree spraying in closed orchards:
(1)
Passability and spatial adaptability. For orchards with the cropping pattern of dense planting with standard rootstocks, the management is predominantly handled by small-scale farmers, with canopy maintenance relying mainly on conventional pruning; after the trees enter the full fruiting stage, trees develop relatively short trunks and have numerous main branches, resulting in overlapping canopies and narrow rows in closed orchards; the orchard canopy density ranges from 0.49 to 0.93 [34]. A compact structure was adopted for the sprayer, and the height of the complete machine was less than 1.2 m, ensuring passability in low spaces. The unilateral spraying width was greater than 2 m to cover the canopy crossing areas; the longitudinal spraying height was greater than 3 m, and the penetration of droplets in dense canopies was enhanced by combining multi-duct directional air delivery technology, meeting the pesticide application needs of different fruit tree shapes.
(2)
Spraying operation quality and parameter control. To ensure operation quality, the driving speed of the sprayer should be less than 1.5 m/s to reduce missed spraying and re-spraying; the spray volume was greater than 4 L/min to ensure effective, comprehensive coverage of liquid chemical; meanwhile, the powerful airflow produced by the air delivery system could enhance the penetration of droplets and improve the droplet deposition effect inside canopies and on the back surfaces of leaves.
(3)
Dynamic adjustable structure and adaptability optimization. The sprayer should be designed with a height- and width-adjustable spray bar to adapt to the growth stages of different fruit trees in closed orchards and to the tree shape changes after intermediate pruning and transformation. The dynamic agronomic needs of orchards can be satisfied by flexibly adjusting spraying parameters, thereby improving the sprayer’s working efficiency.
(4)
Terrain adaptability and power abundance. Given the large slope and scattered plots in mountain orchards, the travel system was improved, and the sprayer had the climbing ability of ≥25° due to its range-extended engine and a crawler-type chassis structure; the weight of the complete machine was reduced by using lightweight materials; an extended-range power system was adopted to guarantee endurance; and the suspension system provided shock absorption and stability, mitigating the influence of bumpiness on spraying uniformity and ensuring continuous operational capability under complex terrains.

2.1.2. Complete Machine Structure and Working Principles

The “compact chassis + adjustable spray bar” layout was employed for the multi-duct air-delivered sprayer. The structural diagram of the complete machine is displayed in Figure 1 and mainly includes high-pressure nozzles, vertical spray bars, duckbill air outlets, a horizontal electric push rod, plunger pumps, bellows, splitters, vertical electric push rods, a storage battery, a mounting base, a centrifugal fan, crawlers, frames, driving motors, a range extender, pressure gauges, a liquid chemical storage tank, and a shell, etc.
The sprayer was powered by a self-propelled crawler-type unmanned vehicle and was fixedly connected to the longitudinal beam of the chassis of the unmanned vehicle through the mounting base (connecting plate and connecting pin). Flexible multi-duct air-delivered spraying was adopted, and the structure was mainly composed of a spraying waterway, an adjustable vertical spray frame, and a multi-duct air delivery system. Before the spraying machine was operated, according to the agronomic characteristics of the closed apple orchard, the nozzle angle of the spray bar was adjusted, and the height and width of the vertical spray bar were adjusted by a multi-dimensional electric push rod, so that the width and height of the spray bar of the multi-duct sprayer were adjusted to obtain a better spraying mode. During operation, the lithium battery of the unmanned vehicle synchronously supplied power to the sprayer and the centrifugal fan. In case of a shortage of battery power supply, the range extender of the unmanned vehicle burned gasoline to supply electric energy, thus realizing long battery life for the sprayer. The driving motor of the crawler chassis was controlled by the lever on the remote controller to complete the actions of the sprayer, such as moving forward, backward, and turning, so as to realize self-propelled spraying with a stepless velocity change of 0–1.5 m/s. The spray switch on the remote controller was used to control the chemical delivery motor to transmit power to the plunger pump, which sent the liquid chemical from the water outlet of the chemical tank to the nozzle through the plunger pump, the pipeline, the spray bar, and the pressure gauge, and the liquid chemical was sprayed by the nozzle; the excess liquid chemical was circulated to the chemical tank through the plunger pump, the reflux valve, the return line, and the return port, which provided a dynamic pressure stabilizing role, thus realizing the remote control of unilateral or bilateral spraying. The two air outlets of the centrifugal fan were connected with 6 flexible air outlet pipes through the splitter, and the liquid chemical sprayed by the nozzle installed at the outlet of the flexible air outlet pipe was refined further by the airflow of the duck-billed air outlet of the flexible air outlet pipe and then blown to the fruit tree plants to ensure that the droplets evenly covered the whole tree and to complete the multi-duct air-delivered spraying. The main technical parameters of the multi-duct air-delivered sprayer are shown in Table 1.

2.2. Key Components and Main Parameters

2.2.1. Waterway Design for the High-Pressure Atomization System

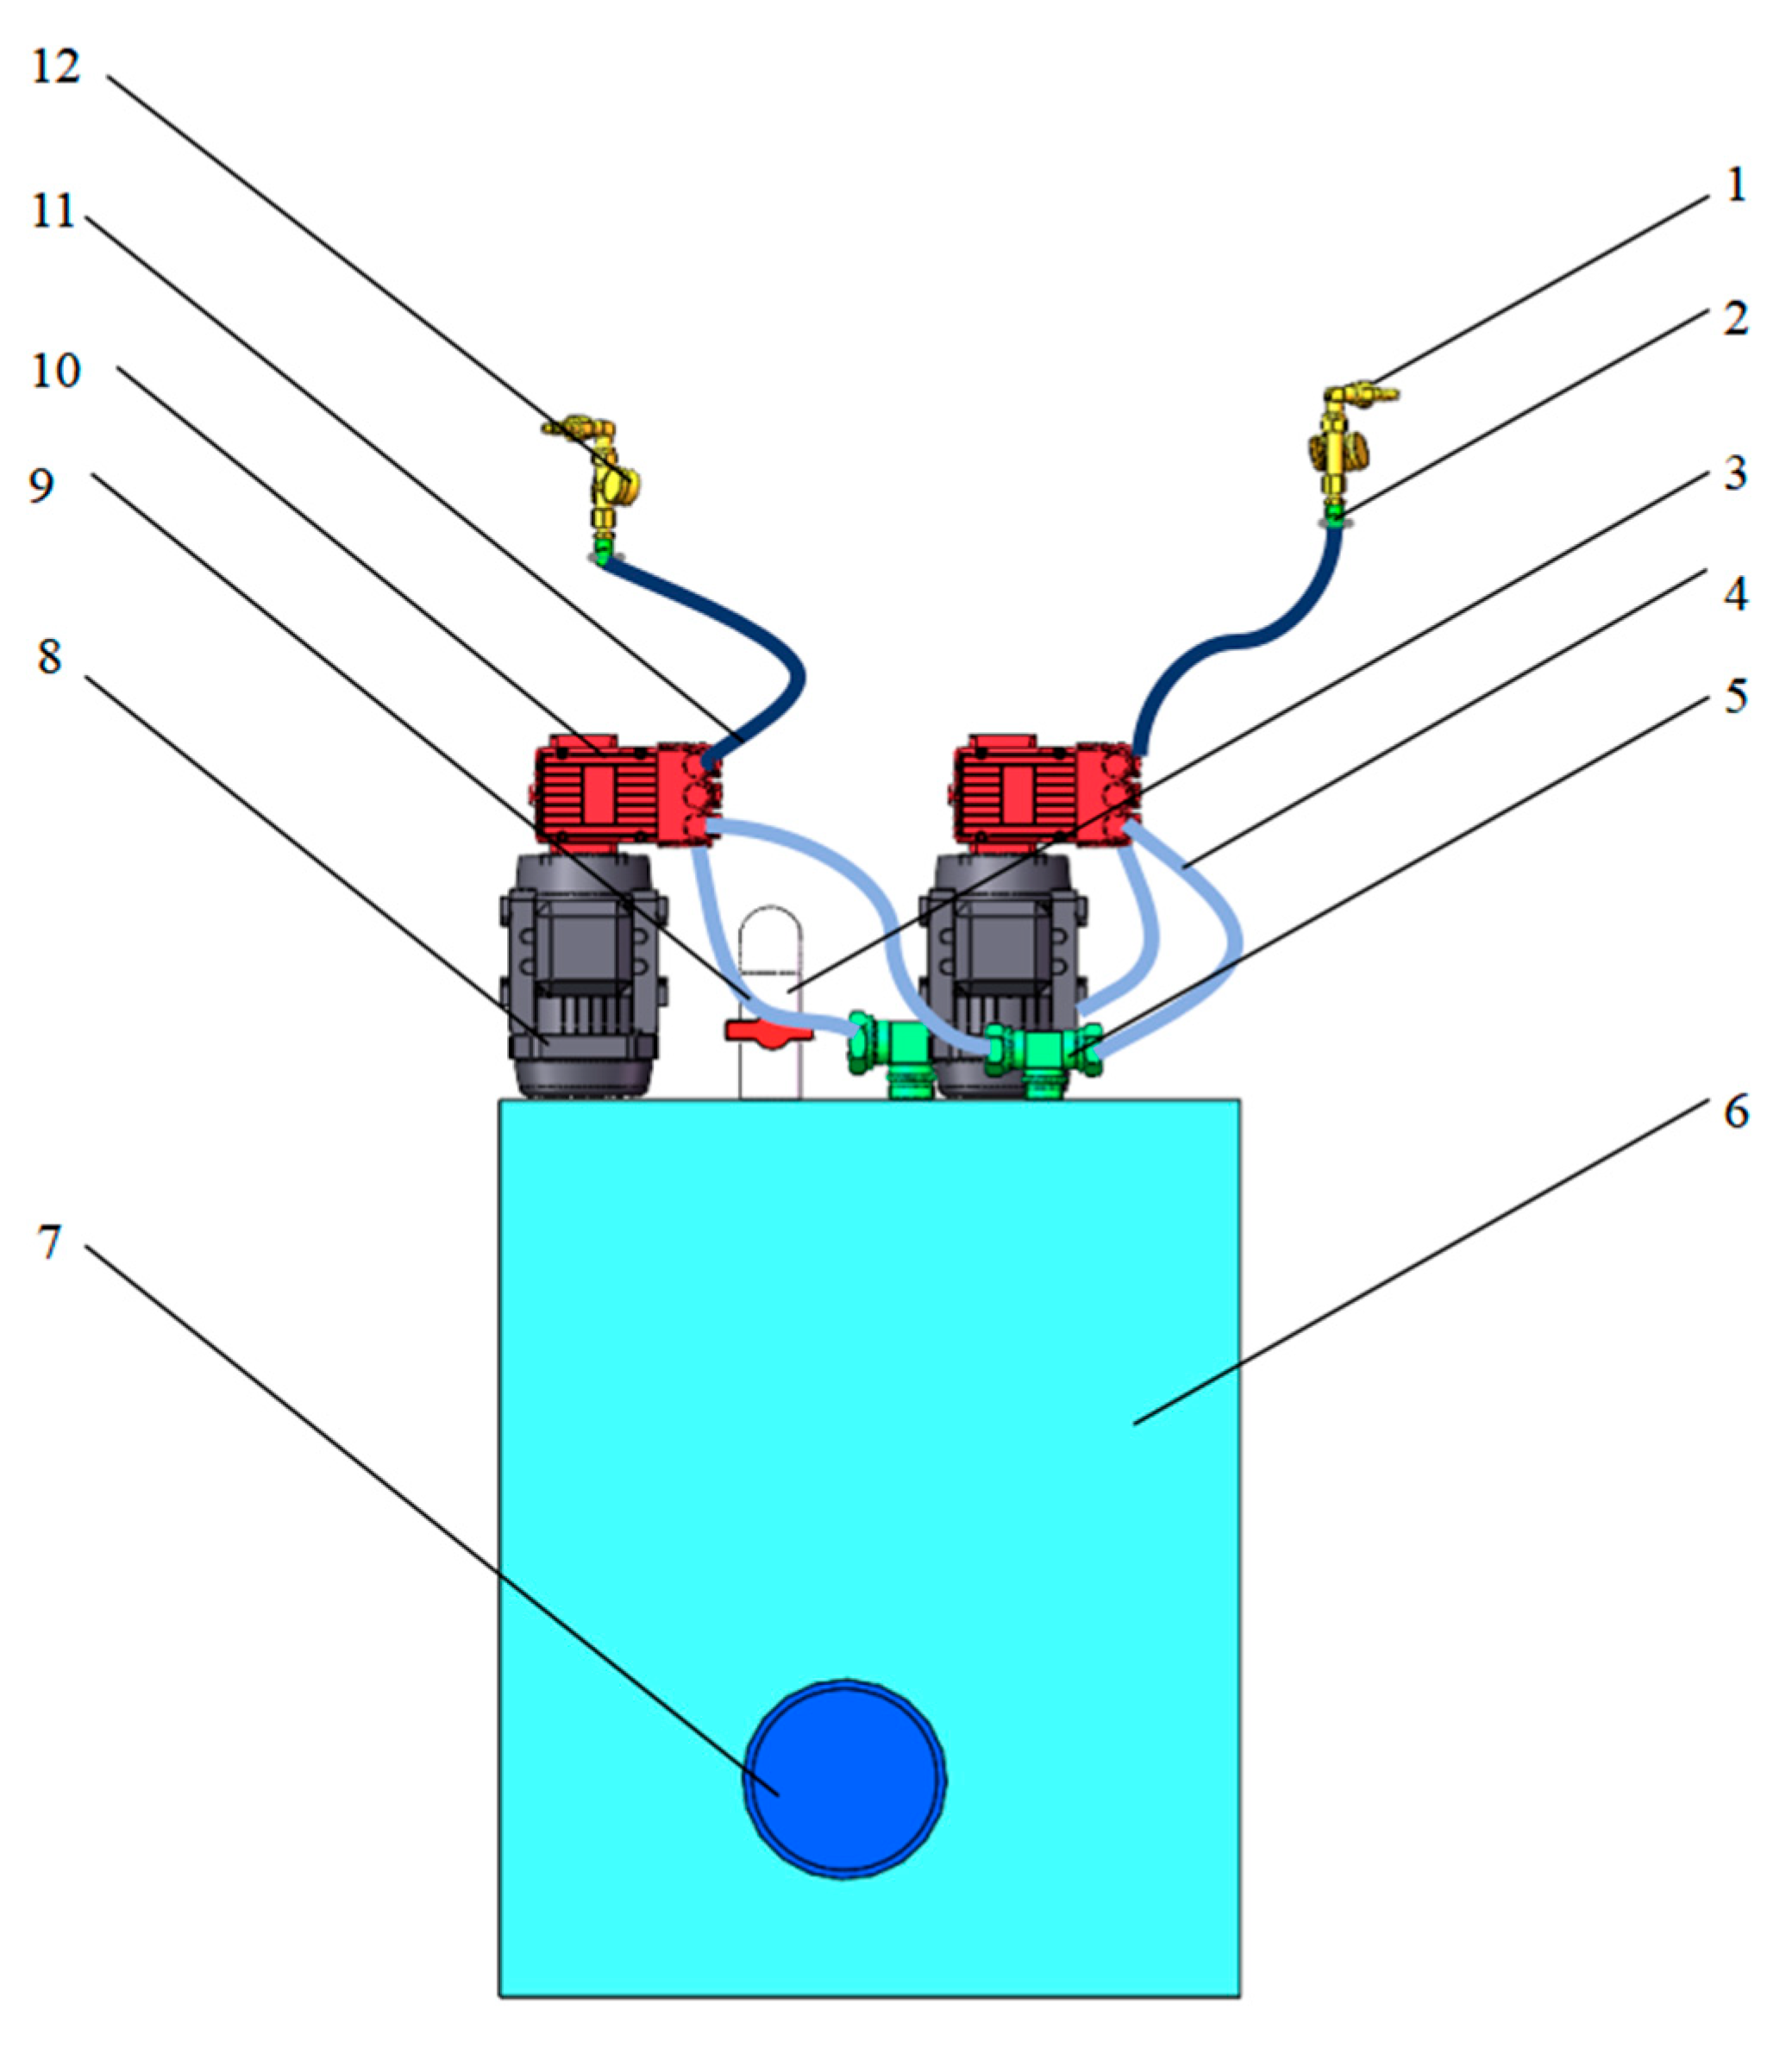
Due to the height of the fruit trees and overlapping branches and leaves in the closed apple orchard, and to meet the requirements of plant protection and ensure the effect of pesticide application, a high-pressure atomization system was adopted in the pesticide spraying waterway, and its core components included two high-pressure plunger pumps, two corresponding motors, a liquid chemical storage tank, two vertical spray bars, fan-shaped nozzles, high-pressure water delivery pipelines, and a drain outlet. The layout structure of the waterway is shown in Figure 2. A base frame was mounted on the power chassis of the crawler unmanned vehicle and was equipped with a liquid chemical tank, high-pressure plunger pumps, corresponding motors, high-pressure water delivery pipelines, and other components; the liquid chemical tank was made of 300 L polyethylene (treated with mildew inhibitor), and the bottom was designed with a 5° inclination and a two-stage filtration system (comprising a stainless steel filter screen and a polyester fiber filter membrane) to effectively prevent impurities from blocking the nozzle; the atomization unit was driven by an MN1408 (Zhejiang Pinbang Machinery Technology Co., Ltd., Taizhou, Zhejiang, China) three-cylinder plunger pump (flow rate: 5–12 L/min; pressure: 12 MPa) and paired with the fan-shaped nozzle to realize efficient spraying; the spray bar was made of high-strength aluminum alloy (wall thickness: 3 mm), and the height and width of the spray bar could be adjusted remotely by an electric push rod; the outlet of the plunger pump to the spray bar was lined with a PTFE high-pressure water delivery pipeline with a pressure resistance of 20 MPa, and right-angle bending of the pipeline was avoided to reduce pressure fluctuations; a pressure relief valve was arranged at the end to ensure the uniformity of the atomization system.

2.2.2. Multi-Duct Air-Delivered System Design

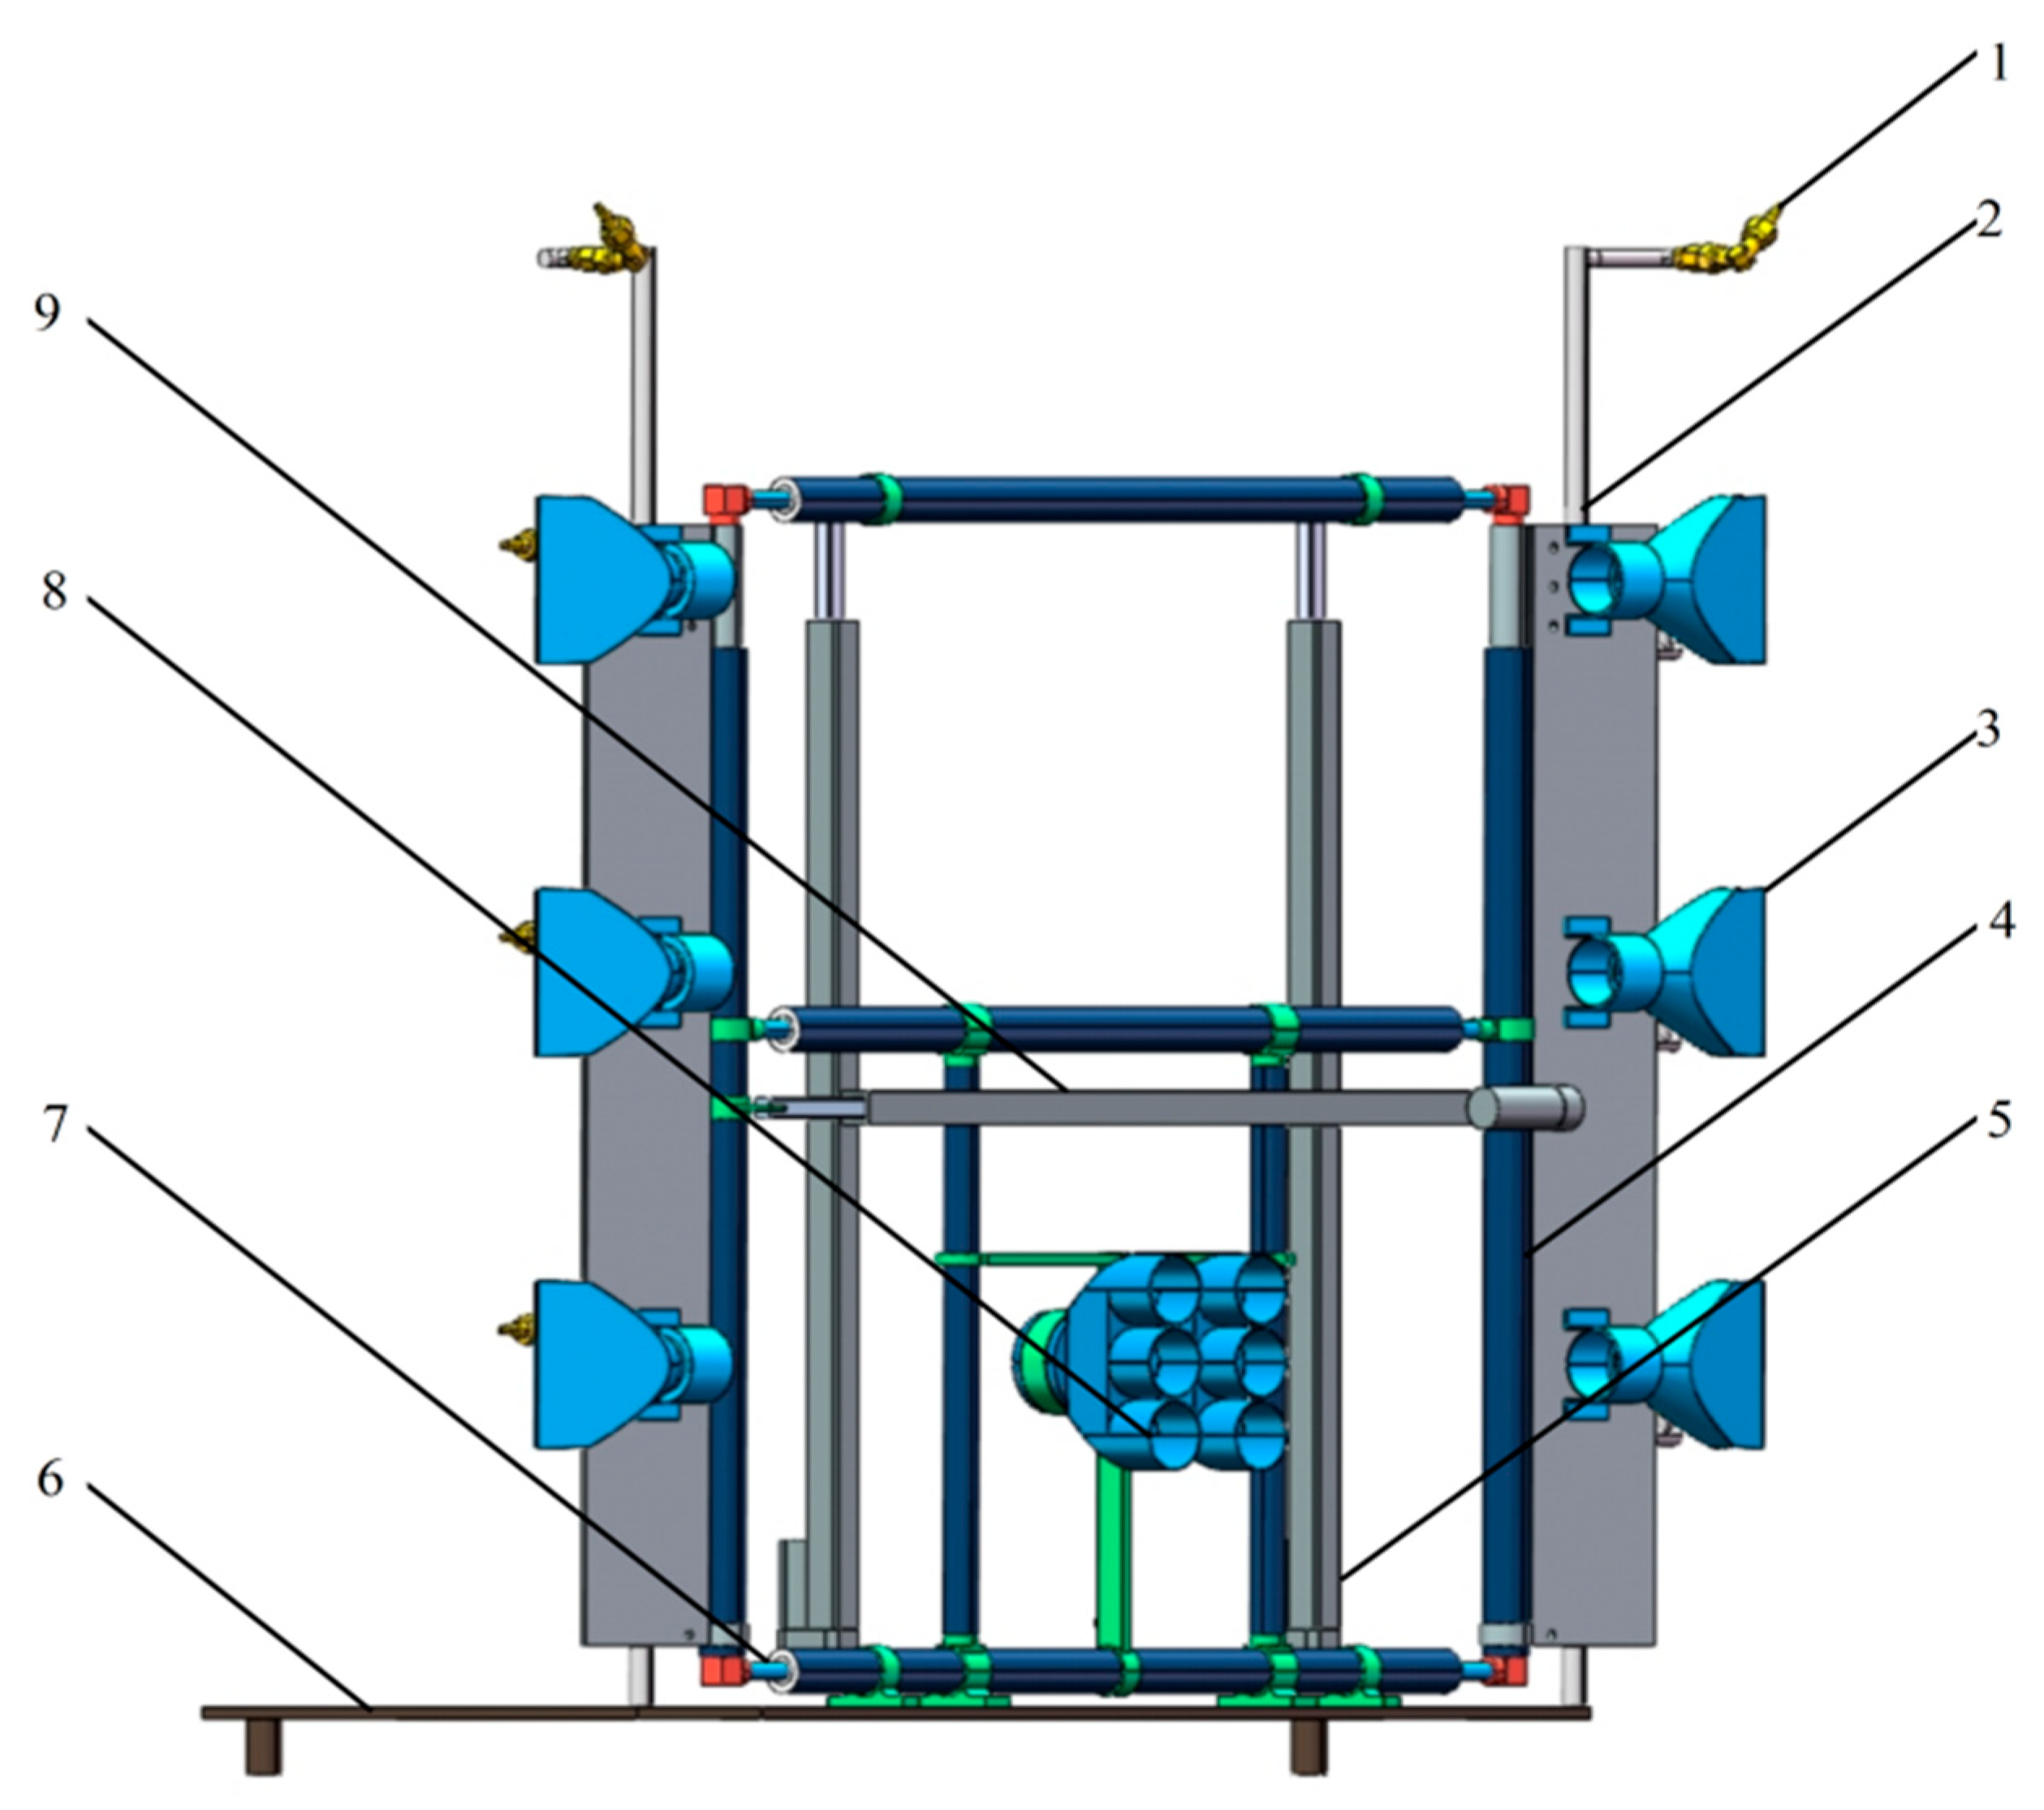
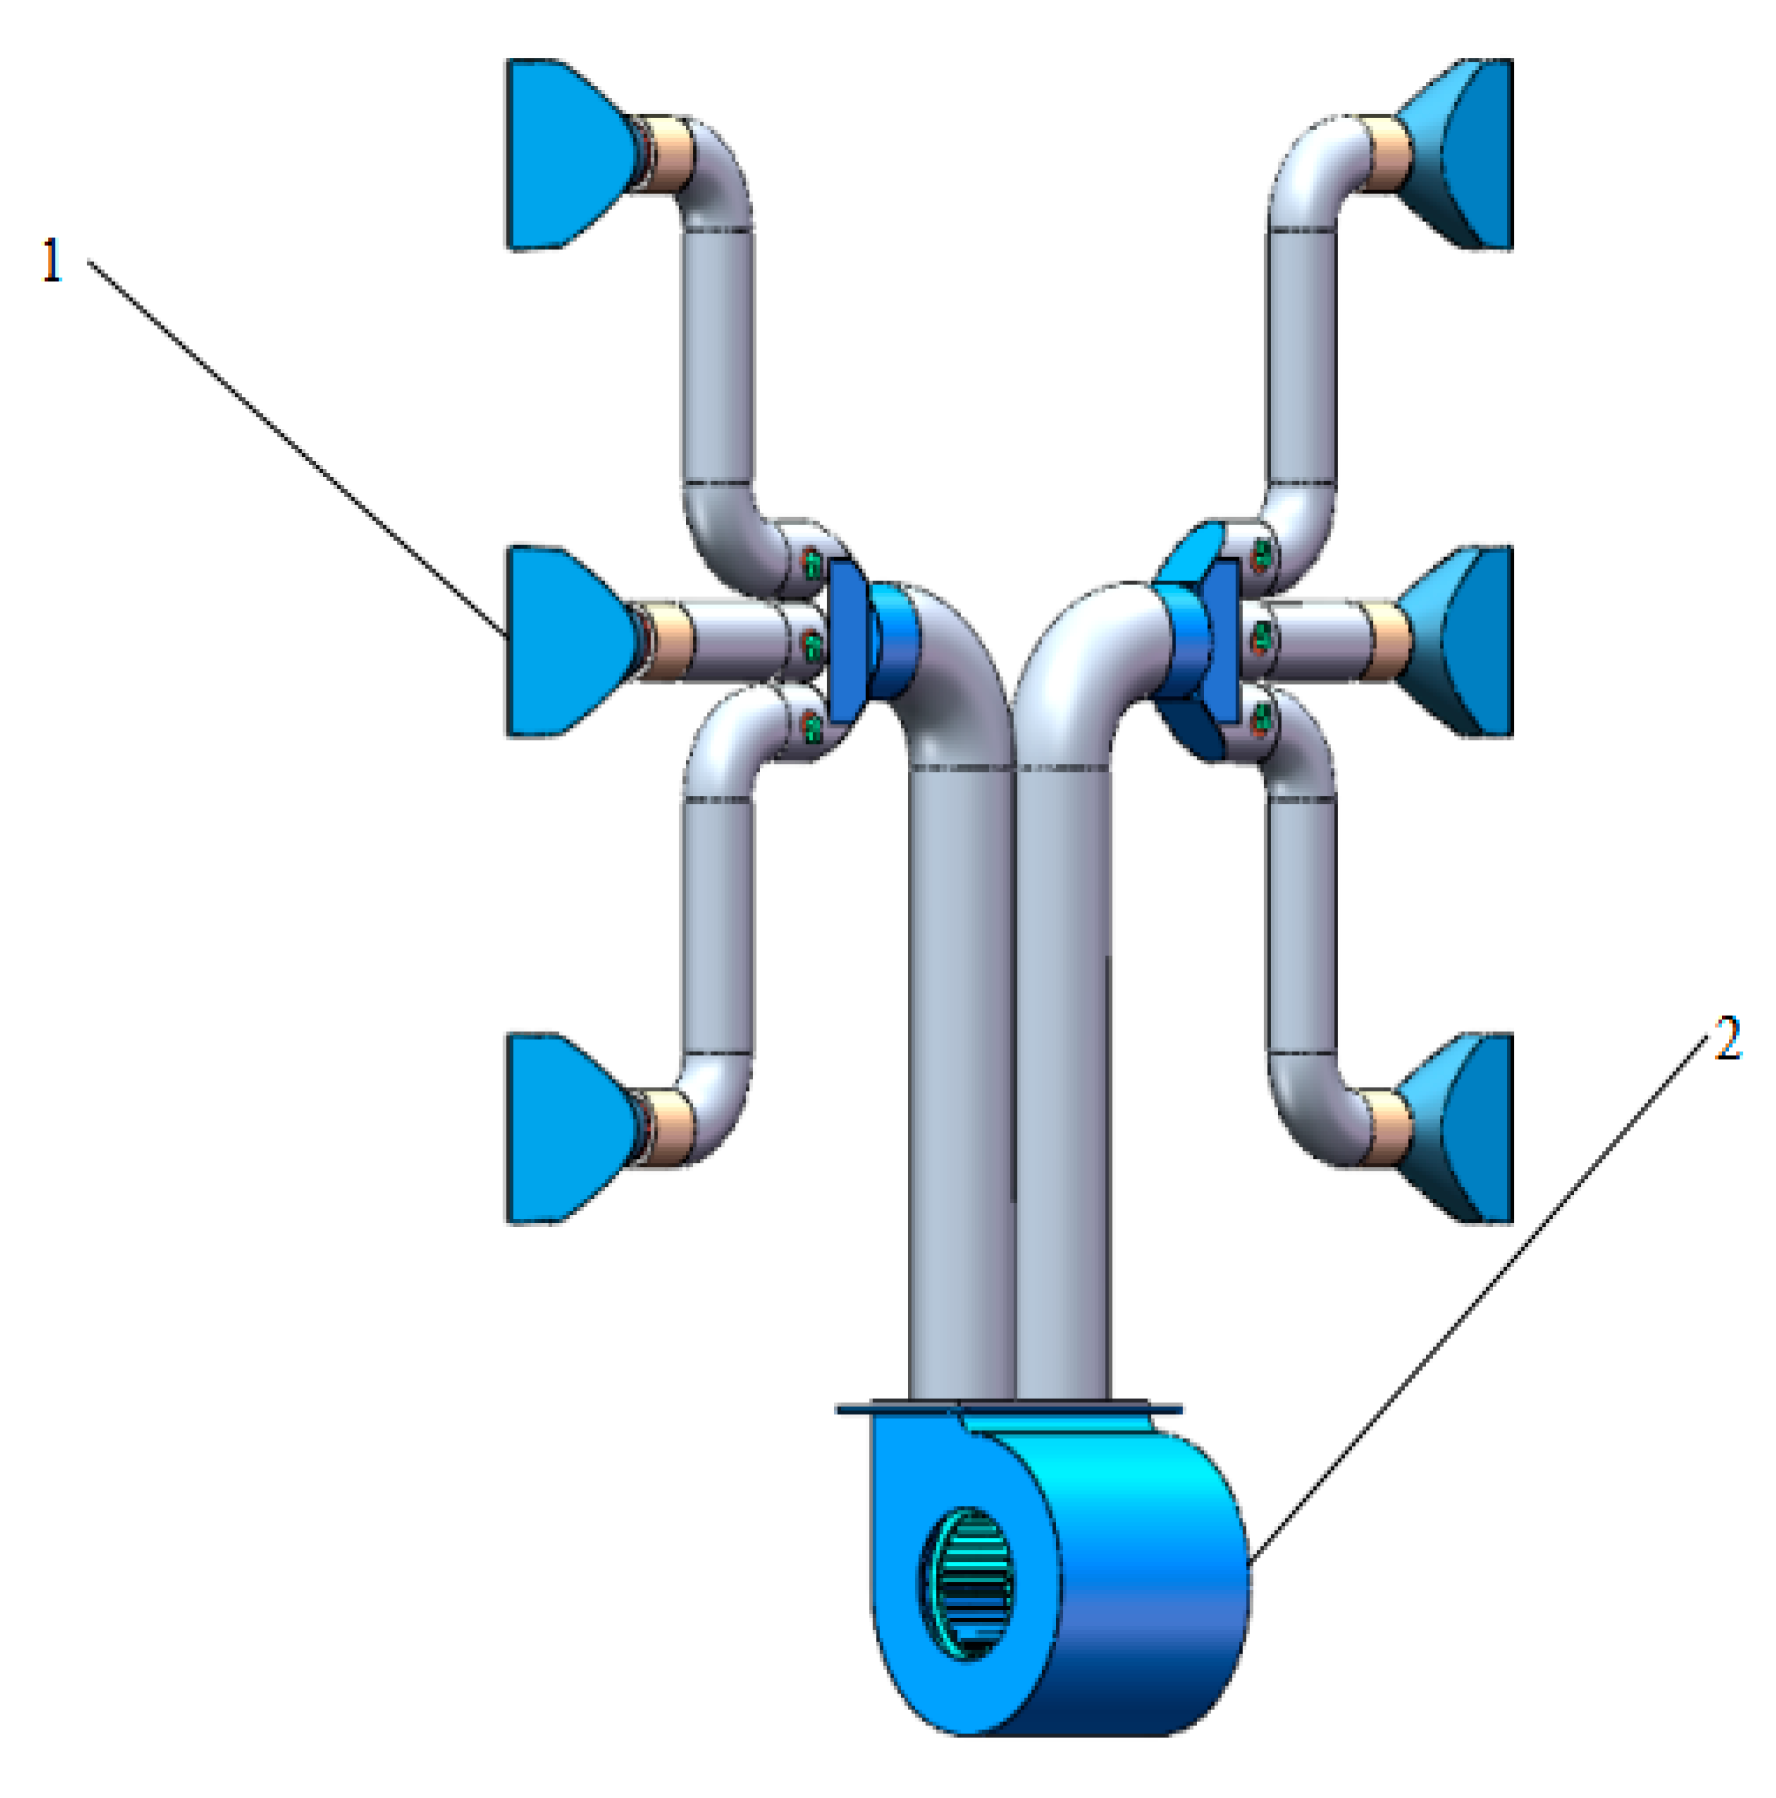
With the help of high-velocity airflow, droplets can be atomized secondarily, which can significantly improve the penetration of droplets in the canopies of fruit trees, reduce their drift loss caused by environmental wind, and enhance the uniformity of droplet adhesion on the surface of branches and leaves. To increase the utilization rate of pesticides, a multi-duct air delivery device was designed, which was mainly composed of nozzles, duckbill air outlets, vertical spray rods, a horizontal electric push rod, chrome-plated steel pipes, two splitters, two vertical electric push rods, optical axes, a mounting base, and other components, as shown in Figure 3. To meet the wind volume demand of spraying operations in closed apple orchards, a centrifugal fan with symmetrical left and right air ducts was adopted. When the air flows through the impeller of the centrifugal fan, it is centrifugally accelerated, forming a high-pressure radial airflow perpendicular to the axial direction, which can penetrate the dense canopies with low porosity and spray trees vertically. Each air duct of the centrifugal fan is separately equipped with a one-in-three-out splitter, which is connected to three duckbill air outlets through pressure-resistant corrugated hoses to form a six-channel three-dimensional air supply structure. As the core distribution component in the air delivery system, the splitter is mainly responsible for the distribution and directional guidance of airflow. The splitter distributes the airflow of the main air duct to the three branch air ducts; each branch is equipped with an independent air volume control valve, which enables the high-velocity airflow generated by the centrifugal fan impeller to be evenly distributed to the three branches. This not only improves the uniformity of airflow distribution but also enhances the flexibility and stability of the system. The air outlet is an important discharge component of the air delivery system, which evenly distributes the high-velocity airflow generated by the centrifugal fan evenly to the target area; the flat diffusion of duckbill outlets can reconstruct the distribution of the airflow field, enlarge the cross-sectional area of the air outlet, reduce the local peak wind velocity, and contribute to a more uniform airflow. Meanwhile, the duckbill structure can reduce the vortex and backflow of the airflow, ensure that the air flows in the predetermined direction, and effectively reduce the waste and drift of liquid chemicals. The angle of the duckbill air outlets can be adjusted, and the direction of the airflow can be accurately controlled, which can meet the needs of different spraying environments.
(1)
Air volume of the fan
In the actual spraying operation of the air-delivered sprayer, the airflow accelerates the role of accelerating the droplets of the liquid chemical, disturbs the fruit tree canopies, and regulates the microenvironment. The air volume of the fan should be calculated following the principles of replacement and final velocity. As per the former principle, the original air from the air outlet to the fruit tree canopies needs to be completely replaced by the airflow generated by the fan in a unit time. Therefore, in the calculation process, such factors as the driving speed of the sprayer, the target distance, and the geometric parameters of the fruit tree canopies should be comprehensively considered to ensure that the airflow can effectively replace the air in the gaps within the canopies of the fruit tree. Thus, the air volume generated by the unilateral fan duct is required to replace all the air between the air outlet and the fruit tree, and the calculation formula for the air volume is as follows:
Q c = V e ( H 1 + H 2 ) L K 1 2
where Q c is the air volume replaced within unit time, m3/s; Ve is the operating velocity of the sprayer under standard working conditions, m/s; H 1 is the total height of duckbill air outlets, m; H2 represents the canopy height of fruit trees in the closed orchard, m; L denotes the distance between the duckbill air outlet and the fruit tree, m; K1 is the airflow attenuation coefficient, generally taken as K1 = 1.3–1.6 [35].
Having met the replacement principle, the air volume of the sprayer also needs to meet the final velocity principle so as to ensure that the residual velocity of airflow from the fan remains above an empirical threshold when reaching the canopy of the fruit tree, and that the airflow can overcome the canopy resistance and carry the droplets into the inner part of the fruit tree. According to the final velocity principle, the calculation formula for the air volume of the fan is as follows:
Q = Q c K 2 = V e ( H 1 + H 2 ) L K 1 K 2 2
where Q is the air volume generated by the centrifugal fan, m3/s; K2 is a coefficient determined according to the air volume loss, generally taken as K2 = 1.3–1.8 [35].
Q = H 2 F V 2 = H 1 F V 1 K 2
where F denotes the travel distance of the sprayer within unit time, m; V1 represents the air outlet velocity of the centrifugal fan, m/s; V2 is the final velocity when the airflow reaches the fruit tree, generally taken as V2 = 9–10 m/s [35].
According to the planting agronomic characteristics of closed apple orchards, the values Ve = 0.6–1.0 m/s, H1 = 1.5 m, and H2 = 2.5–3.0 m are generally used; L = 1.2–1.5 m. These values are substituted into Formula (2) to obtain Q = 2.43–9.72 m3/s. Taking Q = 10,000 m3/h = 2.78 m3/s as the selected value, the value is substituted into Formula (3) to obtain V1 = 18.2–51.79 m/s. Thus, the spraying effect can reach the specified requirement when the air outlet velocity of the sprayer falls within this range.
(2)
Adjustable vertical lifting device
To meet the agricultural needs of apple orchards with different planting patterns, an intelligent lifting device was designed (Figure 3). The device combines an extensible frame with an electric push rod, enabling intelligent adjustment of the height and width of the spraying unit. A high-strength chrome-plated hollow circular tube and a chrome-plated optical axis are adopted, combined with linear bearings, allowing the device to flexibly expand and contract in both vertical and horizontal directions; at the same time, the two-axis electric push rod drive system is used to adjust the height and width, respectively, and the height adjustment system is equipped with two electric push rods, enabling adjustment to any height within the range of 1.0–1.5 m; the width adjustment system is equipped with one electric push rod, allowing adjustment to any distance between 0.9 and 1.3 m. The main parameters are listed in Table 2.

2.3. Design of the Spray Control System

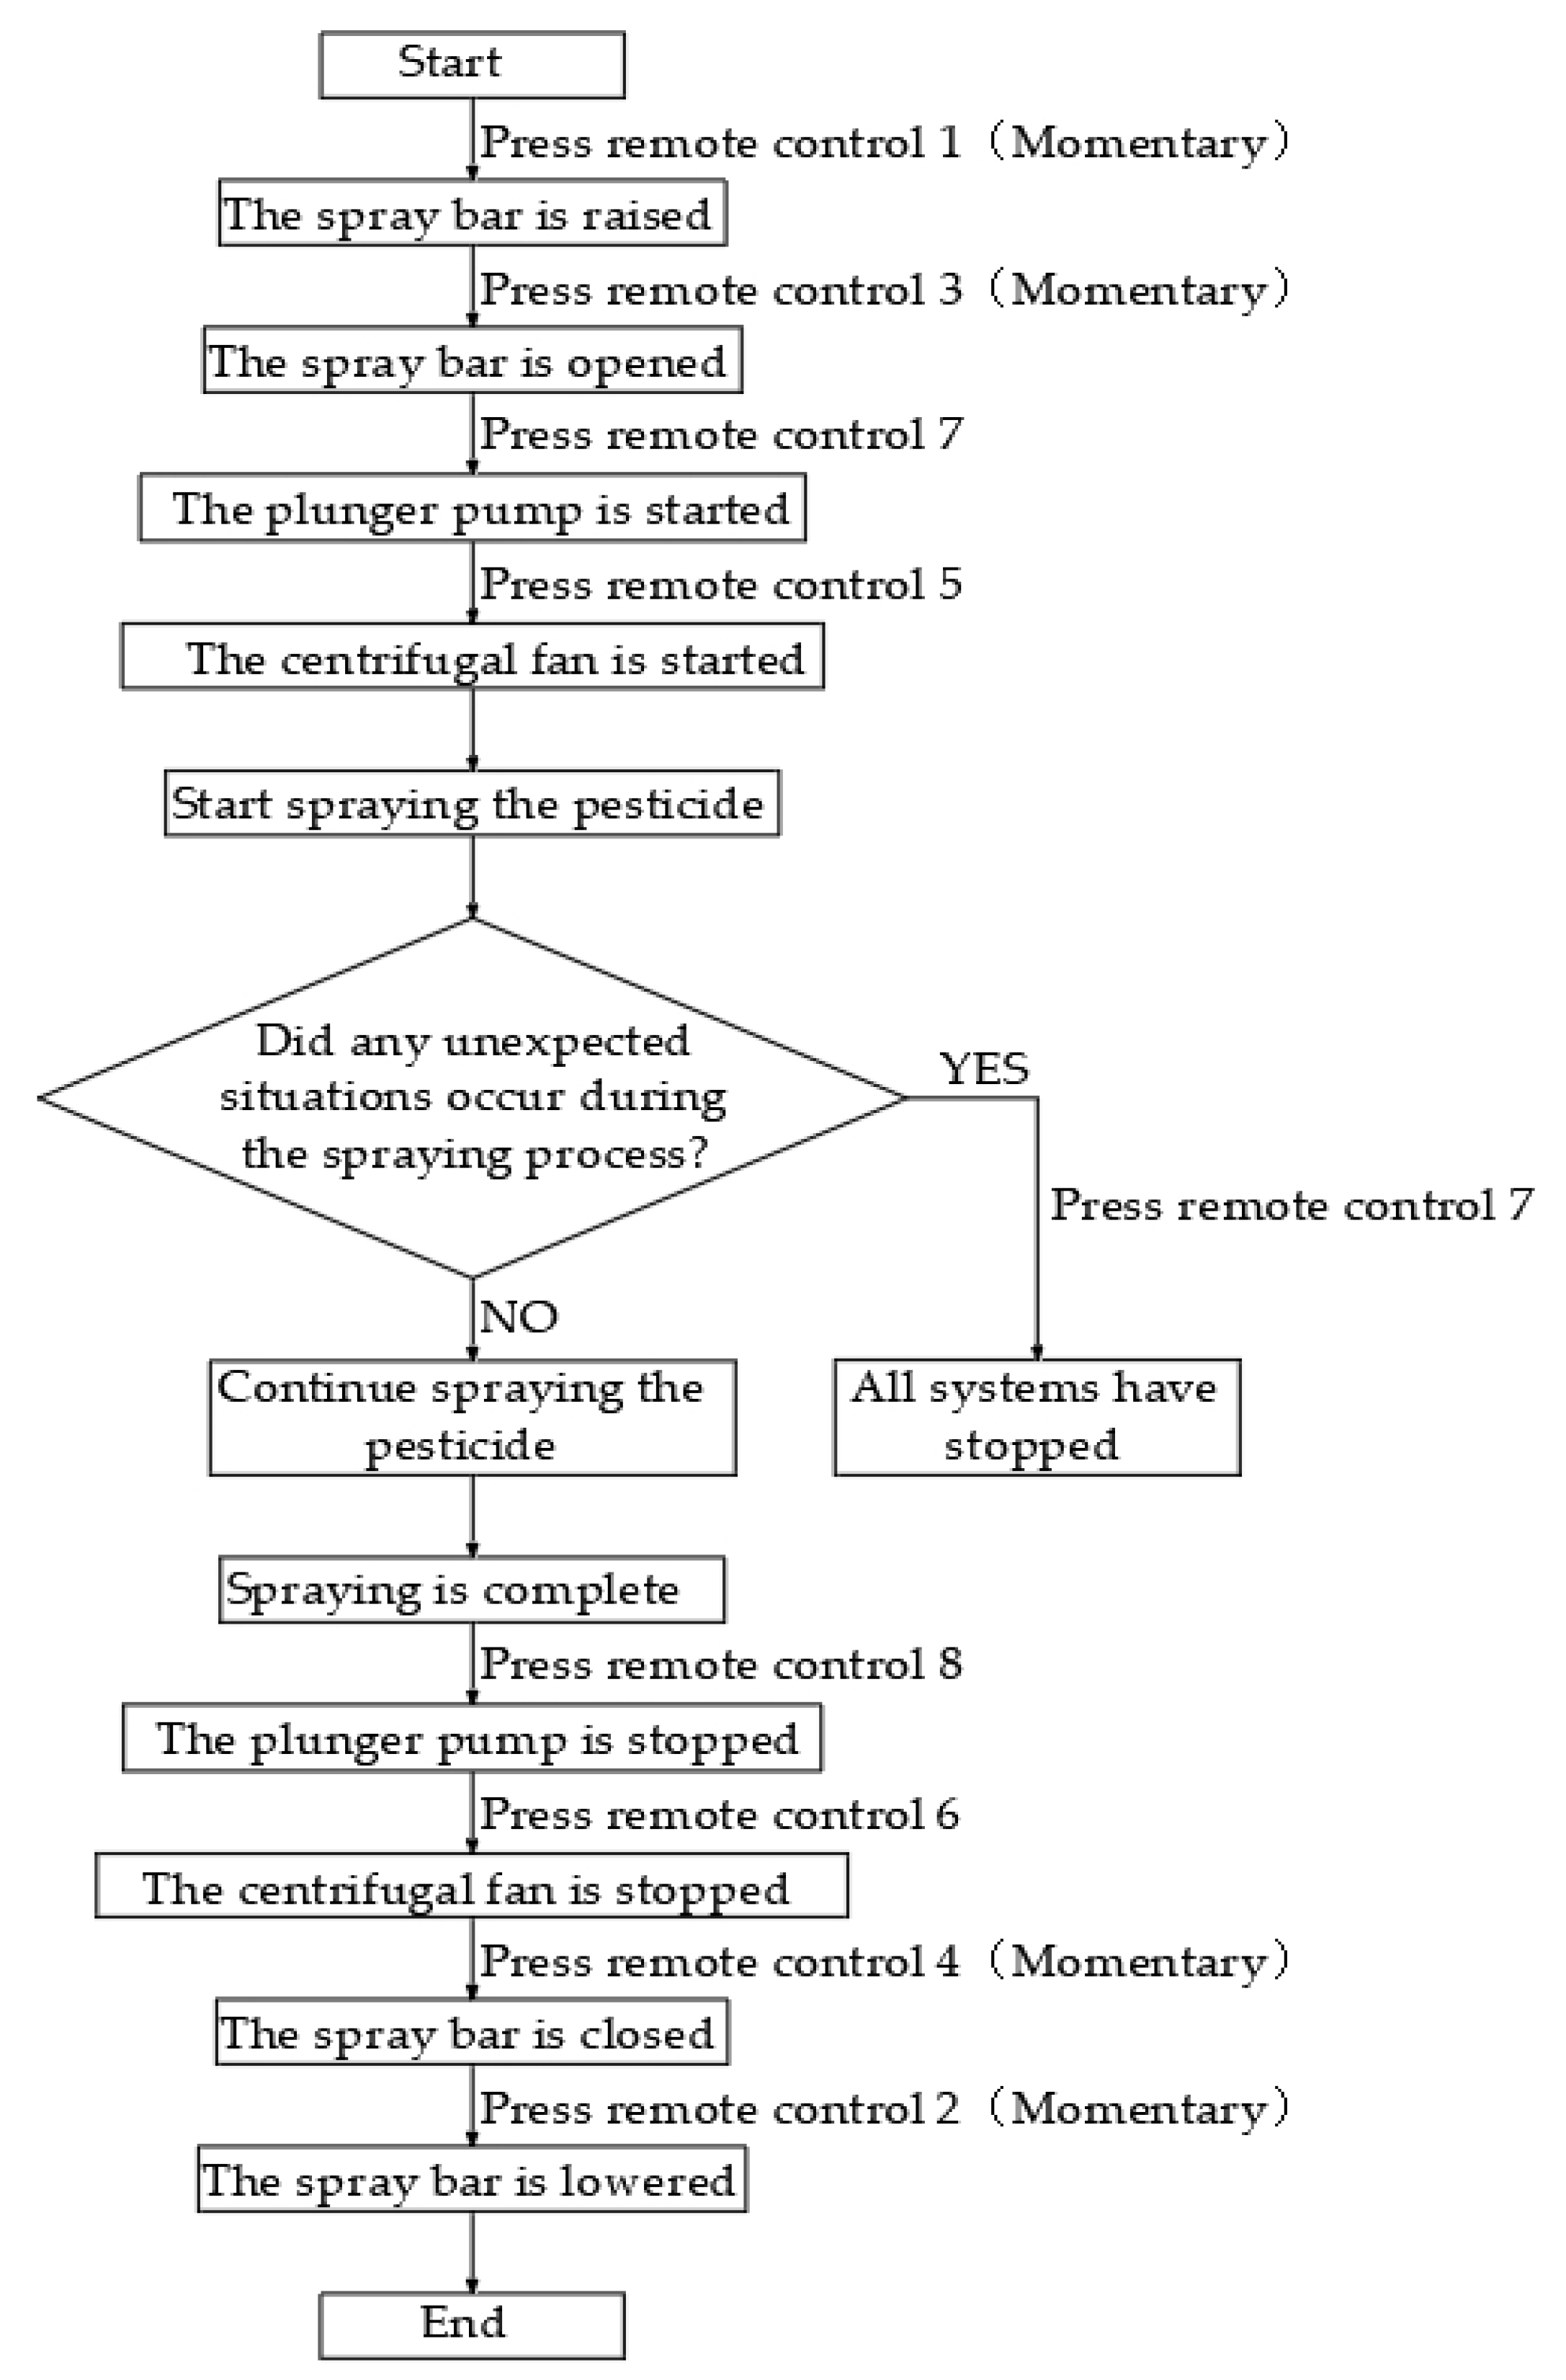
The spray control system consists of a remote control instruction receiving module, a relay, an electric push rod, a centrifugal fan, and a plunger pump; the relay is triggered by the remote control signal to enable the remote control of the mechanical movement of the spray bar and the spraying equipment. The general flowchart of the spray control system is shown in Figure 4.
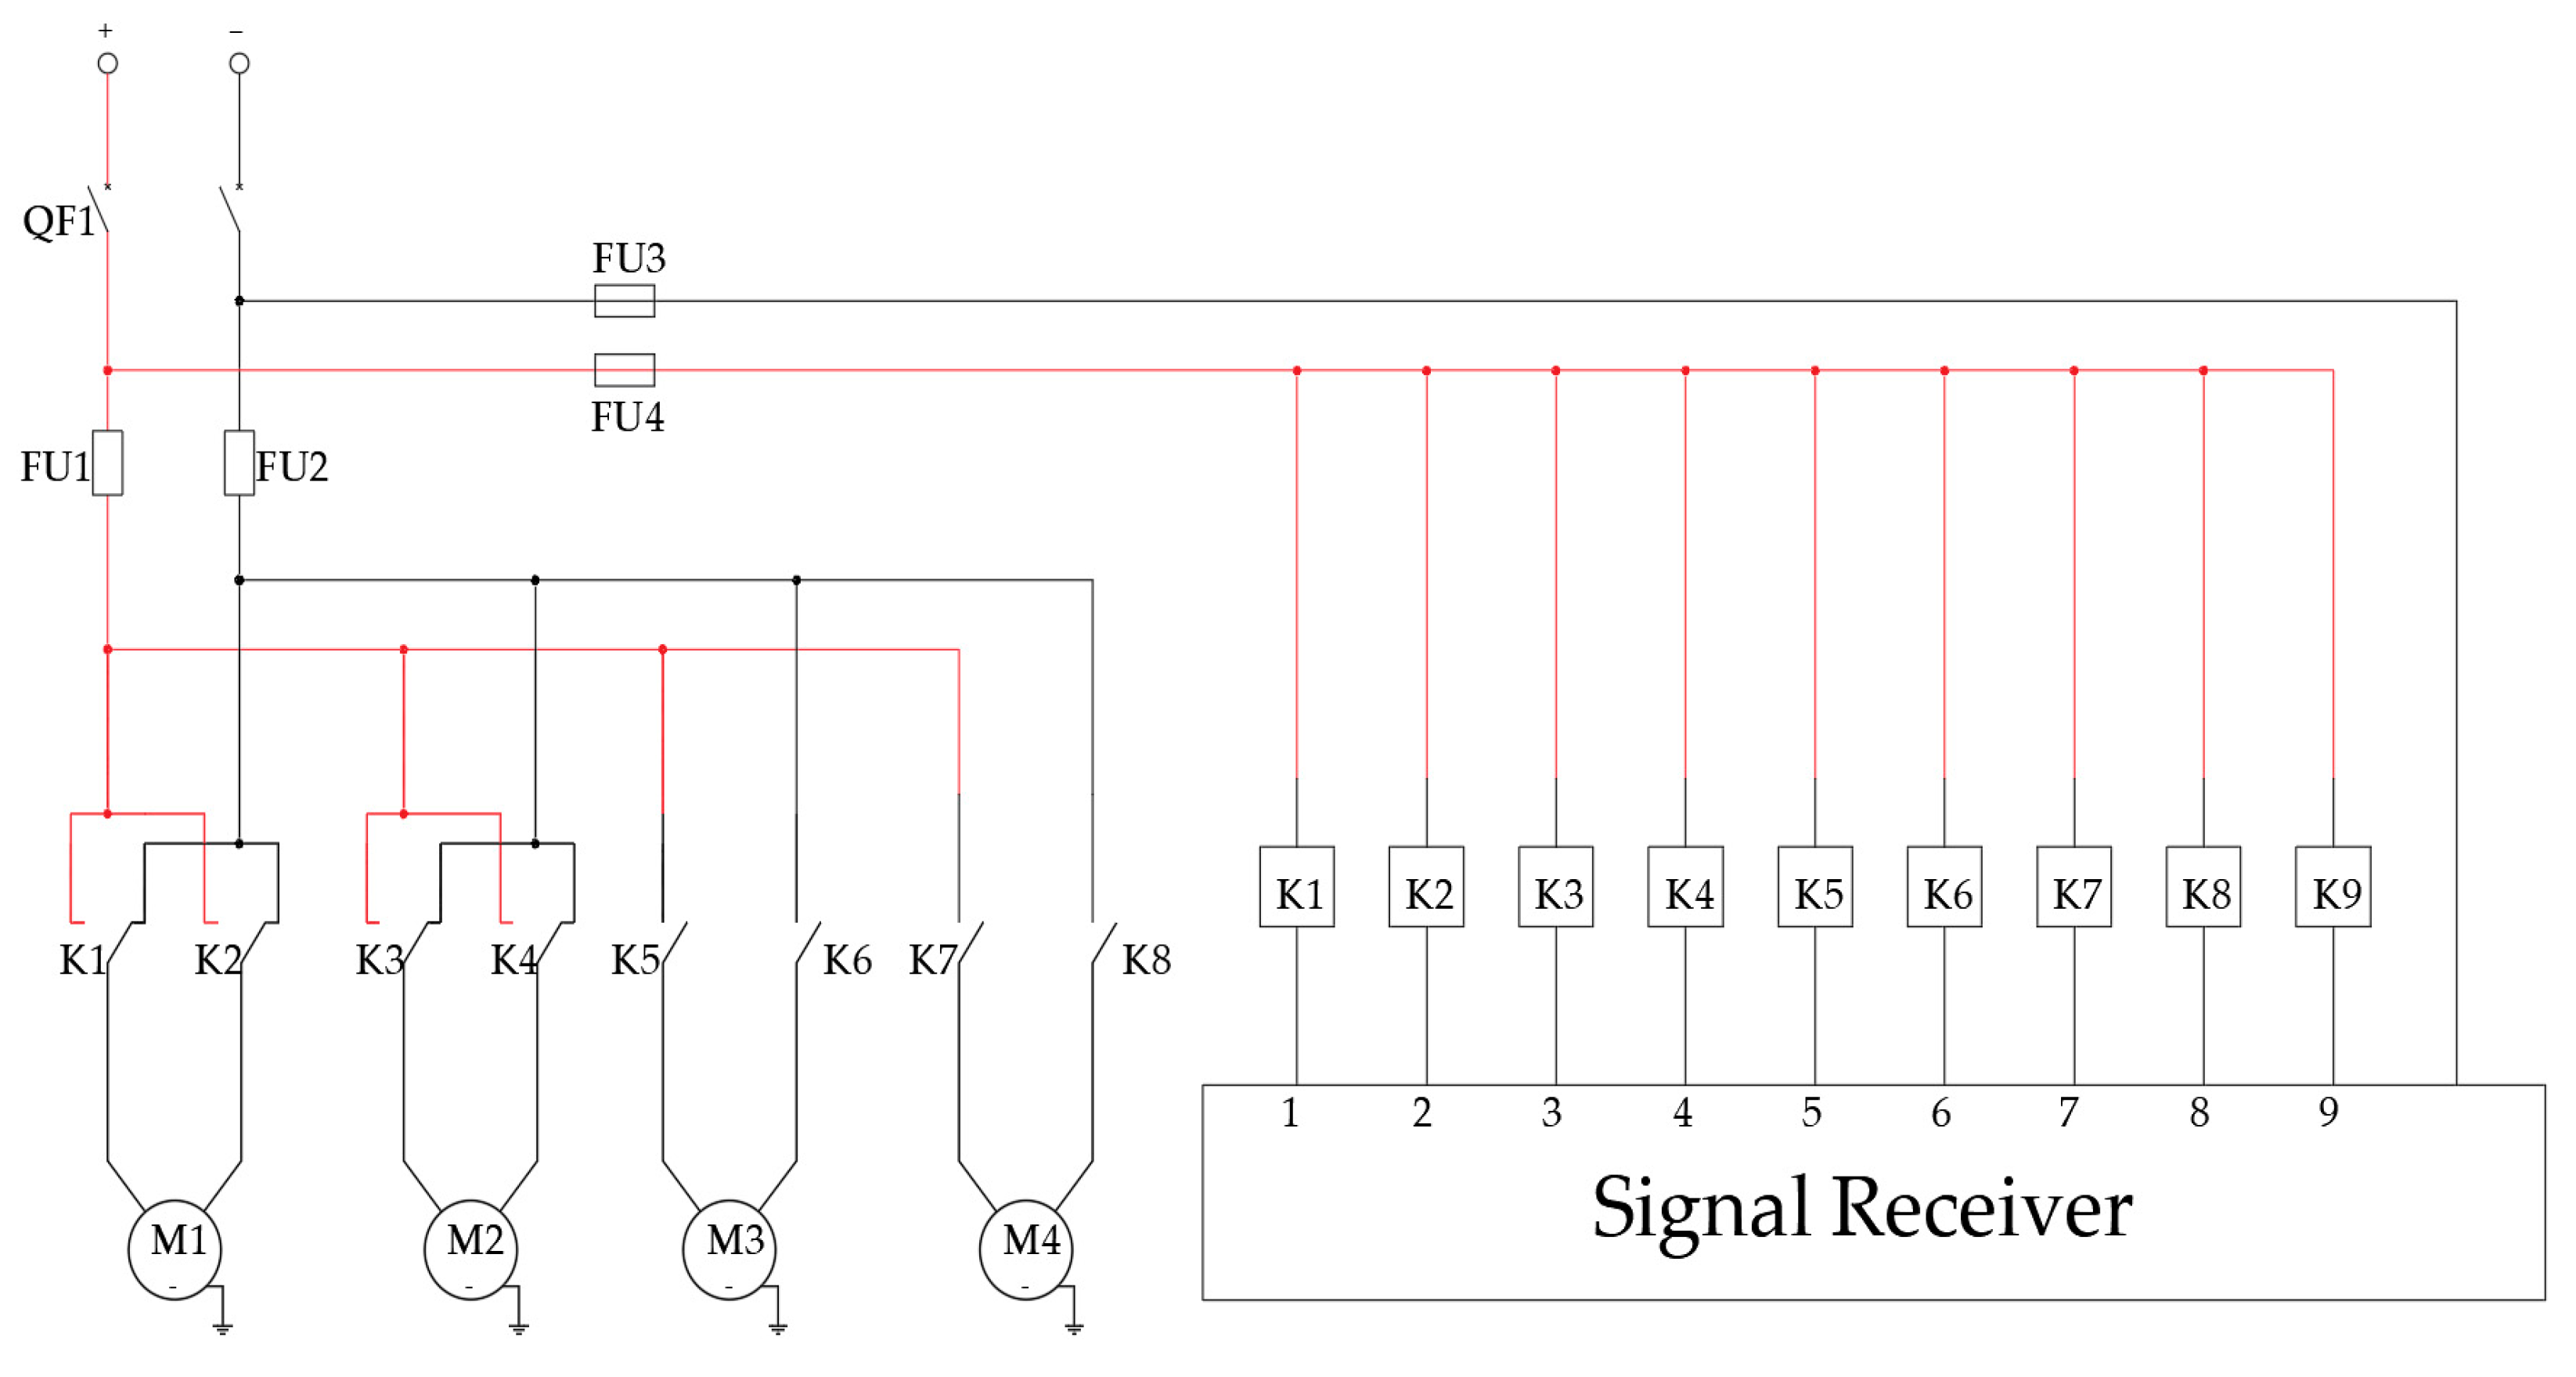
A dual-relay polarity switching scheme is adopted for the control of the electric push rods; each push rod is equipped with two relays to enable the forward and reverse rotation control of the DC motor for controlling the expansion and contraction of the push rod; the centrifugal fan and plunger pump are each controlled by relays within an independent control circuit to regulate their start and stop operation. The schematic diagram of the control circuit of the spray system is shown in Figure 5.
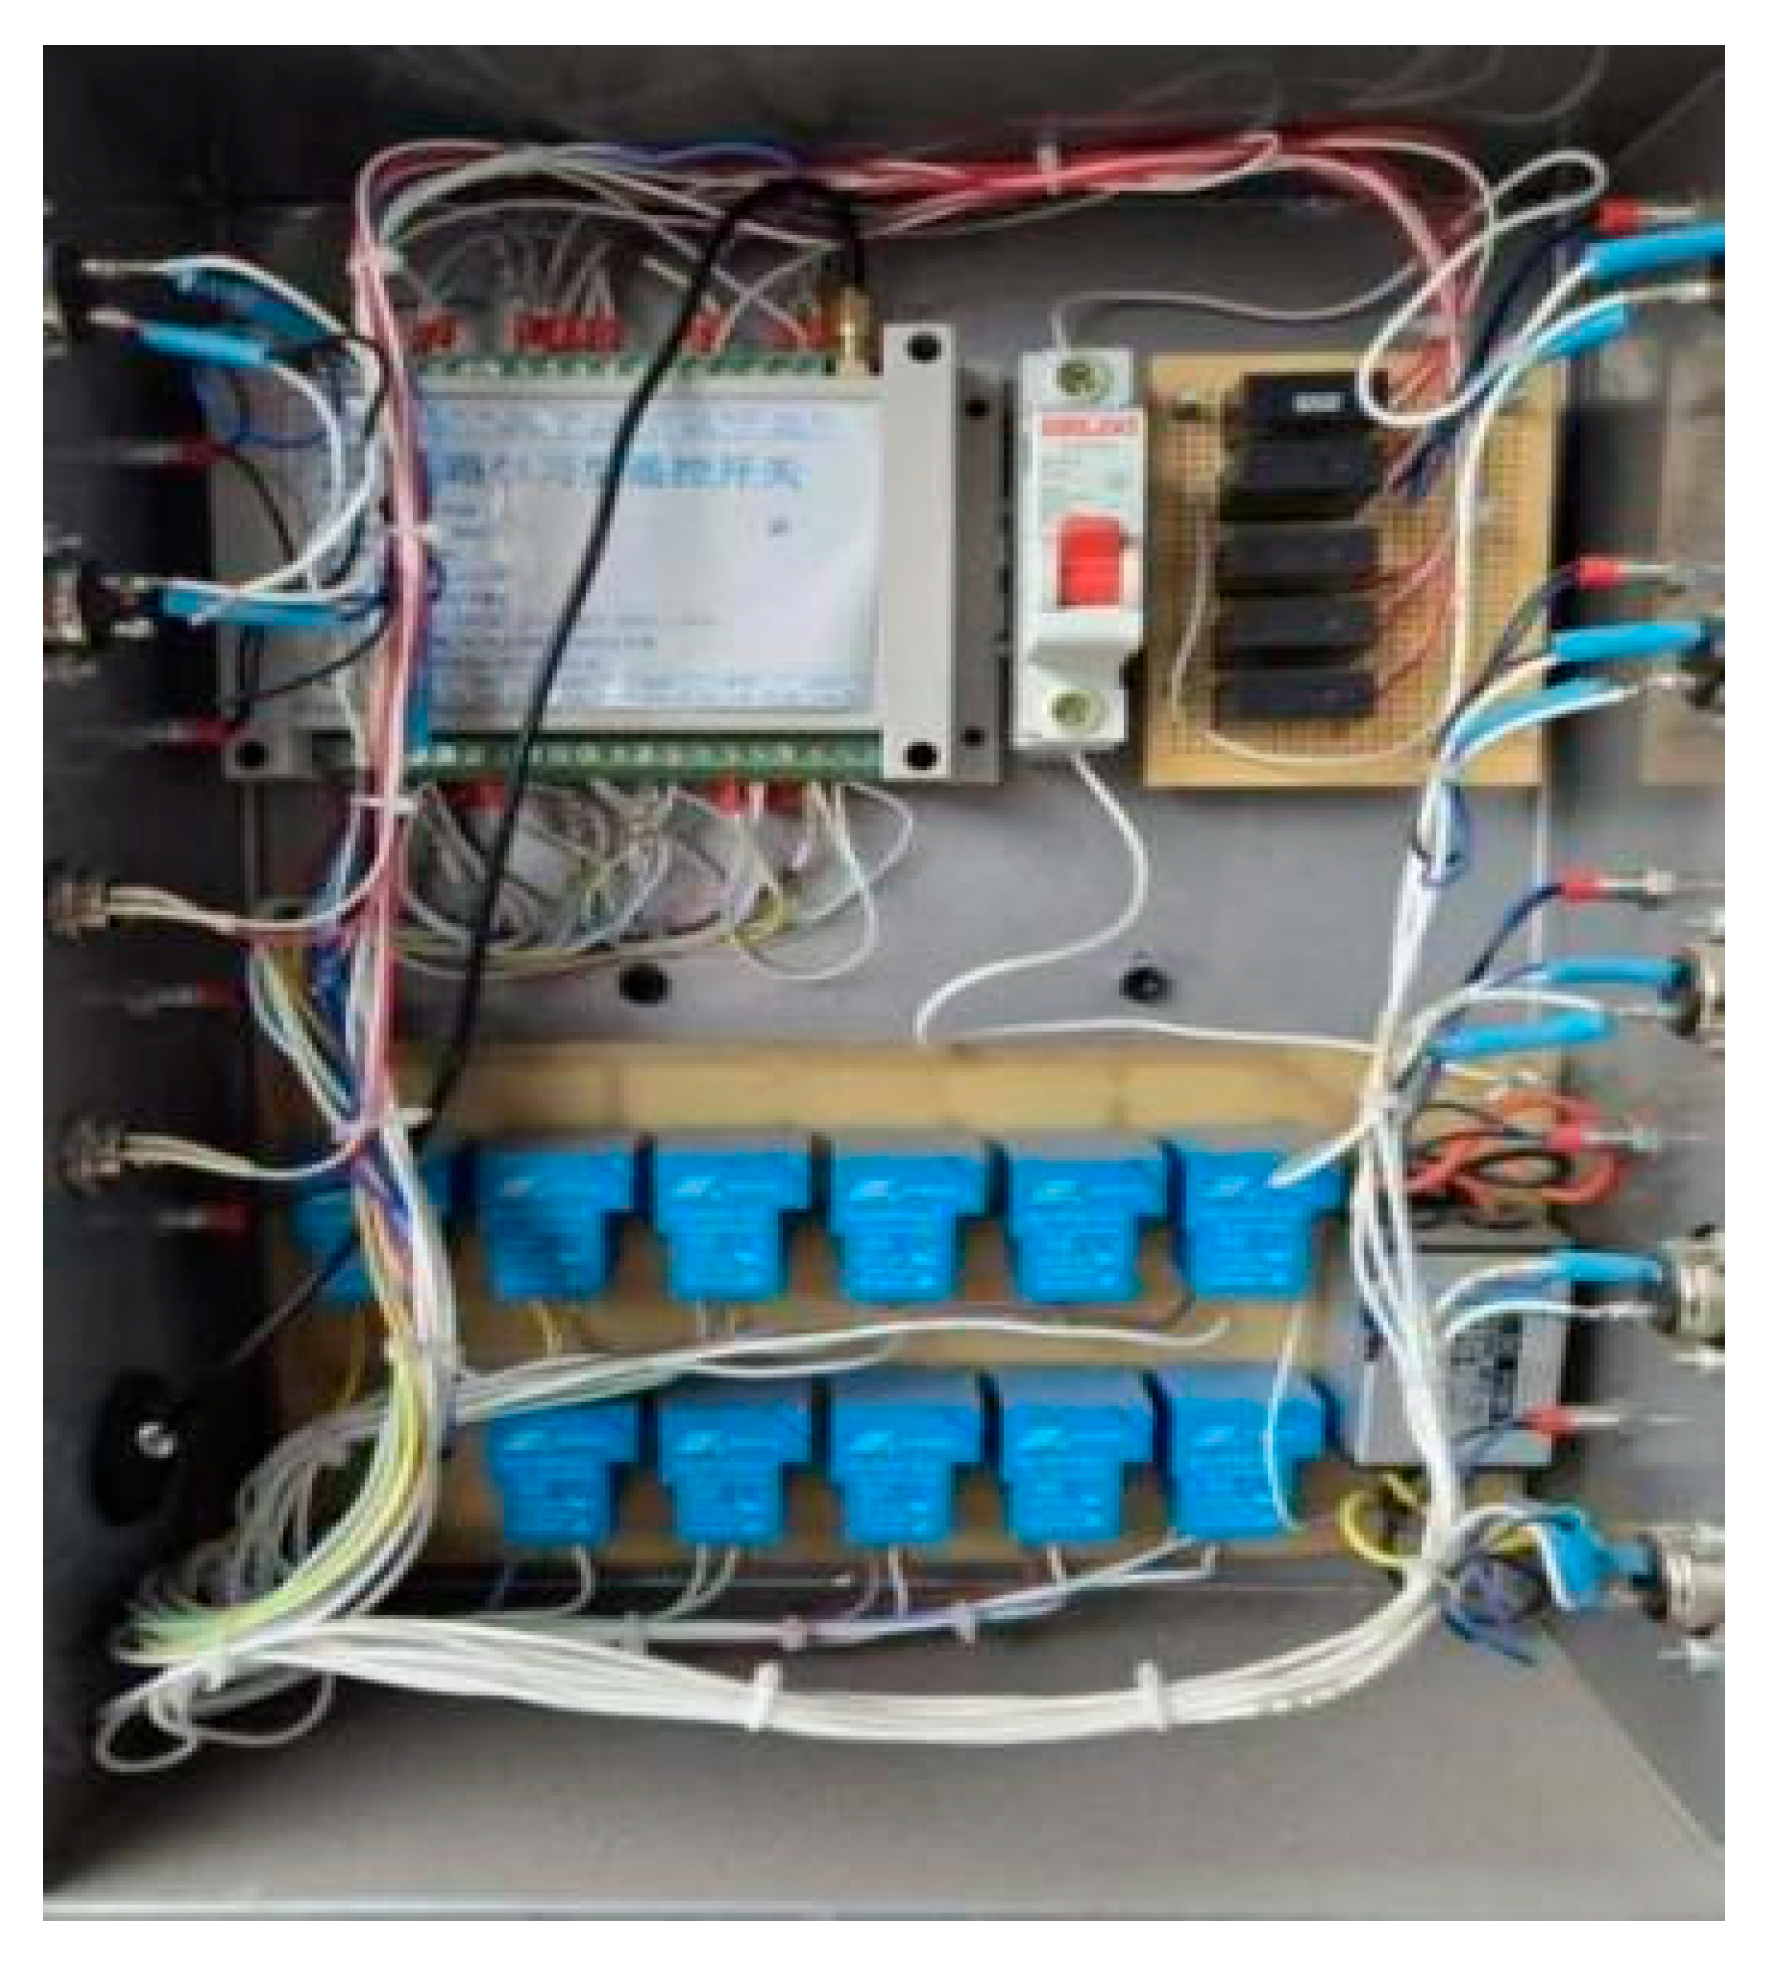
It can be observed from Figure 5 that the DC power supply is protected from short circuit by using a DC-dedicated circuit breaker QF1, the main circuit is protected from short circuit by using the fuses FU1 and FU2, and the control circuit is protected from short circuit by using the fuses FU3 and FU4. Figure 5 also shows that the DC motor M1 is controlled for forward and reverse rotation through relays K1 and K2, thereby controlling the electric push rod to rise and fall; the DC motor M2 is controlled for forward and reverse rotation by relays K3 and K4, thereby controlling the electric push rod to open and close leftward and rightward; the DC motor M3 controls the start and stop of the centrifugal fan through relays K5 and K6; and the DC motor M4 controls the start/stop of the plunger pump through relays K7 and K8. The integrated wiring diagram of the spray control system is shown in Figure 6.

2.4. The Flow Field Simulation and Wind Speed Test

The environmental wind field and the penetration of fruit tree canopies were simulated using CFD simulation technology, and the shell size of the centrifugal fan and the air outlet layout were optimized to reduce the drift of droplets. Within the centrifugal fan, the airflow flowed at high velocity, and the high-pressure environment in the spray pipeline resulted in the high flow velocity of the liquid chemical at the nozzle outlet. Given the complex internal and external flow fields, a standard k ε turbulence model was selected under a steady-state solver, and the equation for its turbulent kinetic energy is as follows:
ρ k t + ρ u j k x j = x j μ + μ t σ k k x j + G k + G b ρ ε Y M
where ρ is the fluid density, kg/m3; k represents the turbulent kinetic energy, m2/s2; t is time, s; μj represents the components of the average velocity vector in the Cartesian coordinate system (x, y, z) directions; xj is the space coordinate, s; μ stands for the dynamic viscosity coefficient of the fluid, Pa·s; μt is the turbulent viscosity coefficient, Pa·s; σk is the turbulent Prandtl number; σk = 1.0 is the turbulent Prandtl number of the turbulent kinetic energy equation; Gk is the turbulent kinetic energy produced by the average velocity gradient, kg/(m·s3); Gb is the turbulent kinetic energy triggered by buoyancy, kg/(m·s3); ε is the dissipation rate of turbulent kinetic energy, m2/s2; YM is the contribution made by the pulsating expansion in the compressible turbulence to dissipation, kg/(m·s3).
The equation for the turbulence dissipation rate of the model is as follows:
t ρ ε + x i ρ ε u j = x j μ + μ t σ ε ε x j + C 1 ε ε k G k + C 3 ε G b + G b C 2 ε ρ ε 2 k
In the equation, C = 1.44 is an empirical constant that controls the influence of turbulence generation on the dissipation rate; C = 1.92 controls the turbulence dissipation intensity; C = 0.8 is an influence coefficient of buoyancy on the dissipation rate; Cμ = 0.09 is a constant for calculating the turbulence viscosity; σk = 1.0 is the turbulent Prandtl number of the turbulent kinetic energy equation; σε = 1.3 is the turbulent Prandtl number of the dissipation rate equation.
The turbulent eddy viscosity coefficient is expressed as follows:
μ t = ρ C μ k 2 ε
where Cμ is the empirical constant.
In the experiment, an impeller–centrifugal fan air duct coupling model and an air outlet distance model (Figure 7) were established at a 1:1 scale. A simulation analysis system for the flow field inside and outside the air delivery system was built based on the ANSYS (Ansys 2022 R1, ANSYS Inc., Canonsburg, PA, USA) Workbench-Fluent integrated platform. In the simulation analysis of the flow field in the centrifugal fan, geometric repair and fluid domain capping were performed on the impeller and shell of the centrifugal fan using DesignModeler (DesignModeler in Ansys 2022 R1, ANSYS Inc., Canonsburg, PA, USA); a rotational domain for the impeller was established using the MRF method. During the simulation of the ambient wind field and its penetration through fruit tree canopies, the boundary conditions were set as follows: the inlet used a pressure boundary condition with pressures of 2 MPa, 2.5 MPa, and 3 MPa, respectively; the outlet adopted the same boundary condition, set to standard atmospheric pressure (101,325 Pa); the walls were defined as smooth ideal surfaces with a no-slip, frictionless boundary condition. Additionally, heat exchange effects were neglected (no extra thermal boundary conditions applied), and fluid–wall interaction was only constrained by the no-slip condition to avoid wall viscous shear effects on the flow field. To reduce simulation complexity, international standard atmospheric conditions were set: temperature 293.2 K, fluid density 1.225 kg/m3, and turbulence intensity 0.1%. A high-precision discrete model was obtained using the hybrid mesh generation method; the results were solved, followed by postprocessing and analysis. Moreover, the models under different parameter combinations were subjected to the simulation analysis in Fluent, and the uniformity of the flow field was evaluated intuitively using velocity cloud maps, thereby obtaining the optimal design parameters of the air delivery system and optimizing the system structure. During the simulation, each model was placed at the center of the computational domain, and the velocity distributions of internal and external flow fields were solved separately using the standard k ω turbulence model. Finally, a comparative analysis was conducted to select the air duct size and air outlet distance of the centrifugal fan suitable for the complex working conditions in closed apple orchards.

2.4.1. Simulation of Flow Field Inside the Fan Air Duct

To explore the influence of the geometric parameter of the air duct on the flow field characteristics, three-dimensional models with air duct widths of 100, 110, and 120 mm were established. The outlet cross-sectional sizes of the centrifugal fan were 230 × 100 mm, 230 × 110 mm, and 230 × 120 mm, respectively, and a simulation experiment was performed on the internal flow field.

2.4.2. Simulation of Flow Field Outside the Air Delivery System

To more intuitively explore the wind field distribution when the airflow reaches the inner chamber of fruit trees, the flow field between the air outlet and the canopy was simulated. Using the ANSYS platform, the external flow field distribution and the airflow velocity upon reaching the target were analyzed with Fluent. For a high spindle-shaped fruit tree, the effective working height of the wind field should be not less than 3 m when the airflow reaches the center of the fruit tree, and the wind velocity should remain uniformly within 9–10 m/s. The position of the air outlet significantly influenced the working height at which the wind field reached the center of the fruit tree. If the distance between two air outlets was too large, the airflow velocity would be low in some areas, and the airflow would fail to cover the whole canopy if the distance was too small. To investigate the influence of the air outlet position on the airflow, simplified air delivery system models with air outlet spacings of 200, 350, and 500 mm were established for the simulation of the external flow field; the numerically computational domain from the air outlet to the inner chamber of the fruit tree was set to be 4 m long, 2 m wide, and 3.5 m high. Environmental pressure and outlet air velocity were defined as boundary conditions, and the airflow velocity was set as the target; the global and local meshes were generated: the fan velocity decided the velocity at which the airflow reached the center of the fruit tree. To ensure that this velocity remained within the range of 9–10 m/s, different speed values of different rotational domains were defined for the models under different air outlet distances. The speed values of rotational domains were set to 1080, 1620, and 2160 r/min, respectively, for the simulation. Since the air outlets on both sides of the sprayer are symmetrically distributed along the length direction, only the wind field distribution on one side needs to be studied.

2.4.3. Wind Speed Test

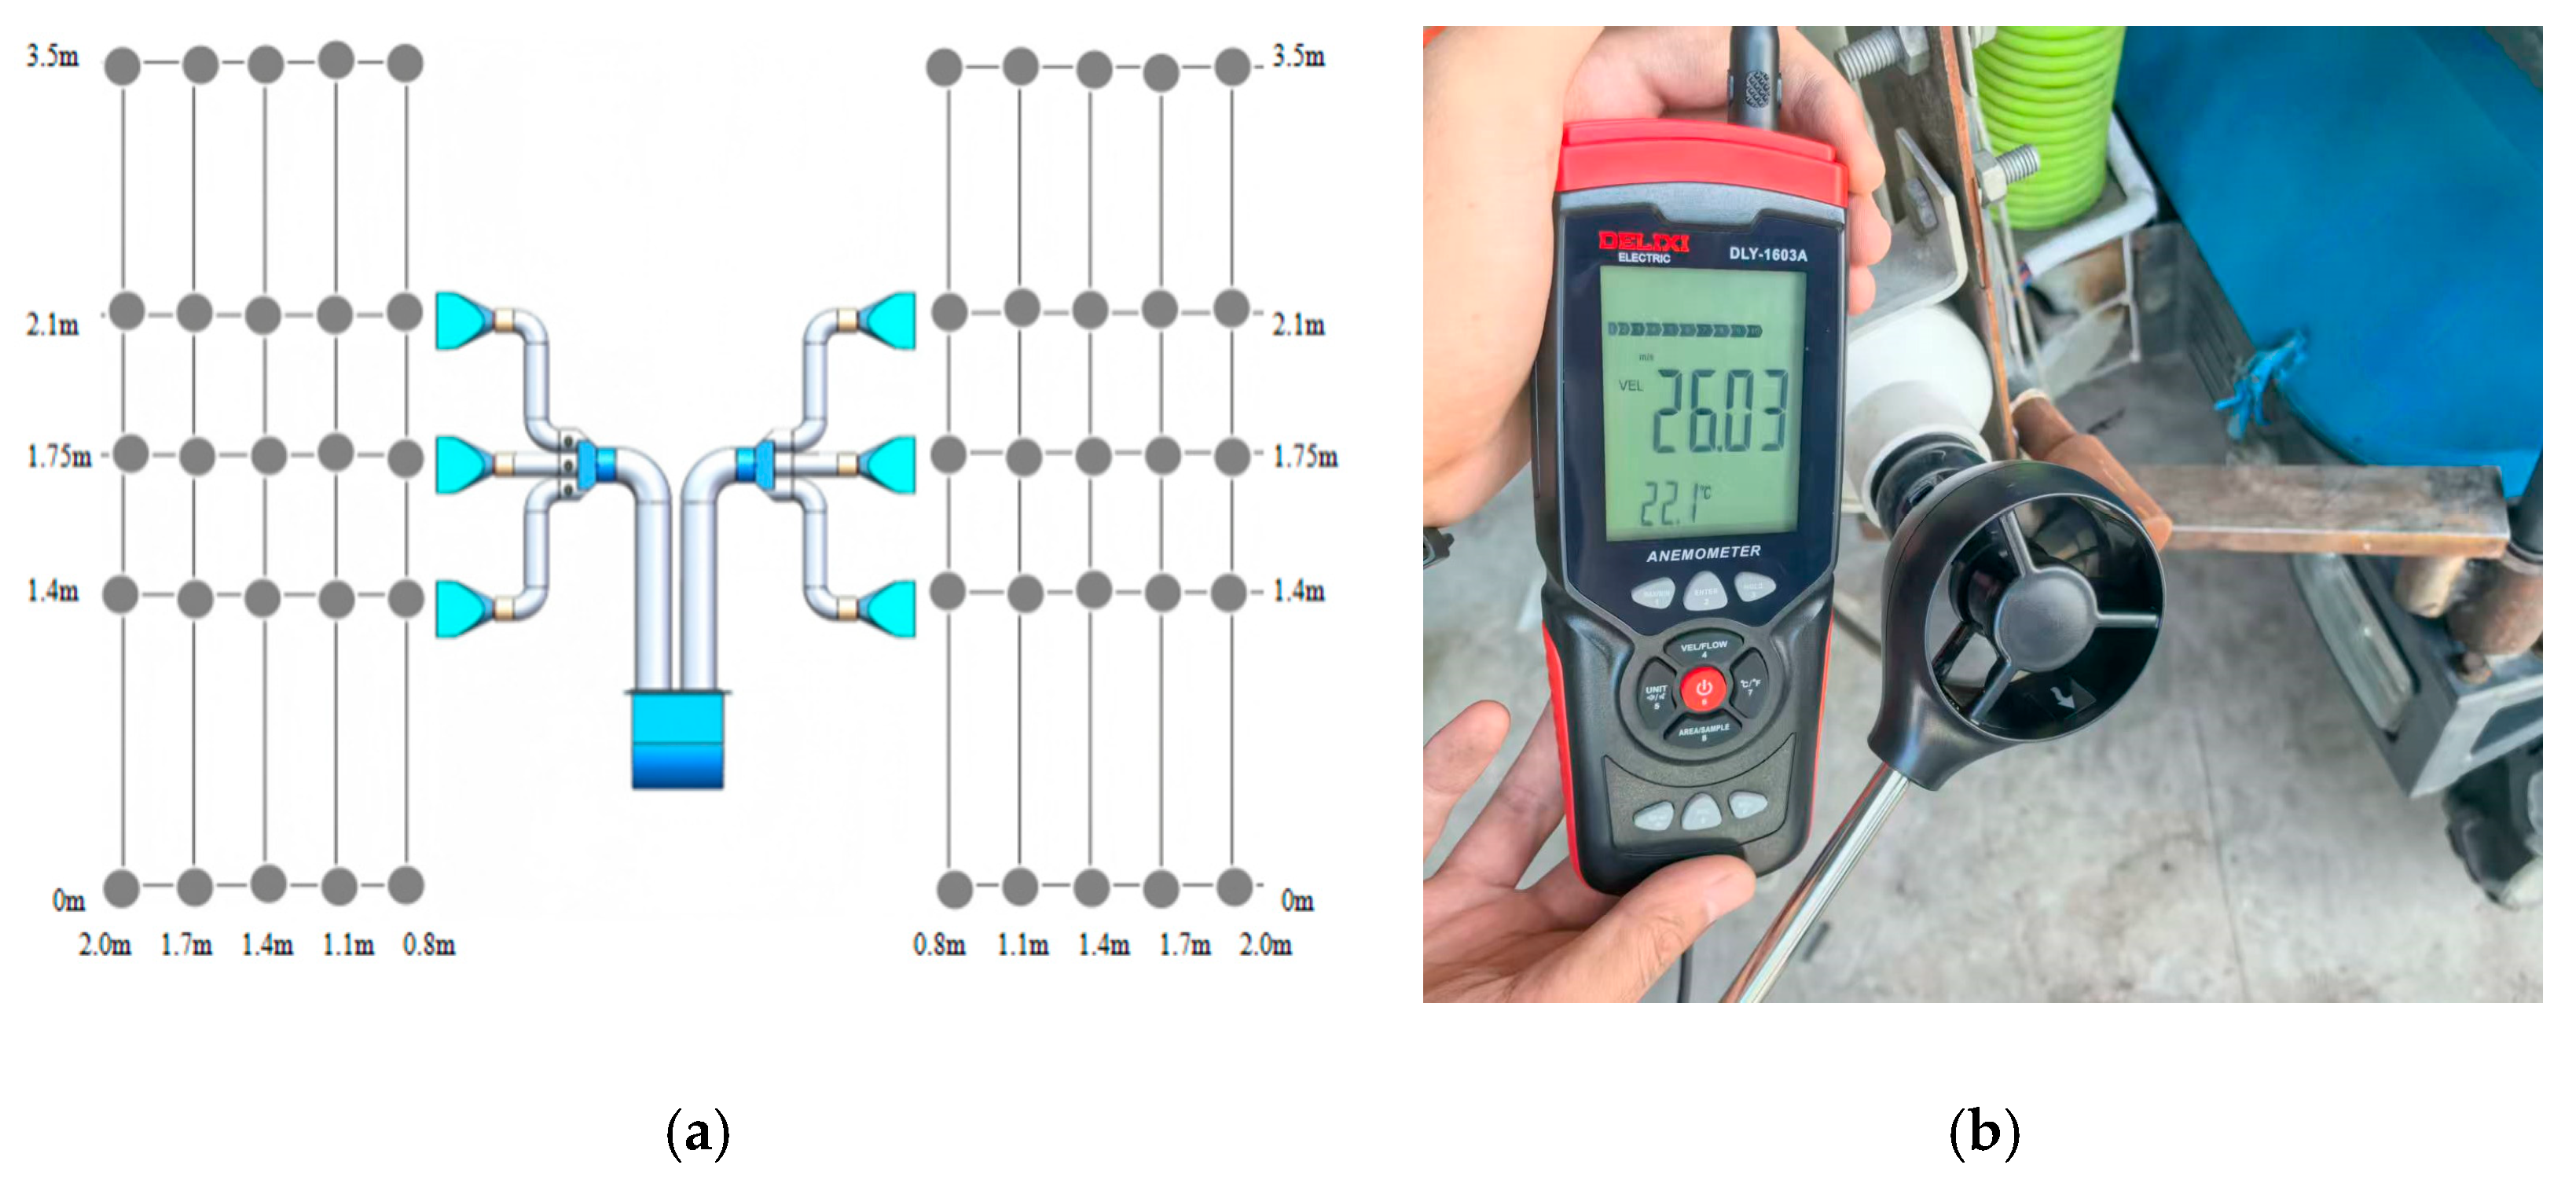
To validate the accuracy of the simulation results, an experimental platform was constructed, and wind speed tests were conducted using the optimal parameters, which included a duckbill air outlet distance of 350 mm and a centrifugal fan speed of 2160 r/min. Taking advantage of the symmetry of the flow field on both sides of the sprayer, 50 airflow speed measurement points were arranged in a grid pattern from the air outlet to the tree canopy (Figure 8a). The experiment was carried out at the Taigu Agricultural Machinery Factory under the following conditions: temperature, 23.2 °C; humidity, 29%; natural wind speed, 0.32 m/s; and target distance, 1.2 m. The experimental setup is shown in Figure 8b.

2.5. Field Operation Performance Test

2.5.1. Test Conditions

Referring to the test method specified in the General Testing Program for Plant Protection Machinery (JB/T 9782-2014) [36] and taking the driving speed, nozzle pressure, and nozzle type as test factors, the multi-duct air-delivered sprayer underwent a field spray performance test, using the droplet deposition density on the leaves as the evaluation index. The test was carried out in an apple orchard at the Fruit Tree Research Institute, Shanxi Agricultural University, on 23 October 2024. In this orchard, the row spacing was 4 m, the plant spacing was 2 m, the average fruit tree height was 3.5 m, the vertical canopy thickness was 2.5 m, and the measured canopy density was 0.56, belonging to a typical moderately closed orchard. During the test, the meteorological background was stable, the air temperature ranged from 15 to 20 °C, and the maximum instantaneous wind velocity was less than 0.5 m/s.

2.5.2. Test Method

(1)
Orthogonal test design
The droplet deposition performance is an important indicator to evaluate the operation quality of the sprayer. To analyze the influence of different operation parameters on the droplet deposition effect, the L9(34) orthogonal table was used to arrange the test scheme, and three factors were selected, each with three levels (Table 3). Factor A represents the driving speed, and the three levels are A1: 0.3 m/s, A2: 0.8 m/s, and A3: 1.3 m/s. Factor B represents the nozzle pressure, and the three levels are B1: 2 MPa, B2: 2.5 MPa, and B3: 3 MPa. Factor C represents the model of the fan-shaped nozzle, and the three levels are C1: 6501; C2: 6502; C3: 6503. The Volume Median Diameter (VMD) for all nozzles is classified as medium, and their Relative Span (RS) values are all greater than 1 [37]. Meanwhile, to analyze the difference in droplet deposition density under two typical operation modes—liquid pump independent operation and liquid pump–fan cooperative operation—the test designations under the independent liquid pump spraying mode are V1–V9, and those under the liquid pump–fan cooperative spraying mode are L1–L9.
(2)
Field sampling layout
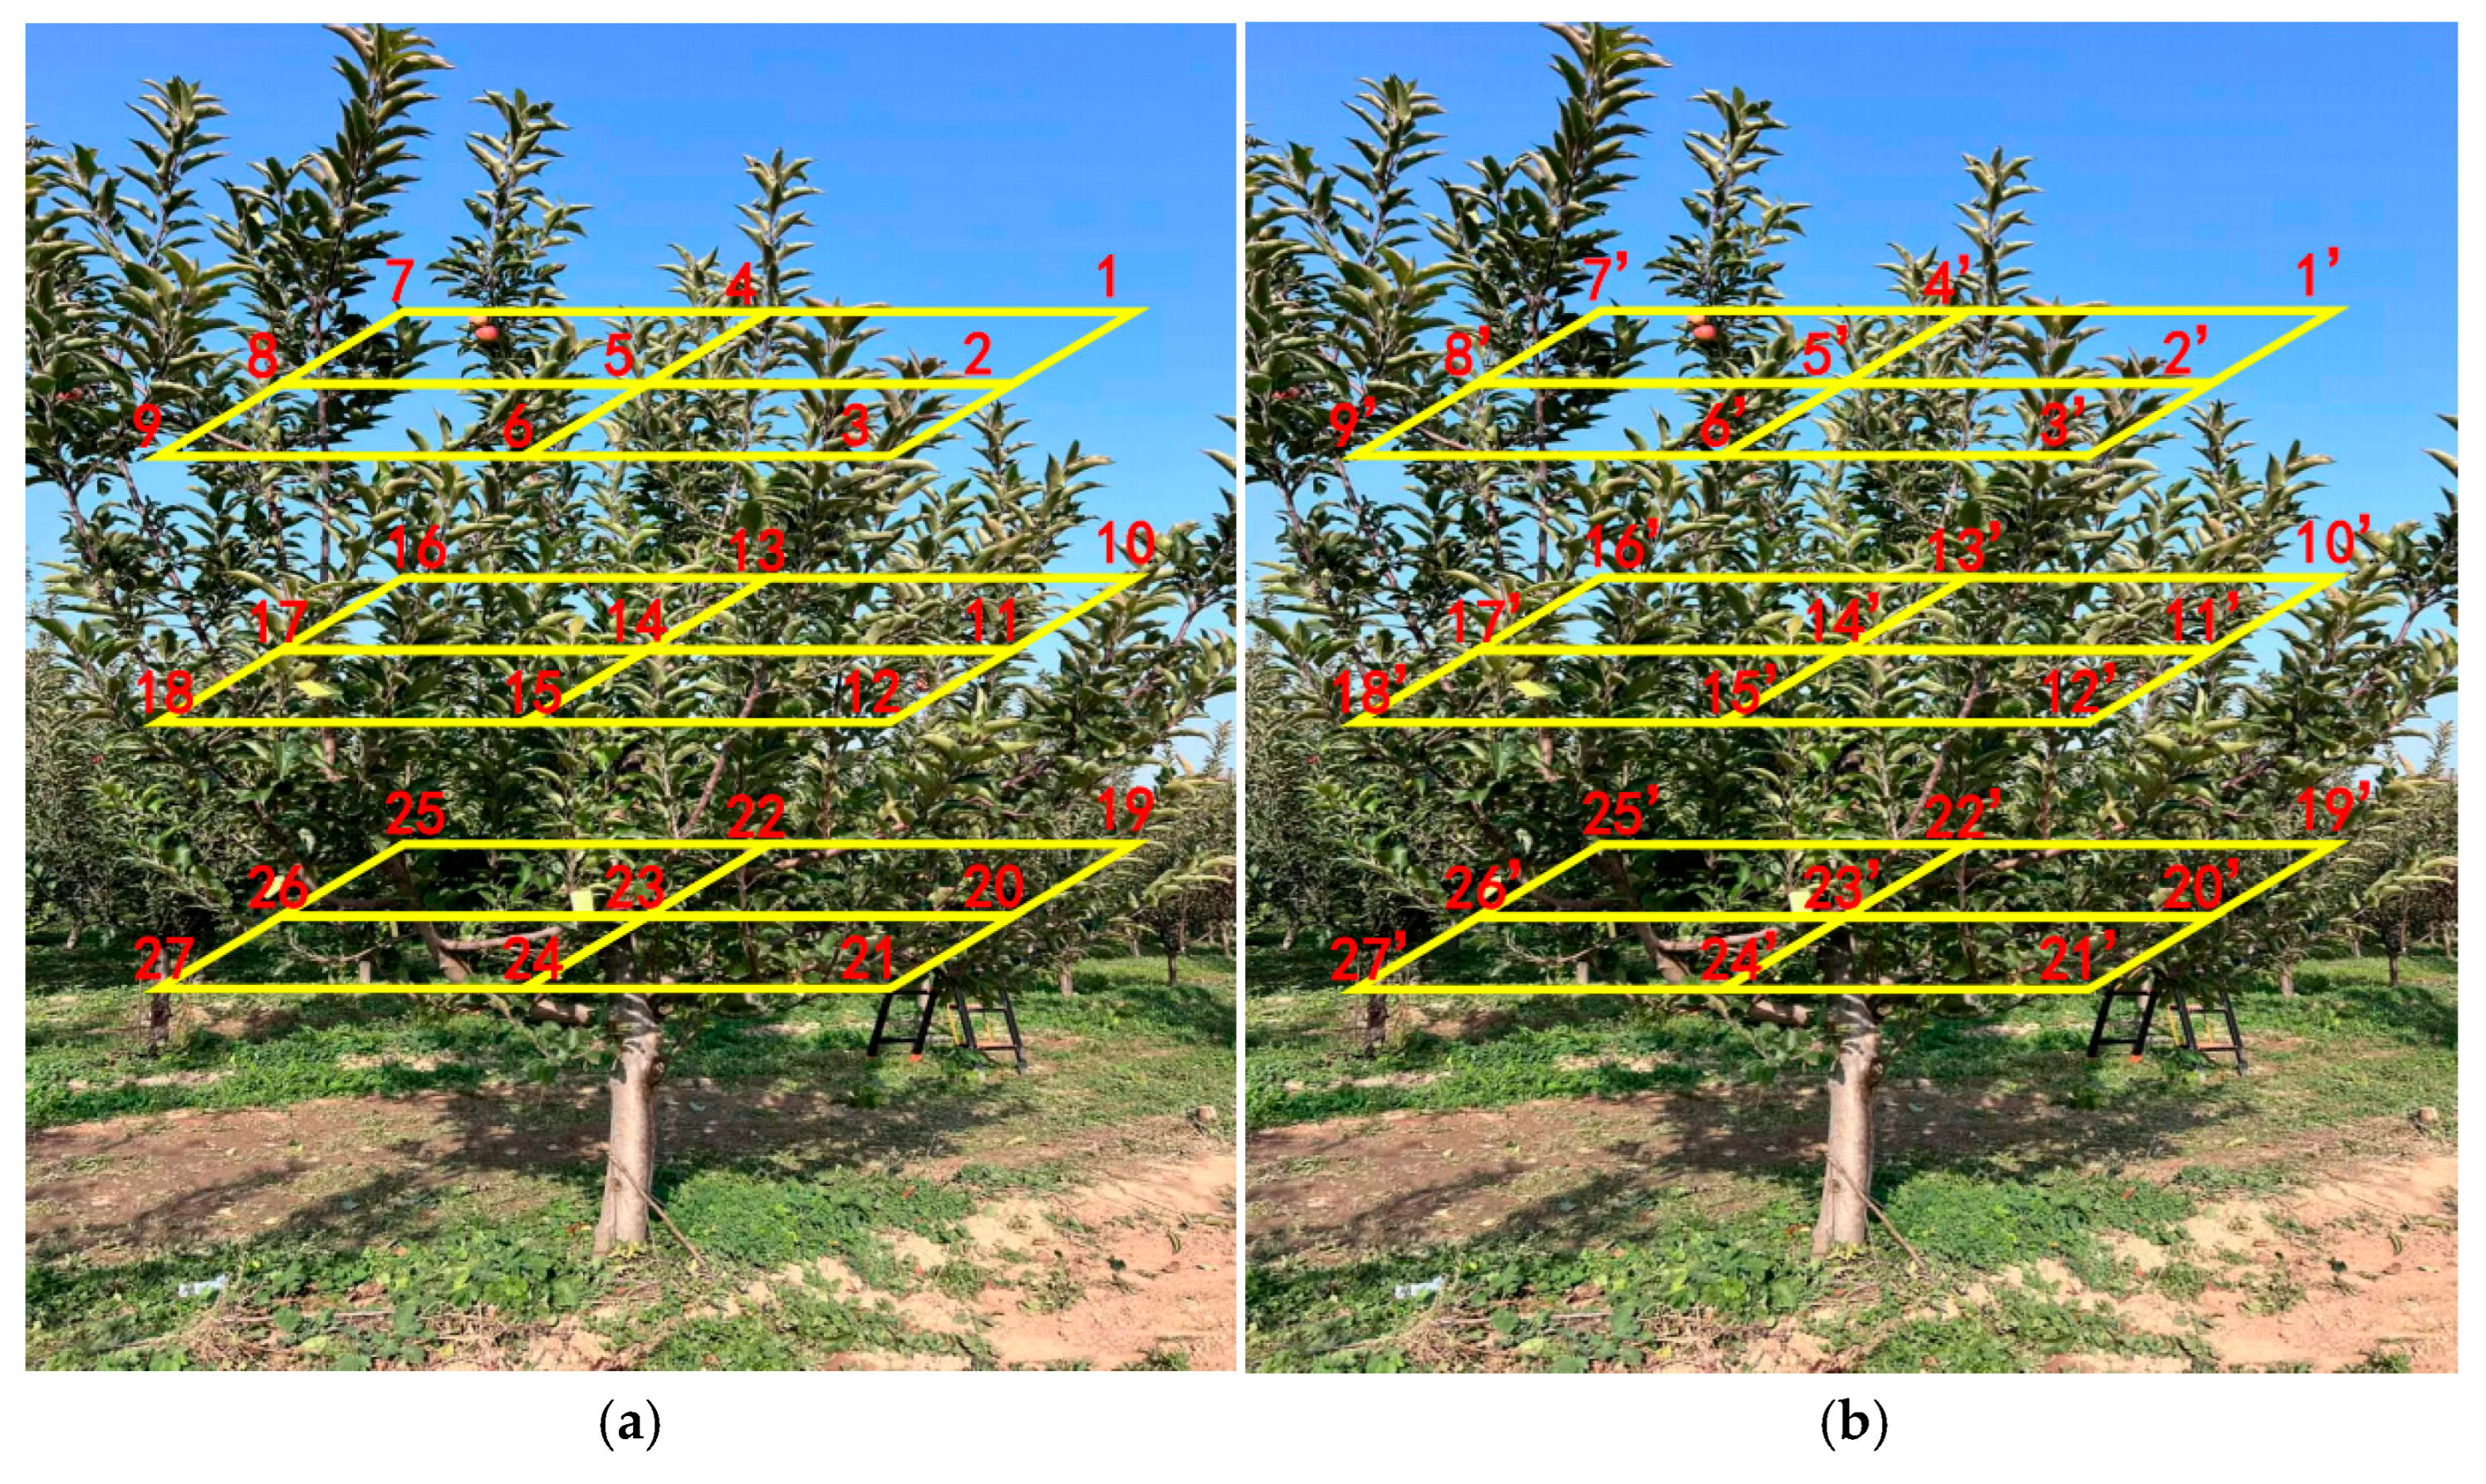
Sampling points were arranged within the fruit tree canopy using a three-dimensional grid method. Each tree was divided vertically into three layers: upper layer (2.5–3.5 m), middle layer (1.5–2.5 m), and lower layer (0.5–1.5 m). A 3 × 3 grid of sampling points was arranged in each layer of the plane, forming a total of 27 sampling points (Figure 9). At each sampling point, typical leaves were selected. Water-sensitive test papers were non-destructively fixed on the front and back faces of leaves using paper clips. All test papers were numbered according to the canopy position. Thus, 27 sampling points were tested per tree, yielding a total of 54 test samples.
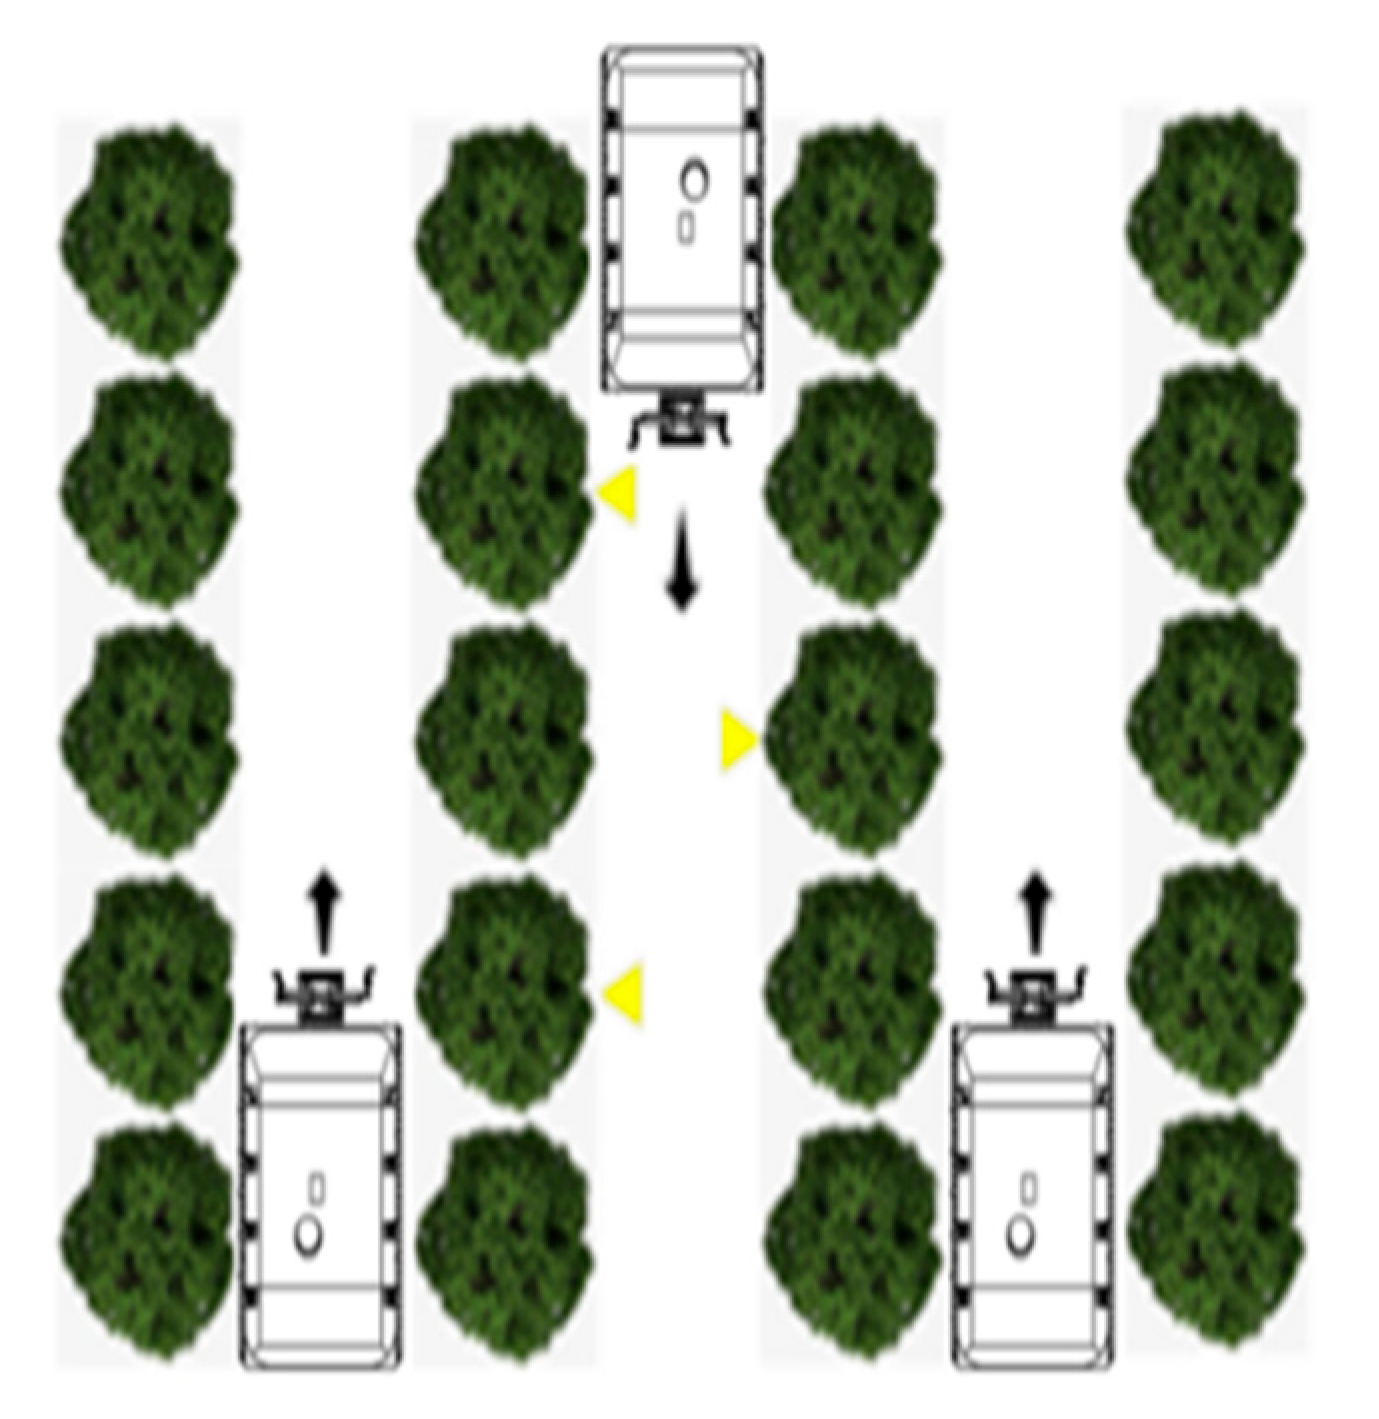
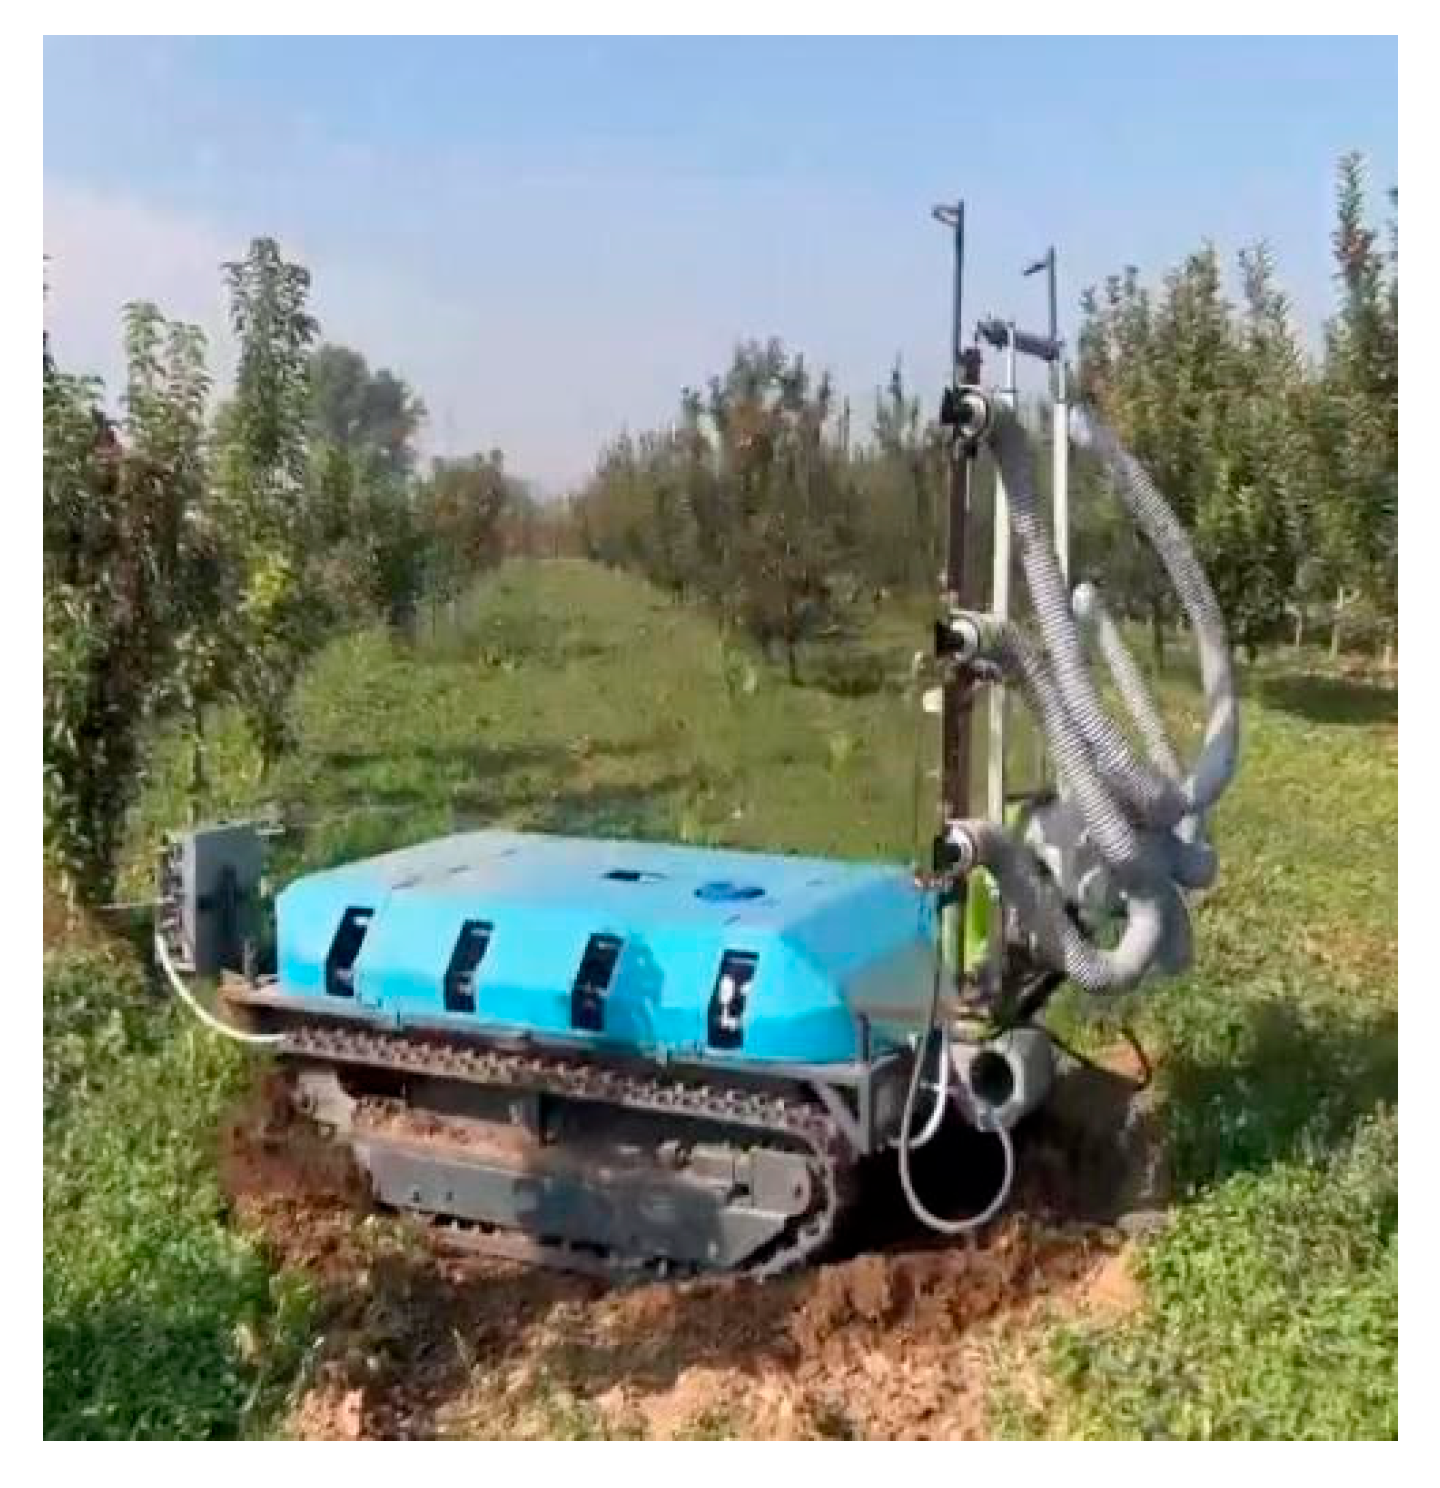
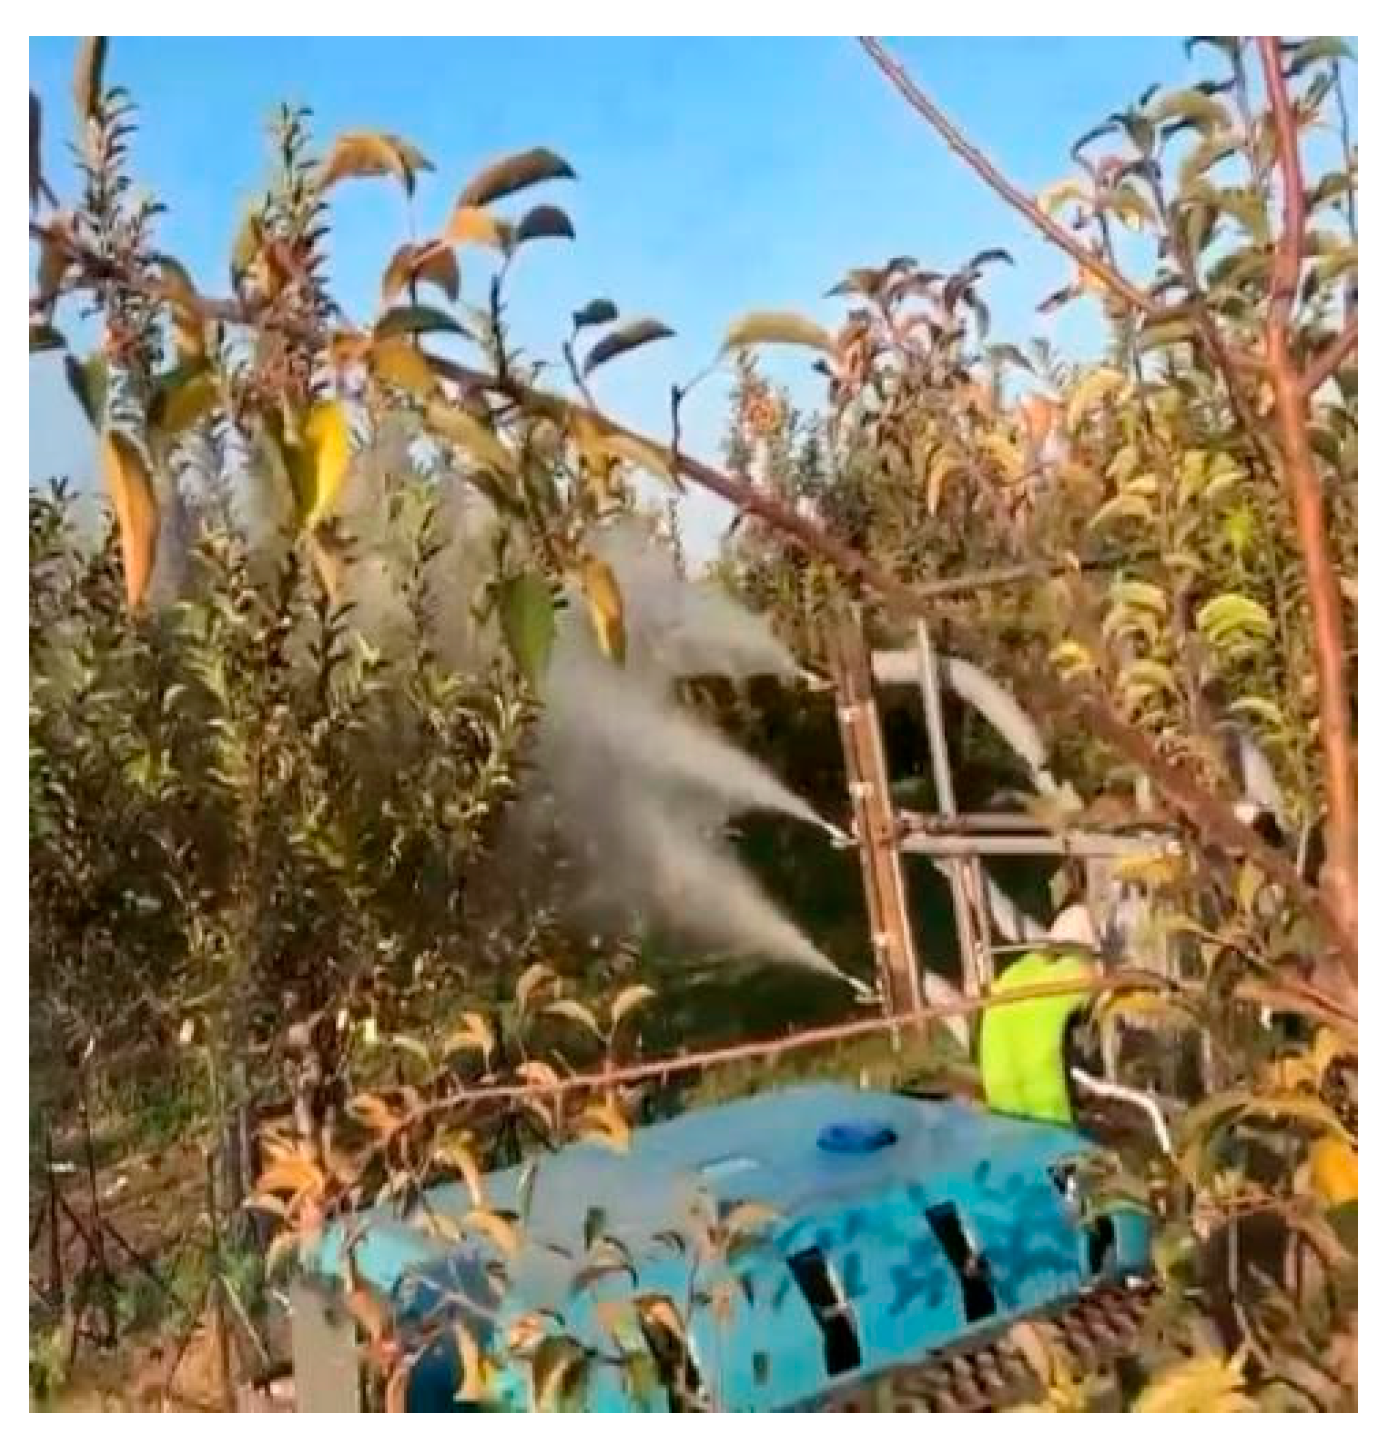
During the spraying test, three representative fruit trees with typical canopy structures were chosen as the test objects, with the test repeated three times. A left-right alternating spraying pattern was adopted to eliminate the effect of wind direction. The sampling method is shown in Figure 10. A real-world image of the multi-duct air-delivered sprayer prototype is shown in Figure 11, and the field spraying performance test is presented in Figure 12.

2.5.3. Treatment of Test Samples

After the spraying operation, the collected water-sensitive test papers were dried, scanned using a scanner with a resolution of 600 dpi, and stored in PNG format. The images were then imported into ImageJ software (1.54f, NIH, Bethesda, MD, USA) and converted into grayscale images, followed by noise filtering screening and removal of interference factors such as small droplets. Finally, the deposition density at sampling points was automatically calculated. The droplet deposition patterns on water-sensitive test papers before and after processing are shown in Figure 13.

2.6. Data Processing

The field orthogonal test results of the multi-duct sprayer were analyzed for significance using the Tukey procedure in SPSS 26.0 (IBM, Armonk, NY, USA). In addition, droplet deposition density at different canopy heights was analyzed for significance using the ANOVA procedure in SAS (SAS9.1, SAS Institute, Cary, NC, USA).

3. Results and Discussion

3.1. Simulation Analysis of the Flow Field Inside the Air Duct and Outside the Air Delivery System

3.1.1. Simulation Analysis of the Flow Field Inside the Fan Air Duct

In the simulation model of the internal flow field of the centrifugal fan duct, the section of the air duct outlet was designated as the monitoring surface to measure the outlet velocity. Sampling points were evenly distributed on this surface to represent the entire cross-section of the fan, and the average velocity of the section was calculated as the outlet speed; meanwhile, the middle section of the model was selected to observe the velocity distribution in the air duct (Figure 14).
As shown in Figure 14, the airflow velocities at the outlet sections of the three air duct sizes were different. Moreover, the velocity varied at each measurement point on the outlet section for a given duct size. Additionally, the airflow velocity near the outer wall was significantly lower than that in the central region. When the air duct size was 230 × 110 mm, the velocity distribution was the most uniform, the range of velocity variation at the air outlet was narrower, and the flow was more stable compared to the other two duct sizes. At the same fan speed, for a duct width of 110 mm, the maximum mean velocity was 18.52 ± 0.28 m/s, which was 1.47 times that under the air duct width of 100 mm and 1.15 times that under the air duct width of 120 mm. In summary, a 230 × 110 mm duct size was selected.

3.1.2. Simulation Analysis of Flow Field Outside the Air Delivery System

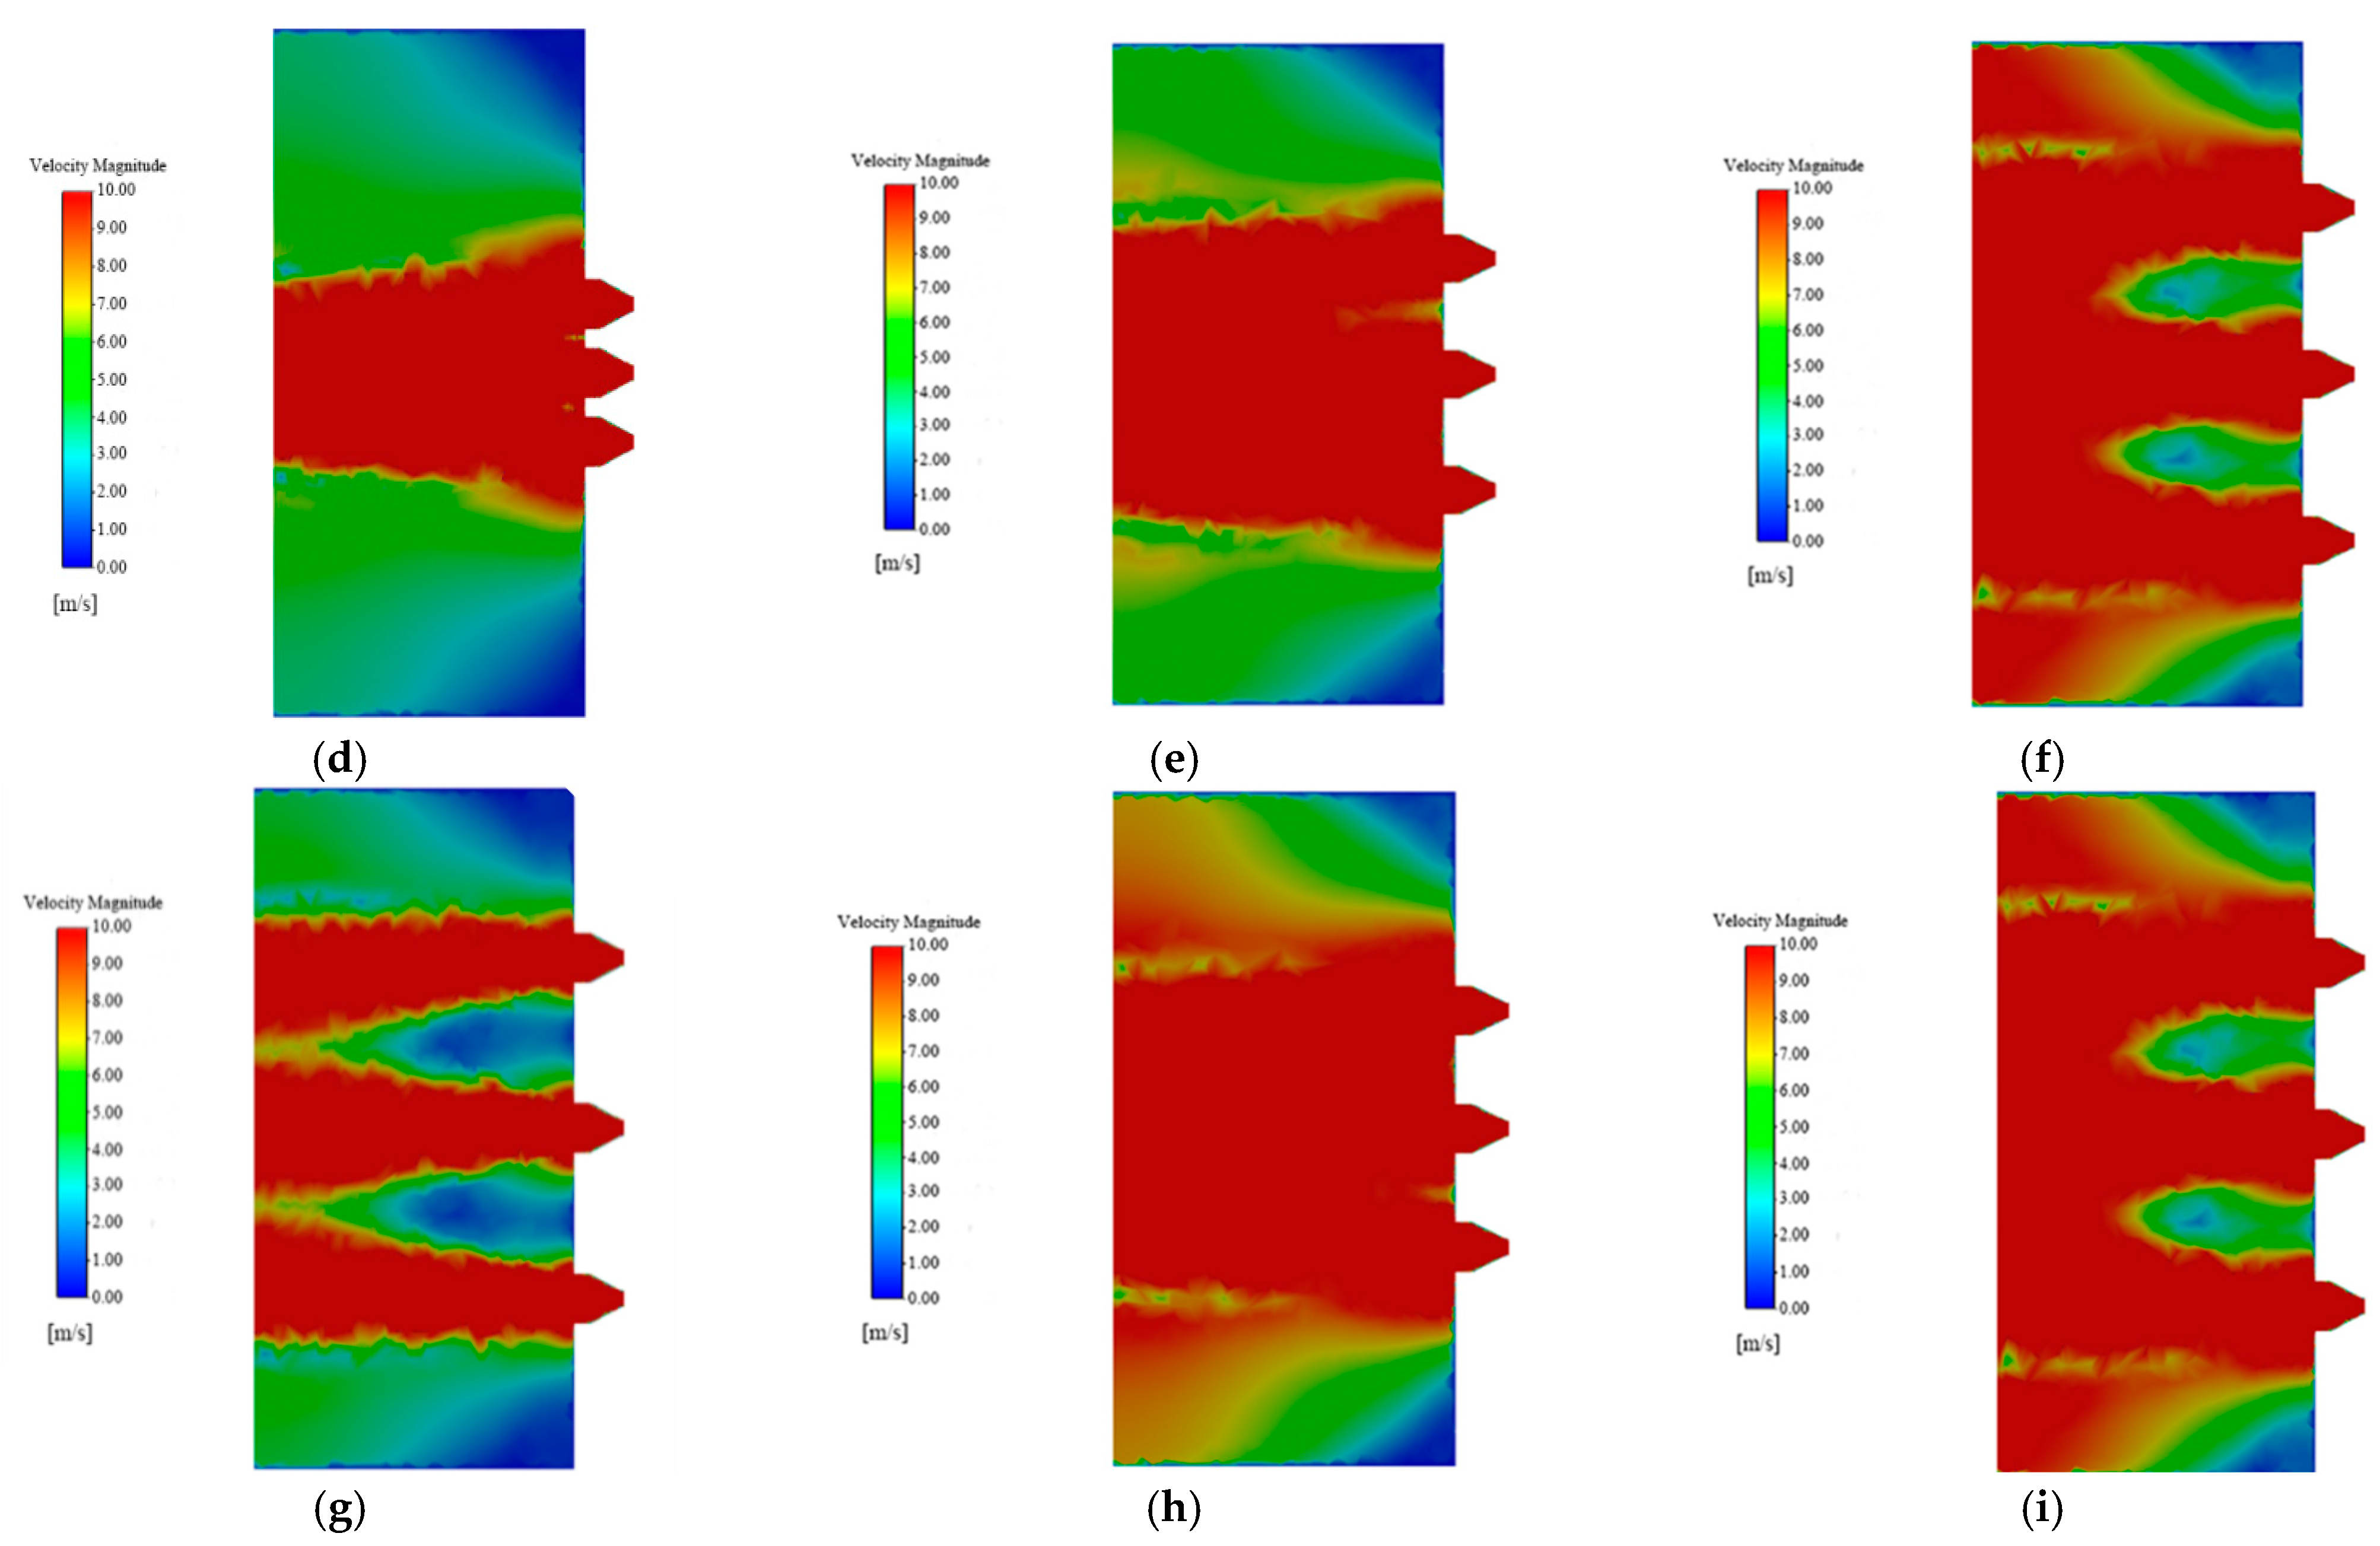
Through the simulation analysis of the flow field outside the air delivery system between the left side of the air duct outlet of the fan and the canopy, the velocity cloud map of the airflow is shown in Figure 15. It can be seen from Figure 15 that when the air outlet spacing was set to 200 mm, the effective coverage width was small due to the insufficient flow field diffusion angle. At the fan speeds of 1080, 1620, and 2160 r/min, the operating width failed to meet the agronomic requirement that the longitudinal spray height should be greater than 3 m. When the air outlet spacing was set to 500 mm, although the operating width satisfied the requirements, the final airflow velocity failed to meet the requirement that the final velocity should be 9–10 m/s under the three fan speeds. With an air outlet spacing of 350 mm, the final velocity did not meet requirements at the speeds of 1080 and 1620 r/min; when the fan speed was increased to 2160 r/min, both the flow field width outside the air delivery system and the final airflow velocity met the dual requirements of operating width and final velocity. Based on the above analysis, an air outlet spacing of 350 mm and a fan speed of 2160 r/min were selected for subsequent testing.

3.1.3. Wind Speed Test Analysis

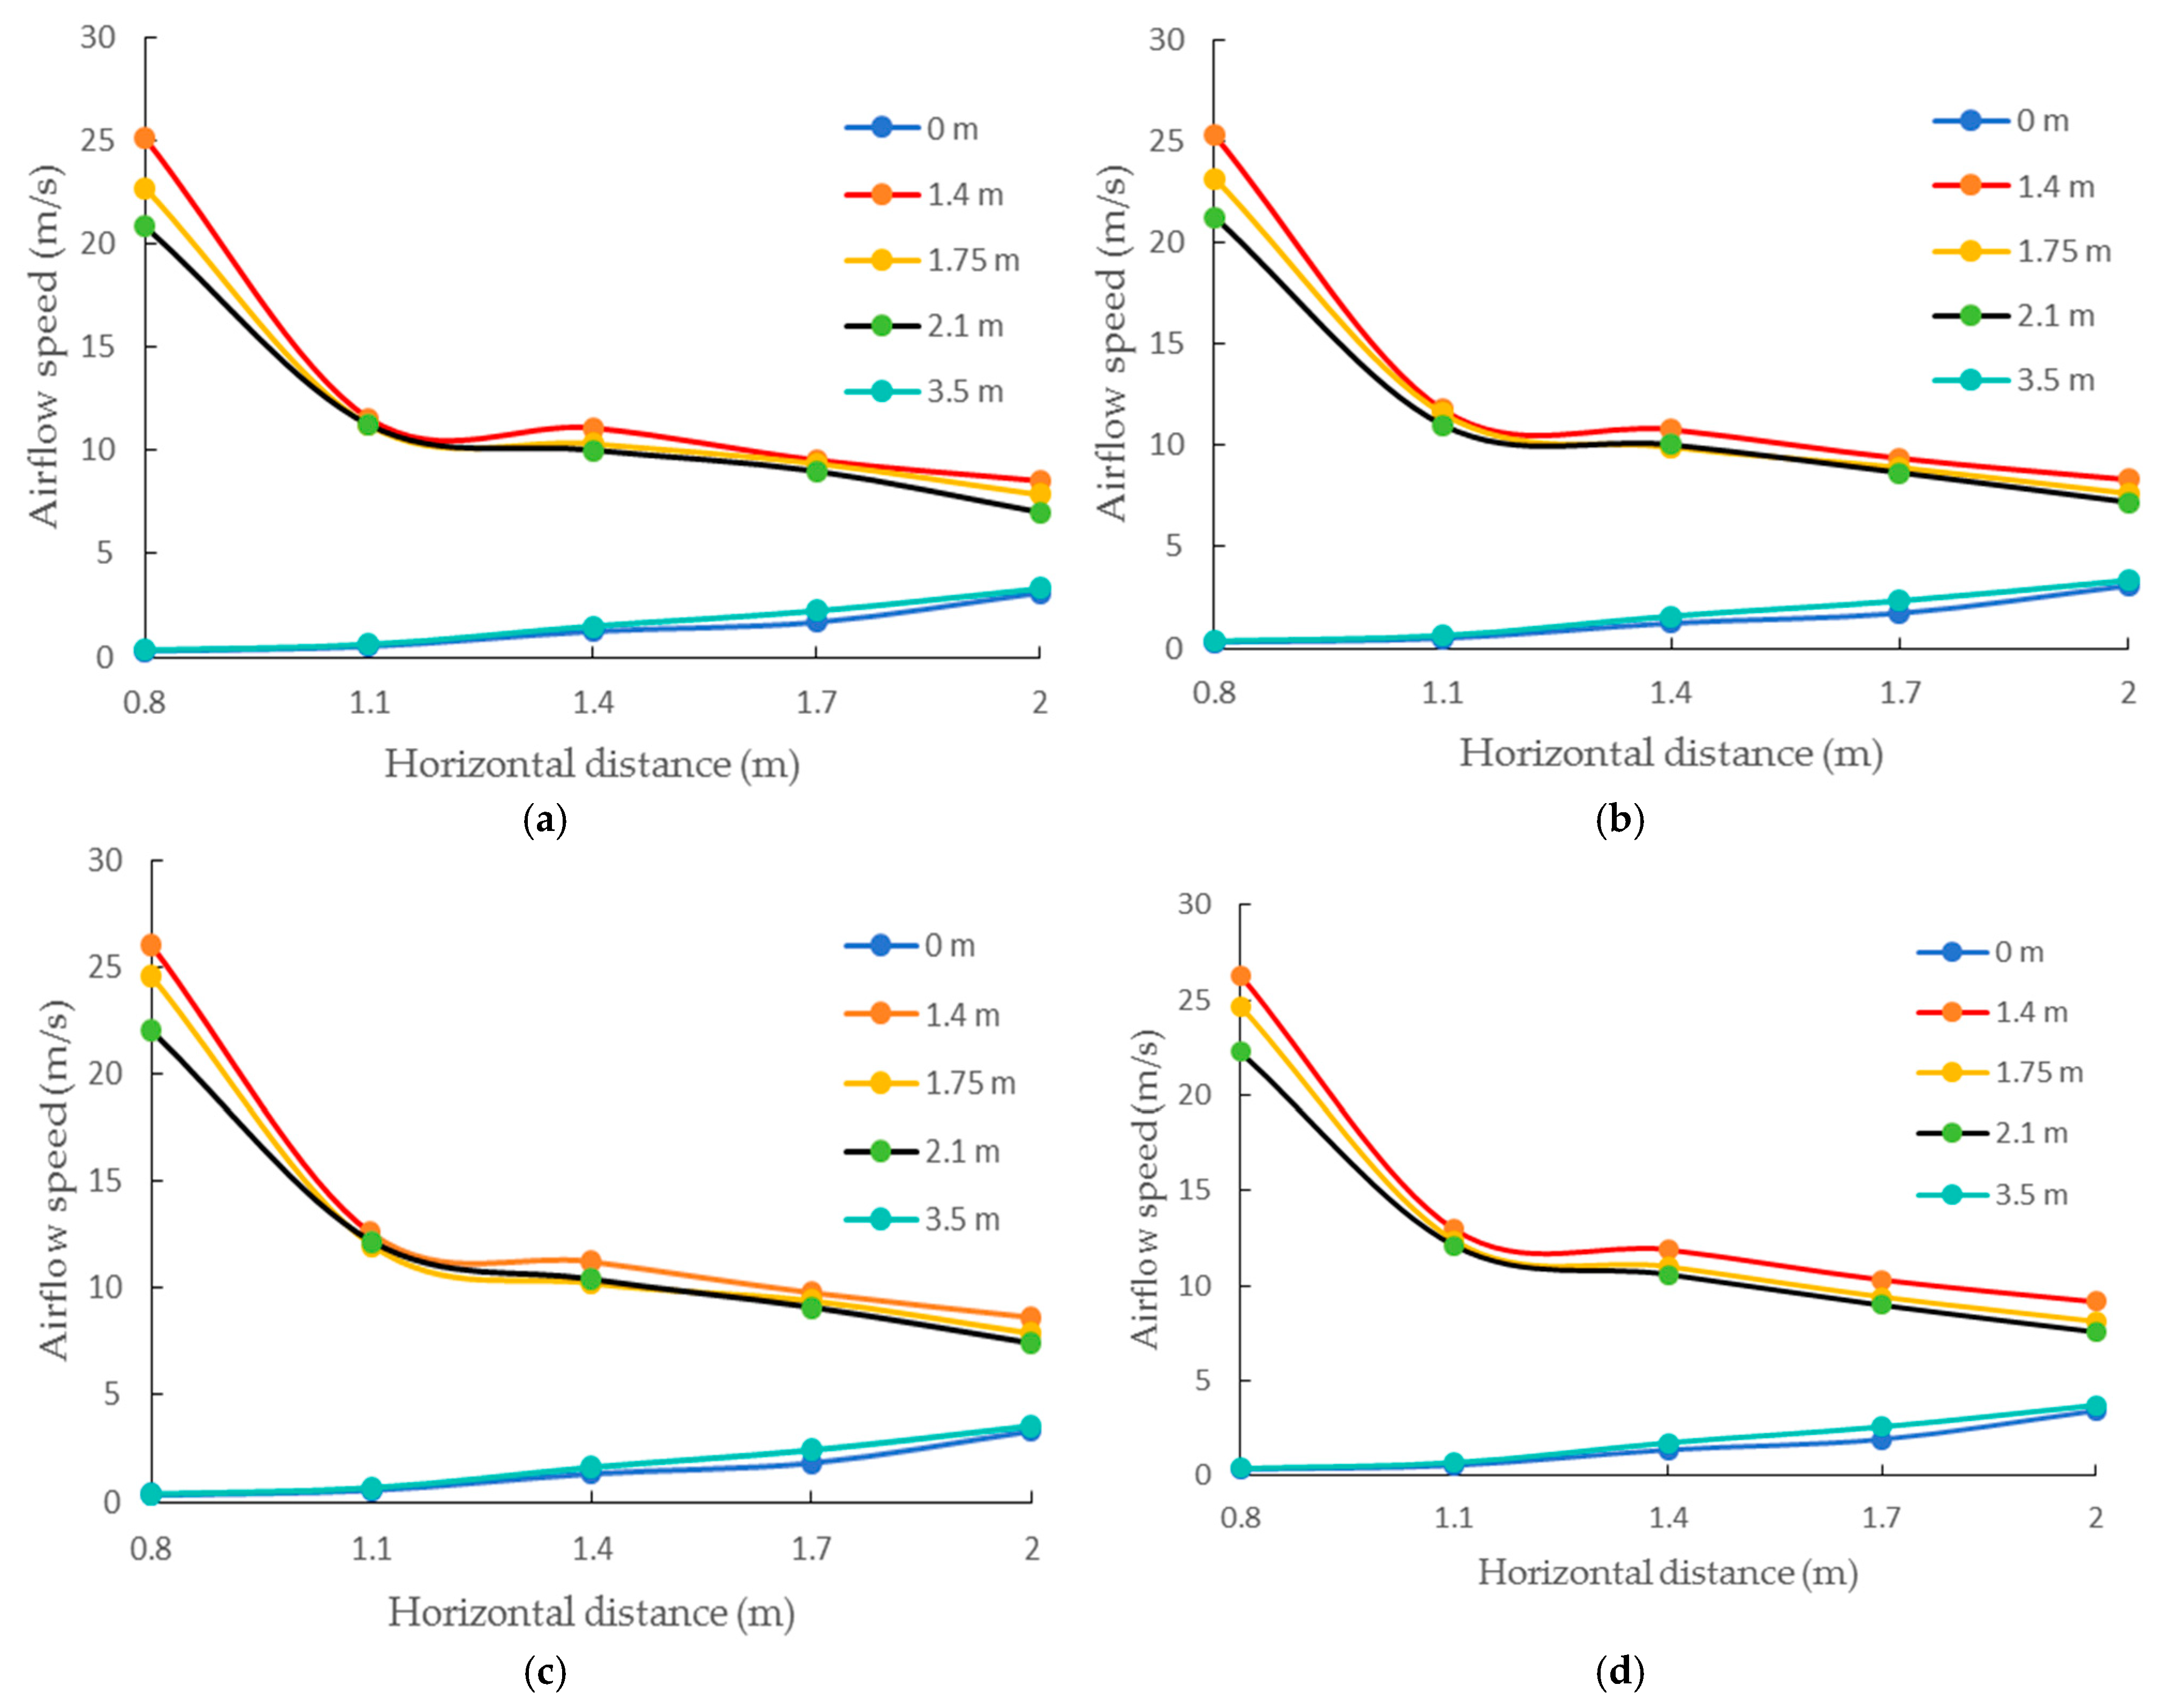
Based on the wind speed results from each measurement point, a comparison curve between the simulated and experimental values of the horizontal airflow velocity at the left and right outlets of the air-delivered system was plotted (Figure 16). The results indicate that the simulated and experimental values of the airflow speed on both the left and right sides decrease significantly within a lateral distance of 0.8–1.1 m, owing to the air resistance encountered at the outlets. In the distant section, due to the increased distance, the effect of air resistance becomes less pronounced, and the decay trends of the airflow on both sides are generally consistent. The relative error for the simulated values on both sides is less than 6%, while that of the experimental values is less than 7%, indicating good consistency in wind speed between the left and right sides. Owing to the impact of unavoidable environmental factors on the airflow, the experimental values of wind speed are slightly higher than the simulated values. The relative error between the experimental and simulated values is within 8% for the left side and within 10% for the right side, demonstrating good agreement and validating the reliability of the simulation model for the air-assisted system.

3.2. Performance Test Results of the Multi-Duct Sprayer and Result Analysis

3.2.1. Droplet Deposition Characteristic Analysis Under Different Spraying Modes

The droplet deposition density measured by water-sensitive test papers can directly reflect the adhesion effect of the pesticide on fruit tree leaves. The mean value, standard deviation, and coefficient of variation in droplet deposition density on fruit tree leaves sampled under different operating parameters are shown in Table 4. It can be observed that when the liquid pump operated independently, the mean value, standard deviation, and coefficient of variation in droplet deposition density under different operating parameters were 43.87–65.64 droplets/cm2, 9.93–18.27 droplets/cm2, and 18.73–28.94%, respectively. The mean droplet deposition density was the highest in test No. V2, at 65.64 droplets/cm2, followed by that of V3 (65.62 droplets/cm2) and V8 (43.87 droplets/cm2). When the liquid pump worked together with the fan, the mean value, standard deviation, and coefficient of variation in droplet deposition density under different operating parameters were 53.87–77.28 droplets/cm2, 12.03–16.86 droplets/cm2, and 18.73–26.06%, respectively. The mean droplet deposition density was the highest in test No. L3, at 77.28 droplets/cm2, followed by that of L2 (73.42 droplets/cm2), and L8 (53.87 droplets/cm2). It can also be seen from Table 4 that under the same operating parameters, the droplet deposition density when the liquid pump and fan worked together was higher than that when the liquid pump worked independently, with significant differences ( p < 0.05 ); this is because the initial velocity of droplets is enhanced by the horizontal airflow generated by the fan across the upper leaves of the front surface during the spraying operation, allowing droplets to adhere to the front surface of the leaves more efficiently [38]. Additionally, the vortex effect produced by the fan airflow improves the droplet deposition on middle-layer leaves at the front [39], and the disturbance of the airflow reflected by the ground is offset by the increased kinetic energy of droplets due to the airflow of the fan, thus increasing the adhesion rate of droplets [38,40]. Moreover, due to the disturbance of the airflow, the dip angle of the leaves at the back changes, increasing the droplet deposition density [40]. The above analysis reveals that compared with the liquid pump operating independently, the adhesion effect of pesticide on fruit tree leaves is better under the cooperative operation of the liquid pump–fan, and the dispersion degree of droplet deposition is reduced. This cooperative air delivery system can provide steady airflow, which is beneficial for covering the whole operating area and improving the operational efficiency of the sprayer.
The test data obtained under different spraying modes—liquid pump independent operation and liquid pump–fan cooperative operation—were subjected to the analysis of variance using SAS software, with the results listed in Table 5. Table 5 shows that the droplet deposition density is significantly affected by different spraying modes ( p < 0.05 ). The p-value for the Analysis of Variance (ANOVA) model is less than 0.05 for both the pump-only operation and the pump–fan cooperative operation. It could also be seen from Table 5 that the nozzle type, driving speed, and nozzle pressure all exerted significant effects; the significance p-value under liquid pump independent operation was 0.003, 0.013, and 0.006, respectively, and that under pump–fan cooperative operation was 0.006, 0.013, and 0.011, respectively, indicating that the influence of the factors is ranked as C > B > A.
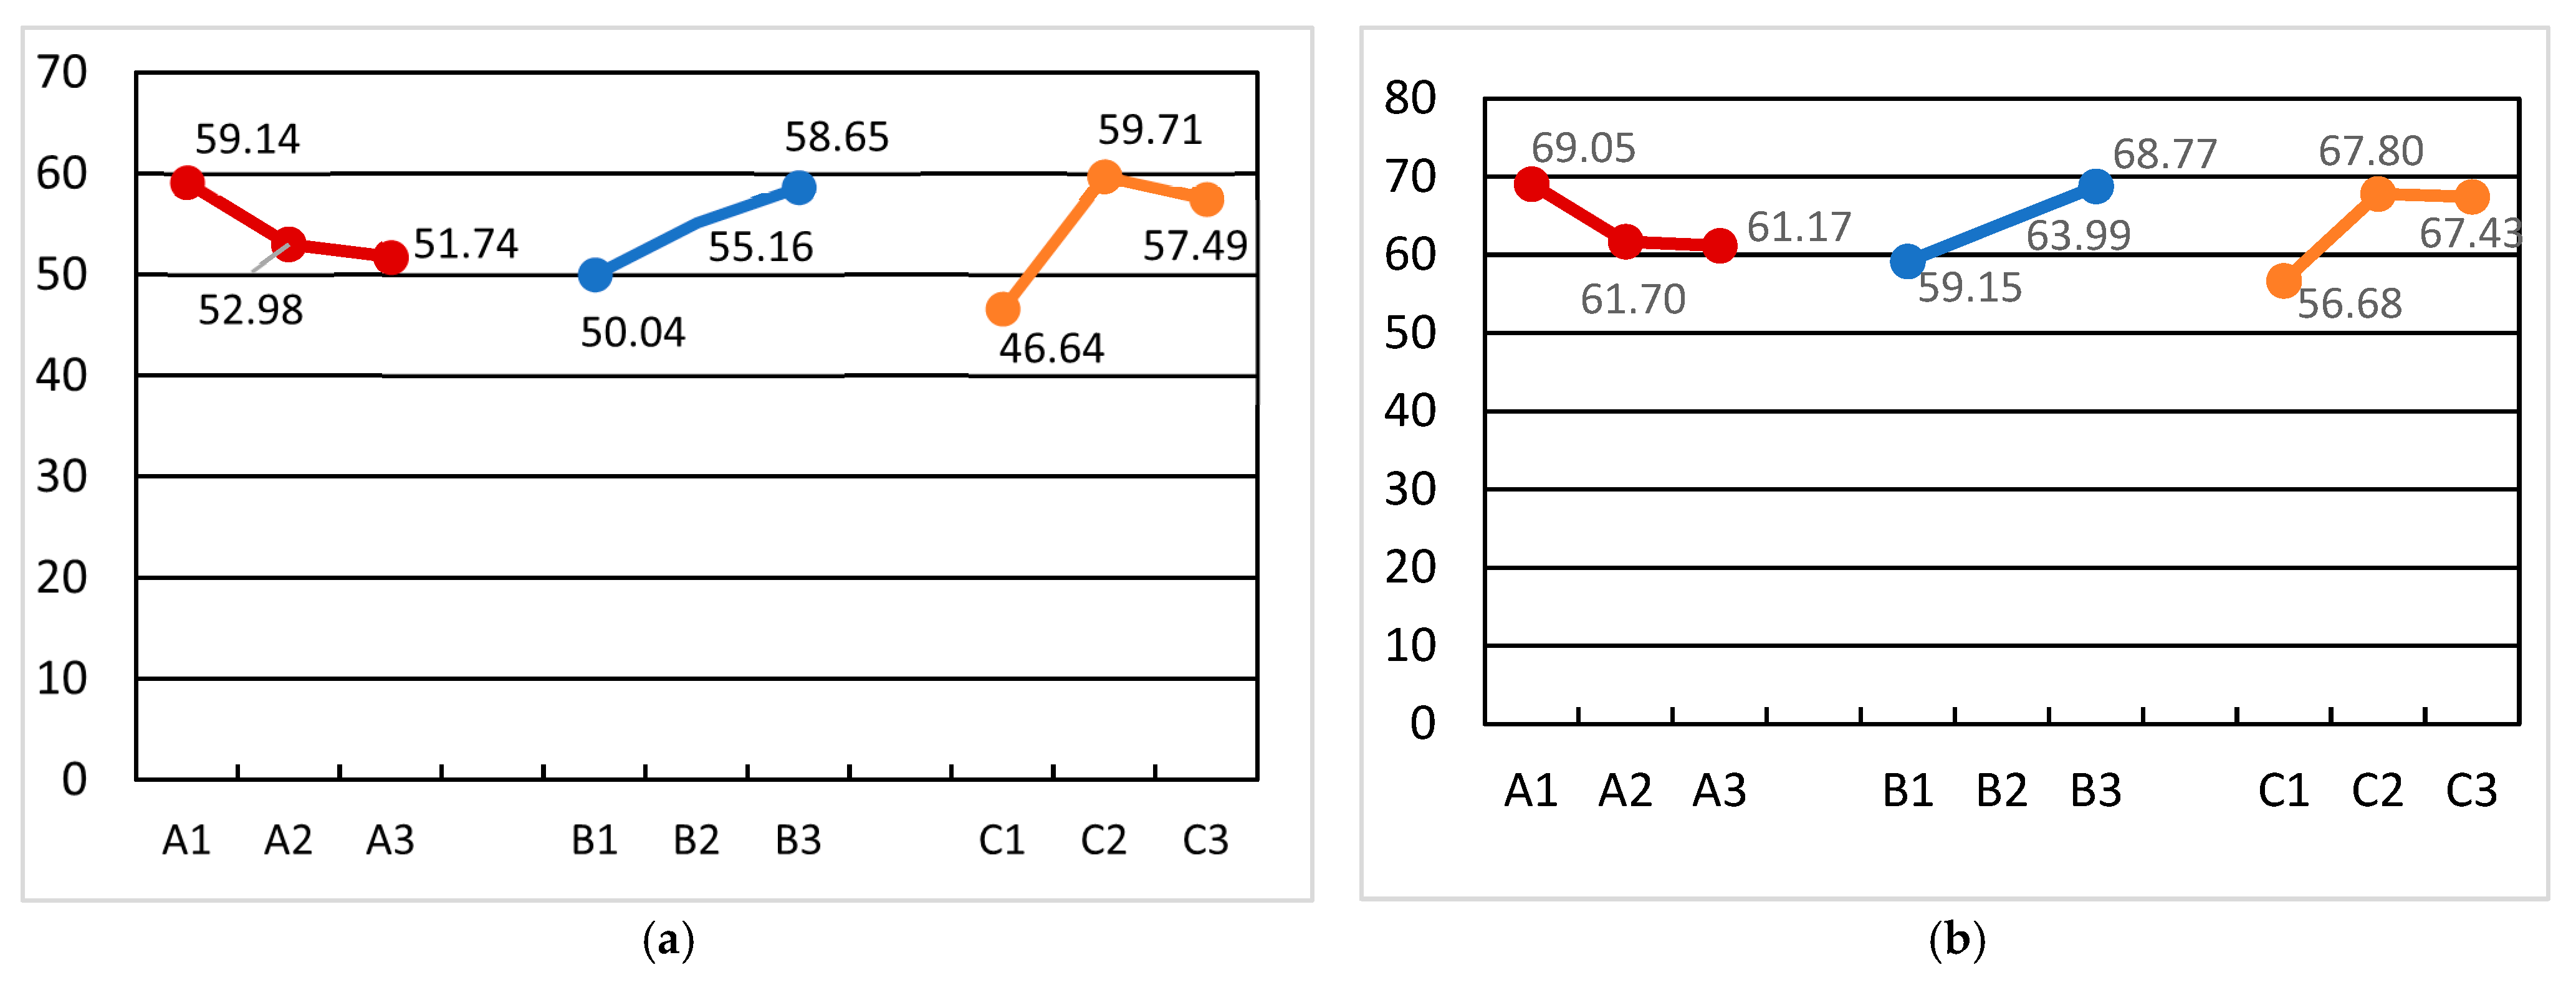
The trend chart (Figure 17) of the 3 factors could be obtained based on the mean values of the three levels of each factor. It can be observed from Figure 17 that under the two spraying modes, the effect of factor C (nozzle type) consistently followed the order C2 > C3 > C1, the effect of factor B followed B3 > B2 > B1, and the effect of factor A (nozzle pressure) followed A1 > A2 > A3. Meanwhile, it can also be seen from Figure 17 that the ranges of factors A, B, and C under liquid pump independent operation were 7.40, 8.61, and 13.07, respectively, and those under liquid pump–fan cooperative operation were 7.88, 9.62, and 11.12, respectively. Under both operation modes, the factors with the greatest influence remained C, B, and A (in descending order), and the optimal spraying performance was achieved at a driving speed of 0.3 m/s, a nozzle pressure of 3 MPa, and a nozzle type of 6502.

3.2.2. Droplet Deposition Density Analysis Under Different Canopy Heights

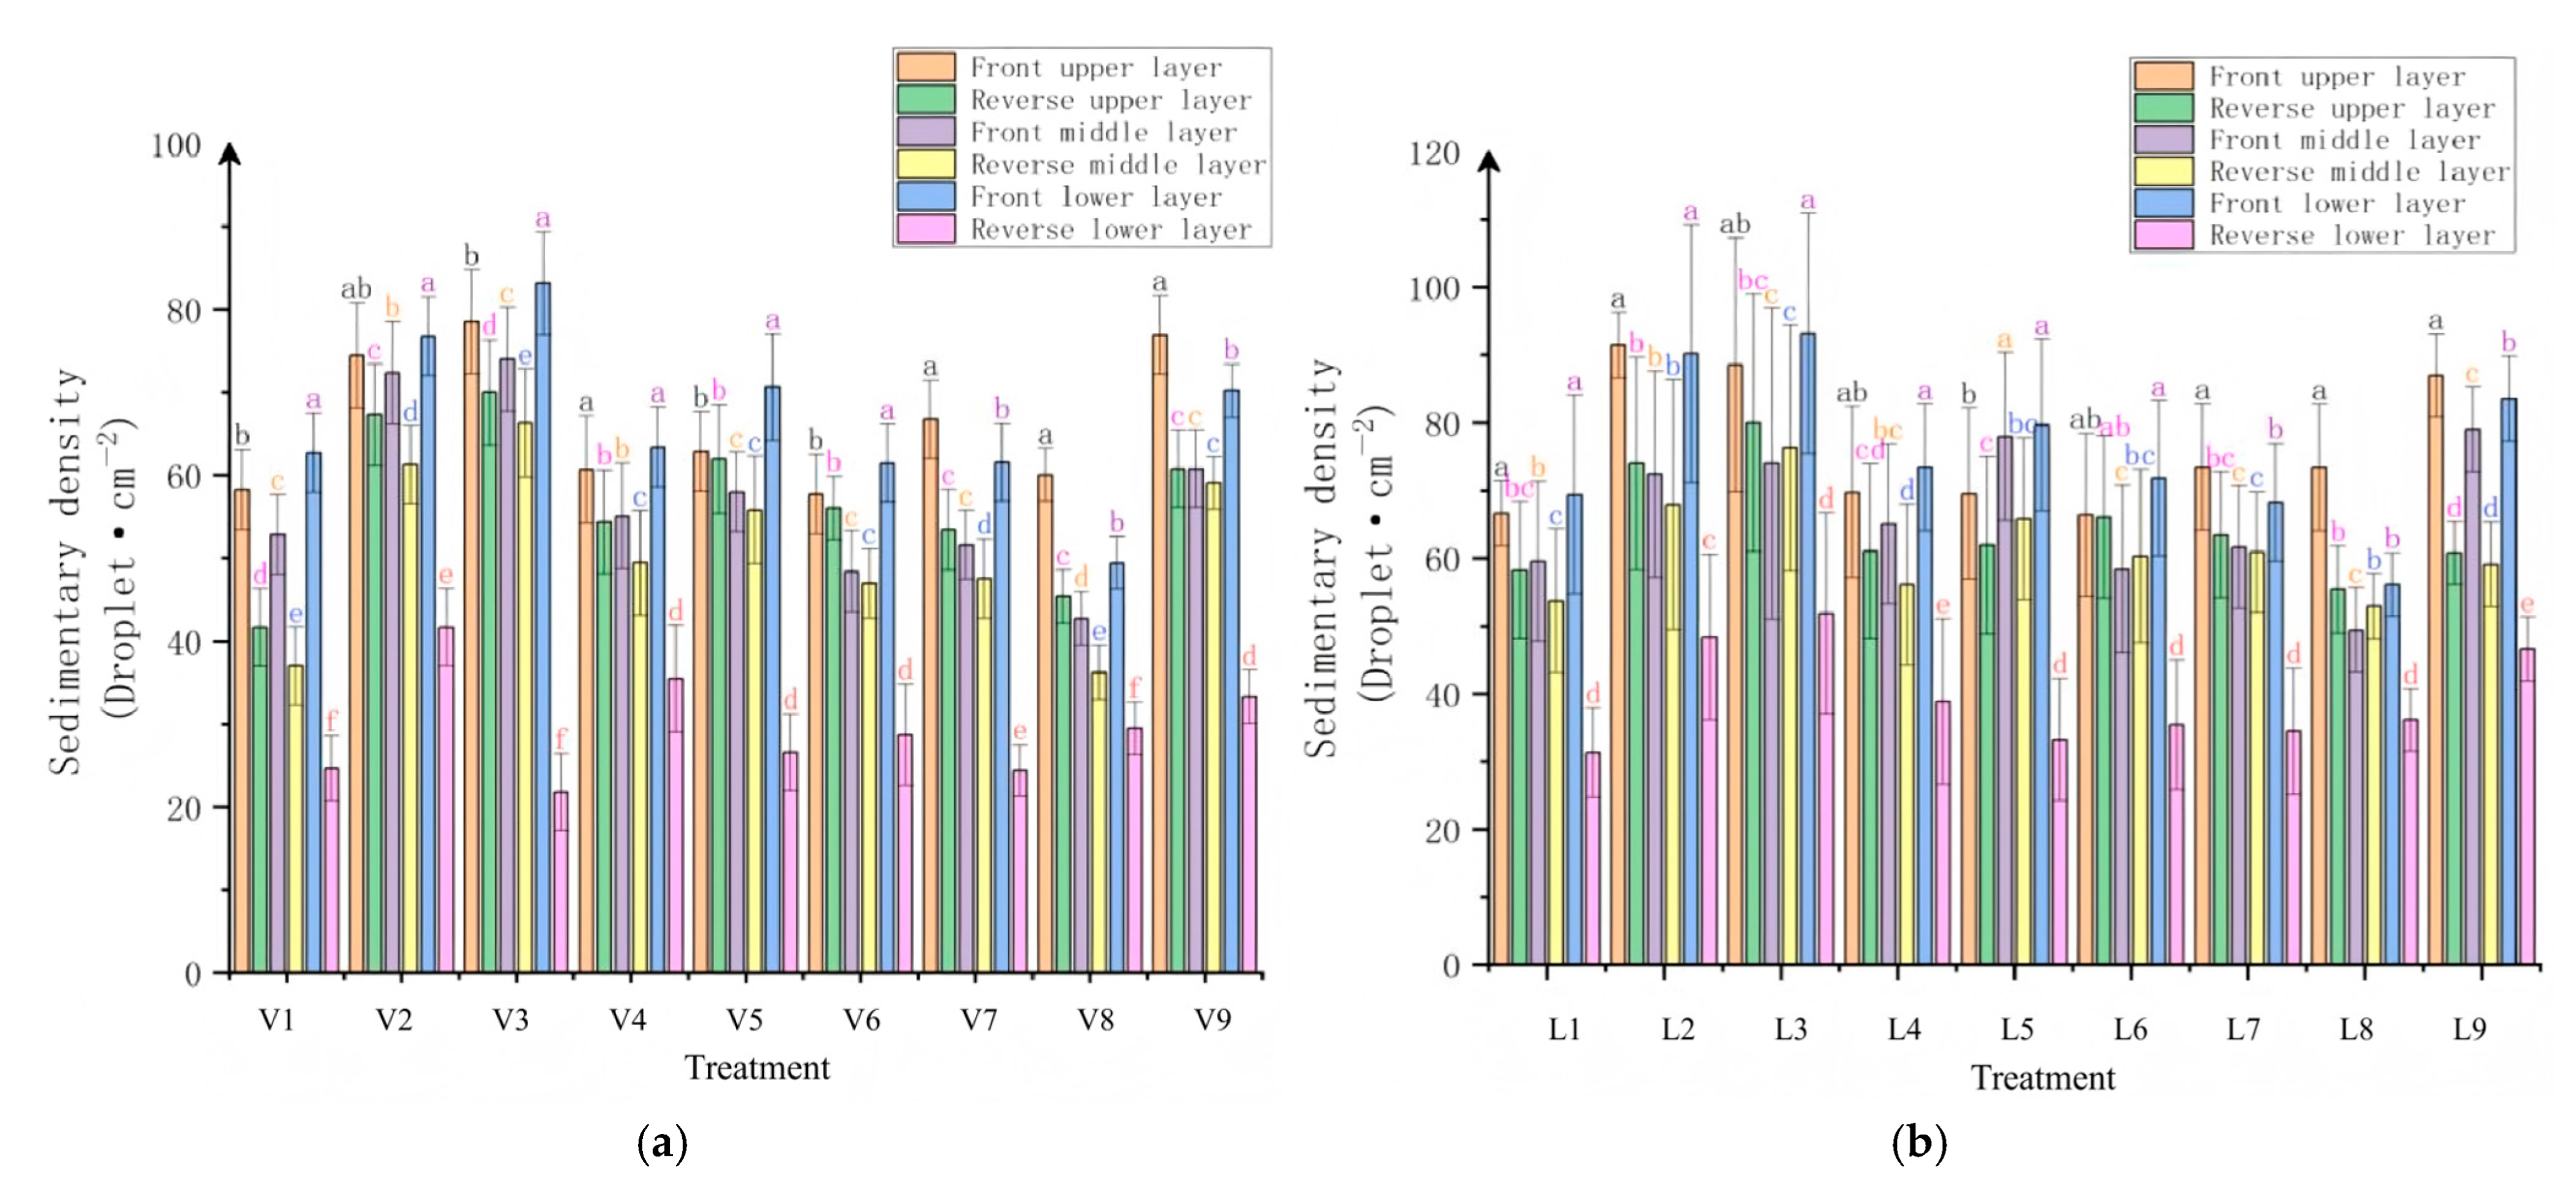
To evaluate the spraying effect on the front and back sides of leaves with different heights, the deposition densities at sampling points within different canopy heights of fruit trees were averaged separately for the liquid pump independent spraying mode and the liquid pump–fan cooperative spraying mode (Figure 18).
As shown in Figure 18, under different spraying modes, the deposition distribution of droplets at different positions within the fruit tree canopy presented significant spatial characteristics ( p < 0.05 ). From Figure 18a, under liquid pump independent operation, the average deposition density on the front side of fruit tree leaves was greater than 40 droplets/cm2, and that on the back of leaves was greater than 20 droplets/cm2. Figure 18b shows that under the liquid pump–fan cooperative spraying mode, the average deposition density on the front side of fruit tree leaves was greater than 50 droplets/cm2, and that on the back side of leaves was greater than 30 droplets/cm2. It could also be seen from Figure 18 that the droplet deposition density on the front side in the upper and lower layers was generally significantly higher than that in the middle layer ( p < 0.05 ), while the droplet deposition density on the back side in the lower layer was markedly lower than that in the middle and upper layers ( p < 0.05 ). This is because the droplet deposition density on the front side in the upper layer is significantly improved under the joint action of the gravitational field and the initial velocity direction of droplets. Due to the large canopy thickness in the middle layer, the dense leaves will form multiple barriers, affecting the droplet deposition efficiency; however, the droplet deposition on the backside of leaves mainly depended on the horizontal component of the initial velocity of droplets. Additionally, since the lower-layer leaves were close to the ground, the dynamic pressure generated in the collision process of droplets would lead to a change in the dip angle of leaves, hindering the effective deposition of droplets on the back side. By comparing the droplet deposition density in the fruit tree canopy under two working conditions—liquid pump independent operation and liquid pump–fan cooperative operation—it was known that when the liquid pump operated independently, the coefficient of variation in the average deposition density on the front side of leaves in the upper, middle, and lower layers ranged from 2.97% to 17.23%, while that on the back side ranged from 21.10% to 50.90%, indicating significantly enhanced nonuniformity on the back side. Under liquid pump–fan cooperative operation, the coefficient of variation for the average deposition density on the front side of leaves in the upper, middle, and lower layers ranged from 4.79% to 20.77%, and that on the back side ranged from 8.21% to 59.87%, reflecting that although droplet penetration is improved, air assistance aggravates the nonuniformity of droplet distribution. This distribution phenomenon is triggered by the dynamic disturbance effect of the airflow, which can carry droplets to enhance their penetration depth in the canopy, but the turbulence effect generated by the airflow will result in the secondary deposition of droplets on the surface of leaves.

3.3. Results and Analysis of Field Verification Test

The best operating parameters, namely, a driving speed of 0.3 m/s, a nozzle pressure of 3 MPa, and a fan-shaped nozzle type of 6502, were used to verify the spraying effect of the two modes in the field. The average coverage rate and deposition density of droplets are shown in Table 6. It can be seen from Table 6 that under liquid pump independent operation, the average coverage rate of droplets on fruit tree canopy leaves was 48.30%, and the average deposition density per unit area was 60.28 droplets/cm2; under liquid pump–fan cooperative spraying mode, the average coverage rate of droplets on fruit tree canopy leaves was 56.54%, and the average deposition density per unit area was 71.24 droplets/cm2; both modes met the relevant standard requirements for plant protection in orchards (coverage ≥ 35%, deposition density ≥ 25 droplets/cm2) [41]. It can also be seen from Table 6 that under liquid pump independent spraying mode, the coefficient of variation for the average droplet coverage on the front side of the leaves ranged from 9.70% to 11.85%, and that on the back side ranged from 11.33% to 22.67%; under liquid pump–fan cooperative spraying mode, the coefficient of variation on the front side ranged from 13.37% to 16.82%, and that on the back side ranged from 14.19% to 19.07%. Both modes satisfied the evaluation criterion for the coefficient of variation in plant protection machinery in orchards (uniformity is considered good when the coefficient of variation is ≤30%) [42], thus meeting the uniformity requirements for droplet distribution. The average coverage and deposition density of droplets on fruit tree canopy leaves under the liquid pump–fan cooperative spraying mode were significantly higher than those under the liquid pump independent spraying mode (p < 0.05). The above analysis indicates that the droplet coverage and deposition density under the liquid pump–fan cooperative spraying mode were both better than those under the liquid pump independent spraying mode. This reveals that the cooperative operation can not only secondarily atomize droplets and prevent droplet drift but also enhance the penetration ability of droplets, since the airflow can turn over leaves, thereby improving the uniformity of droplet coverage and increasing the adhesion rate of droplets at different canopy heights.

4. Conclusions

According to the planting agronomic mode of closed apple orchards and the agronomic requirements of fruit tree spraying, a self-propelled multi-duct sprayer with a multi-duct spraying device and a multi-duct intelligent control system as the core components was developed. The distribution characteristics of the flow fields inside the air duct and outside the air delivery system were simulated using CFD simulation technology and the field test and verification test of spraying performance. The following conclusions were mainly drawn:
(1)
According to the complex topographic characteristics of the closed orchard and the agronomic requirements of the plant protection operation, a centrifugal fan was selected for the air volume generation device in the air delivery system and was matched with an adjustable splitter and duckbill air outlets to ensure the air delivery effect. Based on the principles of air replacement and final velocity, the air volume of the centrifugal fan in the air-delivered spray system was designed as 10,000/m3·h, enabling the airflow to overcome the canopy resistance and carry droplets to enter the inner chamber of the fruit tree. The vertical and horizontal adjustment ranges of the integral intelligent lifting device driven by the electric push rod in the multi-duct system were 1.0–1.5 m and 0.9–1.3 m, respectively, meeting the plant protection requirement of orchards under different planting patterns in different periods.
(2)
CFD-based simulation of the flow field inside the centrifugal fan and outside the air delivery system showed that an air duct size of 230 × 110 mm, an air outlet distance of 350 mm, and a fan speed of 2160 r/min can simultaneously meet the requirements for both width and final velocity.
(3)
The field L9(34) orthogonal test results indicate that under the same operating parameters, the droplet deposition density under liquid pump–fan cooperative operation is significantly higher than that under liquid pump independent operation (p < 0.05). Under the liquid pump–fan cooperative spraying mode, liquid pesticide achieves better adhesion on fruit tree leaves, with a reduced dispersion degree of droplet deposition; under different operating modes, the factors with the greatest influences are, in order, C, B, and A, and the optimal spraying performance is achieved at a driving speed of 0.3 m/s, a nozzle pressure of 3 MPa, and a nozzle type of 6502.
(4)
The field spraying experimental verification was conducted under the optimal operating parameters. The results show that the average droplet coverage and deposition density on fruit tree canopy leaves under liquid pump independent operation mode are 48.30% and 60.54 droplets/cm2, respectively, and those under liquid pump–fan cooperative operation mode are 56.54% and 71.34 droplets/cm2, respectively; the coefficients of variation for the average droplet coverage on the front and back sides of fruit tree canopy leaves under liquid pump independent operation mode range from 9.70% to 11.85% and from 11.33% to 22.67%, respectively, and those under liquid pump–fan cooperative operation mode range from 13.37% to 16.82% and from 4.19% to 19.07%, respectively. Both sets of results meet the evaluation criterion for the coefficient of variation in plant protection machinery in orchards. Furthermore, the average droplet coverage and deposition density on fruit tree canopy leaves under liquid pump–fan cooperative mode are significantly higher than those under liquid pump independent operation mode (p < 0.05). Under cooperative operation mode, the droplets, assisted by the fan airflow, can penetrate the canopy, improving the uniformity of droplet coverage on leaves and elevating the adhesion rate of droplets at different canopy heights.

Author Contributions

Conceptualization, J.W.; methodology, J.W., F.Z. and Q.C.; software, F.Z., Y.W. and J.W.; data curation, F.Z., H.L. and Y.J.; investigation, J.W., Y.Z. and Z.Z.; writing—original draft, J.W.; writing—review and editing, J.W.; funding acquisition, J.W., Q.C., Y.Z. and Z.Z. All authors have read and agreed to the published version of the manuscript.

Funding

This research was funded by the Key Research Project of Shanxi Province (202102020101012), the National Natural Science Foundation of China (11802167), and the Applied Basic Research Project of Shanxi Province (201801D221297).

Institutional Review Board Statement

Not applicable.

Data Availability Statement

The data reported in this study are contained within the article and are available upon request from the corresponding author. The data are not publicly available due to copyright implications.

Acknowledgments

The authors would like to thank the technical editor and anonymous reviewers for their constructive comments and suggestions on this study.

Conflicts of Interest

The authors declare no conflicts of interest.

References

  1. Argenta, C.; Amarante, D.; Betinelli, S.; Brancher, L.; Nesi, N.; Vieira, J. Comparison of fruit attributes of ‘Fuji’ apple strains at harvest and after storage. Sci. Hortic. 2020, 272, 109585. [Google Scholar] [CrossRef]
  2. Abasi, S.; Minaei, S.; Jamshidi, B.; Fathi, D. Development of an optical smart portable instrument for fruit quality detection. IEEE Trans. Instrum. Meas. 2021, 70, 7000109. [Google Scholar] [CrossRef]
  3. Wang, Y.; Han, L.; Qi, K.; Hou, J. Transaction Costs and Farm-to-Market Linkages in China: Empirical Evidence from Apple Producers. J. Agric. Sci. 2024, 12, 82. [Google Scholar] [CrossRef]
  4. Zhou, J.; Zhao, D.; Chen, Y.; Kang, G.; Cheng, C. Analysis of apple producing area changes in China. J. Fruit Sci. 2021, 38, 372–384. [Google Scholar]
  5. Wang, H. Study on the Restrictions and Countermeasures of Developing Shanxi Apple Industry. Master’s Thesis, Northwest A&F University, Yanling, China, 2012. [Google Scholar]
  6. Yu, L.; Zhao, Q.; Li, L.; Zhang, J.; Du, J.; Niu, Z. Major cultivation techniques suitable for fruit high quantityand efficiency production Shanxi Province in 2020. J. Fruit Res. 2020, 1, 52–56. [Google Scholar]
  7. Zhang, J.; Wang, C.; He, J.; Zhang, D. Causes and Reformation Strategies of Apple Closed-in Orchards. Xiandai Nongcun Keji 2019, 12, 43+99. [Google Scholar]
  8. Shang, G. Causes of Canopy Closure and Improvement Measures in Standard Apple Orchards. Northwest Hortic. 2022, 12, 15–16. [Google Scholar]
  9. Wang, S.; Song, J.; He, X.; Li, Y.; Ling, Y. Design of air-assisted electric knapsack sprayer and experiment of its operation performance. Tran. Chin. Soc. Agric. Eng. 2016, 32, 67–73. [Google Scholar]
  10. Wu, J.; Wang, X.; Zhang, W.; Xie, X.; Li, C.; Rao, X. Study on precise variable operation control method of orchard plant protection unmanned aerial vehicles. China Plant Prot. 2024, 44, 11–16. [Google Scholar]
  11. Chen, H. Portable Efficient Application Techniques in Hilly Orchards Chen Hongju. Beijing Nongye 2012, 15, 45–46. [Google Scholar]
  12. Gao, Y.; Zhao, J.; Zhang, P.; Liu, Z.; Shi, G.; Fan, R. Risk Assessment of Human Exposure to Beta-Cypermethrin During Application in Apple Orchard. Agr. Ochem. 2021, 60, 38–41+65. [Google Scholar]
  13. Li, C.; Zhang, X.; Jiang, J.; Hu, Y. Development and experiment of riser air-blowing sprayer in vineyard. Tran. Chin. Soc. Agric. Eng. 2013, 29, 71–78. [Google Scholar]
  14. Dong, X.; Zhang, T.; Yan, M.; Yang, X.; Yan, H.; Sun, X. Design and Experiment of 3WPZ-4 Type Air-assisted Grape Sprayer. J. Agric. Mach. 2018, 49, 205–213. [Google Scholar]
  15. Chen, J.Z.; Song, S.R.; Sun, D.Z.; Hong, T.S.; Zhang, L. Test on airflow field and spray characteristics for long-range air-blast sprayer. J. Agric. Mach. 2017, 33, 72–79. [Google Scholar]
  16. Li, H.; Chen, Z.; Li, Q.; Tang, Y.; Wang, P. Structural Designal and Experimental Test for Airflow Field Optimization of An Air-Assisted Radial Targeting Sprayer. J. Southwest Univ. (Nat. Sci. Ed.) 2024, 46, 195–206. [Google Scholar]
  17. Zhu, H.; Brazee, R.; Derksen, R.; Ozkan, H.; Fox, R. A specially designed air-assisted sprayer to improve spray penetration and air jet velocity distribution inside dense nursery crops. Trans. Asabe 2006, 49, 1285–1294. [Google Scholar] [CrossRef]
  18. Gil, E.; Llorens, J.; Llop, J.; Gallart, R.; Arnó, J.; Escolà, A. Variable rate sprayer. Part 2-Vineyard prototype: Design, implementation, and validation. Comput. Electron. Agric. 2013, 95, 136–150. [Google Scholar] [CrossRef]
  19. Ru, Y.; Chen, X.; Liu, B.; Wang, S.; Lin, M. Optimized Design and Performance Test of Axial Flow Orchard Sprayer Air Delivery System. J. Agric. Mach. 2022, 53, 147–157. [Google Scholar]
  20. Jiang, H.; Bai, P.; Liu, L.; Dong, X.; Song, J.; Zhang, X. Caterpillar Self-propelled and Air-assisted Orchard Sprayer with Automatic Target Spray System. J. Agric. Mach. 2016, 47, 189–195. [Google Scholar]
  21. Song, L.; Li, J.; Yang, X.; Wang, P. Optimization Design of Wind Field Parameters of Tower Type Wind-driven Orchard Sprayer. J. Agric. Mech. Res. 2020, 42, 12–17. [Google Scholar]
  22. Zhang, Z.; Wang, D.; Li, J.; Wang, P.; Guo, Y.; Tian, S. Design and Experiment of Dual Flexible Air Duct Spraying Device for Orchards. Agriculture 2021, 15, 1031. [Google Scholar] [CrossRef]
  23. Duga, A.; Delele, M.; Ruysen, K.; Nuyttens, D.; Verboven, P.; Nicolai, B. Development and validation of a 3D CFD model of drift and its application to air-assisted orchard sprayers. Biosyst. Eng. 2017, 154, 62–75. [Google Scholar] [CrossRef]
  24. Duga, A.; Dekeyser, D.; Ruysen, K.; Nuyttens, D.; Verboven, P.; Nicolai, B. Numerical analysis of the effects of wind and sprayer type on spray distribution in different orchard training systems. BLM 2015, 157, 517–535. [Google Scholar] [CrossRef]
  25. Delele, M.; Jaeken, P.; Baer, C.; Schampheleire, J.; Verboven, P.; Nicolai, B.; Velde, H.; Nuyttens, D. CFD prototyping of an air-assisted orchard sprayer aimed at drift reduction. Comput. Electron. Agric. 2007, 55, 16–27. [Google Scholar] [CrossRef]
  26. Endalew, A.; Baer, C.; Rutten, N.; Vercammen, J. A new integrated CFD modelling approach towards air-assisted orchard spraying. Part I. Model development and effect of wind speed and direction on sprayer airflow. Comput. Electron. Agric. 2010, 71, 128–136. [Google Scholar] [CrossRef]
  27. Yang, F.; Li, Z.; Li, Y.; Huang, Z.; Ru, Y.; Zhou, H. Wind force test and simulation analysis for air delivery system of orchard sprayer. Acta Agric. Univ. Jiangxiensis 2024, 46, 1610–1622. [Google Scholar] [CrossRef]
  28. Niu, Y. Design and Experiment of Three-Port Air-Assisted Variable Sprayer for Citrus Orchards. Master’s Thesis, Huazhong Agricultural University, Wuhan, China, 2012. [Google Scholar]
  29. Huang, X.; Li, Y.; Chen, L.; Wang, K. CFD-Based Flow Field Characteristics of Air-Assisted Sprayer in Citrus Orchards. Agriculture 2021, 15, 1103. [Google Scholar] [CrossRef]
  30. Yang, F.; Sun, J.; Li, Y.; Zhang, Y.; Liu, Z. Design and performance test of image transmission remote control mower in closed orchard. J. Jilin Univ. Eng. Technol. Ed. 2024, 54, 281–293. [Google Scholar]
  31. GB/T 17997-2008; Evaluating Regulations for the Operation and Spraying Quality of Sprayers in the Field. China Standards Press: Beijing, China, 2008.
  32. NY/T 650-2013; Operating Quality for Sprayers. China Agriculture Press: Beijing, China, 2013.
  33. GB/T 32250.1-2022; National Technical Committee of Agricultural Machinery on Standardization (SAC/TC 201). Agricultural and Forestry Machinery—Inspection of Sprayers in Use—Part 1: General. China Standards Press: Beijing, China, 2022.
  34. Zhang, J.N.; Wang, C.; Zhang, D.; Yang, C. Effect of smallholder farmers’ management behavior on the canopy density of apple orchard. Jiangsu J. Agric. Sci. 2021, 37, 163–168. [Google Scholar]
  35. Dai, F.F. Selection and calculation of the blowing rate of air-assisted sprayers. Plan Prot. 2008, 6, 124–127. [Google Scholar]
  36. JB/T 9782-2014; Equipment for Crop Protection-General Test Methods. China Machine Press: Beijing, China, 2014.
  37. Fritz, B.K.; Hoffmann, W.C.; Bagley, W.E.; Kruger, G.R.; Czaczyk, Z.; Henry, R.S. Measuring droplet size of agricultural spray nozzles–Measurement distance and airspeed effects. At. Sprays 2014, 24, 747–760. [Google Scholar] [CrossRef]
  38. He, G.X.; Zeng, A.J.; He, J. Effect of Wind velocity from orchard sprayer on droplet deposit and Distribution. Tran. Chin. Soc. Agric. Eng. 2002, 04, 75–77. [Google Scholar]
  39. Li, X.; Lu, D.P.; Wang, S.L.; Fan, D.Q.; Zhou, H.; Lü, X.L. Simulation and Test on Droplet Distribution and Deposition of Fixed-pipe Cold Fogging System in Greenhouse. J. Agric. Mach. 2020, 51, 261–267. [Google Scholar]
  40. Xu, L.Y.; Wu, Y.Z.; Zhou, H.P.; Zhang, J.; Zhang, C. Analysis of spatial motion attitude and droplet deposition effect of tree leaves in response to wind vibration. Tran. Chin. Soc. Agric. Eng. 2024, 40, 71–81. [Google Scholar]
  41. Yan, Y.; Lan, Y.; Wang, G.; Xu, T.; Deng, J.; Chen, P.; Wang, L. Evaluation of the deposition and distribution of spray droplets in citrus orchards by plant protection drones. Fron. Plant Sci. 2023, 14, 1303669. [Google Scholar] [CrossRef] [PubMed]
  42. Liu, Y.; Xiao, Q.; Han, X.; Lan, Y.; Chen, S.; Wang, J.; Zhang, H.; Wang, X.; Li, J. Effect of aerial application of adjuvants on pepper defoliant droplet deposition and efficacy of defoliation sprayed by unmanned aerial vehicles. Fron. Plant Sci. 2022, 13, 917462. [Google Scholar] [CrossRef]
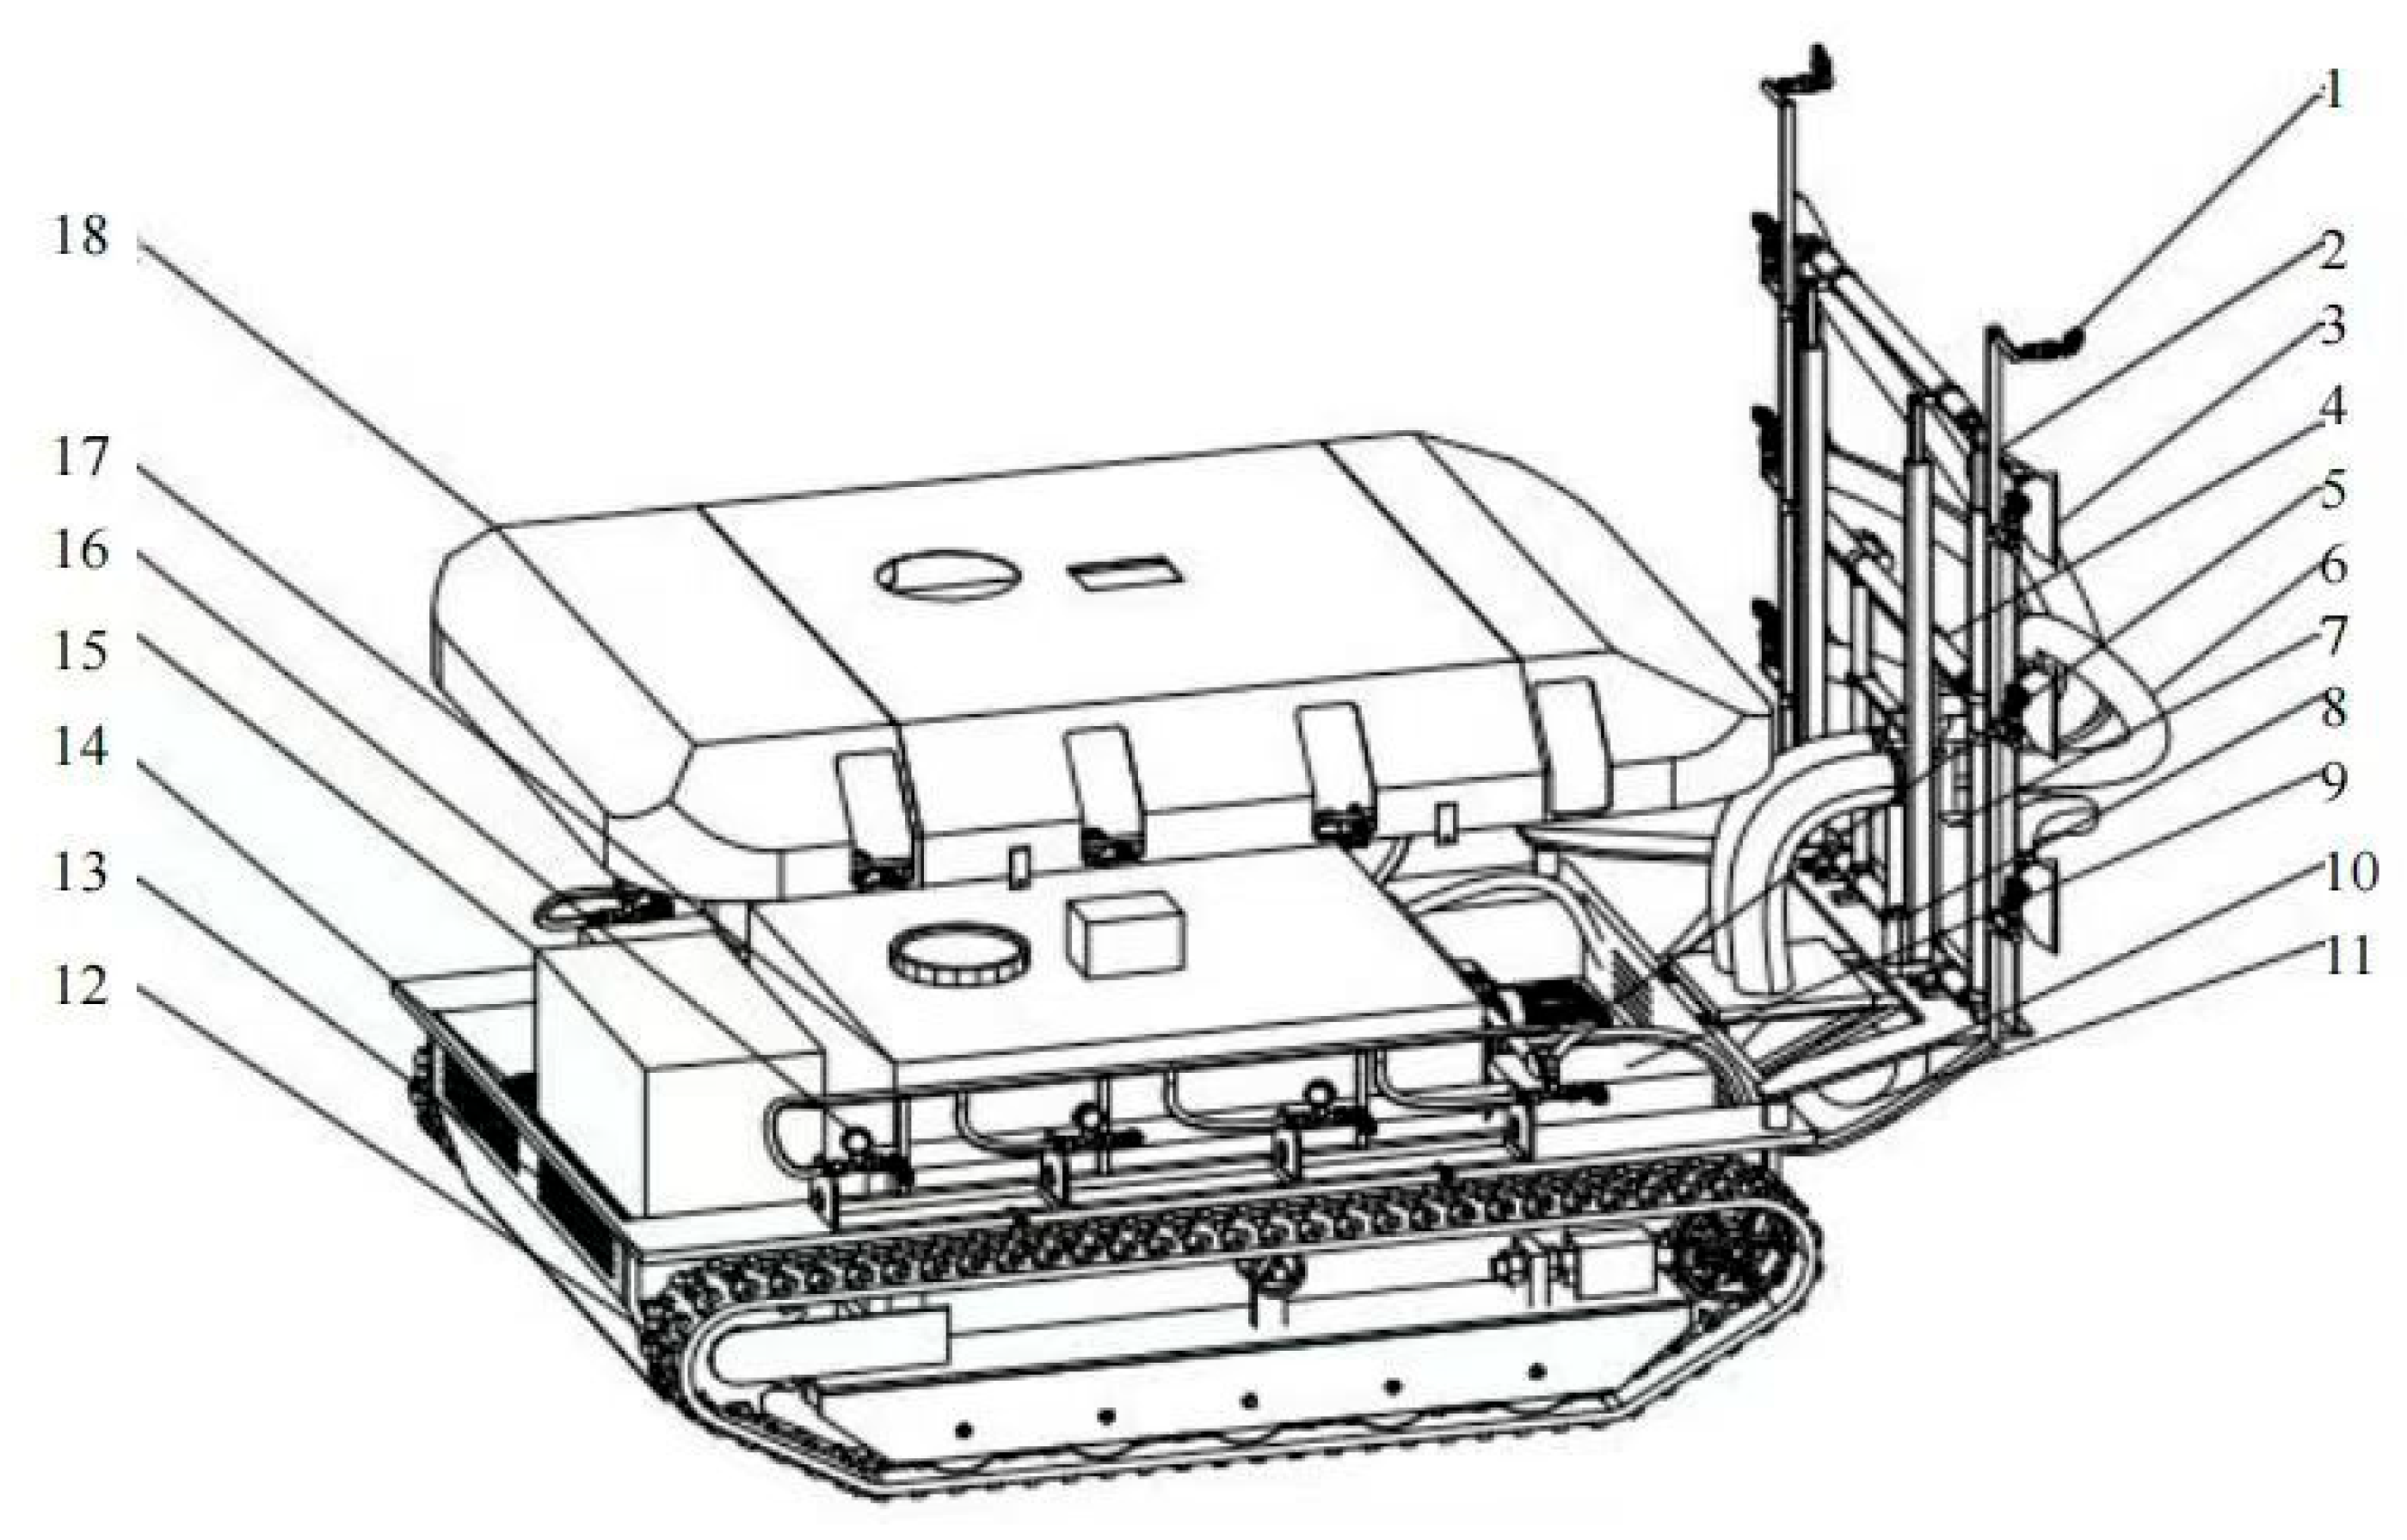
Figure 1. Structural diagram of the multi-duct air-delivered sprayer. Note: 1—high-pressure nozzle; 2—vertical spray bar; 3—duckbill air outlet; 4—horizontal electric push rod; 5—plunger pump; 6—bellows; 7—splitter; 8—vertical electric push rod; 9—storage batteries; 10—mounting base; 11—centrifugal fan; 12—crawler; 13—frames; 14—driving motor; 15—range extender; 16—pressure gauge; 17—liquid chemical storage tank; 18—shell.
Agriculture 15 01958 g001
Figure 2. Layout structure sketch of the sprayer waterway. Note: 1—fan-shaped nozzle; 2—vertical spray bar; 3—drain outlet; 4—outlet pipeline; 5—flow divider valve; 6—liquid chemical storage tank; 7—tank cover; 8—matching motor; 9—return line; 10—high-pressure plunger pump; 11—high-pressure water delivery pipeline; 12—pressure gauge.
Agriculture 15 01958 g002
Figure 3. Structure sketch of a multi-duct air delivery device. Note: 1—nozzle; 2—vertical spray bar; 3—duckbill air outlet; 4—chrome-plated steel pipe; 5—vertical electric push rod; 6—mounting base; 7—optical axis; 8—splitter; 9—horizontal electric push rod.
Agriculture 15 01958 g003
Figure 4. The general flowchart of the spray control system.
Agriculture 15 01958 g004
Figure 5. The schematic diagram of the control circuit of the spray system.
Agriculture 15 01958 g005
Figure 6. The integrated wiring diagram of the spray control system.
Agriculture 15 01958 g006
Figure 7. Simulation model. Note: 1—The flow field model outside the air delivery system; 2—The fan air duct model.
Agriculture 15 01958 g007
Figure 8. (a) The distribution of airflow speed measurement points; (b) wind speed test experimental setup.
Agriculture 15 01958 g008
Figure 9. Sampling points in the field test: (a) front sampling points and (b) back sampling points.
Agriculture 15 01958 g009
Figure 10. Sampling diagram of test fruit trees.
Agriculture 15 01958 g010
Figure 11. Real picture of the multi-duct air-delivered sprayer.
Agriculture 15 01958 g011
Figure 12. Field spraying performance test.
Agriculture 15 01958 g012
Figure 13. Droplet image processing of water-sensitive test papers: (a) image collecting; (b) grayscale processing; and (c) binary image processing.
Agriculture 15 01958 g013
Figure 14. Simulation of the flow field inside the fan air duct: (a) 230 × 100 mm velocity distribution contour map; (b) 230 × 110 mm velocity distribution contour map; and (c) 230 × 120 mm velocity distribution contour map.
Agriculture 15 01958 g014
Figure 15. Simulation results of external flow field under different fan speeds and different air outlet spacings: (a) distance 200 mm + 1080 r/min; (b) distance 350 mm + 1080 r/min; (c) distance 500 mm + 1080 r/min; (d) distance 200 mm + 1620 r/min; (e) distance 350 mm + 1620 r/min; (f) distance 500 mm + 1620 r/min; (g) distance 200 mm + 2160 r/min; (h) distance 350 mm + 2160 r/min; and (i) distance 500 mm + 2160 r/min.
Agriculture 15 01958 g015aAgriculture 15 01958 g015b
Figure 16. Comparison diagram of air speed: (a) left-side simulated value; (b) right-side simulated value; (c) left-side test value; (d) right-side test value.
Agriculture 15 01958 g016
Figure 17. Factor trends in the orthogonal test under different spraying modes: (a) liquid pump independent operation; (b) liquid pump–fan cooperative operation.
Agriculture 15 01958 g017
Figure 18. Droplet deposition density on front and back sides of leaves under different spraying modes, and analysis of variance (ANOVA) was employed to test for significance, with a subsequent Duncan’s test performed for multiple comparisons of means, and different lowercase letters denote significant differences among a treatment group (p < 0.05): (a) liquid pump independent operation; (b) liquid pump–fan cooperative operation.
Agriculture 15 01958 g018
Table 1. Main technical parameters of the multi-duct air-delivered sprayer.
ItemValue
Unmanned vehicle power (kW) 17.4
Unmanned vehicle overall size (L × W × H mm)2000 × 1260 × 750
Overall weight (kg)665
Walking modeSelf-propelled crawler-type
Operation modeRemote mode
Operation speed (m/s)0–1.5
Climbing slope (°)≤45
Oil tank capacity (L)7.5
Battery capacity (A·h)100
Spraying power (kW) 2 × 1.5
Number of nozzles 6
Liquid chemical tank capacity (L)300
Spraying width (m)8
Rated spray volume of single pump (L/min)≥8
Table 2. Main technical parameters of a spraying lifting device.
ItemValue
Vertical spray bar height (mm) 1100
The adjustment range of vertical spray bar height (mm)500
The adjustment range of vertical spray bar width (mm)400
Table 3. Implementation plan for the orthogonal test of sprayer operation.
TreatsFactor Coding VariablesFactor Actual Variables
Driving Speed
(m/s)
Nozzle Pressure
(MPa)
Nozzle TypeDriving Speed
(m/s)
Nozzle Pressure
(MPa)
Nozzle Type
1A1B1C10.326501
2A1B2C20.32.56502
3A1B3C30.336503
4A2B1C20.826502
5A2B2C30.82.56503
6A2B3C10.836501
7A3B1C31.326503
8A3B2C11.32.56501
9A3B3C21.336502
Table 4. Statistical data of droplet deposition density in the sprayer orthogonal test.
Experiment NumberDroplet Deposition DensityExperiment NumberDroplet Deposition Density
Mean ± Standard Deviation (Droplets/cm2) Coefficient VariationMean ± Standard Deviation (Droplets/cm2) Coefficient Variation
V146.17 ± 12.93 A28.01%L156.45 ± 13.59 B24.07%
V265.64 ± 12.99 A19.79%L273.42 ± 15.14 B20.63%
V365.62 ± 18.27 A27.85%L377.28 ± 14.47 B18.73%
V453.07 ± 9.93 A18.72%L460.68 ± 12.34 B20.34%
V555.97 ± 15.27 A27.29%L564.69 ± 16.86 B26.06%
V649.89 ± 11.77 A23.59%L659.72 ± 12.84 B21.51%
V750.88 ± 14.72 A28.94%L760.32 ± 13.54 B22.44%
V843.87 ± 10.61 A24.18%L853.87 ± 12.03 B22.33%
V960.43 ± 14.9 A24.66%L969.31 ± 16.12 B23.26%
Note: Means within rows with a different uppercase letter are significantly different (p ≤ 0.05).
Table 5. Analysis of variance of orthogonal test results of the sprayer.
SourceSum of SquaresDFMean SquareF Valuep Value
Liquid pump independent operationA153.156276.57877.2340.013
B339.8252169.9125171.36970.006
C730.5692365.2845368.4160.003
Error1.98343470.9915
Cor Total1225.5334353
Liquid pump–fan cooperative operationA349.4972174.748576.9990.013
B416.4572208.228591.7510.011
C718.292359.145158.2490.006
Error4.53943472.2695
Cor Total1488.7834353
Table 6. Mean value and standard deviation of droplet coverage rate and deposition density in the field verification test.
Canopy PositionsDroplet Coverage Rate (%)Droplet Deposition Density (Droplets/cm2)
Liquid Pump IndependentLiquid Pump–Fan Cooperativep ValueLiquid Pump IndependentLiquid Pump–Fan Cooperativep
Value
Front side in upper layer59.92 ± 5.81 B
(9.70%)
64.19 ± 8.58 A
(13.37%)
0.036870.97 ± 4.50 B
(6.34%)
86.25 ± 2.43 A
(2.81%)
<0.0001
Front side in middle layer48.61 ± 6.09 B
(12.53%)
61.02 ± 8.82 A
(14.45%)
<0.000173.98 ± 5.44 B
(7.35%)
78.63 ± 1.33 A
(1.69%)
<0.0001
Front side in lower layer46.85 ± 5.55 B
(11.85%)
55.46 ± 9.33 A
(16.82%)
0.000142.77 ± 3.34 B
(7.81%)
63.92 ± 0.33 A
(0.52%)
<0.0001
Back side in upper layer51.46 ± 5.83 B
(11.33%)
58.11 ± 8.99 A
(15.47%)
0.002270.11 ± 4.03 B
(5.75%)
74.60 ± 0.50 A
(0.67%)
<0.0001
Back side in middle layer47.81 ± 5.84 B
(12.21%)
57.24 ± 8.12 A
(14.19%)
<0.000166.28 ± 5.05 B
(7.62%)
72.26 ± 0.29 A
(0.40%)
<0.0001
Back side in lower layer35.12 ± 7.96 B
(22.67%)
43.22 ± 8.24 A
(19.07%)
0.000639.14 ± 1.37 B
(3.50%)
51.79 ± 0.23 A
(0.44%)
<0.0001
Note: data are presented as mean ± standard deviation (coefficient of variation, %). Means within rows with a different uppercase letter are significantly different (p ≤ 0.05).
Disclaimer/Publisher’s Note: The statements, opinions and data contained in all publications are solely those of the individual author(s) and contributor(s) and not of MDPI and/or the editor(s). MDPI and/or the editor(s) disclaim responsibility for any injury to people or property resulting from any ideas, methods, instructions or products referred to in the content.