Article

Optimizing Controlled-Release Urea and Conventional Urea Ratios Enhances Nitrogen Use Efficiency and Yield in Peanut

1
College of Agronomy, Shandong Agricultural University, Taian 271018, China
2
Linyi Academy of Agricultural Sciences, Linyi 276000, China
3
Key Laboratory of Crop Physiology, Ecology, and Cultivation, Ministry of Agriculture, Taian 271018, China
*
Authors to whom correspondence should be addressed.
These authors contributed equally to this work and should be considered co-first authors.
Agriculture 2025, 15(18), 1923; https://doi.org/10.3390/agriculture15181923
Submission received: 9 August 2025 / Revised: 8 September 2025 / Accepted: 9 September 2025 / Published: 11 September 2025
(This article belongs to the Section Crop Production)

Abstract

Combined application of controlled-release urea (CRU) and urea (U) improves yield and nitrogen use efficiency (NUE) in various crops, but the optimal blending ratio and related mechanisms in peanut production, particularly regarding antioxidant enzyme responses, remain insufficiently studied. To address this, a two-year field experiment was conducted with six fertilization treatments at a nitrogen rate of 120 kg·ha−1: CK (no nitrogen), T1 (100% U), T2 (100% CRU), T3 (50% CRU + 50% U), T4 (70% CRU + 30% U), and T5 (30% CRU + 70% U). The results showed that compared with T1, the blended treatments significantly increased yield by 5.41–10.88% and improved NUE by 35.90–64.37%, with T4 performing the best. The T4 treatment significantly enhanced photosynthetic characteristics, promoted dry matter accumulation, coordinated nitrogen supply across growth stages, strengthened nitrogen metabolism enzyme activity, and delayed leaf senescence. At harvesting stage, the activities of SOD, POD, and CAT in T4 were 12.82%, 22.37%, and 23.32% higher, respectively, than those in T1, while MDA content decreased by 11.29%. This study demonstrates that in the ridge-furrow plastic film mulching cultivation system of Shandong’s brown soil, coapplying 70% CRU with 30% U is an effective nitrogen management strategy for peanuts. This approach achieves high and stable yields by improving nitrogen metabolism and antioxidant capacity. The findings provide a theoretical basis and technical reference for sustainable intensification of peanut production in similar ecological regions and cultivation systems.

1. Introduction

Peanut (Arachis hypogaea L.) is a globally important oilseed and food crop. In China, its cultivation area reaches 4.68 million hectares, accounting for approximately 20% of the world’s total planting area [1]. The total production stands at about 19.23 million tons (2023, National Bureau of Statistics of China), constituting roughly 40% of the global output [2]. Peanuts not only provide 45–55% of the world’s edible vegetable oil and 25–30% of plant protein but also serve as a critical crop for ensuring food and oil security in China and the Asia-Pacific region [3,4].
Peanut is a typical nitrogen-loving crop, and its yield formation relies on balanced nitrogen supply throughout the entire growth cycle. Excessive nitrogen at the seedling stage inhibits nodule formation [5], while deficiency leads to stunted plant growth. During the pegging and pod-setting stages, excess nitrogen promotes excessive vegetative growth, reducing the number of effective pegs, whereas nitrogen deficiency similarly decreases effective peg formation [6]. By the pod-filling stage, excessive nitrogen can cause delayed maturity and prolonged vegetative growth, while insufficient nitrogen accelerates functional leaf senescence and limits pod plumpness [7]. With the widespread adoption of plastic film mulching technology [8,9], the common practice of applying a single large dose of nitrogen before sowing often leads to excessive early-stage nitrogen availability and mid-to-late-stage nitrogen deficiency, ultimately limiting yield potential [7]. The application of controlled-release urea (CRU) is one of the primary strategies to address nitrogen shortage during the later growth stages of crops [10]. Pierozan et al. [11] found that applying 50 kg N ha−1 of CRU effectively met the nitrogen demand of soybeans at the R3 stage, increasing yield by 9.2% compared to conventional urea (U). Additionally, CRU significantly enhances the nitrogen fixation contribution of peanut rhizobia, establishing a dual nitrogen source mechanism during the critical pod development phase, thereby stabilizing nitrogen nutrition supply for kernel filling [12]. Although CRU can provide a stable nitrogen supply for peanuts, the release rate of nitrogen from the coating may be too slow to meet the early-stage nitrogen demand of the crop.
Recent studies have found that the combined application of CRU and U can overcome the limitations associated with their individual use and improve crop nitrogen use efficiency (NUE). An appropriate mixture of CRU and U ensures a balanced nitrogen supply that matches crop demand at different growth stages [13,14]. This balanced supply helps regulate root architecture and enhance root activity [15], improve canopy structure for more uniform distribution of light and nitrogen resources [16], increase soil microbial abundance and stimulate the activity of nitrogen-fixing microorganisms [17], enhance urease and sucrase activity during later growth stages to promote nutrient transformation and maintain nitrogen availability [18], and regulate nitrogen metabolism enzyme activity to improve nitrogen utilization capacity [19].However, the optimal mixing ratio varies among crops. In rice, CRU must account for more than 60% of the total nitrogen input to significantly increase yield and NUE [20]. For wheat and maize, the optimal CRU-to-U ratios are 75:25 and 50:50, respectively, both of which significantly improve yield and nitrogen efficiency [21]. To date, few studies have explored the use of CRU–U blends to enhance nitrogen use efficiency in peanuts. Therefore, further research is needed to determine the optimal mixing ratio for peanut production systems.
Peanut is a crop characterized by multi-pod formation, yet at harvest, only 15% to 30% of the pods are fully developed, while the remainder are immature and do not contribute to yield [22]. Excessive immature pods have become a major constraint to improving both yield and quality. Senescence is one of the primary factors affecting pod filling in the late growth stages [7,23]. After pod setting, peanuts enter a senescence process during which leaf abscission occurs faster than new leaf growth, leading to accelerated aging [24]. Simultaneously, senescence reduces the leaf area index and promotes the degradation of photosynthetic pigments, impairing photosynthetic efficiency [25] and hindering the translocation of nutrients to the pods [26], ultimately compromising pod plumpness. Through optimized fertilization practices, Zhang et al. [7] successfully delayed senescence, increasing the effective pod ratio and raising the yield by 29.20%. Therefore, preventing premature senescence in the late growth stages is critical for enhancing pod number per plant and overall yield. Appropriate soil nitrogen levels can delay chlorophyll degradation and slow leaf senescence [27,28]. Blending CRU with U has been shown to enhance available nitrogen content during the later growth stages of crops. However, the effects of CRU–U combinations on soil nitrogen supply capacity and leaf senescence across different growth stages in peanuts remain unclear and require further investigation.
Based on the above, we conducted an experiment with different blending ratios of urea and controlled-release urea during 2023–2024, aiming to investigate: (1) whether the blending ratios of controlled-release urea and conventional urea can improve peanut yield and nitrogen use efficiency; (2) the dynamic responses of the peanut antioxidant system at different growth stages under different blending ratios; (3) the effects of different ratios on agronomic factors (agronomic traits, dry matter accumulation, nitrogen use efficiency) and soil nitrogen supply. We hope that our study can provide both theoretical and practical foundations for the green and sustainable development of peanut production.

2. Materials and Methods

2.1. Experimental Sites and Materials

The field experiment was conducted in Daiyue District, Tai’an City, Shandong Province, China (117°00′ E, 36°01′ N). A permanent experimental field with over 15 years of corn–wheat–peanut rotation history was selected. To eliminate the effects of continuous peanut cropping obstacles, although the experimental plots differed between the two years, adjacent plots were strictly chosen to ensure soil condition consistency. The soil type was identified as brown earth, with baseline fertility characteristics presented in Table 1. Meteorological data (rainfall and temperature) during the experimental period are shown in Figure 1.
This study utilized the large-seeded peanut cultivar ‘Shanhua 9’, developed by Shandong Agricultural University. The CRU was supplied by Shandong Agricultural University Fertilizer Technology Co., Ltd. (Taian, China), with a nitrogen content of 44% and coated with polyurethane resin. The coating thickness ranges 80–120 μm, and the release period is 90 days. The detailed physicochemical properties of the polyurethane coating material and the release kinetics equation of this CRU in static water at 25 °C provided in the Supplementary Files. U (46% N) and KH2PO4 were purchased from local fertilizer suppliers.

2.2. Experimental Design

The field experiment was arranged in a randomized block design with six treatments: CK (no fertilizer application); T1 (100% U); T2 (100% CRU); T3 (50% CRU + 50% U); T4 (70% CRU + 30% U); and T5 (30% CRU + 70% U). Each treatment was replicated three times, with a plot area of 20.52 m2. For nitrogen-applied treatments, the nitrogen application rate was 120 kg·ha−1 (as pure N), which had been determined to achieve maximum peanut yield in previous experiments [29]. Additionally, all treatments received a uniform application of 240 kg·ha−1 KH2PO4.
A planting method of ridging and mulching was adopted in the experiment. Researchers used machine ridging, and a trench about 10 cm deep was opened manually in the middle of each ridge. Manual fertilization was adopted. KH2PO4 was applied to each ridge first, and then nitrogen fertilizer was applied according to the assigned treatments and covered with soil. The hole spacing was 17 cm, with two seeds sown in each hole and two rows per ridge, resulting in a planting density of about 247,000 plants·ha−1. After planting, the ridge was mulched with film and irrigated. Other management measures were the same as those of general high-yield fields.

2.3. Sampling and Measurements

2.3.1. Yield-Related Traits and Quality of Peanut

On 1 September 2023, and 2 September 2024, peanuts from each plot were harvested, placed in mesh bags for air-drying, and weighed for yield measurement after removing impurities. Subsequently, a random sample of 500 g of pods was collected from each plot for pod trait evaluation, including 100-pod weight, 100-kernel weight, and shelling percentage. Meanwhile, kernel quality was analyzed using a DA7250 near-infrared spectrophotometer.

2.3.2. Sampling

Sampling was performed at four critical growth stages: 30 days after sowing (DAS) (flowering stage, 50% of the seedlings in the entire field have produced their first flower), 60 DAS (pod-setting stage, Pod initiation was observed in 50% of peanut plants across the entire field), 90 DAS (pod-filling stage), and 120 DAS (harvesting stage). For each experimental plot, 10 representative plants were sampled for agronomic trait evaluation, 40 functional leaves from main stems were collected for nitrogen metabolism enzyme and antioxidant enzyme analyses, and soil cores (0~20 cm depth) were extracted using a soil auger for determination of available nitrogen content.

2.3.3. Peanut Agronomic Traits, Dry Matter Accumulation, Nitrogen Accumulation, and Nitrogen Fertilizer Efficiency

The sampled plants were measured for main stem height and lateral branch length. Following measurement, plant organs were separated, oven-dried, and weighed to determine biomass accumulation in different organs. The dried samples were digested using the H2SO4-H2O2 method, with nitrogen content determined by a Kjeldahl nitrogen analyzer (FOSS) to calculate nitrogen accumulation in various peanut plant organs. The nitrogen use efficiency (NUE), partial factor productivity of nitrogen (PFPN), and agronomic efficiency nitrogen use (AEN) of peanuts were determined according to the method described by Li et al. [30]. Dry matter accumulation (DMA), dry matter accumulation rate (DMAR), nitrogen accumulation (NA), and nitrogen accumulation rate (NAR) of peanut after pod setting were calculated using the following Equations (1), (2), (3), and (4), respectively:
Post-podding   DMA   ( PpDMA ,   g · plant 1 )   =   DMA H     DMA PS
Post-podding   DMAR   ( PpDMAR , % )   = PpDMA DMA H
Post-podding   NA   ( PpNA ,   mg · plant 1 )   = NA H     NA PS  
Post-podding   NAR   ( PpNAR , % )   = PpNA NA H
In the equation, DMAH represents the dry matter accumulation at the harvesting stage, DMAPS represents the dry matter accumulation at the pod-setting stage, NAH represents the nitrogen accumulation at the harvesting stage, and NAPS represents the nitrogen accumulation at the pod-setting stage.

2.3.4. Determination of Leaf Nitrogen Metabolism Enzyme Activity

The nitrogen metabolism enzyme activities in functional leaves were determined at different growth stages. Nitrate reductase (NR) activity was measured according to the method of Bories and Bories [31], while glutamate synthase (GOGAT) and glutamate dehydrogenase (GDH) activities were determined following Singh and Srivastava [32]. The activities of NR, GOGAT, and GDH were expressed as the NADH oxidation rate per unit leaf mass (measured by ultraviolet absorbance at 340 nm). Glutamine synthetase (GS) activity was assayed at 540 nm following Zhang et al. [33], with results expressed as absorbance at 540 nm (A540) per unit leaf mass per hour.

2.3.5. Determination of Leaf Antioxidant Enzyme Activity

The antioxidant enzyme activities were determined according to the method described by Wu et al. [34]. Superoxide dismutase (SOD) activity was measured using the nitroblue tetrazolium (NBT) photoreduction method at 560 nm, peroxidase (POD) activity by the guaiacol oxidation method at 470 nm, catalase (CAT) activity by the hydrogen peroxide decomposition method at 240 nm, and malondialdehyde (MDA) content was determined via the thiobarbituric acid (TBA) reaction with absorbance corrections at 600 nm, 532 nm, and 450 nm.

2.3.6. Determination of Soil Nitrogen Content

The soil samples were air-dried naturally, and the available nitrogen content (AN) was determined using the alkaline hydrolysable diffusion method [35].

2.3.7. Leaf Area Index (LAI), SPAD Value, Photosynthetic Intensity (Pn)

At the pod-setting and pod-filling stages, The LAI of peanuts was determined using the leaf disk method [36]. Meanwhile, in field-grown peanut plants, SPAD values of the third fully expanded leaf from the top were measured using a portable chlorophyll meter (Model CL-01), and the net photosynthetic rate (Pn) was determined with a CIRAS-3 portable photosynthesis system. SPAD and Pn measurements were taken with 10 replicates per plot.

2.4. Statistical Analysis

Text processing was completed using Microsoft Office 2021. Data analysis was performed using IBM SPSS Statistics 26 software for analysis of variance (ANOVA), with experimental treatment and year as fixed factors, and measured indicators as response variables. Significant differences between groups were determined by Duncan’s multiple range test at p < 0.05 (see Supplementary Table S1). Correlations between variables were analyzed using Pearson’s test (* p < 0.05, ** p < 0.01). All bar charts and correlation heatmaps were generated using Origin 2021 software.

3. Results

3.1. Peanut Yield and Constituent Factors

The yield of the T3 and T4 treatments was significantly higher than that in the other treatments, while the T5 and T2 treatments were significantly higher than that in the T1 treatment (Table 2). Compared with the T1 treatment, the yield in the T2, T3, T4, and T5 treatments increased by 3.67%, 8.30%, 10.88%, and 5.41%, respectively. The optimal nitrogen fertilizer ratio had a positive impact on the number of pods per plant. The T3 and T4 treatments had significantly higher pod numbers than those in the T1 treatment. Compared with the T1 treatment, the number of pods per plant in the T2, T3, T4, and T5 treatments increased by 5.59%, 10.47%, 13.71%, and 8.36%, respectively. The application of CRU promoted pod filling. Compared with the T1 treatment, the 100-kernel weight in the T2, T3, T4, and T5 treatments increased by 2.65%, 1.41%, 1.79%, and 3.76%, respectively. The kernel filling rate followed a similar pattern to that of 100-kernel weight.

3.2. Peanut Quality

The optimized nitrogen fertilizer ratio increased the crude protein content and total amino acid content of peanut kernels, with the two-year trend being T4 > T3 > T2 > T5 > T1 > CK (Table 3). Compared with the CK treatment, the crude protein content and total amino acid content in the T4 treatment increased by 16.91% and 8.29%. The application of nitrogen fertilizer reduced the oil content, but there was no clear trend among different fertilization treatments. Optimized nitrogen application increased oleic acid content, decreased linoleic acid content, and increased the O/L ratio. Compared with the T1 treatment, the O/L ratio in the T2, T3, T4, and T5 treatments increased by 2.14%, 3.21%, 5.35%, and 4.81%, respectively.

3.3. Soil Nitrogen Content

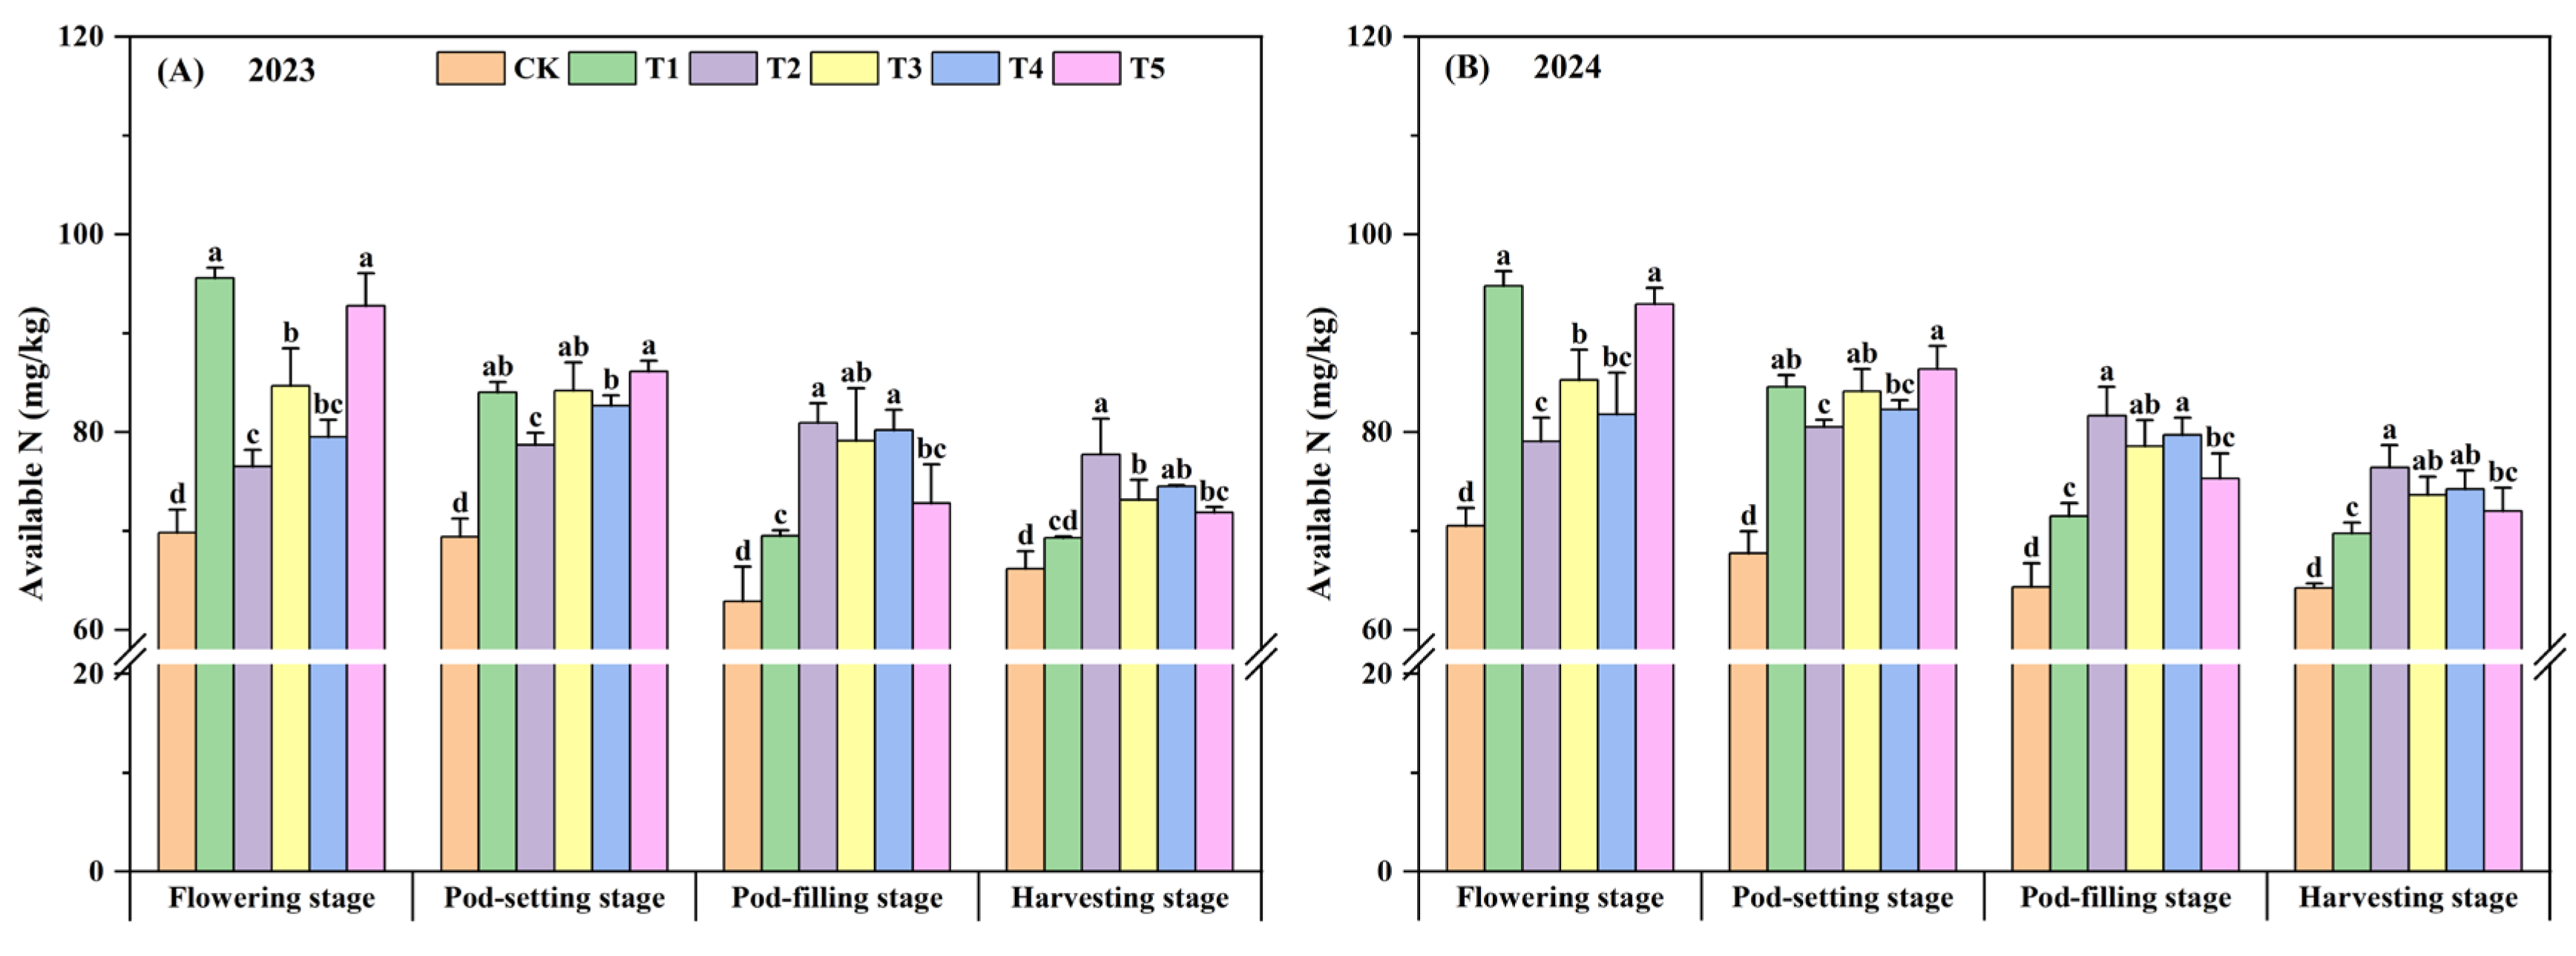
The optimized nitrogen fertilizer ratio significantly affected the available nitrogen content in the 0–20 cm soil layer of peanut at different growth stages (Figure 2).
At the flowering stage, the soil available nitrogen content in the T1 and T5 treatments was significantly higher than that in the other treatments, and that in the T3 treatment was significantly higher than that in the T2 treatment. Compared with the T1 treatment, the soil available nitrogen content in the T2, T3, T4, and T5 treatments decreased by 18.28%, 10.74%, 15.27%, and 2.46%, respectively. At the pod-setting stage, the soil available nitrogen content in the T2 treatment was significantly lower than that in the other fertilization treatments. Compared with the T1 treatment, the soil nitrogen content in the T2, T3, T4, and T5 treatments increased by 15.34%, 11.87%, 13.45%, and 5.05% at the pod-filling stage, and increased by 10.85%, 5.58%, 6.98%, and 3.46% at the harvesting stage, respectively. Meanwhile, the difference between the T2, T3, and T4 treatments and the T1 treatment reached a significant level in the pod-filling stage and the harvesting stage.

3.4. Agronomic Traits of Peanut

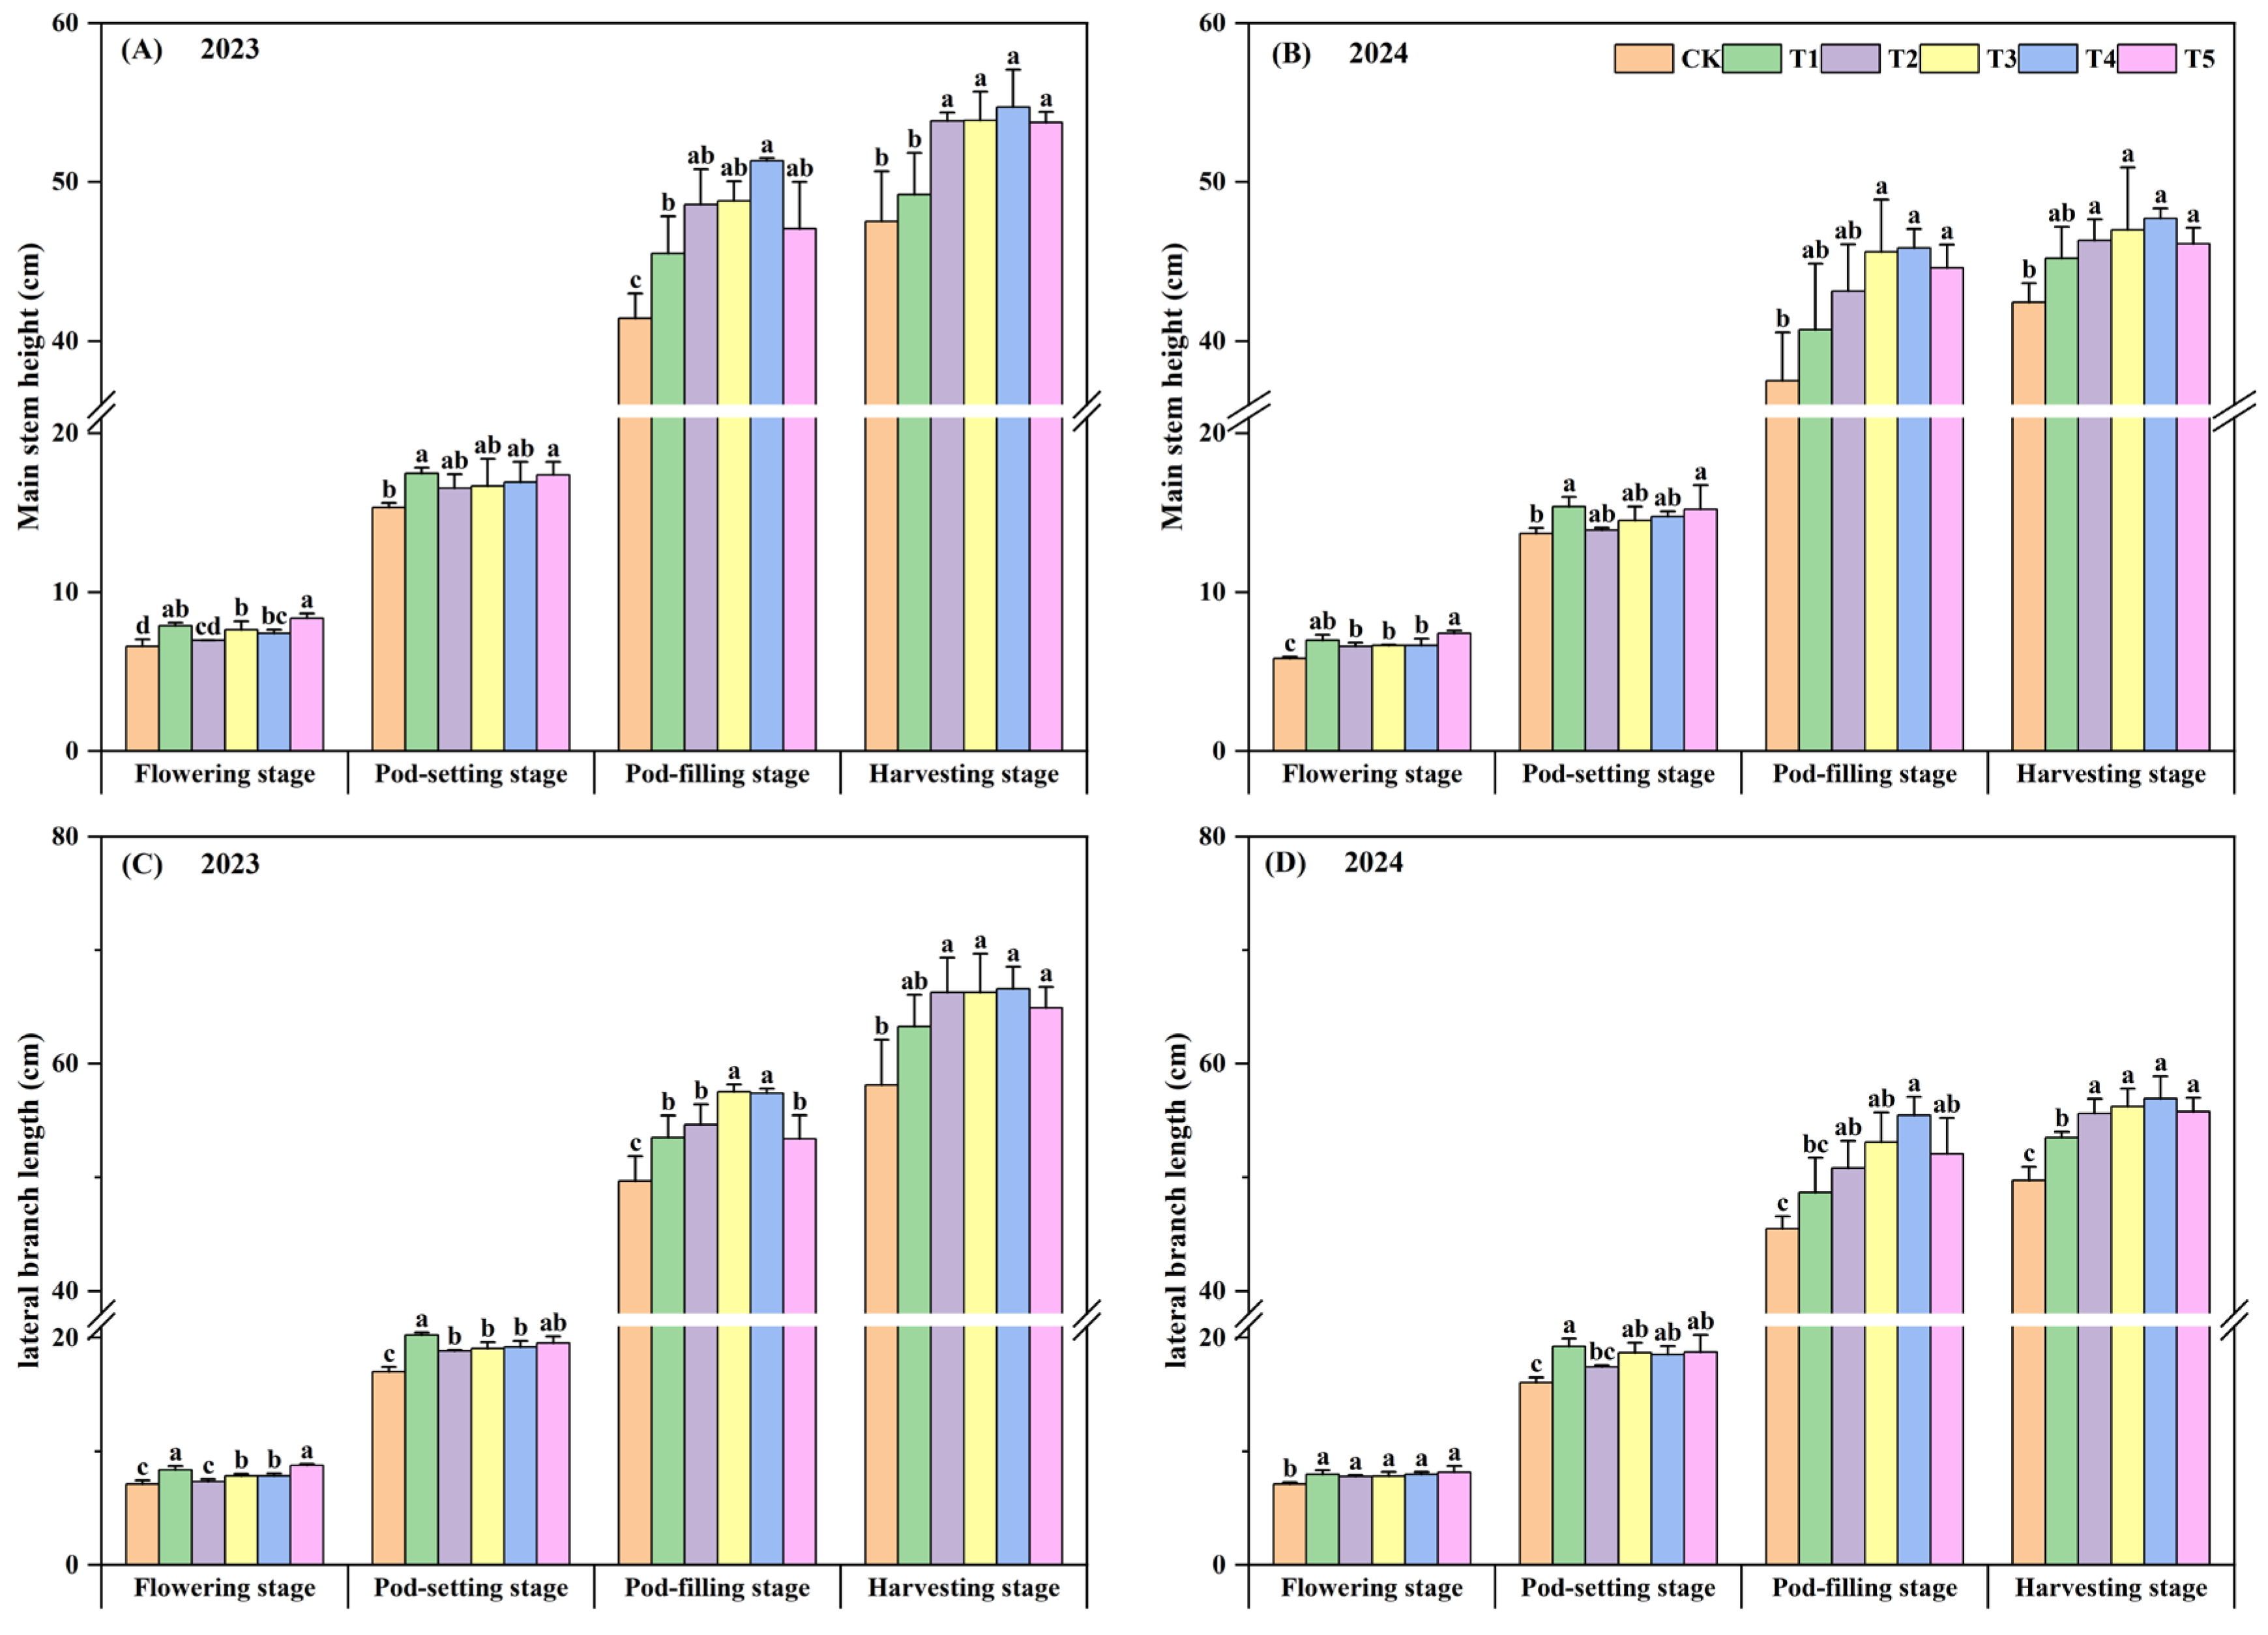
In both years, the main stem height and lateral branch length approached the maximum value at the pod-filling stage (Figure 3). At the flowering and pod-setting stages, the main stem height and lateral branch length in the T1 and T5 treatments with high U application were higher than those in other treatments. After the pod-setting stage, the T2, T3, and T4 treatments showed rapid growth, with the main stem height and lateral branch length in the T3 and T4 treatments being higher than those in other treatments at the pod-filling stage. At the harvesting stage, the peanuts in the T2, T3, T4, and T5 treatments with CRU had higher main stem height and lateral branch length than those in the T1 treatment, and the main stem height increased by 4.95%, 4.66%, 6.27%, and 4.61%, respectively, and the lateral branch length increased by 5.33%, 5.83%, 6.68%, and 4.27%, respectively.

3.5. Leaf Antioxidant Enzyme Activity

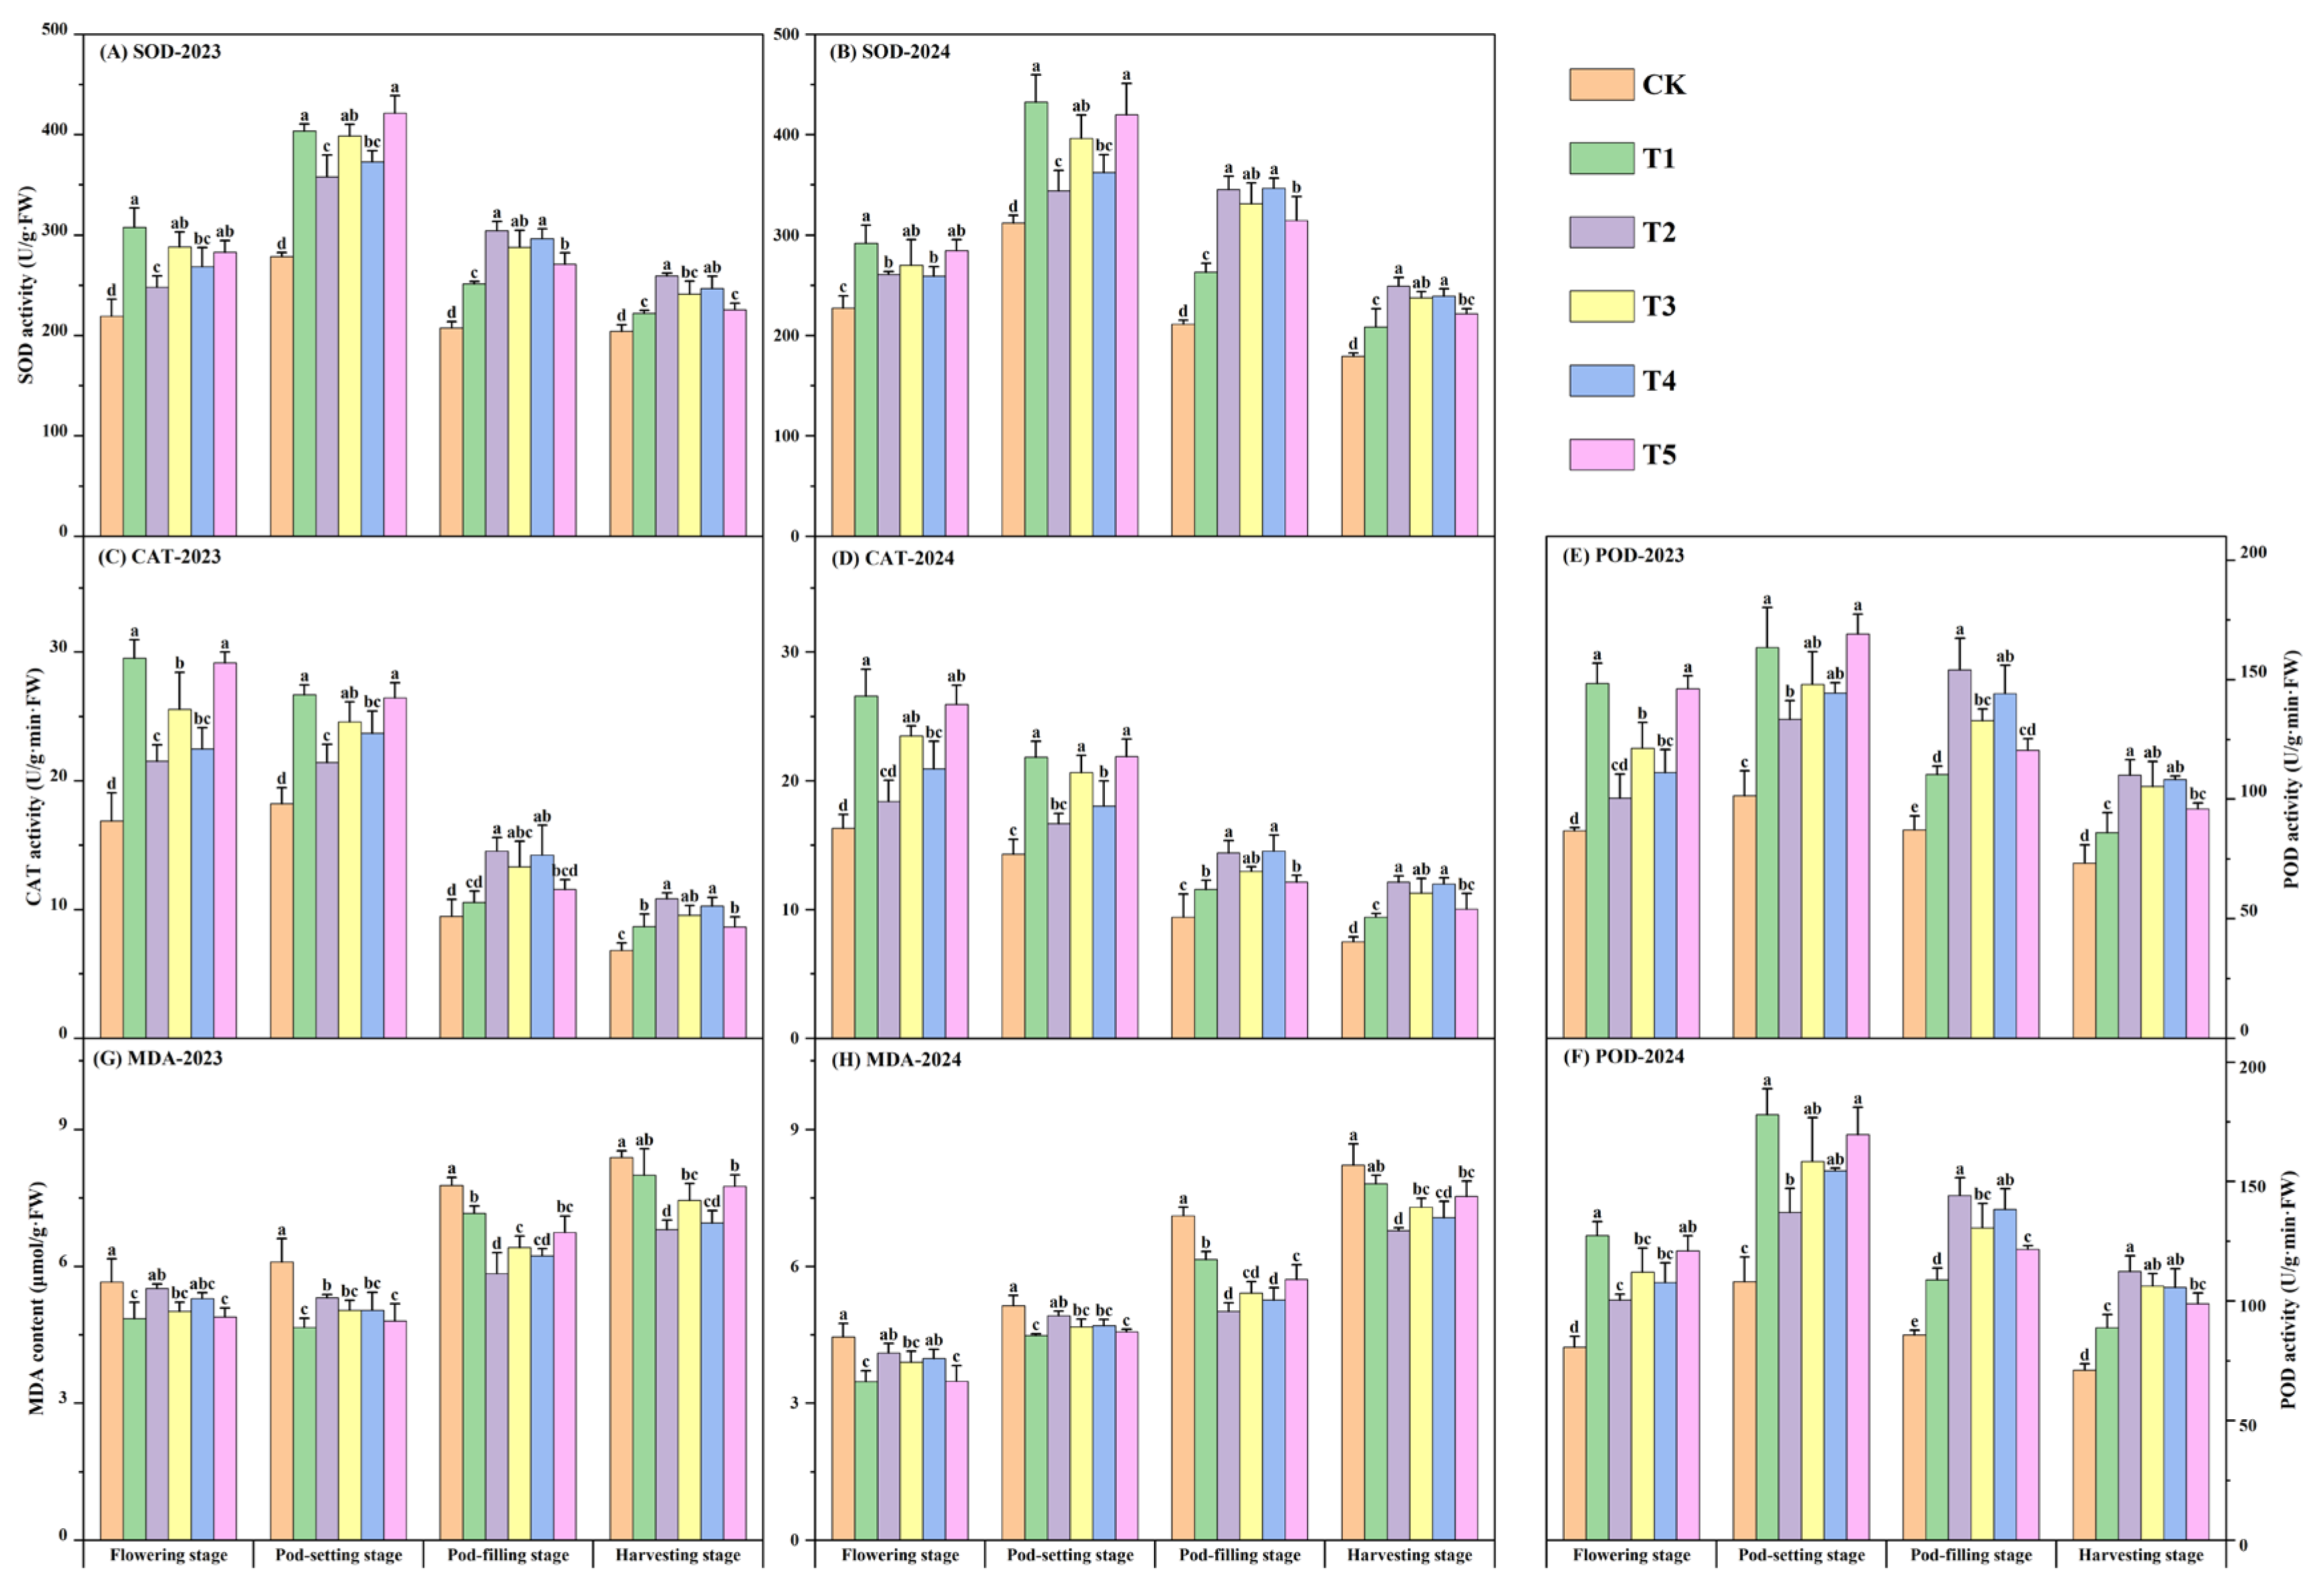
Optimizing the nitrogen fertilizer ratio can significantly affect the antioxidant enzyme activities in peanut leaves (Figure 4). At the flowering stage, the activities of SOD, POD, and CAT in the T1, T3, and T5 treatments were significantly higher than those in the T2 treatment. A similar pattern was observed at the pod-setting stage. At the pod-filling stage and harvesting stage, the activities of SOD, POD, and CAT in the T2 and T4 treatments were significantly higher than those in the T5 and T1 treatments, and the activity in the T3 treatment was significantly higher than that in the T1 treatment. Compared with the T1 treatment, at the pod-filling stage, the SOD activities in the T2, T3, T4, and T5 treatments increased by 26.32%, 20.39%, 25.04%, and 13.84%, respectively. Similarly, the POD activities increased by 35.99%, 20.02%, 28.78%, and 10.32%, and the CAT activities increased by 30.72%, 18.74%, 30.05%, and 7.06%. At the harvesting stage, the SOD activities in the T2, T3, T4, and T5 treatments increased by 18.08%, 11.17%, 12.82%, and 3.83%, respectively. Similarly, the POD activities increased by 27.15%, 20.99%, 22.37%, and 11.39%, and the CAT activities increased by 27.21%, 15.26%, 23.32%, and 3.24%. The MDA content in the leaves increased continuously with the progress of the growth period. The MDA contents in all fertilization treatments were significantly lower than those in the CK treatment. Compared with the T1 treatment, at the pod-filling stage, the MDA contents in the T2, T3, T4, and T5 treatments decreased by 18.44%, 11.08%, 13.64%, and 6.38%, respectively, and at the harvesting stage, they decreased by 13.98%, 6.71%, 11.29%, and 3.32%, respectively.

3.6. Leaf Nitrogen Metabolism Enzyme Activity

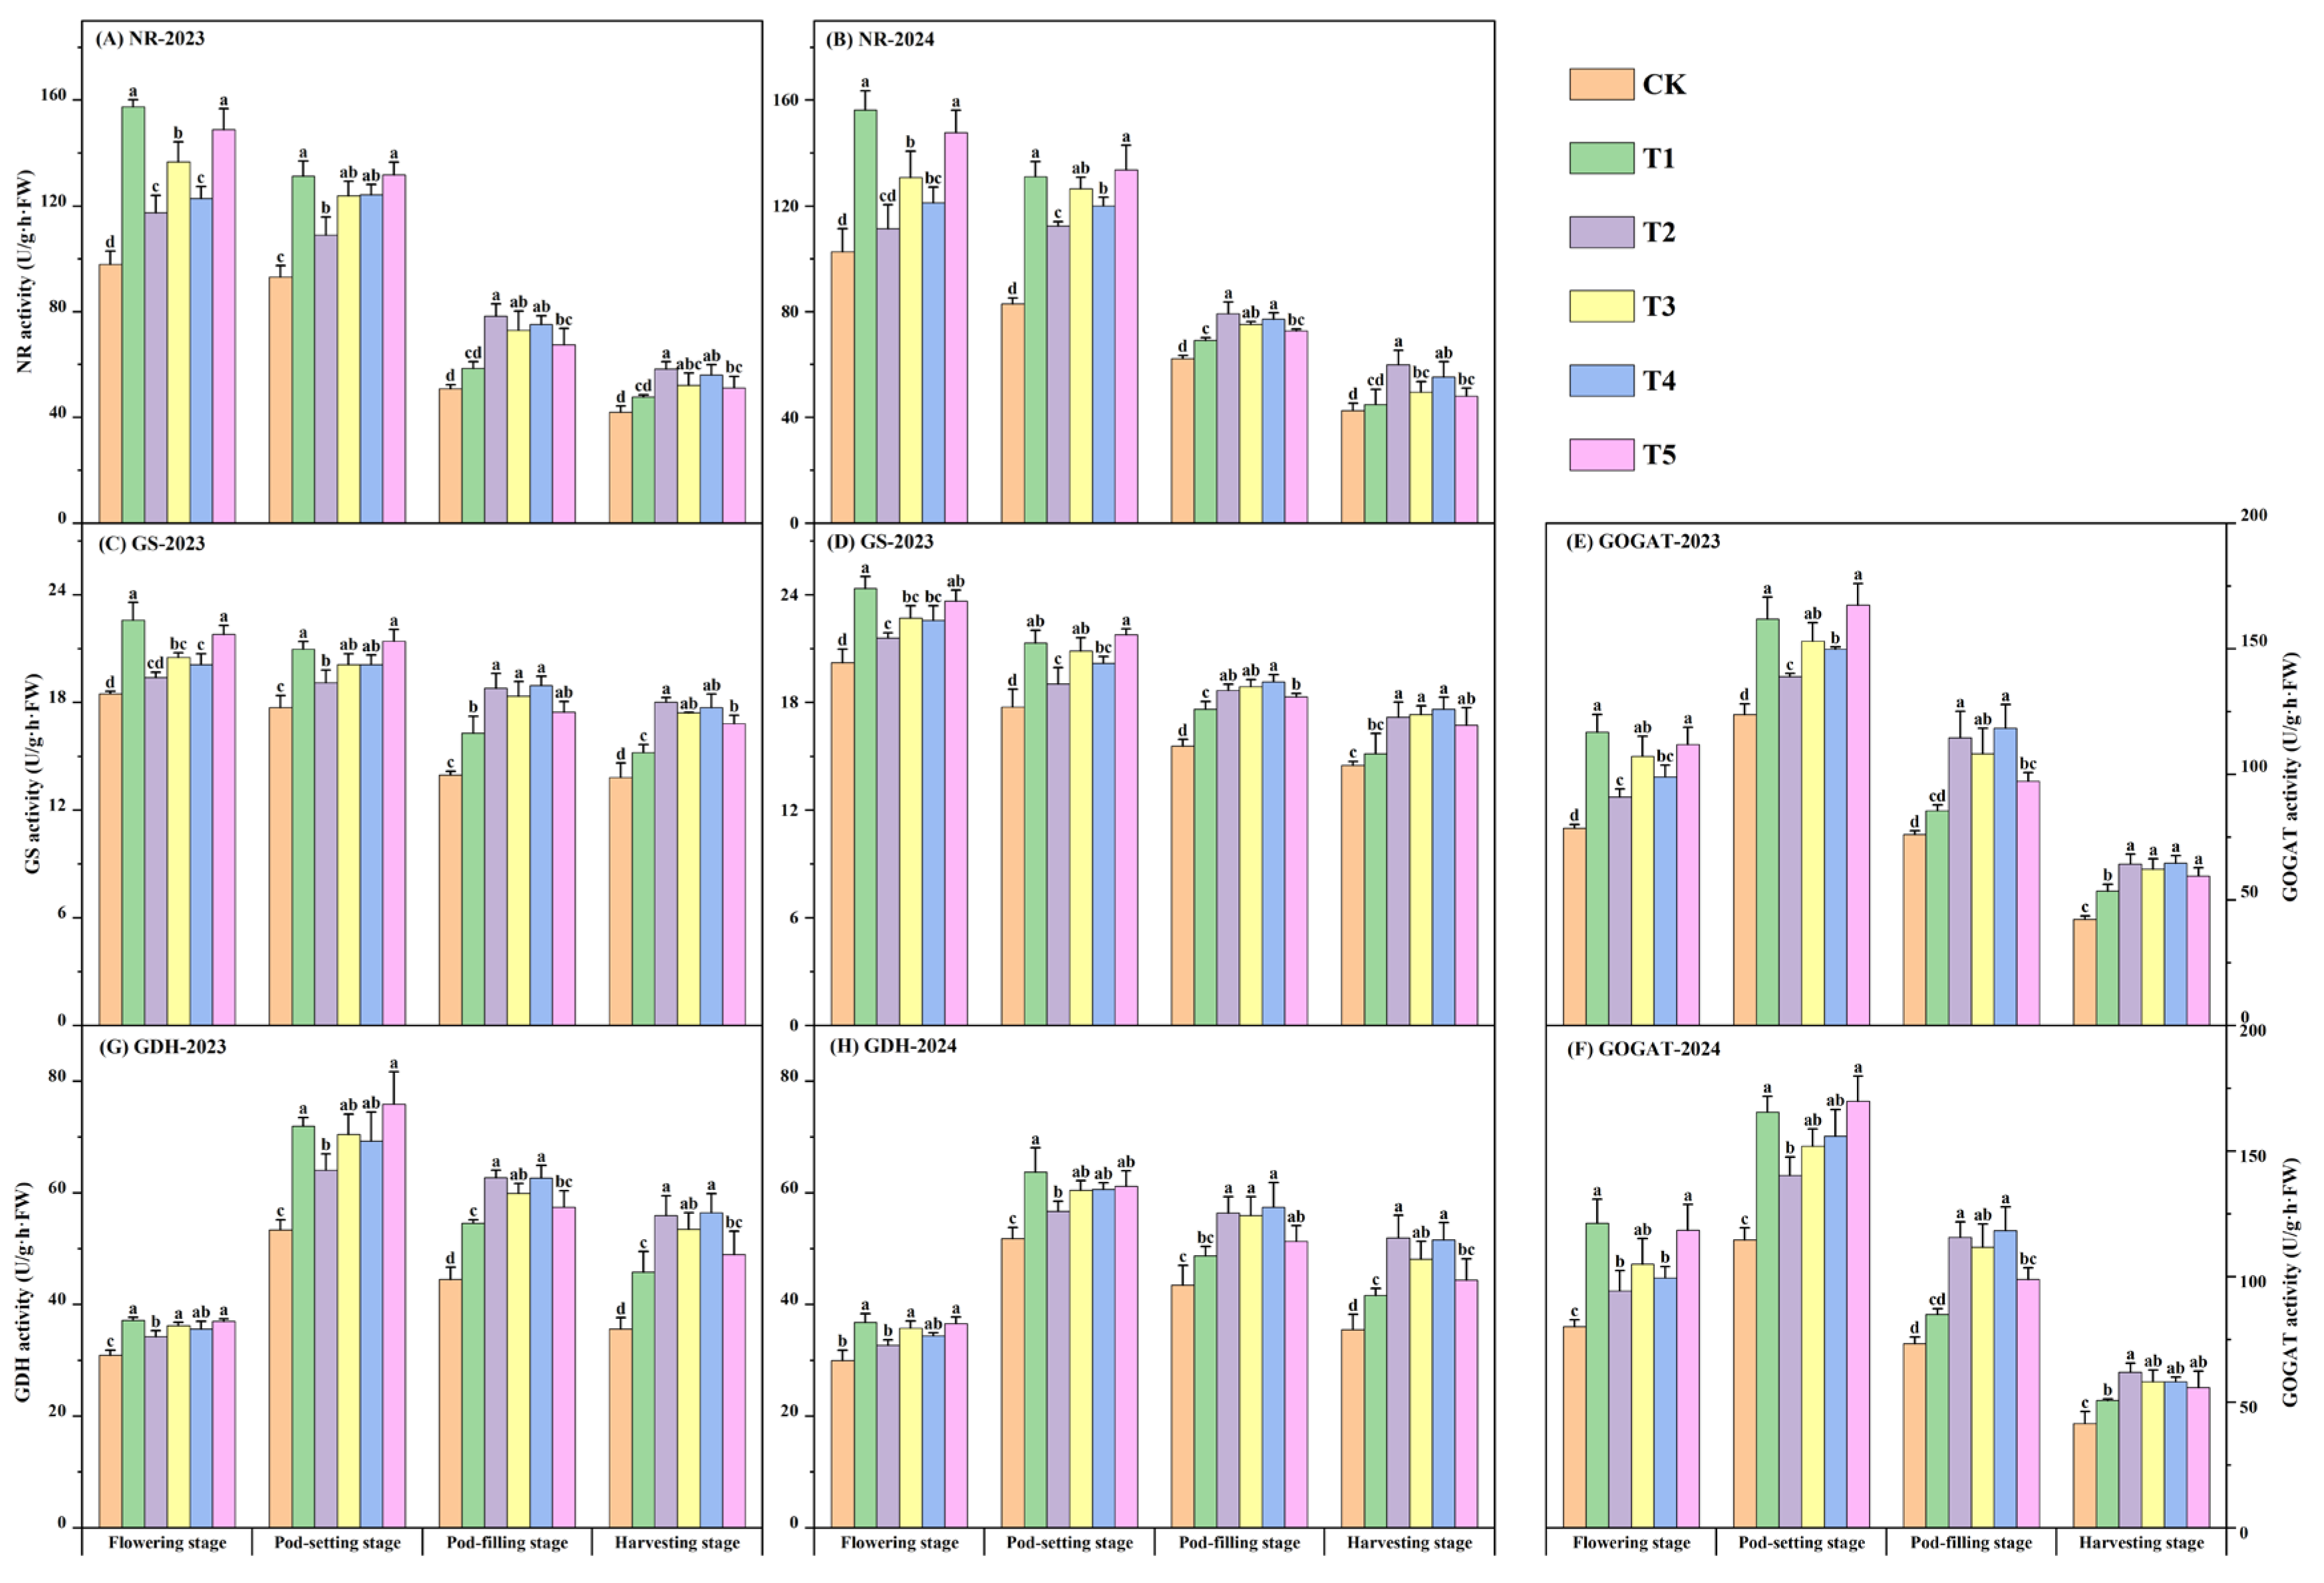
Optimization of the nitrogen fertilizer ratio affected the activities of nitrogen metabolizing enzymes in peanuts at different growth stages (Figure 5). At the pod-setting stage, the activities of NR, GS, GOGAT, and GDH in the T1 and T5 treatments were significantly higher than those in the T2 treatment, but the differences were not significant compared with those in the T3 and T4 treatments. Compared with the T1 treatment, the activities of NR, GS, GOGAT, and GDH in the T2 treatment decreased by 18.30%, 9.18%, 11.08%, and 10.94%. In the T3 treatment, the corresponding decreases were 8.35%, 1.64%, 6.83%, and 1.99%. In the T4 treatment, these activities decreased by 10.68%, 4.05%, 8.76%, and 4.23%. However, in the T5 treatment, the activities of NR, GS, GOGAT, and GDH increased by 11.89%, 2.83%, 3.00%, and 1.08%. At the pod-filling stage, the nitrogen metabolic enzyme activities of the T2, T3, and T4 treatments were significantly higher than those in the T1 treatment. Compared with the T1 treatment, the activity of NR in the T2, T3, and T4 treatments increased by 23.97%, 16.53%, and 19.85%, respectively. Similarly, the activity of GS increased by 10.44%, 7.96%, and 12.34%, the activity of GOGAT increased by 35.04%, 28.96%, and 38.73%, the activity of GDH increased by 15.27%, 9.25%, and 16.29%. At the harvesting stage, the T2, T4, T3, and T5 treatments treated with CRU still showed higher nitrogen metabolic enzyme activities than the T1 treatment.

3.7. Photosynthetic Performance

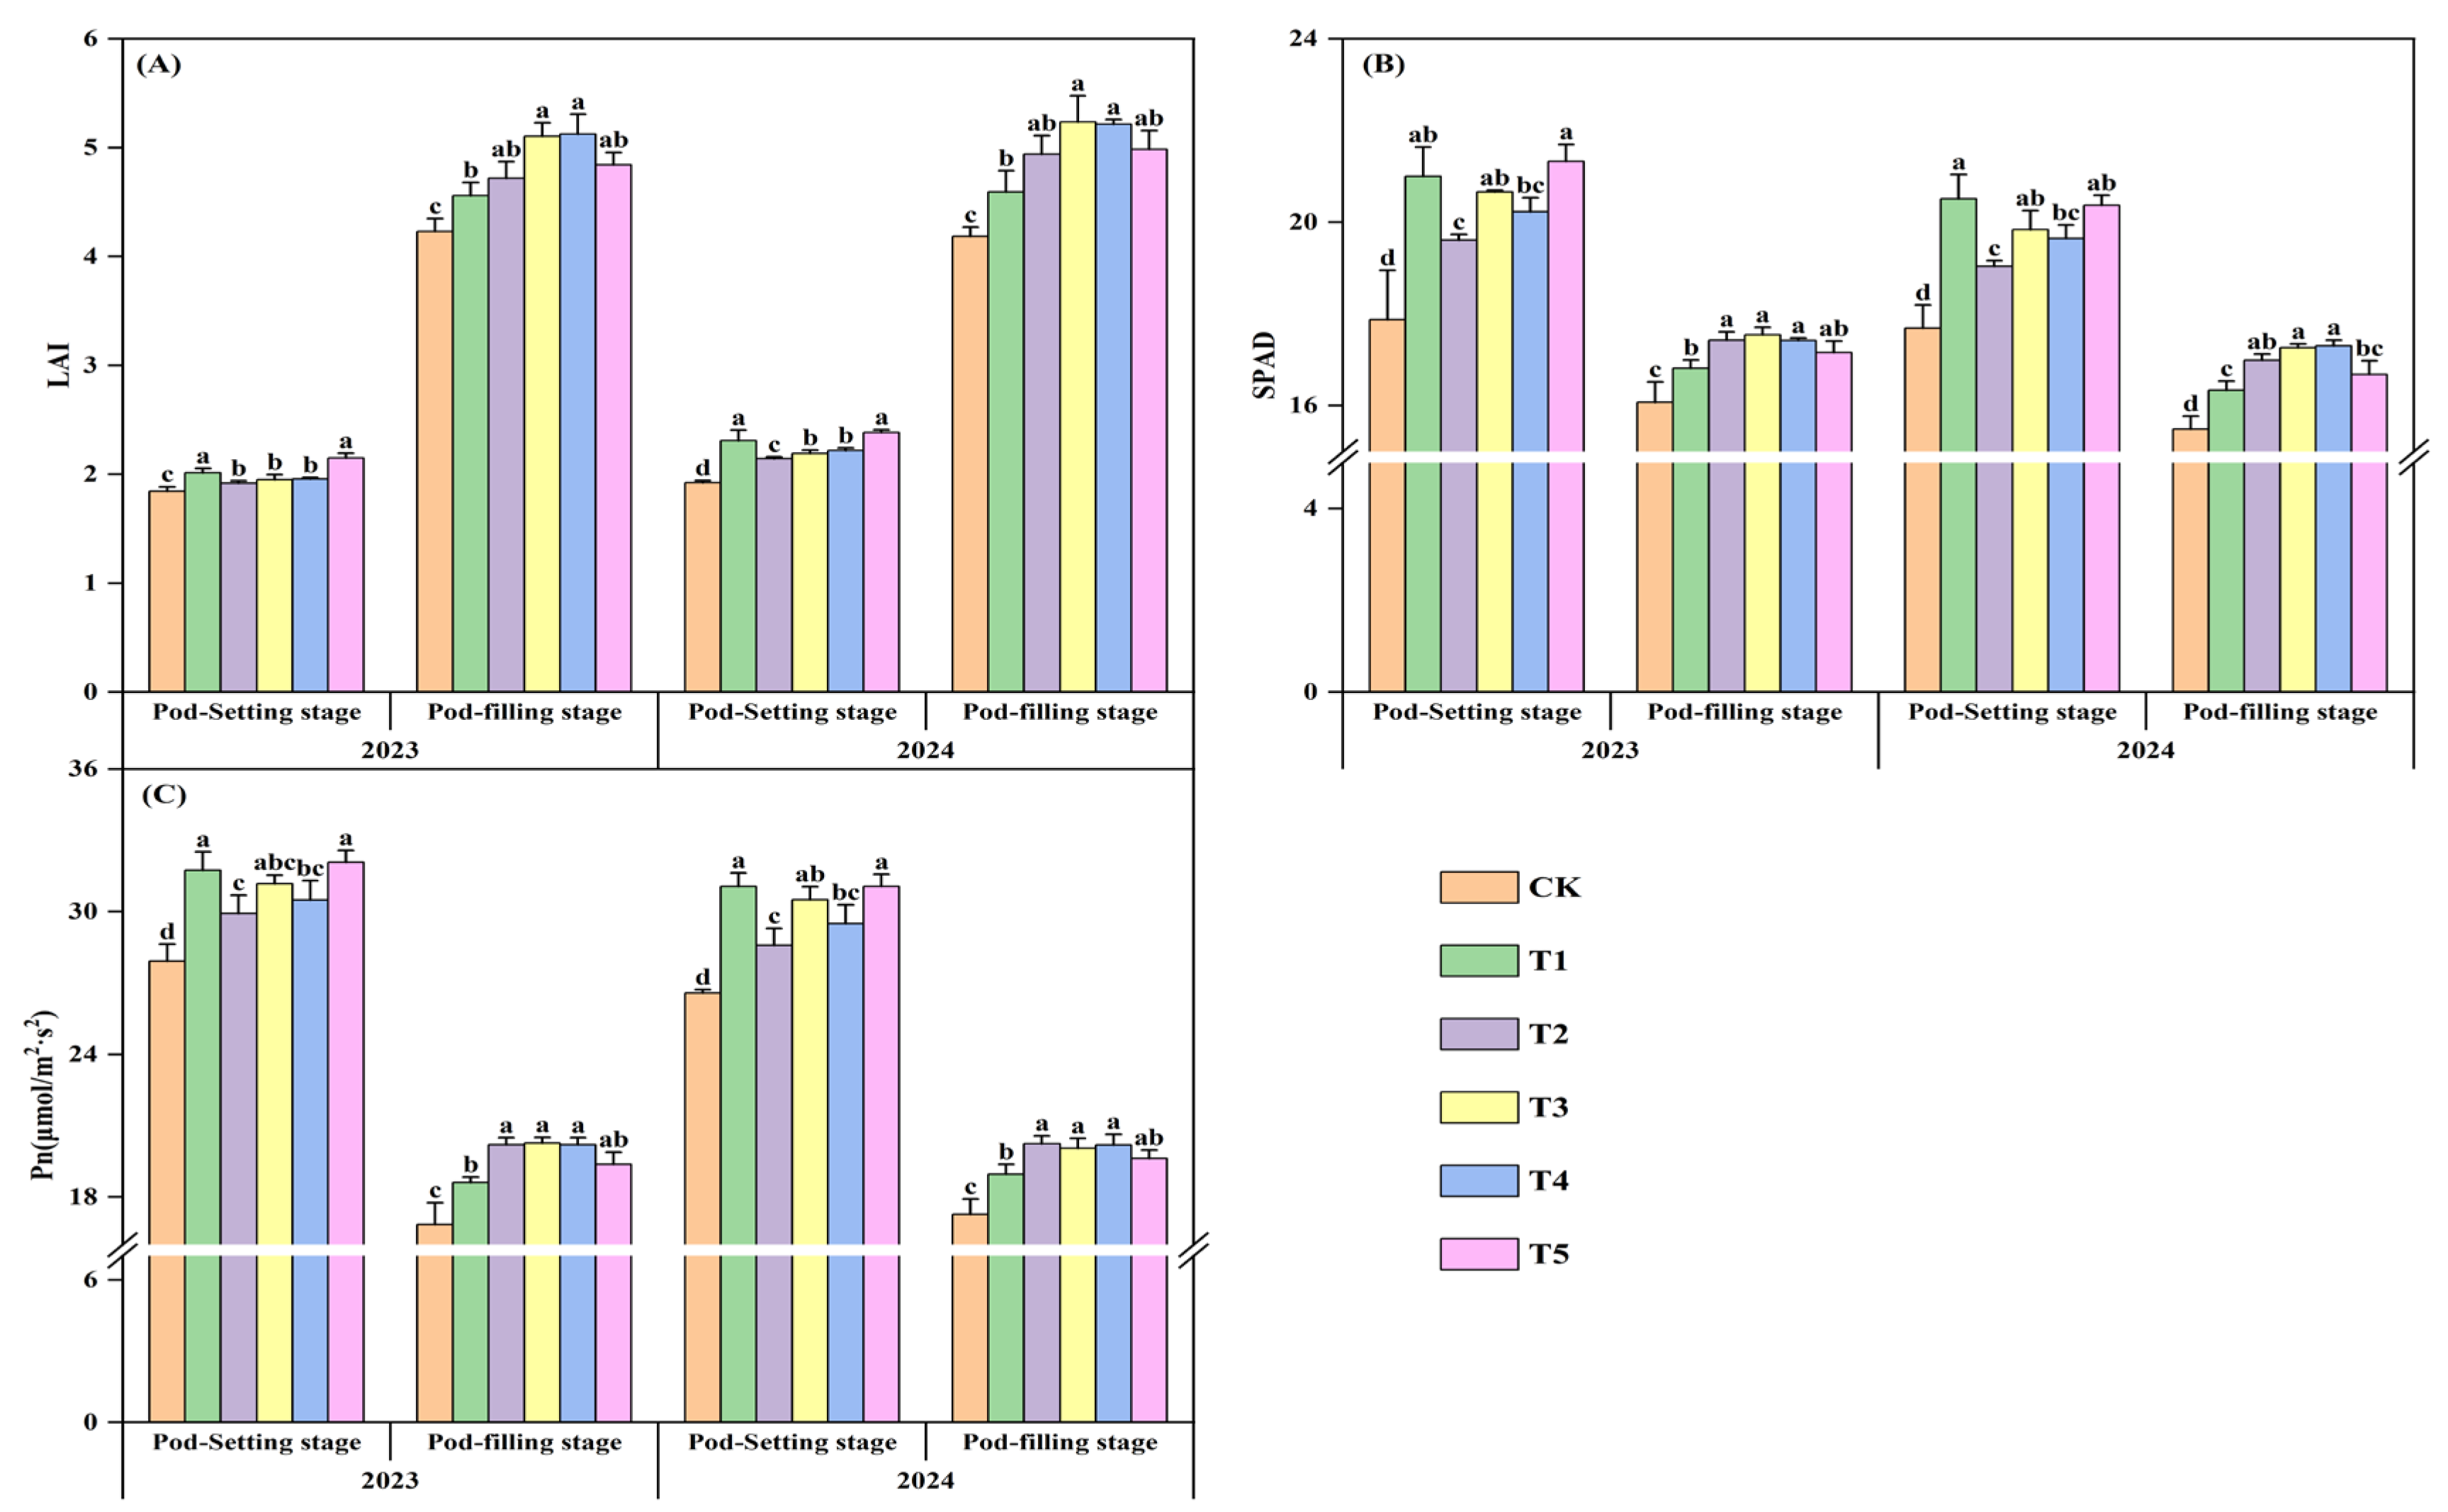
Optimization of nitrogen fertilizer ratio affected the LAI, SPAD, and Pn of peanuts. At the pod-setting stage, LAI in the T1 and T5 treatments was significantly higher than that in other treatments, and the T3 and T4 treatments were higher than those of the T2 treatment, with significant differences observed in 2024. Compared with the T1 treatment, LAI in the T2, T3, and T4 treatments decreased by 8.21%, 6.41%, and 5.58%, respectively, but LAI in the T5 treatment increased by 2.49%. At the pod-filling stage, LAI in the T3 and T4 treatments significantly increased by 13.00% and 12.93%, respectively, compared with the T1 treatment (Figure 6A).
At the pod-setting stage, SPAD in the T1, T3, and T5 treatments was significantly higher than that in the T2 treatment. Compared with the T1 treatment, SPAD in the T2, T3, and T4 treatments decreased by 6.89%, 2.42%, and 3.93%, respectively, but SPAD in the T5 treatment increased by 4.55%. At the pod-filling stage, SPAD in the T2, T3, and T4 treatments was significantly higher than that in the T1 treatment. Compared with the T1 treatment, SPAD increased by 3.84%, 4.99%, and 4.76%, respectively (Figure 6B).
The patterns of Pn and SPAD values showed a similar trend. At the pod-setting stage, compared with the T1 treatment, Pn in the T2, T3, and T4 treatments decreased by 6.86%, 1.80%, and 4.52%, respectively, but Pn in the T5 treatment increased by 5.47%. At the pod-filling stage, compared with the T1 treatment, Pn in the T2, T3, T4, and T5 treatments increased by 7.63%, 7.32%, 7.48%, and 3.81%, respectively (Figure 6C).

3.8. Dry Matter Accumulatio

At the flowering stage and pod-setting stage, the stem, leaf, and total dry matter accumulation in the T1 and T5 treatments were significantly higher than that in other treatments (Figure 7A,B). At the harvesting stage, dry matter accumulation showed the trend of T3, T4 > T5, T2 > T1 > CK. Compared with the T1 treatment, the T2, T3, T4, and T5 treatments increased by 8.58%, 14.61%, 16.20%, and 12.74%, respectively. The trend at the pod-filling stage was similar to that at the harvest stage (Figure 7C,D).
The post-podding dry matter accumulation in the T2, T3, T4, and T5 treatments was significantly higher than that in the T1 treatment, with increases of 17.93%, 24.81%, 27.83%, and 17.12%, respectively, compared with the T1 treatment (Figure 7E). The post-podding dry matter accumulation rate in the T2, T3, T4, and T5 treatments increased by 8.74%, 9.02%, 10.18%, and 4.51%, respectively, compared with the T1 treatment. Meanwhile, the difference between T2, T3, T4 and T1, T5 treatments was statistically significant (Figure 7F).

3.9. Nitrogen Accumulation

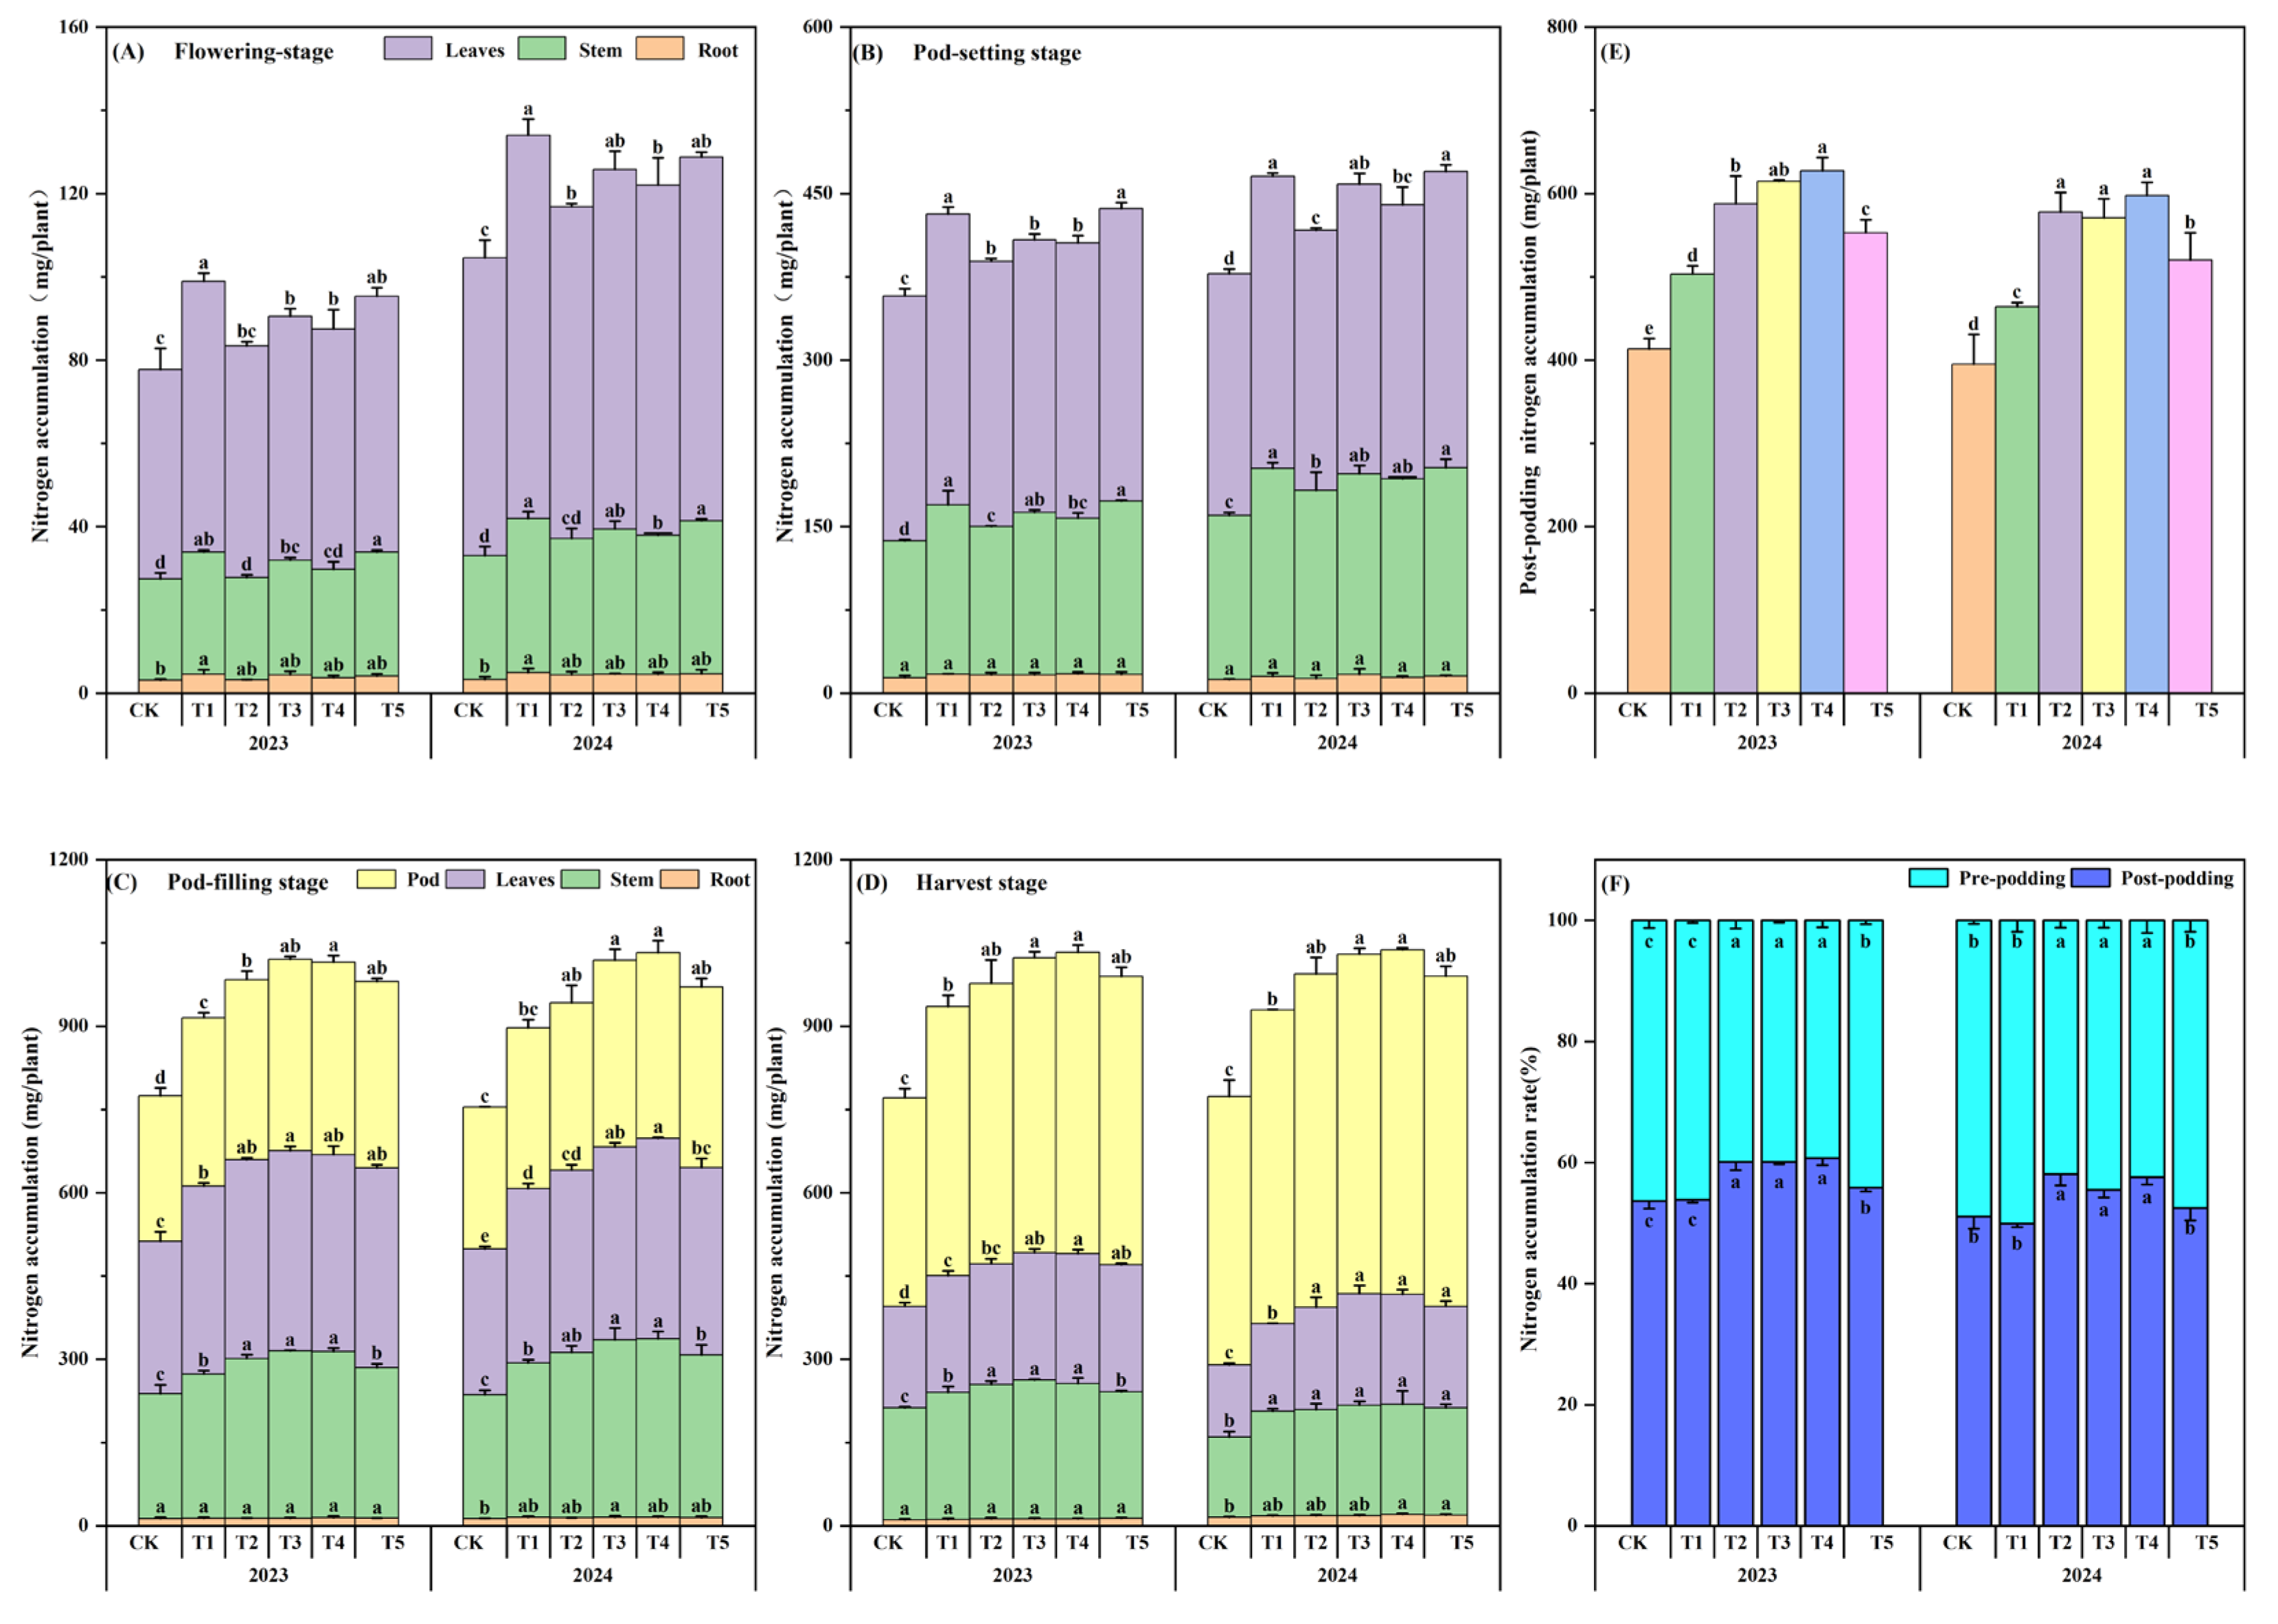
At the flowering stage and pod-setting stage, total nitrogen accumulation showed the trend T1, T5 > T3, T4 > T2 > CK (Figure 8A,B). Compared with the T1 treatment, the T2, T3, T4, and T5 treatments decreased by 14.05%, 7.16%, 10.10%, and 3.82%, respectively, at the flowering stage. Similarly, the T2, T3, and T4 treatments decreased by 10.14%, 3.38%, and 5.73%, respectively, but the T5 treatment increased by 1.05% at the pod-setting stage. At the pod-filling stage and the harvesting stage, total nitrogen accumulation showed the trend T3, T4 > T5, T2 > T1 > CK (Figure 8C,D). Compared with the T1 treatment, the T2, T3, T4, and T5 treatments increased by 6.30%, 12.56%, 13.04%, and 7.71%, respectively, at the pod-filling stage. At the harvesting stage, the increase was 5.73%, 10.07%, 11.06%, and 6.17%, respectively.
The post-podding nitrogen accumulation in the T2, T3, T4, and T5 treatments was significantly higher than that in the T1 treatment, and the T2, T3, and T4 treatments were significantly higher than those in the T5 treatment. Compared with the T1 treatment, the T2, T3, T4, and T5 treatments increased by 20.46%, 22.54%, 26.64%, and 10.91%, respectively (Figure 8E). The post-podding nitrogen accumulation rate in the T2, T3, T4, and T5 treatments increased by 13.92%, 11.34%, 14.03%, and 4.44%, respectively, Compared with the T1 treatment. Meanwhile, the difference between T2, T3, T4 and T1, T5 treatments was statistically significant (Figure 8F).

3.10. Nitrogen Fertilizer Efficiency

The optimized nitrogen fertilizer ratio significantly improved the Nitrogen Use Efficiency (NUE), Partial Factor Productivity of Nitrogen (PFPN), and Agronomic Efficiency of Nitrogen (AEN) of peanuts (Table 4). The T2, T3, T4, and T5 treatments were significantly higher than the T1 treatment, and the T3 and T4 treatments were significantly higher than the T2 and T5 treatments. Compared with the T1 treatment, the NUE in the T2, T3, T4, and T5 treatments increased by 33.39%, 58.58%, 64.37%, and 35.90%, respectively. The PFPN increased by 21.78%, 35.62%, 39.76%, and 21.37%, respectively. The AEN increased by 61.06%, 138.09%, 181.86%, and 85.05%, respectively.

3.11. Correlation Analysis

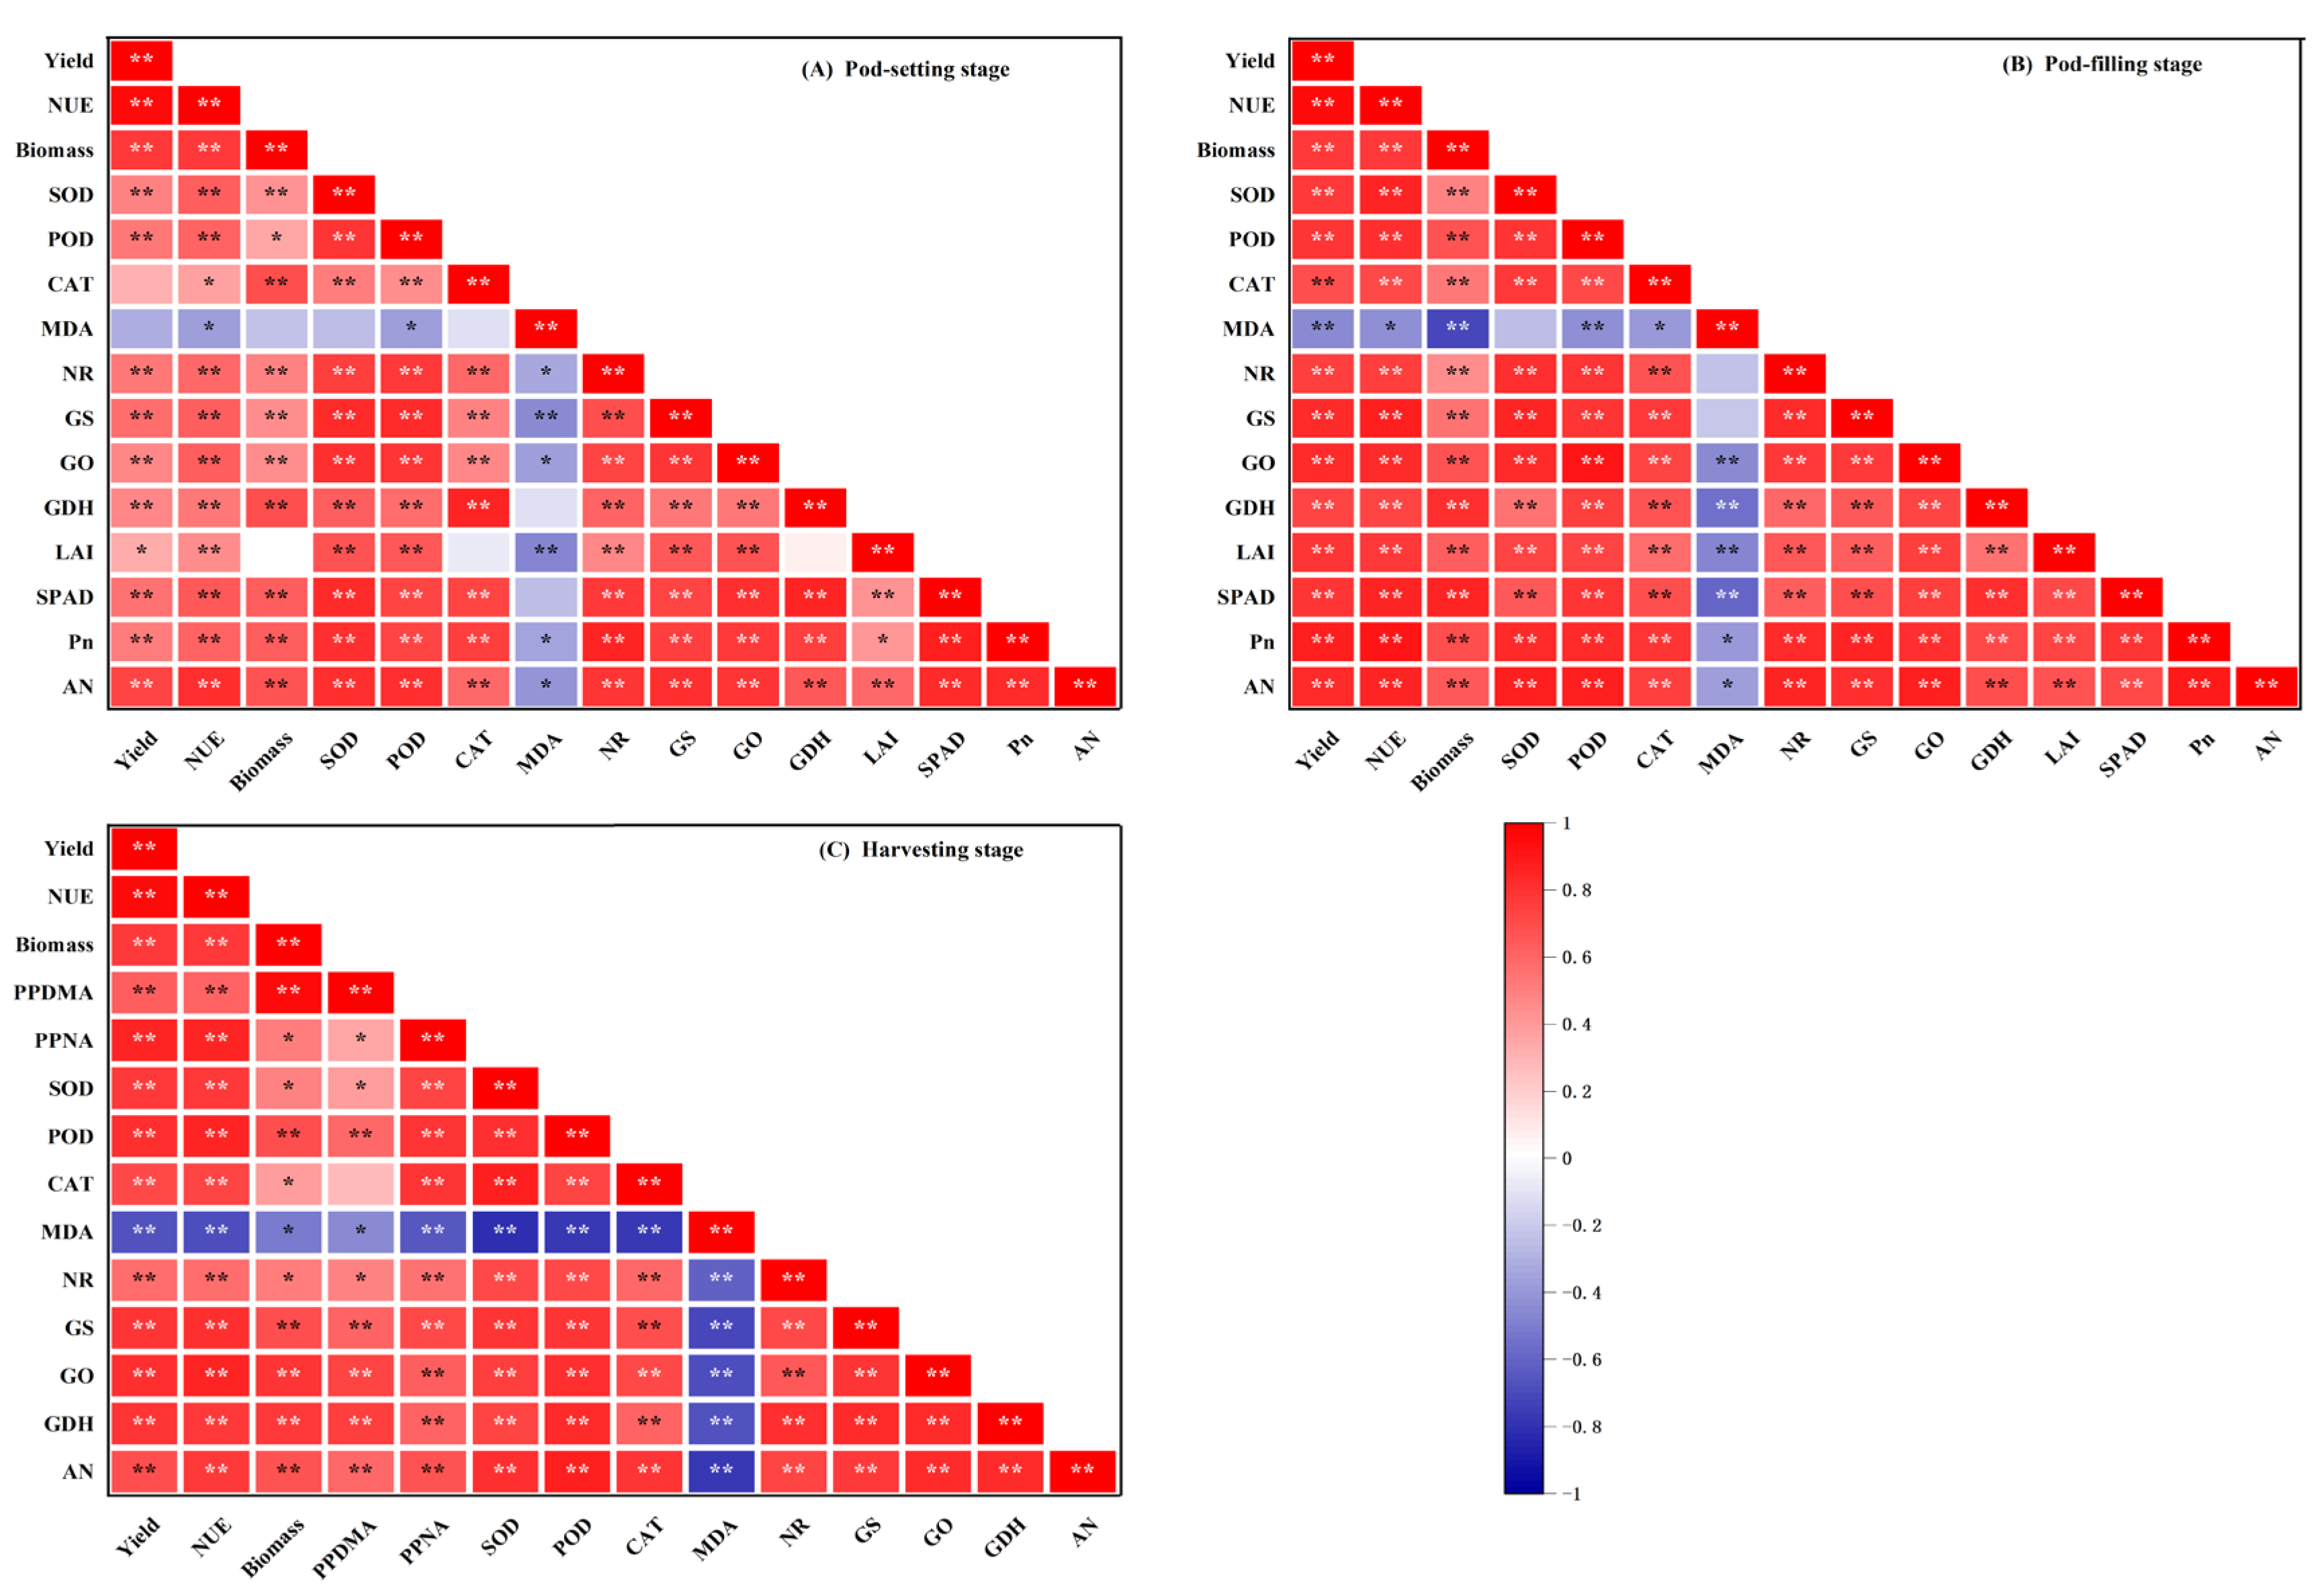
Correlation analysis (Figure 9) demonstrated that peanut yield, NUE, and biomass exhibited highly significant positive correlations with both post-podding dry matter accumulation and post-podding nitrogen accumulation. Significant or highly significant positive correlations were observed with the activities of SOD, POD, and CAT during the pod-setting, pod-filling, and harvesting stages. Highly significant positive correlation were detected with the activities of NR, GS, GOGAT, and GDH across the pod-setting, pod-filling, and harvesting stages. Additionally, highly significant positive correlations were found with the LAI at the pod-filling stage, as well as with both SPAD values and Pn at the pod-setting and pod-filling stages. In contrast, a significant negative correlation was identified with MDA content.

4. Discussion

4.1. Effects of Combined Application of CRU and U on Nitrogen Supply Dynamics

Nitrogen is the most demanded element for peanut growth and development, which can significantly affect the balance between vegetative growth and reproductive growth of peanuts, and thus affect the yield of peanuts [34,37]. In studies on the nitrogen requirement patterns of peanuts, it was found that the nitrogen absorption of peanuts was relatively low before flowering, and most of the nitrogen accumulation (about 60%) occurred after podding [6,38], which is generally similar to the findings of this study (Figure 8). The pod-setting stage is the key period for pod formation. Studies have found that excessively high soil available nitrogen content during the pod-setting stage will increase the number of ineffective pods and pod needles, while insufficient soil available nitrogen content is also detrimental to the formation of pod needles and pods, which will reduce the yield of peanuts [38]. In this study, the T2 treatment with CRU as the sole base fertilizer showed relatively lower soil available nitrogen content before podding compared to other treatments, which led to reduced peanut growth before podding (Figure 3) and was not conducive to pod formation (Table 2). Moreover, the high available nitrogen content during harvest resulted in nitrogen waste (Figure 2). The soil available nitrogen content in the T1 and T5 treatments before podding was excessively high, resulting in vigorous vegetative growth of peanuts at the flowering and podding stages (Figure 3), and the soil available nitrogen content decreased sharply from the pod-setting stage to the pod-filling stage (Figure 2), which was not conducive to pod filling, leading to a reduction in the number of pods per plant (Table 2). Meanwhile, the number of pods per plant in the T5 treatment was higher than that in the T1 treatment. This difference is probably due to the application of 30% of the nitrogen fertilizer as CRU. The 30% and 50% U applications in the T3 and T4 treatments met the nitrogen demand at the flowering and pod-setting stages. After entering the pod-setting stage, the increase in field irrigation and rainfall also promoted the release of CRU, meeting the nitrogen demand from the pod-filling to the harvesting stage of peanuts. The soil available nitrogen content at the pod-filling stage in the T4 treatment was higher than that in the T3 treatment (Figure 2). This may explain why the T4 yields were higher than the T3 yields, which is consistent with the pattern found in wheat by Xiao et al. [39].
In summary, we conclude that CRU combined with U can balance the nitrogen fertilizer requirements of peanut vegetative and reproductive growth, with the T4 treatment being the best, followed by the T3 treatment.

4.2. Effects of Combined Application of CRU and U on Peanut Growth and Nitrogen Utilization

Nitrogen fertilizer is the most critical factor regulating peanut growth. With the increase in nitrogen application at the early growth stage, the main stem height and lateral branch length of peanuts are significantly enhanced [40]. Meanwhile, the first and second pairs of lateral branches contribute 70–80% of the pods per plant [6]. In this study, the main stem height and lateral branch length of the peanut generally reached their highest values at the pod-filling stage. Due to optimal nitrogen supply levels, the main stem height and lateral branch length of the T3 and T4 treatments were higher than those of the other treatments at the pod-filling stage and harvest stage (Figure 3), which could provide an efficient source for pod development in peanuts. Peanut needs to insert the fertilized ovary into the ground via pod needles [41]. The key period for pod needle insertion is from the flowering stage to the pod-setting stage. At this time, the main stem height of the T1 and T5 treatments was higher than that of the other treatments (Figure 1), and the position of the lateral branches on the main stem may be elevated, requiring more photosynthetic products and time for pod needle penetration into the ground [6]. This is detrimental to production.
Peanuts generally absorb nitrogen in the form of nitrate and ammonium salts and assimilate nitrogen into various amino acids through enzymes such as NR, GS, GOGAT, and GDH [42], which are transported to the source organs for substance metabolism and protein synthesis [43]. Approximately 75% of leaf nitrogen is stored in chloroplasts and can be directly mobilized and utilized by crops [44]. Peanut leaves begin to senesce at the pod stage, so the content of leaf nitrogen after pod formation is crucial for maintaining leaf chlorophyll, photosynthesis, and yield formation [42]. In this study, there was no significant difference in the activities of nitrogen-metabolizing enzymes among fertilization treatments at the pod-setting stage, but the activities of nitrogen-metabolizing enzymes in the T2, T3, and T4 treatments at the pod-filling stage were higher than those of other treatments (Figure 5). The enhanced activity of these nitrogen-metabolizing enzymes improved the plant’s ability to absorb and assimilate nitrogen [45]. Meanwhile, treatments T3 and T4 maintained higher levels of soil available nitrogen and plant nitrogen content during the pod-filling stage, which positively influenced nitrogen uptake and assimilation. These mechanisms collectively contributed to the superior performance of T3 and T4 in terms of NUE, AEN, and PFPN. Wu et al. [46] found that crop NUE was positively correlated with the activity of nitrogen-metabolizing enzymes, while Liu et al. [47] demonstrated that appropriately reducing early-stage nitrogen application promoted deeper root growth and enhanced late-stage nitrogen uptake and utilization, thereby improving NUE. These findings are consistent with the results of this study.
After the podding stage, peanut seed kernels begin to develop, and amino acids and proteins are essential for the formation of the storage organs [48]. Increasing post-podding nitrogen accumulation is crucial for seed kernel development. In this study, it was found that the post-podding nitrogen accumulation rate was 50–60%, and the post-podding nitrogen accumulation in the T2, T3, and T4 treatments was significantly higher than that in other treatments, which could provide more amino acids and proteins for seed kernel development. The nitrogen accumulation at the harvesting stage under the T3 and T4 treatments was higher than that under other treatments (Figure 3). The T2 treatment may have lacked sufficient nitrogen in the early stage, leading to inadequate nitrogen storage in the leaves, which could affect the transfer of amino acids to the seeds.
Therefore, we believe that the T3 and T4 treatments can improve the activity of nitrogen metabolizing enzymes after podding, promote the absorption and utilization of nitrogen by peanuts, enhance the extension of the main stem and lateral branches of peanuts after podding, improve the nitrogen accumulation per plant, and ultimately increase the nitrogen utilization rate. Meanwhile, the T4 treatment performed better than the T3 treatment.

4.3. Effects of Combined Application of CRU and U on Peanut Senescence

Lipid peroxidation refers to a series of oxidative reactions involving unsaturated fatty acids in biological membranes triggered by free radicals and other factors [49]. Plant senescence accelerates lipid peroxidation, leading to an increase in the product malondialdehyde (MDA) and enhanced cell membrane permeability [50,51]. Rational nitrogen fertilizer application can reduce the accumulation of reactive oxygen species (ROS), thereby decreasing MDA content and stabilizing cell membrane permeability within an optimal range, ultimately enhancing crop resistance to senescence [27,28]. In this study, the MDA content in peanuts gradually increased from the full-pod stage to the harvest stage, indicating leaf senescence. Treatments T2, T3, and T4 exhibited lower MDA levels, which were associated with soil available nitrogen content. At both the full-pod and harvest stages, soil available nitrogen content showed a significant negative correlation with MDA content (Figure 9). The combined application of controlled-release urea and conventional urea maintained adequate soil available nitrogen levels during the late growth stages, promoting the synthesis of amino acids, particularly proline, which directly scavenges ROS in plants [52]. Additionally, the synthesized proteins mitigated the degradation of endogenous proteins, thereby enhancing the crop’s resistance to senescence.
The antioxidant capacity of crops is primarily manifested through the enhanced activity of leaf antioxidant enzymes (SOD, POD, CAT), which defend against and eliminate ROS generated in plants [53] The application of controlled-release fertilizers has been shown to improve the activity of ROS-scavenging enzymes during the mid-to-late growth stages [54], consistent with the findings of this study. In this experiment, the antioxidant enzyme activity in peanuts decreased progressively from the pod-setting stage onward. However, treatments T2, T3, and T4 maintained higher antioxidant enzyme levels during the late growth stages (Figure 4), which contributed to reduced MDA accumulation in leaves and improved the balance between ROS production and elimination in cells. Furthermore, antioxidant enzyme activity was significantly positively correlated with soil available nitrogen content (Figure 9), indicating that maintaining adequate soil nitrogen levels in the later stages can enhance peanut antioxidant enzyme activity. This finding aligns with previous research by Liu et al. [47].
The LAI is an indicator of plant photosynthetic capacity, and a decrease in LAI is one of the manifestations of plant senescence [55]. Chlorophyll, the most essential pigment for photosynthesis, degrades during senescence. Chlorophyll content is the most direct indicator of leaf senescence [34]. Studies have shown that the crop LAI, net photosynthetic rate (Pn), and SPAD value are positively correlated with antioxidant enzyme activity and negatively correlated with malondialdehyde (MDA), as reported in content by Wu et al. [34], which is consistent with the findings of this study. In this experiment, treatments T3 and T4 exhibited higher LAI at the full-pod stage compared to other treatments, while treatments T2, T3, and T4 showed higher SPAD and Pn values. The lower LAI in T2 compared to T3 and T4 was due to insufficient nitrogen supply during the early growth stage, resulting in poorer vegetative growth. Higher LAI enhances light interception, while higher SPAD and Pn values improve the persistence of source organs in peanuts, making their anti-senescence characteristics more pronounced. These findings are consistent with the results reported in soybeans by Qiang et al. [56].

4.4. Effects of Combined Application of CRU and U on Biomass, Yield, and Quality of Peanuts

The conventional planting mode of applying a large amount of base fertilizer at one time restricts the development of peanuts [8]. In view of this, this study carried out a 2-year field experiment on the ratio of CRU to U in peanuts and found that the highest yield was achieved by the 70% CRU + 30% U treatment (T4). Maize achieves maximum yield at a 50% U + 50% CRU ratio [21]. This is because the peak nutrient demand period of maize (from the jointing to big trumpet stage, 30-50d) is shorter than that of peanut (from the pod-setting to pod-filling stage, 60-90d), requiring a higher proportion of fast-acting urea. The optimal ratio for wheat (25–30% U + 70–75% CRU) is similar to our study [21,39]. This is because the peak nutrient demand period of spring wheat (from the jointing to booting stage, 50-70d) is similar to that of peanut, both showing relatively gradual nutrient demand patterns. Peanut yield is composed of plant number per unit area, pod number per plant, and pod weight. The rational combination of CRU and U affected the pod number per plant and pod dry weight per plant in peanuts, which could be attributed to the balance of nitrogen supply levels at the pod-setting stage and the pod-filling stage [8,35]. The number of pods per plant in the T4 treatment was significantly higher than that in other treatments (Table 2). This increase in pod number promoted the transfer of photosynthates to the pods during pod-filling [2]. The pod-setting stage is the peak nutrient utilization period of peanuts, representing both vegetative growth and reproductive growth. Excessively vigorous vegetative growth in this period will reduce the nutrient utilization rate of reproductive organs [57]. In this study, the post-podding dry matter accumulation rate ranged 64–75%. The post-podding dry matter accumulation rate was higher in T2, T3, and T4 treatments with higher proportions of CRU, but the post-podding dry matter accumulation amount in the T2 treatment was lower than that in the T3 and T4 treatments (Figure 7), which was caused by poor growth in the early stage. The post-podding dry matter accumulation in the T4 treatment was the highest, and since post-podding dry matter accumulation in peanuts is the main source of pod-filling [48], it was significantly positively correlated with yield (Figure 9). The T3 and T4 treatments showed stronger anti-senescence ability at the pod-filling stage (Figure 4), and their leaf dry weight at the pod-filling stage was higher than in other treatments (Figure 7), which enabled peanuts to maintain a higher LAI and intercept more light resources. At the same time, higher SPAD and Pn values provide more photosynthetic products for pod-filling [58], resulting in higher yields in the T3 and T4 treatments compared to the other treatments.
The oil content and protein content of peanut kernels are important quality indexes for evaluating peanut quality [59]. Nitrogen application can significantly affect the quality of peanuts, and the crude protein content and amino acid content of peanuts increased with increasing nitrogen application [24]. In this study, we found that the crude protein content and amino acid content of peanuts in the T4 treatment were the highest at the nitrogen application rate of 120 kg·ha−1, but the oil content was reduced in all fertilizer treatments. Previous studies have shown that the formation of peanut crude protein is closely related to the enzyme activities of NR, GOGAT, GS, and GDH [60]. In this study, the T4 treatment maintained higher soil available nitrogen content during the later growth stage and significantly improved the enzyme activities of NR, GOGAT, GS, and GDH. This enhanced enzyme activity enables peanuts to produce more amino acids, which are transferred to the kernels. At the same time, GS can also assimilate nitrogen from amino acid metabolism in leaves and promote the transfer of N to developing seeds [61].
Therefore, we believe that the T4 treatment can effectively improve the biomass, yield, and quality of peanuts.

4.5. Technology Promotion and Challenges

In this study, we found that under a total nitrogen application rate of 120 kg·ha−1, a CRU to U ratio of 7:3 delayed peanut senescence and improved nitrogen utilization, resulting in a 10.88% increase in yield. Although the price of CRU is approximately 4.5% higher than that of conventional urea, the additional fertilizer cost under this blending practice is almost negligible. Furthermore, the blended application significantly reduces the labor cost associated with topdressing, enhances farming efficiency, and improves economic returns for farmers. However, this fertilization technique still faces several challenges: (1) Due to differences in soil temperature and humidity across regions, the release characteristics of CRU vary, leading to inconsistent results in some studies. Therefore, determining an appropriate ratio of CRU to U should consider local environmental factors. (2) Since peanuts are leguminous plants, their nodule nitrogen fixation contributes to nitrogen acquisition. Reducing the soil available nitrogen content before podding promotes peanut rhizobia nodulation [62], explaining the advantages of the T4 and T3 treatments. However, some studies have shown that long-term application of CRU may consequently affect microbial community composition [63], and this may affect peanut nodulation. (3) Recent studies have revealed that after the coating of CRU degrades, it remains in the soil as microplastics, which may negatively affect subsequent crops and the environment [64,65]. These will be the focus of our next study.

5. Conclusions

The primary scientific contribution of this study lies in identifying the optimal blending ratio of CRU to U for peanut production and elucidating the dynamic regulatory effects of different ratios on the antioxidant enzyme system. Results demonstrated that the T4 treatment (70% CRU + 30% U) achieved the highest yield and NUE. This treatment balanced nitrogen supply across growth stages, significantly increasing soil available nitrogen content and nitrogen assimilation enzyme activity during the late growth phase, thereby promoting the accumulation of dry matter and nitrogen post-podding. Simultaneously, the T4 treatment markedly enhanced antioxidant enzyme activity, reduced MDA content, alleviated senescence-induced leaf damage, improved light interception capacity (LAI) and source organ functionality (SPAD, Pn), and consequently increased the number of effective pods per plant. These mechanisms collectively established a solid foundation for yield formation. In conclusion, the combined application of 70% CRU and 30% U can serve as an efficient and economical nitrogen management strategy for ridge-furrow plastic film mulched peanut cultivation in Shandong’s brown soil regions. This approach is simple to implement, demonstrates significant benefits, and exhibits strong potential for large-scale field application. Future research should further explore genotype × management × environment interactions across different cropping systems and regions.

Supplementary Materials

The following supporting information can be downloaded at: https://www.mdpi.com/article/10.3390/agriculture15181923/s1: Supplementary Materials for CRU; Table S1: Analysis of variance of yield and main measurement characteristics between/among years and treatment.

Author Contributions

M.G.: writing—review and editing, writing—original draft, validation, investigation, formal analysis, data curation. L.L.: writing—original draft, validation, investigation, formal analysis. R.F.: writing—review and editing, formal analysis. F.L.: methodology, conceptualization. Z.T.: investigation, formal analysis. Z.W.: investigation. M.Z.: investigation. K.Z.: writing—review and editing, supervision, methodology, funding acquisition, conceptualization. Y.W.: writing—review and editing, supervision, methodology, conceptualization. All authors have read and agreed to the published version of the manuscript.

Funding

This research was funded by the earmarked fund for CARS-13 and the Key Research and Development Program of Shandong Province (2024CXGC010902).

Data Availability Statement

The original contributions presented in the study are included in the article. Further inquiries can be directed to the corresponding author.

Conflicts of Interest

The authors do not declare any conflicts of interest.

References

  1. Shi, L.; Wang, B.; Hu, Z.; Yang, H. Mechanism and Experiment of Full-Feeding Tangential-Flow Picking for Peanut Harvesting. Agriculture 2022, 12, 179. [Google Scholar] [CrossRef]
  2. Li, L.; Cheng, X.; Zhang, Y.; Kohtz, D.; Wang, X.; Zhang, X.; Kong, X.; Xue, H.; Jia, P.; Bai, N.; et al. Exogenous melatonin improves peanut field productivity and quality at reduced nitrogen application. Field Crops Res. 2024, 319, 109650. [Google Scholar] [CrossRef]
  3. Toomer, O.T. Nutritional chemistry of the peanut (Arachis hypogaea). Crit. Rev. Food Sci. Nutr. 2018, 58, 3042–3053. [Google Scholar] [CrossRef]
  4. Wang, F.; Miao, H.; Zhang, S.; Hu, X.; Li, C.; Yang, W.; Chen, J. Identification of a New Major Oil Content QTL Overlapped with FAD2B in Cultivated Peanut (Arachis hypogaea L.). Plants 2025, 14, 615. [Google Scholar] [CrossRef]
  5. Guo, P.; Ren, J.; Shi, X.; Xu, A.; Zhang, P.; Guo, F.; Feng, Y.; Zhao, X.; Yu, H.; Jiang, C. Optimized nitrogen application ameliorates the photosynthetic performance and yield potential in peanuts as revealed by OJIP chlorophyll fluorescence kinetics. BMC Plant Biol. 2024, 24, 774. [Google Scholar] [CrossRef]
  6. Gao, H.; Zhang, C.; Zhang, L.; Guo, F.; Cross, P.; Zhang, Z.; Wan, S.; Zhang, F. Morphological responses in peanut pod development to intercropping and nitrogen application rates. Field Crops Res. 2023, 302, 109101. [Google Scholar] [CrossRef]
  7. Zhang, M.; Wang, L.; Wan, Y.; Liu, F.; Zhang, K. Rational Nitrogen Strategies Can Improve Peanut Source Supply Capacity and Pod Yield. Agron. J. 2017, 109, 2927–2935. [Google Scholar] [CrossRef]
  8. Zhao, J.; Liu, Z.; Lai, H.; Zhao, M.; Zhu, Q.; Zhao, C.; Yang, D.; Li, X. The impacts of soil tillage combined with plastic film management practices on soil quality, carbon footprint, and peanut yield. Eur. J. Agron. 2023, 148, 126881. [Google Scholar] [CrossRef]
  9. Huang, T.; Wu, Q.; Yuan, Y.; Zhang, X.; Sun, R.; Hao, R.; Yang, X.; Li, C.; Qin, X.; Song, F.; et al. Effects of plastic film mulching on yield, water use efficiency, and nitrogen use efficiency of different crops in China: A meta-analysis. Field Crops Res. 2024, 312, 109407. [Google Scholar] [CrossRef]
  10. Ding, Z.; Hu, R.; Cao, Y.; Li, J.; Xiao, D.; Hou, J.; Wang, X. Integrated assessment of yield, nitrogen use efficiency and ecosystem economic benefits of use of controlled-release and common urea in ratoon rice production. J. Integr. Agric. 2024, 23, 3186–3199. [Google Scholar] [CrossRef]
  11. Pierozan, J.C.; Favarin, J.L.; Baptistella, J.L.C.; Almeida, R.E.M.; Maciel, O.S.; Lago, B.C.; Tezotto, T. Controlled release urea increases soybean yield without compromising symbiotic nitrogen fixation. Exp. Agric. 2023, 59, e1. [Google Scholar] [CrossRef]
  12. Shibru, D.; Mitiku, H. Effects of Rhizobial inoculant and nitrogen fertilizer on yield and nodulation of common bean. J. Plant Nutr. 2000, 41, 55–63. [Google Scholar] [CrossRef]
  13. Guo, J.; Wang, Y.; Blaylock, A.D.; Chen, X. Mixture of controlled release and normal urea to optimize nitrogen management for high-yielding (>15 mg·ha −1 ) maize. Field Crops Res. 2017, 204, 23–30. [Google Scholar] [CrossRef]
  14. Liu, S.; Li, Y.; Zhang, Y.; Chen, L.; Wang, T.; Li, H.; Liao, Y.; Li, Y.; Zhang, G.; Han, J. Controlled release urea combined with normal urea maintains the N balance and improves the environmental and economic benefits in wheat–maize multiple cropping. Eur. J. Agron. 2025, 163, 127446. [Google Scholar] [CrossRef]
  15. Zheng, C.; Li, C.; Tian, L.; Shen, Z.; Feng, G.; Hou, W.; Liu, F.; Gao, Q.; Wang, Y. Mixture of controlled-release and normal urea to improve maize root development, post-silking plant growth, and grain filling. Eur. J. Agron. 2023, 151, 126994. [Google Scholar] [CrossRef]
  16. Li, H.; Zhu, Y.; Wang, G.; Liu, R.; Huang, D.; Song, M.; Zhang, Y.; Wang, H.; Wang, Y.; Shao, R.; et al. Maize yield increased by matching canopy light and nitrogen distribution via controlled-release urea /urea adjustment. Field Crops Res. 2024, 308, 109284. [Google Scholar] [CrossRef]
  17. Ji, P.; Du, X.; Zhou, J.; Peng, Y.; Li, X.; Tao, P.; Zhang, Y. Network Analysis Reveals the Combination of Controlled-Release and Regular Urea Enhances Microbial Interactions and Improves Maize Yields. Front. Microbiol. 2022, 13, 825787. [Google Scholar] [CrossRef]
  18. Hu, Y.; Zhang, F.; Hassan, J.H.; Peng, X.; Chen, H.; Tang, W.; Lai, Y.; Wu, Y. Controlled-Release Nitrogen Mixed with Common Nitrogen Fertilizer Can Maintain High Yield of Rapeseed and Improve Nitrogen Utilization Efficiency. Plants 2023, 12, 4105. [Google Scholar] [CrossRef] [PubMed]
  19. Tang, C.; Han, M.; Yang, X.; Shen, T.; Gao, Y.; Wang, Y.; Zhang, S.; Chen, D.; He, D.; Li, C. Gene Expression, Enzyme Activity, Nitrogen Use Efficiency, and Yield of Rice Affected by Controlled-Release Nitrogen. ACS Omega 2023, 8, 23772–23781. [Google Scholar] [CrossRef]
  20. Yang, L.; Lakshmanan, P.; Tu, D.; Sun, X.; Zhou, Y.; Xu, Y.; Li, Z.; Wu, W.; Liu, X.; Luo, T.; et al. Co-Benefits of Yield and Nitrogen Use Efficiency Gains Through Combined Use of Controlled-Release Urea and Conventional Urea in Rice. Food Energy Secur. 2025, 14, e70043. [Google Scholar] [CrossRef]
  21. Fan, Z.; Chen, J.; Zhai, S.; Ding, X.; Zhang, H.; Sun, S.; Tian, X. Optimal Blends of Controlled-Release Urea and Conventional Urea Improved Nitrogen Use Efficiency in Wheat and Maize with Reduced Nitrogen Application. J. Soil Sci. Plant Nutr. 2021, 21, 1103–1111. [Google Scholar] [CrossRef]
  22. Liu, Z.; Gao, F.; Li, X.; Zhang, J. Source-sink coordinated peanut cultivar increases yield and kernel protein content through enhancing photosynthetic characteristics and regulating carbon and nitrogen metabolisms. Plant Physiol. Biochem. 2024, 206, 108311. [Google Scholar] [CrossRef]
  23. Gao, F.; Li, Y.; Zhang, Q.; Liu, Z.; Zhao, J.; Yang, D.; Li, X. Regulating effect of spraying stage of ethephon on the formation of source-sink in peanut. Ying Yong Sheng Tai Xue Bao 2021, 32, 951–958. [Google Scholar] [CrossRef]
  24. Li, G.; Guo, X.; Sun, W.; Hou, L.; Wang, G.; Tian, R.; Wang, X.; Qu, C.; Zhao, C. Nitrogen application in pod zone improves yield and quality of two peanut cultivars by modulating nitrogen accumulation and metabolism. BMC Plant Biol. 2024, 24, 48. [Google Scholar] [CrossRef]
  25. Wu, L.; Wang, S.; Tian, L.; Wu, L.; Li, M.; Zhang, J.; Li, P.; Zhang, W.; Chen, Y. Comparative proteomic analysis of the maize responses to early leaf senescence induced by preventing pollination. J. Proteom. 2018, 177, 75–87. [Google Scholar] [CrossRef]
  26. Ahmad, I.; Minkina, T.; Mandzhieva, S.; Rajput, V.D.; Sushkova, S.; Tarigholizadeh, S.; Ikram, K. Effect of Planting Patterns and Fertilization Optimization on Hormonal Profile, Leaf Senescence and Yield in Maize. J. Soil Sci. Plant Nutr. 2024, 25, 195–212. [Google Scholar] [CrossRef]
  27. Du, K.; Zhao, W.; Lv, Z.; Xu, B.; Hu, W.; Zhou, Z.; Wang, Y. Optimal rate of nitrogen fertilizer improves maize grain yield by delaying the senescence of ear leaves and thereby altering their nitrogen remobilization. Field Crops Res. 2024, 310, 109359. [Google Scholar] [CrossRef]
  28. Lan, T.; Du, L.; Wang, X.; Zhan, X.; Liu, Q.; Wei, G.; Lyu, C.; Liu, F.; Gao, J.; Feng, D.; et al. Synergistic effects of planting density and nitrogen fertilization on chlorophyll degradation and leaf senescence after silking in maize. Crop J. 2024, 12, 605–613. [Google Scholar] [CrossRef]
  29. Zhang, W. Regulatory Effects of Different Humic acid Fertilizers on Peanut Growth and Yield. Master’s thesis, Shandong Agricultural University, Taian, China, 2020. [Google Scholar] [CrossRef]
  30. Li, H.; Qiong, Y.; Fang, C.; Tang, J.; Huang, K. Integrated use of cultivation practices increases the Tartary buckwheat yield by improving the photosynthetic capacity and nitrogen utilization rate. Front. Plant Sci. 2025, 16, 1651635. [Google Scholar] [CrossRef]
  31. Bories, P.N.; Bories, C. Nitrate determination in biological fluids by an enzymatic one-step assay with nitrate reductase. Clin. Chem. 1995, 41, 904–907. [Google Scholar] [CrossRef]
  32. Singh, R.P.; Srivastava, H.S.M.D. Increase in glutamate synthase (NADH) activity in maize seedlings in response to nitrate and ammonium nitrogen. Physiol. Plant. 1986, 66, 413–416. [Google Scholar] [CrossRef]
  33. Zhang, C.; Peng, S.; Peng, X.; Chavez, A.Q.; Bennett, J. Response of glutamine synthetase isoforms to nitrogen sources in rice (Oryza sativa L.) roots. Plant Sci. 1997, 125, 163–170. [Google Scholar] [CrossRef]
  34. Wu, P.; Liu, F.; Chen, G.; Wang, J.; Huang, F.; Cai, T.; Zhang, P.; Jia, Z. Can deep fertilizer application enhance maize productivity by delaying leaf senescence and decreasing nitrate residue levels? Field Crops Res. 2022, 277, 108417. [Google Scholar] [CrossRef]
  35. Shang, S.; Yu, X.; Qi, Y. Comparison of determination methods of hydrolyzable nitrogen in soil and precautions. Agric. Technol. 2022, 42, 97–99. [Google Scholar] [CrossRef]
  36. Junior, P.C.; Kawakami, J. Efficiency of the leaf disc method for estimating the leaf area index of soybean plants. Acta Sci. Agron. 2013, 35, 487–493. [Google Scholar] [CrossRef]
  37. Noorzai, A.; Suresh, K.; Subbarao, A.S.; Kumar, K.A.; Reddy, K.P.C.; Satish, P. Nutrient Uptake of the Individual Crops in Maize and Groundnut Cropping System Grown under Different Irrigation Systems with Varied Irrigation and Nitrogen Levels. J. Sci. Res. Rep. 2024, 30, 369–382. [Google Scholar] [CrossRef]
  38. Noorzai, A.; Suresh, K.; Subbarao, A.S.; Kumar, K.A.; Reddy, K.P.C.; Satish, P. Profitability of Maize and Groundnut Crop Production under Different Irrigation Systems with Varied Irrigation and Nitrogen Level Application in Southern India. Arch. Curr. Res. Int. 2024, 24, 109–122. [Google Scholar] [CrossRef]
  39. Meng, C.; Wu, M.; Wang, X.; Yang, L.; Liang, H.; Wu, Q.; Shen, P. Slow-release fertilisers increased microflora and nitrogen use efficiency and thus promoted peanut growth and yield. Plant Soil Environ. 2024, 70, 61–71. [Google Scholar] [CrossRef]
  40. Xiao, Z.; Zhang, Y.; Wang, C.; Wen, Y.; Wang, W.; Zhu, K.; Zhang, W.; Gu, J.; Liu, L.; Zhang, J.; et al. Optimized controlled-release nitrogen strategy achieves high yield and nitrogen use efficiency of wheat following rice in the lower reaches of Yangtze River of China. Field Crops Res. 2024, 317, 109567. [Google Scholar] [CrossRef]
  41. Nagaraju, K.; Prasad, T.N.V.K.; Chari, M.S.; Ramu, Y.R.; Murthy, B.R.; Naidu, M.V.S.; Leelavathy, G.P.; Mohan, P.R.; Damu, A.G.; Gopal, D. Effects of Soil Application of Nanobiochar-Based Nitrogen and Potassium Fertilizers on the Growth and Yield of Groundnut (Arachis Hypogaea L.). J. Soil Sci. Plant Nutr. 2024, 24, 5759–5771. [Google Scholar] [CrossRef]
  42. Kumar, R.; Pandey, M.K.; Roychoudhry, S.; Nayyar, H.; Kepinski, S.; Varshney, R.K. Peg Biology: Deciphering the Molecular Regulations Involved During Peanut Peg Development. Front. Plant Sci. 2019, 10, 1289. [Google Scholar] [CrossRef]
  43. Tegeder, M.; Masclaux-Daubresse, C. Source and sink mechanisms of nitrogen transport and use. New Phytol. 2018, 217, 35–53. [Google Scholar] [CrossRef] [PubMed]
  44. Aluko, O.O.; Liu, Z.; Sun, X. The interplay of carbon and nitrogen distribution: Prospects for improved crop yields. Mod. Agric. 2023, 1, 57–75. [Google Scholar] [CrossRef]
  45. Wu, H.; Xiang, J.; Zhang, Y.; Zhang, Y.; Peng, S.; Chen, H.; Zhu, D. Effects of post-anthesis nitrogen uptake and translocation on photosynthetic production and rice yield. Sci. Rep. 2018, 8, 12891. [Google Scholar] [CrossRef] [PubMed]
  46. Gyawali, C.; Upadhayaya, B.T.; Pokharel, B.; Pandey, B.P.; Gyawaly, P.; Moi, T. Effect of Different Nitrogen Levels on Growth, Yield, and Nitrogen Use Efficiency (NUE) of Hardinath Hybrid Dhan-1 in Madhesh Province, Nepal. Int. J. Plant Soil Sci. 2025, 37, 56–66. [Google Scholar] [CrossRef]
  47. Liu, C.; Pang, S.; Li, X.; Liu, P.; Zhou, Y.; Lin, X.; Gu, S.; Wang, D. Layered nitrogen fertilization regulates root morphology to promote synergistic nitrogen and phosphorus absorption in maize (Zea mays L.). Field Crops Res. 2025, 322, 109737. [Google Scholar] [CrossRef]
  48. Gao, H.; Zhang, C.; van der Werf, W.; Ning, P.; Zhang, Z.; Wan, S.; Zhang, F. Intercropping modulates the accumulation and translocation of dry matter and nitrogen in maize and peanut. Field Crops Res. 2022, 284, 108561. [Google Scholar] [CrossRef]
  49. Gao, H.; Zhao, F.; Yang, J.; Yang, H. Nitric oxide alleviates lipid peroxidation induced by osmotic stress during senescence of detached leaves of Malus hupehensis Rehd. J. Hortic. Sci. Biotechnol. 2010, 85, 367–373. [Google Scholar] [CrossRef]
  50. Zhao, H.; Dai, T.; Jing, Q.; Jiang, D.; Cao, W. Leaf senescence and grain filling affected by post-anthesis high temperatures in two different wheat cultivars. Plant Growth Regul. 2007, 51, 149–158. [Google Scholar] [CrossRef]
  51. Lu, J.; Zhang, Q.; Sun, X.; Deng, Y.; Guo, H.; Wang, C.; Zhao, L. Study on the Mechanism of Slow-Release Fertilizer and Nitrogen Fertilizer on the Senescence Characteristics of Quinoa Leaves. Agronomy 2024, 14, 884. [Google Scholar] [CrossRef]
  52. Shehab, A.E.S.A.; Guo, Y. Effects of nitrogen fertilization and drought on hydrocyanic acid accumulation and morpho-physiological parameters of sorghums. J. Sci. Food Agric. 2021, 101, 3355–3365. [Google Scholar] [CrossRef] [PubMed]
  53. Sairam, R.K.; Vasanthan, B.; Arora, A. Calcium regulates Gladiolus flower senescence by influencing antioxidative enzymes activity. Acta Physiol. Plant. 2011, 33, 1897–1904. [Google Scholar] [CrossRef]
  54. Yue, K.; Li, L.; Xie, J.; Fudjoe, S.K.; Zhang, R.; Luo, Z.; Anwar, S. Nitrogen Supply Affects Grain Yield by Regulating Antioxidant Enzyme Activity and Photosynthetic Capacity of Maize Plant in the Loess Plateau. Agronomy 2021, 11, 1094. [Google Scholar] [CrossRef]
  55. Tian, G.; Qi, D.; Zhu, J.; Xu, Y. Effects of nitrogen fertilizer rates and waterlogging on leaf physiological characteristics and grain yield of maize. Arch. Für Acker-Pflanzenbau Bodenkd. 2021, 67, 863–875. [Google Scholar] [CrossRef]
  56. Qiang, B.; Chen, S.; Fan, Z.; Cao, L.; Li, X.; Fu, C.; Zhang, Y.; Jin, X. Effects of nitrogen application levels on soybean photosynthetic performance and yield: Insights from canopy nitrogen allocation studies. Field Crops Res. 2025, 326, 109871. [Google Scholar] [CrossRef]
  57. Zhao, S.; LÜ, J.; Xu, X.; Lin, X.; Luiz, M.R.; Qiu, S.; Ciampitti, I.; He, P. Peanut yield, nutrient uptake and nutrient requirements in different regions of China. J. Integr. Agric. 2021, 20, 2502–2511. [Google Scholar] [CrossRef]
  58. Liao, Z.; Lai, Z.; Kou, H.; Zhang, H.; Li, Z.; Zhang, F.; Fan, J. Soil Mulching Practices Increased Grain-Filling Capacity of Rainfed Maize (Zea mays L.) by Improving Soil Hydrothermal Condition and Leaf Photosynthetic Potential. J. Agron. Crop Sci. 2024, 210, e12781. [Google Scholar] [CrossRef]
  59. Jegadeeswari, D.; Chinnappan, S.; Mathiyazhagan, V.; Mahalingam, M.; Damodharan, Y.; Ganesan, D. Unlocking bottlenecks of groundnut productivity and quality: Opportunities for foliar micronutrient mixture. J. Plant Nutr. 2025, 48, 1134–1143. [Google Scholar] [CrossRef]
  60. Zhang, J.; Gao, F.; Lin, Y.; Wang, Y.; Yang, C.T.; Zhang, F.; Li, Y.; Li, X. Differences in seed kernel qualityand related enzyme activities of different quality type peanut cultivars. Chin. J. Appl. Ecol. 2013, 24, 481–487. [Google Scholar] [CrossRef]
  61. Lothier, J.; Gaufichon, L.; Sormani, R.; Lemaître, T.; Azzopardi, M.; Morin, H.; Chardon, F.; Reisdorf-Cren, M.; Avice, J.C.; Masclaux-Daubresse, C. The cytosolic glutamine synthetase GLN1;2 plays a role in the control of plant growth and ammonium homeostasis in Arabidopsis rosettes when nitrate supply is not limiting. J. Exp. Bot. 2011, 62, 1375–1390. [Google Scholar] [CrossRef] [PubMed]
  62. Liu, Y.; Yan, Z.; Wang, J.; Zhao, J.; Liu, Y.; Zou, J.; Li, L.; Zhang, J.; Wan, S. Optimizing Initial Nitrogen Application Rates to Improve Peanut (Arachis hypogaea L.) Biological Nitrogen Fixation. Agronomy 2023, 13, 3020. [Google Scholar] [CrossRef]
  63. Chen, Z.; Wan, Q.; Zhou, P.; Li, H.; Liu, Y.; Lu, Y.; Li, B. Microplastics Can Inhibit Organic Carbon Mineralization by Influencing Soil Aggregate Distribution and Microbial Community Structure in Cultivated Soil: Evidence from a One-Year Pot Experiment. Agronomy 2024, 14, 2114. [Google Scholar] [CrossRef]
  64. Katsumi, N.; Kusube, T. Runoff and accumulation of microplastics derived from polymer-coated fertilizer in Japanese paddy fields. Environ. Toxicol. Chem. 2025, 44, 935–943. [Google Scholar] [CrossRef] [PubMed]
  65. Bhattacharjee, L.; Gopakumar, A.N.; Beheshtimaal, A.; Jazaei, F.; Ccanccapa-Cartagena, A.; Salehi, M. Mechanisms of microplastic generation from polymer-coated controlled-release fertilizers (PC-CRFs). J. Hazard. Mater. 2025, 486, 137082. [Google Scholar] [CrossRef] [PubMed]
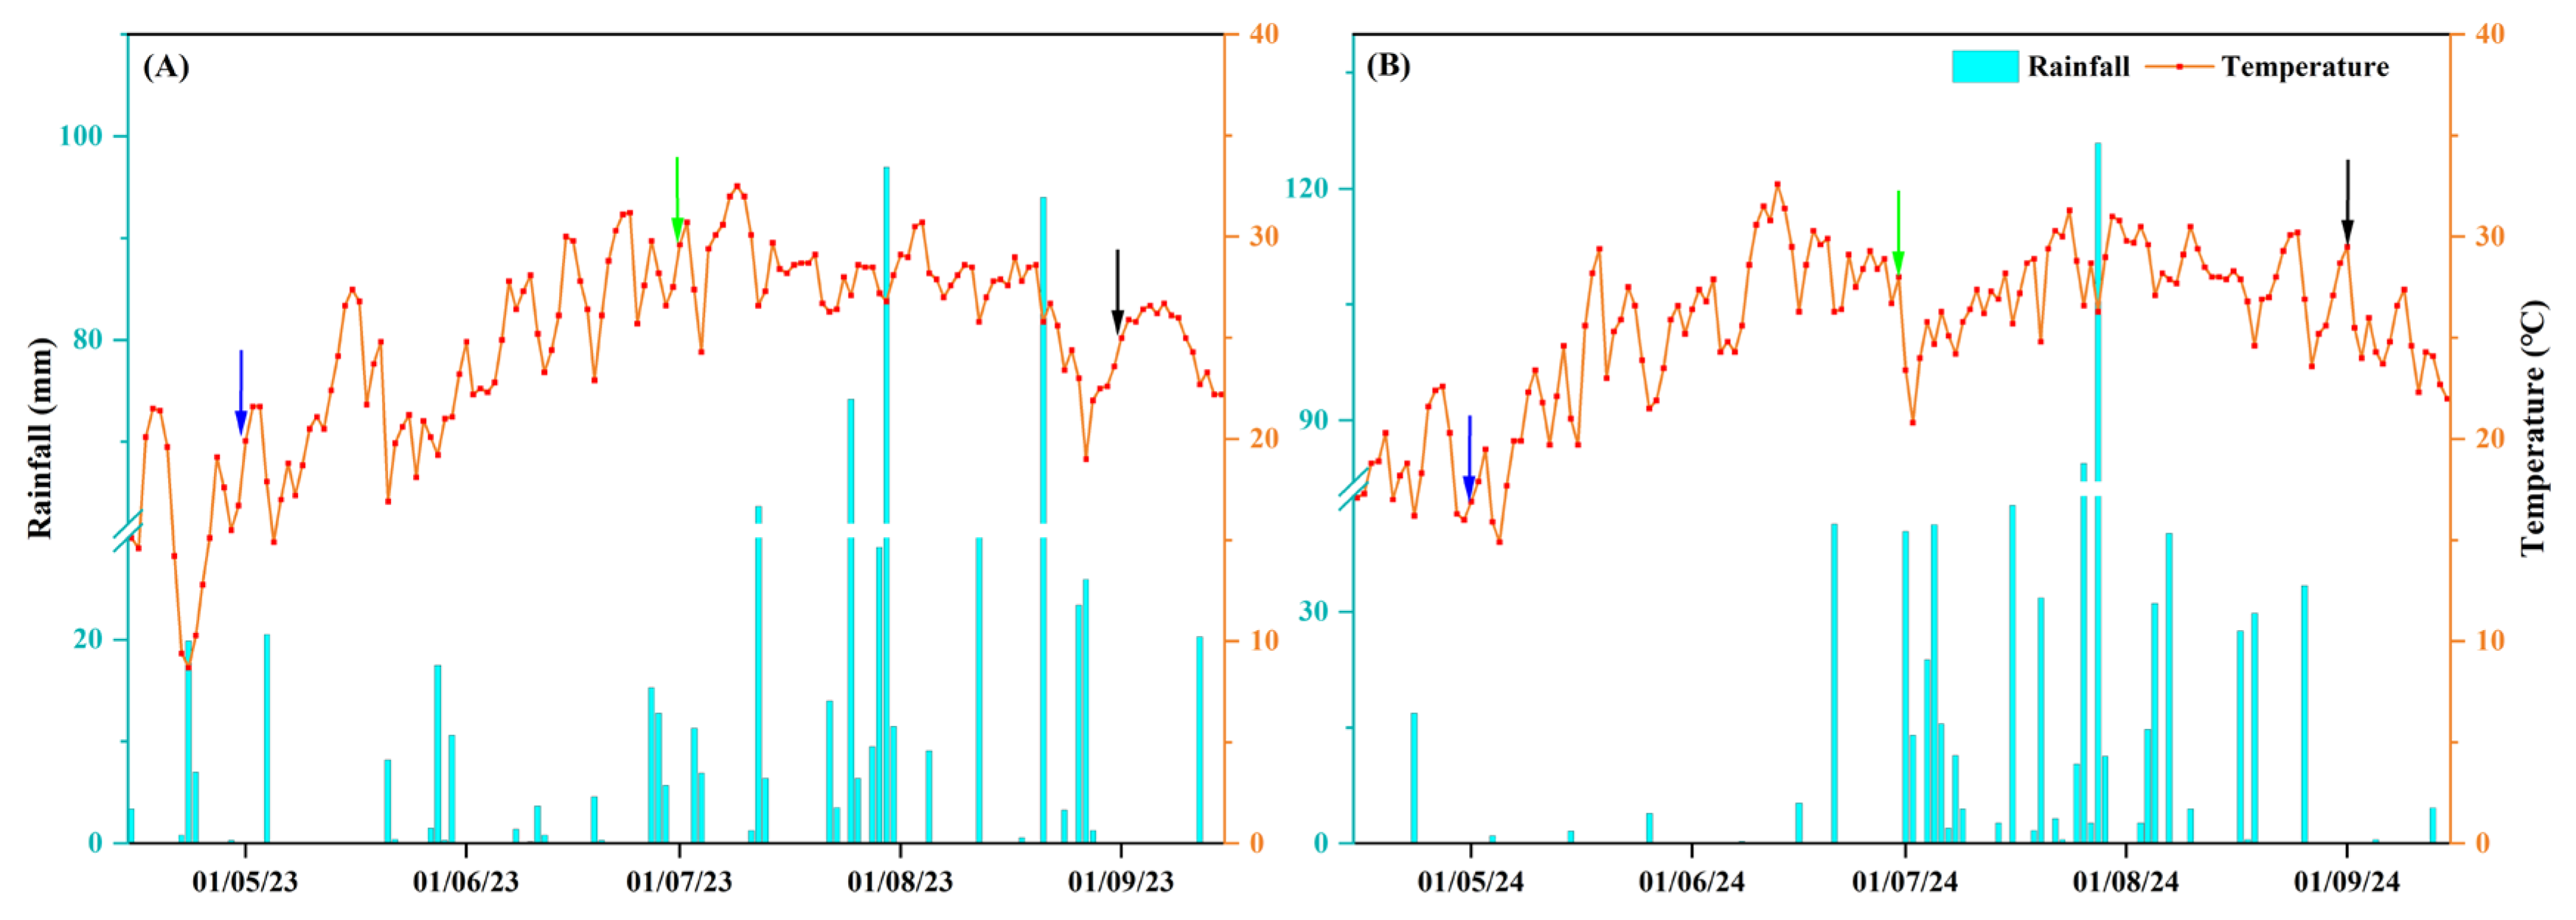
Figure 1. Daily total rainfall and variation of temperature during the peanut growing season in 2023 (A) and 2024 (B). The dates indicated by the blue, green, and black arrows are the sowing, pod-setting, and harvesting stages, respectively.
Agriculture 15 01923 g001
Figure 2. Effects of different blending ratios of CRU and U on the alkaline hydrolyzed nitrogen content in the 0–20 cm soil layer at various peanut growth stages in 2023 (A) and 2024 (B). Data were analyzed using two-way ANOVA. Different lowercase letters within a column indicate significant differences according to Duncan’s multiple range test at p < 0.05.
Agriculture 15 01923 g002
Figure 3. Effects of different blending ratios of CRU and U on the main stem height (A,B) and lateral branch length (C,D) of peanut at various growth stages in 2023 and 2024. Data were analyzed using two-way ANOVA. Different lowercase letters within a column indicate significant differences according to Duncan’s multiple range test at p < 0.05.
Agriculture 15 01923 g003
Figure 4. Effects of combined applications of CRU and U on the SOD activity (A,B), POD activity (C,D), CAT activity (E,F), and MDA content (G,H) in peanut at different growth stages during 2023 and 2024. Data were analyzed using two-way ANOVA. Different lowercase letters within a column indicate significant differences according to Duncan’s multiple range test at p < 0.05.
Agriculture 15 01923 g004
Figure 5. Effects of combined applications of CRU and U on the NR activity (A,B), GS activity (C,D), GOGAT activity (E,F), and GDH content (G,H) in peanut at different growth stages during 2023 and 2024. Data were analyzed using two-way ANOVA. Different lowercase letters within a column indicate significant differences according to Duncan’s multiple range test at p < 0.05.
Agriculture 15 01923 g005
Figure 6. The effects of different CRU combined with U on the LAI (A), SPAD (B), and Pn (C) in peanut at different growth stages during 2023 and 2024. Data were analyzed using two-way ANOVA. Different lowercase letters within a column indicate significant differences according to Duncan’s multiple range test at p < 0.05.
Agriculture 15 01923 g006
Figure 7. Effects of combined applications of CRU and U on dry matter accumulation in different organs (AD), post-podding accumulation (E), and accumulation rate (F) at various growth stages of peanut during 2023 and 2024. Data were analyzed using two-way ANOVA. Different lowercase letters within a column indicate significant differences according to Duncan’s multiple range test at p < 0.05.
Agriculture 15 01923 g007
Figure 8. Effects of combined applications of CRU and U on nitrogen accumulation in different organs (AD), post-podding nitrogen accumulation (E), and accumulation rate (F) at various growth stages of peanut during 2023 and 2024. Data were analyzed using two-way ANOVA. Different lowercase letters within a column indicate significant differences according to Duncan’s multiple range test at p < 0.05.
Agriculture 15 01923 g008
Figure 9. Correlation analysis of peanut yield, NUE, biomass with agronomic physiological indices, soil available nitrogen content, and photosynthetic performance at different growth stages. Note: * indicates significance at the 0.05 probability level, ** indicates significance at the 0.01 probability level; PPDMA: post-podding dry matter accumulation; PPNA: post-podding nitrogen accumulation.
Agriculture 15 01923 g009
Table 1. Soil nutrient content in the 0–20 cm soil layer before sowing in the experimental field.
YearOrganic Matter
(g·kg−1)
Available N
(mg·kg−1)
Available P
(mg·kg−1)
Available K
(mg·kg−1)
202312.1471.7314.3690.20
202413.4670.7713.9280.88
Table 2. The effects of CRU combined with U on yield and its constituent factors of peanut.
YearsTreatmentsYield
(kg·ha−1)
Pods Number per PlantPods Number
per kg
100-Pods
Weight (g)
100-Kernel
Weight (g)
Kernel Percent (%)
2023CK3666.99 d13.44 c689 a221.40 b87.45 c59.02 b
T14013.09 c14.50 bc601 c230.87 a87.59 bc60.46 ab
T24154.58 bc15.53 ab621 bc227.67 ab91.86 a61.94 a
T34397.84 a16.45 a643 b227.47 ab89.90 abc61.03 ab
T44514.42 a16.80 a621 bc225.33 ab90.45 ab61.28 ab
T54227.62 b15.96 ab614 c230.40 a92.50 a61.56 ab
2024CK3723.88 e14.08 d664 a215.40 b88.44 b63.28 c
T14063.61 d15.40 c622 ab229.40 a90.93 ab65.35 b
T24218.68 c16.04 bc621 ab228.37 a91.39 ab66.69 a
T34349.51 ab16.58 ab630 ab225.60 a91.15 ab65.25 b
T44440.63 a17.20 a626 ab225.27 a91.26 ab65.34 b
T54262.14 bc16.44 abc614 b230.53 a92.73 a65.70 b
Note: data were analyzed using two-way ANOVA. Different lowercase letters within a column indicate significant differences according to Duncan’s multiple range test at p < 0.05.
Table 3. The effects of CRU combined with U on the quality of peanut.
YearsTreatmentsCrude Protein
(%)
Oil Content
(%)
Oleic Acid
(%)
Linoleic Acid
(%)
O/LTotal Amino Acid (%)
2023CK20.22 b55.25 a34.59 b39.58 a0.87 a22.04 b
T121.49 a53.92 b34.84 ab39.36 a0.89 a22.86 ab
T221.81 a53.94 b34.98 ab38.39 a0.91 a23.05 ab
T321.85 a53.64 b35.08 ab38.33 a0.92 a23.37 a
T422.3 a53.49 b36.06 a38.10 a0.95 a23.40 a
T521.56 a53.79 b35.24 ab37.60 a0.94 a22.94 ab
2024CK18.16 b55.60 a36.95 c38.52 a0.96 c21.68 b
T119.17 ab54.10 a37.08 bc37.97 ab0.98 bc22.35 ab
T219.41 ab54.48 a37.05 bc37.07 b1.00 abc23.31 ab
T319.45 ab54.99 a37.94 ab37.84 ab1.01 ab23.35 ab
T420.14 a54.79 a38.30 a37.69 ab1.02 a23.51 a
T519.28 ab54.41 a37.61 abc36.98 b1.02 a23.27 ab
Note: data were analyzed using two-way ANOVA. Different lowercase letters within a column indicate significant differences according to Duncan’s multiple range test at p < 0.05.
Table 4. The effects of CRU combined with U on the NUE, PFPN, and AEN of peanut.
TreatmentsNUE (%)PFPN (kg·kg−1)AEN (kg·kg−1)
202320242023202420232024
T131.39 c30.03 c32.61 c33.86 d2.05 c2.00 d
T239.43 b42.50 b33.79 bc35.16 c3.23 bc3.29 c
T348.26 a49.14 a35.82 a36.25 ab5.26 a4.38 ab
T450.20 a50.75 a36.79 a37.01 a6.23 a5.14 a
T541.84 b41.63 b34.40 b35.52 bc3.84 b3.65 bc
Note: data were analyzed using two-way ANOVA. Different lowercase letters within a column indicate significant differences according to Duncan’s multiple range test at p < 0.05.
Disclaimer/Publisher’s Note: The statements, opinions and data contained in all publications are solely those of the individual author(s) and contributor(s) and not of MDPI and/or the editor(s). MDPI and/or the editor(s) disclaim responsibility for any injury to people or property resulting from any ideas, methods, instructions or products referred to in the content.