1. Introduction
The genus
Aspergillus P. Micheli ex Haller, 1768, includes more than 185 species [
1], presenting unique taxonomic complexity due to genetic, phenotypic, and biochemical divergences that modulate its metabolic activity, toxicity, and environmental adaptability [
2]. These challenges are compounded by the presence of cryptic variants (genetically distinct but morphologically indistinguishable) [
3,
4] and the scarcity of reference genome sequences for type strains, which limits the accuracy of species identification within the genus
Aspergillus [
4].
As a priority species in public health and food safety,
Aspergillus flavus Link, 1809, is notable for its ability to synthesize carcinogenic aflatoxins [
5] and its morphological plasticity, influenced by environmental conditions and culture media [
6]. Macroscopic identification methods, based on qualitative patterns such as powdery textures and colony color changes [
7,
8,
9,
10,
11], face critical limitations, including the following: a. analytical subjectivity: the interpretation of traits such as colony diameter, reversible pigmentation, conidial structures (vesicles, phialides), and surface textures requires expert knowledge [
12,
13,
14]; b. phenotypic variability: abiotic factors (temperature and humidity) affect secondary metabolite production and morphological traits, potentially inducing diagnostic errors [
15,
16]; and c. time investment: observations often require extended periods (days or weeks) and specific culture media [
13,
14].
Modern molecular methods for fungal identification include the following: ITS region sequencing, the standard marker for fungal identification due to its high interspecific variability [
16]; D2 LSU subunit analysis, effective in yeasts and molds but dependent on specialized equipment and validated databases; and whole-genome sequencing (WGS), which enables the discrimination of cryptic species through bioinformatic analysis, but with an application limited by the availability of reference genomes [
16].
Ultraviolet (UV) radiation emerges as a relevant tool for the preliminary detection of mycotoxin-producing fungi. Its use is based on the characteristic fluorescence of fungal metabolites under specific wavelengths, allowing for non-destructive, real-time identification. Under UV radiation at 365 nm (UV-A range), aflatoxins exhibit differential fluorescence: aflatoxins B1 and B2 emit bright blue, while G1 and G2 fluoresce green-yellow [
17,
18]. Although this technique has mainly been used for mycotoxin quantification [
3,
14,
18,
19], its potential for the direct identification of
A. flavus remains underexplored.
The taxonomy of
Aspergillus has evolved from classical morphotyping toward integrative approaches that combine multi-omics (chemotyping—the analysis of secondary metabolites such as aflatoxins [
14], and mitogenotyping [
3]). In this context, this article proposes an innovative computational approach to the morphological characterization of
Aspergillus flavus colonies grown in different media through a radiomic analysis of images acquired under UV radiation. This methodology enables the automatic quantification of macroscopic morphological traits, reducing subjective bias [
19].
The hypothesis posits that controlled exposure to UV radiation (365 nm) induces differentiable patterns in the macroscopic phenotype of
Aspergillus flavus, manifested as morphological and fluorescent variations modulated by the culture medium. These patterns can be quantified through radiomic analysis and detected via computerized image processing, enabling the amplification of subtle phenotypic differences and their use as discriminative markers against phylogenetically related species such as
Aspergillus parasiticus Speare, 1912 [
20,
21,
22,
23].
This non-destructive and low-cost approach complements conventional species discrimination methods, reduces diagnostic time, and can be implemented in resource-limited settings using accessible equipment and open-source software [
23,
24,
25].
2. Materials and Methods
2.1. Culture Media and Strain
Four culture media were used: Malt Extract Agar (MEA, Oxoid Ltd., Basingstoke, UK), Oxytetracycline Glucose Yeast Extract Agar (OGY, Condalab, Madrid, Spain), Coconut Milk Agar (CMA, GIMBIO, Pamplona, Colombia), and Yeast Extract Agar (YEA, Oxoid Ltd., Basingstoke, UK). These media were selected based on their ability to induce distinguishable morphological traits in filamentous fungi, especially under UV radiation conditions [
6,
26]. Unlike commonly used media such as Potato Dextrose Agar (PDA), Czapek Dox Agar (CZA), or
Aspergillus flavus-parasiticus Agar (AFPA), the selected media demonstrated higher sensitivity in revealing key fungal structures such as conidiophores, vesicles, and conidia, which are essential for the proposed radiomic analysis. AFPA was excluded due to its selective focus on the differential identification of aflatoxin-producing species, which limits its usefulness for comprehensive morphological characterization under photoluminescent conditions.
All media were prepared following the manufacturer’s instructions, using sterile distilled water, produced in the laboratory with a Schott-Geräte Typ 82000 distiller (Schott-Geräte GmbH, Hofheim am Taunus, Germany). Subsequently, they were sterilized in an autoclave at 121 °C for 15 min, using an All American UL 6p38, model 75X (All American, Manitowoc, WI, USA). The molten medium was poured into 60 mm diameter and 15 mm height glass Petri dishes (Brixco, Bogotá, Colombia), under aseptic conditions, ensuring a depth of approximately 20 mL per plate.
A certified strain of
A. flavus (ATCC 9643), non-aflatoxigenic [
27,
28,
29], was used in this study, and therefore the characteristic blue-green fluorescence of aflatoxins was not expected. Likewise,
A. parasiticus was included as a second species, due to its close phylogenetic relationship with
A. flavus and the morphological changes exhibited by its colonies under UV light [
30,
31,
32]. This decision was based on the study’s objective: to explore the usefulness of a radiomic approach to characterize and differentiate their fungal morphology, each represented by a strain used as an experimental model. It should be noted that the main differences between both species encompass not only their toxigenic profile and ecology but also distinctive morphological characteristics [
33]. Nevertheless, it is recognized that species such as
A. oryzae (Ahlburg) Cohn, 1884, frequently confused with
A. flavus due to their morphological and genetic similarities [
34], are systematically regarded as separate species. The inclusion of
A. oryzae could provide additional value in future comparative analyses. Although the limited number of strains restricts the possibility of generalizing the statistical models at the species level, experimental standardization ensures reproducibility, and the inclusion of multiple strains per species is projected in order to improve the generalization of statistical evaluation.
Both strains were inoculated onto the four media and cultured under standardized conditions: incubation in the dark at 25 ± 2 °C for seven days [
13].
A total of N = 8 samples were used, corresponding to the combination of two species and four culture media (2 species × 4 media). The same strains and cultivation conditions were uniformly applied throughout the experiment, ensuring the reproducibility of results and comparability across treatments.
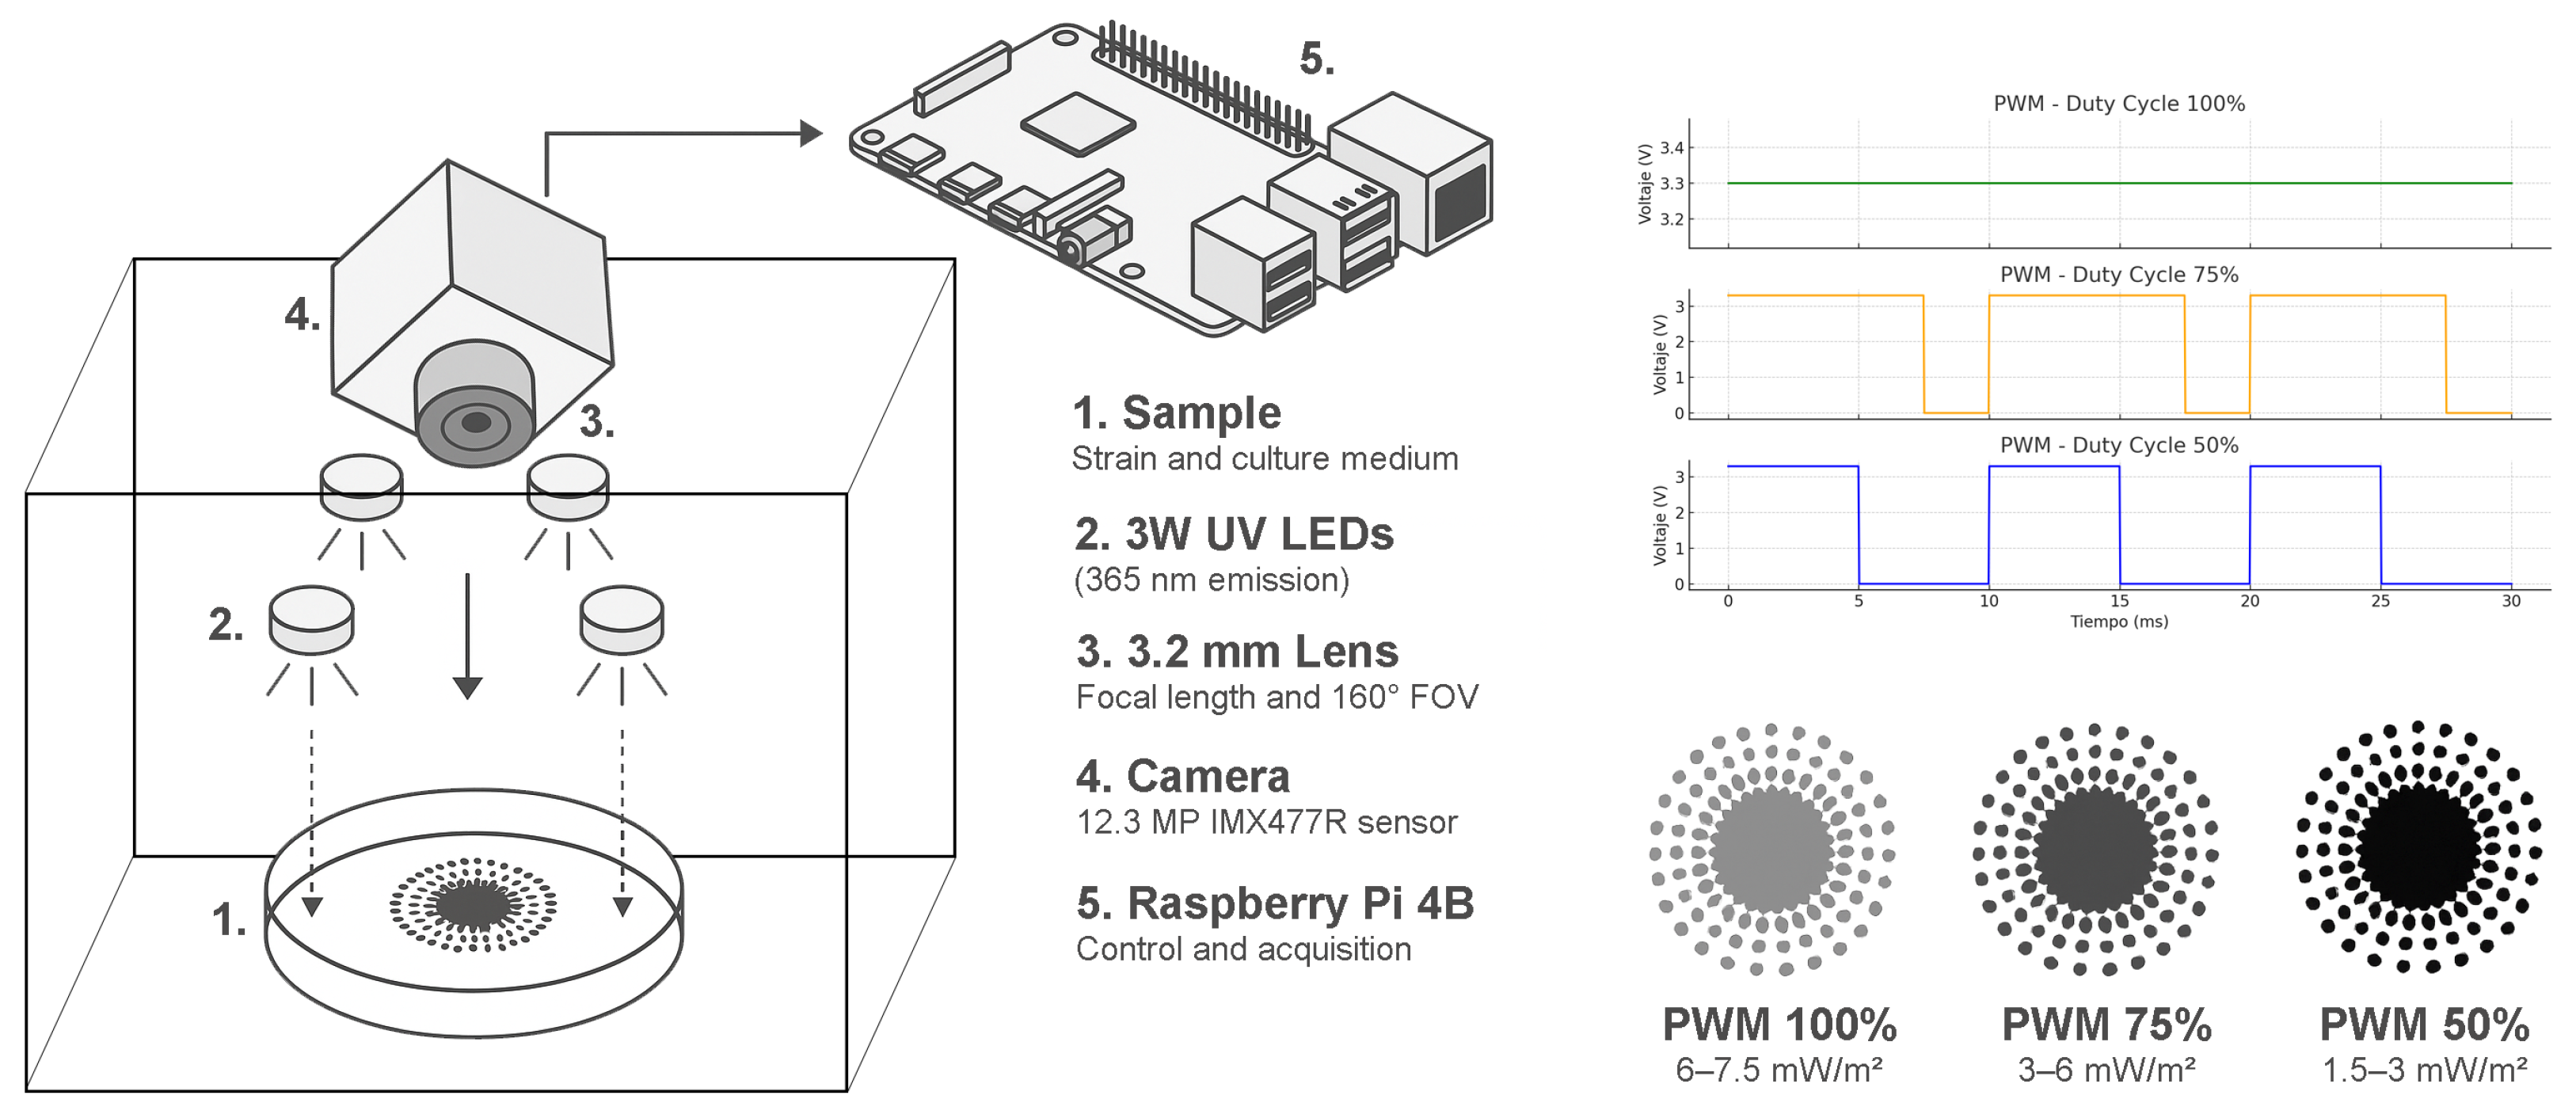
Starting from the eighth day of incubation, each sample was photographed over five consecutive days under UV radiation (365 nm), applied at 24 h intervals and three intensity levels, with approximate irradiance values of 6–7.5 mW/m2 for 100% duty cycle, 3–6 mW/m2 for 75%, and 1.5–3 mW/m2 for 50%. This resulted in a total of 120 images, distributed as 60 images per species and 15 per medium, intended for subsequent analysis through digital image processing and radiomic evaluation.
2.2. Image Acquisition System
This consists of a set of four 3W UV LEDs with an emission wavelength of 365 nm (Ref: LED-365NM-3W, Didácticas Electrónicas I+D, Bogotá, Colombia), a Raspberry Pi 4B board (Raspberry Pi Foundation, Cambridge, UK) responsible for controlling the activation of the UV LEDs and managing image acquisition through a Raspberry Pi M12 camera (Ref: WS-23945, Waveshare Electronics, Shenzhen, China) with a 12.3 MP sensor (Sony Corporation, Tokyo, Japan), coupled with a 3.2 mm focal length lens and 160° FOV (Ref: WS-23967, Waveshare Electronics, Shenzhen, China), which captures images with dimensions of 4056 × 3040 pixels and a depth of 32 bits. All components are shown in
Figure 1.
2.3. Software and Libraries Used
The programming logic was developed using the Python 3.12.11 language, selected for its wide availability of open-source libraries and compatibility with the Raspberry Pi platform. For image acquisition, the picamera2 library was used. Data management and logging in Excel spreadsheets were carried out using openpyxl, and GPIO pin control, including pulse-width modulation (PWM), was implemented with RPI.GPIO. Digital image processing, which included segmentation, analysis, and visualization tasks, was performed using the OpenCV 4.12.0, NumPy 2.0.2, Pandas 2.2.2, and Matplotlib 3.10.0 libraries.
Radiomic feature extraction was conducted using the PyRadiomics library, which specializes in quantitative image analysis, together with SimpleITK for preprocessing and spatial standardization of the data [
35].
For statistical analysis and classification, the Scikit-learn 1.6.1 and SciPy 1.16.1 Python libraries were used, incorporating functions for applying the ANOVA technique [
36,
37,
38].
2.4. Digital Image Processing
Once the images were acquired, they were processed to extract the information. The region of interest was identified and isolated, starting with the detection of the Petri dish edge in each image. This process allowed the analysis to focus exclusively on the culture medium and its contents, eliminating background elements and reducing the image size to facilitate subsequent processing. Then, through the segmentation technique, a binary mask was obtained that delimited the pixels corresponding to the fungus.
2.4.1. Identification of Petri Dishes
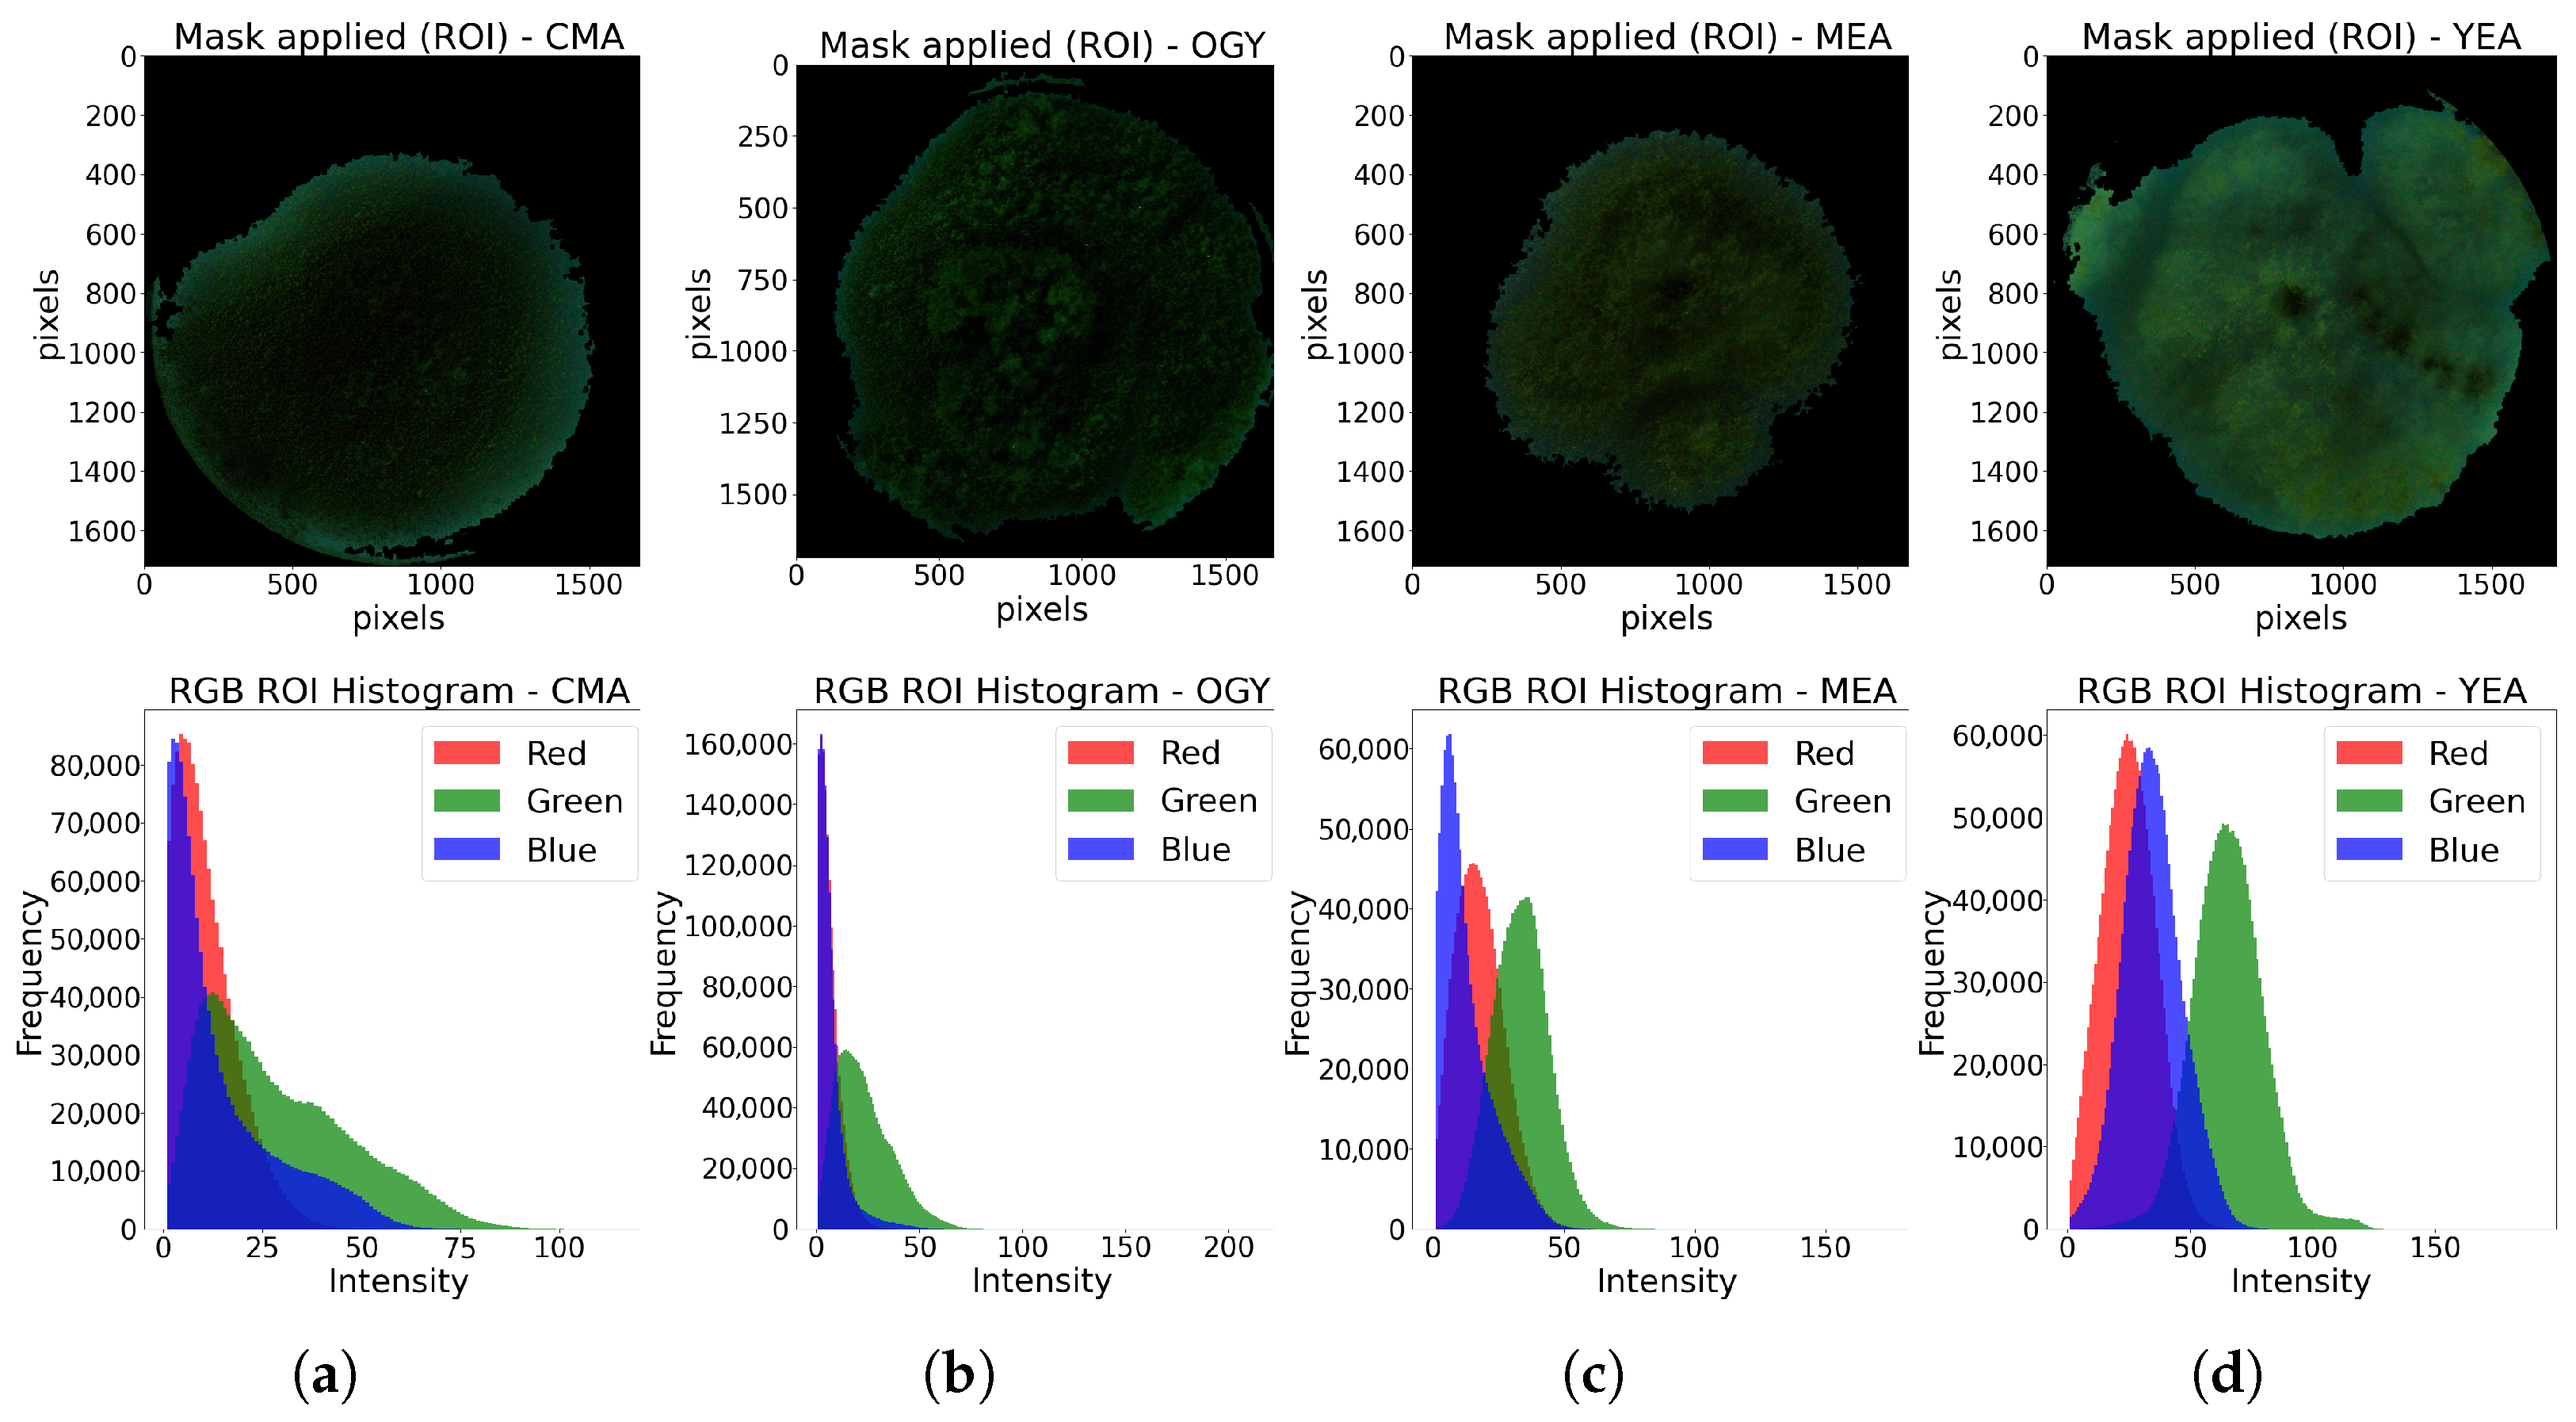
For the identification of the Petri dishes, the information of each sample in the RGB channels was independently analyzed. By observing the histograms of the image of each channel, presented in (
Figure 2), and analyzing their standard deviation (
Table 1), indicative of the dispersion of the intensity levels of each color around the mean, it was found that the blue channel showed the greatest separation between the pixels of the region of interest (RoI), corresponding to both the culture medium and the edge of the Petri dish, with respect to the background, thus facilitating the subsequent segmentation of the RoI. For this reason, the image from the blue channel was used as the starting point for cropping the region of interest.
Based on the information from
Table 1, the image from the blue channel was binarized using a fixed threshold of 20 intensity levels to segment the region of interest, resulting in the separation of most pixels belonging to the culture medium and the edge of the dish from the background, as shown in
Figure 3.
2.4.2. Contour Detection
Once the image was binarized, the method of Suzuki et al. [
39] was used to find all contours present in the binarized image. Then, the detected contours were iterated through to identify the one with the largest perimeter. Simultaneously, a black image with the same dimensions as the original was generated, on which a circle was drawn with a radius equal to that of the Petri dish, centered at the coordinates of the contour with the largest perimeter. This circle was used to mask the region of interest, as shown in
Figure 4.
A new image was then obtained by superimposing the detected mask onto the original image, where the value of each pixel in the resulting image takes the minimum value between the two input images. In this way, all pixels outside the Petri dish were removed. This allowed for the removal of unwanted background elements, leaving only the contents of the Petri dish. The processed image was cropped to retain only the region of interest within the Petri dish. This process generated a final file with reduced dimensions of 1720 × 1720 pixels and a color depth of 24 bits (
Figure 5), optimizing the size and format to facilitate processing.
2.4.3. Image Segmentation
Once the reduced image of the Petri dish was obtained, the blue channel image was segmented using Otsu’s method [
40]. This technique assumes that the histogram modes of the image follow a Gaussian probability distribution function, and it selects the optimal threshold that minimizes the within-class variance (background and object) while maximizing the difference between the two classes. Although the histogram modes are not perfectly Gaussian, as shown in
Figure 6, the selected threshold (red line in
Figure 6) allows for a good separation between the background and the region of interest in the image [
41,
42,
43,
44]. The resulting image was used as a mask to facilitate the segmentation of the fungus from the background.
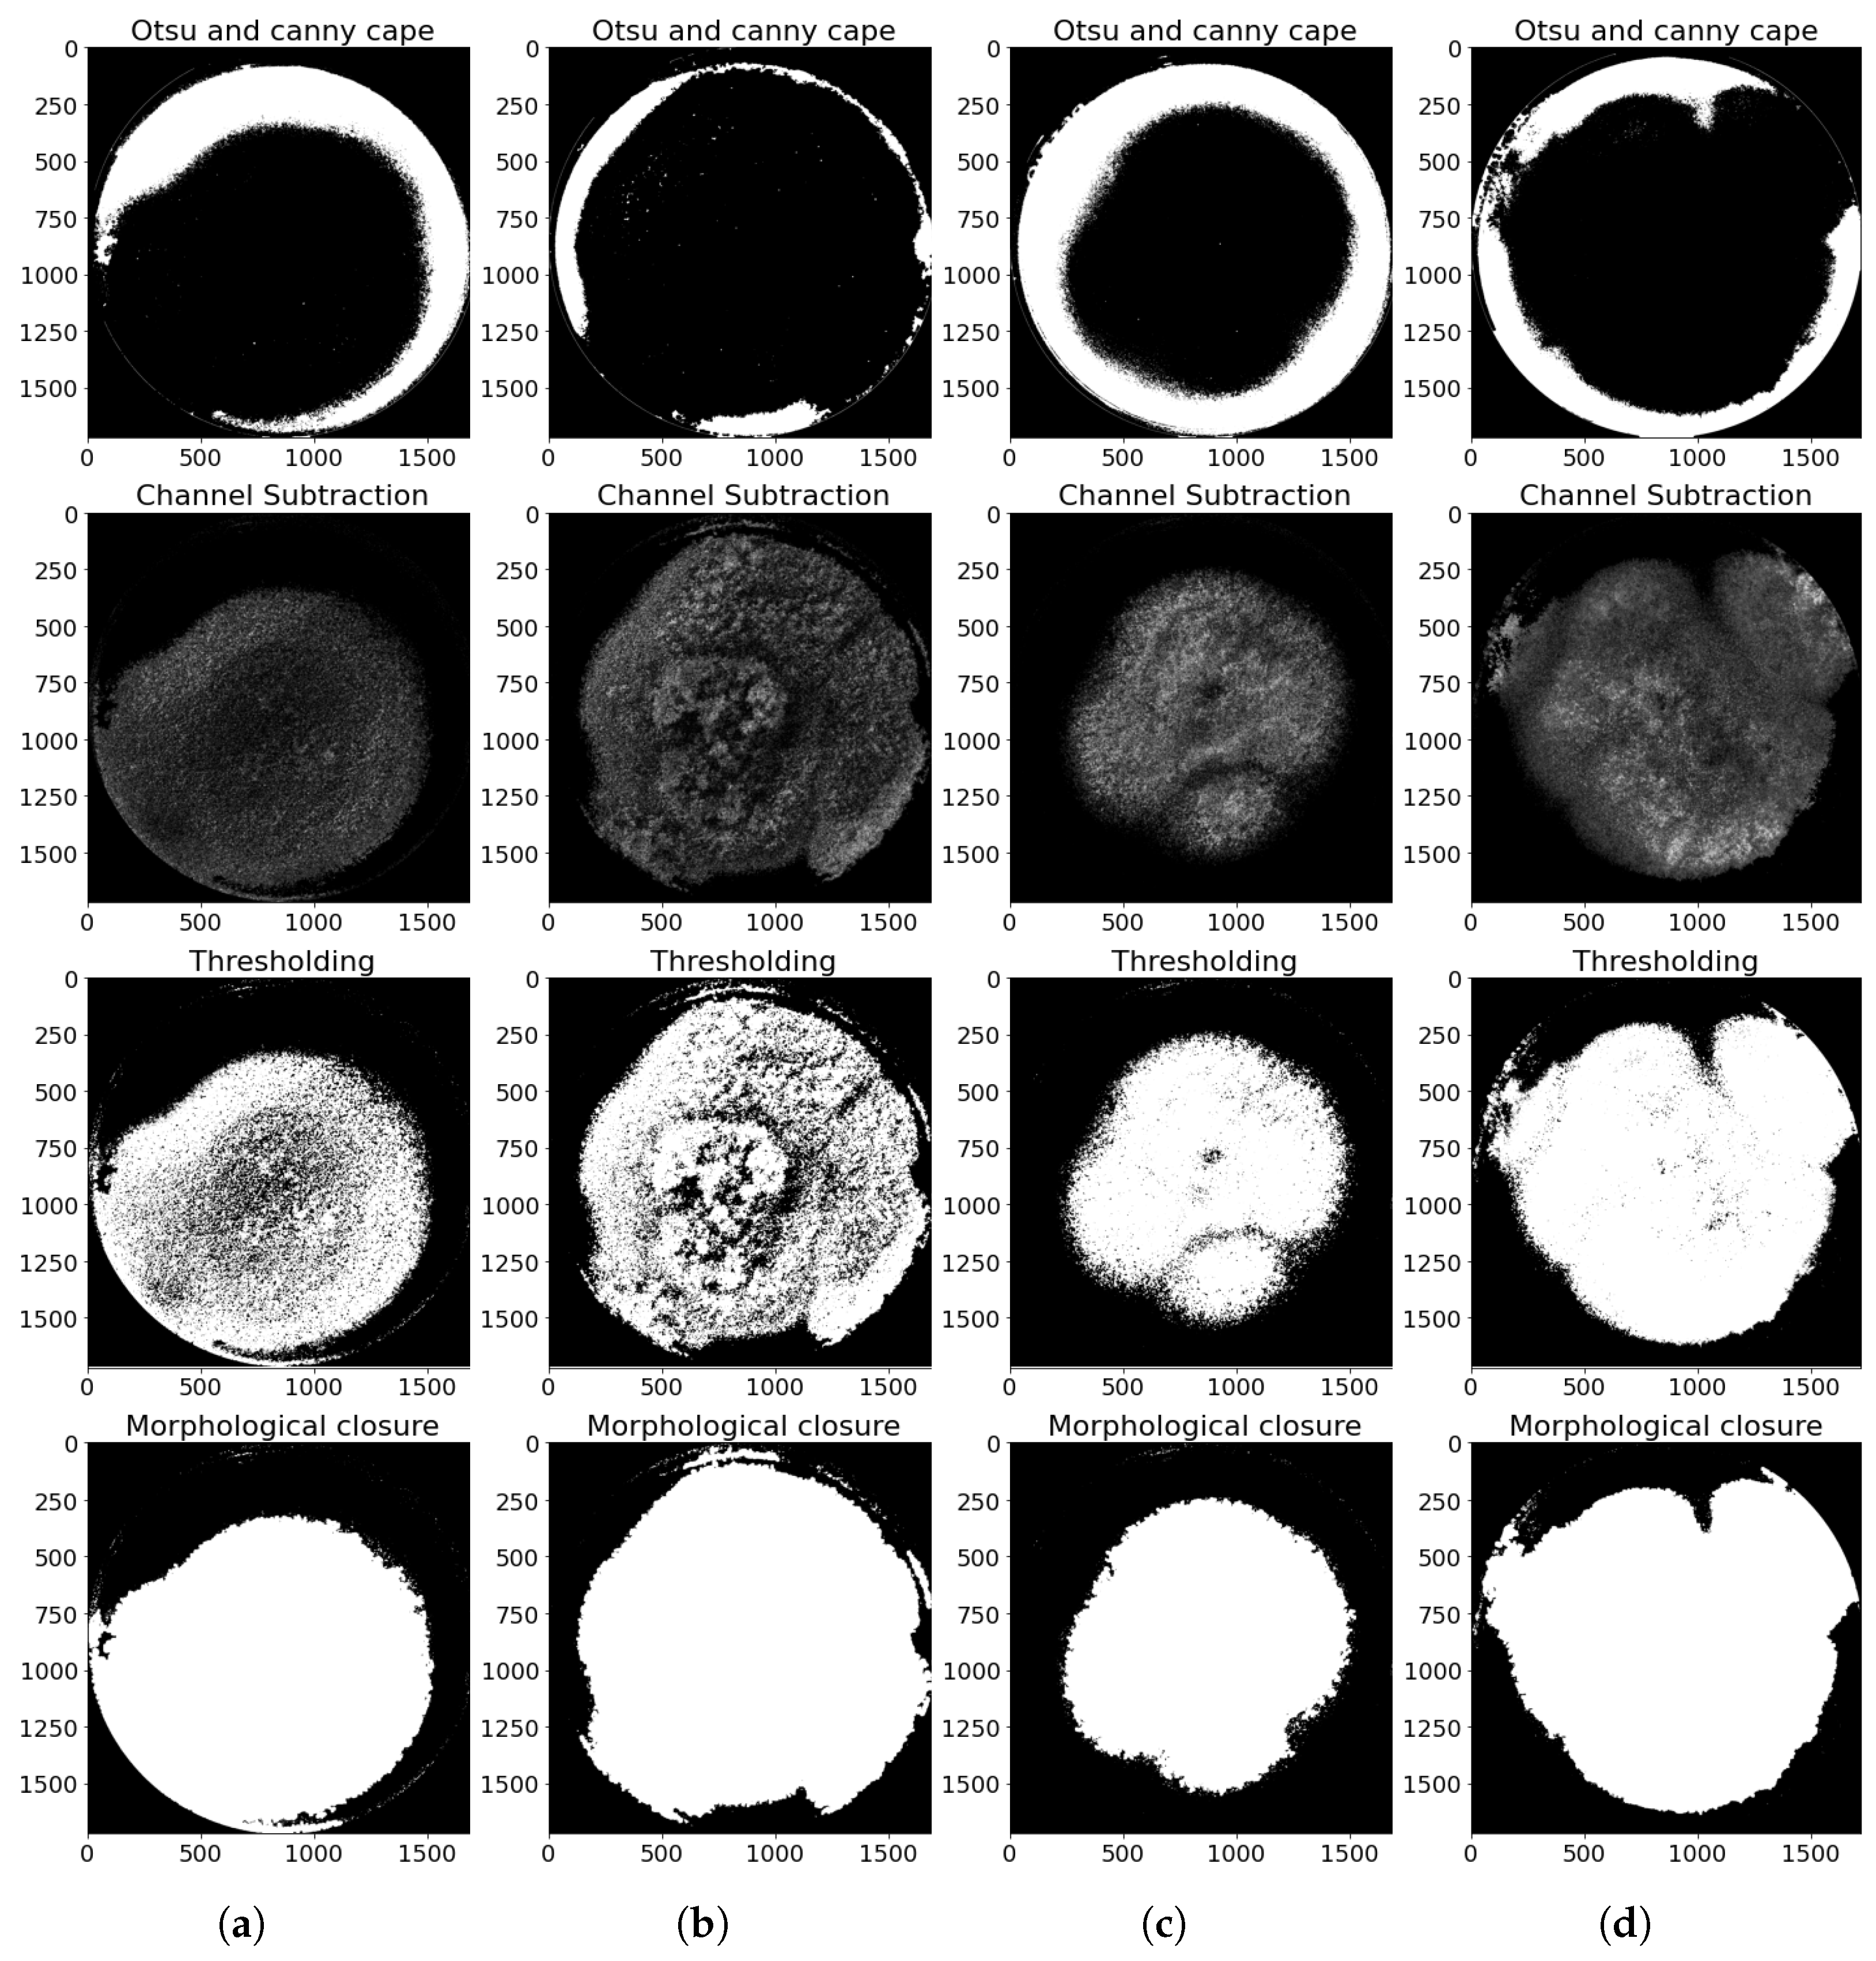
To improve the segmentation accuracy, a Gaussian filter was applied to smooth the image and reduce noise. However, due to the original low contrast of the images, this process also attenuated details in the regions of interest, predominantly preserving the pixels with higher intensity. This effect allowed the analysis to focus on the reflections produced by the UV illumination of the LEDs (365 nm), which were efficiently detected using the Canny edge detection algorithm, as their high light intensities remained unchanged after filtering.
Subsequently, morphological closing operations were performed on the detected edges. This process involved applying dilation, followed by erosion, which allowed for the merging of nearby edges and filling of small gaps present in the detected contours. The result of these operations was a binary mask representing the reflections, which was combined with the mask previously generated using Otsu’s method.
Additionally, following the background subtraction approach described by Sobral and Vacavant [
45], the green and blue channels were subtracted, as well as the red and blue channels, truncating negative values to zero. These operations helped reduce background interference and increased contrast in the relevant areas. The resulting image was thresholded to generate a new binary mask, for which both the mask generated by Otsu and the reflection mask were subtracted (
Figure 7).
This mask was consolidated by individually dilating each contour whose area exceeded a minimum pixel threshold, and then cumulatively combining them using a pixel-wise maximum operation. Subsequently, a morphological erosion was applied with a square kernel of size 11 × 11 pixels, which helped smooth the edges and remove small irregularities. The resulting mask allowed for the internal closing of the fungus shape and the recovery of regions lost during the channel subtraction operations. As shown in
Figure 8, its application on the original image facilitated the extraction of RGB values only within the region of interest, allowing for the generation of an intensity histogram for each color channel.
2.5. Radiomic Analysis
To extract the radiomic features, the PyRadiomics extractor was configured with specific parameters, such as bin width, pixel spacing, interpolator, and intensity value normalization. All available features were enabled for extraction; then, the textural features were extracted from both the color image and the mask. This process was repeated for each of the three color channels (RGB) and for the grayscale image, resulting in a total of 408 features: 102 features per channel (
Figure 9).
2.6. Statistical Evaluation and Computational Classification
2.6.1. Statistical Validation of Radiomic Features
The assumptions of the normality and homogeneity of variances were evaluated for each extracted radiomic feature. For this purpose, a linear model was fitted for each variable using ordinary least squares (OLS), considering the evaluated strain (A. flavus or A. parasiticus) and the culture medium as relevant factors. Subsequently, the Shapiro–Wilk test was applied to the model residuals to assess normality, and Levene’s test was performed on the combined groups (strain × culture medium) to verify the homogeneity of variances. Only the features that met both criteria (p > 0.05 in both tests) were considered valid for the ANOVA analysis.
2.6.2. Feature Selection with ANOVA
A two-way factorial ANOVA was applied, using a Type II model that robustly evaluates the main effects and their interaction. The model structure was formulated as shown in Equation (
1):
Each feature was evaluated individually, and the resulting
p-values determined the statistical significance of the factors. Features with
p-values < 0.05 for any factor were considered sensitive to that effect, and thus relevant for differentiating between species, media, or their interaction [
46].
For the comparative analysis between the strains of
A. flavus and
A. parasiticus, the following hypotheses were formulated, as expressed in Equations (
2) and (
3):
Null hypothesis (
): there are no significant differences between the means of the extracted features for
A. flavus and
A. parasiticus.
Alternative hypothesis (
): there is at least one significant difference between the means of the extracted features for
A. flavus and
A. parasiticus
For the comparative analysis between culture media, the following hypotheses were formulated, as expressed in Equations (
4) and (
5):
Null hypothesis (
): There are no significant differences in the means of the extracted features among the four culture media (CMA, OGY, MEA, YEA):
Alternative hypothesis (
): There are significant differences in the means of at least one feature among the four culture media (CMA, OGY, MEA, YEA):
2.6.3. Supervised Classification Using Machine Learning Algorithms
To evaluate the discriminative capacity of the radiomic features selected through ANOVA, a classification pipeline based on machine learning was implemented. The dataset was divided into two subsets, with 70% of the data used for training and 30% for validation through stratified sampling.
The pipeline included data standardization, followed by feature selection using a univariate approach based on the F-ANOVA test, exploring different values of the parameter k (5, 8, and all variables). Subsequently, five supervised classifiers were trained and evaluated: Random Forest, Support Vector Machines (SVM), K-Nearest Neighbors (KNN), Logistic Regression, and Gradient Boosting.
For each model, an exhaustive hyperparameter search was carried out using five-fold stratified cross-validation, with accuracy as the main evaluation metric. Metrics such as accuracy, weighted F1-score, weighted precision, and weighted recall were calculated, allowing for validation of the usefulness of the selected variables for the automatic classification of A. flavus.
The best classifier was selected based on its average performance during cross-validation and was subsequently evaluated on the test set.
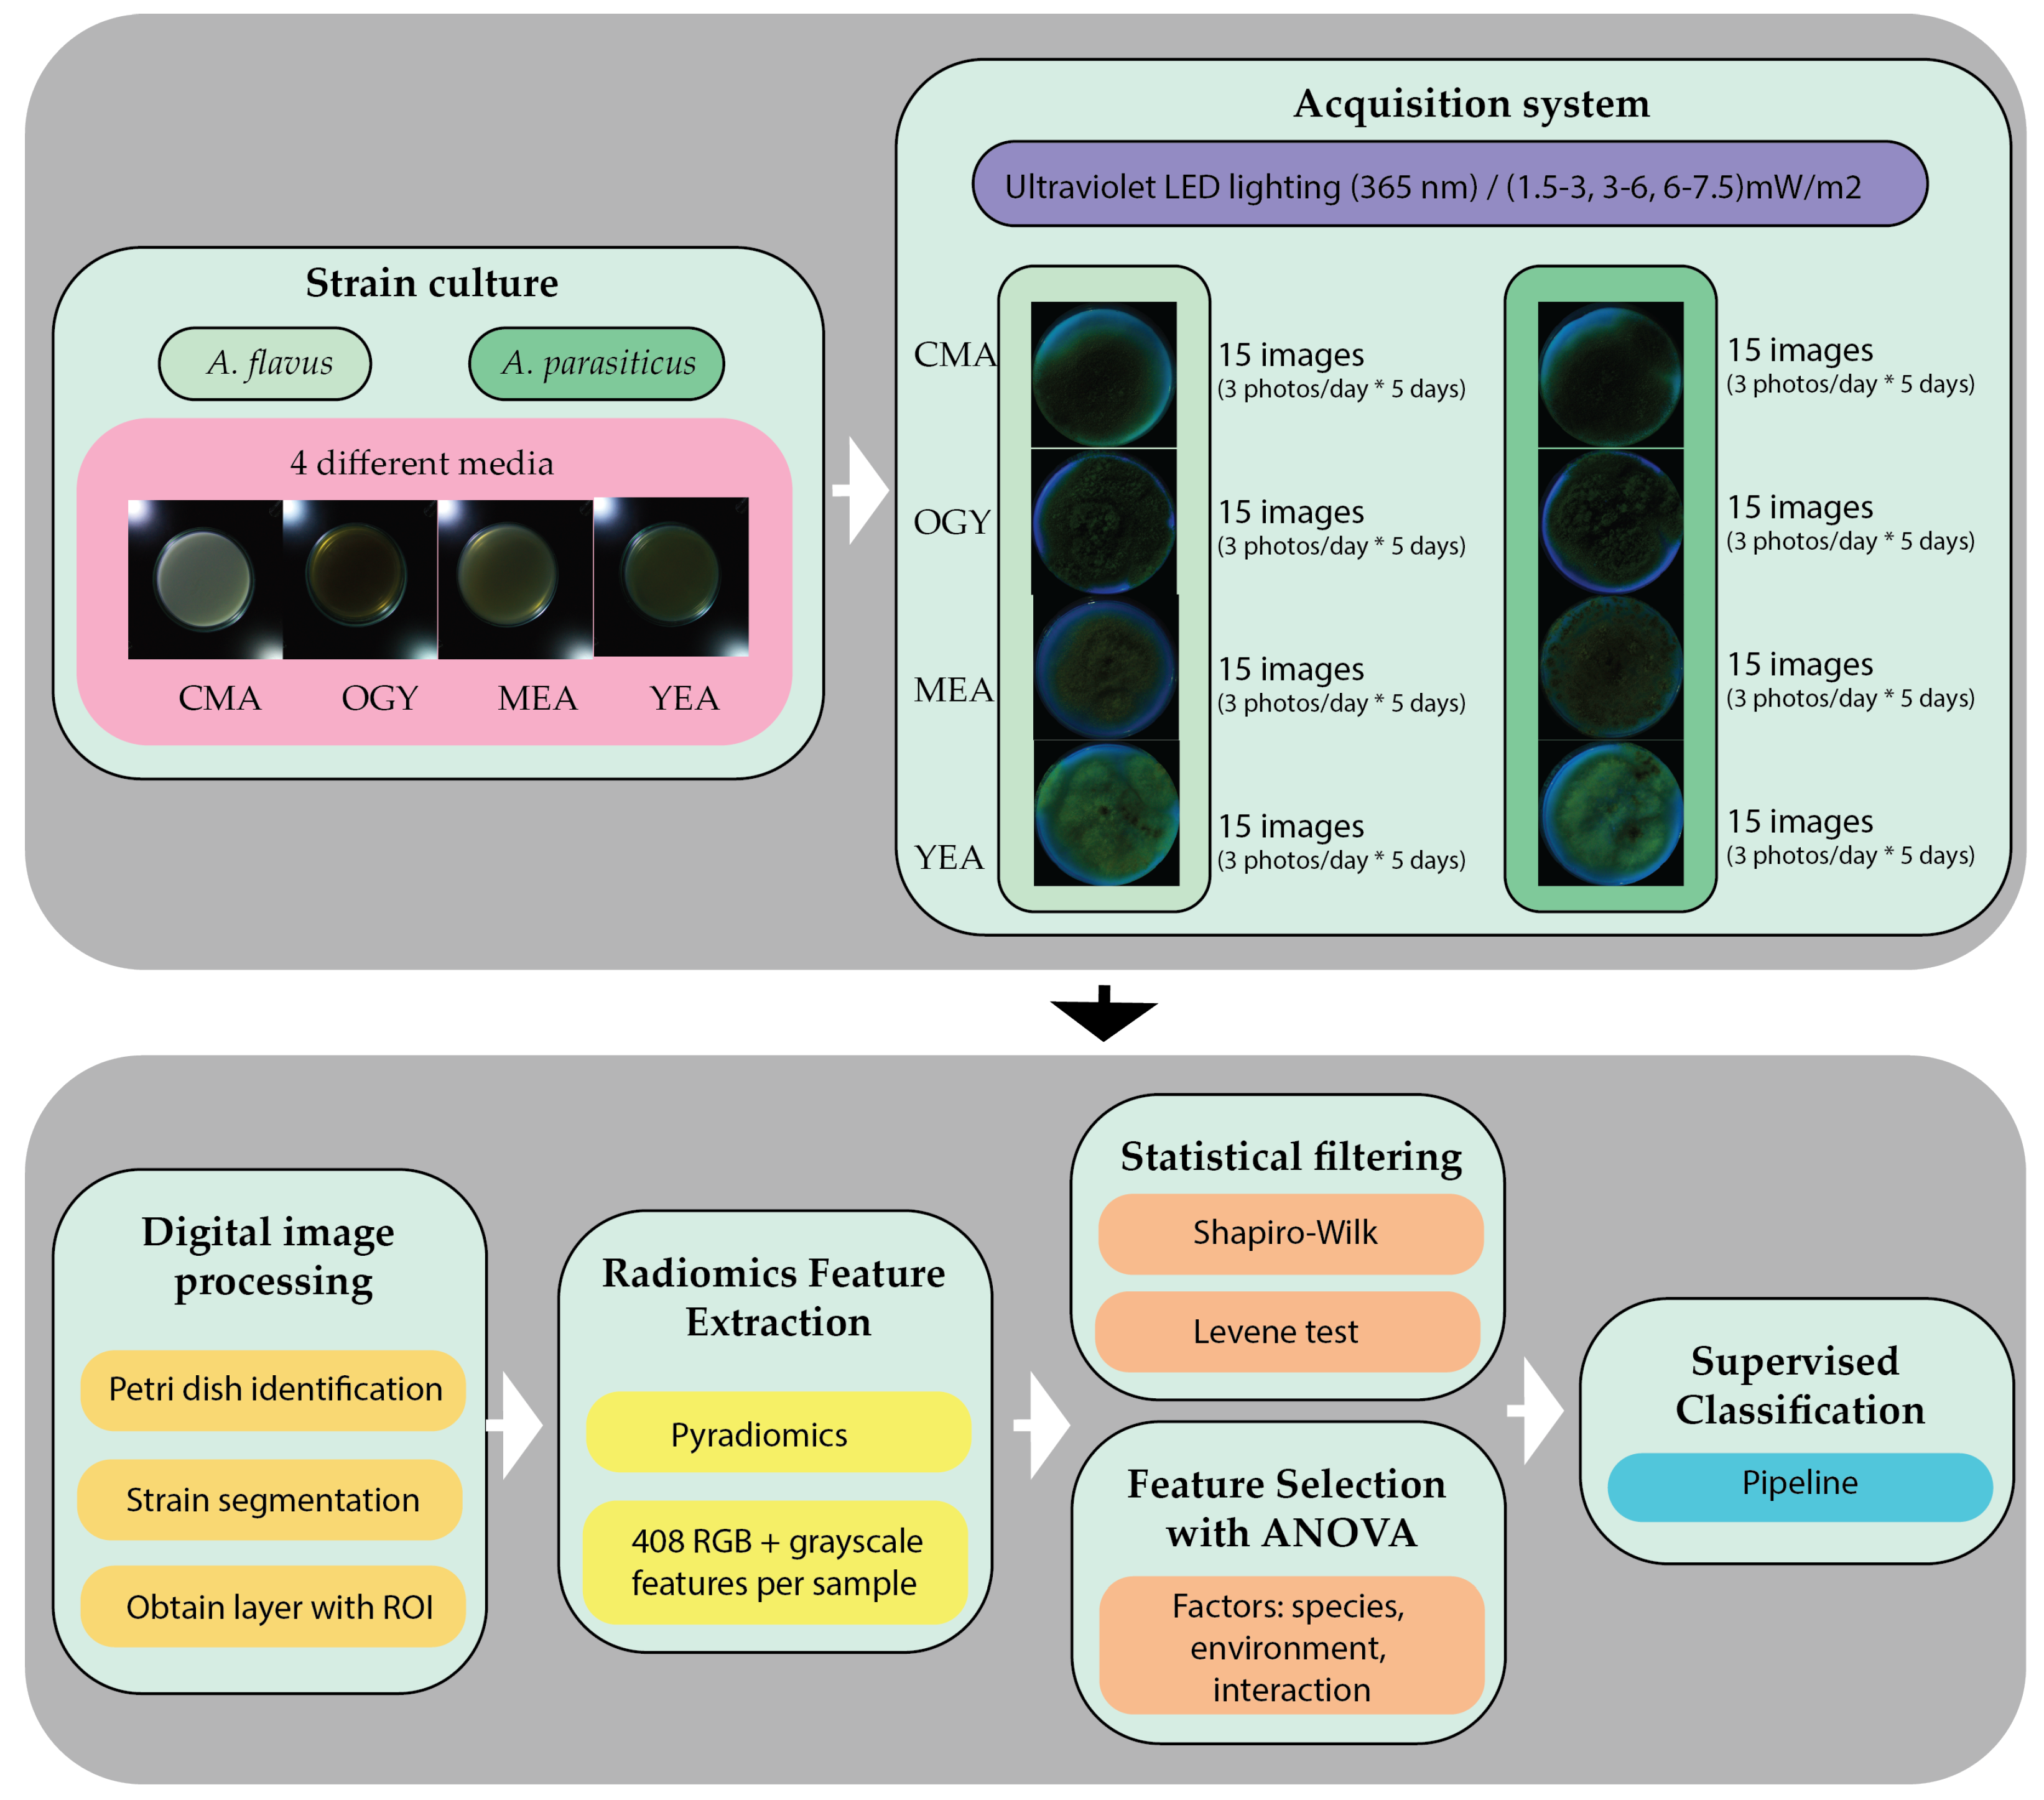
Figure 10 presents a flowchart summarizing the methodological procedure followed for the acquisition, processing, and analysis of radiomic images of
Aspergillus flavus.
3. Results
3.1. Radiomic Features with Validated Statistical Criteria
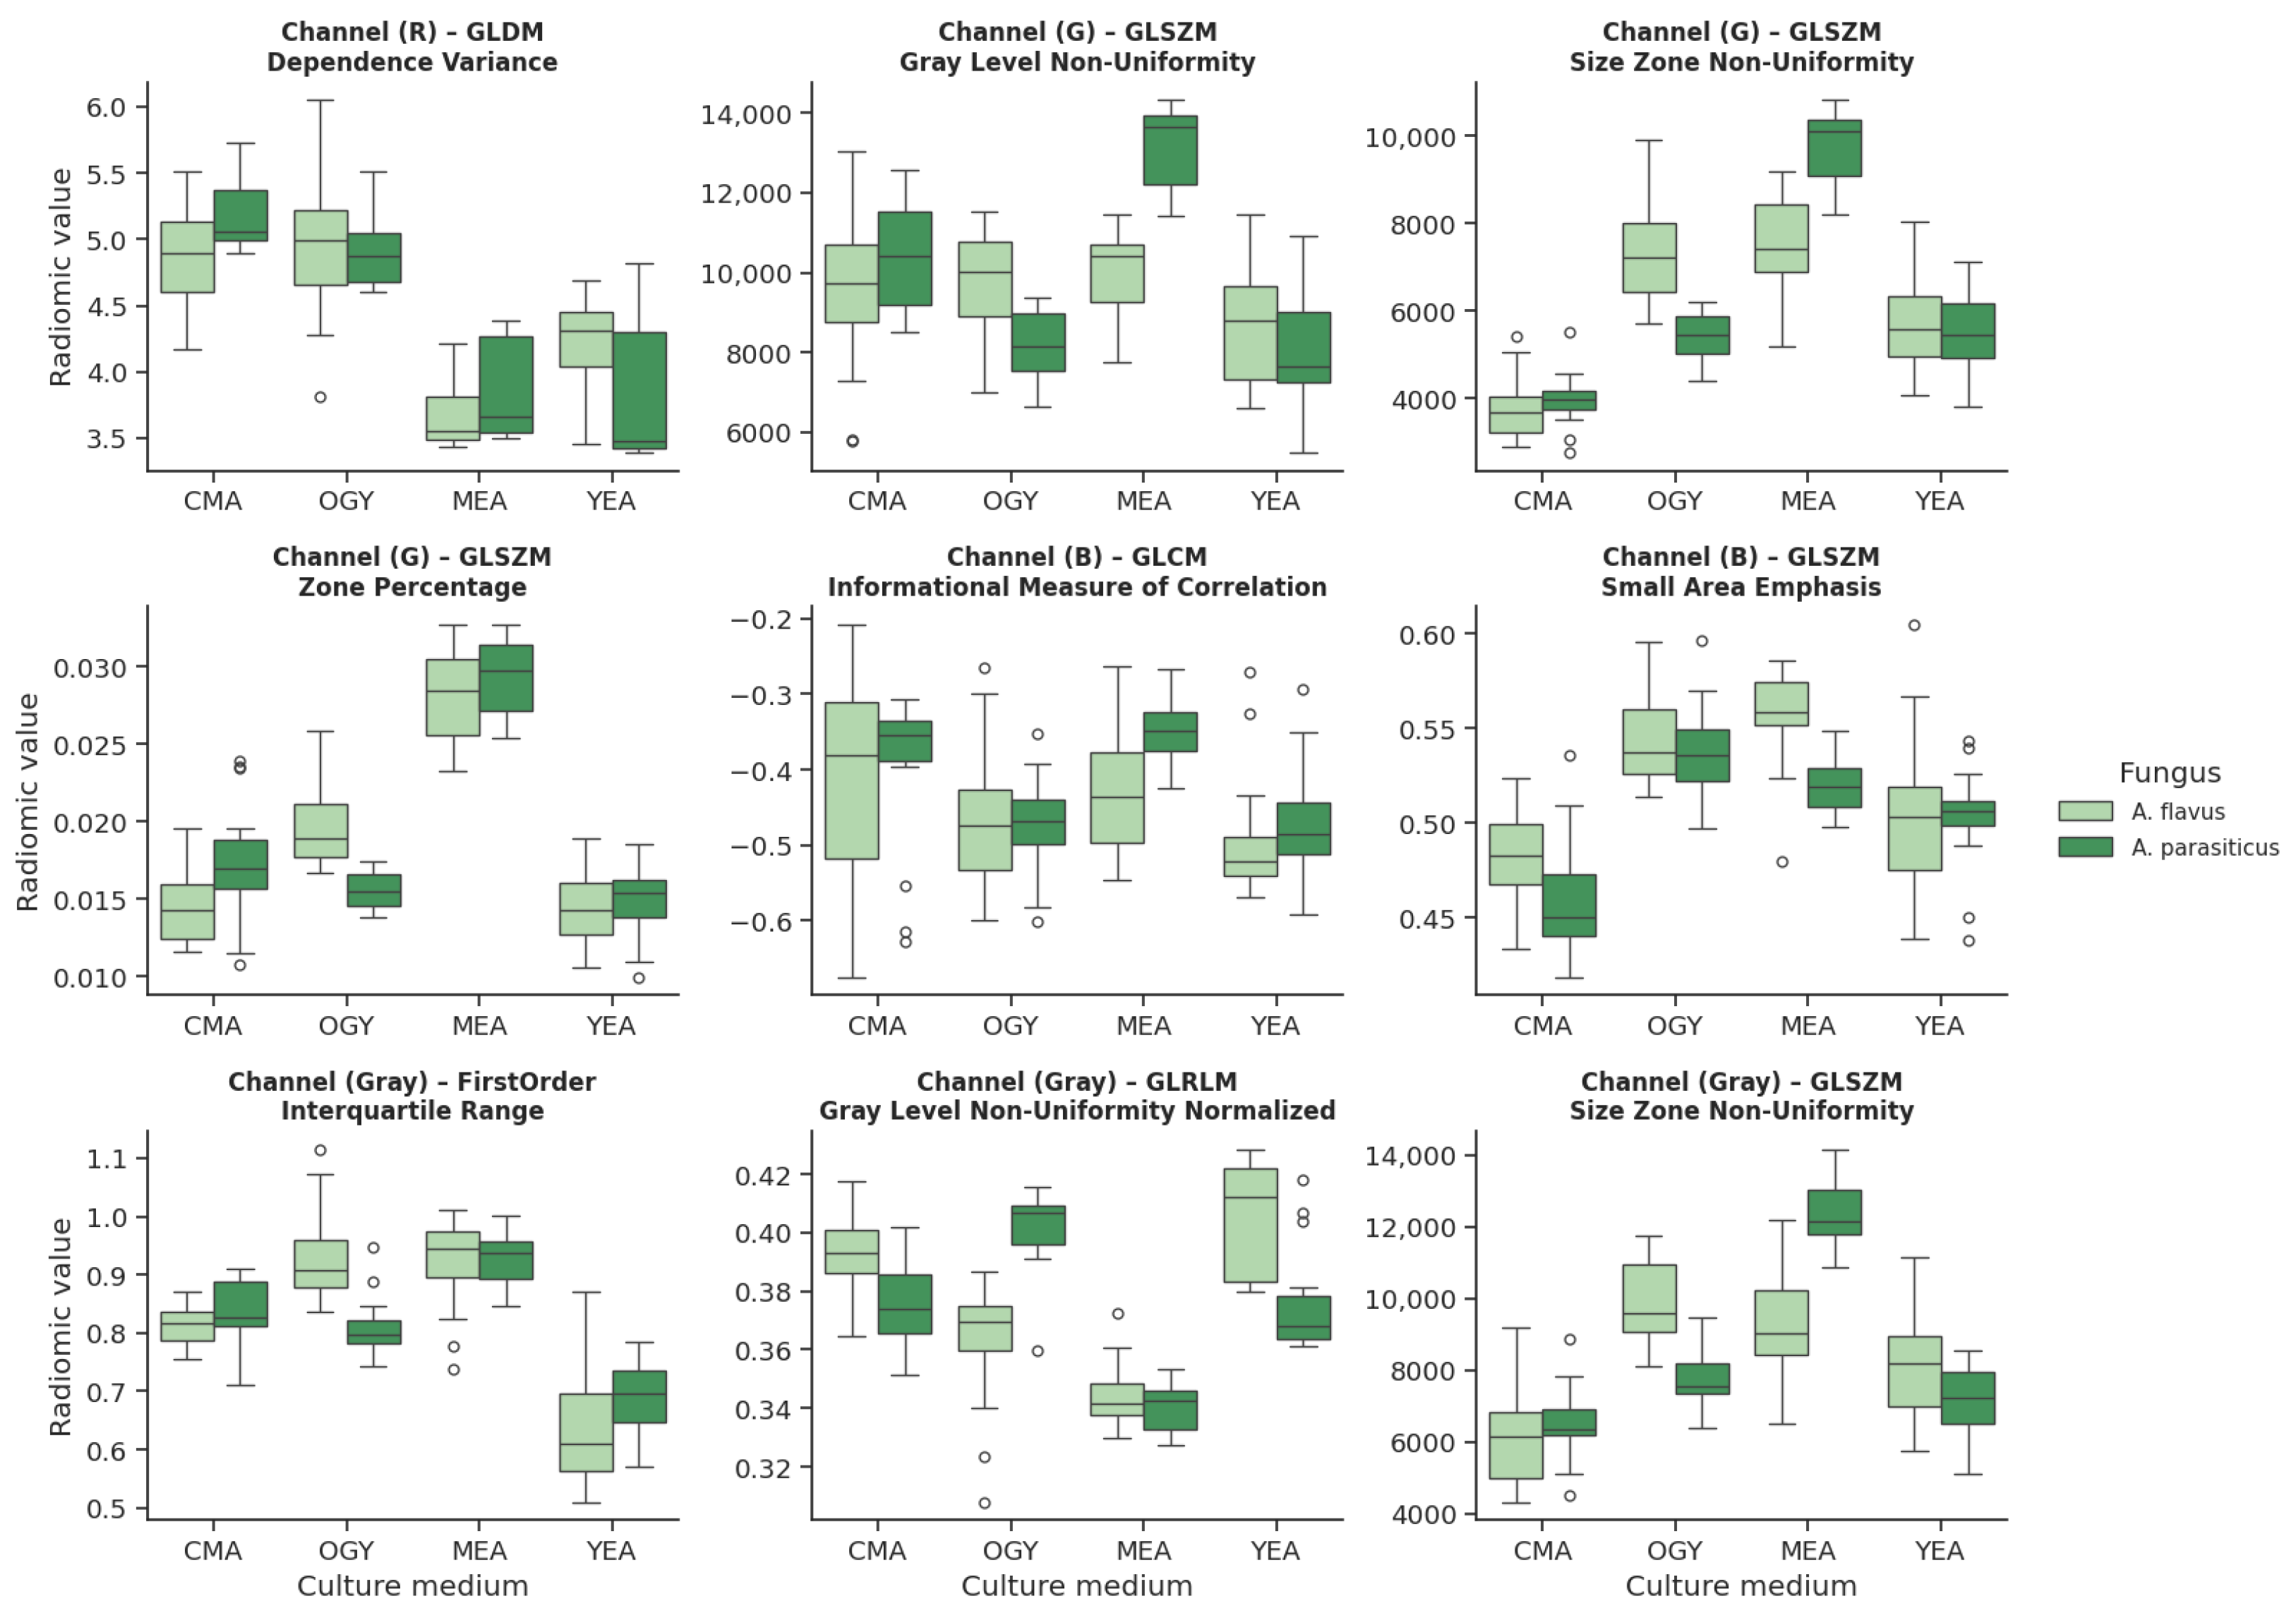
Of the 408 extracted radiomic features, only 9 (2.21%) simultaneously met the criteria for the normality of residuals (Shapiro–Wilk, ) and homogeneity of variances between groups (Levene, ). These variables were primarily distributed across the R (red), G (green), and B (blue) channels, and in grayscale.
In
Figure 11, light green corresponds to
A. flavus, while dark green identifies
A. parasiticus. This representation highlights the differences in the morphological response under the different culture conditions and allows the discriminative capacity of the selected radiomic descriptors to be appreciated.
In the red channel, a feature derived from the GLDM texture was identified, which calculates the Dependence Variance, a measure of the variability in the dependence of intensity levels between neighboring pixels.
In the green channel, three features from the GLSZM texture were found: Gray Level Non-Uniformity, Size Zone Non-Uniformity, and Zone Percentage, all related to the distribution and homogeneity of regions with similar intensity.
In the blue channel, two features were identified: one corresponding to the GLCM texture, which evaluates the Imc1 (Information Correlation Measure 1), and another from GLSZM, which quantifies Small Area Emphasis.
Finally, in the grayscale, three variables were included: one of first order that calculates the Interquartile Range of intensity values, one from the GLRLM texture that measures Gray Level Non-Uniformity Normalized, and another from GLSZM that re-evaluates Size Zone Non-Uniformity.
The variables wee grouped into two main categories according to their nature: first-order features, which describe the statistical distribution of intensity values (such as dispersion and interquartile range), and texture features, derived from co-occurrence and spatial dependence matrices, which capture patterns of repetition, heterogeneity, and uniformity within the regions of interest.
3.2. Results of the Analysis of Variance (ANOVA)
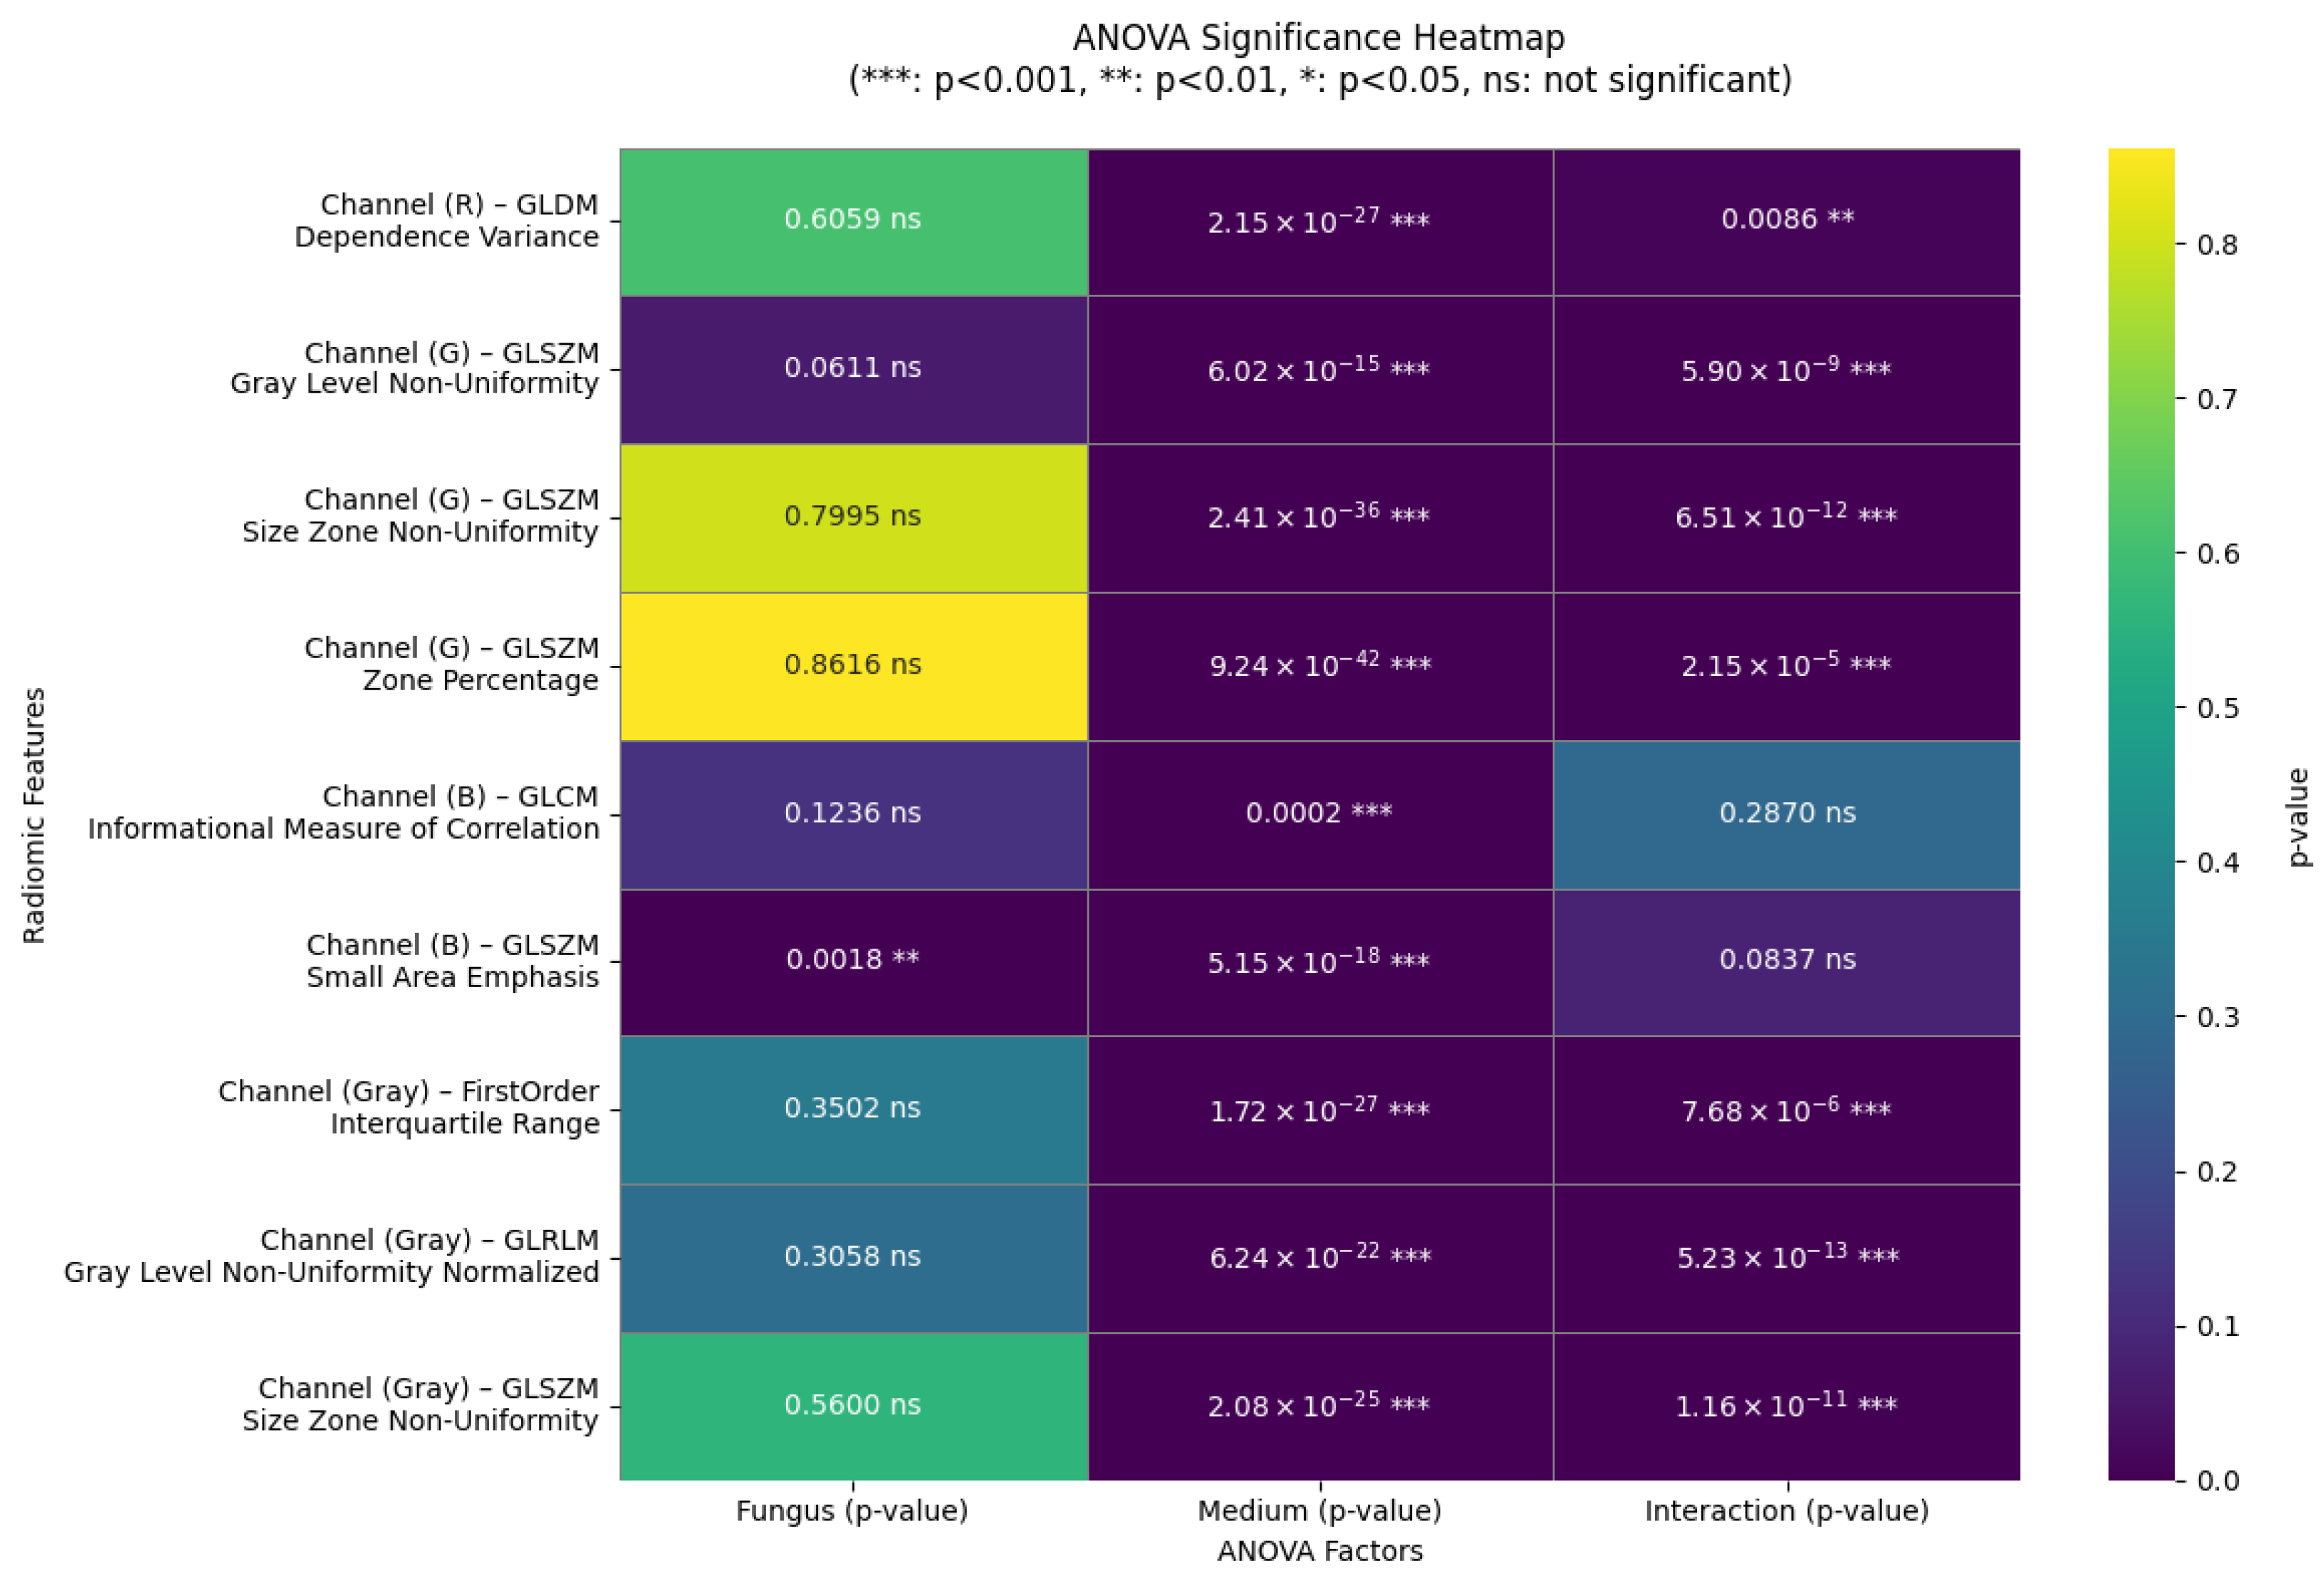
The two-way analysis of variance applied to the nine radiomic features that met the statistical assumptions revealed a highly significant effect of the culture medium on all variables (
), as shown in
Figure 12.
Seven of them exhibited a significant interaction strain and medium, indicating that the morphological response of each fungus depends on the growth environment. In contrast, only one variable showed a significant main effect of the type of fungus (glszm_SmallAreaEmphasis, blue channel; ), suggesting that the morphological differences between A. flavus and A. parasiticus are more pronounced when considered in conjunction with the culture medium. The remaining two variables did not show a significant interaction or a main effect of the type of fungus, although they were still affected by the medium.
3.2.1. Significant Interactions Between Strain and Medium
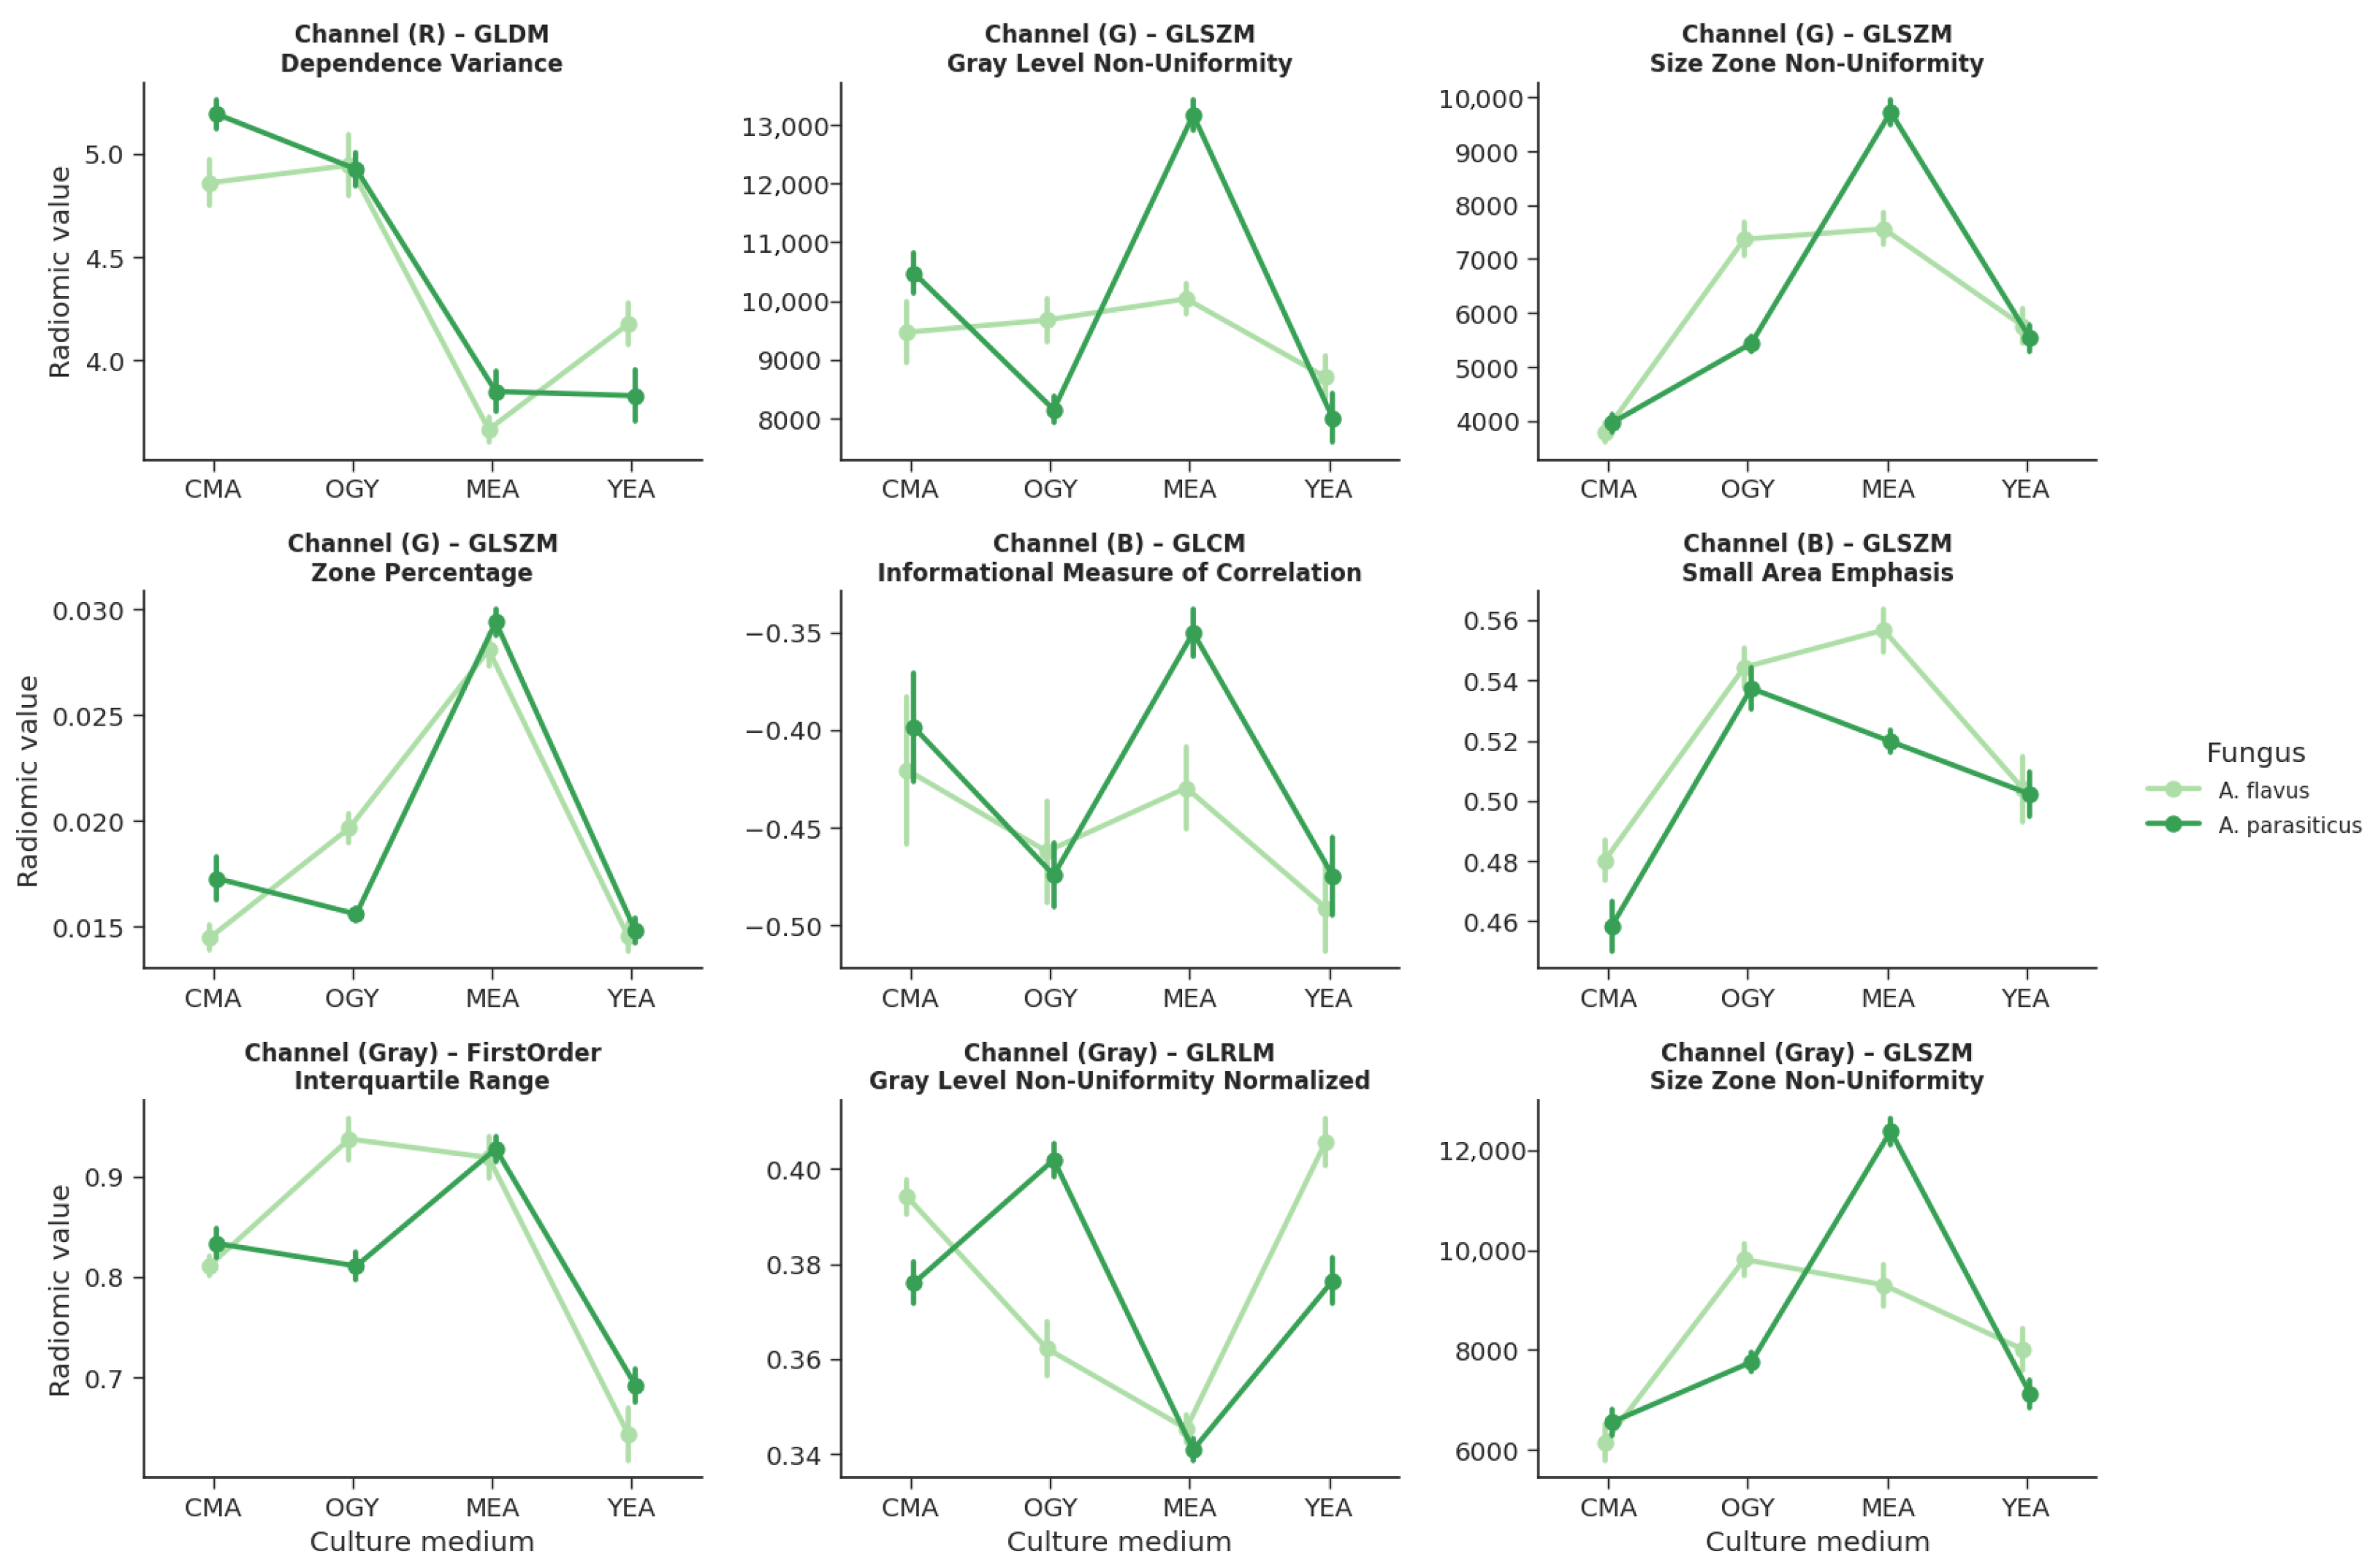
Eight radiomic features exhibited opposing morphological patterns between strains depending on the culture medium, as evidenced visually in the scatter plots with error bars (
Figure 13).
Particularly noteworthy is the variable glszm_SmallAreaEmphasis (blue channel), which is the only one where A. flavus consistently shows higher values than A. parasiticus across all four evaluated media. This difference is especially pronounced in the CMA and MEA media, where A. flavus reaches its minimum (CMA) and maximum (MEA) values, with no overlap with A. parasiticus, indicating a clear separation between the evaluated groups.
It is important to note that although the blue channel usually presents the lowest contrast and the majority of pixels concentrate at the lower end of the histogram (
Figure 6), making direct visual interpretation difficult, radiomic techniques can capture patterns not easily detectable by the human eye.
In this case, the SmallAreaEmphasis feature, derived from the GLSZM matrix, quantifies the concentration of small zones in the image. High values indicate a greater presence of small homogeneous intensity regions, associated with a granular or fragmented distribution of the fluorescence pattern.
3.2.2. Post-Hoc Multiple Comparisons (Tukey HSD)
In order to identify the characteristics with the greatest discriminative power between the different groups evaluated, the Tukey HSD multiple comparisons test was applied to each of the variables extracted after verifying the normality and homoscedasticity criteria [
47]. This test allowed for any statistically significant differences between the means of each group for a given characteristic to be determined using a control approach for Type I error in multiple comparisons [
48,
49]. Since the dataset includes multiple comparison groups, a specific number of comparisons (in this case, 28 possible group combinations) was generated for each radiomic characteristic, and the number of differences that were statistically significant was counted. This count reflected the discriminative power of each characteristic: the higher the number of significant comparisons, the greater its ability to differentiate between groups.
Table 2 shows the characteristics with the most significant comparisons, considered the most relevant for subsequent classification or predictive tasks.
Among the analyzed features, the most discriminative was the GLSZM texture in the green channel, with 23 comparisons, which measures the variability in the size of homogeneous zones and reflects marked differences in fluorescence patterns between strains and culture media. Following it were the first-order features in the grayscale image, with 21 comparisons, which reflects the dispersion of intensities between the 25th and 75th percentiles; GLSZM, with 19 comparisons, which quantifies the heterogeneity in zone sizes; and GLRLM, with 18 comparisons, which captures tonal variations in sequences of grayscale levels.
Other prominent textures are presented in the following paragraphs.
The GLDM feature in the red channel obtained 17 comparisons; GLSZM in the blue channel obtained 17 comparisons and GLSZM in the green channel obtained 16 comparisons; GLSZM with the GrayLevelNonUniformity feature in the green channel obtained 13 comparisons. These features provide complementary information from the red, blue, and green channels, capturing aspects such as the local structural variability, the frequency of small zones, or the granularity of the fluorescent pattern, and reinforce the value of combining multichannel spectral information.
Although the GLCM texture in the blue channel showed only four significant comparisons, its ability to detect organized correlations in the texture indicates that even features with a lower frequency of significance can provide relevant information for classification. These metrics demonstrate that macroscopic texture, measured through subtle spatial and intensity differences, constitutes radiomic information that can only be obtained from high-resolution images, whose quality strongly depends on an appropriate combination of experimental conditions: homogeneous UV illumination, optimal selection of the spectral channel, contrasting culture medium, and well-defined acquisition parameters. Under these conditions, it is possible to identify signals associated with subtle morphological variations, such as heterogeneity in the size of structures, intensity dispersion, the presence of small repetitive zones, or spatial variability in mycelial organization.
To determine the culture medium that allows for greater differentiation between
A. flavus and
A. parasiticus, the combinations with the highest number of significant differences in radiomic variables were identified, as shown in
Table 3. The combination of
A. parasiticus in malt extract agar presented the highest number of features with significant differences (five features), indicating a high radiomic contrast compared to other combinations. Although the focus of the article is on
A. flavus, this pattern indicates that the malt extract agar medium is the most suitable for differentiating between the evaluated strains, as it allows for greater quantitative discrimination in the extracted features.
3.3. Validation and Performance of Radiomic Features in Strain Classification Models
With the aim of identifying the most suitable model to classify
A. flavus versus
A. parasiticus, five classification algorithms were evaluated: Logistic Regression, K-Nearest Neighbors (KNN), Random Forest (RF), Gradient Boosting (GB), and Support Vector Machines (SVM). The best performance was achieved by the SVM model with an RBF (Radial Basis Function) kernel, configured through grid search, using nine radiomic features selected by ANOVA, along with a categorical variable corresponding to the type of culture medium, which showed high statistical significance (
) for differentiating between the evaluated strains (
Figure 14).
The SVM model achieved an accuracy of 97% on the test set, with an F1-score of 0.97 for both classes, reflecting a good balance between precision and sensitivity (
Table 4). The confusion matrix in
Figure 14a shows that only one of the 36 samples was misclassified. In five-fold stratified cross-validation, the model obtained a mean accuracy of 86% (±0.07), indicating good generalization capacity with a low risk of overfitting.
Regarding the other models evaluated, SVM consistently outperformed them, especially after hyperparameter optimization. This advantage can be attributed to its ability to model nonlinear decision boundaries in high-dimensional spaces, which is suitable for capturing complex patterns in the radiomic features.
Figure 14b shows the learning curve of the SVM model. A high accuracy on the training set (∼1.0) is observed, even with few data points, but there is a considerable gap compared to the validation curve (∼0.80), suggesting slight overfitting. However, the validation curve stabilizes with larger training sizes, indicating that the model improves its generalization ability as more data become available. The standard deviation bands are narrow, indicating consistency in performance across folds.
Models like Random Forest, KNN, and Gradient Boosting did not exceed the 80% accuracy threshold in cross-validation and exhibited greater variability. Meanwhile, logistic regression showed limitations in capturing non-linear relationships, which affected its discriminative power.
Complementary to the analysis based on images and AI algorithms, a supervised reduction and classification procedure was implemented in order to more explicitly illustrate the separation between Aspergillus strains. In the first stage, a Principal Component Analysis (PCA) was applied, which projected the complete set of radiomic descriptors into a two-dimensional space defined by the first two principal components, which together explained 63.5% of the total variance. This reduction allows for high-dimensional information to be condensed into a plane where the relative distribution of the samples reflects their textural similarities or differences.
In a second stage, and with the aim of quantifying the discriminative capacity, an independent Support Vector Machine (SVM) classifier was trained for each culture medium, using the PCA coordinates (PC1 and PC2) as input variables. This procedure generates a separation hyperplane specific to each medium, represented in
Figure 15 by the solid black line, along with the ±1 margins (dashed lines). The colored regions reflect the decision areas of the classifier, while the points correspond to individual samples, coded by color (fungal strain) and by shape (culture medium). In addition, 95% confidence ellipses were included to delimit the dispersion within each group, facilitating the visual interpretation of variability.
The results show that the A. flavus and A. parasiticus strains tend to cluster separately in all media, although with different accuracy depending on the case (96.7% in MEA, 93.3% in OGY, 73.3% in CMA, 46.7% in YEA). This variability suggests that culture conditions influence the expressiveness of the descriptors, which is adequately captured by the model. The factor loadings analysis indicated that the main contributions to PC1 and PC2 come from textural descriptors derived from the GLSZM, GLRLM, GLCM, and GLDM matrices, as well as first-order metrics (interquartile range). This confirms that discrimination does not rely solely on chromatic differences, but on multichannel structural patterns.
4. Discussion
UV illumination (365 nm) induced an optical response sufficient to extract radiomic features sensitive to morphological variations between the analyzed strains of
A. flavus and
A. parasiticus, without requiring hyperspectral equipment [
50]. This result is consistent with the findings of Jin et al. [
51], who demonstrated that UV fluorescence can discriminate toxigenic strains of
A. flavus, highlighting the value of this optical signal even in low-cost acquisition systems [
52]. Likewise, the emission of light from fungal mycelium in the visible spectrum, induced by UV excitation, is often associated with the presence of secondary metabolites such as aflatoxins [
32]. However, intrinsic autofluorescence signals may also occur in non-aflatoxigenic strains, such as the
A. flavus ATCC 9643 used in this study [
27]. In this context, the proposed method does not rely exclusively on secondary metabolites but instead leverages radiomic patterns derived directly from colony morphology under UV excitation.
The most relevant radiomic descriptors—identified based on their statistical significance through ANOVA—included a first-order metric and textures derived from matrices such as GLCM, GLDM, GLRLM, and GLSZM, reflecting different aspects of structural heterogeneity in fluorescence images. These features align with standardized methodological strategies for the quantitative characterization of biological structures. As highlighted by Rani et al. [
53], attributes such as contrast, entropy, and homogeneity, together with morphogeometric parameters such as perimeter, circularity, elongation, and axis ratios [
54], have demonstrated high discriminative power in machine learning-based classification tasks, including those applied to fungal analysis. In this article, several of these descriptors were extracted using radiomic techniques; however, not all met the assumptions of normality (Shapiro–Wilk) and homogeneity of variances between groups (Levene), limiting their inclusion in ANOVA. This lack of normality could be associated with the nonlinear nature of fluorescence patterns under UV radiation. Nevertheless, since this study included only one strain per species, it is not possible to attribute this variation to intraspecific differences. Although such descriptors were not selected in the parametric stage, their discriminative potential should not be dismissed, and future research could consider non-parametric statistical tests or dimensionality reduction approaches such as UMAP or t-SNE.
Moreover, as indicated by Lezcano et al. [
55],
A. flavus exhibits remarkable morphological plasticity in response to environmental and nutritional factors, where parameters such as color, texture, pigmentation, and the development of reproductive structures vary significantly depending on the culture medium. This observation is consistent with our results, where the culture media generated the greatest morphological variability detected, as evidenced through analysis of variance (ANOVA). Consistently, Atallah et al. [
56] reported that MEA medium is useful for the qualitative differentiation of
Aspergillus species. In contrast, our radiomic approach enabled the quantitative characterization of these differences, confirming MEA as a reference medium for obtaining distinguishable textural patterns in morphology-based classification analyses.
Recent studies have demonstrated the good performance of artificial intelligence models based on convolutional neural networks (CNN) for the automatic classification of microorganisms [
57]. For example, Tsang et al. [
23] achieved an accuracy of 99.35% when classifying images of
Aspergillus spp. using ResNet-18, and Alnowaiser [
58] developed MicrobeNet, a model combining weighted CNNs with feature selection based on PCA, chi-square, and ANOVA, reaching an accuracy of 99.97%. Although these approaches are highly effective, they tend to rely on feature transformations that may compromise the traceability of the model’s reasoning, particularly when the link to specific morphological descriptors is lost. As highlighted by [
53], feature extraction and selection should balance model performance with an understanding of the variables involved, especially when working with morphological, textural, and differential attributes. In contrast, by applying ANOVA as the central methodology to identify statistically significant radiomic features without transforming them, traceability to the represented biological structures is maintained. This aspect is crucial in disciplines such as mycology or medicine, where decisions cannot rely solely on accuracy metrics but must instead use validated biomarkers and morphological relationships that are comprehensible to experts [
59].
The metrics obtained in this study through radiomic analysis achieved an accuracy of 97% in the classification of the analyzed strains of
A. flavus and
A. parasiticus, even with a limited dataset, and without requiring deep architectures, which is remarkable compared to the requirements of more complex approaches such as that of Zhou et al. [
60], whose CNN model, although showing high training and validation rates (95–96%), exhibited low generalization capacity (69.23% in testing), particularly in scenarios with small sample sizes. Similarly, although Ma et al. [
61] achieved 99.7% accuracy using microscopic images and deep convolutional networks, their approach depends on stereoscopic microscopy and extensive databases, which limits its applicability in resource-constrained environments. In contrast, this phenotype-centered approach not only reduces reliance on advanced infrastructure but also outperforms traditional models, such as those by Haron et al. [
62], where the use of PCA and supervised classifiers (kNN, SVM, SRC, IFkNCN, KSRC) reached a maximum of 80% accuracy with 162 images.
It is noteworthy that no previous studies have employed macroscopic images under UV illumination combined with radiomic descriptors and artificial intelligence algorithms for the classification of Aspergillus strains. Therefore, the accuracy values achieved in this work (up to 97% with only nine features) are not directly comparable to those obtained through microscopic images and deep learning models. Nevertheless, the proposed methodology offers notable advantages in terms of simplicity, cost, reproducibility, and practical applicability in real-world settings or embedded systems.
Nevertheless, some limitations of the present study must be acknowledged. The database size (120 images in total) may restrict the model’s generalization capacity. Another limitation is the dependence on the UV fluorescence channel, which, while useful for highlighting optical features of the colonies, can be influenced by external factors such as exposure, lens type, or illumination intensity. Relatedly, the current methodology was primarily designed for strains that exhibit emission in the visible range under UV excitation (365 nm); however, non-aflatoxigenic strains such as
A. oryzae, which are phylogenetically close and morphologically similar to
A. flavus but clearly diverge in secondary metabolism [
6], may require specific system adaptations (white-light illumination, adjustments in acquisition, or segmentation in the visible spectrum). Likewise, the controlled acquisition and cultivation conditions, although necessary to reduce variability, limit the representation of real contamination scenarios. Nevertheless, this methodological choice enabled a rigorous characterization of radiomic patterns under UV radiation, avoiding interferences caused by natural fluorescence or by the physicochemical properties of the substrate [
63,
64]. In consequence, future work should validate this approach in contaminated food matrices and expand the dataset by incorporating multiple strains per species, as well as other toxigenic species, in order to strengthen the model’s generalization. We also aim to explore alternative color spaces (HSV, Lab, YCbCr), which could reveal additional radiomic patterns not detectable in RGB. To complement this, future studies could integrate radiomic analysis with deep learning models, such as hybrid convolutional neural networks (hybrid CNNs), using radiomic features as structured inputs or in intermediate layers, with the aim of enriching the automatically learned deep representations and optimizing classification. Furthermore, the incorporation of three-dimensional acquisition technologies, such as volumetric scanners, would allow for the inclusion of radiomic descriptors associated with thickness, surface topology, and the spatial organization of the mycelium, thereby broadening the spectrum of morphological information available for analysis.
5. Conclusions
This study demonstrated that radiomic analysis, when applied to images of fungal colonies under long-wave ultraviolet irradiation (UVA, 365 nm), constitutes an effective tool to quantitatively differentiate between Aspergillus flavus (ATCC 9643) and an isolate of A. parasiticus. The results showed that the culture medium exerts a significant effect on the variability of the descriptors, with Malt Extract Agar (MEA) and Yeast Extract Glucose Agar with Oxytetracycline (OGY) standing out as those that generated the most discriminant textural patterns and the highest classification accuracy. This observation is particularly relevant, as it suggests that the choice of medium can help reduce morphological overlap between closely related species, optimizing the performance of classification models.
Although only 2.21% of the features were statistically valid, this statistical refinement allowed for the identification of nine variables with high discriminative power and analytical stability. These variables mainly included textural descriptors derived from the GLSZM, GLRLM, GLCM, and GLDM matrices, as well as first-order metrics, confirming that differentiation relies not only on chromatic intensity but also on multichannel structural patterns. Additionally, the integration of PCA and SVM enabled the visual and quantitative representation of the differentiation between the strains across the different culture media.
The configuration of radiomic feature extraction was decisive: the use of minimal bin width values facilitated the capture of subtle patterns in high-resolution images under UV radiation (365 nm), resulting in higher statistical significance for textural variables specialized in small regions. This level of detail reduced class overlap and enhanced the discriminative capacity of the model, highlighting the importance of preserving image resolution in studies aimed at precise morphological characterization.
Finally, the application of ANOVA as a feature selection technique allowed for a reduction in the original set of 408 descriptors to only 9 key features, simplifying quantitative and visual interpretation. This approach, validated through SVM, revealed that although many texture metrics exhibit non-linear behaviors, they are fundamental for species discrimination when adequately projected into higher-dimensional spaces. In the future, the incorporation of a larger volume of standardized images and additional species will strengthen the model’s generalization capacity and consolidate its application in real diagnostic and control contexts.
