Article

Mechanical Properties of Corn Stalks and Behavior of Particles During Compression Process Based on Discrete Element Method

College of Engineering, Shenyang Agricultural University, 120 Dongling Road, Shenhe District, Shenyang 110866, China
*
Author to whom correspondence should be addressed.
Agriculture 2025, 15(17), 1824; https://doi.org/10.3390/agriculture15171824
Submission received: 11 July 2025 / Revised: 17 August 2025 / Accepted: 21 August 2025 / Published: 27 August 2025
(This article belongs to the Section Agricultural Technology)

Abstract

The mechanical properties of corn stalks play a crucial role in the design of packing and harvesting equipment. Complete and damaged stalks were used to simulate stalk mixtures during the collection process. This study measured the mechanical characteristics of complete stalks and damaged stalks through experiments. A discrete element method (DEM) model was established which incorporated both the skin and core tissues of the samples. The compression behavior of the stalks was analyzed with the EDEM 2022 software. The results indicate that the complete stalks exhibited both a plastic and second plastic stage, while the damaged stalks fractured immediately upon reaching peak stress. The models of the complete and damaged stalks were validated through a radial compression test. An analysis of the relative errors and particle velocities enabled the quantification of experimental accuracy, ensured the reliability of the experimental data, and revealed the dynamic behavior mechanism of the materials under mechanical loading. The simulation results show that the maximum compression force is 254.11 N and 33.1 N, with a 1.5% and 12.3% relative error compared to the experiment. The particle velocity in the core part is the largest, which is 9.83 × 104 mm/s and 3.51 × 105 mm/s. This study can provide a theoretical reference for researching the mechanical behavior and compressive failure of stalks.

1. Introduction

Corn, one of China’s most important crops, occupies the largest planting area in the country. Consequently, as the world’s second-largest corn producer, China also generates an enormous volume of corn stalks [1]. Stalks are a renewable resource, which are rich in nutrients and can be used as feed [2]. However, there exist issues of strong seasonality and a low utilization rate of stalks [3]. The collection, storage, and transportation of stalks are crucial components for addressing the problems of strong seasonality and low utilization rates [4]. Stalks are typically collected through compression, which can improve efficiency and reduce costs [5]. During the collection and storage processes, mixtures of complete and damaged stalks often exist. Therefore, exploring the compression comparison between complete and damaged stalks can provide guiding significance for stalk collection, storage, and transportation. In this study, damaged stalk refers to mechanical damage caused by external forces during harvesting and processing, which is mainly characterized by structural incompleteness.
The DEM is widely applied in agricultural engineering, which can analyze the contact interactions between particle and mechanical components [6,7,8]. Rigid models are generally established in the research of harvesting and reaping processes of corn and grass stalks [9,10]. However, they cannot accurately characterize the mechanical properties of materials. In order to solve this problem, a flexible model composed of rigid cylinders connected by joints was established, which can analyze the loading process of corn stalks [11,12]. However, this connection method cannot demonstrate the continuous variation of stress on stalks. Mao et al. [13] established a particle-based hollow stalk model utilizing inter-particle bonds, where bond deformation arises from particle displacement. To characterize stalk mechanics, Schramm et al. [14] derived a method for determining the local damping coefficient and bond Young’s modulus of flexible fibers, linking these properties linearly to particle oscillation frequency. Li et al. [15] further developed a breakable–flexible hollow stalk model, investigating the impact of operational and structural parameters on thrown stalk mass and cut stalk length. This model of stalks treats them as homogeneous substances, being unable to analyze the mechanical properties among different tissues within stalks and changes among internal particles. A model incorporating accurate mechanical parameters needs to be established for structural analysis of stalks. Leblicq et al. [16] combined deformation with model parameters to validate the compression of single and batch stalks based on contact parameters. Li et al. [17] investigated the mechanical properties of sorghum and corn stalks, analyzing the impact of various factors on their compressive strength. Their findings reveal that moisture content exerts a significant influence on stalk compressive strength. Song et al. [18] investigated the dynamic mechanical properties of reed corn stalks and then analyzed the effects of different positions on the compressive strength of reed corn stalks. The results indicate that the axial compressive strength of node-containing corn stalks is higher than that of node-free corn stalks. Tang et al. [19] studied the changes of porosity and pressure with stalks of different lengths under the condition of vibrating compression. Their research demonstrates that vibration eases pressure on stalks during compression. However, there is a lack of exploration of the interactions among various layers of tissues and changes in each layer of tissues. It is insufficient to accurately characterize a mechanical property model only by studying the physical properties of the materials themselves. A two-layer model of corn stalks was established, which was discretized into heterogeneous particle assemblies to characterize the mechanical properties of skin and core regions [20,21]. Currently, studies on stalks mostly treat stalks as a whole and construct overall mechanical models. Such models have limitations in investigating the internal interactions of stalks, as they can only reflect the variation patterns of the overall structure. Additionally, some scholars have established particle stacking models based on internal structures to observe force characteristics. However, their analysis of stalk-internal structures and exploration of inter-particle forces remain relatively insufficient. In this study, a double-layer model of stalks is constructed, and the variation characteristics between particles of two stalk types are analyzed with EDEM 2022 software to explore their internal correlation mechanisms.
This study established a DEM model incorporating skin–core differentiation and calibrated its parameters. The mechanical properties of stalks were determined experimentally, and model validation was performed through compression simulations. The failure processes of two types of stalks with different shapes were analyzed, and a damaged stalk model was used to represent the incomplete stalk model. Furthermore, the interaction relationships between different tissue particles were explored.

2. Materials and Methods

2.1. Physical Parameters of Corn Stalks

The test specimens consisted of damaged corn stalk and complete corn stalk segments, which were collected from the Northeast Conservation Tillage Demonstration Site located in Cuijiatun Village, Yiniubaozi Township, Shenyang City, Liaoning Province of China. The test samples were obtained in September 2024, and all tests were completed within 24 h after they were collected. The complete stalks have a length of 25 mm and a diameter of approximately 18 mm. The damaged stalks were derived from the complete ones, with a length of 25 mm and a minimum diameter of approximately 10 mm. The main difference between the complete and damaged stalks lies in their thickness, with damaged stalks highlighting structural incompleteness. These damaged stalks were used to represent other incomplete stalk models. Experimental measurements showed a 16.22% moisture content in corn stalks. Density analysis yielded a bulk density of 0.376 g/cm3, with core (0.105 g/cm3) and skin (0.584 g/cm3) components exhibiting significant density contrast. The morphological configurations of the complete corn stalks and damaged corn stalks are illustrated in Figure 1a,b.

2.2. Mechanical Properties of Corn Stalks

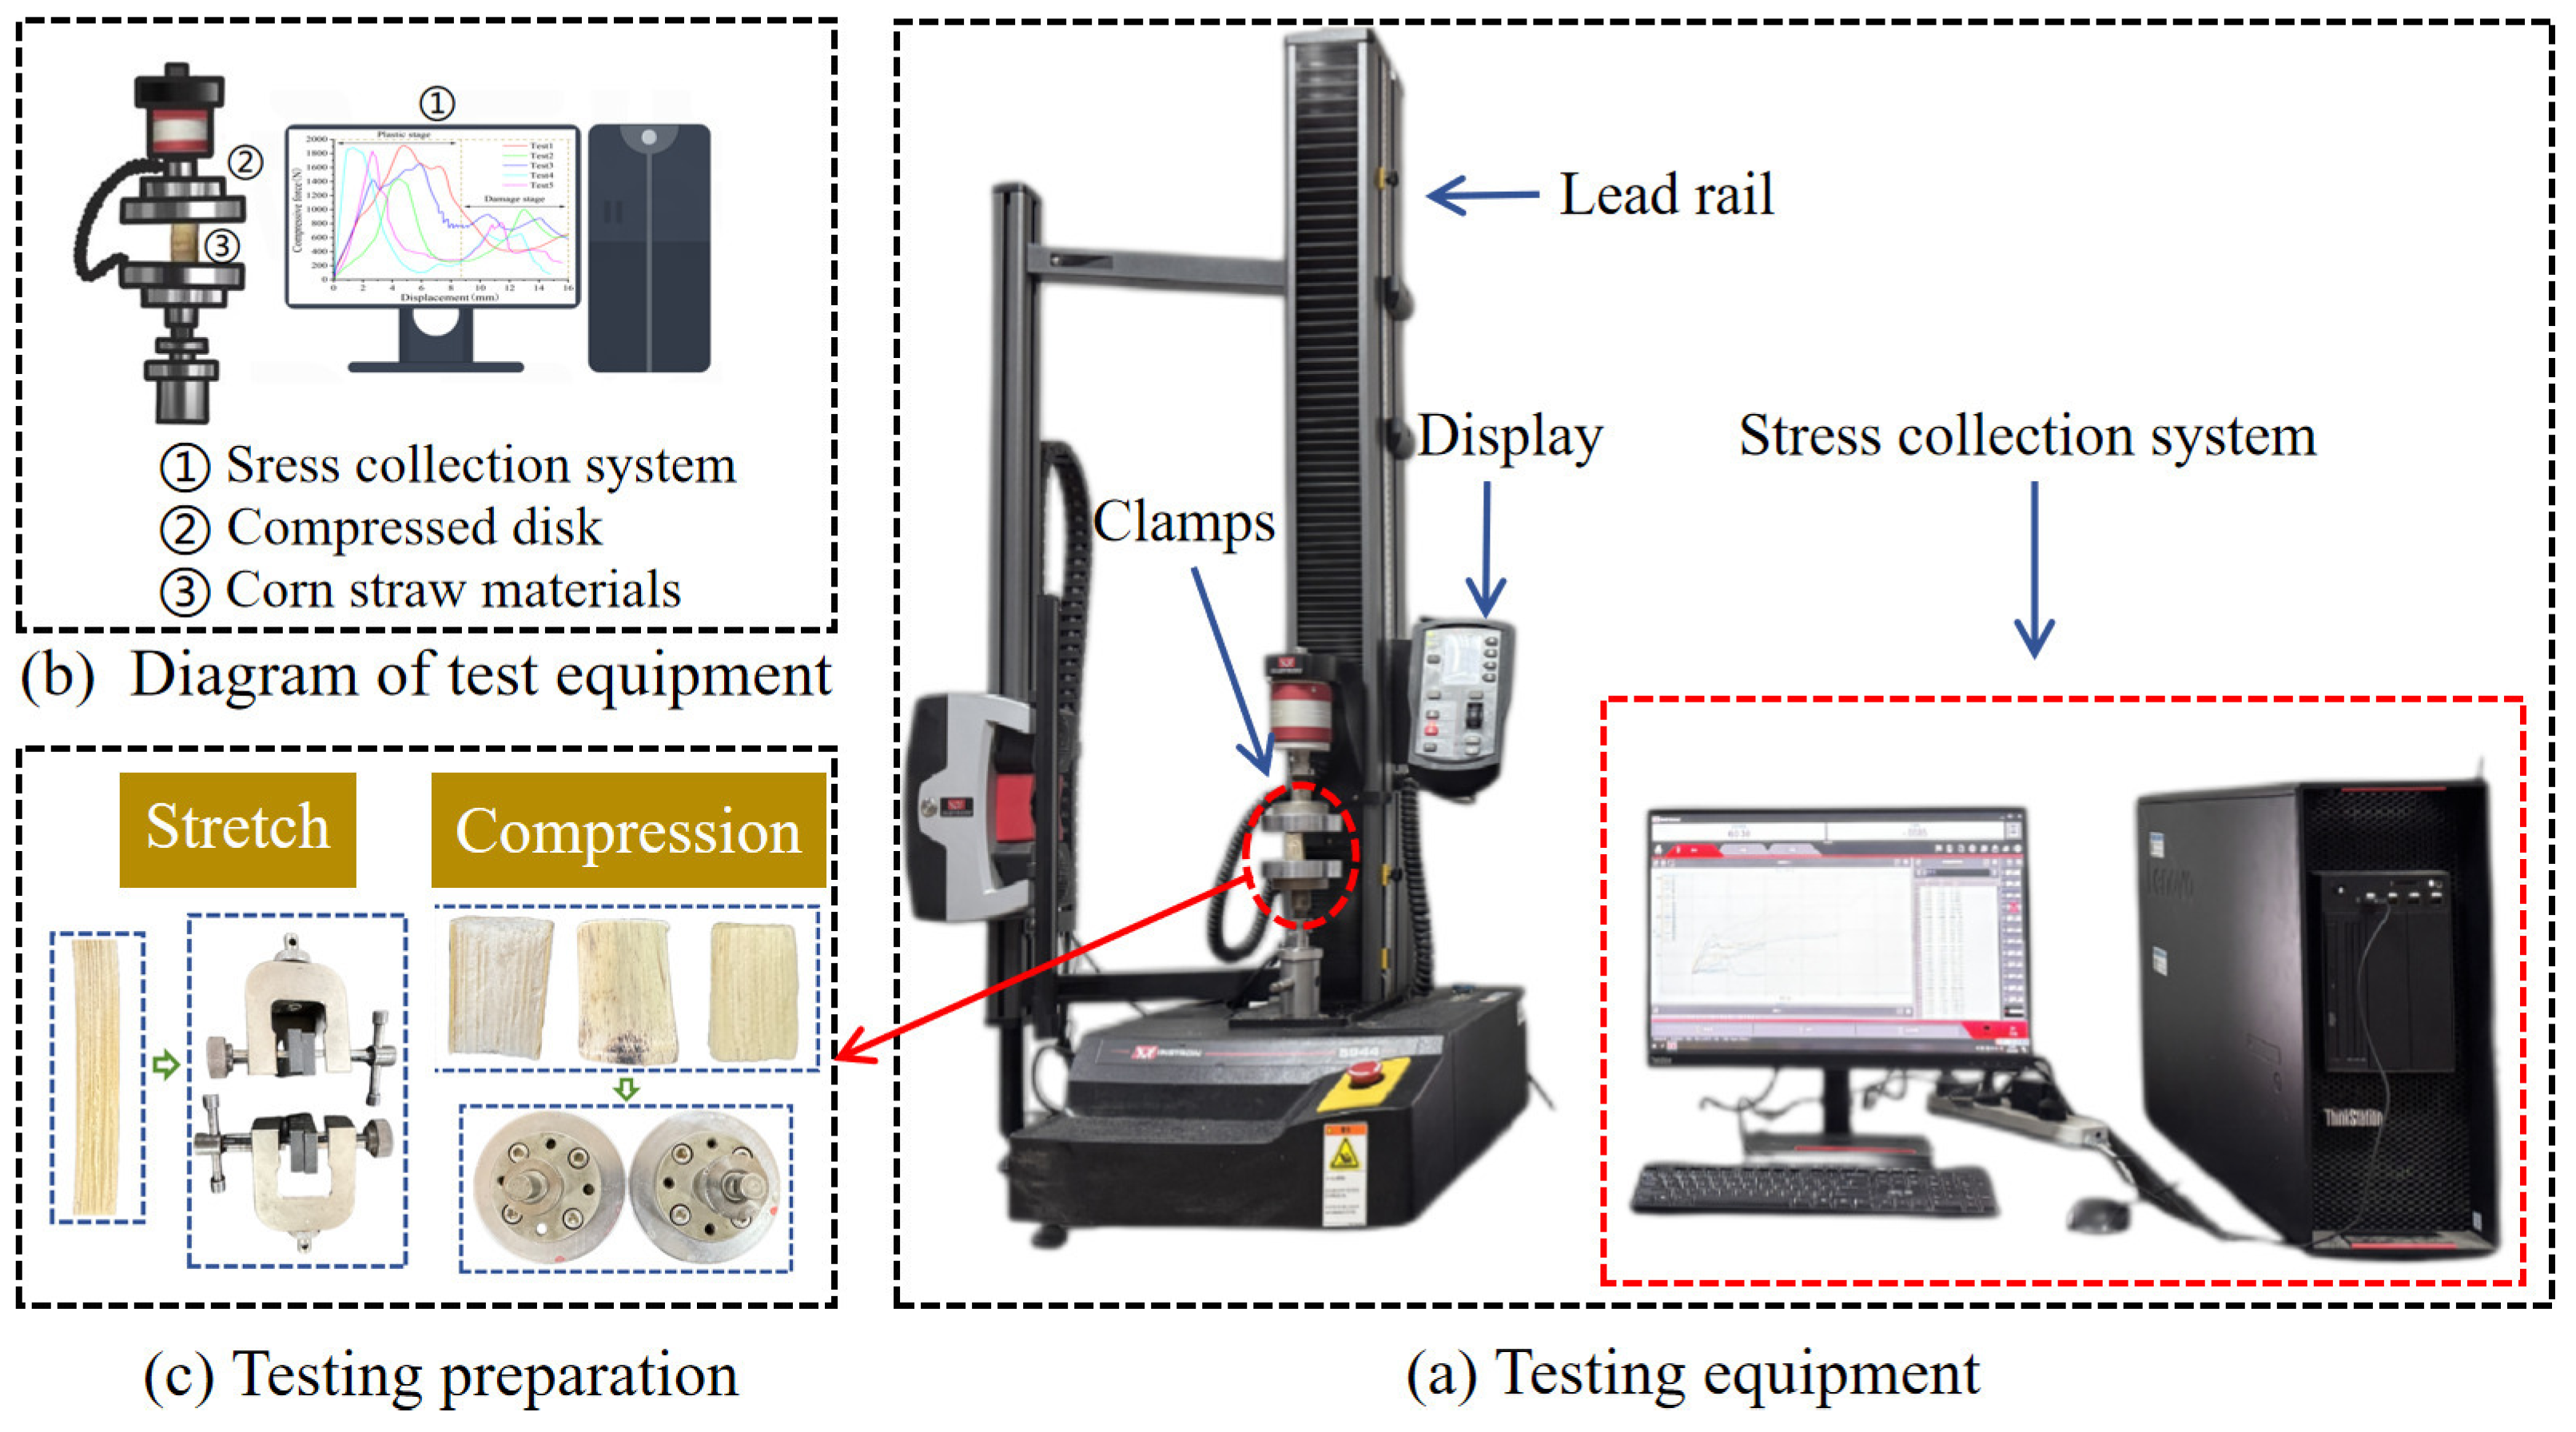
Mechanical properties of the stalks were analyzed using an INSTRON-5944 universal testing machine (Figure 2a), which comprises a compression fixture and pressure acquisition system (Figure 2b). This study adopted two testing methods (tensile and compression) and three loading modes (tensile, axial compression, and radial compression) to conduct the experiment. The loading modes could be achieved by replacing the fixtures, as shown in Figure 2c.

Compression and Tension Tests of Corn Stalks

The skin of the corn stalks was divided into different rectangular strip samples, in which the skin was separated from the core. The cross-sectional area (S) and length (L) of the corn stalks were measured. Complete and damaged stalks, stalk cores, and stalk skins were selected as test samples, with each type of sample divided into five groups and each group subjected to 10 independent repeated experiments. Elastic modulus was calculated using Equation (1).
E = F / S D L / L 10 6
Elastic modulus E (pa) represents stalk stiffness. Under compression, F (N) denotes the applied force, S (mm2) the cross-sectional area, DL (mm) length deformation, and L (mm) the initial length.

2.3. Determination of Contact Parameters of Corn Stalks

2.3.1. Determination of the Restitution Coefficient of Corn Stalks

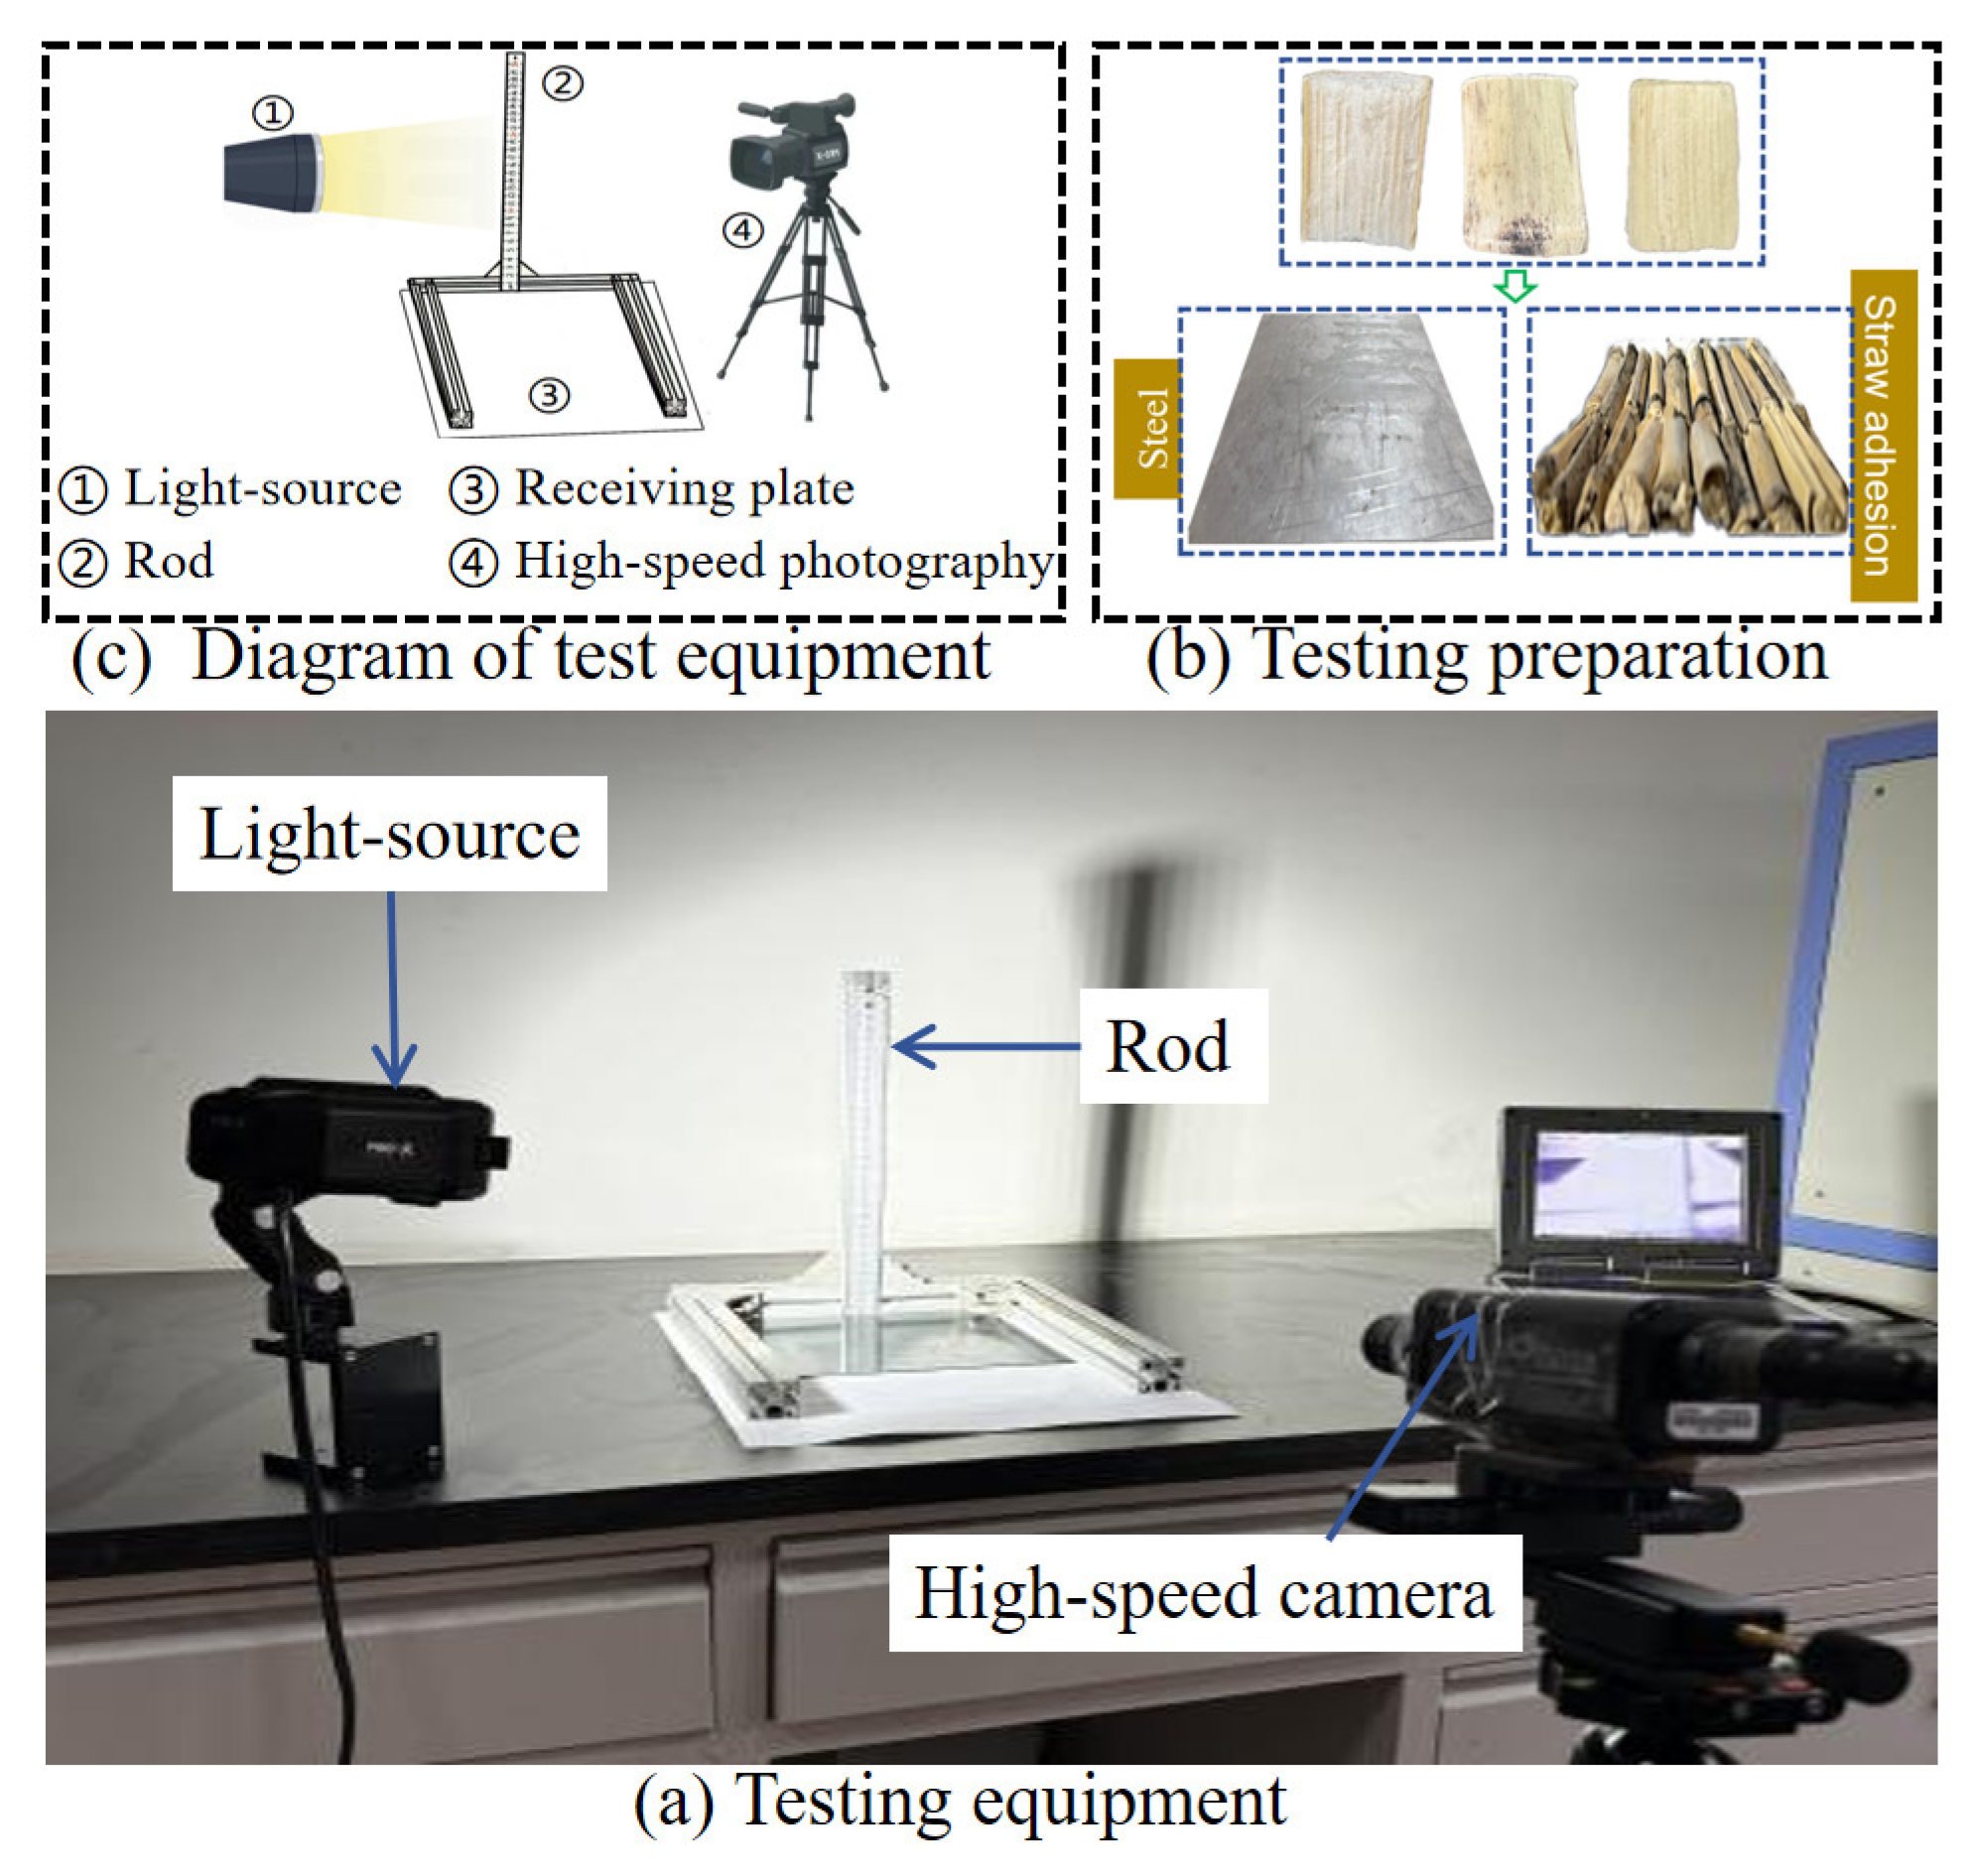
The drop test rig was applied for this experiment, and the coefficients of restitution for collisions were measured between damaged corn stalks and steel plates, damaged and complete corn stalks, complete corn stalks and steel plates, and complete corn stalks and corn stalk cores. Collision–rebound dynamics were recorded using a high-speed camera (Figure 3a). Test specimens comprised complete corn stalks, damaged corn stalks, steel plates, and stalk-adhesive plates (Figure 3b). The experimental setup included illumination sources, metrology instruments, and an imaging system (Figure 3c). The restitution coefficient was computed via Equation (2) [22].
e x = V 1 V 0 = 2 g h 2 g H = h H
The restitution coefficient (ex) characterizes corn stalk collisions, where V1 is the post-collision normal velocity (m/s), V2 is the pre-collision normal velocity (m/s), h is the maximum rebound height (m), and H is the initial drop height (m).
The restitution test of complete corn stalks impacting a steel plate was as shown in Figure 4a. When a stalk came into contact with the steel plate, elastic deformation occurred. The elastic deformation ends were converted into upward kinetic energy. It bounced up by 4.2–8.6 cm and then fell onto the steel plate. Figure 4b shows the collision recovery test between damaged corn stalks and steel plates. When the steel plates rebounded 3.1–6.4 cm, the contact interface with damaged corn stalks exhibited an inclined orientation. Figure 4c shows the collision recovery test between complete corn stalks and stalk-adhesion plates. The stalks bounced up by 5.0 cm to 7.0 cm. Figure 4d shows the collision recovery test between damaged corn stalks and the stalk-adhesion board. When the stalks were dropped onto the stalk-adhesion board at an inclined angle, they rebounded upward along the inclined direction by 2.2 cm to 4.5 cm.

2.3.2. Determination of the Static Friction Coefficient

The static friction coefficient was determined using the inclined plane method for the following interfaces: complete corn stalks versus steel plates (Figure 4e), damaged corn stalks versus steel plates (Figure 4f), complete corn stalks versus stalk-adhesive plates (Figure 4g), damaged corn stalks versus stalk-adhesive plates (Figure 4h), and core–core interfaces. All configurations were calculated using Equation (3).
μ s = tan θ
The static friction coefficient of the corn stalk is denoted by µs, while θ represents its static friction angle in degrees (°).

2.3.3. Determination of the Rolling Friction Coefficient

The rolling friction coefficients for corn–stalk interfaces were determined using the inclined plane method. These included complete/damaged stalks against both steel plates and stalk-adhesive plates, along with core–core interfaces. All values were calculated using Equation (4) [23]. The experiments to determine the coefficient of kinetic friction for both complete corn stalks and damaged corn stalks are illustrated in Figure 4i–l.
m g S 1   sin   β = μ r m g ( S cos β + L 1 )
The rolling friction coefficient of the corn stalk is denoted by µr, while m signifies its mass (g), and g represents gravitational acceleration (9.8 m/s2). The experimental parameters include S1 (rolling distance on the inclined plane, mm), β (inclination angle, °), and L1 (rolling distance, mm).

2.4. Calculation of Bonding Parameters

In order to reflect the flexible characteristics of the corn stalk model and simulate the deformation and fracture process of corn stalks, the bonded particles were displaced along the normal and tangential directions. The deformation of corn stalks was simulated through the continuous accumulation of displacements. The principle of inter-particle bonding is shown in Figure 5a. The forces and torques acting on the particles were determined by Equations (5) and (6) [24].
K n 1 = A E 1 L 2 ( N 1 )
K s 1 = K n 2 2 ( 1 + μ )
A denotes the cross-sectional area of the parallel bond (mm2); E1 refers to the elastic modulus of the parallel bond (pa); L2 stands for the length of the parallel bond (mm); K n 1 is the normal stiffness of the stalk (N/mm3); K s 1 represents the shear stiffness per unit area of the parallel bond (N/mm3); K n 2 denotes the normal stiffness per unit area of the parallel bond (N/mm3).
When the acting force exceeds the predetermined value, the bond breaks. The fracture conditions are shown in Equations (7) and (8).
σ m a x < F n A + 2 M t J R b
τ m a x < F t A + M n J R b
δ m a x and τ m a x correspond to the critical normal stress and critical tangential stress, respectively.
The average normal stiffness per unit area was determined to be 1.47 × 10⁹  N · m 3 , while the average tangential stiffness per unit area was found to be 1.39 × 10⁹  N · m 3 . Additionally, the average critical normal stress was derived as 1.69 × 10⁸, and the average bonding value was calculated to be 0.9.

2.5. Establishment of the Corn Stalk Model

To capture the mechanical properties of corn stalks during compression and breakage, a flexible stalk model that can simulate bending and breaking was developed. In calculating contact forces, it is necessary to choose a suitable contact model, and a bonding model is better able to represent contact characteristics [25,26].
In the simulation, a rigid boundary condition was adopted, whose material properties are consistent with those of the compression device used in physical experiments. The contact type between the boundary and particles was defined as no-slip contact. This model was employed to describe the interaction between stalk particles and steel, aiming to reflect the characteristics of stalks. The units were connected using the Hertz–Mindlin with Bonding V2 contact model [27], which mainly consists of two layers of particles. The outermost layer represents the skin. The inner layer represents the core [28]. The core of the damaged corn stalks model composed of spherical particles, whose diameter was 1 mm. The core radius was 1.2 mm, and the skin radius was 0.9 mm. The stalk length was L3 = 25 mm, as shown in Figure 5b. The complete corn stalks had a diameter of 18 mm, as shown in Figure 5c. During the operation of the actual collection device, a mixture of complete and damaged stalks was produced. The complete stalks were modeled as circular shapes, while damaged stalks adopted an elliptical structural model to simulate incomplete stalks in the mixture. The thickness of damaged stalks was set to approximately half of that of the complete stalks. Considering the integrity of the model in actual modeling, the diameter (d) was set to 10.53 mm in this study, which was used to simulate models with structural damage and incompleteness.

2.6. Calibration of Contact Parameters for Corn Stalks

2.6.1. Determination of the Actual Angle of Repose

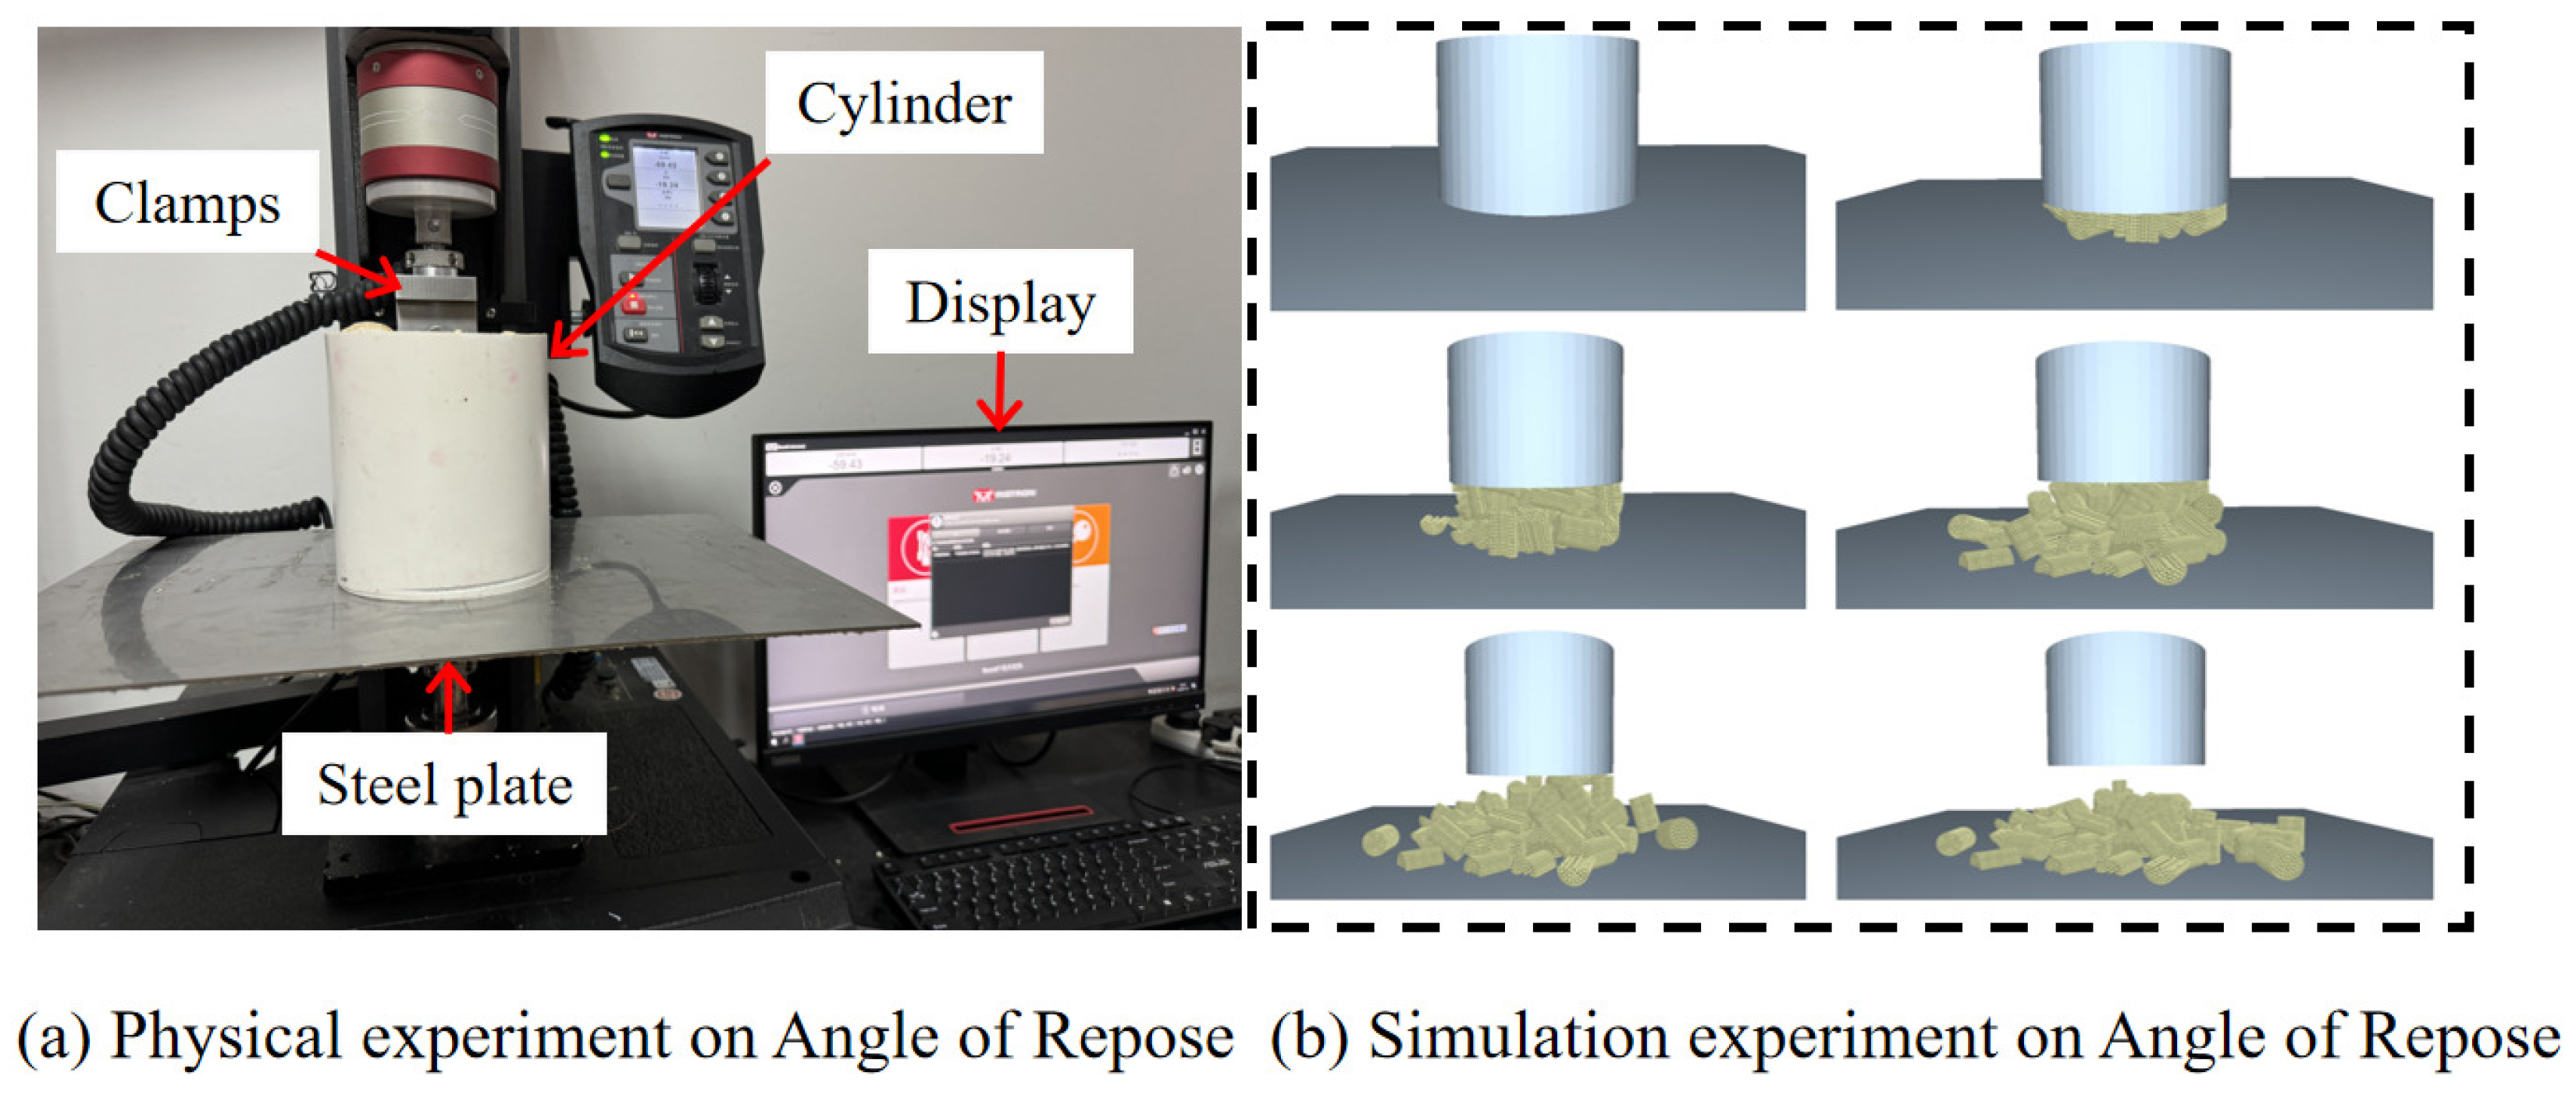
A piling experiment was carried out using the lifting method, through which the angle of repose for a mixture of complete and damaged corn stalks was determined. This angle of repose experiment is illustrated in Figure 6a. The experiment was performed with 5 independent repetitions, and statistical analysis was conducted using the results from these five independent calculations. The standard deviation is used to indicate repeatability, while the 95% confidence interval demonstrates reliability. It should also be clarified that minor fluctuations in stalks are from natural variations in the morphology of stalk particles and do not affect the overall stability.

2.6.2. Simulation of the Angle of Repose

The angle of repose formed in the simulation test is illustrated in Figure 6b. Models of complete and damaged corn stalks were imported into EDEM 2023, with Poisson’s ratio set to 0.32. In the simulation tests, models of the cylinder and base plate with the same parameters as those in the physical tests were established. A Polygon plane was built above the cylinder as the particle factory. After multiple repeated tests, the particle generation rate was set to 5 kg/s, with a generation time of 4 s. After the particles were completely generated and the particle pile was statically stabilized, lifting was conducted at the same speed as in the physical tests, with a lifting time of 6 s. The time step was 20% of the Rayleigh time step, and the mesh size was 3 times the particle radius. The MATLAB 2022 software was utilized to process the obtained images of the angle of repose, thereby deriving the angle of repose for the simulation tests.
The tests were repeated ten times from both physical and simulation perspectives, and the error values, confidence intervals, standard deviations, and sensitivity analyses of the two groups of experimental results were compared to verify the reliability of the data from a statistical perspective.

3. Results and Discussion

3.1. Mechanical Experiment Analysis

3.1.1. Contact Parameter Measurement Results

The contact parameters of complete corn stalks used to measure the friction coefficient and coefficient of restitution are shown in Table 1. The coefficient of restitution for collisions between stalks and steel plates was the largest, ranging from 0.255 to 0.661. Friction coefficients were highest for core–core contacts, exceeding both stalk–stalk and stalk–steel interactions.
Table 2 shows the measured contact parameters of damaged corn stalks, including the friction coefficient and coefficient of restitution. The coefficient of restitution for collisions between stalks and steel plates was the largest, ranging from 0.179 to 0.422, while friction coefficients were highest in stalk–steel plate contacts.

3.1.2. Axial Compression Test

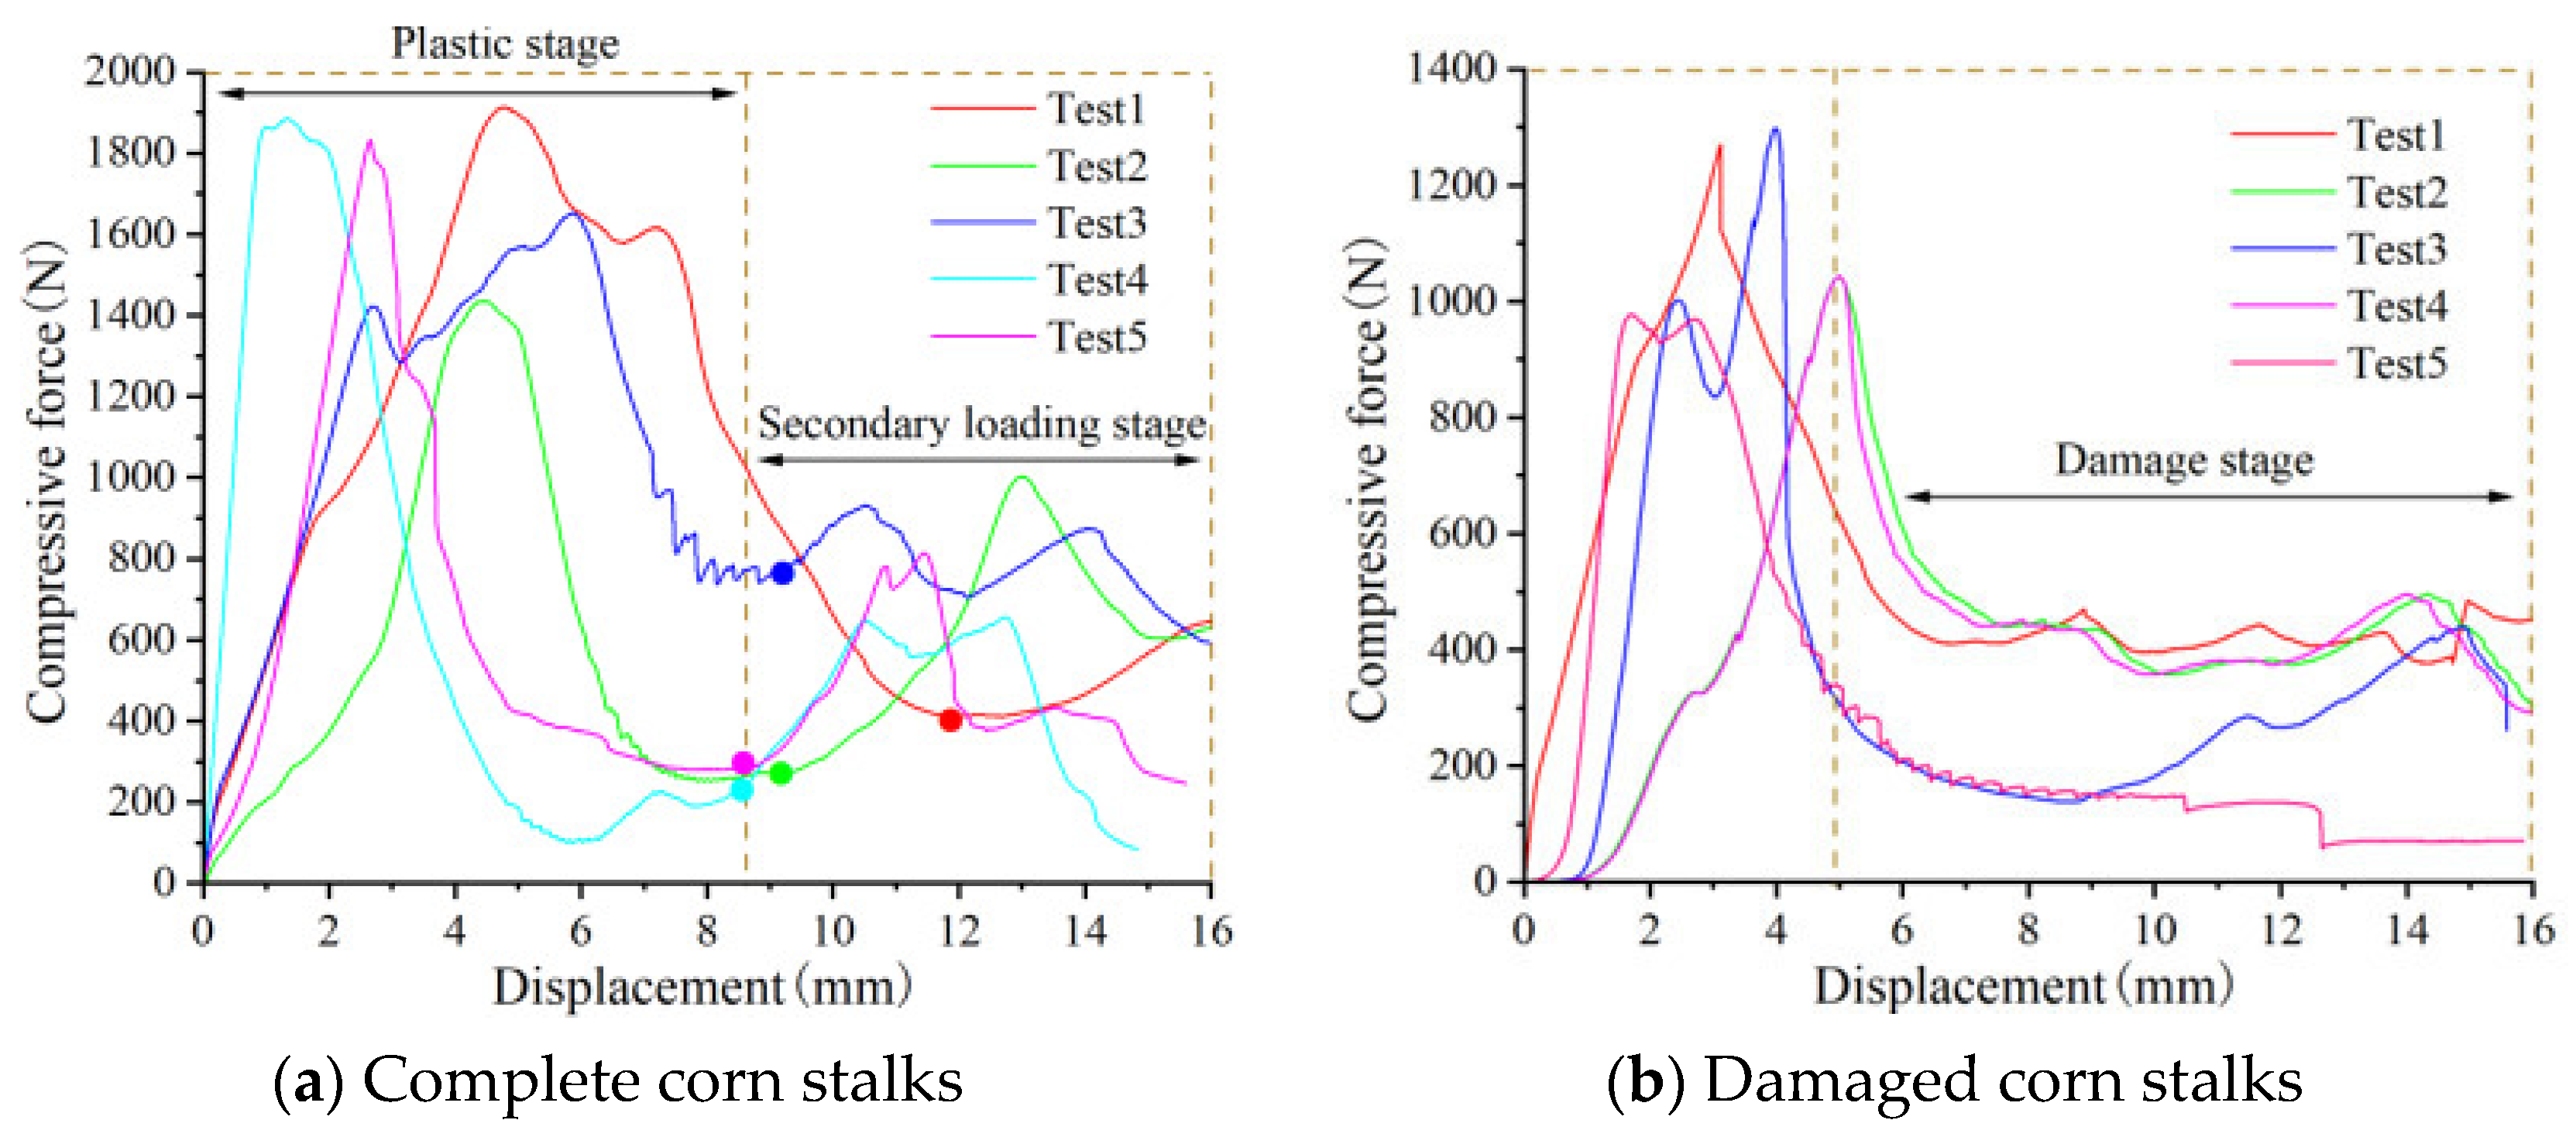
The compression results of the complete corn stalks are shown in Figure 7a. The results show that the average elastic modulus of the corn stalks is 2.35 × 10⁸ pa. It can be concluded that there are obviously two stages during the compression process of the complete corn stalks, which are a plastic stage and a second plastic stage.
During the compression process of stalks, their plastic stage exhibits distinct phased characteristics. When entering the first plastic stage, the compressive force rises sharply within the range of 900 to 1900 N, accompanied by the occurrence of transverse tearing on the stalk epidermis. After the compressive force first rises to a peak and then drops to a minimum value, the second plastic point is reached, which marks the entry of the stalk structure into a stage of further damage. Subsequently, the second plastic stage begins, where the loading displacement reaches 8 to 14 mm, and the compressive force rebounds from 600 N to 1000 N. In this stage, the stalk epidermis is completely torn, showing a state of gradually intensified plastic deformation and structural damage under the action of external forces.
The compression process of the damaged corn stalks is shown in Figure 7b. The average elastic modulus of the damaged corn stalks is 1.68 × 10⁷ pa. It was found that when the damaged corn stalks were compressed, there was no obvious phenomenon of the second plastic stage.
The compression force rises rapidly in the plastic stage. When the compression force reaches 950–1300 N, the skin of the damaged corn stalks shows a transverse tearing phenomenon. It is completely separated from the core. When the loading displacement reaches 7–16 mm, the compression force remains between 150–600 N, and there is no significant change in the compression force. The structure of damaged stalks is incomplete. When the compression force reaches its maximum value, the structure fails. Thus, it fails to form effective secondary support after damage.

3.1.3. Skin Tensile and Core Compression Tests

The core compression force versus displacement curve is shown in Figure 7c. The results show that the elastic modulus of the corn stalk core is 3.55 × 10⁸ pa, and its compression curve exhibits a linear upward trend. When the loading displacement reaches 12 to 16 mm, the compression force increases from 280 to 600 N. The stalk core is compressed into a dense compacted mass. The relationship between displacement and compressive force for the damaged corn stalks is shown in Figure 7d. The results show that the elastic modulus of the skin for corn stalks is 1.41 × 10⁷ pa, and its tensile curve exhibits a linear trend. When the tensile force reaches its maximum value of 1500 to 2000 N, fracture occurs in the stalk. Therefore, it can be concluded that a corn stalk is of linear elastic material.

3.2. Test Results of Angle of Repose

The acquired angle of repose images were processed using the MATLAB 2023a software. The image processing procedure for the angle of repose of mixed corn stalks is illustrated in Figure 8a. The slope of the fitted straight line corresponds to the tangent of the corn stalks’ angle of repose, which is presented in Figure 8b.
Comprehensive analysis of the angle of repose data from physical tests and simulation tests showed that the two sets of data exhibit high consistency and reliability (Table 3). Error analysis further verified the simulation accuracy: the average error value is only 0.54°, with the average error percentage being as low as 1.52%, and the maximum error percentage in a single test is 4.03%, indicating that the overall deviation is controlled at a small level. The RMSE is 0.64°, reflecting extremely small point-to-point deviations; R2 = 0.89 indicates a strong linear correlation between the two sets of data, and the simulation results could reliably predict the physical test results through a linear relationship. The 95% confidence interval confirms that there is no statistically significant difference between the two sets of data. The simulation tests could reproduce the angle of repose characteristics of the physical tests, providing statistical support for the validity of the simulation model.
As shown in Figure 9, a sensitivity analysis was performed on 15 groups of parameter combinations for the two types of stalks, with sensitivity coefficients calculated and classified into different levels. Overall, the sensitivity coefficients fluctuated within the range of 0.42–1.56. According to the classification criteria of “high sensitivity (S > 1)” and “medium sensitivity (0.3 ≤ S ≤ 1)”, among the 15 parameter groups, there were 5 groups of high-sensitivity parameters and 10 groups of medium-sensitivity parameters, with no low-sensitivity parameters. The high-sensitivity parameters are mainly concentrated in the restitution coefficient and static friction coefficient. Minor changes in these parameters will significantly affect the system response, so their accuracy should be prioritized in the experimental design.

3.3. Analysis of Plackett–Burman Test

The Plackett–Burman module in Design-Expert 13.0 was utilized to identify factors that significantly influence the angle of repose. In the PB test, the angle of repose was designated as the test index. Contact parameters between damaged corn stalks were labeled as X1X6, those between damaged and complete corn stalks were labeled as X7X12, and contact parameters between damaged corn stalks were labeled as X13X15. Additionally, four dummy parameters were set, designated as X16X19, as shown in Table 4.
The average value was taken as the final angle of repose of the simulation experiment. The results of the Plackett–Burman test are shown in Table 5.
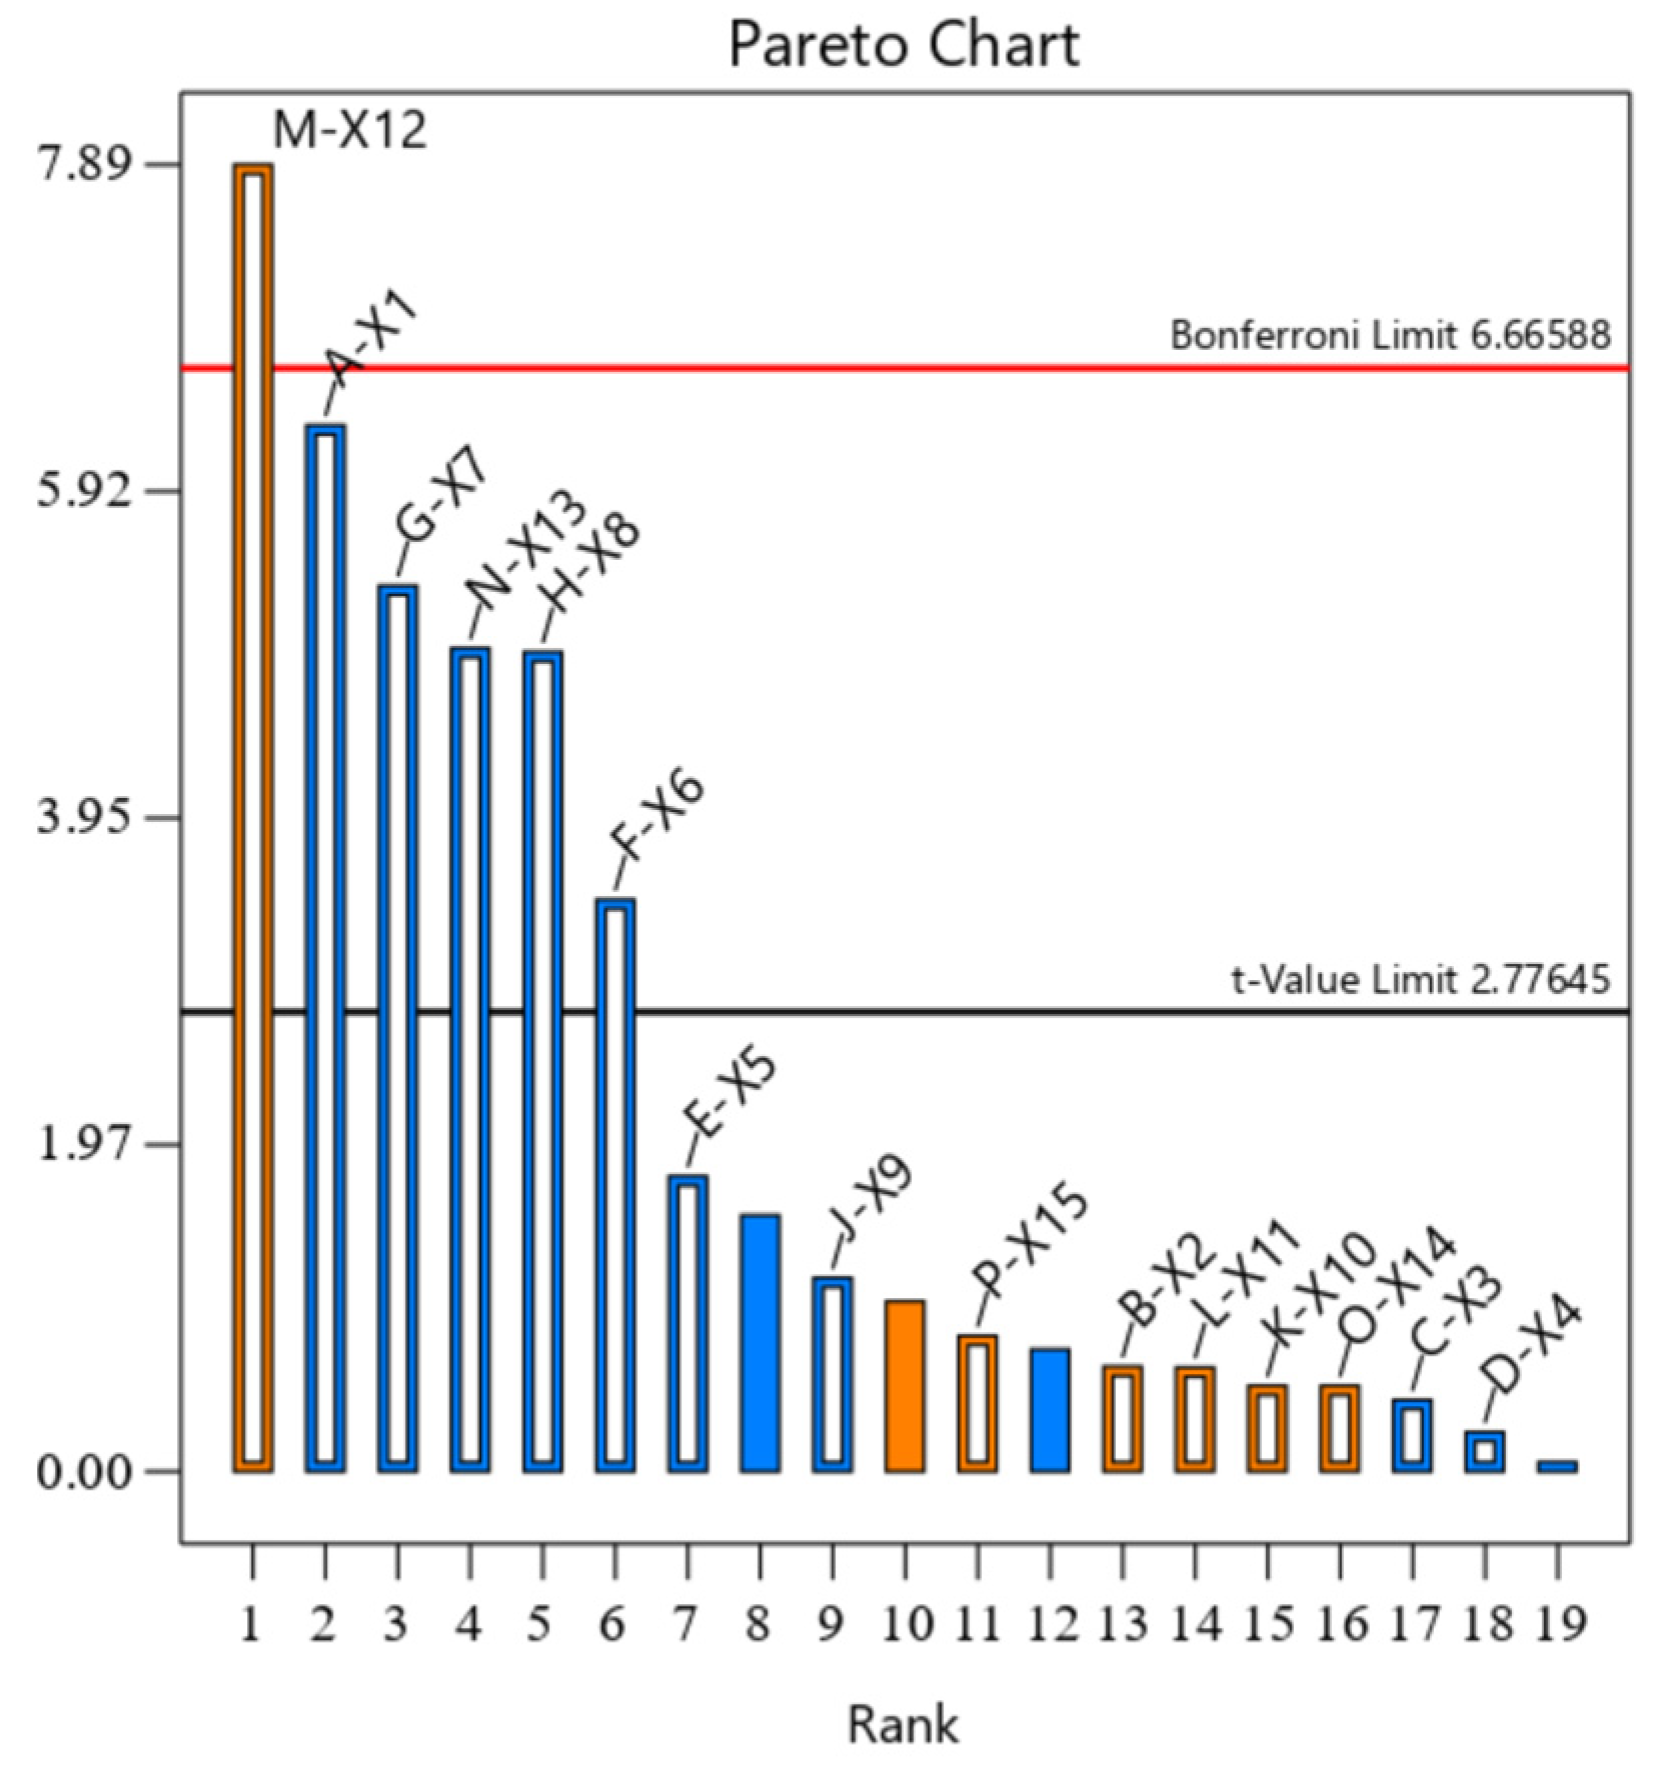
ANOVA was performed with Design-Expert 13.0 to determine the impact effects of each parameter, as presented in Table 6. The findings indicate that p < 0.05 and the coefficient of determination is R2 = 0.9803, demonstrating that the model is significant and can effectively forecast the variation trends of how each factor affects the angle of repose. Figure 10 illustrates the significance of factors influencing β1, which are X12, X1, X7, X13, X8, and X6. Among these, X12 exerts a positive effect on β1, while X12, X1, X7, X13, X8, and X6 exert negative effects; notably, X12 has a highly significant impact on β1.
Based on the Plackett–Burman stacking test, three parameters with significant influence were selected through the steepest ascent test. The relative error between the simulated and experimental angles of repose was used as an evaluation indicator to ascertain the optimal range of the test parameters. The calculation of the relative error between the simulated value and the physical value is shown in Equation (9), and the test results are presented in Table 6.
Z = β 1 θ 1 θ 1 × 100 %
Z is the relative error. β1 is the angle of repose obtained from the simulation test (°), and θ1 is the angle of repose obtained from the physical test (°).

3.4. Analysis of the Steepest Ascent Test for Contact Parameters

The steepest ascent test plan and results regarding contact parameters are presented in Table 7. As the levels of the three experimental factors increase gradually, the maximum relative error stands at 17.97%, and the minimum relative error is 3.63%.

3.5. Box–Behnken Experimental Analysis

The experimental design was conducted using Design-Expert 13.0, which composed of 17 simulation trials. The experimental design and results are shown in Table 8.
After excluding factors that do not significantly influence β1, the regression model was optimized and adjusted to obtain a revised regression model, as shown in Equation (10).
Y 1 = 34.8 + 3.49 A + 1.58 B + 0.4837 C + 0.845 A B 0.35 A C 0.4425 B C + 0.2248 A 2 1.45 B 2 0.5528 C 2
The ANOVA results of the regression model after optimization are shown in Table 9. It can be seen that p < 0.0001, which indicates that the relationship between the various parameters of the model and the response value is extremely significant. The lack-of-fit p value is 0.4431 > 0.05, which indicates that the model fits well. The coefficient of determination (R2) is 0.9848. The adjusted coefficient of determination (R2adj) is 0.9651, which indicates that the fitted equation has a high degree of reliability.
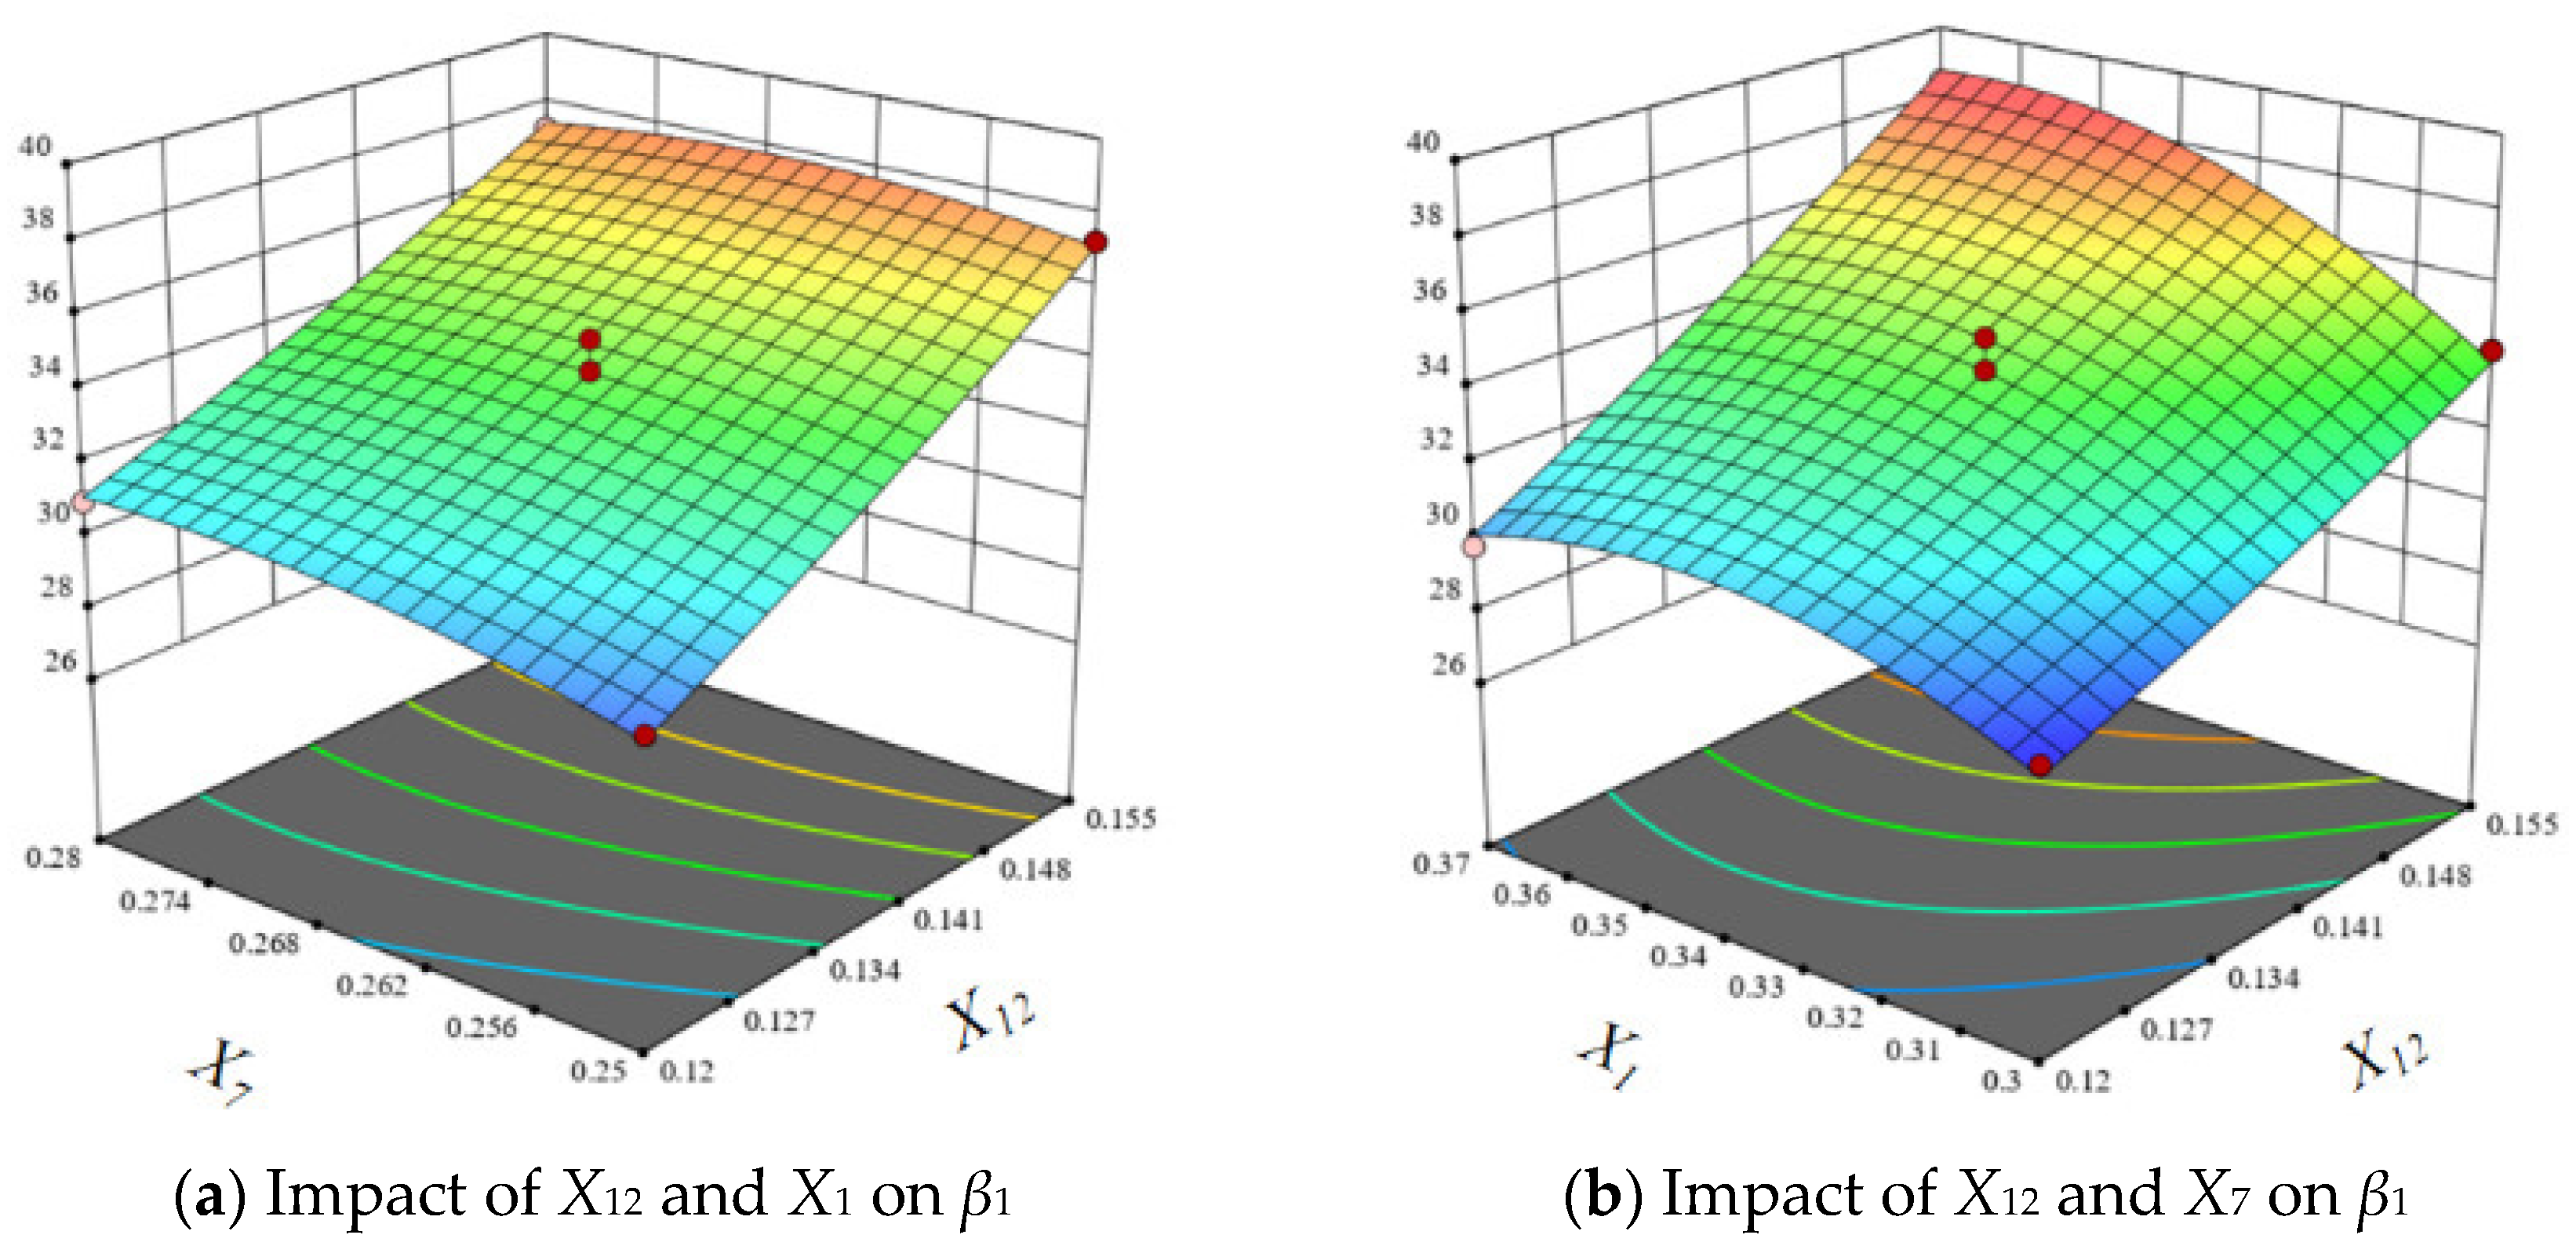
The results of the response surface analysis are shown in Figure 11. It was found that β1 increases with an increasing X12, as shown in Figure 11a,b. It was found that β1 first increases and then decreases as X1 increases, as shown in Figure 11a. It was found that β1 increases steadily as X7 increases, as shown in Figure 11b. It was found that β1 increases significantly with an increasing X12. Considering the two response surfaces, X12 exerts a significant influence on the results, and as X12 increases, the value of β1 increases significantly. This is consistent with the significance results shown in Figure 9 and the ANOVA results shown in Table 9.
The optimization module within the Design-Expert software was used to solve the regression equation. Taking the average value of θ 1 was regarded as the target value, and the optimal parameter combination was subsequently derived. When X12 is 0.137, X1 is 0.33, X7 is 0.266, and then β1 is 33.75°.

3.6. Simulation of Axial Compression of Corn Stalks

3.6.1. Axial Compression Simulation of Complete Corn Stalks

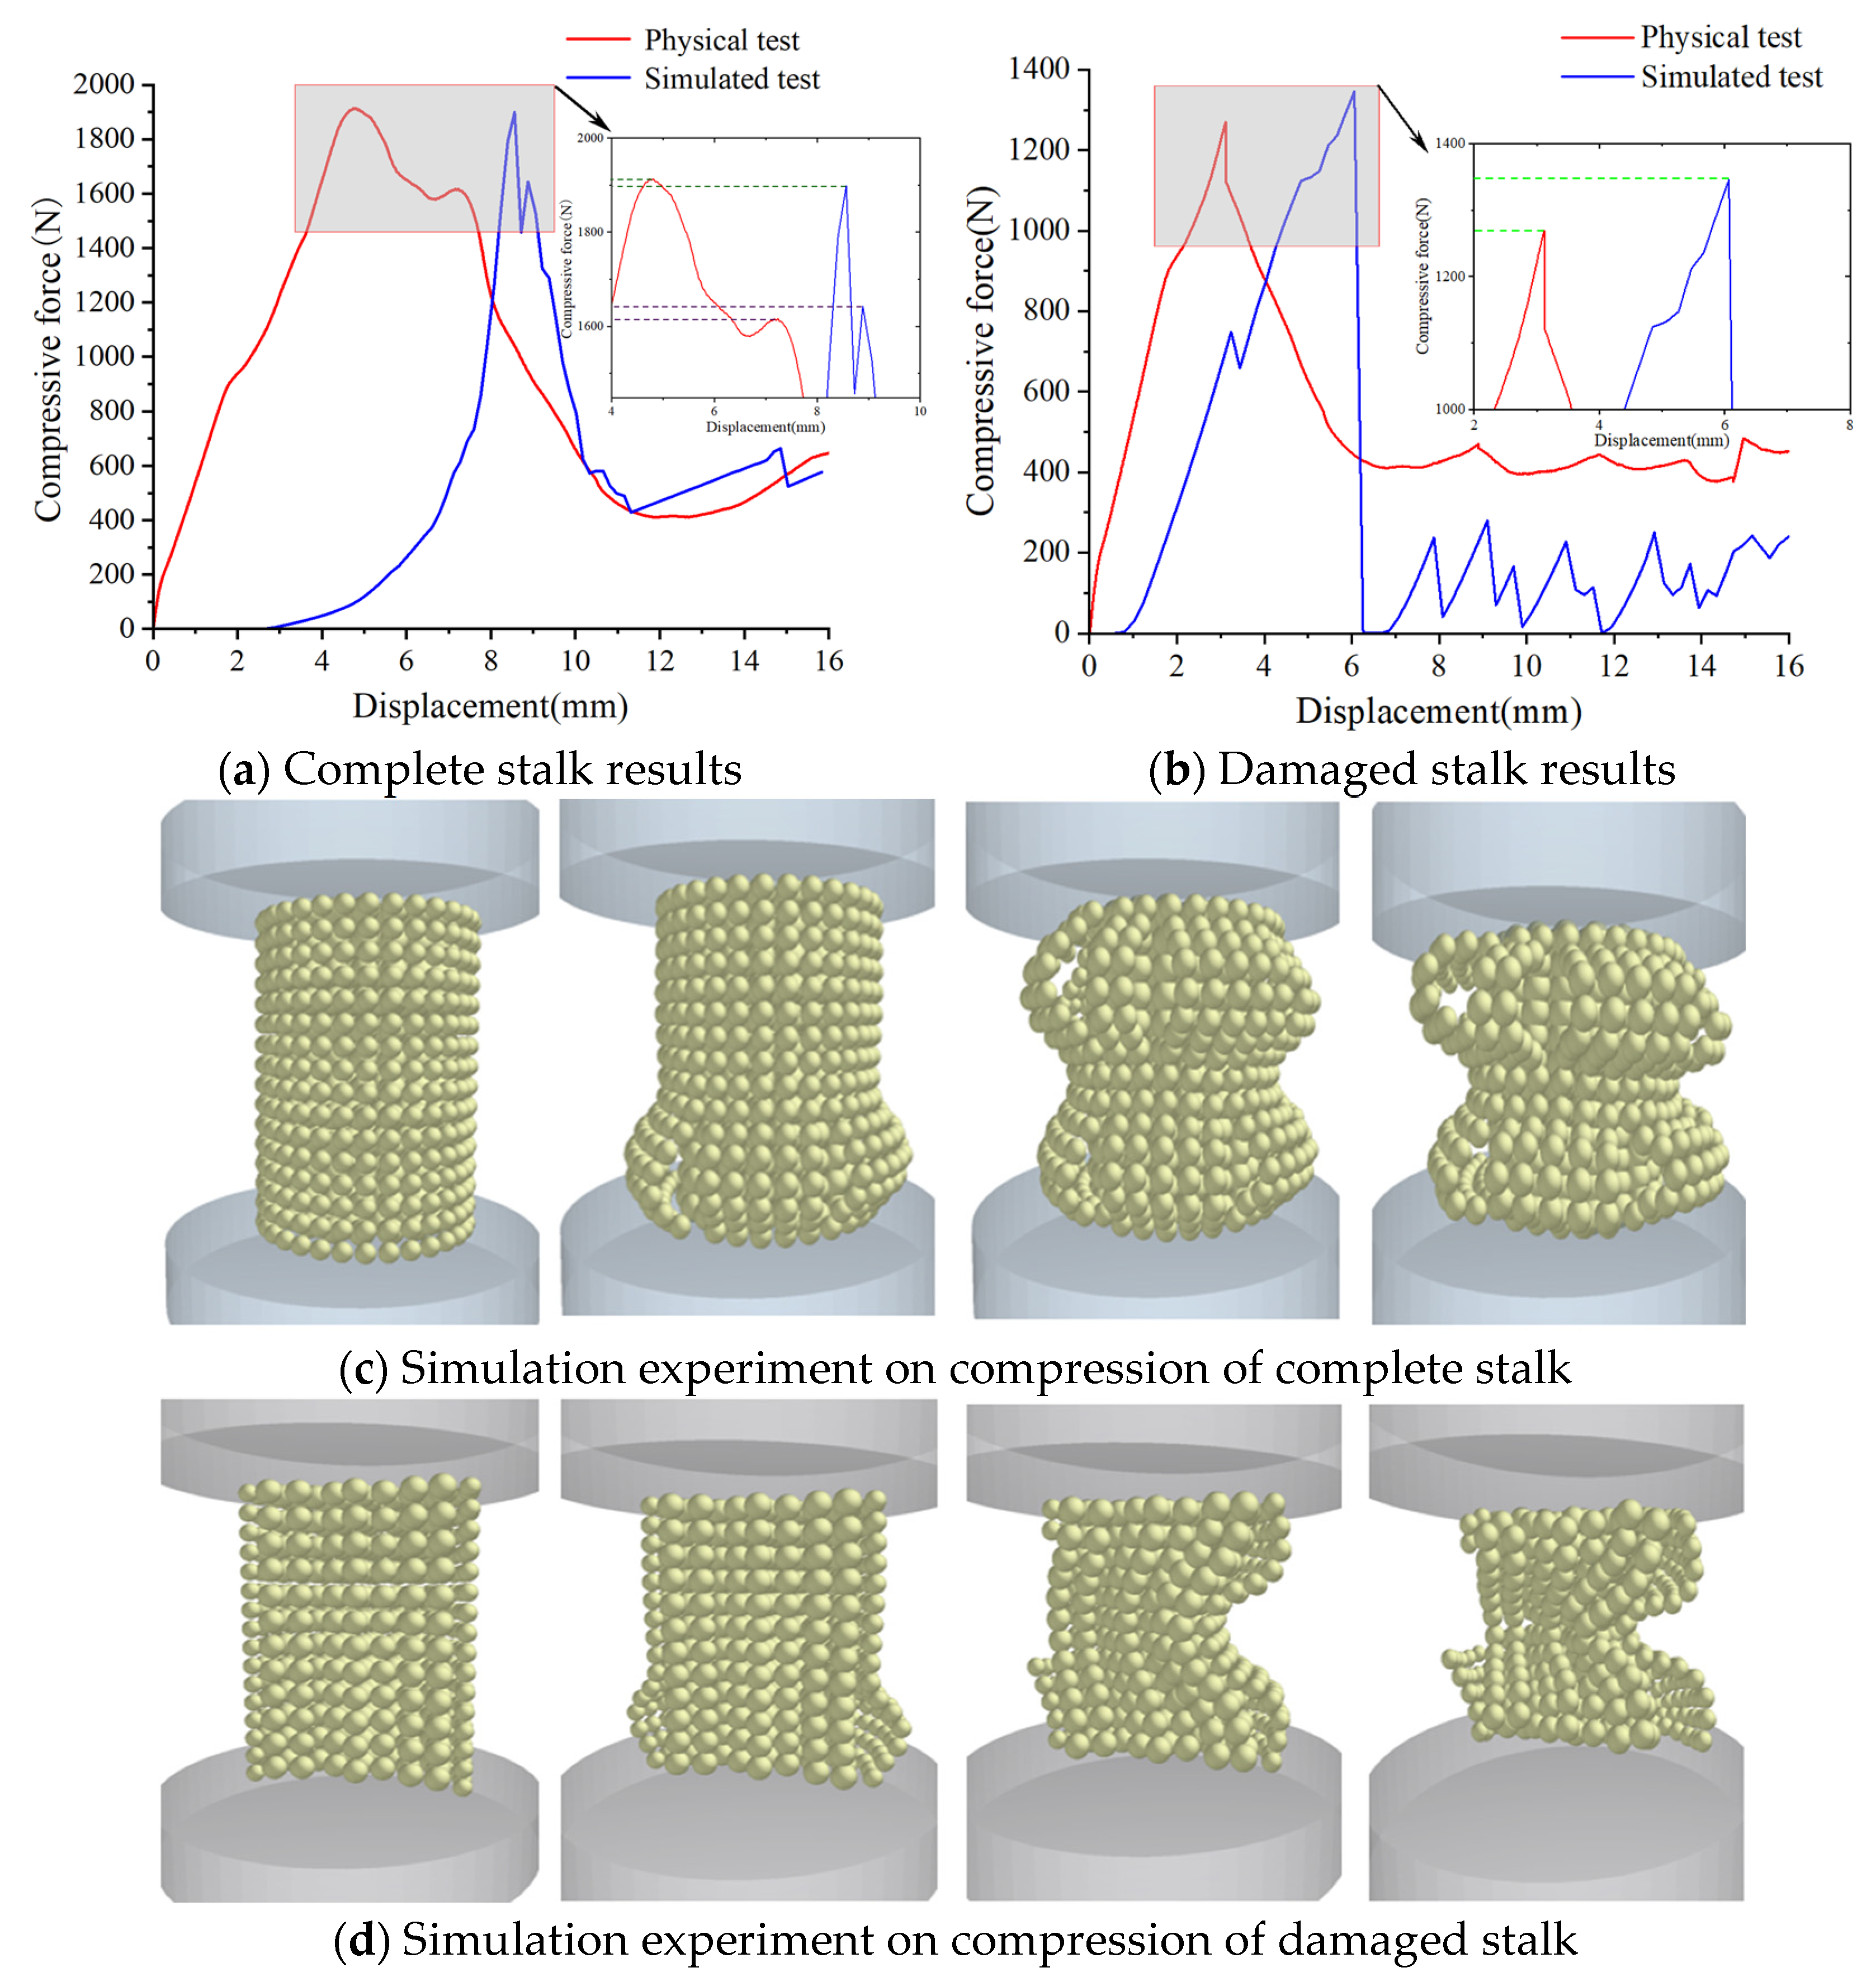
Figure 12a shows the force–displacement curve of the complete corn stalks. The maximum compressive force of the complete corn stalks obtained from the simulation is 1899.28 N, with a relative error of 9.28% compared to the average value from the experiments. Figure 12c shows the axial compression simulation diagram of the complete corn stalks. It was determined that horizontal cracks emerge in the upper and lower parts of the complete corn stalks, followed by the phenomenon of skin and core separation. The compressive force when the leather core separates is 1643.47 N, with a relative error of 2.1% compared to the average value from physical experiments. The DEM model for corn stalks is capable of accurately capturing the relationship between compressive force and displacement.

3.6.2. Axial Compression Simulation of Damaged Corn Stalks

Figure 12b shows the force–displacement curve of the damaged corn stalks. The maximum compressive force of the damaged corn stalks is 1345.77 N, with a relative error of 14.74% compared to the experiments. Figure 12d is an axial compression simulation diagram of the damaged corn stalks. It can be seen that the damaged corn stalks underwent lateral bending on one side, followed by central fracture. The DEM model of corn stalks can accurately reflect the relationship between compressive force and displacement. The compression curves of the two stalk types reveal that the trends of the two curves are essentially identical, with both first increasing, reaching a peak, and then decreasing. Both exhibit peaks within a similar displacement range, which reflects the consistency of their mechanical responses.

3.7. Simulation of Radial Compression of Corn Stalks

3.7.1. Radial Compression Simulation of Complete Corn Stalks

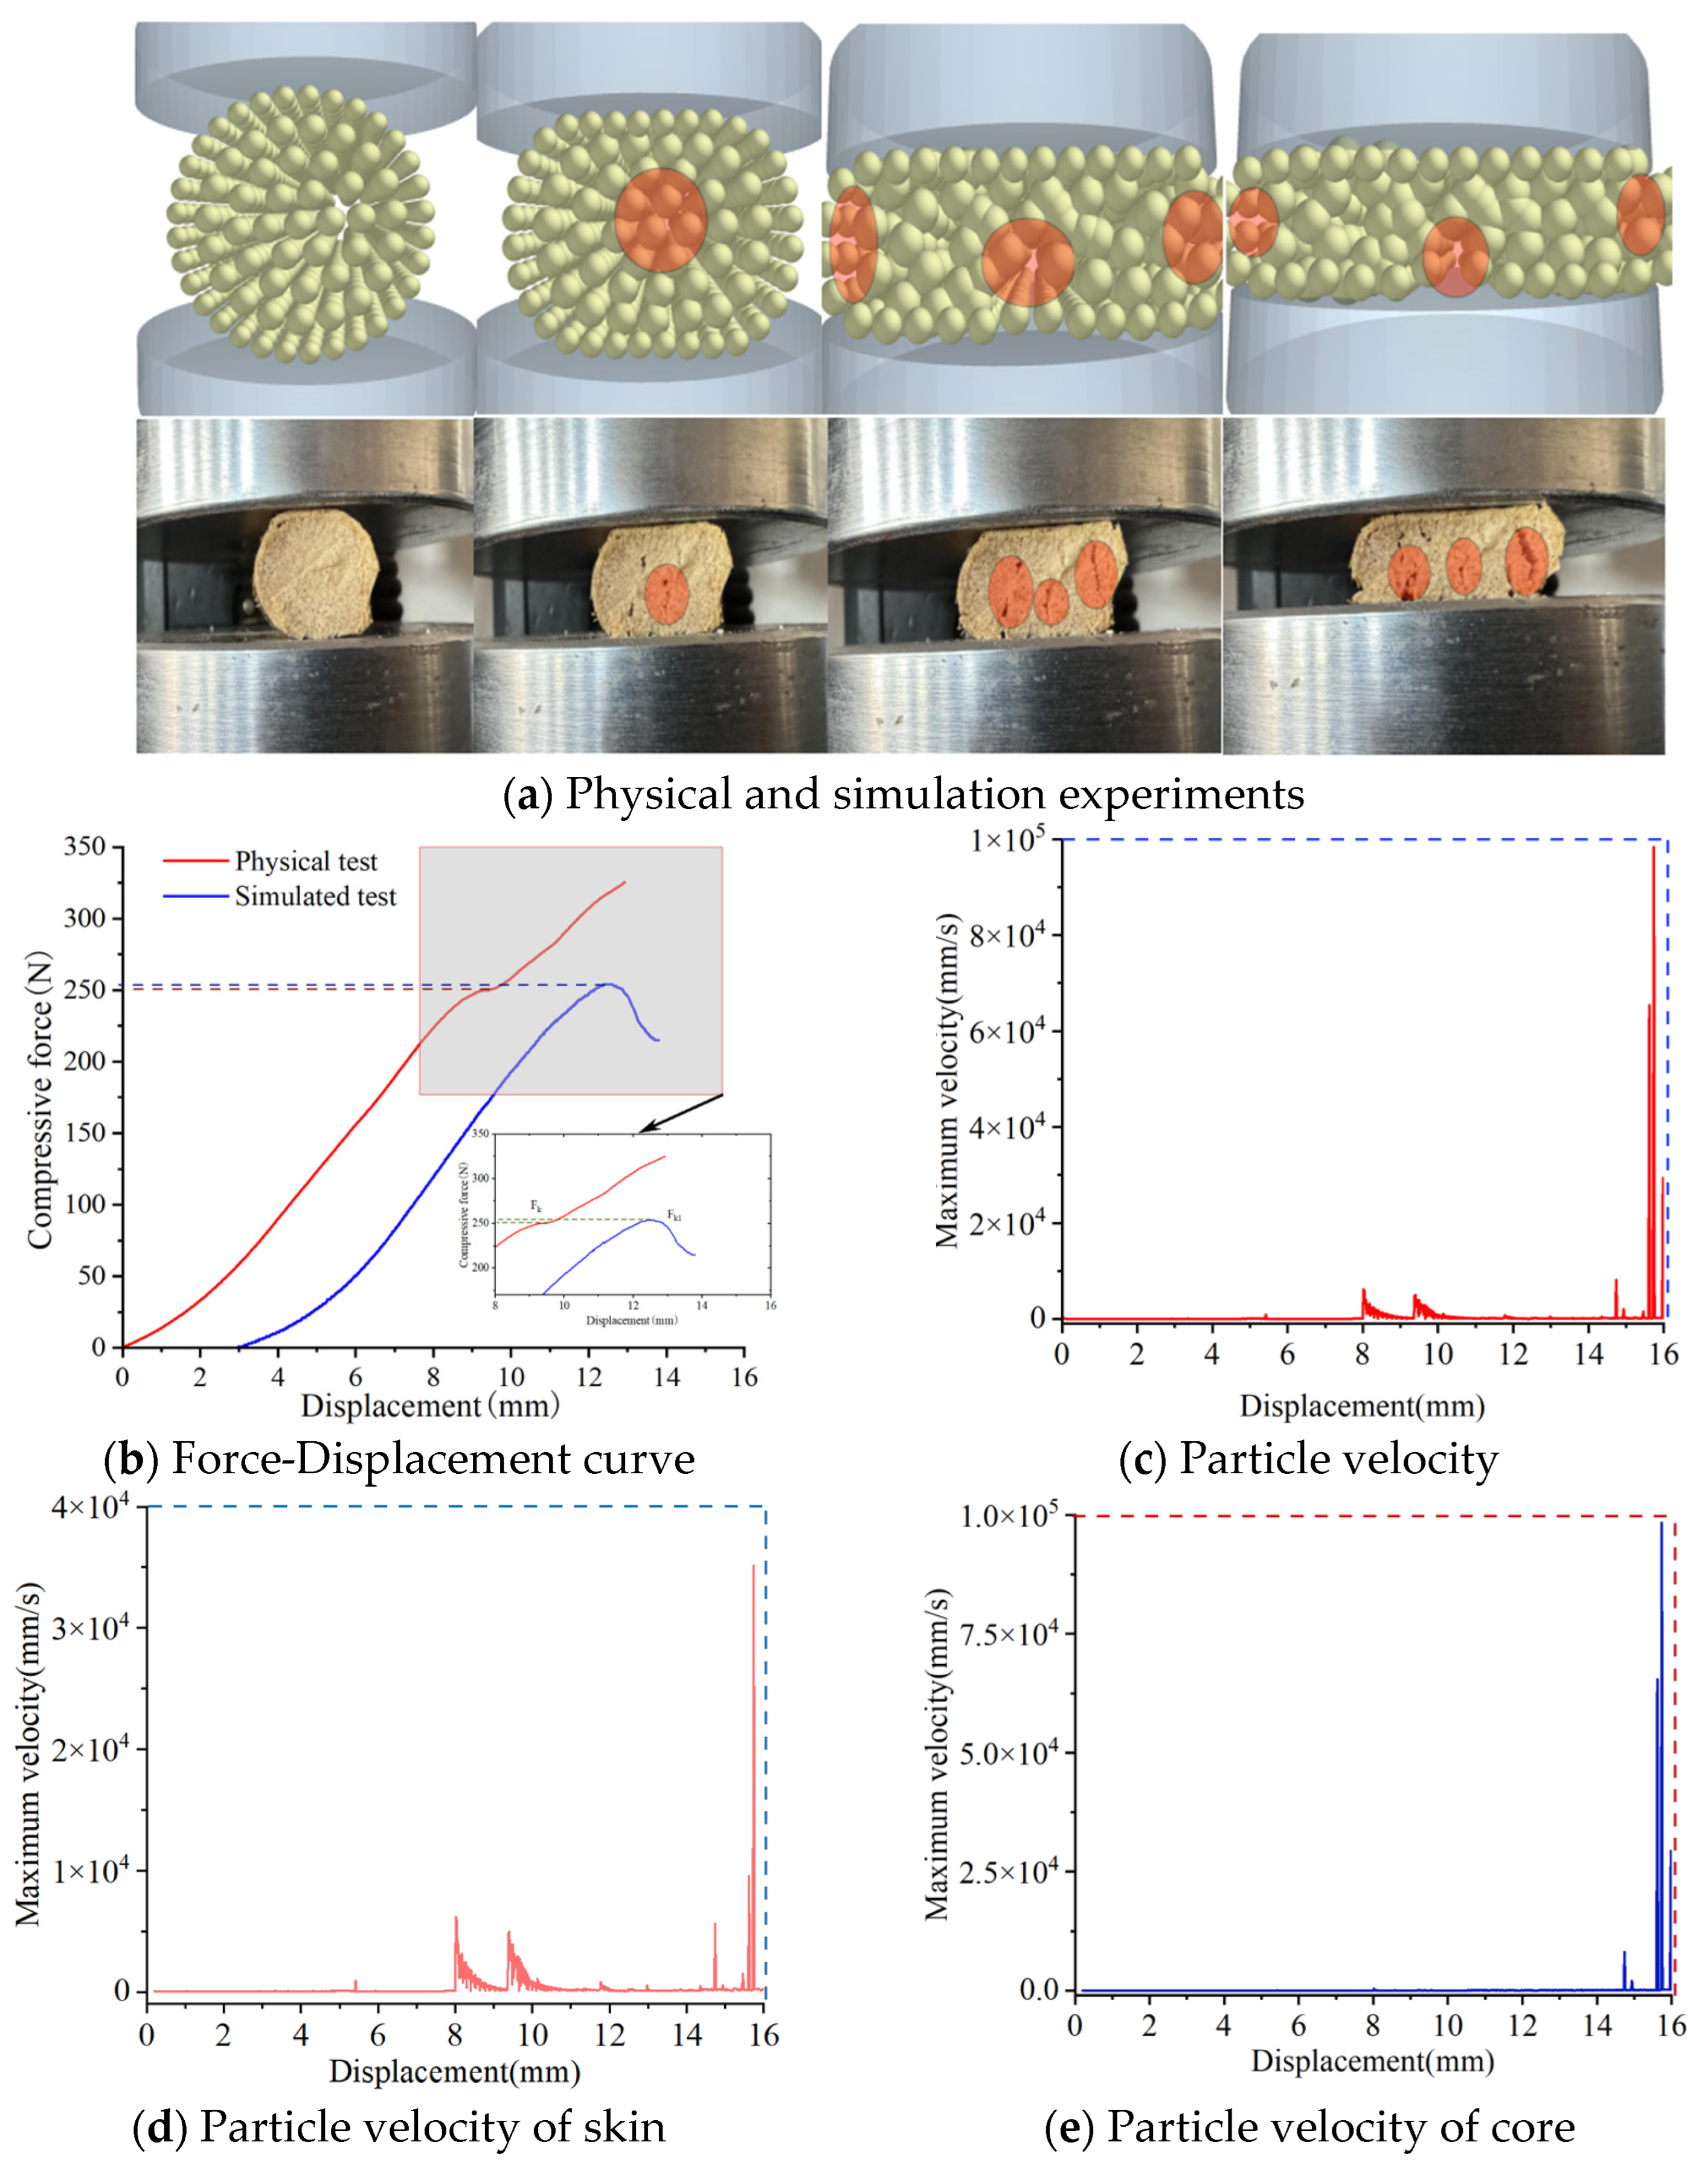
Figure 13a depicts the compression processes in both the physical experiments and simulations. The results indicate that as the compression displacement increases, longitudinal cracks first emerge, with the cracked areas located on the middle sides of the core part. Eventually, the complete corn stalks fractured. Figure 13b presents the radial compression force–displacement curves from both the simulations and physical tests for the complete corn stalks. The average maximum compressive force in the experiment is 250.36 N, while the maximum compressive force obtained from the simulation is 254.11 N, with a relative error of 1.5% compared to the experimental average, as shown in Table 10. These results demonstrate that the changing trends of the two curves are essentially consistent, and the complete corn stalk model can accurately reflect the relationship between compressive force and displacement.
Analysis of the model fitting effect shows that the root mean square error (RMSE) is 9.21 N, as shown in Table 10, indicating a small average deviation between the simulated values and measured values with high overall agreement. The coefficient of determination, R2 = 0.97, is close to 1, suggesting that the model has an excellent ability to capture the mechanical response of complete stalks. The average error percentage is 1.55%, verifying the reliability of the error description. The calculated 95% confidence interval is from −1.23% to 4.33%; this interval contains 0 and has a narrow range, indicating no systematic bias and good stability of errors.
Figure 13c shows the maximum velocity of particles. Figure 13d shows the maximum velocity of skin particles. Figure 13e shows the maximum velocity of core particles. When the compression displacement is 15.84 mm, the maximum velocity of the skin of complete corn stalks is 3.51 × 104 mm/s. The maximum velocity of the core of complete corn stalks is 9.83 × 104 mm/s.
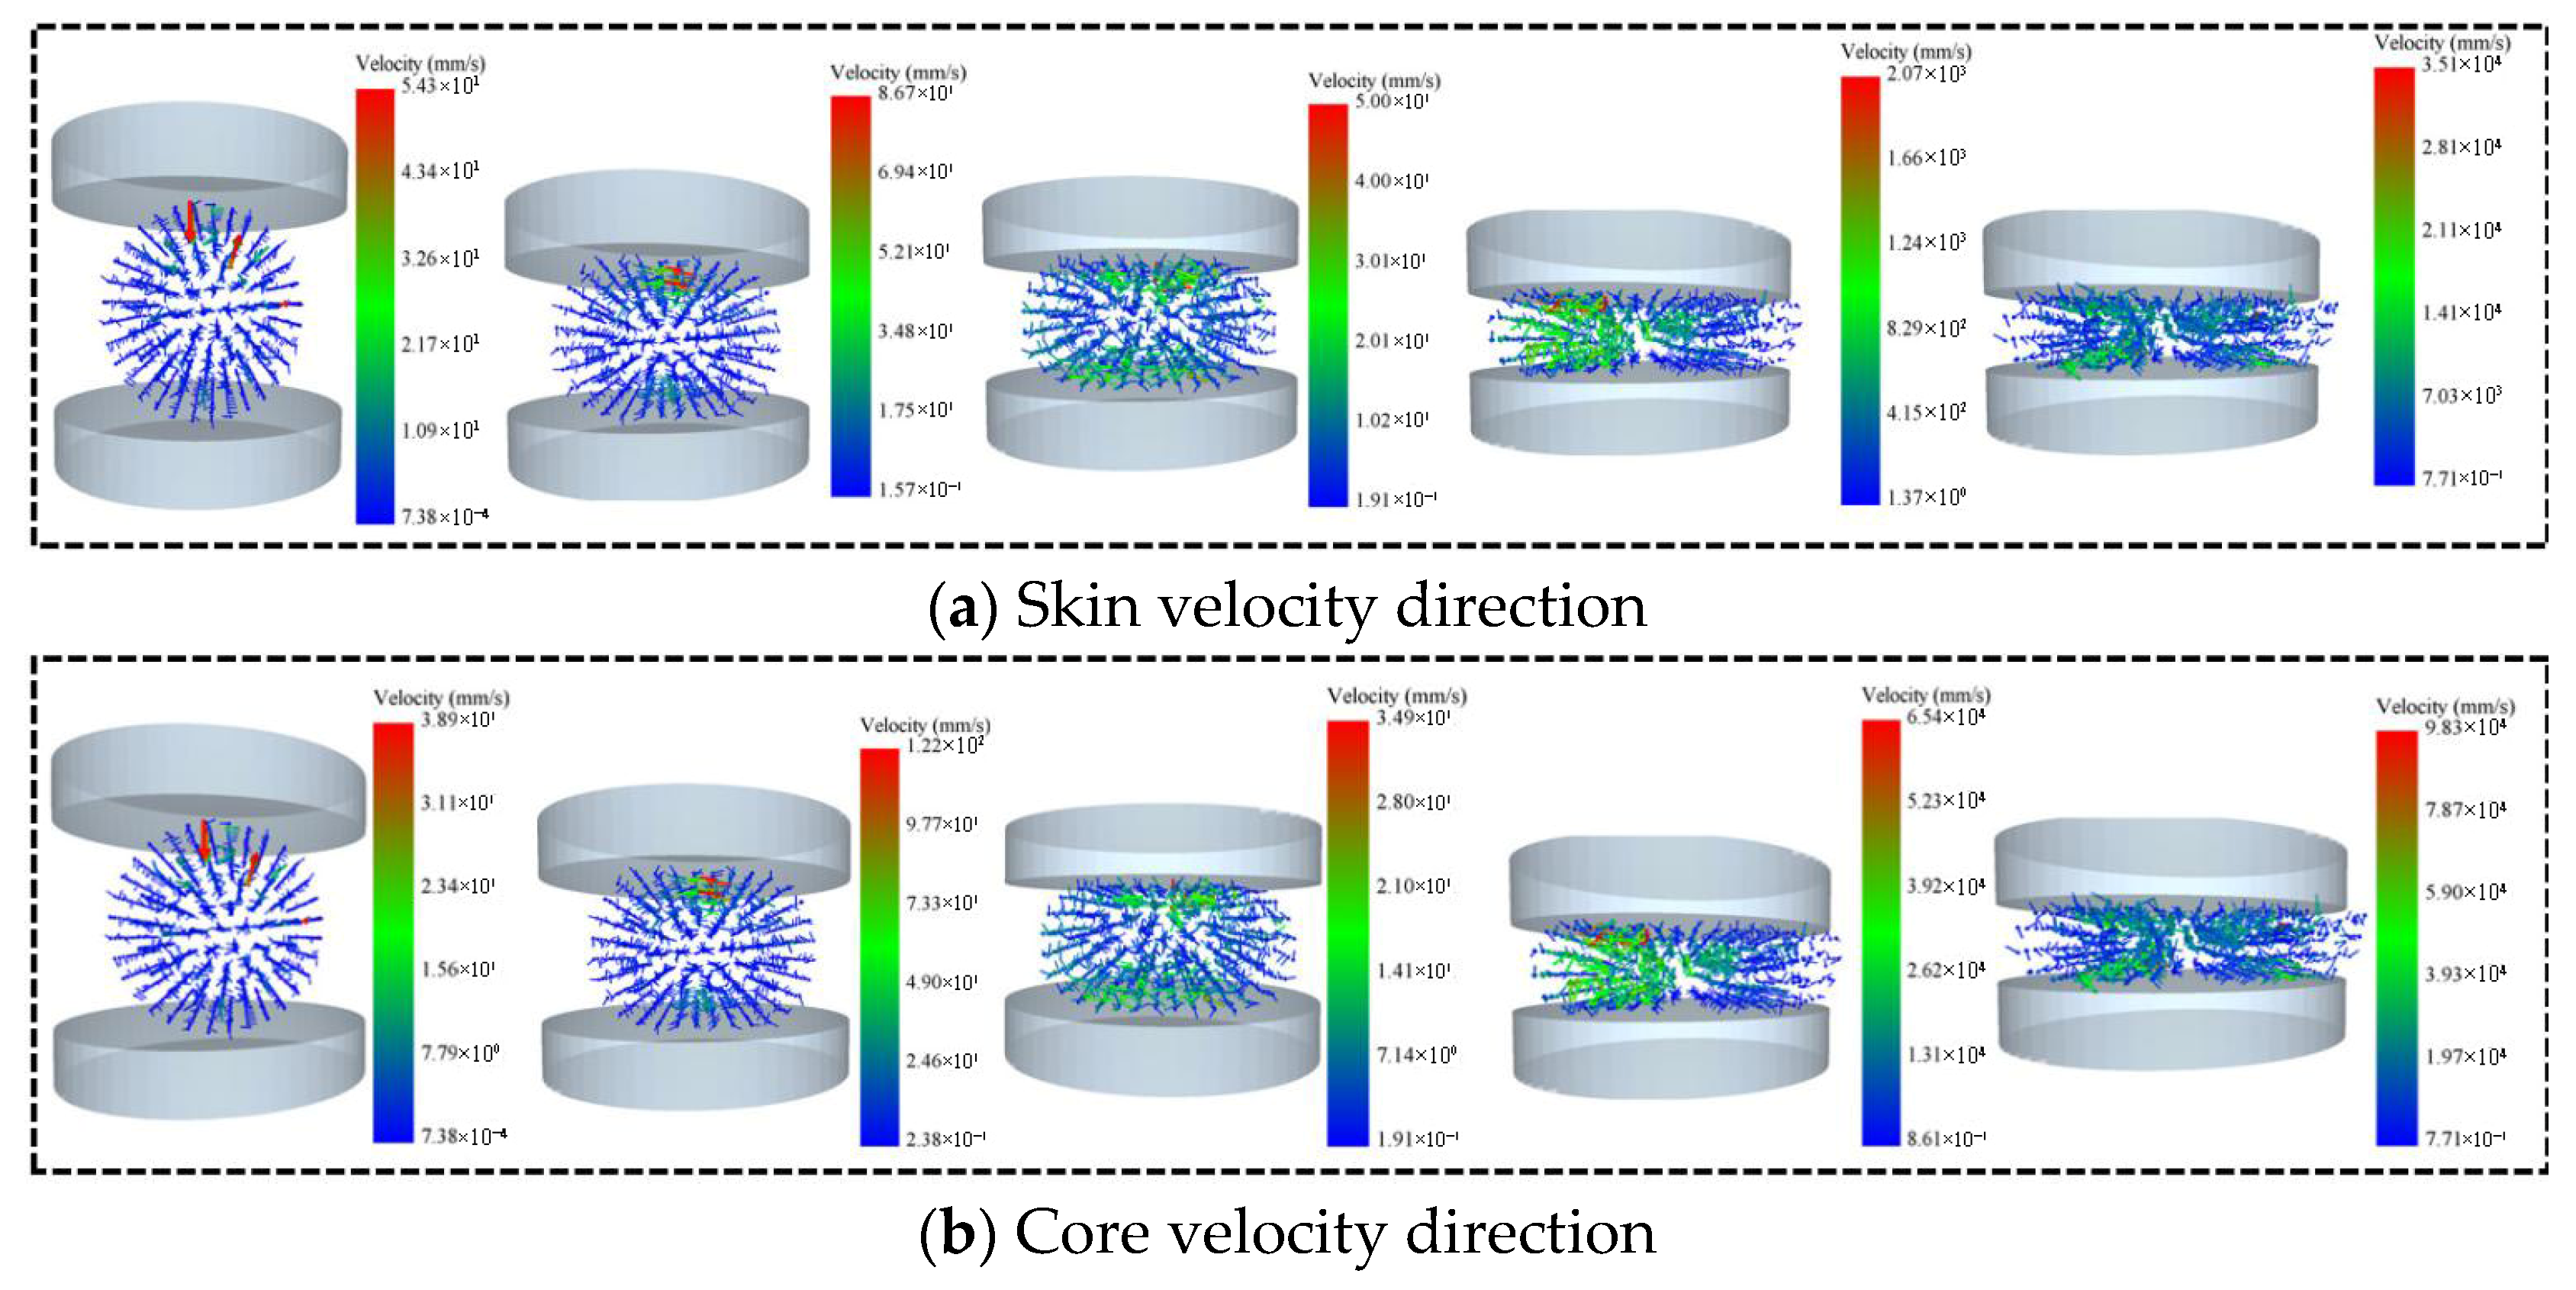
The direction of the radial compression velocity of the skin is shown in Figure 14a. Figure 14b shows the direction of the radial compression velocity of the core. It can be seen that during the initial stage of compression, the velocity direction of the complete corn stalks is directed toward the central region. As the loading displacement increases, the velocity direction at the loaded position of the stalk shifts. The maximum velocity of the outer skin is 3.51 × 104 mm/s when the speed of the core is 9.83 × 104 mm/s. When compression starts, the velocity of stressed stalk particles increases. When the complete stalks develop cracks, the particle velocity decreases, accompanied by a phenomenon of local velocity concentration that diverges to both sides. When the complete stalks are compressed into a clump, the particle concentration causes a sharp increase in particle velocity.
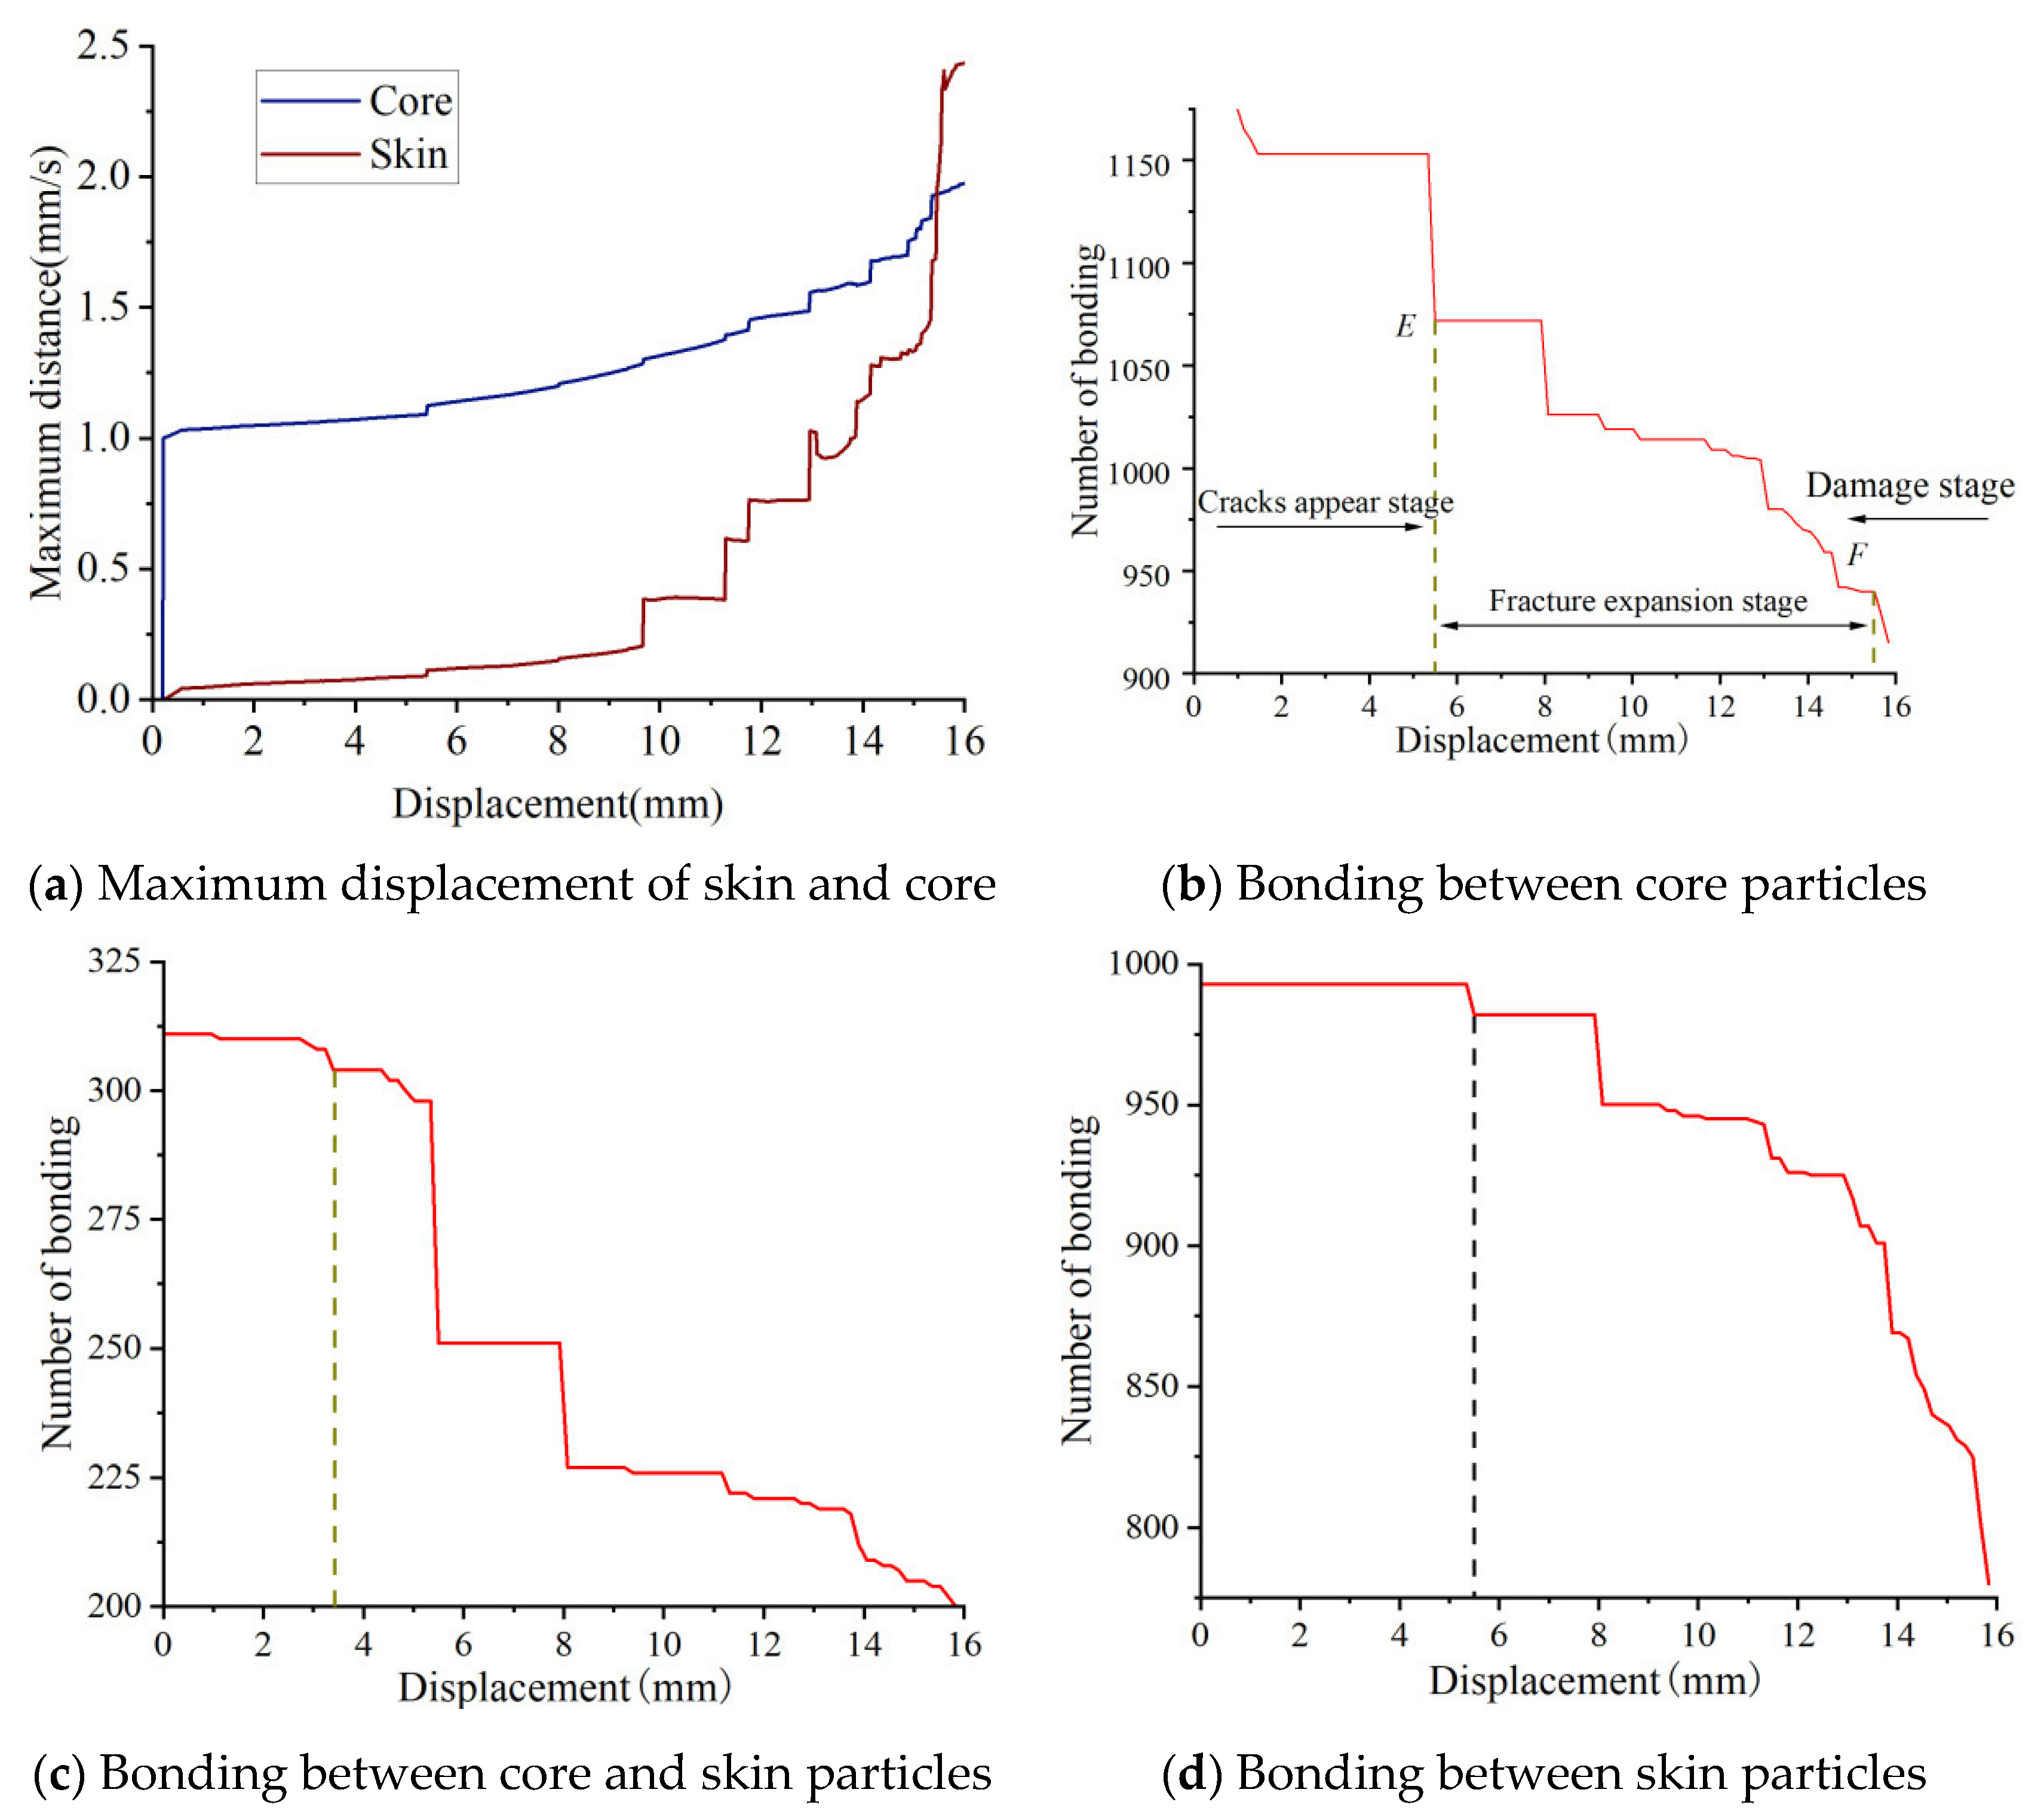
The maximum displacement curve of skin particles during the compression of the complete corn stalks is shown in Figure 15a. It can be seen that at a compression displacement of 15.85 mm, the maximum displacement of the skin particles is 1.96 mm. It can be seen that the maximum displacement of the core particles is 2.43 mm with a compression displacement of 15.94 mm.
Figure 15b illustrates the changes in the number of bonds among the core particles during the radial compression of the complete corn stalks. For the behavior of crack occurrence, key time points were selected to measure crack lengths and calculate areas, which were synchronously verified with the diagrams of particle number changes. It can be observed that as the compression displacement increases, the number of bonds decreases slightly before point E. Crack initiation occurs at point E, where the number of bonds is 1072. The crack propagation stage spans from point E to point F, during which the number of bonds drops from 1072 to 940. After point F, the stalk is fully crushed, and the number of bonds reaches a minimum of 928.
Figure 15c shows the variation in bonds between core and skin particles. When the compression displacement is 5.5 mm, the number of bonds among the core particles decreases by 105, while the number of bonds among the core and skin particles decreases by 60. At this point, cracks form in the core, and partial separation occurs among the core and skin tissues. When the compression displacement reaches 8.28 mm, cracks in the skin are observed, as shown in Figure 15d.
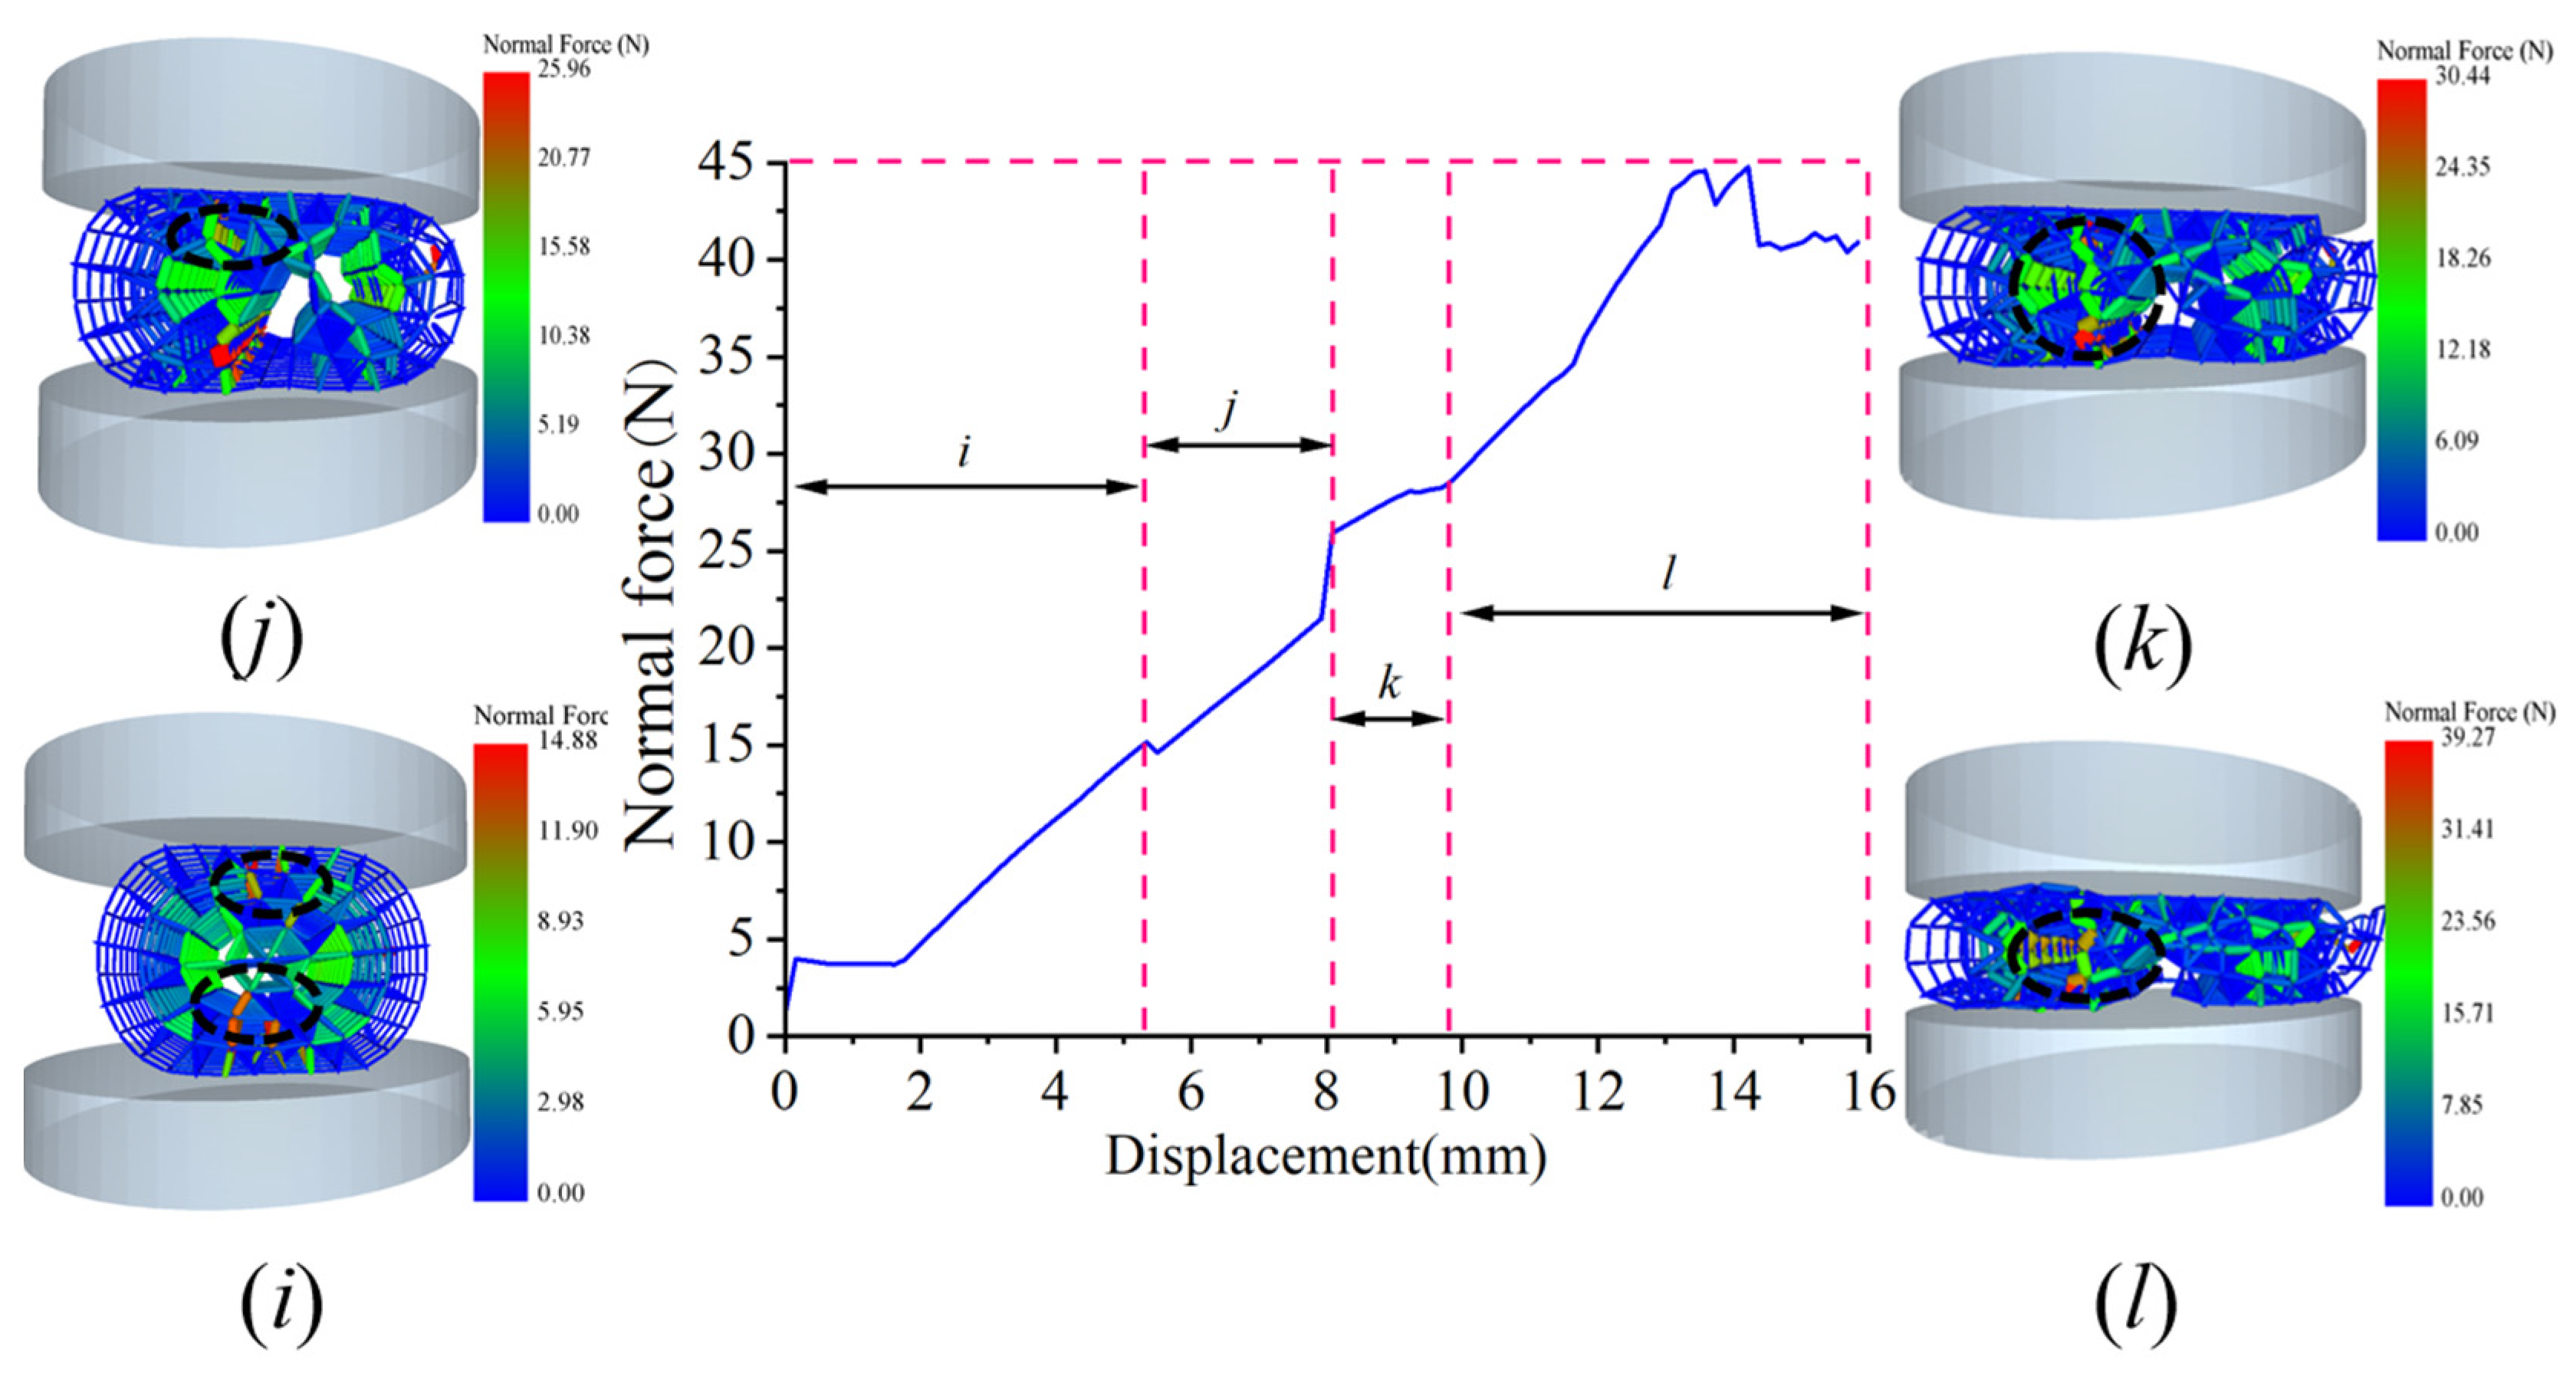
Figure 16 shows the normal force distribution of the skin and core during the radial compression of the complete corn stalks. The stalk fracturing process is divided into four stages: i, j, k, and l. The interval from 0 to 5.24 mm is defined as the vertical fracturing stage (stage i), where the normal force ranges from 0 to 14.88 N, with the maximum normal force in this stage found in the third-layer area of the core. The interval from 5.24 to 8.12 mm is classified as the upper- and lower-part fracturing stage (stage j), with normal forces ranging from 14.88 to 25.96 N; here, the maximum normal force is situated in the area connecting the two transverse fracturing regions. The interval from 8.12 to 9.86 mm is referred to as the skin–core separation stage (stage k), where normal forces range from 25.96 to 30.44 N, and the maximum normal force is located in the area connecting the core and skin. The interval from 9.86 to 16 mm is identified as the complete fracturing stage (stage l), with normal forces ranging from 30.44 to 39.27 N, and the maximum normal force in this stage is found at the center of the stalk. When the compression displacement reaches 14.54 mm, the maximum normal force in stage i is 44.8 N.
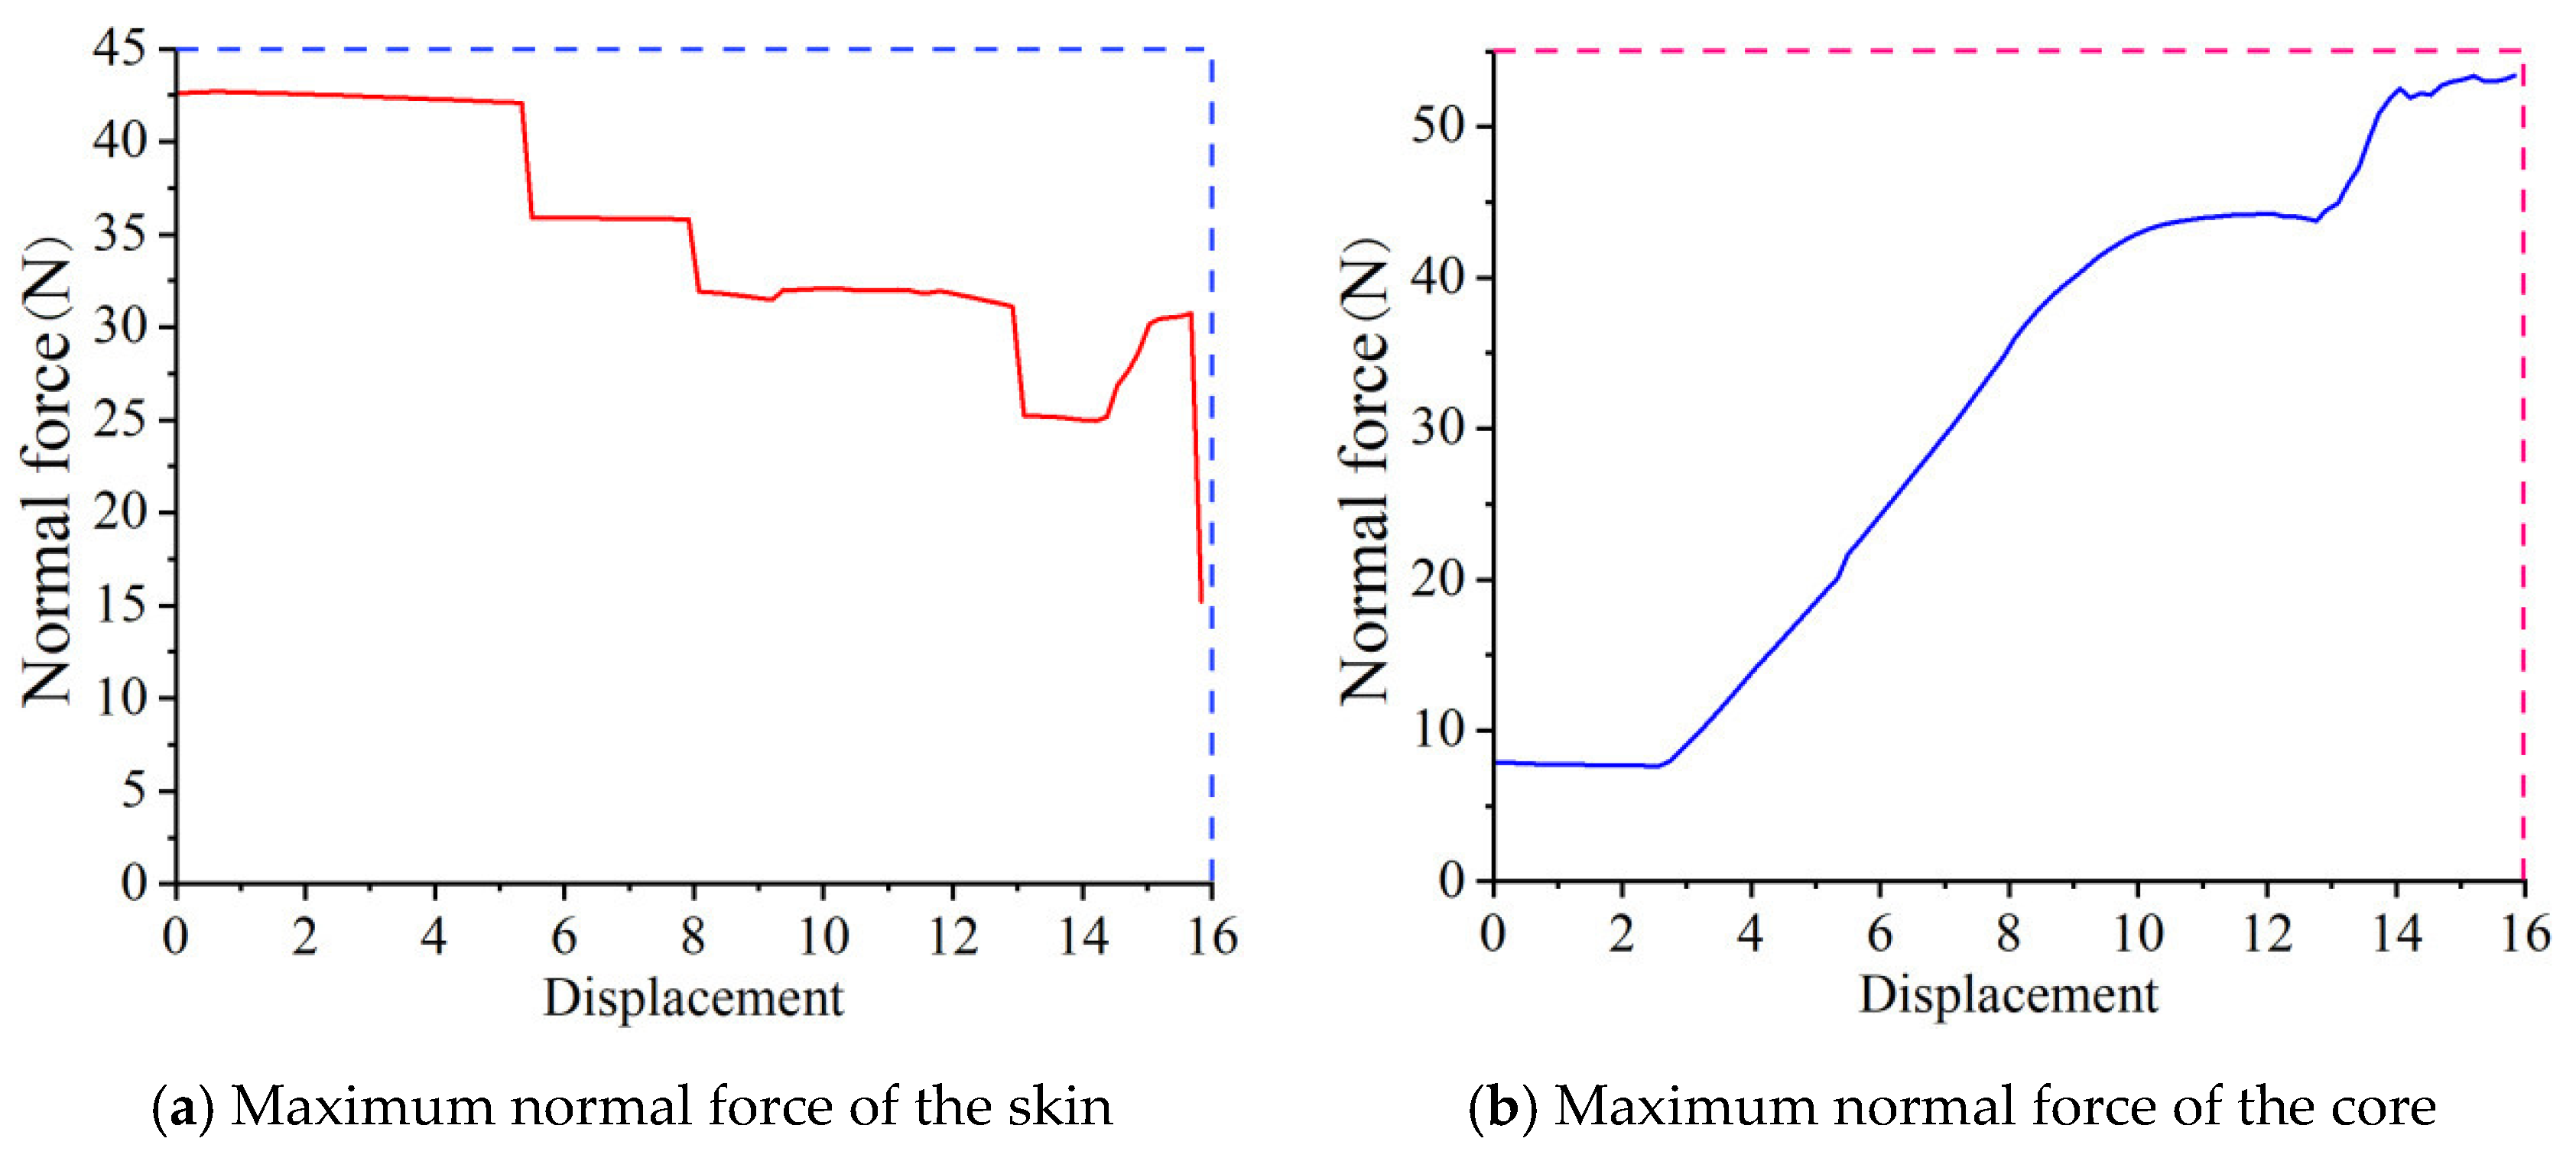
When the compression displacement of the skin is 0.64 mm, the normal force among the skins peaks at 42.69 N, as illustrated in Figure 17a. The normal force among the cores reaches a maximum of 53.39 N at a compression displacement of 15.96 mm, which is shown in Figure 17b.
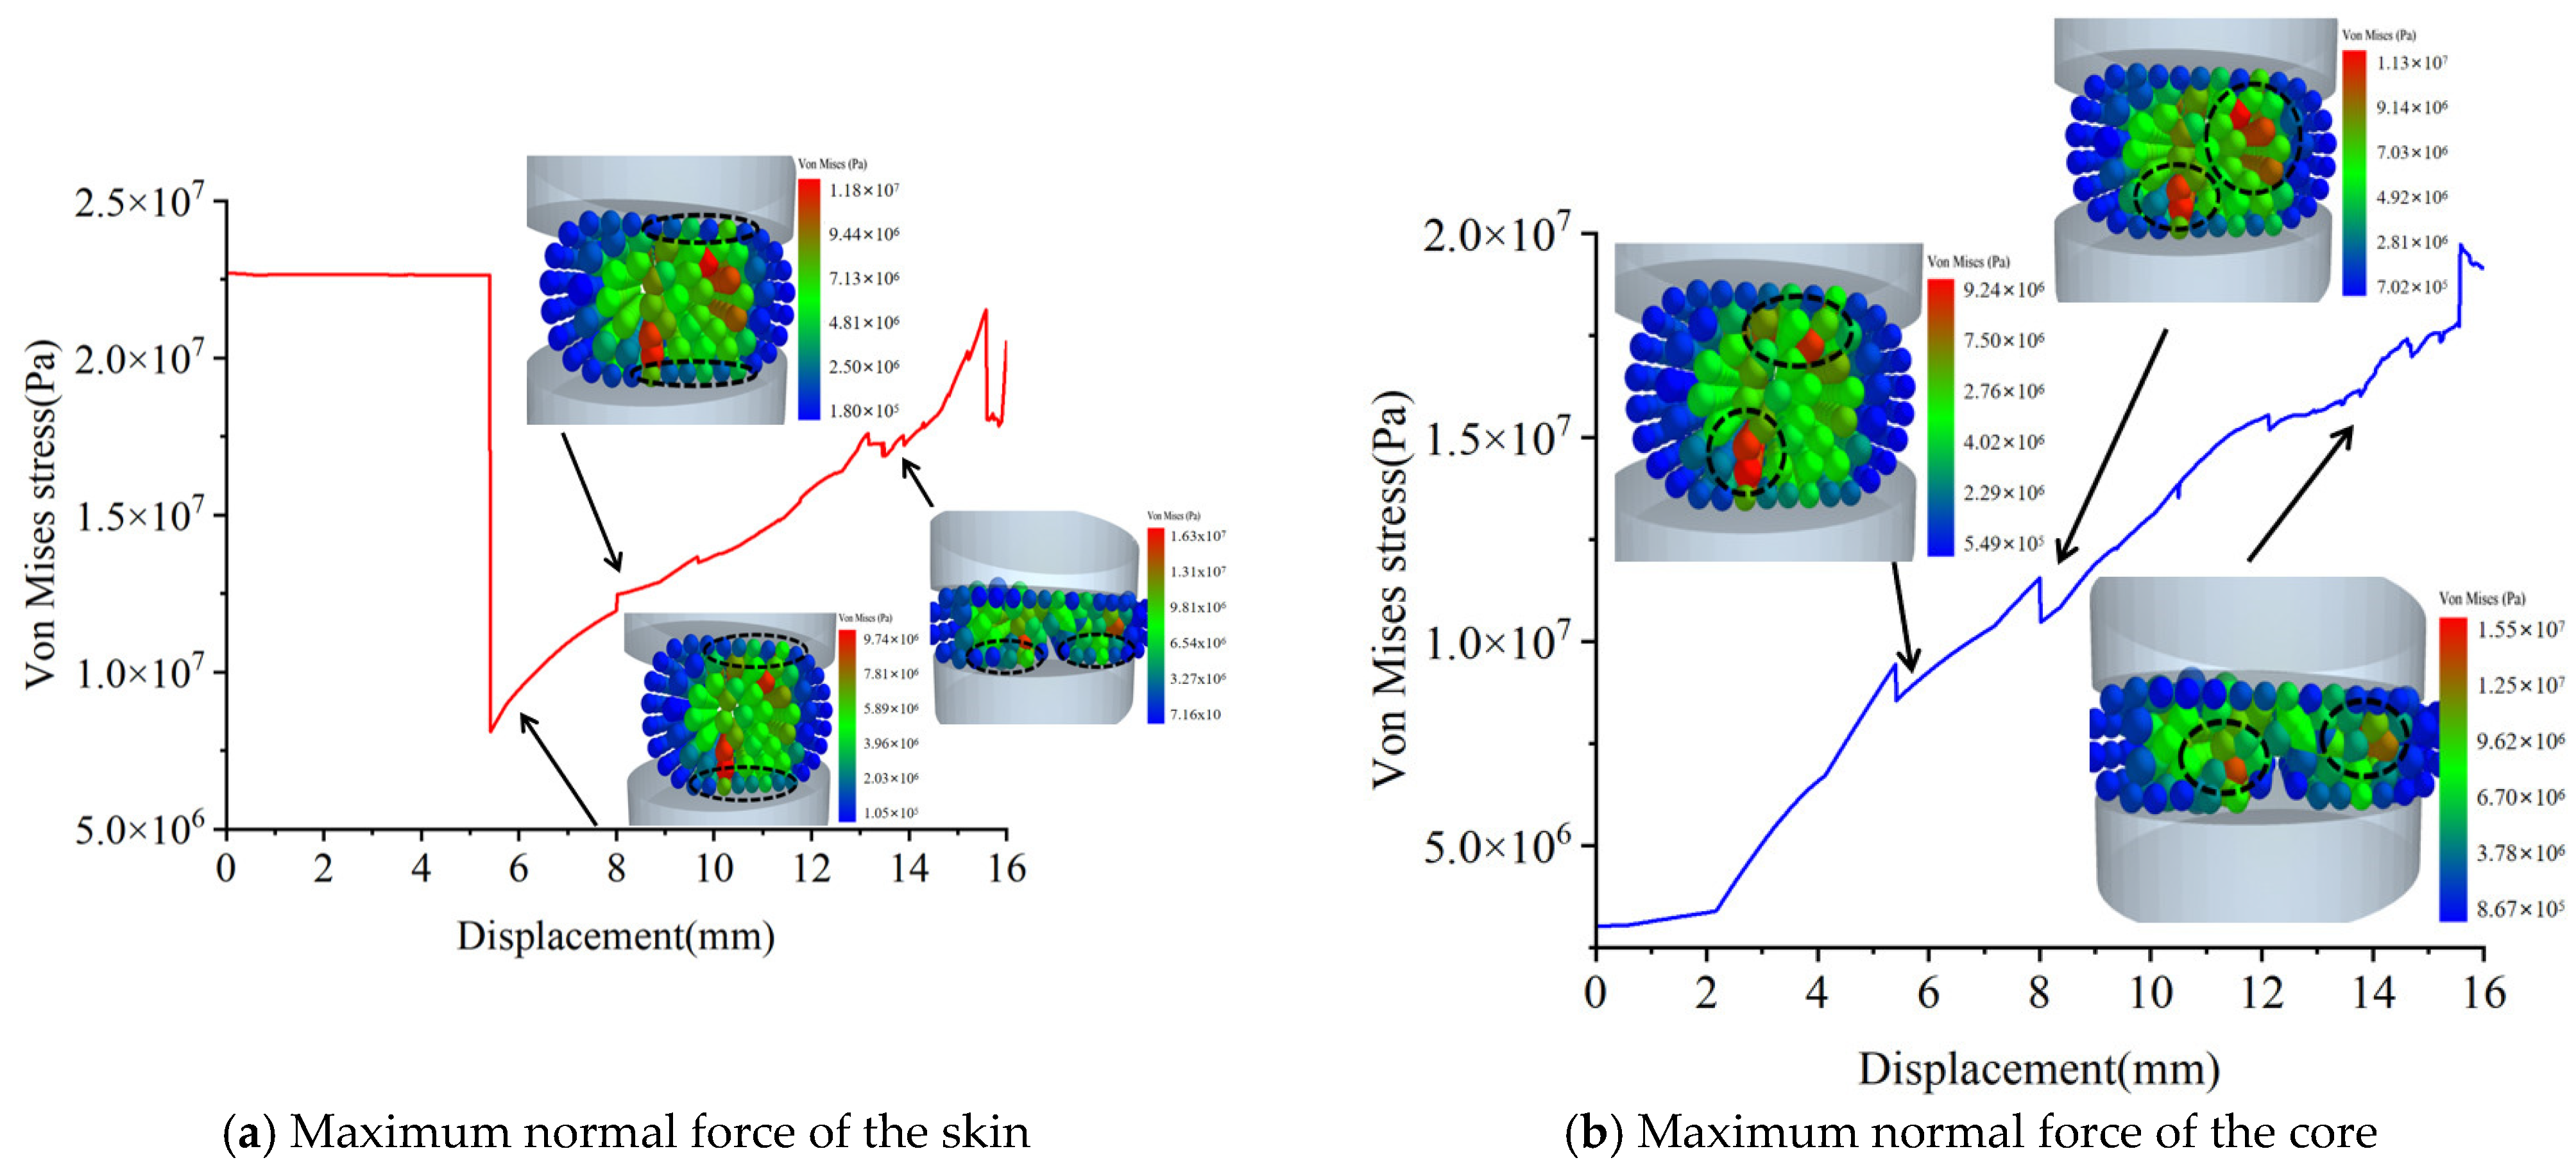
Figure 18a illustrates the equivalent stress of skin particles in the complete corn stalks. It can be observed that when a crack forms at the middle position, the maximum equivalent stress of the skin is 9.74 × 10⁶ pa, with this maximum stress located in the contact area between the corn stalks and the compression plate. When cracks form on the left and right sides of the stalk, the maximum equivalent stress of the skin reaches 1.18 × 10⁷ pa, and the maximum stress in the skin is situated in the region where it connects to the crack core particles. When cracks form at the edges on both sides, the maximum equivalent stress of the skin is 1.63 × 10⁷ pa.
Figure 18b shows the equivalent stress of core particles in the complete corn stalks. It can be observed that when a crack forms at the middle position, the maximum equivalent stress of the core is 9.24 × 10⁶ pa, with this maximum stress located in the connection region among the skin and the core (the parts of the stalk between the skin and the core). When cracks appear on the left and right sides of the stalk, the maximum equivalent stress of the core reaches 1.13 × 10⁷ pa. When cracks form at the edges on both sides, the maximum equivalent stress of the core is 1.55 × 10⁷ pa, with the maximum stress concentrated in the middle area around the cracks.

3.7.2. Radial Compression Simulation of Damaged Corn Stalks

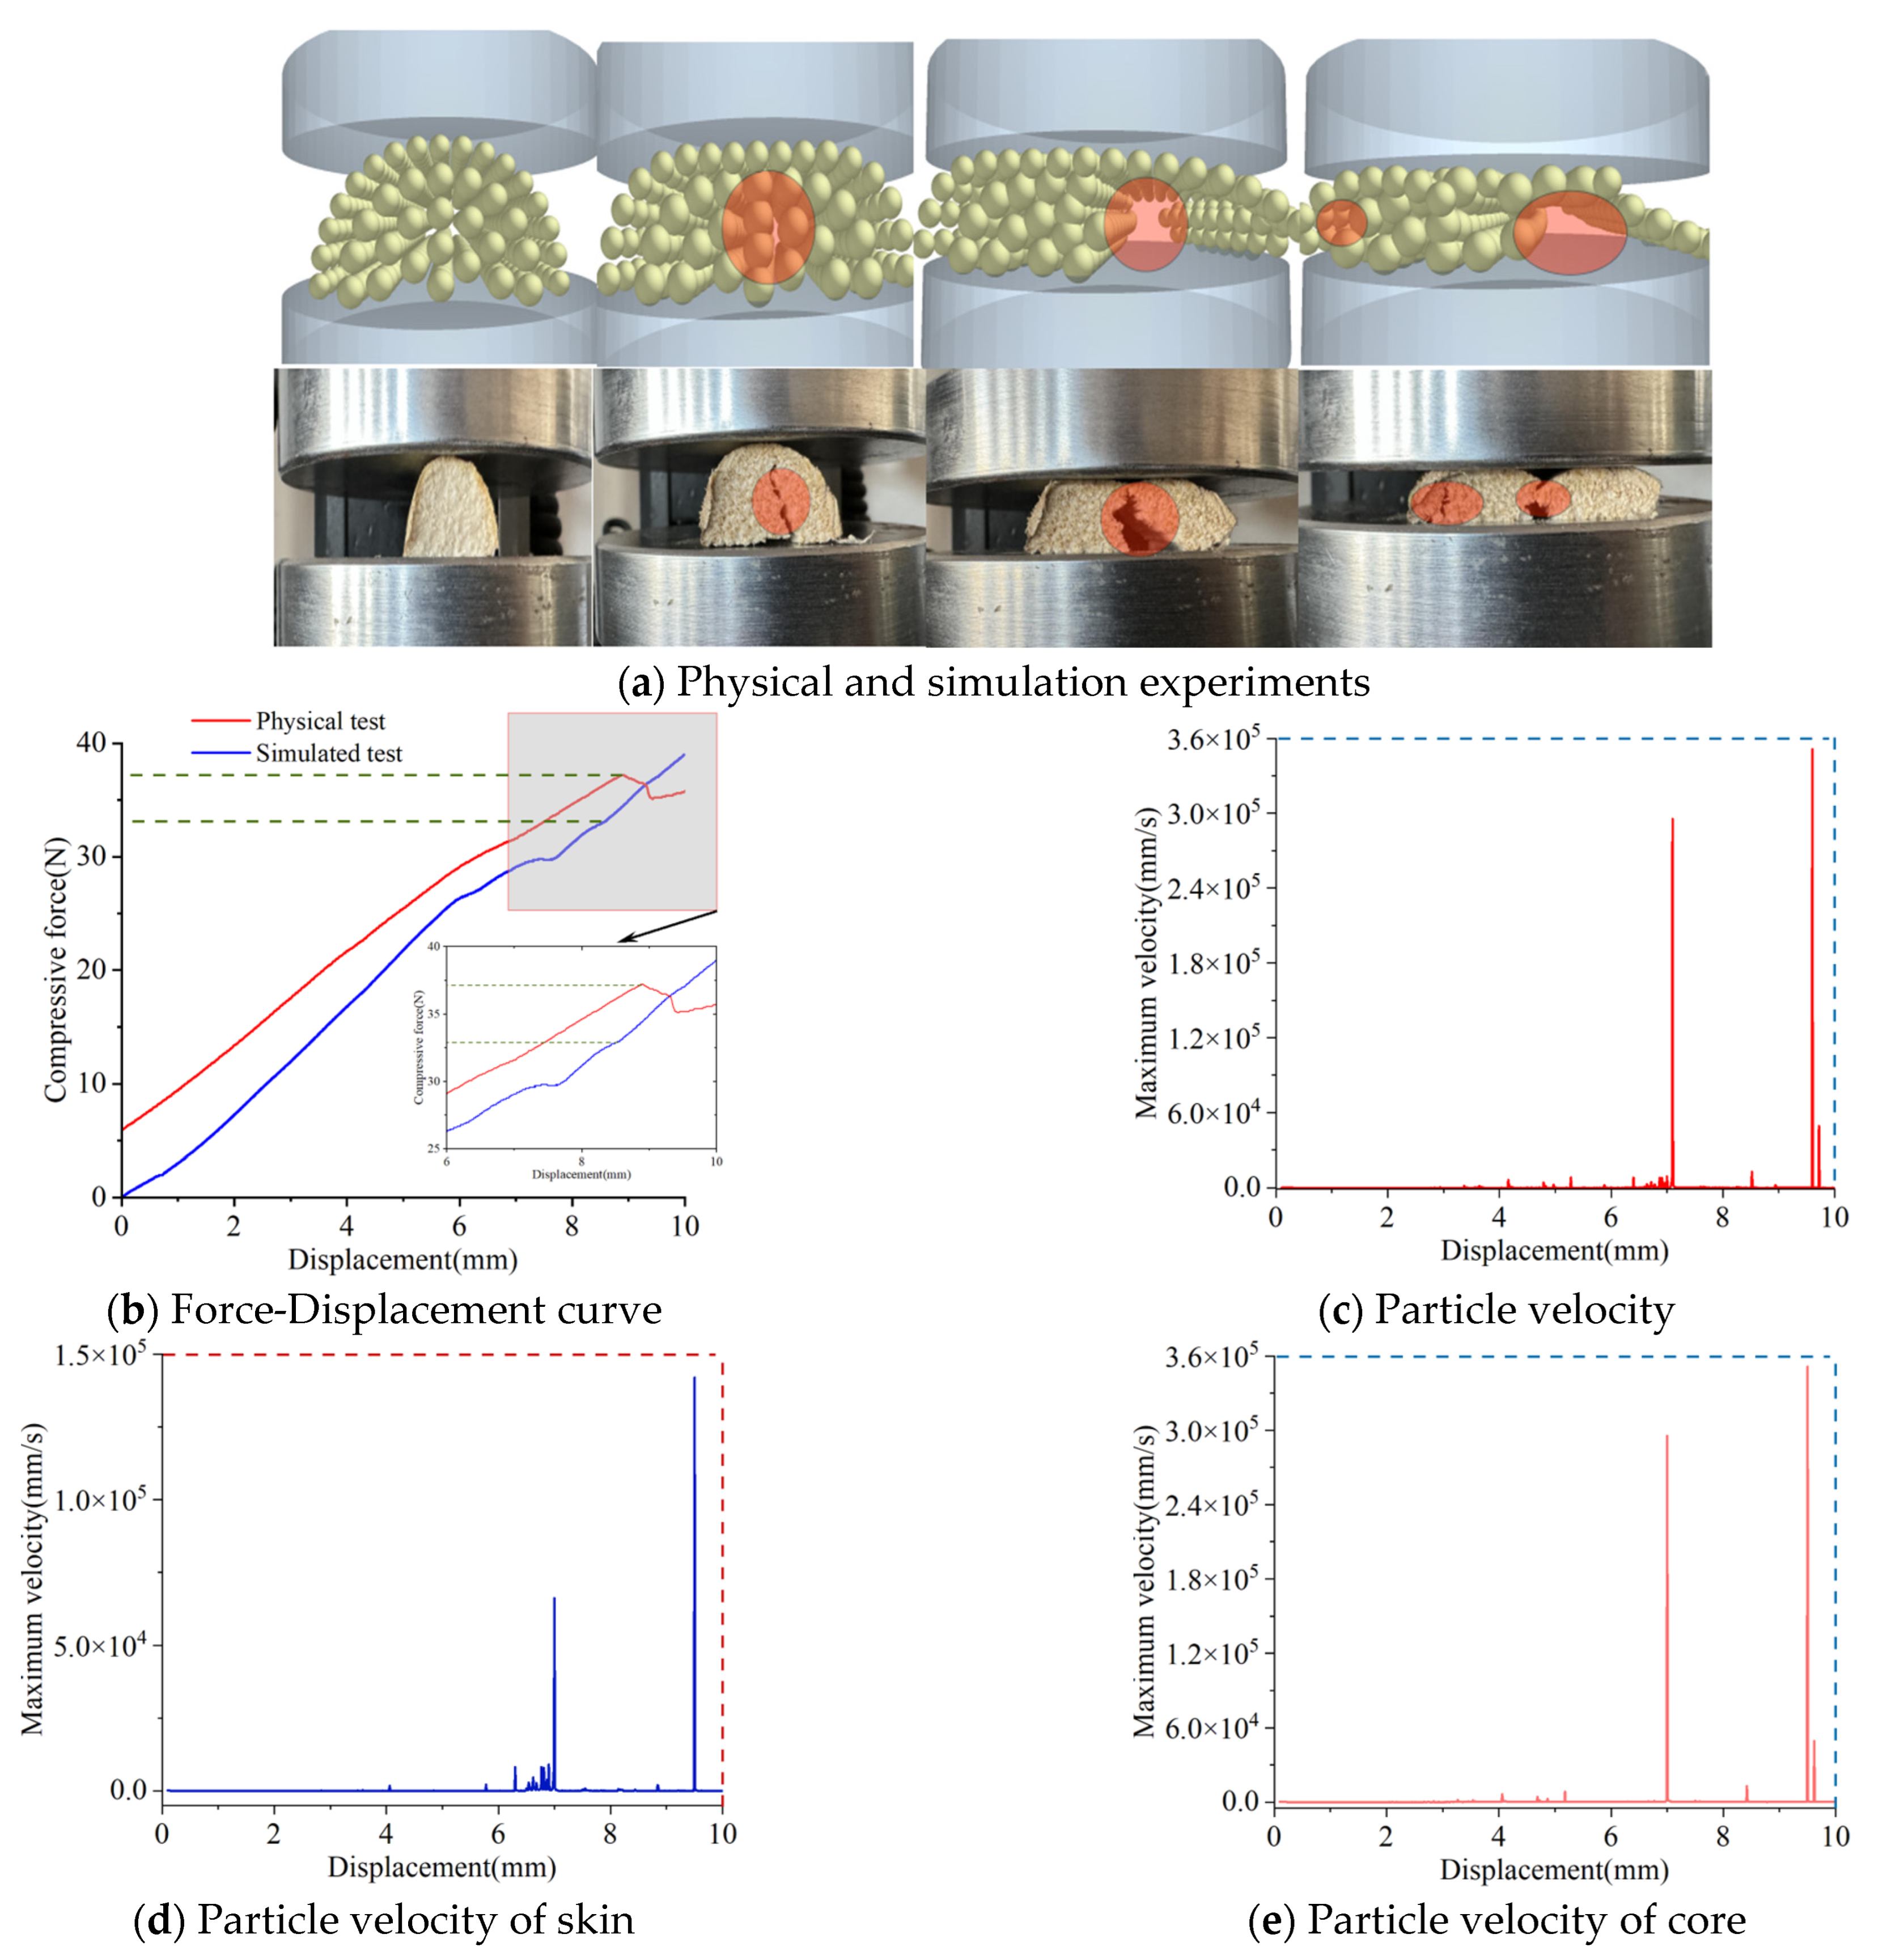
Figure 19a depicts the compression processes in both the physical experiments and simulations. The results indicate that as the compression displacement increases, longitudinal cracks first emerge, with the cracked areas located on the middle sides of the core part. Eventually, separation among the core and skin occurs. Additionally, a crack forms on the left side of the stalk, which is then compressed into a flattened shape. Figure 19b presents the radial compression force–displacement curves from both the simulations and physical tests for the damaged corn stalks. The average maximum compressive force in the experiment is 37.18 N, while the maximum compressive force obtained from the simulation is 33.1 N, with a relative error of 12.3% compared to the experimental average. These results show that the changing trends of the two curves are essentially consistent, and the damaged corn stalk model can accurately reflect the relationship between compressive force and displacement.
The RMSE is 4.92 N with small absolute deviation, indicating good overall agreement between the simulated values and measured values in Table 11. The coefficient of determination (R2 = 0.84) shows that the model can explain 84% of the variation in measured force, and despite individual errors, it still maintains a relatively high coefficient of determination. The average error percentage is −10.36%. The 95% confidence interval is from −16.23% to −4.49%. Since its force bearing differs from that of the complete stalks, it exhibits higher strain variability under mechanical response.
Figure 19c shows the maximum velocity of the particles. The maximum velocity of the skin particles is as in Figure 19d, and the maximum velocity of the core particles is as in Figure 19e. At a compression displacement of 9.76 mm, the maximum velocity of the skin of the damaged corn stalks is 1.42 × 105 mm/s. The maximum velocity of the core of the damaged corn stalks is 3.51 × 105 mm/s.
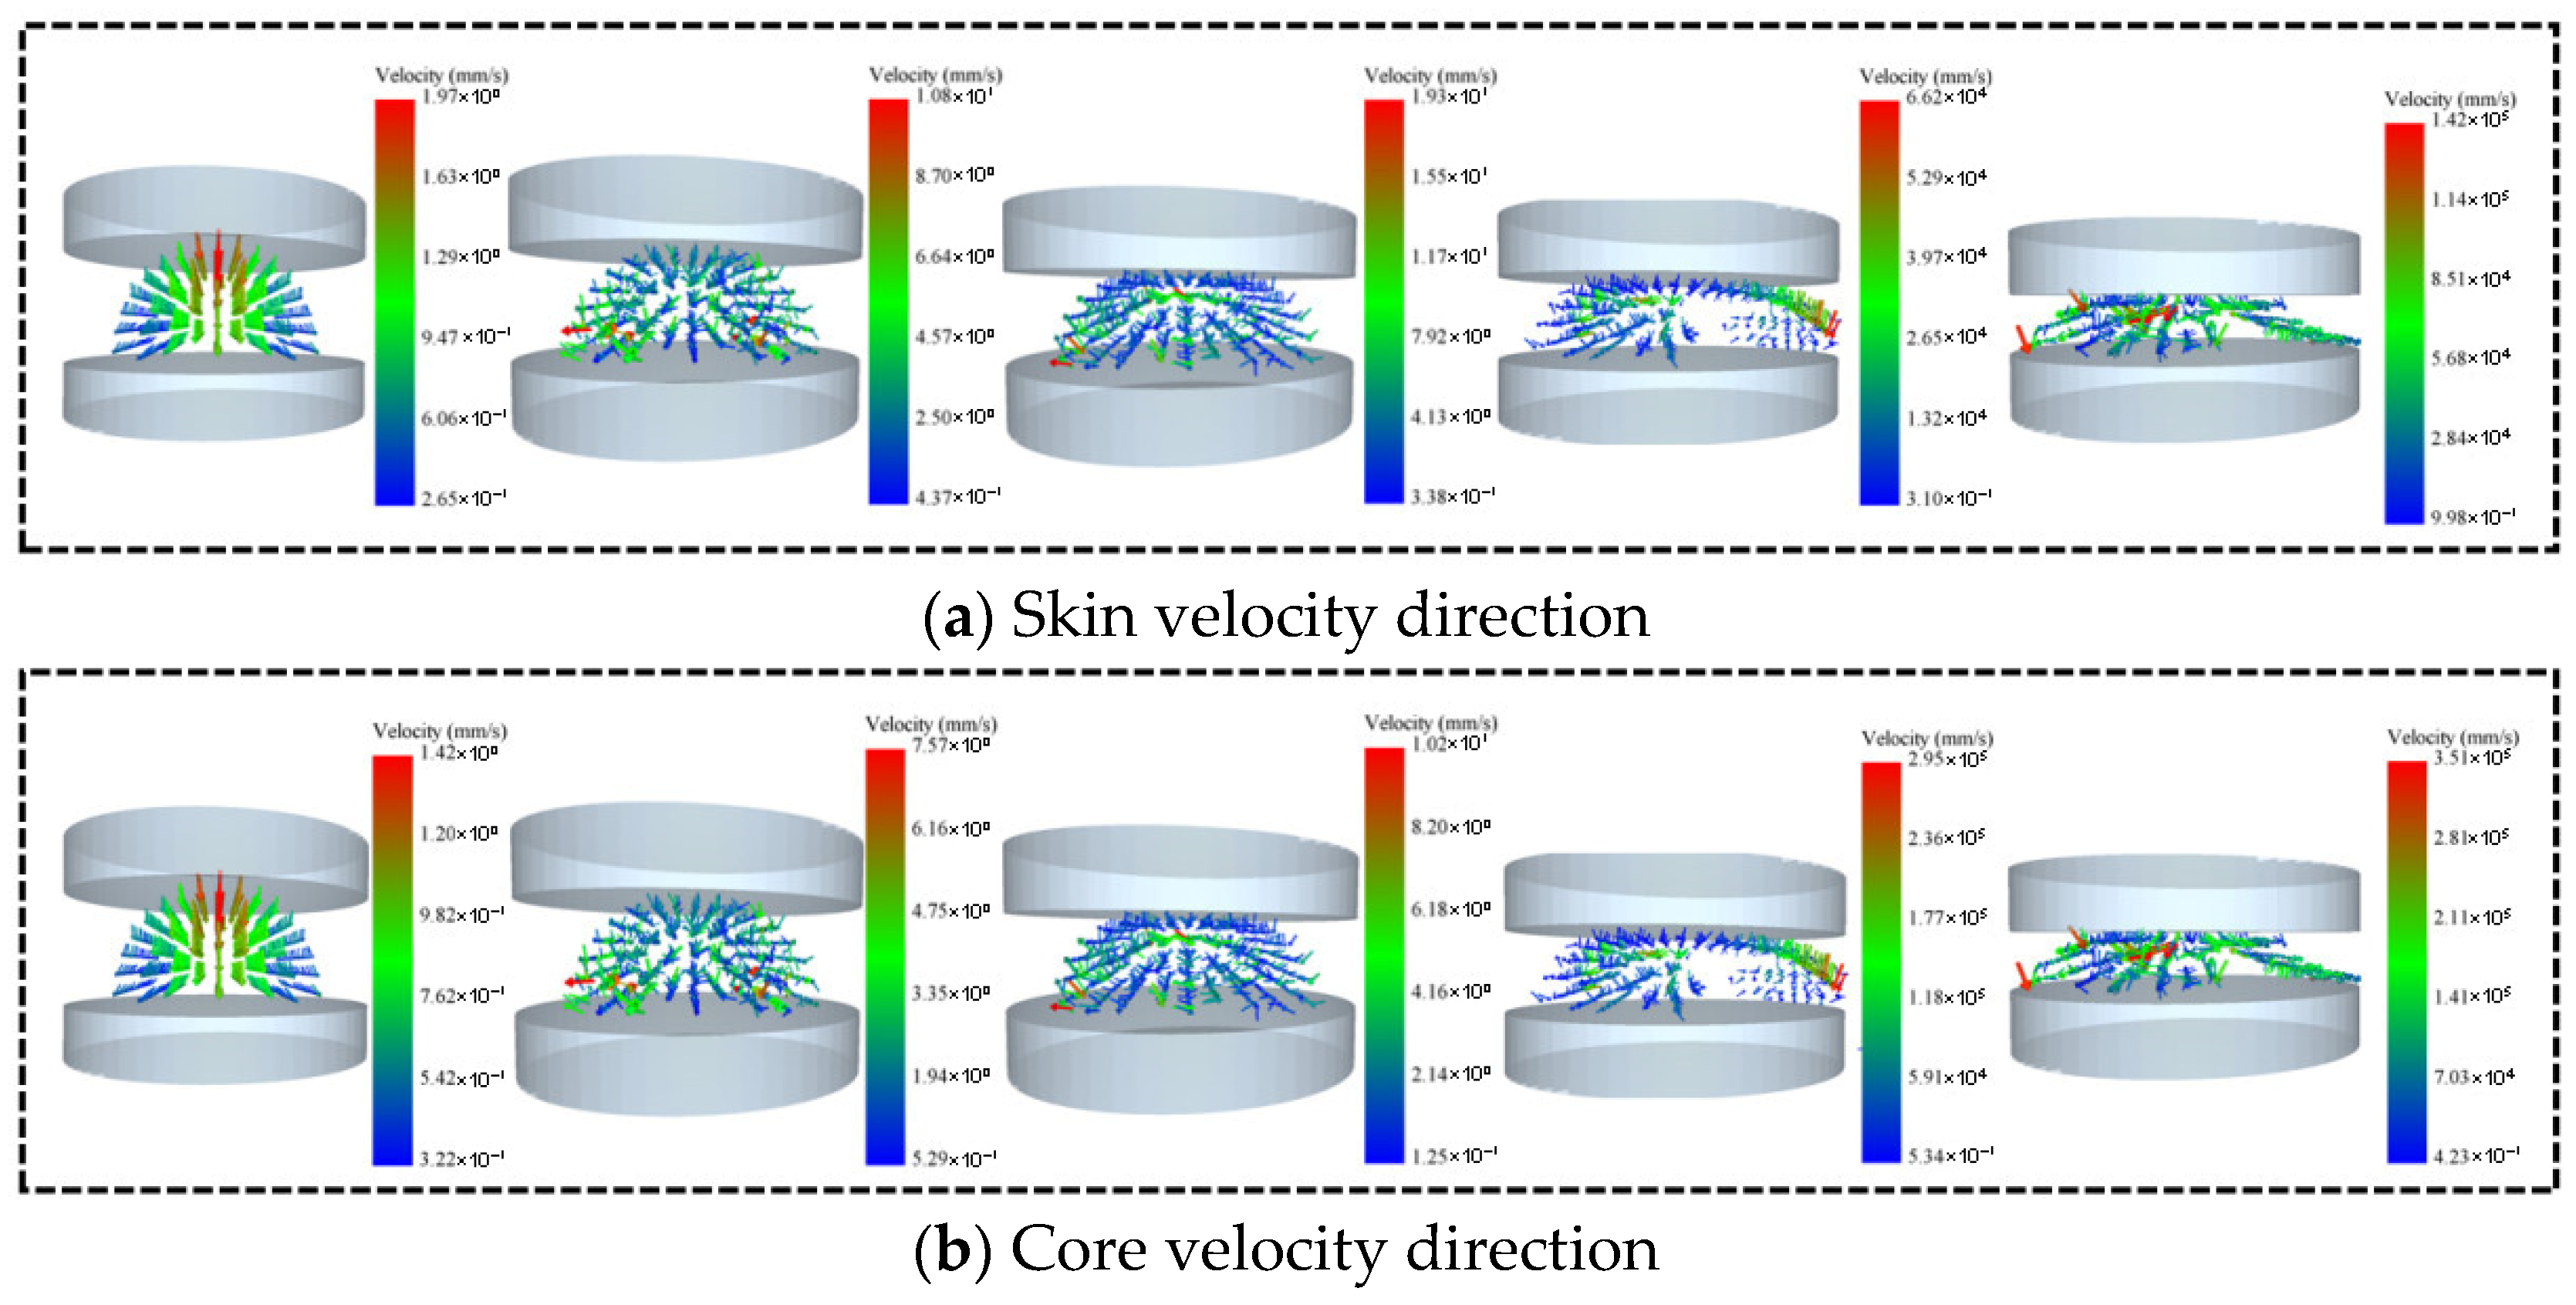
Figure 20a shows the direction of radial compression velocity of the skin. Figure 20b shows the direction of the radial compression velocity of the core. It can be seen that during the initial stage of compression, the velocity direction of the damaged corn stalks is directed toward the central region. As the loading displacement increases, the velocity direction at the loaded position of the stalk shifts. The maximum velocity of the skin is 1.42 × 105 mm/s when the speed of the core is 3.51 × 105 mm/s. The particle velocity of the damaged stalks increases as compression proceeds, with a relatively uniform velocity distribution. When separation of the rind and core occurs in the damaged stalks, the particle velocity rises sharply, and velocity concentration zones emerge. When the damaged stalks are compressed into a flat shape, the velocity of the stressed particles reaches its maximum.
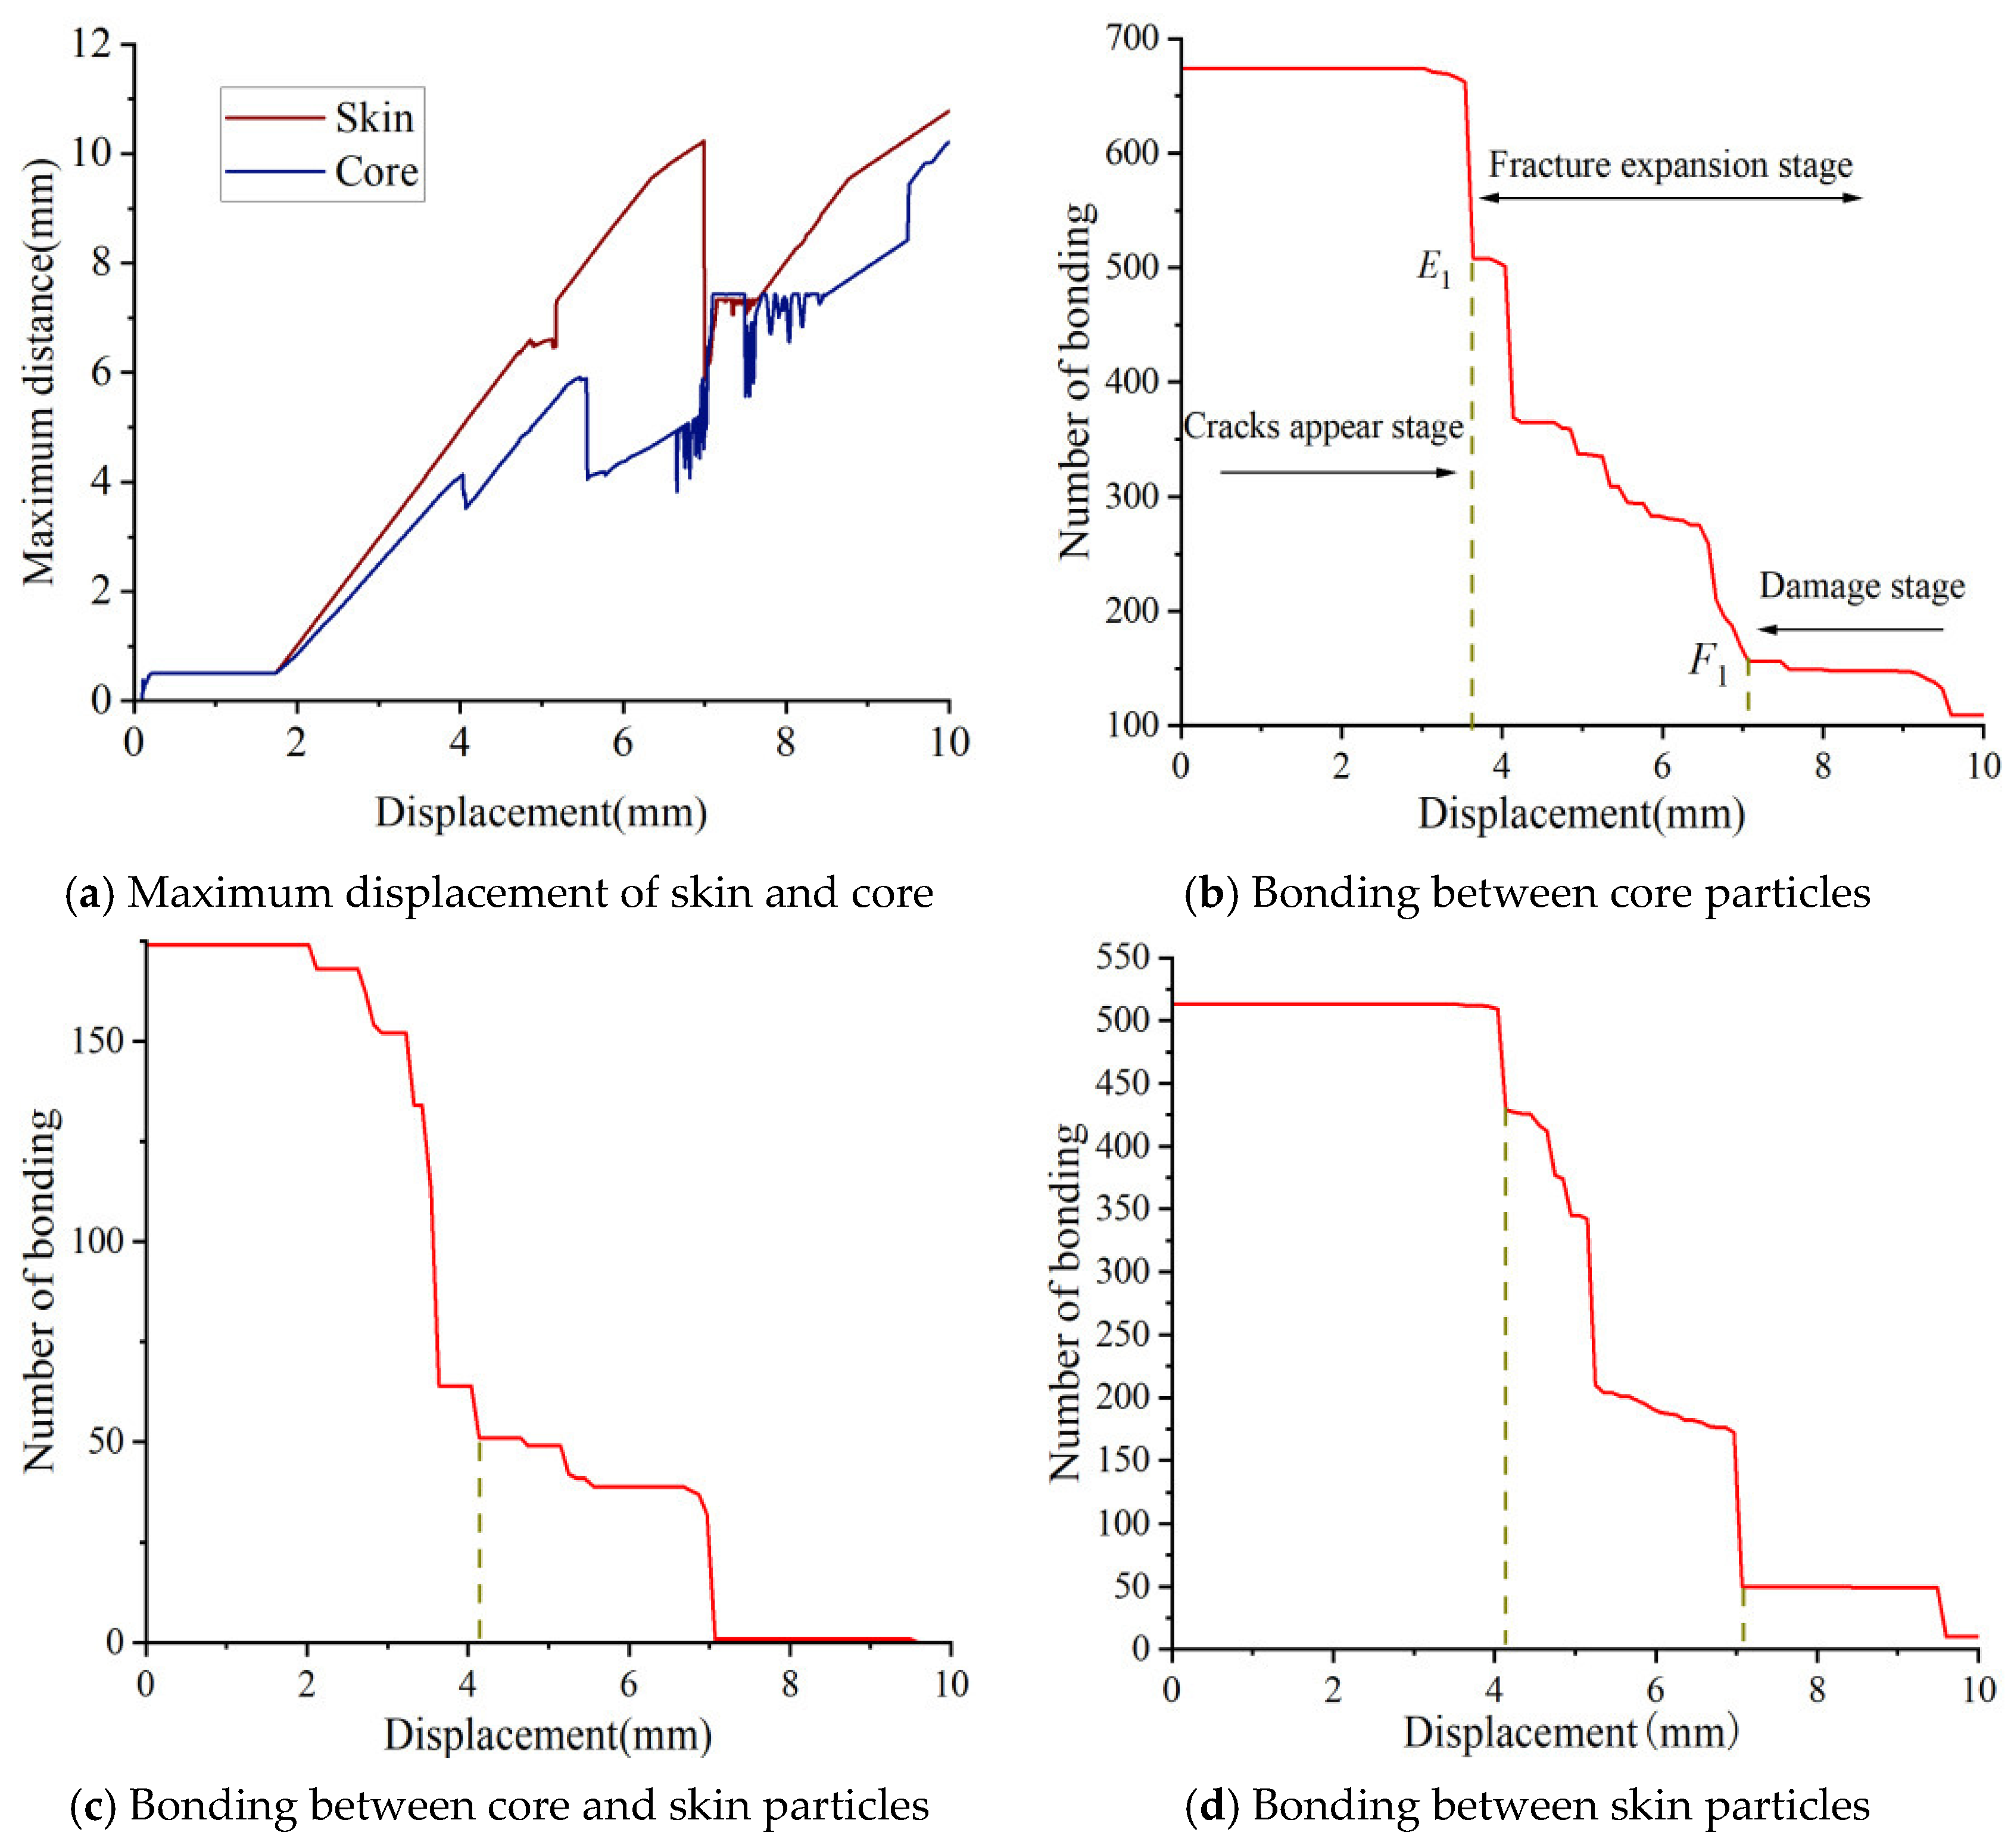
The maximum displacement curve of the skin particles during the compression of the damaged corn stalks is shown in Figure 21a. It can be seen that at a compression displacement of 9.98 mm, the maximum displacement of the skin particles is 10.2 mm. The maximum displacement of core particles is 10.76 mm.
Figure 21b shows the variation in the number of bonds among core particles during the radial compression of damaged corn stalks. As the compression displacement increases, the number of bonds decreases slightly before point E1. Cracks initiate at point E1, where the number of bonds is 512. The crack propagation stage spans from point E1 to F1, during which the number of bonds decreases from 512 to 178. A greater reduction in the number of bonds corresponds to a higher degree of corn stalk fracturing. After point F1, the stalk is completely fractured, with the number of bonds reduced to 162.
Figure 21c illustrates the variation in bonds among the core and skin particles in the damaged corn stalks. When the compression displacement is 4.19 mm, the number of bonds among the core particles decreases by 166, the number of bonds among the core and skin particles decreases by 110, and the number of bonds among the skin particles decreases by 86. This indicates that not only do cracks form in the core, but partial separation also occurs among the core and skin tissues, as shown in Figure 21d.
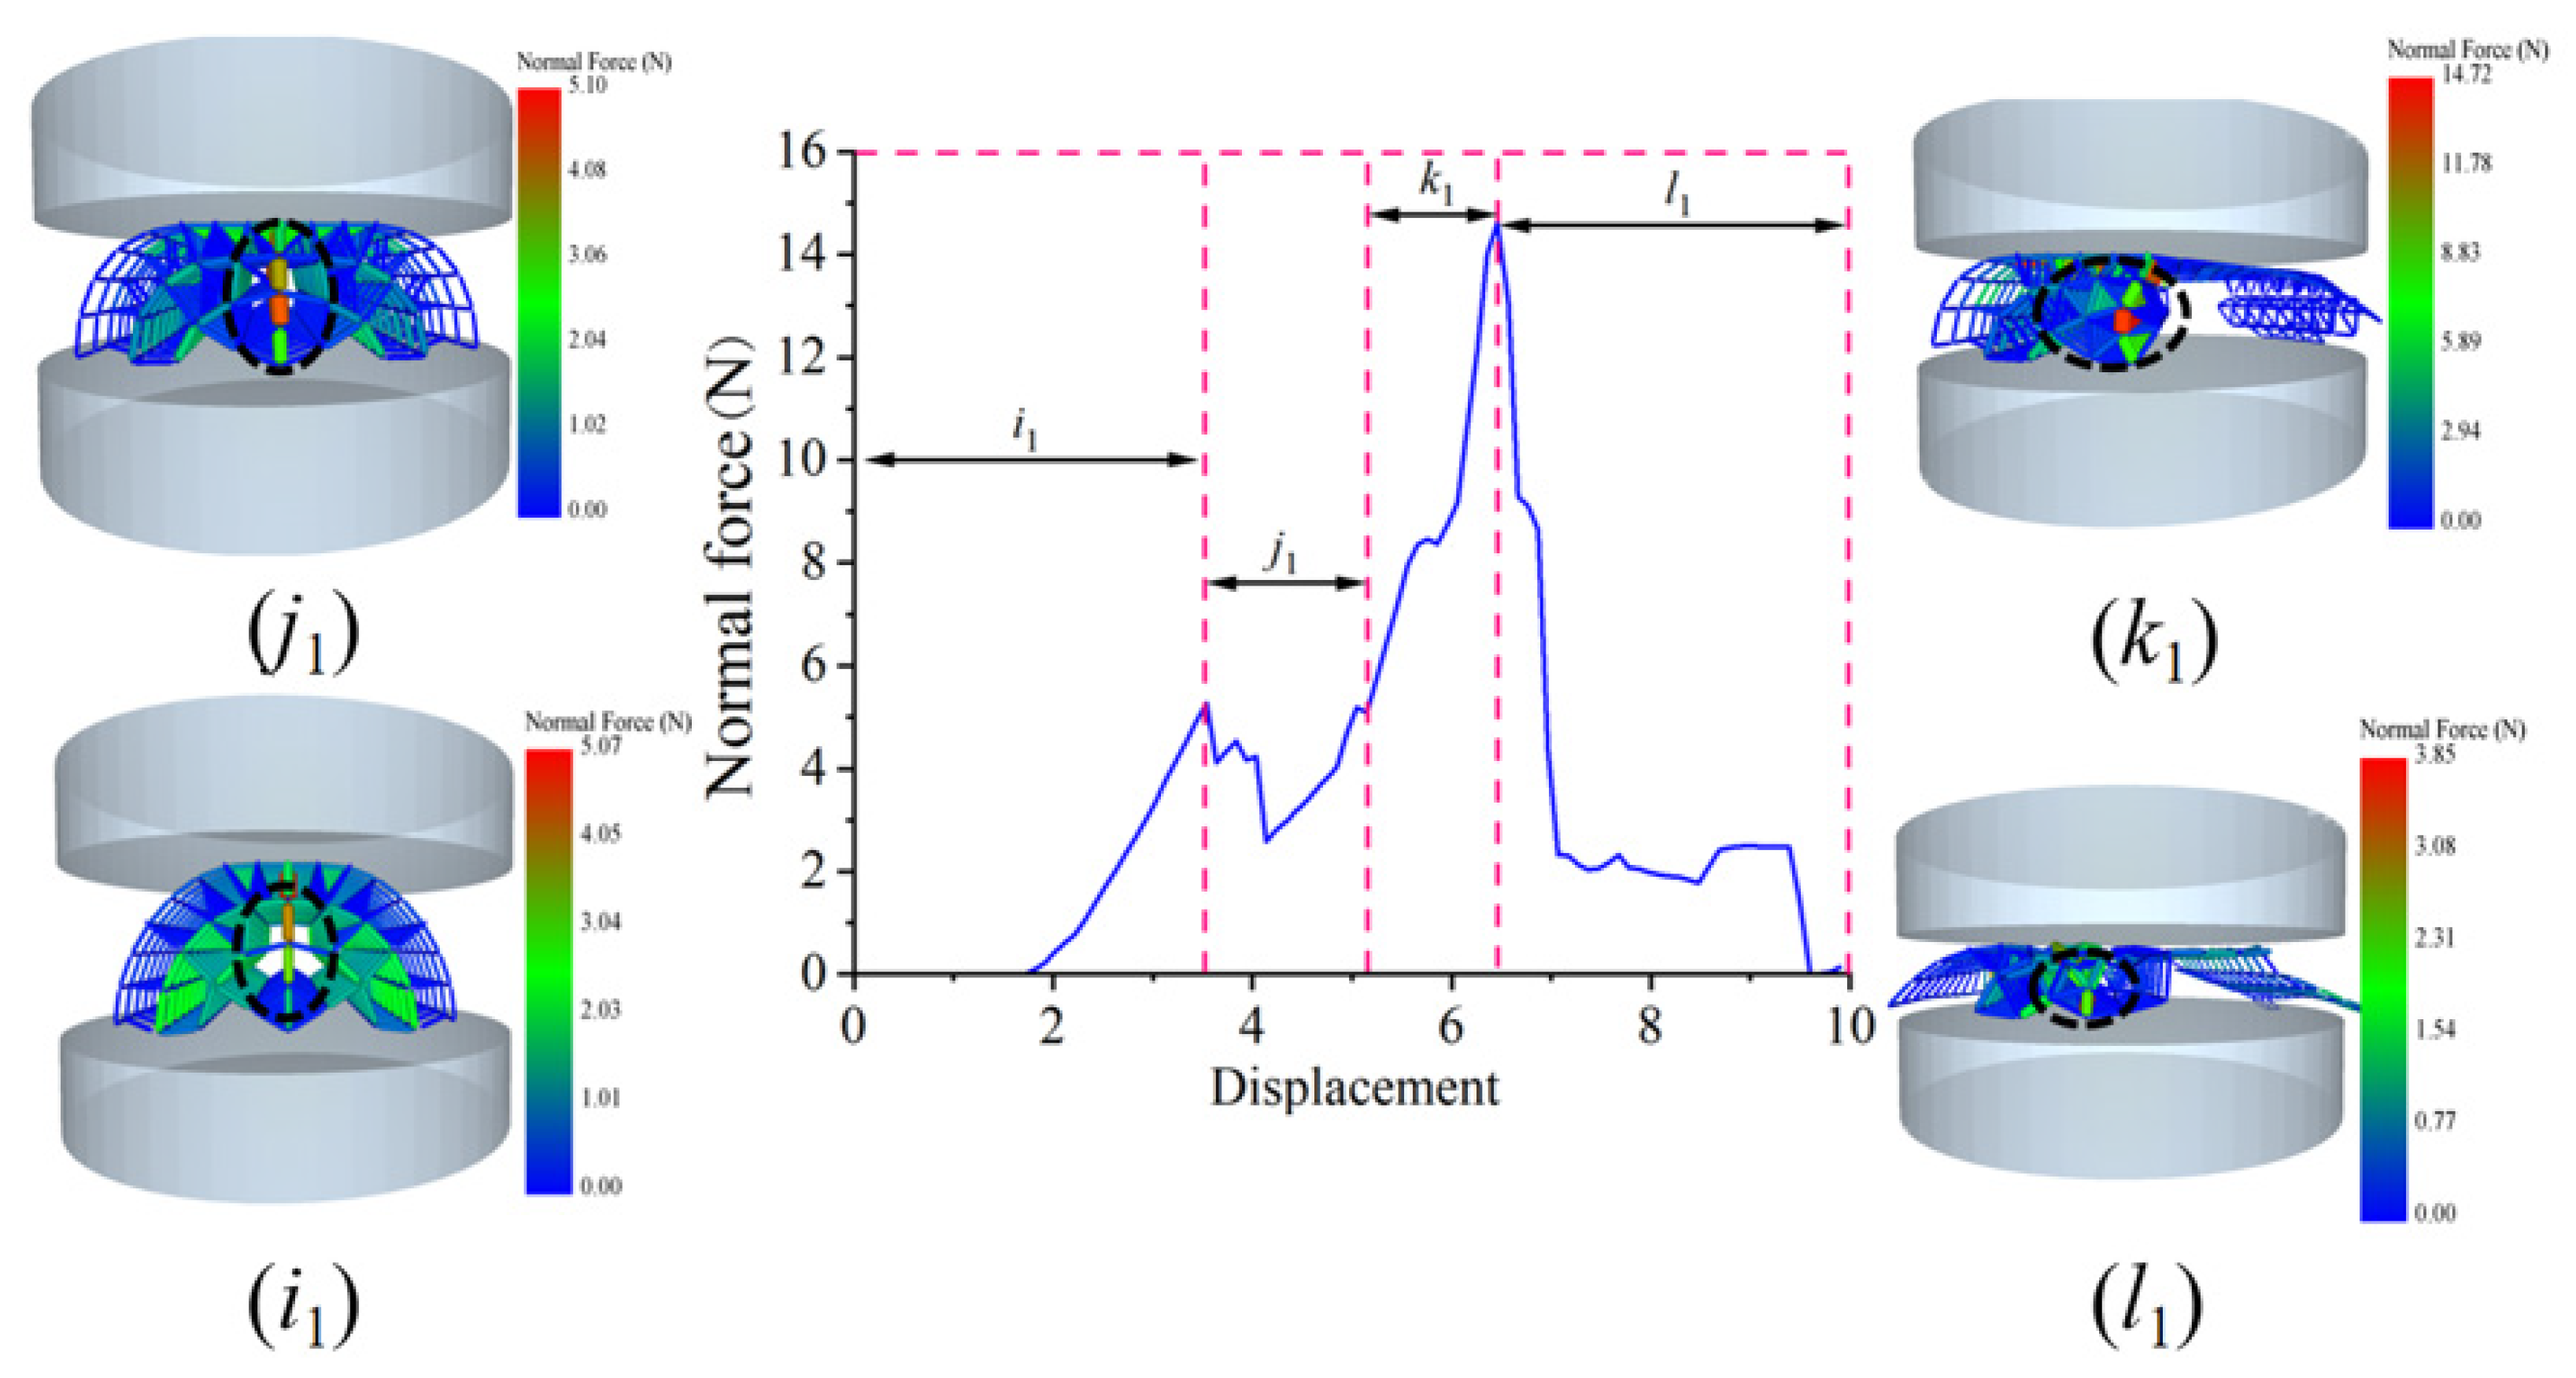
Figure 22 shows the normal force distribution of the skin and core during the radial compression of the damaged corn stalks. The stalk fracturing process is divided into four stages: i1, j1, k1, and l1. The interval from 0 to 3.64 mm is defined as the force-bearing stage (stage i1), where the normal force ranges from 0 to 5.07 N, with the maximum normal force in this stage located in the middle part of the skin. The interval from 3.64 to 5.05 mm is classified as the lateral fracturing stage (stage j1), with normal forces ranging from 5.07 to 5.1 N; here, the maximum normal force is situated in the middle area of the core. The interval from 5.05 to 7.34 mm is referred to as the core detachment stage (stage k1), where normal forces range from 5.1 to 14.72 N, and the maximum normal force is located in the area of the middle-bent core. The interval from 7.34 to 10 mm is identified as the complete fracturing stage (stage l1), with normal forces ranging from 14.72 to 3.85 N, and the maximum normal force in this stage is found in the remaining area of the core. When the compression displacement reaches 6.46 mm, the maximum normal force in this stage k1 is 14.72 N.
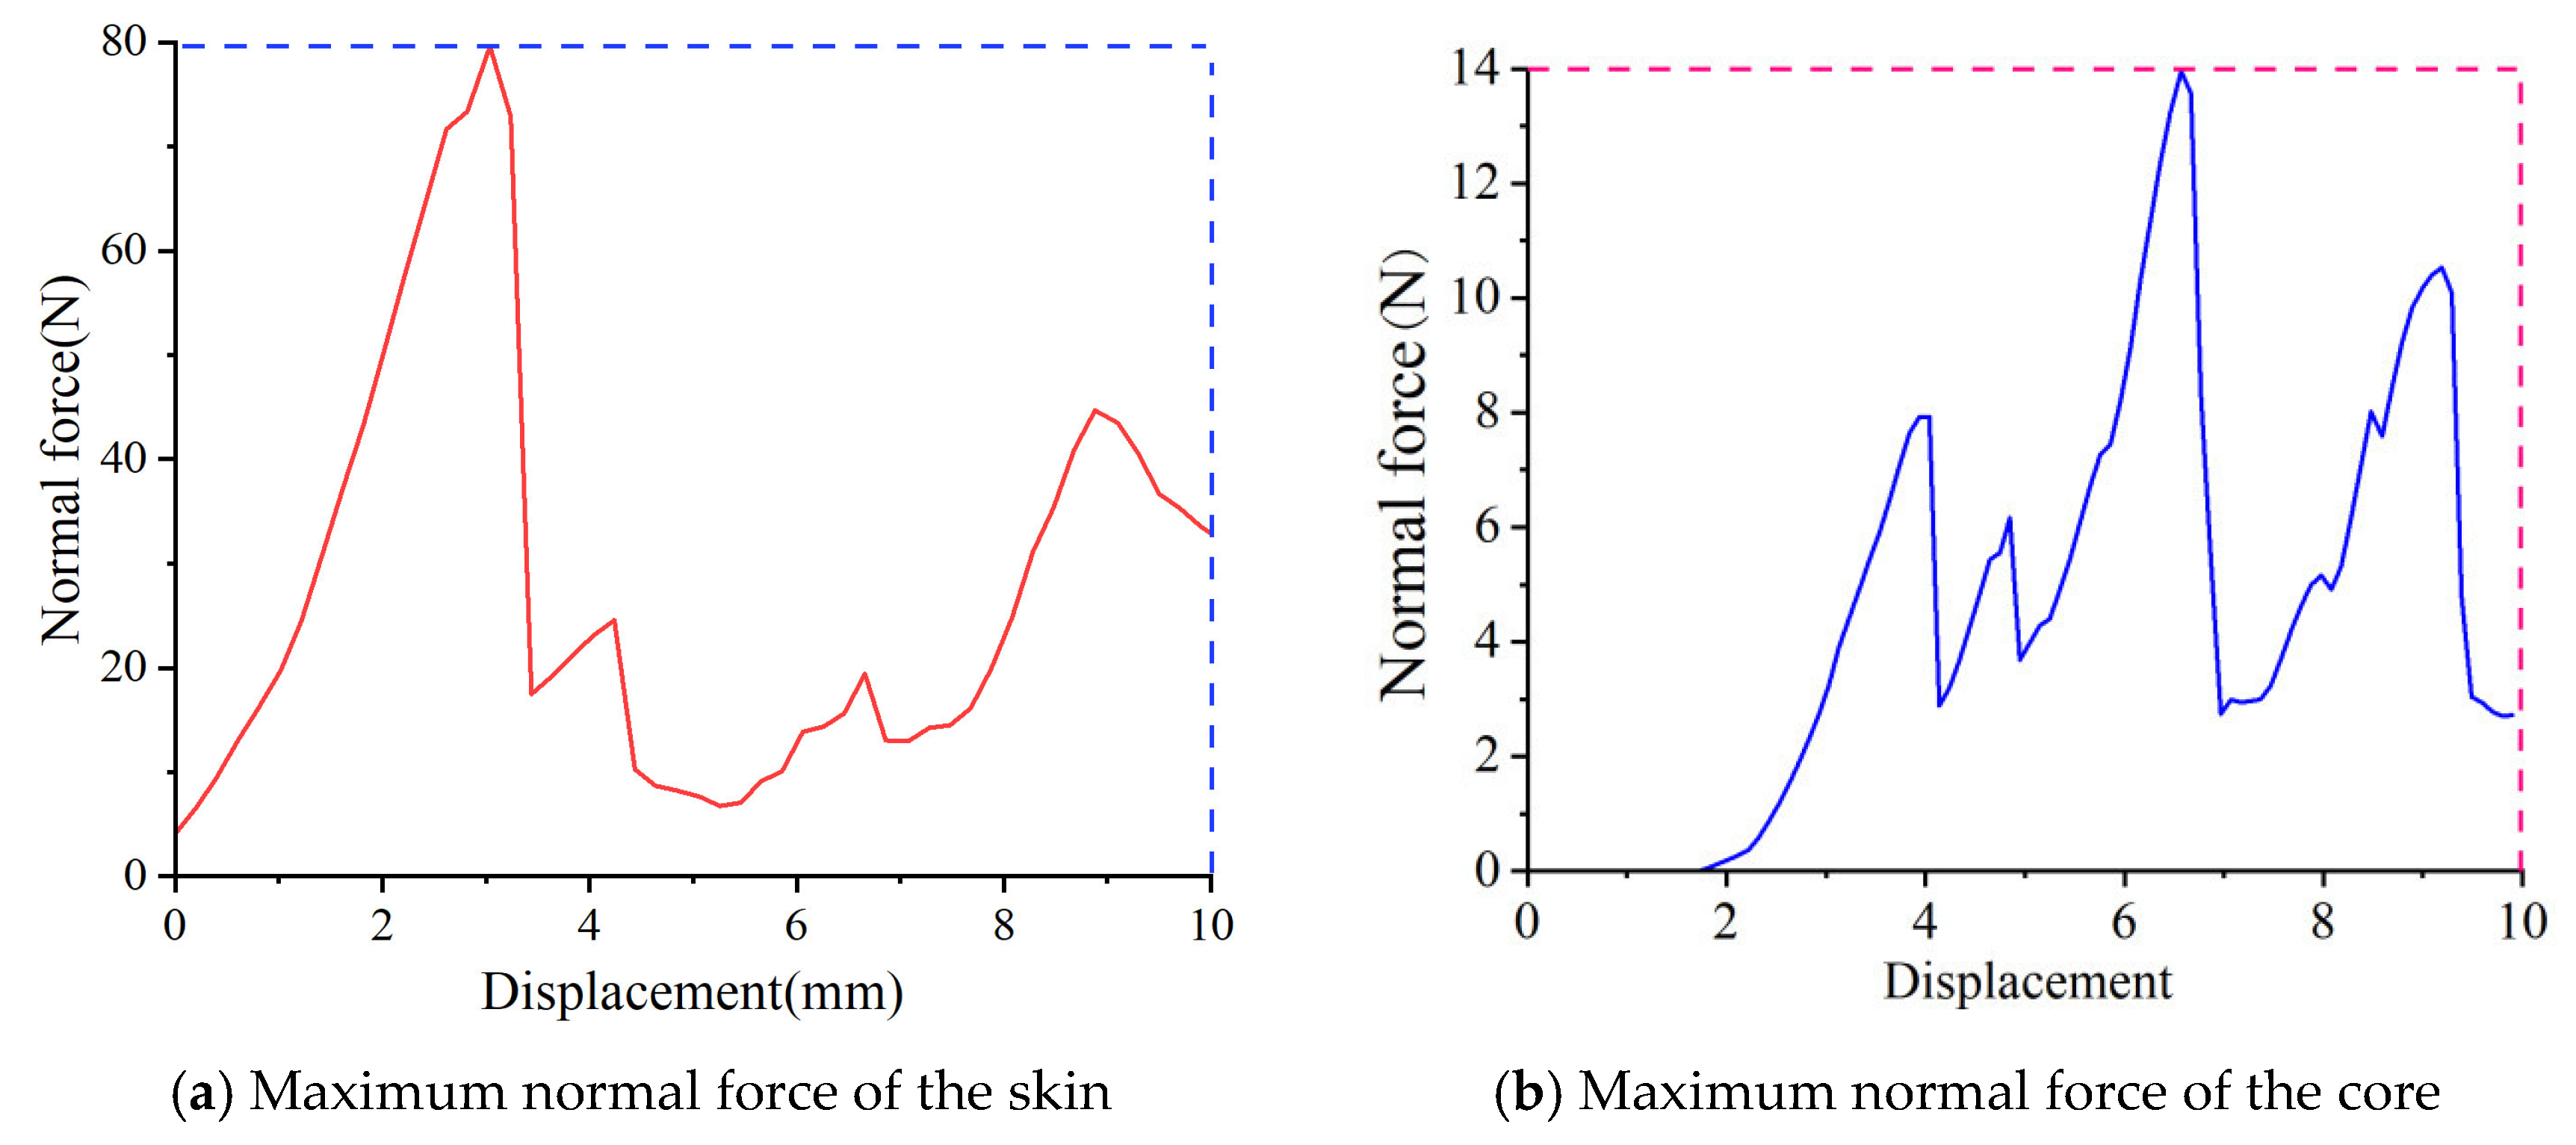
Figure 23a shows the maximum normal force of the skin in the damaged corn stalks. It can be seen that when the compression displacement of the skin is 2.89 mm., the maximum normal force between the skins reaches a value of 79.65 N. When the compression displacement is 6.67 mm, the maximum normal force between the cores reaches a value of 13.57 N. This is shown in Figure 23b.
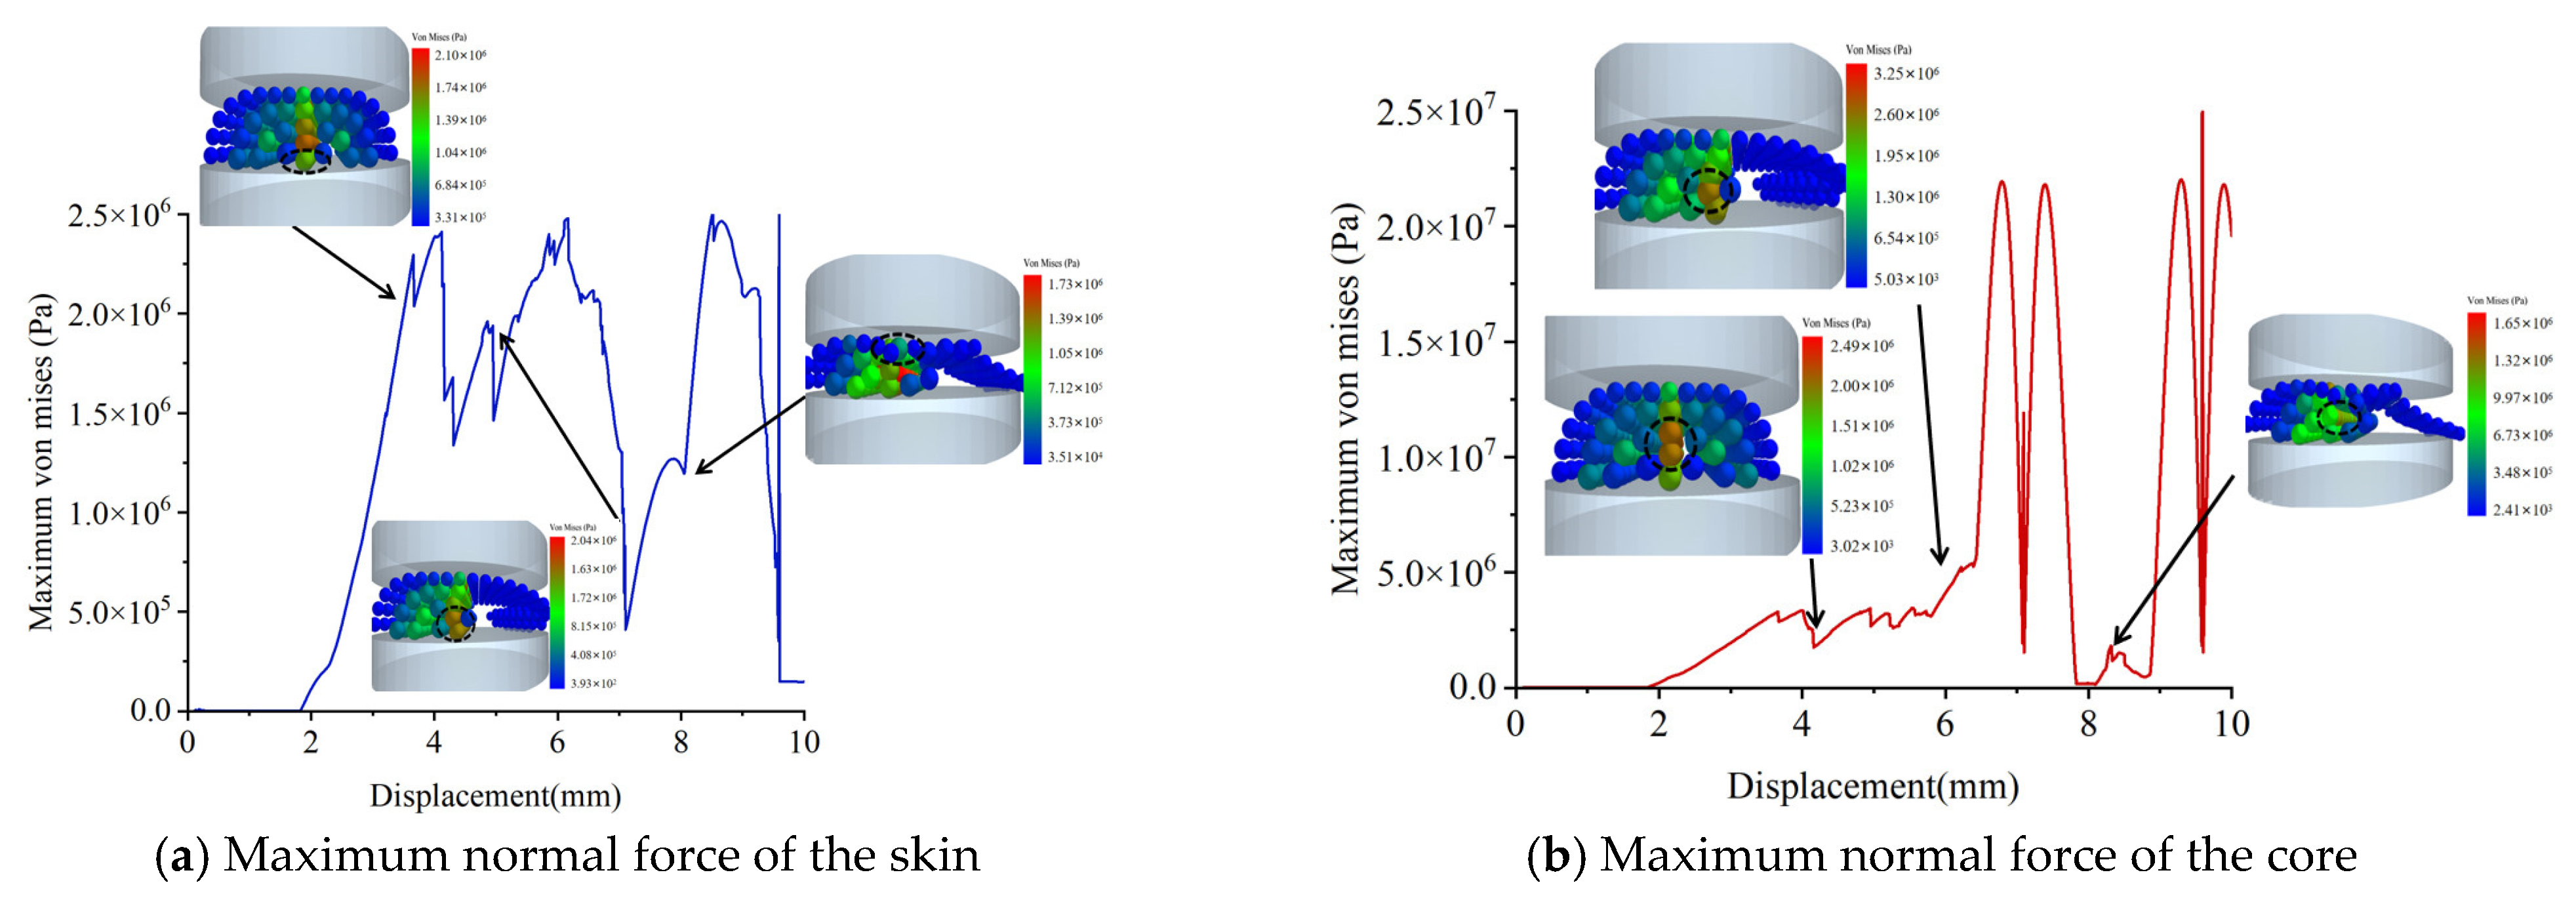
Figure 24a shows the maximum equivalent stress of the core particles in the damaged corn stalks. When a crack forms at the center of the stalk, the maximum equivalent stress of the core is 2.1 × 10⁶ pa, with the maximum stress located at the middle position. When a crack appears on the right side of the stalk, the maximum equivalent stress is 2.04 × 10⁶ pa, and the maximum stress is still located at the middle position of the stalk. When a crack forms at the left edge, the maximum equivalent stress of the core is 1.73 × 10⁶ pa, with the maximum stress located at the middle position.
Figure 24b shows the equivalent stress of the core particles of the damaged corn stalks. It can be seen that when a crack is generated at the middle position, the maximum equivalent stress of the core is 2.49 × 10⁶ pa. The maximum stress is located at the lower parts of the stalk in between the skin and the core. When cracks appear on the right side of the stalk, the maximum equivalent stress of the core is 3.25 × 10⁶ pa. The maximum stress is in the middle area around the cracks. When cracks are generated at the edges on the left side, the maximum equivalent stress of the core is 1.65 × 10⁶ pa. The maximum stress is in the middle area around the cracks. The region of maximum equivalent stress in the skin is located around the crack areas, which is attributed to particle compression caused by stress concentration.
There are significant differences in the stress values and stress concentration patterns between the complete and damaged maize stalks. The stress in the epidermis and core of complete stalks is 3 to 5 times that of the damaged ones. This is because complete stalks have a compact internal structure, enabling them to effectively transmit loads. In contrast, damaged stalks have an incomplete structure and fail to form effective support under high stress conditions. This is due to the fact that the incompleteness of damaged stalks leads to the formation of cracks, which disrupts the connection between the epidermis and the core. Consequently, the stress concentration at the core particles is dispersed, with their stress values dropping abruptly, while the epidermal particles are confined to the area around the cracks and passively bear the load.

4. Conclusions

The mechanical property parameters of complete corn stalks and damaged corn stalks were obtained through experiments. A DEM model of flexible complete corn stalks and damaged corn stalks that includes skin and core tissues was established.
The complete and damaged stalk models were validated by means of compression. The results indicate that the complete stalks exhibited both a plastic and second plastic stage, while the damaged stalks fractured immediately upon reaching peak stress without showing a second plastic stage during axial compression.
The movement of tissue particles in the complete and damaged stalks during radial compression was analyzed. An analysis of force–displacement relationships for the complete and damaged stalks revealed that the results from the physical tests are in good agreement with those from the simulation tests, indicating that the model can accurately characterize the mechanical properties of both types of stalks.
By focusing on the compressive mechanical properties of stalks and the verification of simulation models, this study does not include gradient classification and a systematic exploration of the moisture content of the two types of stalks. Subsequent studies need to establish a multi-gradient moisture content experimental system and need to carry out full-cycle compression tests relying on an experimental platform that simulates actual production conditions.

Author Contributions

Conceptualization, J.H. and Z.L.; methodology, J.H., Y.M. and Y.X.; software, Z.L. and H.D.; validation, J.H., Z.L. and Y.X.; formal analysis, J.H., Y.M. and C.L. (Chenglong Li); investigation, J.H., Z.L., Q.T. and H.D.; resources, J.H., Y.M. and M.L.; data curation, J.H., C.L. (Chenghao Li), and Q.T.; writing—original draft preparation, J.H. and Y.X.; writing—review and editing, Z.L. and C.L. (Chenghao Li); visualization, C.L. (Chenglong Li), C.L. (Chenghao Li), and Q.T.; supervision, M.L. and Q.T.; project administration, J.H., H.D. and C.L. (Chenglong Li); funding acquisition, J.H. All authors have read and agreed to the published version of the manuscript.

Funding

This work is supported by the Shenyang Science and Technology Plan project (Grant No. 23-409-2-04).

Institutional Review Board Statement

Not applicable.

Informed Consent Statement

Not applicable.

Data Availability Statement

Data are contained within the article.

Acknowledgments

The authors thank the Shenyang Science Plan project for financing this research.

Conflicts of Interest

The authors declare no conflicts of interest.

Abbreviations

The following abbreviations are used in this manuscript:
DEMDiscrete element method
ANOVAAnalysis of variance
RMSERoot mean square error

References

  1. Quan, Q.; Yi, F.; Liu, H. Fertilizer Response to Climate Change: Evidence from Corn Production in China. Sci. Total Environ. 2024, 928, 172226. [Google Scholar] [CrossRef]
  2. Liu, Y.; Xu, L.; Gao, S.; Qu, Y.; Zheng, J.; Li, W.; Zhao, M. Enhanced Enzymatic Hydrolysis of Corn Stalk and Corn Cob with Deep Eutectic Solvent Pretreatment. Carbohydr. Res. 2025, 555, 109548. [Google Scholar] [CrossRef]
  3. Jia, Z.; Yang, N.; Wang, S.; Meng, Y.; Sun, Y.; Ye, J.; Li, W.; Xu, S.; Wu, T.; Li, J.; et al. Organic Solvent-Assisted Ethylenediamine Pretreatment to Improve the High-Value Utilization Efficiency of Corn Stalk. Chem. Eng. J. 2024, 495, 153341. [Google Scholar] [CrossRef]
  4. Nguyen, H.V.; Nguyen, C.D.; Tran, T.V.; Hau, H.D.; Nguyen, N.T.; Gummert, M. Energy Efficiency, Greenhouse Gas Emissions, and Cost of Rice Straw Collection in the Mekong River Delta of Vietnam. Field Crops Res. 2016, 198, 16–22. [Google Scholar] [CrossRef]
  5. Nath, B.; Chen, G.; Bowtell, L.; Mahmood, R.A. Assessment of Densified Fuel Quality Parameters: A Case Study for Wheat Straw Pellet. J. Bioresour. Bioprod. 2023, 8, 45–58. [Google Scholar] [CrossRef]
  6. Zhao, H.; Huang, Y.; Liu, Z.; Liu, W.; Zheng, Z. Applications of Discrete Element Method in the Research of Agricultural Machinery: A Review. Agriculture 2021, 11, 425. [Google Scholar] [CrossRef]
  7. Lysych, M.N. Review of Numerical Methods for Modeling the Interaction of Soil Environments with the Tools of Soil Tillage Machines. J. Phys. Conf. Ser. 2019, 1399, 44014. [Google Scholar] [CrossRef]
  8. Du, C.; Han, D.; Song, Z.; Chen, Y.; Chen, X.; Wang, X. Calibration of Contact Parameters for Complex Shaped Fruits Based on Discrete Element Method: The Case of Pod Pepper (Capsicum Annuum). Biosyst. Eng. 2023, 226, 43–54. [Google Scholar] [CrossRef]
  9. Xu, C.; Xu, F.; Tang, H.; Wang, J. Determination of Characteristics and Establishment of Discrete Element Model for Whole Rice Plant. Agronomy 2023, 13, 2098. [Google Scholar] [CrossRef]
  10. Dai, F.; Zhao, Y.; Liu, Y.; Shi, R.; Xin, S.; Fu, Q.; Zhao, W. Analysis and Performance Test on Dynamic Seed Corn Threshing and Conveying Process with Variable Diameter and Spacing. Int. J. Agric. Biol. Eng. 2023, 16, 259–266. [Google Scholar] [CrossRef]
  11. Leblicq, T.; Smeets, B.; Vanmaercke, S.; Ramon, H.; Saeys, W. A Discrete Element Approach for Modelling Bendable Crop Stems. Comput. Electron. Agric. 2016, 124, 141–149. [Google Scholar] [CrossRef]
  12. Schramm, M.; Tekeste, M.Z. Wheat Straw Direct Shear Simulation Using Discrete Element Method of Fibrous Bonded Model. Biosyst. Eng. 2022, 213, 1–12. [Google Scholar] [CrossRef]
  13. Mao, H.; Wang, Q.; Li, Q. Modelling and Simulation of the Straw-Grain Separation Process Based on a Discrete Element Model with Flexible Hollow Cylindrical Bonds. Comput. Electron. Agric. 2020, 170, 105229. [Google Scholar] [CrossRef]
  14. Schramm, M.; Tekeste, M.Z.; Plouffe, C.; Harby, D. Estimating Bond Damping and Bond Young’s Modulus for a Flexible Wheat Straw Discrete Element Method Model. Biosyst. Eng. 2019, 186, 349–355. [Google Scholar] [CrossRef]
  15. Li, W.; Zhang, F.; Luo, Z.; Zheng, E.; Pan, D.; Qian, J.; Yao, H.; Wang, X. Straw Movement and Flow Field in a Crushing Device Based on CFD-DEM Coupling with Flexible Hollow Straw Model. Biosyst. Eng. 2024, 242, 140–153. [Google Scholar] [CrossRef]
  16. Leblicq, T.; Smeets, B.; Ramon, H.; Saeys, W. A Discrete Element Approach for Modelling the Compression of Crop Stems. Comput. Electron. Agric. 2016, 123, 80–88. [Google Scholar] [CrossRef]
  17. Li, Y.; Wang, J.; Qiu, X.; Ge, Y.; Zhang, J.; Pu, Y. Study on the Compressive Mechanical Properties of Greenfeed Sweet Sorghum. In Proceedings of the 2018 3rd International Conference on Mechanical, Control and Computer Engineering (ICMCCE), Huhhot, China, 14–16 September 2018; pp. 10–15. [Google Scholar] [CrossRef]
  18. Song, J.; Li, G.; Liu, Y.; Zou, M. Quasi-Static and Dynamic Mechanical Properties of Reed Straw. Lat. Am. J. Solids Struct. 2024, 21, e534. [Google Scholar] [CrossRef]
  19. Tang, H.; Xu, W.; Zhao, J.; Xu, C.; Wang, J. Comparison of Rice Straw Compression Characteristics in Vibration Mode Based on Discrete Element Method. Biosyst. Eng. 2023, 230, 191–204. [Google Scholar] [CrossRef]
  20. Liu, W.; Su, Q.; Fang, M.; Zhang, J.; Zhang, W.; Yu, Z. Parameters Calibration of Discrete Element Model for Corn Straw Cutting Based on Hertz-Mindlin with Bonding. Appl. Sci. 2023, 13, 1156. [Google Scholar] [CrossRef]
  21. Li, S.; Huan, X.; Wang, T.; Hui, Y.; You, Y.; Wang, D. Biomechanical Properties and Discrete Element Modeling of PSR Stalks during Silage Harvest. Comput. Electron. Agric. 2024, 217, 108644. [Google Scholar] [CrossRef]
  22. Zu, H.; He, K.; Liu, W.; Liu, J.; Song, Z.; Su, Y. Interaction Properties of Wine Grapes: DEM Analysis and Experimental Investigation. J. Food Eng. 2025, 387, 112347. [Google Scholar] [CrossRef]
  23. Fan, G.; Wang, S.; Shi, W.; Gong, Z.; Gao, M. Simulation Parameter Calibration and Test of Typical Pear Varieties Based on Discrete Element Method. Agronomy 2022, 12, 1720. [Google Scholar] [CrossRef]
  24. Sun, K.; Yu, J.; Zhao, J.; Liang, L.; Wang, Y.; Yu, Y. A DEM-Based General Modeling Method and Experimental Verification for Wheat Plants in the Mature Period. Comput. Electron. Agric. 2023, 214, 108283. [Google Scholar] [CrossRef]
  25. Fang, W.; Wang, X.; Han, D.; Chen, X. Review of Material Parameter Calibration Method. Agriculture 2022, 12, 706. [Google Scholar] [CrossRef]
  26. Sharma, R.S.; Sauret, A. Experimental Models for Cohesive Granular Materials: A Review. Soft Matter 2025, 21, 2193–2208. [Google Scholar] [CrossRef] [PubMed]
  27. Jia, X.; Zheng, X.; Chen, L.; Liu, C.; Song, J.; Zhu, C.; Xu, J.; Hao, S. Discrete Element Flexible Modeling and Experimental Verification of Rice Blanket Seedling Root Blanket. Comput. Electron. Agric. 2025, 233, 110155. [Google Scholar] [CrossRef]
  28. Liu, L.; Wang, X.; Zhang, X.; Zhong, X.; Wei, Z.; Geng, Y.; Cheng, X.; Zhao, K.; Bai, M. Determination and Verification of Parameters for the Discrete Element Modelling of Single Disc Covering of Flexible Straw with Soil. Biosyst. Eng. 2023, 233, 151–167. [Google Scholar] [CrossRef]
Figure 1. Surface corn stalks.
Agriculture 15 01824 g001
Figure 2. Universal testing machine and loading methods.
Agriculture 15 01824 g002
Figure 3. Determination of restitution coefficients.
Agriculture 15 01824 g003
Figure 4. Determination of contact parameters for damaged and complete corn stalks.
Agriculture 15 01824 g004
Figure 5. Modeling and bonding principles of damaged and complete corn stalks.
Agriculture 15 01824 g005
Figure 6. Comparison of actual and simulated angles of repose.
Agriculture 15 01824 g006
Figure 7. A curve diagram of compression and tensile force versus displacement.
Agriculture 15 01824 g007aAgriculture 15 01824 g007b
Figure 8. A processing diagram of the results of the angle of repose test.
Agriculture 15 01824 g008
Figure 9. Sensitivity analysis of angle repose.
Agriculture 15 01824 g009
Figure 10. Pareto chart of parameters on β1.
Agriculture 15 01824 g010
Figure 11. Response surface analysis results.
Agriculture 15 01824 g011
Figure 12. Axial compression simulation results of complete and damaged corn stalks.
Agriculture 15 01824 g012
Figure 13. Radial compression results of complete stalks.
Agriculture 15 01824 g013
Figure 14. Particle velocity direction of complete stalks under radial compression..
Agriculture 15 01824 g014
Figure 15. Complete stalk particle changes during radial compression.
Agriculture 15 01824 g015
Figure 16. Radial compression normal force distribution of complete stalk particles.
Agriculture 15 01824 g016
Figure 17. Radial compression normal force of complete stalk.
Agriculture 15 01824 g017
Figure 18. Radial compression Maximum equivalent stress distribution of complete stalk.
Agriculture 15 01824 g018
Figure 19. Radial compression results of damaged stalks.
Agriculture 15 01824 g019
Figure 20. Particle velocity direction of damaged stalks under radial compression.
Agriculture 15 01824 g020
Figure 21. Damaged stalk particle changes during radial compression.
Agriculture 15 01824 g021
Figure 22. Radial compression normal force distribution of damaged stalk particles.
Agriculture 15 01824 g022
Figure 23. Radial compression normal force of damaged stalk.
Agriculture 15 01824 g023
Figure 24. Radial compression maximum equivalent stress distribution of damaged stalk.
Agriculture 15 01824 g024
Table 1. Measured contact parameters of complete corn stalks.
ParameterInteraction TypeValue
Coefficient of restitutionStalk–steel0.255–0.661
Stalk–stalk0.174–0.572
Core–core0.096–0.335
Coefficient of static frictionStalk–steel0.074–0.24
Stalk–stalk0.049–0.156
Core–core0.185–0.476
Coefficient of rolling frictionStalk–steel0.059–0.233
Stalk–stalk0.025–0.089
Core–core0.129–0.304
Table 2. Measured contact parameters of damaged corn stalks.
ParameterInteraction TypeValue
Coefficient of restitutionStalk–steel0.179–0.422
Stalk–stalk0.114–0.376
Coefficient of static frictionStalk–steel0.124–0.412
Stalk–stalk0.085–0.377
Coefficient of rolling frictionStalk–steel0.092–0.215
Stalk–stalk0.068–0.251
Table 3. Results and analysis of angle of repose measurements.
NumberSimulation Test Value (N)Simulation Test Value (N)Error (N)Error Percentage (%)95% Confidence IntervalRMSE (N)R2
135.4435.310.130.37[−1.79, 2.25]0.64°0.89
235.7336.440.711.99
334.6633.591.073.09
430.8131.280.471.53
531.230.890.310.99
636.2635.770.491.35
733.8934.260.371.09
833.2132.90.310.93
931.0329.781.254.03
1032.2531.970.280.87
Table 4. Parameter list of Plackett–Burman test.
SymbolParameter (s)Level (s)
−1+1
X1Coefficient of restitution for collision between complete corn stalks0.170.57
X2Coefficient of static friction between complete corn stalks0.050.15
X3Coefficient of rolling friction between complete corn stalks0.020.08
X4Coefficient of restitution for collision between complete corn stalks and steel plates0.250.66
X5Coefficient of static friction between complete corn stalks and steel plates0.020.24
X6Coefficient of rolling friction between complete corn stalks and steel plates0.060.23
X7Coefficient of restitution for collision between damaged corn stalks and complete corn stalks0.170.39
X8Coefficient of static friction between damaged corn stalks and complete corn stalks0.080.37
X9Coefficient of rolling friction between damaged corn stalks and complete corn stalks0.070.25
X10Coefficient of restitution for collision between damaged corn stalks and steel plates0.180.42
X11Coefficient of static friction between damaged corn stalks and steel plates0.120.41
X12Coefficient of rolling friction between damaged corn stalks and steel plates0.10.21
X13Coefficient of restitution for collision between damaged corn stalks0.10.33
X14Coefficient of static friction between damaged corn stalks0.180.47
X15Coefficient of rolling friction between damaged corn stalks0.120.3
X16X19Virtual parameters————
Table 5. Results of the Plackett–Burman test.
NumberX1X2X3X4X5X6X7X8X9X10X11X12X13X14X15X16X17X18X19Angle of Repose β1/(°)
111−1−11111−11−11−1−1−1−111−129.21
2−111−1−11111−11−11−1−1−1−11125.22
31−111−1−11111−11−11−1−1−1−1132.25
411−111−1−11111−11−11−1−1−1−127.44
5−111−111−1−11111−11−11−1−1−142.99
6−1−111−111−1−11111−11−11−1−135.28
7−1−1−111−111−1−11111−11−11−134.44
8−1−1−1−111−111−1−11111−11−1132.9
91−1−1−1−111−111−1−11111−11−126.26
10−11−1−1−1−111−111−1−11111−1133.59
111−11−1−1−1−111−111−1−11111−136.77
12−11−11−1−1−1−111−111−1−1111140.77
131−11−11−1−1−1−111−111−1−111129.38
1411−11−11−1−1−1−111−111−1−11139.55
15111−11−11−1−1−1−111−111−1−1133.02
161111−11−11−1−1−1−111−111−1−125.31
17−11111−11−11−1−1−1−111−111−133.47
18−1−11111−11−11−1−1−1−111−11132.97
191−1−11111−11−11−1−1−1−111−1125.89
20−1−1−1−1−1−1−1−1−1−1−1−1−1−1−1−1−1−1−139.78
Table 6. Significance analysis of parameters in Plackett–Burman test.
ParameterSum of SquaresF Valuep Value
Model534.3313.260.0114
X12167.4562.320.0014
X1107.3239.940.0032
X776.9528.640.0059
X1366.4324.720.0076
X865.8524.510.0078
X632.0811.940.0259
Table 7. Design and results of the steepest ascent experiment for contact parameters.
Test NumberX12X1X7Angle of Repose β1Relative Error Z/%
10.10.170.1729.1611.02
20.120.30.2530.387.29
30.1550.370.2833.963.63
40.180.50.3536.2410.59
50.210.570.3938.6617.97
Table 8. Box–Behnken experimental design and results.
NumberX12X1X7Angle of Repose β1
10.120.3350.2830.96
20.120.3350.2529.58
30.13750.3350.26534.11
40.13750.3350.26533.76
50.1550.3350.2837.22
60.13750.3350.26533.76
70.120.30.26528.94
80.13750.30.2529.12
90.13750.3350.26533.77
100.1550.3350.2537.24
110.13750.370.2834.15
120.13750.370.2533.78
130.120.370.26529.78
140.1550.30.26534.24
150.13750.3350.26534.99
160.13750.30.2831.26
170.1550.370.26538.46
Table 9. ANOVA results of the Box–Behnken test after optimization.
SourceSum of SquaresDegrees of FreedomMean SquareF Valuep Value
Model133.73914.8650.23<0.0001 **
X1297.3197.3328.93<0.0001 **
X119.88119.8867.19<0.0001 **
X71.8711.876.330.0401 *
X12 × 12.8612.869.660.0171 *
AC0.4910.491.660.239
X1X70.783210.78322.650.1477
X1220.212710.21270.7190.4245
X128.8318.8329.830.0009 **
X721.2911.294.350.0755
Residual2.0770.2958
Lack of Fit0.940830.31361.110.4431
Error1.1340.2825
Total135.816
Note: * indicates that the term is significant, p < 0.05; ** indicates that the term is highly significant, p < 0.01.
Table 10. Results of tests for radial compression of complete stalks.
NumberSimulation Test Value (N)Simulation Test Value (N)Error (N)Error Percentage (%)95% Confidence IntervalRMSE (N)R2
1248.14262.4814.345.78[−1.23, 4.33]9.210.97
2252.21266.4714.265.65
3240.58252.58124.99
4244.66244.36−0.3−0.12
5260.59255.26−5.33−2.05
6255.74266.710.964.29
7240.41249.449.033.76
8252.68242.28−10.4−4.12
9255.64256.360.720.28
10252.88245.19−7.69−3.04
Table 11. Results of tests for radial compression of damaged stalks.
NumberSimulation Test Value (N)Simulation Test Value (N)Error (N)Error Percentage (%)95% Confidence IntervalRMSE (N)R2
135.2132.63−2.58−7.33[−16.23, −4.49]4.920.84
238.8134.41−4.4−11.34
337.6832.14−5.54−14.69
435.3732.72−2.65−7.49
534.2434.410.170.5
637.131.57−5.54−14.93
739.3531.62−7.73−19.64
838.2633.96−4.3−11.24
939.3933.61−5.78−14.67
1036.3633.59−2.77−7.62
Disclaimer/Publisher’s Note: The statements, opinions and data contained in all publications are solely those of the individual author(s) and contributor(s) and not of MDPI and/or the editor(s). MDPI and/or the editor(s) disclaim responsibility for any injury to people or property resulting from any ideas, methods, instructions or products referred to in the content.