1. Introduction
The agricultural sector continues to play a significant role in the economic structure of many European Union (EU) member states, particularly in the economies of Central and Eastern Europe (CEE). In this context, exports of agricultural raw materials are not only an important source of foreign income but also a key indicator of a country’s integration into international value chains. Analyzing the share of gross agricultural exports in total merchandise exports provides valuable insights into the degree of agrarian specialization, the competitiveness of the primary sector, and the level of economic diversification.
Recent research has analyzed the evolution of trade structures in Central and Eastern Europe, emphasizing the transition from agricultural and resource-based exports toward industrial and technology-driven sectors [
1,
2]. However, while these studies provide a broad overview of export diversification, they pay limited attention to the dynamics of agricultural raw material exports as a distinct component of trade. Moreover, the literature offers scarce empirical evidence on the interaction between regional trade shocks—such as the temporary liberalization of Ukrainian grain exports—and the structural transformation of the agricultural sector in emerging EU economies [
3].
This gap is particularly relevant because agricultural exports remain a crucial source of foreign income and a sensitive indicator of competitiveness for several Eastern EU member states. By integrating a long-term perspective (1995–2023) with short-term forecasts (2024–2026) using ARIMA models, this study addresses the lack of statistically grounded evidence on the evolution and future trajectory of agricultural raw material exports in the region. This approach contributes to the literature by combining trade structure analysis with quantitative forecasting, thereby providing policymakers with data-driven insights for the formulation of targeted agricultural and trade policies.
Countries such as Romania, Poland, Hungary, and Slovakia have faced considerable pressure on their domestic agricultural producers due to the surge in low-cost Ukrainian imports, which has led to a decline in internal competitiveness and the emergence of socio-economic tensions. In this context, analyzing the share of agricultural raw material exports in total merchandise exports becomes essential for understanding how these economies are being affected by regional trade reconfigurations.
The decline in the share of agricultural raw material exports in the total exports of Central and Eastern European economies reflects a broader structural transformation. However, the pace, drivers, and implications of this transition remain insufficiently understood. While previous studies have examined export diversification in the region, limited attention has been paid to the specific dynamics of agricultural exports and their vulnerability to external shocks, such as the recent trade disruptions caused by the Russia–Ukraine conflict and the temporary liberalization of Ukrainian grain exports. This knowledge gap is particularly critical because agricultural exports continue to play an important role in foreign income generation and rural development in several Eastern EU member states.
In this context, the study aims to investigate the evolution and structure of agricultural raw material exports, expressed as a percentage of total merchandise exports, for a selected group of European Union member states: Croatia, Bulgaria, the Czech Republic, Poland, Romania, Slovakia, and Hungary. The selection of these countries is justified both by their shared agricultural characteristics and by the similar challenges they have faced in the processes of economic transition, European integration, and adaptation to the Common Agricultural Policy (CAP). Thus, the main objectives of this study are as follows:
- −
Analyzing the evolution of agricultural raw material exports in seven emerging economies in Central and Eastern Europe from 1995 to 2023;
- −
Forecasting the share of agricultural raw material exports for the period 2024–2026 using ARIMA models;
- −
Identifying common trends, structural differences, and correlations among the analyzed economies.
Moreover, based on these objectives and the identified research gap, we have established four research hypotheses:
H1. Exports of agricultural raw materials have recorded a significant decrease in their share of total exports, amid the structural transformation of economies.
H2. There are positive correlations between the analyzed countries, indicating a synchronized regional dynamic.
H3. ARIMA models will confirm a trend of decrease or stabilization of agricultural raw materials exports in the coming years.
H4. Agriculture remains a strategic sector, despite the reduction of its share in total trade.
The significance of this study lies in its ability to provide empirical evidence on the transformation of agricultural trade structures in the context of European integration, global market volatility, and regional trade shocks. By offering country-specific forecasts and a regional comparative perspective, the study provides policymakers with a valuable decision-making tool for designing targeted trade and agricultural policies.
The importance of such an analysis is heightened by recent geopolitical and economic transformations triggered by the military conflict that began in Ukraine in February 2022. As a major player in the global grain market, Ukraine has become a significant supplier for the European market, especially after the European Union temporarily eased trade barriers. While this measure was justified in terms of political solidarity and ensuring global food security, it has caused significant distortions in the agricultural markets of EU member states along the Union’s eastern border.
This research contributes to the literature by providing a comprehensive long-term time series analysis of agricultural raw material exports in Central and Eastern European economies and by integrating ARIMA-based forecasting to project future trends. Unlike previous studies that focus broadly on export diversification, this paper specifically examines the dynamics of agricultural trade, highlighting both country-specific trajectories and regional synchronization through correlation analysis. By addressing this underexplored topic, the study fills a relevant gap in the academic debate on trade specialization and agricultural competitiveness within the European Union while offering practical, data-driven insights to support the design of targeted agricultural and trade policies.
Additionally, the study contributes to shaping an overall understanding of the vulnerabilities and agricultural potential of the analyzed countries, providing relevant data for informing public policy in the fields of foreign trade, agriculture, and rural development. Moreover, the results can assist European policymakers in designing support and protection mechanisms tailored to regional economic realities, ensuring an equitable approach in the context of external crises affecting the single market.
Moreover, one of the study’s novel aspects lies in its integrated regional comparative approach to the evolution of agricultural raw material exports in Central and Eastern Europe over an extended period (1995–2023), combined with short-term quantitative forecasts (2024–2026) using ARIMA (Autoregressive Integrated Moving Average) models. The study not only highlights the structural transitions of each economy toward higher value-added products but also emphasizes the synchronization of these trends across countries, as demonstrated by significant positive correlations among the time series.
Another original contribution is the statistical analysis of distribution and stationarity, which clarifies the volatility and structural instability of gross agricultural exports. Furthermore, the study provides a solid empirical foundation for the formulation of common regional policies by identifying shared trends and structural differences among the economies. At the same time, by combining a macroeconomic perspective with advanced statistical tools and by highlighting public and trade policy implications, this research makes a significant contribution to the academic literature on agricultural transformation and regional economic integration in Eastern Europe.
The paper is structured into four sections.
Section 2 presents a review of the relevant literature, analyzing previous studies on similar topics and comparing findings.
Section 3 outlines the research methodology, including the main methods and validation tests for the ARIMA-based forecasting models.
Section 4 contains the results of the statistical analysis conducted for the seven countries, along with projections for the upcoming period. The paper concludes with final observations and potential policy recommendations.
2. Literature Review
The accession to the European Union, the 2008 financial crisis, and the COVID-19 pandemic have brought substantial changes to the export structures of many Central and Eastern European countries. Based on a cluster analysis conducted on a sample of 11 national economies over a period of 22 years (2000–2001), Petrova and Sznajder Lee [
4] highlight a continuous process of differentiation and a growing trend toward specialization, with the Czech Republic, Hungary, Slovenia, and Slovakia emerging as the industrial core of the Central Europe. The authors note that if more diversified exports are considered, these economies are starting to look similar to Poland, Croatia, and Romania [
4]. In contrast, Estonia, Latvia, Lithuania, and Bulgaria form a distinct cluster, characterized by greater reliance on labor-intensive and natural resource-based goods and services.
Moreover, Schoer et al. [
5] present the concept and methodology of the “Raw Material Consumption” (RMC) indicator for the European Union, which measures the final consumption of raw materials across the entire production chain of goods and services. By combining the input–output method with life cycle assessment, the study highlights the significant role of services in raw material consumption and shows that the EU is self-sufficient in biomass and non-metallic minerals but dependent on imports of fossil fuels and metal ores. The results also emphasize the substantial impact of including capital formation on the RMC value.
Furthermore, Sheker and Şimdi [
6] examine the interdependence and interaction mechanisms of high-technology exports among Central and Eastern European member states. Estimates based on a spatial panel model reveal that an increase in high-technology exports to neighboring economies stimulates similar exports to other countries within the region. Moreover, their findings indicate a positive and statistically significant impact of GDP per capita and investment in research and development on high-technology exports in EU member states undergoing economic transition.
Similar to Petrova and Sznajder Lee [
4], Staszczak [
7] examines the strategic dependency of certain European Union member states on raw material imports, emphasizing the critical role of these materials in industrial and agricultural production, while identifying threats to future economic development. In 2016, fifteen member states were net importers of raw materials, with Germany, Italy, Belgium, and Spain remaining the largest importers in 2019 and 2021. The number of net importers decreased to fourteen in 2019 and thirteen in 2021, although many deepened their trade deficits. The “Dutch paradox” explains the Netherlands’ status as the EU’s leading net exporter despite its reliance on imports. The findings have practical implications for shaping the EU’s short- and long-term economic and trade policies.
Moving on, Kos-LaBedowicz and Taar [
3] investigate the impact of the Russia–Ukraine war on the trade resilience of Central and Eastern European countries, specifically developing a Trade Vulnerability Index to use in this context. Drawing on data from 2016 to 2023, the research reveals that trade remained largely resilient during the first year of the conflict, except for the Baltic states and Poland. Furthermore, countries such as Slovakia and the Czech Republic, although classified as vulnerable according to the TVI, demonstrated strong adaptive capacity. The study confirms that high trade vulnerability does not necessarily reduce a country’s ability to respond to external shocks. The conclusions offer valuable insights for the development of economic policies aimed at strengthening trade resilience in the region.
Along the same lines Petrova and Szarder [
8] examine the impact of European integration on economic redistribution in Central and Eastern Europe. While accession to the European Union has created new economic opportunities, it has also introduced certain constraints. Using a cross-sectional time series analysis of 11 post-communist countries over the 2004–2018 period, the study investigates the influence of trade flows, cohesion funds, emigration, remittances, and membership in the Economic and Monetary Union on income redistribution. The findings indicate that emigration and trade reorientation toward the EU are associated with stronger income inequality reduction policies. In contrast, the adoption of the euro (EUR) is linked to lower levels of redistribution, and EU cohesion funds do not appear to have a significant impact on income disparities.
We continue our analysis with Grodzicki and Możdżeze [
9], who re-evaluate the hypothesis that the Central and Eastern European economies follow an export-led growth (ELG) model. Employing a macroeconomic framework grounded in Goodwinian distributive cycles, the study investigates the relationship between productivity, employment, and the wage share. The research addresses the apparent contradiction between the characteristics of the ELG model and the observed increases in wages and employment in the region following the global financial crisis. The findings suggest that CEE economies have benefited from technological advancements, enabling them to remain competitive in export markets despite a distributional shift being more favorable to labor income.
Moreover, Gilbert and Muchová [
2] employ constant market share analysis to investigate changes in the export shares of CEE economies following the fifth enlargement of the EU, assessing their impact on export competitiveness. The findings reveal that although CEE transition economies have enhanced their global competitiveness, gains in market share have been constrained by a misalignment between the structure of regional exports and the evolution of global demand. The region’s adaptation to these shifts has been gradual, both in terms of product composition and target markets, while the improvement in export competitiveness has largely relied on increased market share within the EU. A newly applied methodology indicates that changes in the extensive margin have had a limited influence on these dynamics.
Furthermore, Hagemejer and Mick [
10] analyze the role of exports and participation in global value chains in facilitating economic growth. Employing advanced methodologies and an extensive dataset, the research analyses GDP growth in CEE countries, highlighting that, during the EU accession and integration period, exports served as the primary driver of economic development. The study also shows that exports helped the new members of the EU bring their national economies closer to the developed core of the Union. Through a panel data analysis, the key determinants of exported value added between 1995 and 2014 are identified as participation in global value chains, technology imports, and capital accumulation.
Tang’s [
11] study investigates the impact of export composition on economic growth in CEE member countries over the period 1999–2016. The findings confirm that exports of fuel and food significantly contributed to economic growth following EU accession, whereas agricultural exports had no notable effect. Due to differing comparative advantages, CEE economies continued to rely on the export of certain raw materials while simultaneously developing their manufactured goods exports. The study also highlights that exports of transport equipment, textiles, steel, and chemical products played a key role in accelerating economic growth—a dynamic attributed to economies of scale and expanded access to EU markets.
Three decades after the fall of communism and more than fifteen years following the major European Union enlargement (2004–2007), Kuc-Czarnecka et al. [
12] re-examines the divergent perspectives on the impact of free trade and EU expansion on CEE countries, analyzing two time periods: the first from 1991 to 2023, beginning with the dissolution of the Eastern European free trade zone, and the second covering the post-enlargement phase of 2004–2007. A clear distinction is made between older EU member states (prior to 2004), CEE countries that joined during the 2004–2007 enlargement, and CEE states that did not accede to the Union, such as Belarus, Moldova, and Ukraine. The findings suggest that the rapid integration of CEE countries into the global and European economy produced adverse effects, resulting in significant losses, similar to the migration processes observed in Latin America following the trade shock of the 1970s.
We continue our literature review with Pilinkiene [
13], who examines the impact of trade openness on economic growth and competitiveness in 11 CEE countries between 2000 and 2014. Although these economies exhibit high levels of trade openness, they follow diverse development and competitive trajectories and implement trade policies focused on regional cooperation to facilitate global integration. The empirical research employs correlation analysis, the Granger causality test, and the vector autoregression model to investigate the relationships between trade openness, economic growth, and competitiveness in both the short and long term. The results confirm an interdependence among these three components: economic growth stimulates trade openness, while improvements in competitiveness contribute to accelerating economic growth. Econometric tests indicate that the effects of economic growth on trade openness are persistent, and competitiveness has a significant impact on GDP per capita in the region.
The research conducted by Cieślik et al. [
14] examines the impact of euro adoption on trade in CEE countries, based on a gravity model, controlling for an extensive set of economic and trade policy variables. The model is estimated using panel data for OECD and CEE countries that engaged in trade relations with the rest of the world between 1993 and 2008. The results indicate that adopting the euro stimulates trade expansion in CEE economies, primarily due to the elimination of exchange rate risk and integration into the European Economic and Monetary Union. However, the estimates suggest that this effect is temporary and does not persist in the long term.
In the first decade following the fall of communism, Eastern European exports underwent a profound transformation against the backdrop of trade relations within the former communist bloc and the intensification of trade with Western countries [
15]. Moreover, the structural changes were accompanied by a significant shift in the composition of exports. While deliveries of production goods to former communist economies declined sharply, exports to the European Community—including heavy vehicles—experienced substantial growth, and these transformations reflect both the redirection of trade flows influenced by price competition and the emergence of comparative advantages shaped by market demands.
Other scholars, such as Jambor and Gorton [
16], examine the impact of EU accession on agriculture and rural regions in CEE countries, highlighting the factors influencing performance disparities among member states. The results indicate modest convergence with the older member states; however, the extent to which accession opportunities were capitalized upon varied significantly. The Baltic countries and Poland achieved the most notable progress, whereas Croatia, Slovenia, and Hungary exhibited slower growth rates. These findings support the concept of “convergence clubs,” emphasizing persistent differences in the pace of economic recovery among groups of states. To explain membership in these clubs with varying convergence speeds, the study identifies four key factors: initial conditions, pre-accession policies and strategies, administrative capacity, and post-accession policies.
Moving on, Davidescu et al. [
17] analyze the trade performance of Romania, a representative economy of Central and Eastern Europe, deeply integrated into global value chains and influenced by international economic relations, particularly with the European Union and China. Using gravity models on panel data from 2008 to 2019, the research demonstrates that Romanian exports are significantly affected by demand from major EU trading partners, imports from China and other global economies, as well as internal factors such as government efficiency, corruption control, and cultural values. The study also explores the capacity of Romanian exports to return to their pre-COVID-19 upward trend by simulating various economic recovery scenarios. The results indicate either a rapid recovery in 2021 (V-shaped scenario) or a slower recovery (U-shaped scenario), depending on how economic shocks propagate through domestic demand and trade.
Lastly, Lima [
18] analyzes and compares the performance of three traditional forecasting methods: ARIMA models and their extensions, time decomposition with linear regression, and the Holt–Winters method. These methods are applied to retail sales data from seven European countries, characterized by pronounced trends and seasonality. The results demonstrate that all models capture the seasonal structure of the data, but ARIMA provides the most accurate forecasts according to performance metrics such as MSE, RMSE, and MAPE. The Holt–Winters method also proves effective, being regarded as a viable alternative to ARIMA.
That being said, the literature highlights the profound structural transformations of CEE economies following EU accession and globalization. Several studies [
3,
4] emphasize increasing specialization, with the Czech Republic, Hungary, and Slovakia forming an industrial core, while Bulgaria and the Baltic states remain more resource dependent. Research on trade dependencies [
5,
7] highlights the vulnerability of EU economies reliant on raw materials, while studies by Șeker and Șimdi [
6] and Grodzicki and Możdżeze [
9] point to the role of technological advancement and high value-added exports in maintaining competitiveness. Moreover, the impact of EU integration and crises is widely discussed: Kuc-Czarnecka et al. [
12] and Pilinkiene [
13] show that financial crises and enlargement deepened regional disparities, while Cieślik et al. [
14] find that euro adoption boosts trade, though with limited long-term effects. In agriculture, Jambor and Gorton [
16] highlight uneven benefits from EU membership, with stronger performance in Poland and the Baltics, but stagnation in Croatia and Hungary. Davidescu et al. [
17] confirm that both external demand and domestic governance shape agricultural export performance. Methodologically, Lima [
18] demonstrates that ARIMA models outperform alternatives such as Holt–Winters and linear regressions for time series forecasting, supporting their use in this study.
This literature review reveals that while trade and economic transformations in the region are well documented, there remains a lack of targeted research on agricultural raw material exports and their future dynamics. Our study addresses this gap by combining country-specific ARIMA forecasting with an integrated regional analysis, contributing both empirically and methodologically to the literature.
While the reviewed studies provide valuable insights into export diversification, trade resilience, and the structural transformation of CEE economies, several gaps remain. First, most existing research has focused on aggregate trade structures or on high-technology exports, paying limited attention to the specific dynamics of agricultural raw material exports as a distinct component of trade. Second, previous studies have primarily adopted either cross-sectional or panel approaches, often neglecting country-specific time series forecasting that can better capture the unique structural trajectories of individual economies. Third, while there is recognition of external shocks—such as the Russia–Ukraine conflict—few works explicitly analyze their implications for agricultural trade patterns in the region.
Our study addresses these gaps by applying a country-level time series analysis combined with ARIMA forecasting, thereby offering a detailed and empirically grounded perspective. By doing so, it not only complements but also critically extends the existing literature, providing evidence-based insights to support both academic debate and policy formulation.
3. Research Methodology
Applying descriptive and inferential statistical methods enables a deeper understanding of economic and financial data and facilitates the extraction of relevant information for evidence-based decision-making. However, the interpretation of these statistical results must be carried out in accordance with the analytical context, requiring a rigorous selection of methodology based on the nature and distribution of the analyzed data.
This research lies at the intersection of agricultural economics, international trade, and applied econometrics, focusing on the structural transformation of emerging economies in CEE within the context of European integration. The study employs advanced time series econometric models (ARIMA) and statistical tests of normality, stationarity, and autocorrelation to examine the dynamics of agricultural raw material exports between 1995 and 2023, and to provide forecasts for 2024–2026. The paper contributes to the academic debate on trade specialization, structural economic change, and agricultural competitiveness in the context of globalization and EU trade policies. Its findings are relevant for scholars and policymakers interested in the design of Common Agricultural Policy (CAP) strategies, trade resilience mechanisms, and food security considerations in the European Union. The data were collected from the World Bank’s publicly available database [
19].
To assess whether the statistical series follows a normal distribution, the Shapiro–Wilk test was employed, given its recognized accuracy for small sample sizes of up to 50 observations. If the p-value associated with the test exceeds the significance threshold of 0.05, the null hypothesis (H0) of normal distribution can be accepted at a 95% confidence level.
For a series Yt, t = 1,…,n, the Shapiro–Wilk test [
20] for normality is defined as follows:
where yt represents the values of the original series Yt, ordered in ascending order (y1 ≤ y2 ≤ …≤ yn),
is the mean of the series, and pt are weights. The null hypothesis H
0 is rejected if W ≤ Wα, where the critical values Wα are tabulated by Shapiro and Wilk [
20] for the chosen significance level. The test also produces an associated
p-value, which, if greater than 0.05 at the chosen significance level
, validates the null hypothesis.
For estimating parameters in the regression models used within the ARIMA forecasting method, this analysis uses the least squares method, recognized for its efficiency in obtaining unbiased coefficient estimates. The statistical significance of the coefficients is validated through Student’s t-test, which tests the null hypothesis (H
0) that the regression coefficients are not significantly different from zero against the alternative hypothesis (H
1), which states that a significant difference exists. If the
p-value associated with the Student’s
t-test is less than the significance threshold of 0.05, the alternative hypothesis is accepted, indicating that the respective coefficients are statistically significant at a 95% confidence level [
21,
22].
Moreover, the F-test is employed to evaluate the overall significance of the model, with the null hypothesis (H0) stating that all model coefficients are insignificant—that is, none contribute meaningfully to explaining the dependent variable. The alternative hypothesis (H1) assumes that at least one coefficient is significantly different from zero. If the p-value associated with the F-test is below 0.05, the null hypothesis is rejected, leading to the conclusion that the model contains at least one statistically significant coefficient at the 5% significance level.
Moving on, autocorrelation occurs when residuals are correlated with one another, which may lead to underestimating the coefficients’ standard errors and misinterpreting significance tests. The Durbin–Watson test calculates a statistic (DW) based on the differences between residual values at two consecutive time points, according to the definition proposed by Durbin and Watson [
23]:
where n represents the number of observations. The Durbin–Watson statistic (DW) ranges between 0 and 4: if the value is closer to 0, the positive autocorrelation is stronger; while, if it is closer to 4, the negative autocorrelation is stronger. A value around 2 indicates the absence of autocorrelation. More precisely, the DW value is compared with the lower bound dL and upper bound dU from the Durbin–Watson tables for a given significance level. If DW lies within the interval (dU,4−dU), the null hypothesis H0 is accepted, indicating that the residuals are not autocorrelated.
Our methodological approach uses the Breusch–Godfrey test [
24,
25] to detect the presence of higher-order autocorrelation in the residuals of a regression model. It produces an associated
p-value, which allows testing the null hypothesis (H
0) to make sure that there is no higher-order autocorrelation in the errors. If this
p-value exceeds 0.05, the null hypothesis is accepted, indicating the absence of autocorrelation at the 5% significance level.
Another statistical test used in our analysis is the Dickey–Fuller test [
26], a fundamental statistical tool used to determine the stationarity of a time series. Stationarity is a key property in time series analysis, implying that the statistical parameters of the series, such as mean and variance, remain constant over time. The test assesses the presence of a unit root in an autoregressive (AR) model, a hypothesis that indicates non-stationarity of the series. A series containing a unit root tends to exhibit persistent evolution over time, showing upward or downward trends without reverting to a stable mean value. In order to improve estimation accuracy, this paper uses the extended version of the test, known as the Augmented Dickey–Fuller (ADF) test, which includes additional lag terms that correct for serial autocorrelation in the residuals. Moreover, the test can incorporate a constant and/or a deterministic trend, thereby adapting to various functional forms of the analyzed series. Due to this flexibility, the ADF test is frequently preferred in econometric practice.
The ADF test formulates the null hypothesis (H0) that the time series contains a unit root (indicating non-stationarity), while the alternative hypothesis (H1) assumes the absence of a unit root (i.e., stationarity). The test result is evaluated by comparing the test statistic value with critical values corresponding to predefined significance levels (1%, 5%, and 10%). If the test statistic is less than the critical value, the null hypothesis is rejected, suggesting that the series is stationary. Additionally, this interpretation can be supported by the associated p-value; if it is below the 0.05 threshold, the series is considered stationary at the 5% significance level.
The Autoregressive Conditional Heteroskedasticity (ARCH) test, proposed by Engle [
27], is a statistical tool used to detect the presence of conditional heteroskedasticity in a time series. Heteroskedasticity reflects non-constant variance of the errors in a regression model, and in the conditional context, it implies that the variance of the errors depends on their past values. The test aims to assess the null hypothesis (H
0) that no conditional heteroskedasticity is present, indicating constant variance of the residuals (homoscedasticity). The alternative hypothesis (H
1) postulates the existence of conditional heteroskedasticity, suggesting that the dispersion of the residuals varies according to their past values. The hypotheses are validated using a chi-square distributed test statistic, with the critical value determined according to the number of lag terms included in the model. If the test statistic exceeds the corresponding critical value, the null hypothesis is rejected, indicating the presence of conditional heteroskedasticity. Additionally, the test provides a
p-value; if this value is greater than 0.05, the null hypothesis is accepted, meaning there is insufficient evidence to support the presence of conditional heteroskedasticity at the 5% significance level.
The ARIMA (Autoregressive Integrated Moving Average) model is a statistical method used to analyze and forecast time series. It combines three essential components:
- −
AR (Autoregressive), where the model uses past values of the series to predict future values. This is represented by the parameter
p, which indicates the number of autoregressive terms included in the model. The general formula for the AR component is:
where
are the autoregressive coefficients,
c is a constant, and
is the random error at time
t.- −
I (Integration), which indicates how many times the series must be differenced to achieve stationarity. The parameter
d shows the number of times previous values are subtracted to remove trends. If
d is the order of differentiation, the transformed series can be obtained as
where
B is the lag operator and
d is the number of differentiations.
- −
MA (Moving Average), where the model considers past errors to improve predictions, with
q representing the number of lagged forecast errors incorporated. The general formula for the MA component is:
where
are the coefficients of the moving average.
Thus, the ARIMA model is denoted as ARIMA(
p,
d,
q). The ARIMA model combines these three components into a general model that can be written as:
where the series
was differencing
d times to make it stationary. For further details, see [
26].
4. Results
An analysis of
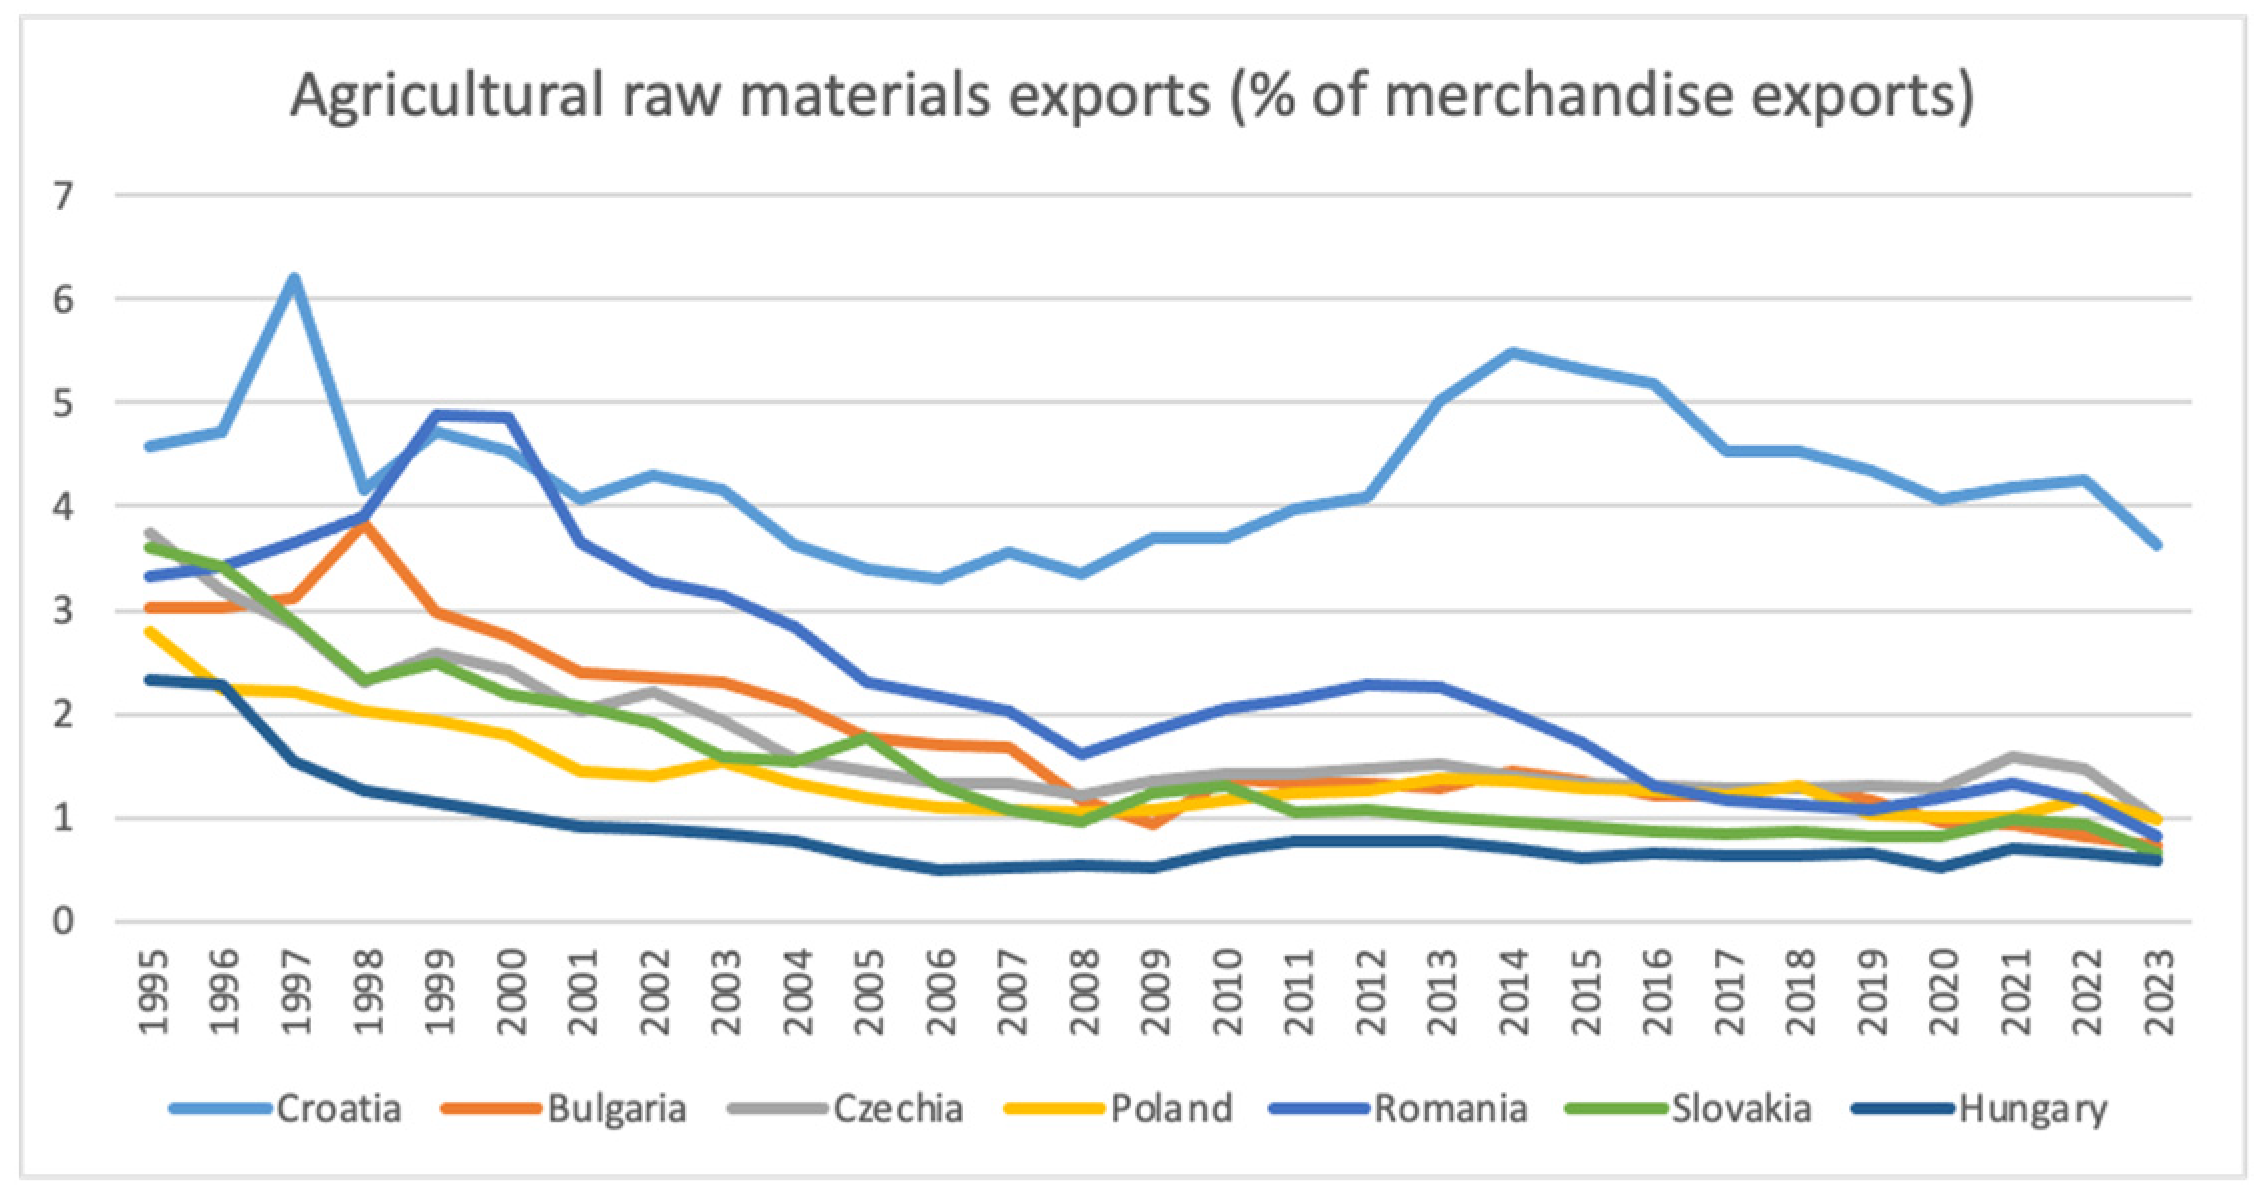
Figure 1 shows that the countries studied display a declining trend in the share of agricultural raw materials exports as a percentage of total merchandise exports over the period 1995–2023. Croatia stands out as the only country to have recorded an increase in the share of agricultural raw materials exports, reaching a peak of 6.20% in 1997. The chart indicates a downward trend for most countries, mainly driven by economic development and a strategic shift toward higher value-added exports, with an increasing focus on finished goods.
Table 1 reveals positive correlations among the seven countries, suggesting that imports of agricultural raw materials tend to move in the same direction over time. Strong correlations are observed between the following country pairs: Bulgaria–Poland (0.858), Bulgaria–Romania (0.898), Bulgaria–Slovakia (0.888), Czech Republic–Slovakia (0.966), Czech Republic–Poland (0.955), and Poland–Slovakia (0.921). These high correlation coefficients indicate a similar evolution of the share of agricultural exports within total exports, which may be attributed to similar trade policies, regional interdependence, or shared economic influences. In contrast, Croatia exhibits low correlation values with all other countries: Romania (0.206), Bulgaria (0.266), the Czech Republic (0.380), Poland (0.479), and Slovakia (0.256). This indicates that Croatia’s trajectory is more independent, possibly due to structural differences in foreign trade or variations in economic integration timelines (e.g., EU accession).
Table 2 shows the results of the Shapiro–Wilk test for assessing the normality of the distributions. It is observed that Croatia’s import distributions tend toward normality, as indicated by a
p-value greater than 0.05. In contrast, the export distributions for the other countries do not follow a normal distribution. Moreover,
Table 3 provides the descriptive statistics for exports of agricultural raw materials. The descriptive statistics show notable differences in the dynamics of agricultural raw material exports among the analyzed countries. Croatia has the highest average share (mean = 4.297%) and the lowest coefficient of variation (15.95%), indicating stability over time. In contrast, Hungary (mean = 0.861%) and Slovakia (mean = 1.497%) exhibit the highest coefficients of variation (54.01% and 53.67%, respectively), reflecting significant fluctuations in export shares. Romania (mean = 2.361%) shows the largest range between its minimum (0.825) and maximum (4.879) values, indicating volatility. Skewness is positive for most countries, suggesting that occasional peaks occur, except for Romania and Bulgaria, which display slightly negative skewness. Kurtosis values vary, with Hungary (5.182) showing a highly peaked distribution, while Romania and Bulgaria have flat distributions, reflecting more uniform variability.
Table 4 presents the results of the augmented Dickey–Fuller test for the initial series (EXPORT) and the differenced series D(EXPORT), in order to establish stationarity. The results of the Augmented Dickey–Fuller (ADF) test indicate that the export series for all analyzed countries are non-stationary in their original form, as reflected by high
p-values exceeding the 0.05 threshold. For instance, Romania (
p = 0.7253) and Bulgaria (
p = 0.5557) clearly fail to reject the null hypothesis of a unit root. However, after applying first-order differencing, all series become stationary, with
p-values dropping below 0.05 (e.g., Bulgaria
p = 0.0122, Poland
p = 0.0001), confirming the suitability of differenced data for ARIMA model estimation. These results validate the need for differencing as a prerequisite for building robust forecasting models.
To avoid unnecessary repetition, detailed explanations of the ARIMA model results are provided for Romania (
Table 5) as an example, while the same interpretation logic applies to the other countries. Similarly, each figure is discussed within its respective country analysis, focusing on the main trends and forecasts rather than duplicating identical explanations.
4.1. Romania
The following section presents an analysis of agricultural product exports (as a percentage of total merchandise exports) for the period 1995–2023, along with a forecast for the interval of 2024–2026. According to the descriptive statistical analysis (
Table 3), the average value during 1995–2023 was 2.36%, with a standard deviation of 1.13. The minimum value of 0.83% was recorded in 2023, while the maximum value of 4.88% occurred in 1999. The coefficient of variation stands at 47.78%, indicating a non-representative mean, as the data series is heterogeneous and values are not clustered around the average. In terms of temporal evolution, it is evident that the share of agricultural exports has declined over the 1995–2023 period.
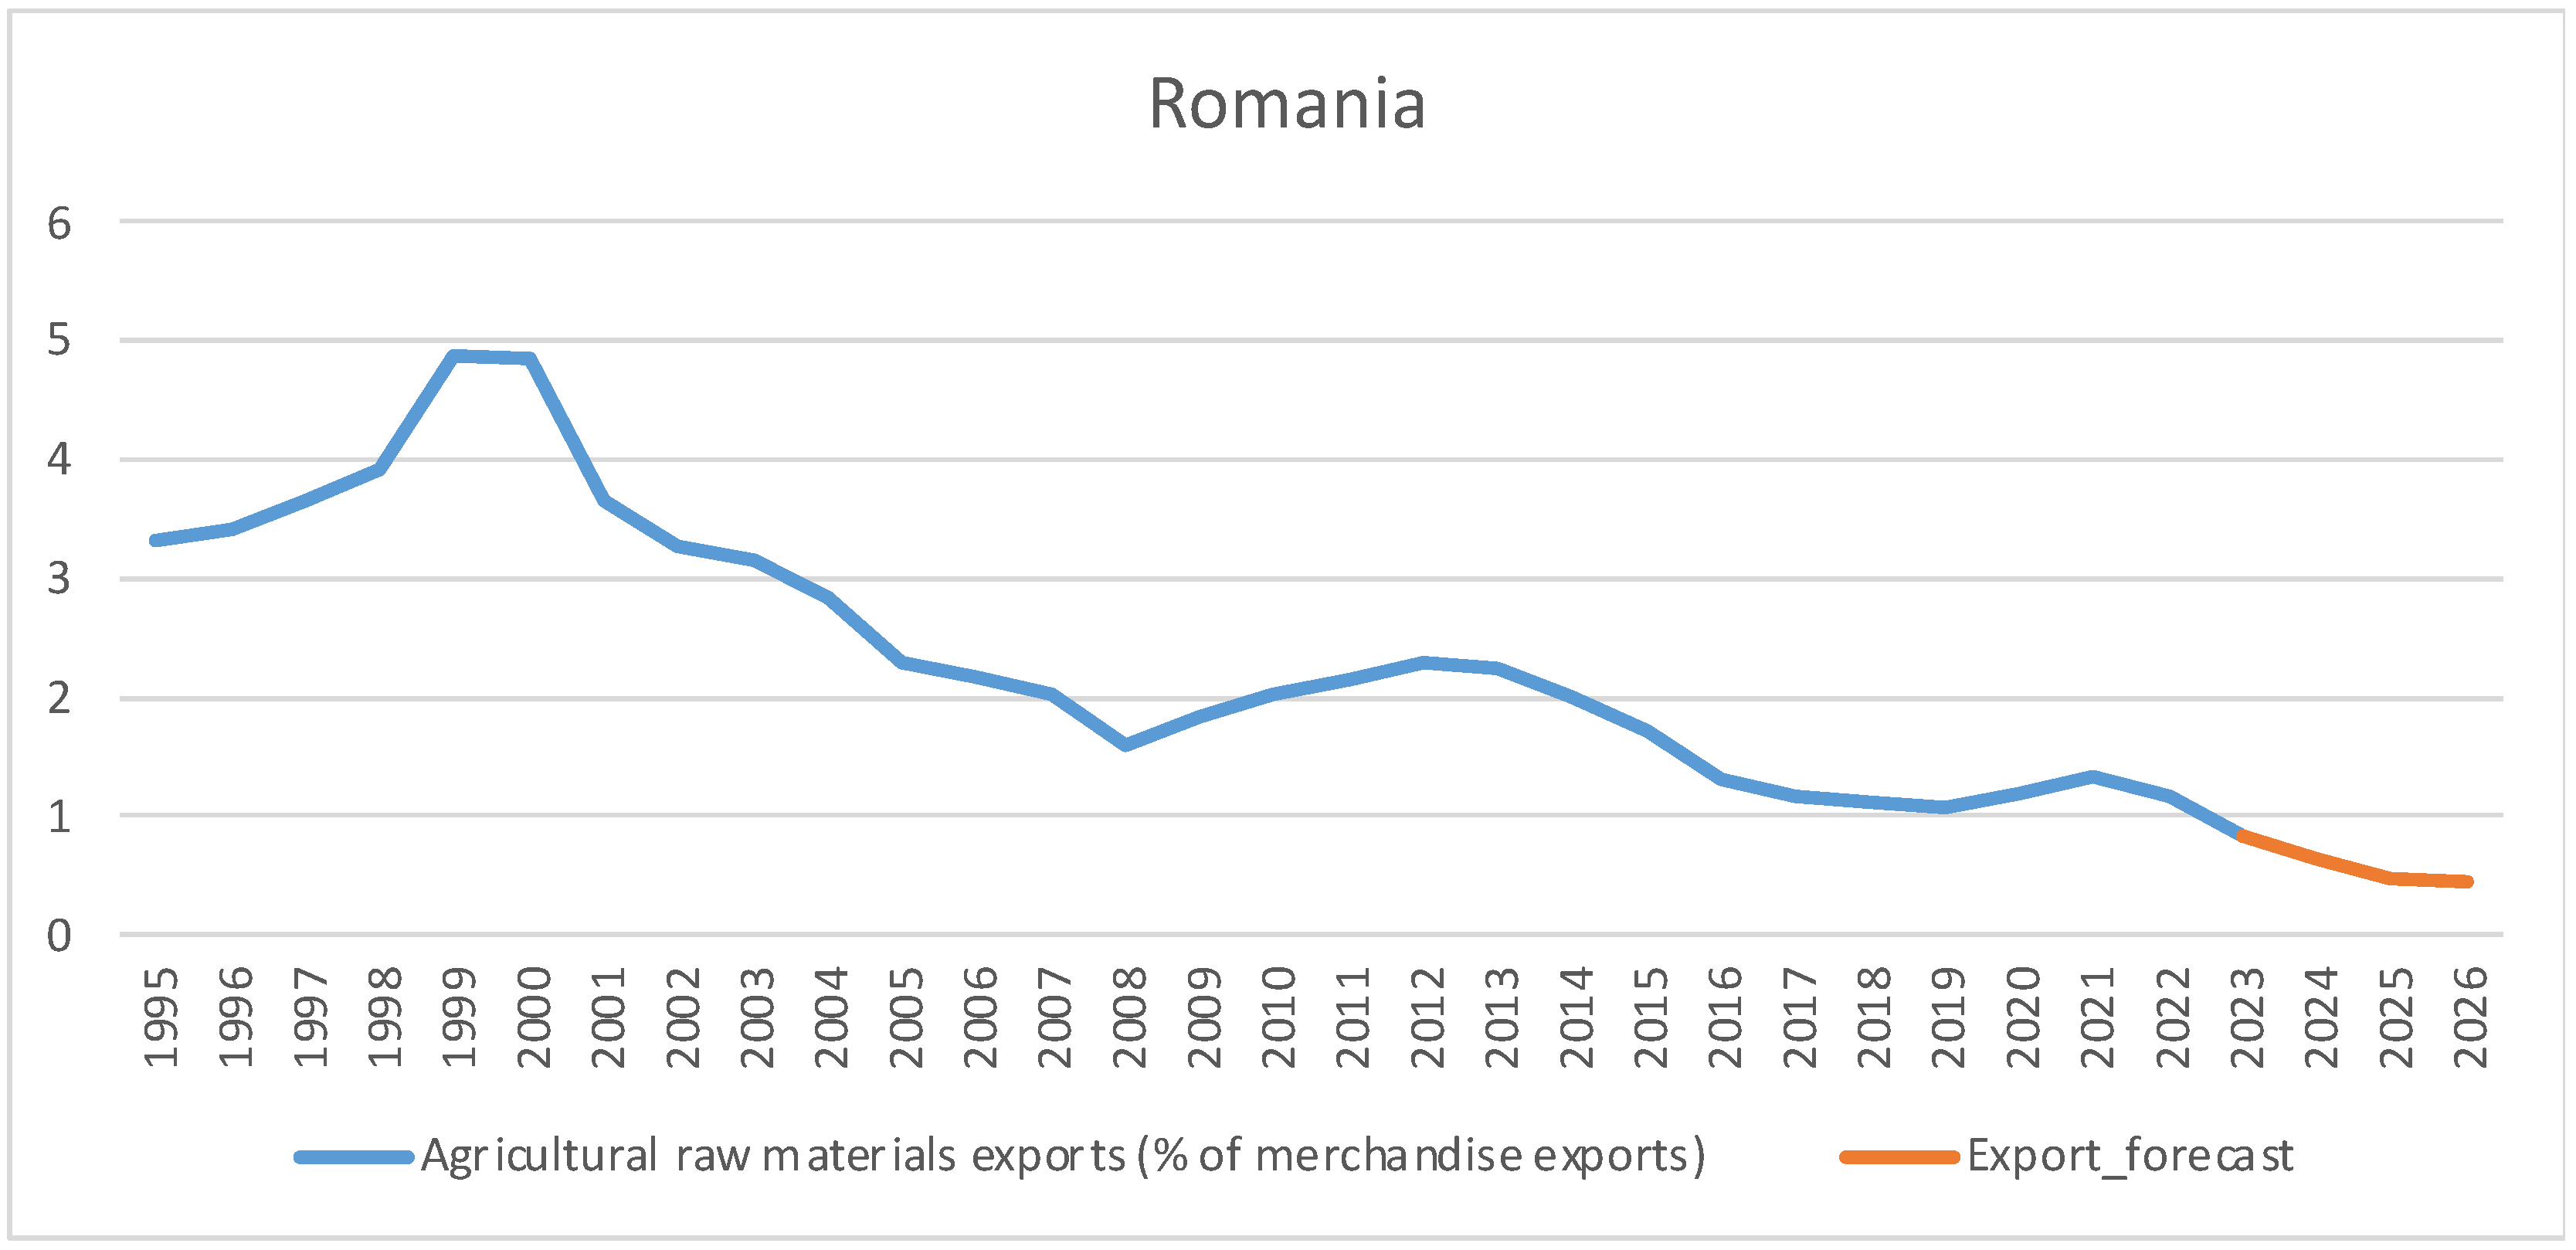
As we can see in
Figure 2, between 1995 and 2023, the share of agricultural raw material exports within Romania’s total merchandise exports changed significantly, indicating substantial transformations in the country’s foreign trade structure. Romania has become a key player in European agriculture and the largest exporter of agricultural raw materials in the EU. Through consistent shipments of wheat, maize, sunflower seeds, and oilseed meals, the country has secured a leading position in this sector. Between 1 July and 29 October 2023, over 2.6 million tons of common wheat were exported from Romania to European markets, marking a top performance in the field. Even so, according to the World Bank [
19], in 2023, agricultural raw material exports represented only about 0.83% of Romania’s total merchandise exports, indicating a relatively modest contribution of this sector to the country’s overall trade. This low share of 0.83% in 2023 represents a significant decrease compared with 3.74% recorded in 1995 and the peak of 4.88 from 1999 [
28]. This downward trend reflects a reconfiguration of Romania’s foreign trade structure, with an increasing orientation toward higher value-added products.
Moving on, the analysis uses the ARIMA model to forecast Romania’s exports, while the stationarity of the original series is tested using the Dickey–Fuller test with both a constant and a linear trend. Since the
p-value of the test is 0.7253—greater than the 0.05 significance level—the null hypothesis is not rejected, indicating that the original series is non-stationary (
Table 4), thus confirming the presence of a unit root. The first difference of the original series is then computed, resulting in a new series, D(EXPORT), which is stationary, as the associated
p-value of the Dickey–Fuller test is 0.018. This allows the differenced series to be used for ARIMA modeling.
Based on the correlogram analysis of the differenced series D(EXPORT), several ARIMA (p,1,q) models were evaluated. The ARIMA(4,1,6) model was selected (
Table 5), as it yielded lower values for the Akaike [
29] and Schwarz [
30] information criteria, indicating it as the most suitable model to describe the time series dynamics of exports. The
p-values associated with the t-statistic test are below 0.05, confirming the statistical significance of the estimated coefficients. The F-statistic value is 48.92, with a
p-value of zero, further validating the overall model. The Durbin–Watson statistic of 2.04 and the Breusch–Godfrey test with a
p-value of 0.92 confirm that the residuals are not autocorrelated. According to the ARCH test, the ARIMA(4,1,6) model is homoscedastic, with a
p-value of 0.53, indicating that the residuals have constant variance over time. The fact that all autoregressive (AR) and moving average (MA) roots are within the unit circle confirms that the ARIMA(4,1,6) model is stationary and invertible, ensuring long-term forecast stability.
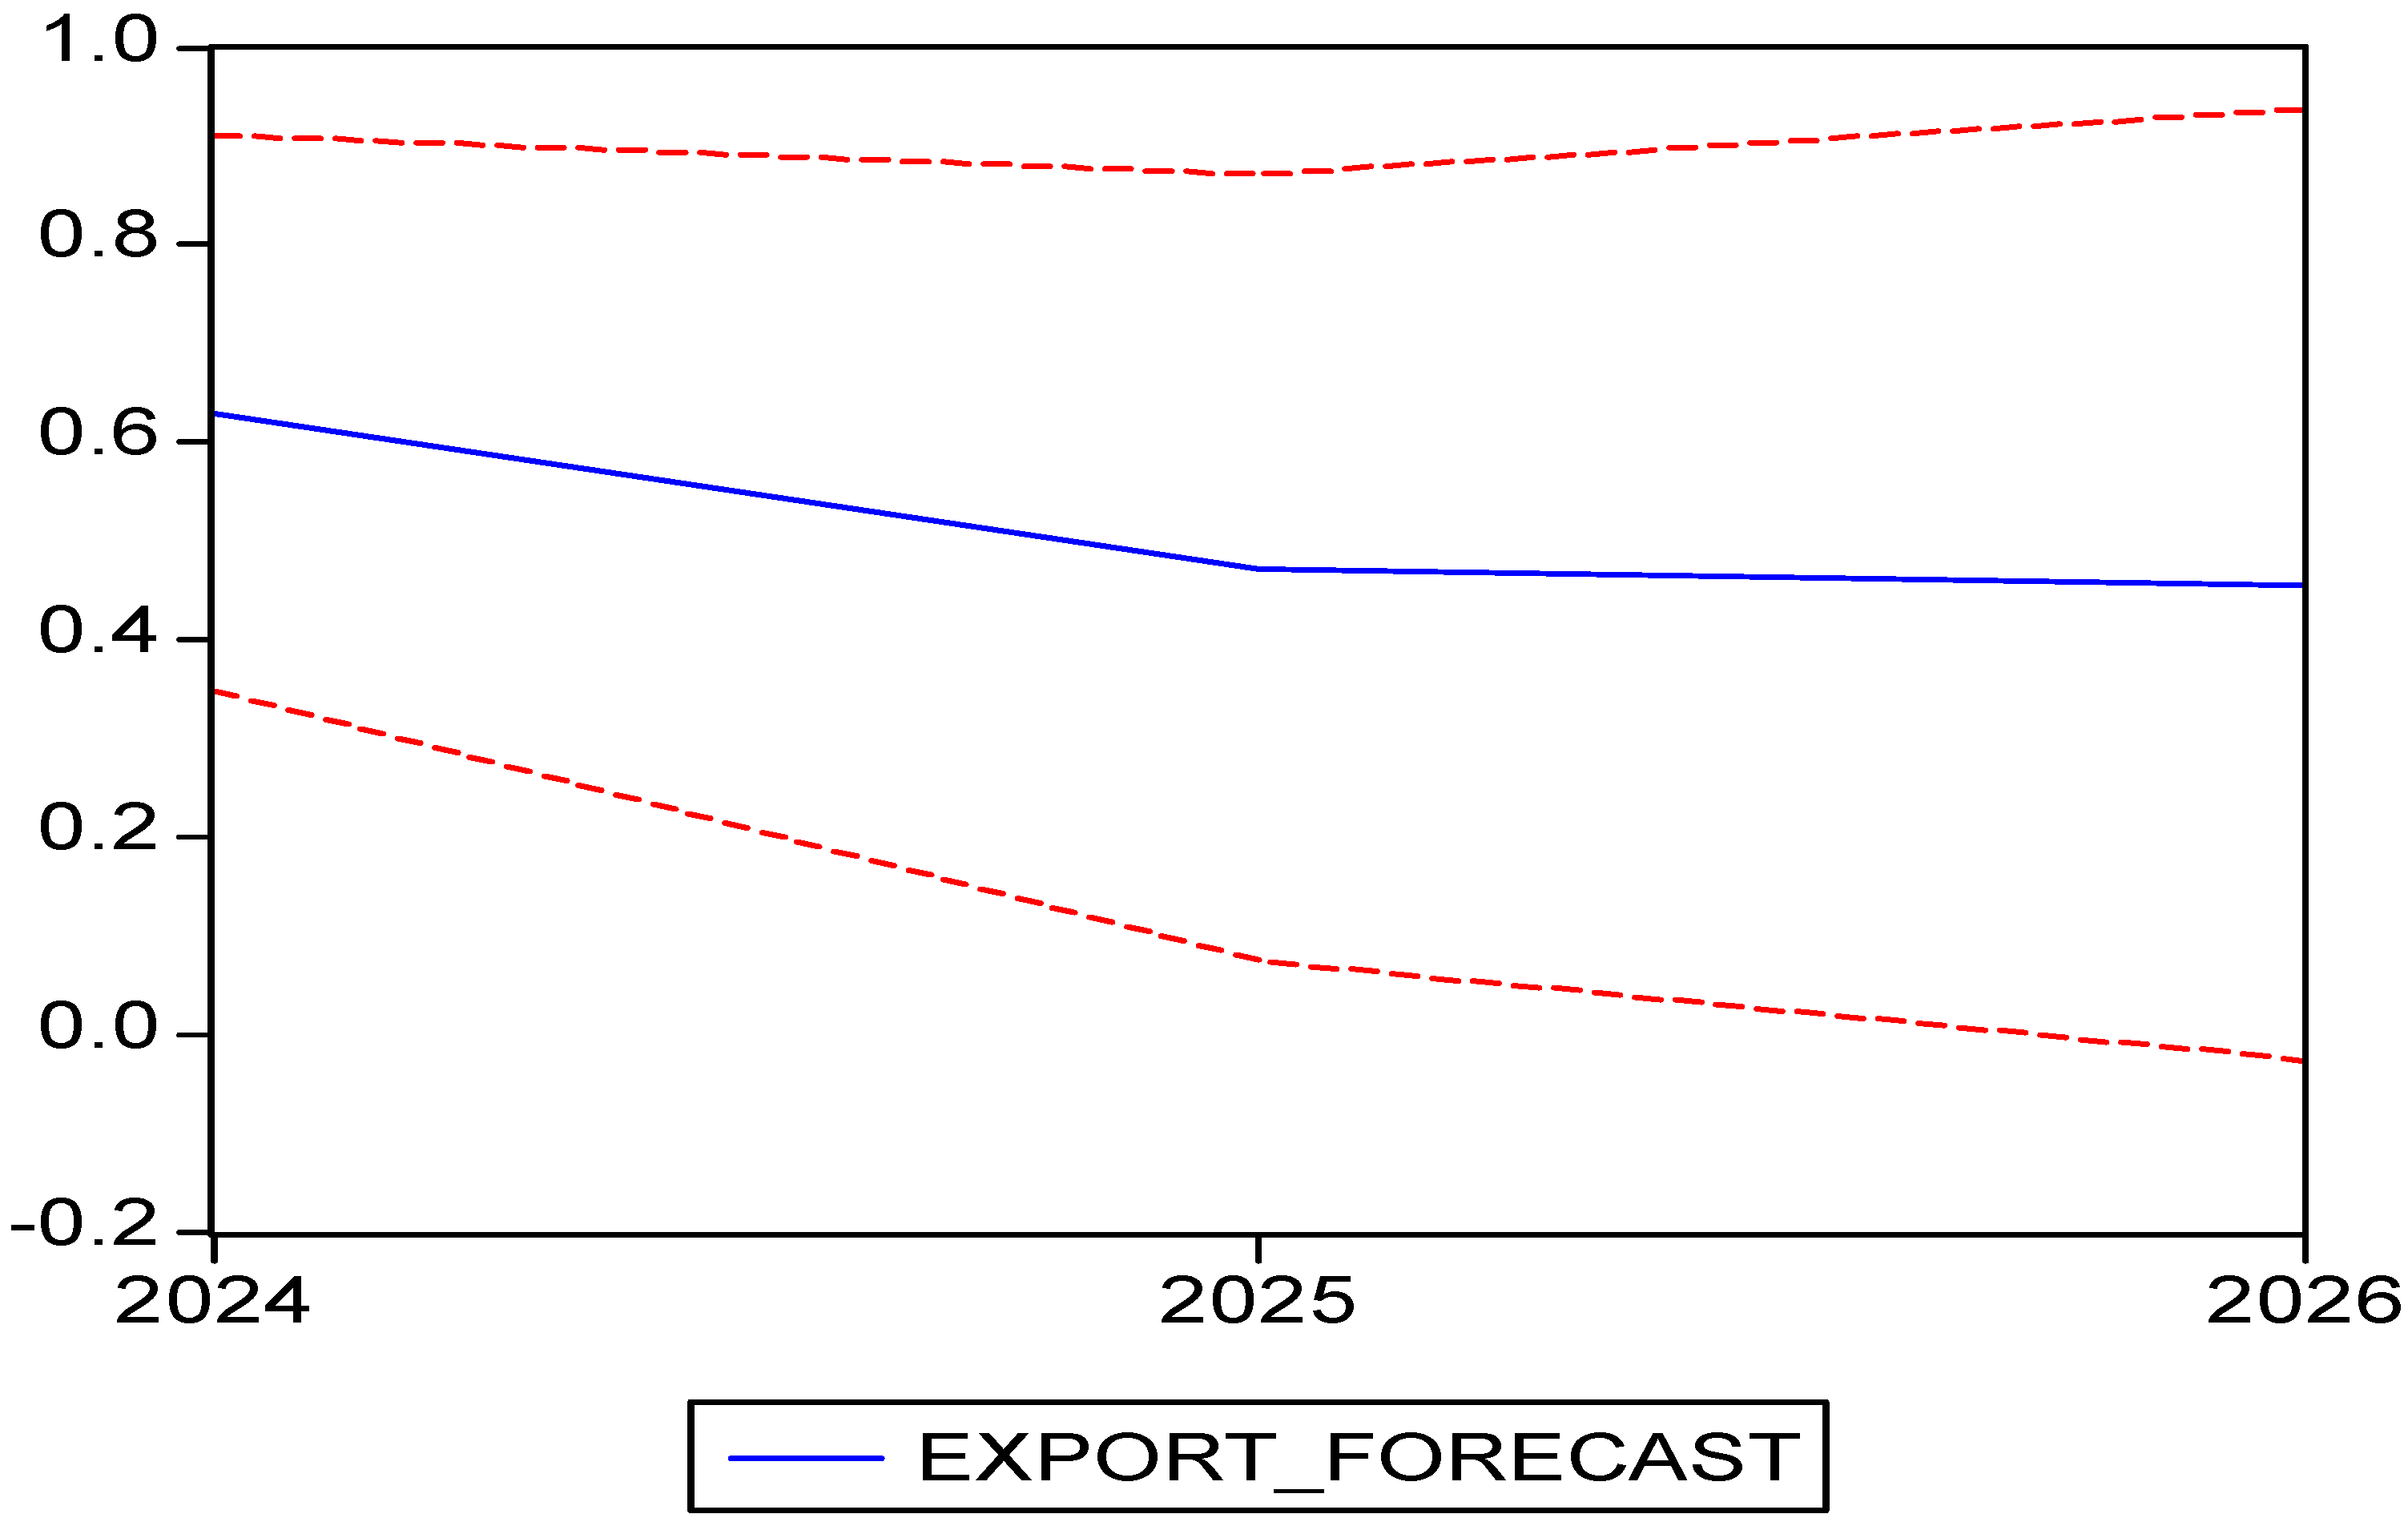
The forecast is presented in
Table 6 and graphically illustrated with confidence intervals in
Figure 3. Historical data alongside the forecast are shown in
Figure 2. The ARIMA(4,1,6) model generates forecasts for the period 2024–2026, indicating a continued decline in agricultural raw material exports in the coming years.
For clarity and to avoid unnecessary repetition, the ARIMA(4,1,6) model for Romania is presented in detail as an illustrative example, including the interpretation of the statistical tests. The same modeling procedure and interpretation logic apply to all other ARIMA models (e.g., ARIMA(2,1,6), ARIMA(2,1,2)) used for the remaining countries.
4.2. Poland
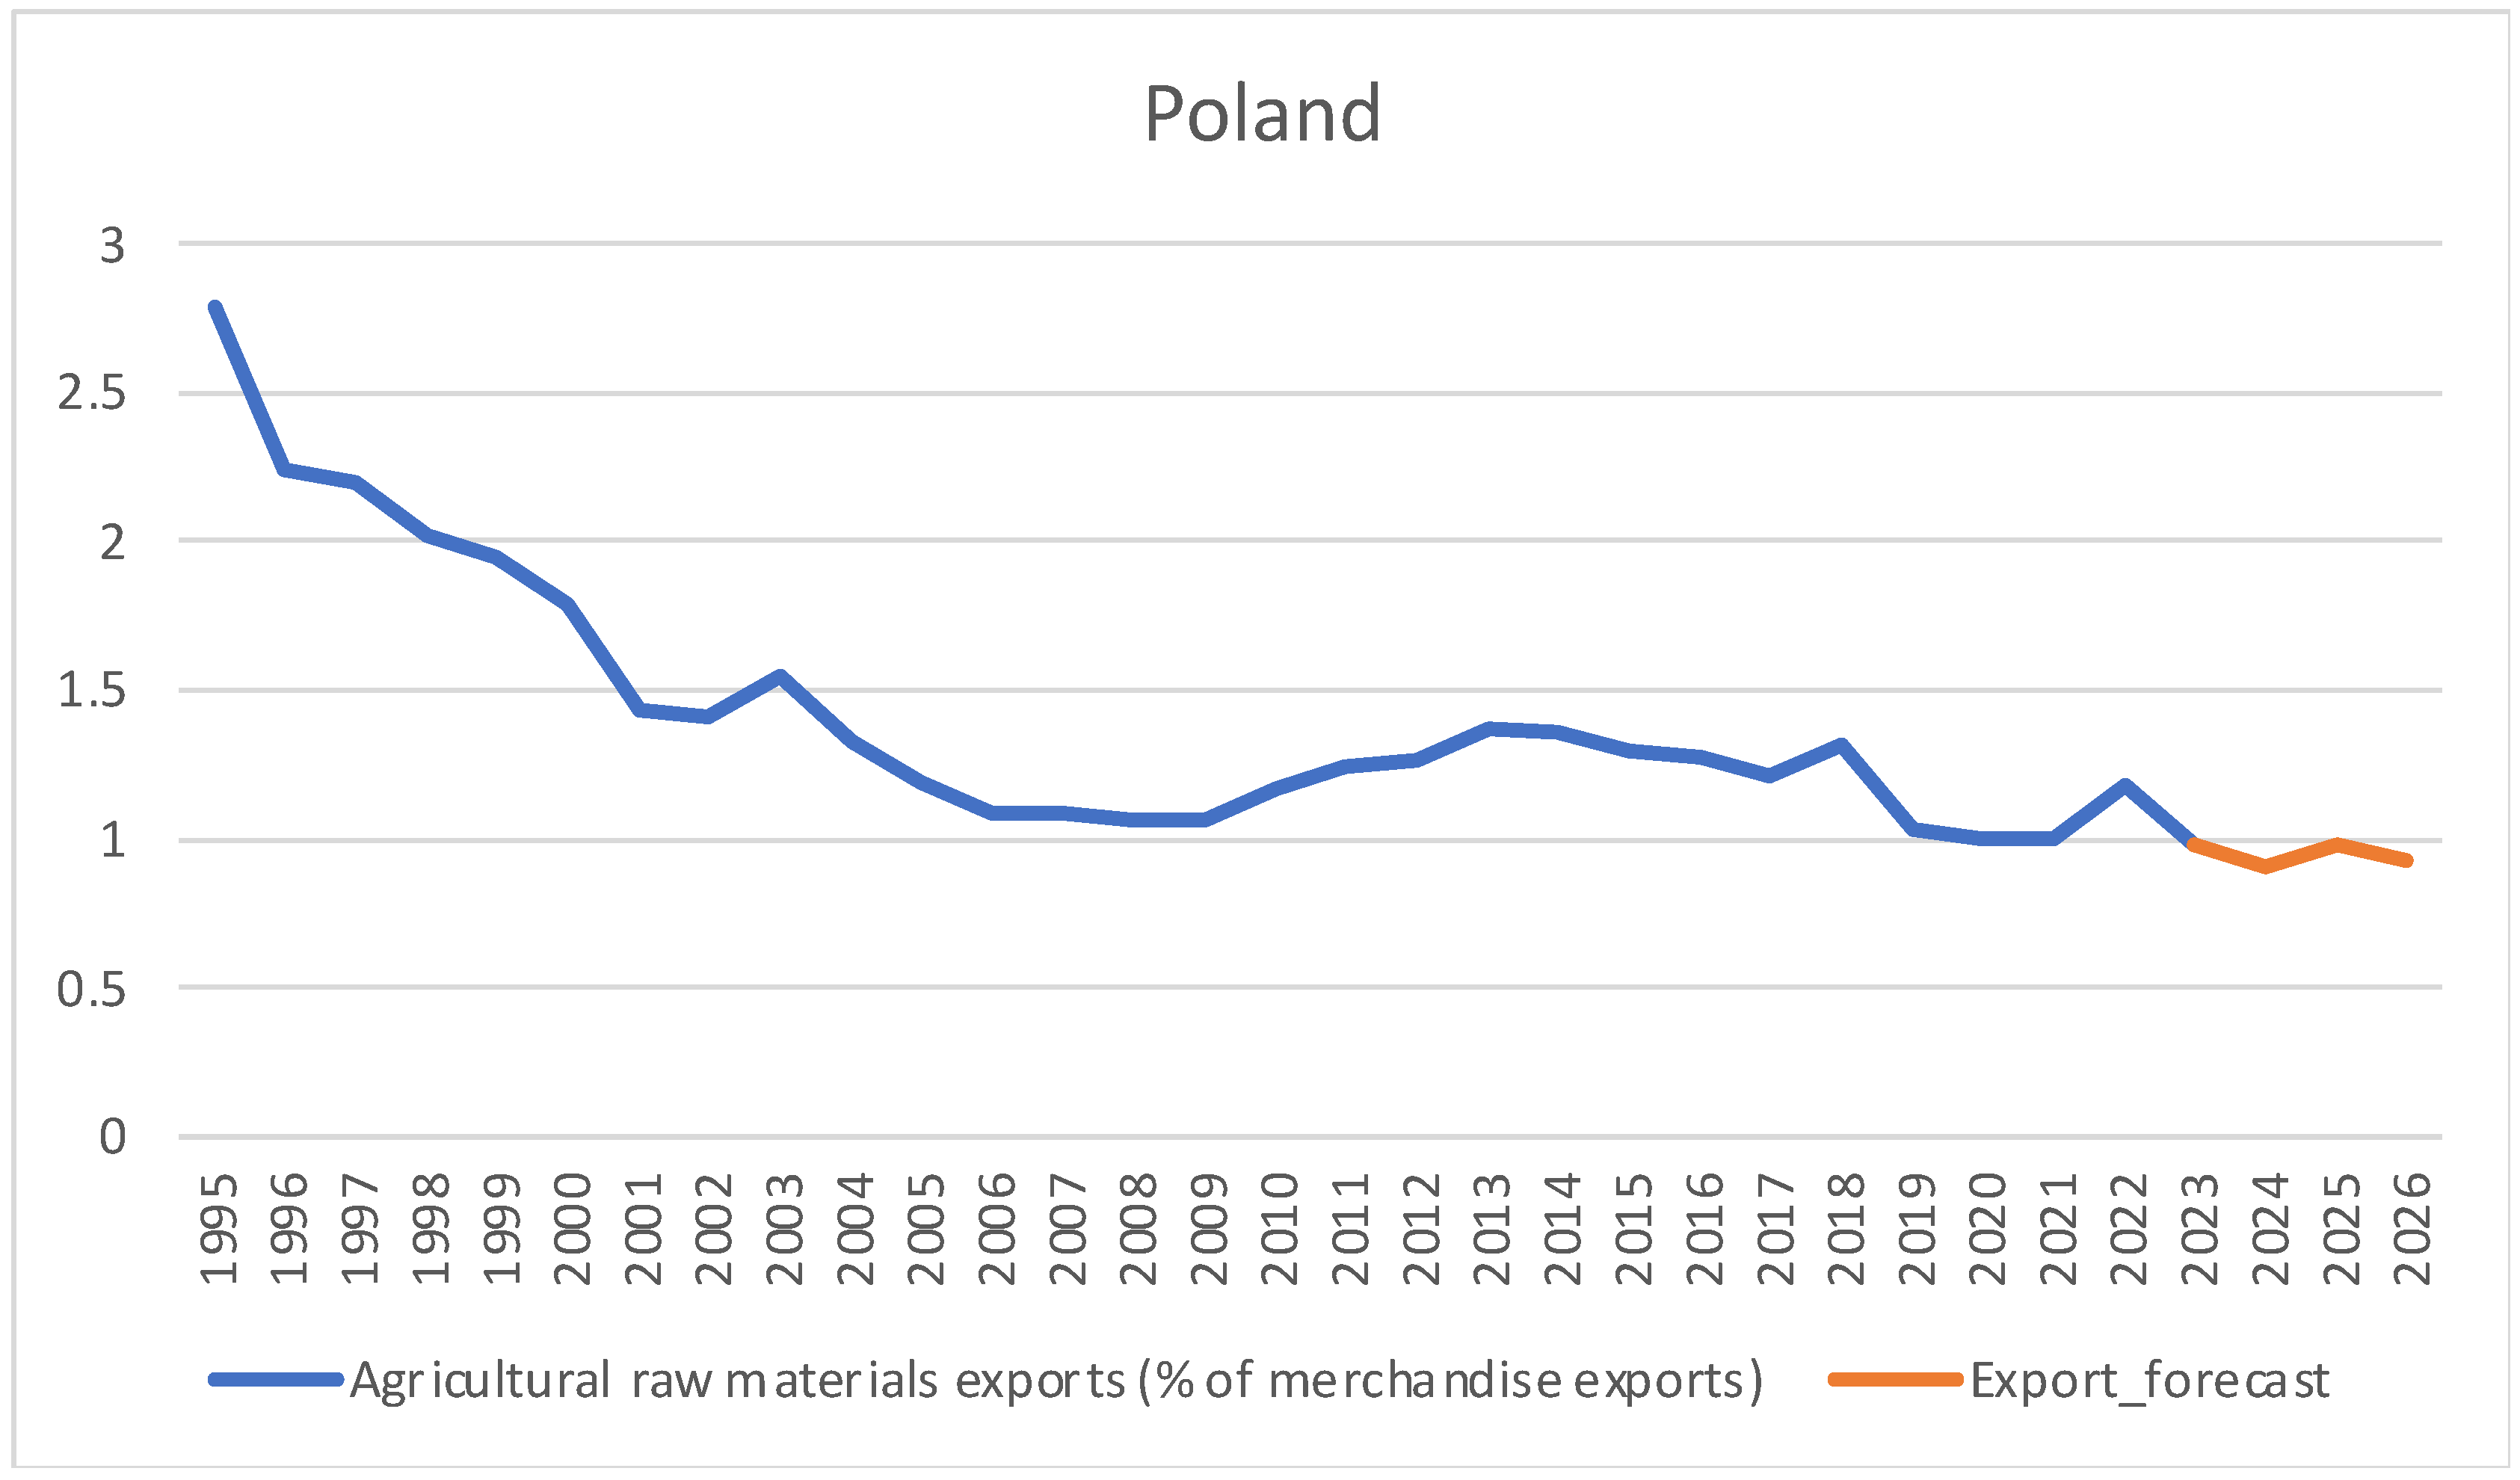
Between 1995 and 2023, the share of agricultural raw material exports in Poland’s total merchandise exports followed a steady downward trend, as seen in
Figure 4. In 1995, agricultural raw materials accounted for approximately 2.78% of Poland’s total merchandise exports. Over the following decades, this share gradually declined. By 2020–2021, this share had fallen to 1.00%, and by 2023 it decreased further to 0.98% [
31].
In 1995, cereal exports represented a significant share of the country’s total agricultural raw material exports, especially wheat and maize exports, which were key components of Poland’s foreign trade. However, starting in the 2000s, Poland began to increasingly export processed cereal products, such as flour and bakery goods. In the 2020s, cereal exports continued to grow due to strong demand from the European Union and other international markets. Poland exported approximately 4.5 million tons of wheat in 2020, while cereal exports increased by approximately 15% in 2023 compared to 2022.
The descriptive statistical analysis (
Table 3) reveals a mean value of 1.41 for the period 1995–2023, with a standard deviation of 0.44. The minimum value of 0.98 was recorded in 2023, while the maximum value of 2.78 occurred in 1995. The coefficient of variation is 31.28%, suggesting that the mean is not fully representative due to the heterogeneity of the data series. Regarding the temporal evolution, it can be observed that the value of agricultural product exports exhibited a declining trend over the analyzed period 1995–2023.
The stationarity of the original series is tested using the Dickey–Fuller test with both a constant and a linear trend. Since the
p-value associated with the test is 0.3435, which is greater than 0.05, the null hypothesis is accepted, indicating that the original series is non-stationary (
Table 4). The first difference of the original series is then applied, resulting in a new series, D(EXPORT), which is stationary, as the
p-value of the Dickey–Fuller test for this differenced series is 0.0001, allowing its use in the ARIMA model.
Based on the correlogram analysis, several ARIMA (p,1,q) models were evaluated. The ARIMA(2,1,2) model was selected as it satisfies all validation criteria (
Table 7).
The forecast is presented in
Table 8 and graphically illustrated with confidence intervals in
Figure 5. Historical data alongside the forecast are depicted in
Figure 4. The ARIMA(2,1,2) model generates forecasts for the period 2024–2026, indicating a decline in exports in the coming years.
4.3. Slovakia
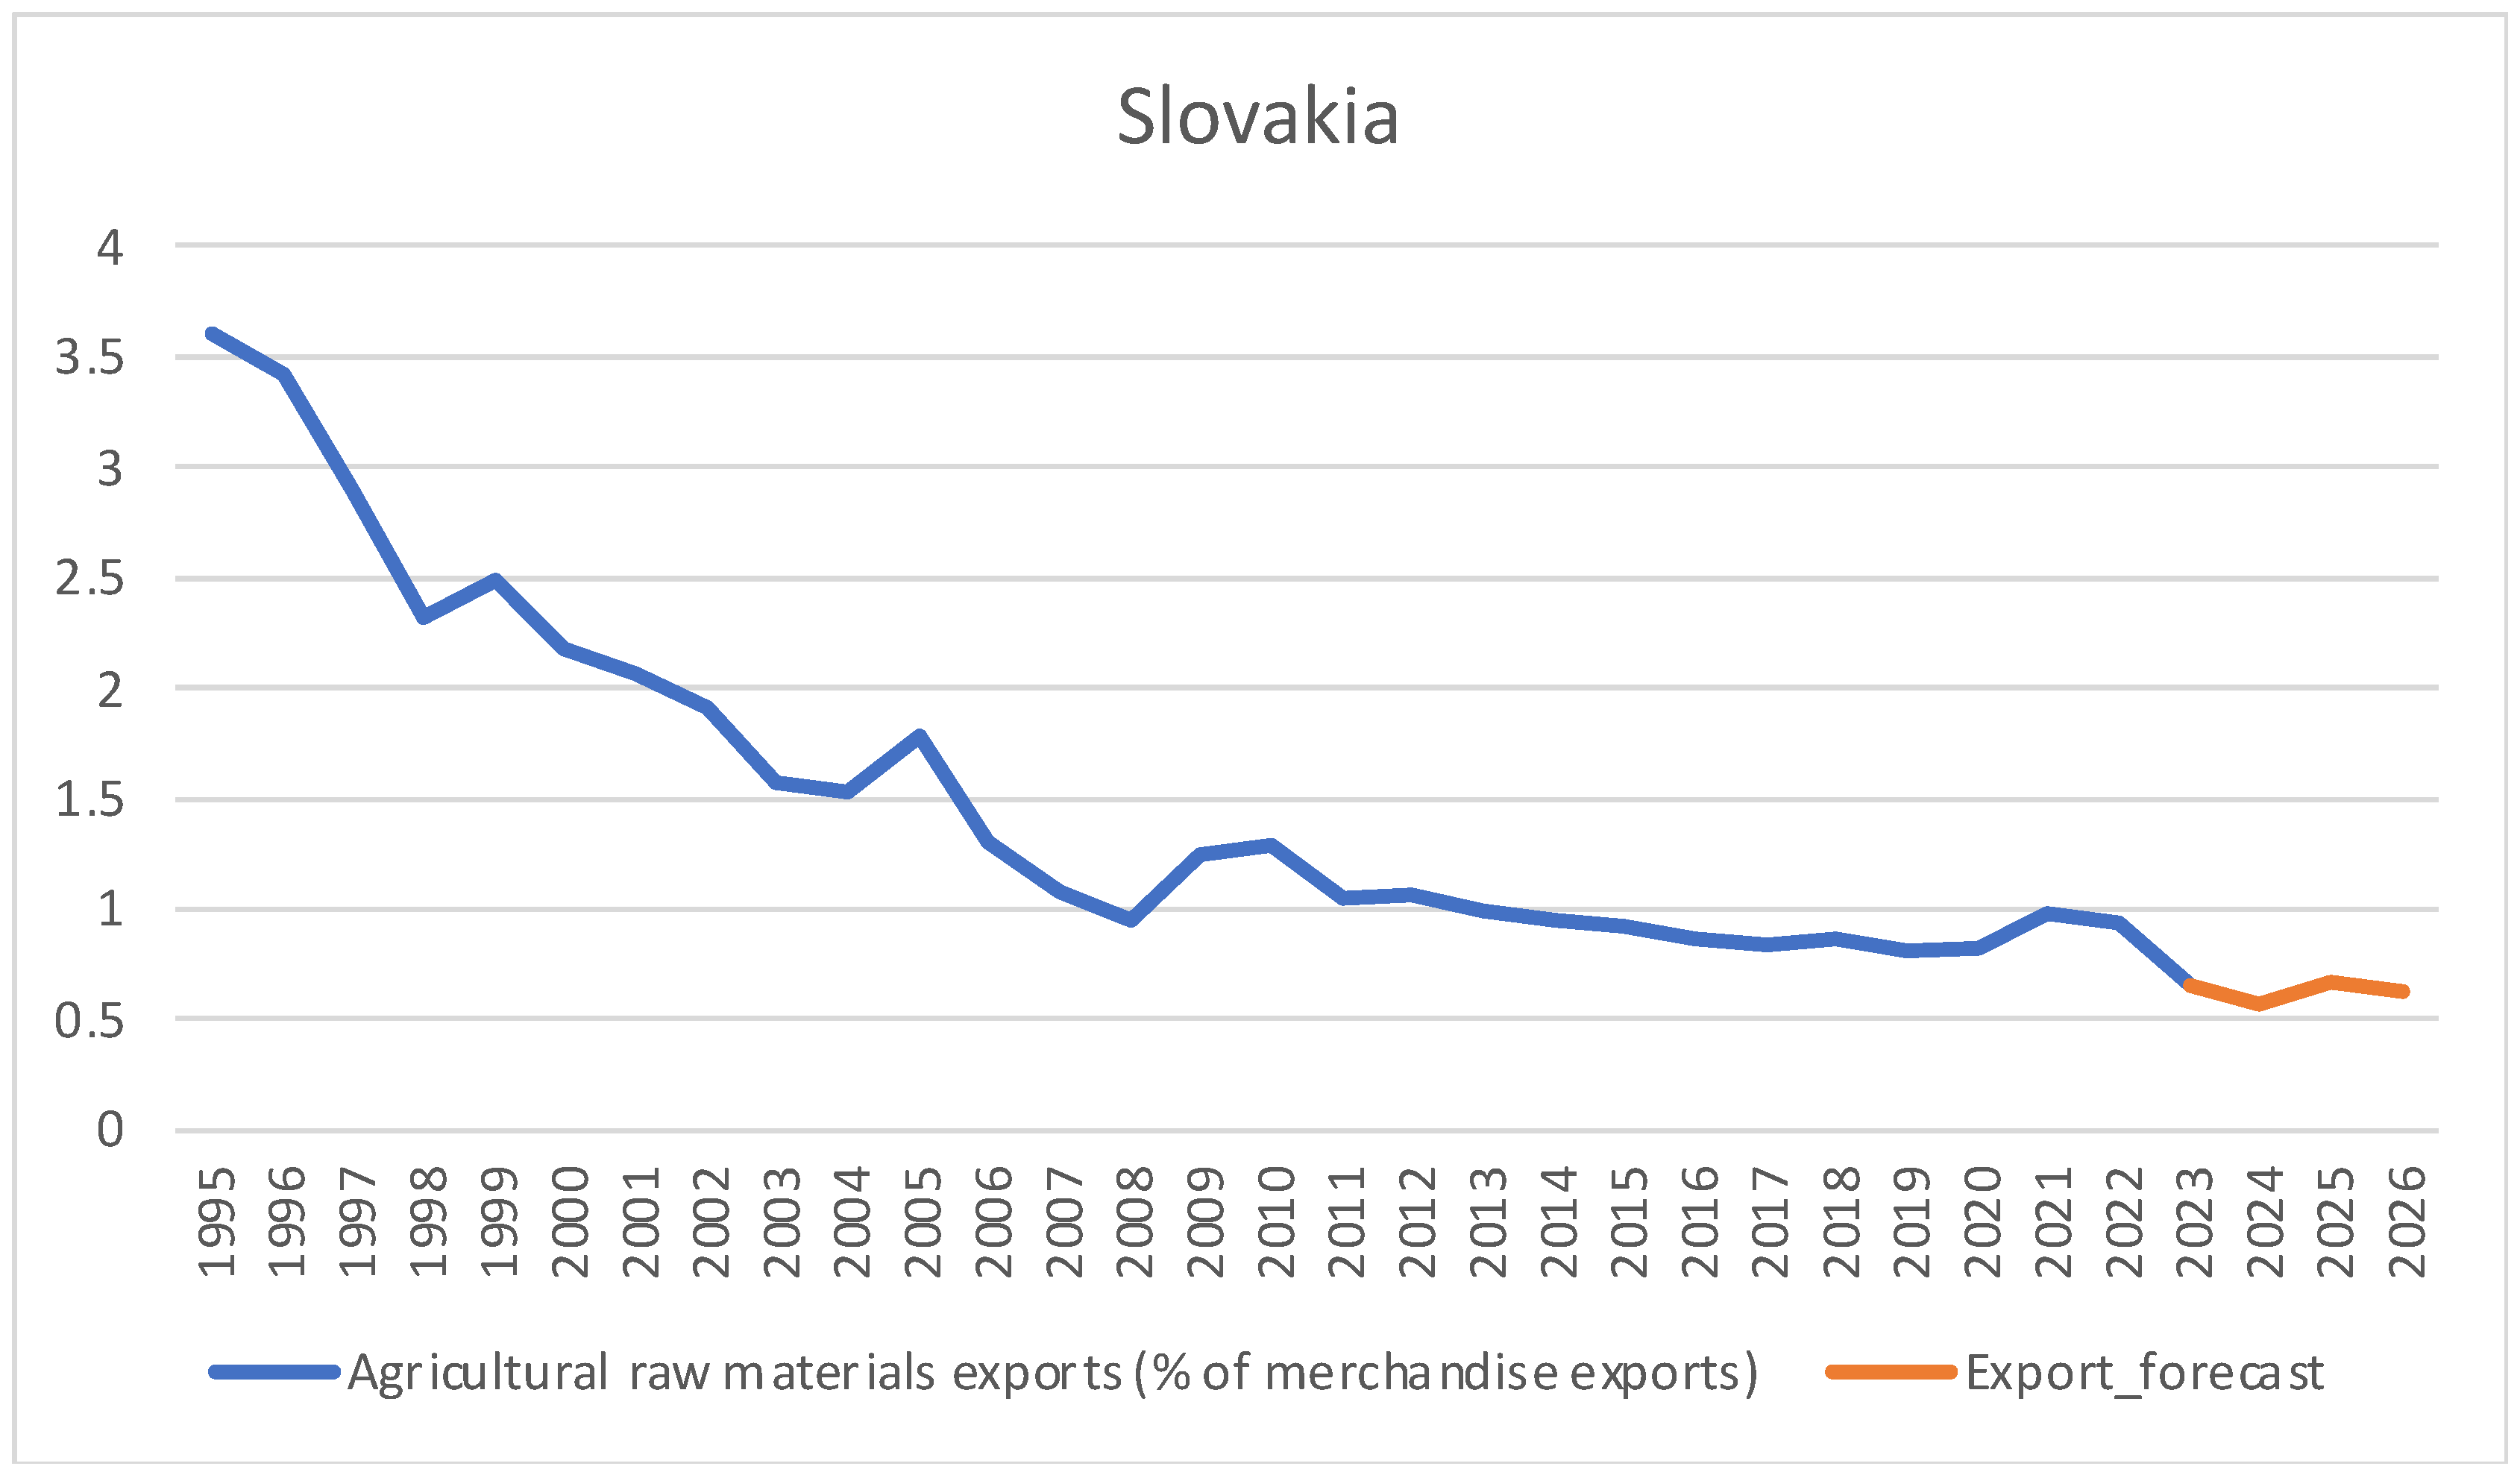
From 1995 to 2023, Slovakia saw a significant decline in the share of agricultural raw material exports in its total merchandise exports. This trend reflects a structural transformation of Slovakia’s economy, marked by export diversification and a growing focus on higher value-added products. According to available economic statistics, agricultural raw material exports accounted for approximately 3.60% of Slovakia’s total goods exports in 1995. Over the following decades, this share steadily declined, reaching 0.99% in 2021, as seen in
Figure 6. This downward trend indicates a profound structural shift in Slovakia’s export profile, suggesting a gradual reduction in dependence on raw agricultural exports in favor of strengthening exports of higher value-added products, characteristic of an economy transitioning toward more sophisticated and sustainable development models [
32].
In 2023, Slovakia’s main cereal exports included maize, with exports totaling 131 million USD to key markets including Italy, Hungary, Austria, the Czech Republic, and Poland, wheat and rye, valued at about USD 10.82 million, primarily destined for Switzerland, as well as oats, valued at USD 173,840 and barley, valued at USD 165,070, both exported mainly to Switzerland.
The descriptive statistics (
Table 3) reveal a mean value of 1.49 over the period 1995–2023, with a standard deviation of 0.80. The minimum value of 0.66 was recorded in 2023, while the maximum value of 3.60 occurred in 1995. The coefficient of variation is 53.68%, indicating that the mean is not fully representative due to data heterogeneity. Regarding the temporal evolution, it is evident that the value of agricultural product exports decreased between 1995 and 2023. Slovakia’s share dropped sharply from 3.60% in 1995 to 0.66% in 2023, one of the fastest declines among the analyzed countries.
To apply the ARIMA method for forecasting, the stationarity of the data series was tested using the Dickey–Fuller test. Since the
p-value is 0.2384, the null hypothesis cannot be rejected, indicating that the original export series (EXPORT) is non-stationary (
Table 4), confirming the presence of a unit root. The first difference was applied, resulting in the series D(EXPORT), which is stationary with a
p-value of 0.0022.
Based on the correlogram of D(EXPORT), several ARIMA models were tested, and the ARIMA(2,1,6) model was selected as it showed the lowest Akaike and Schwarz information criteria values and satisfied all validation tests (
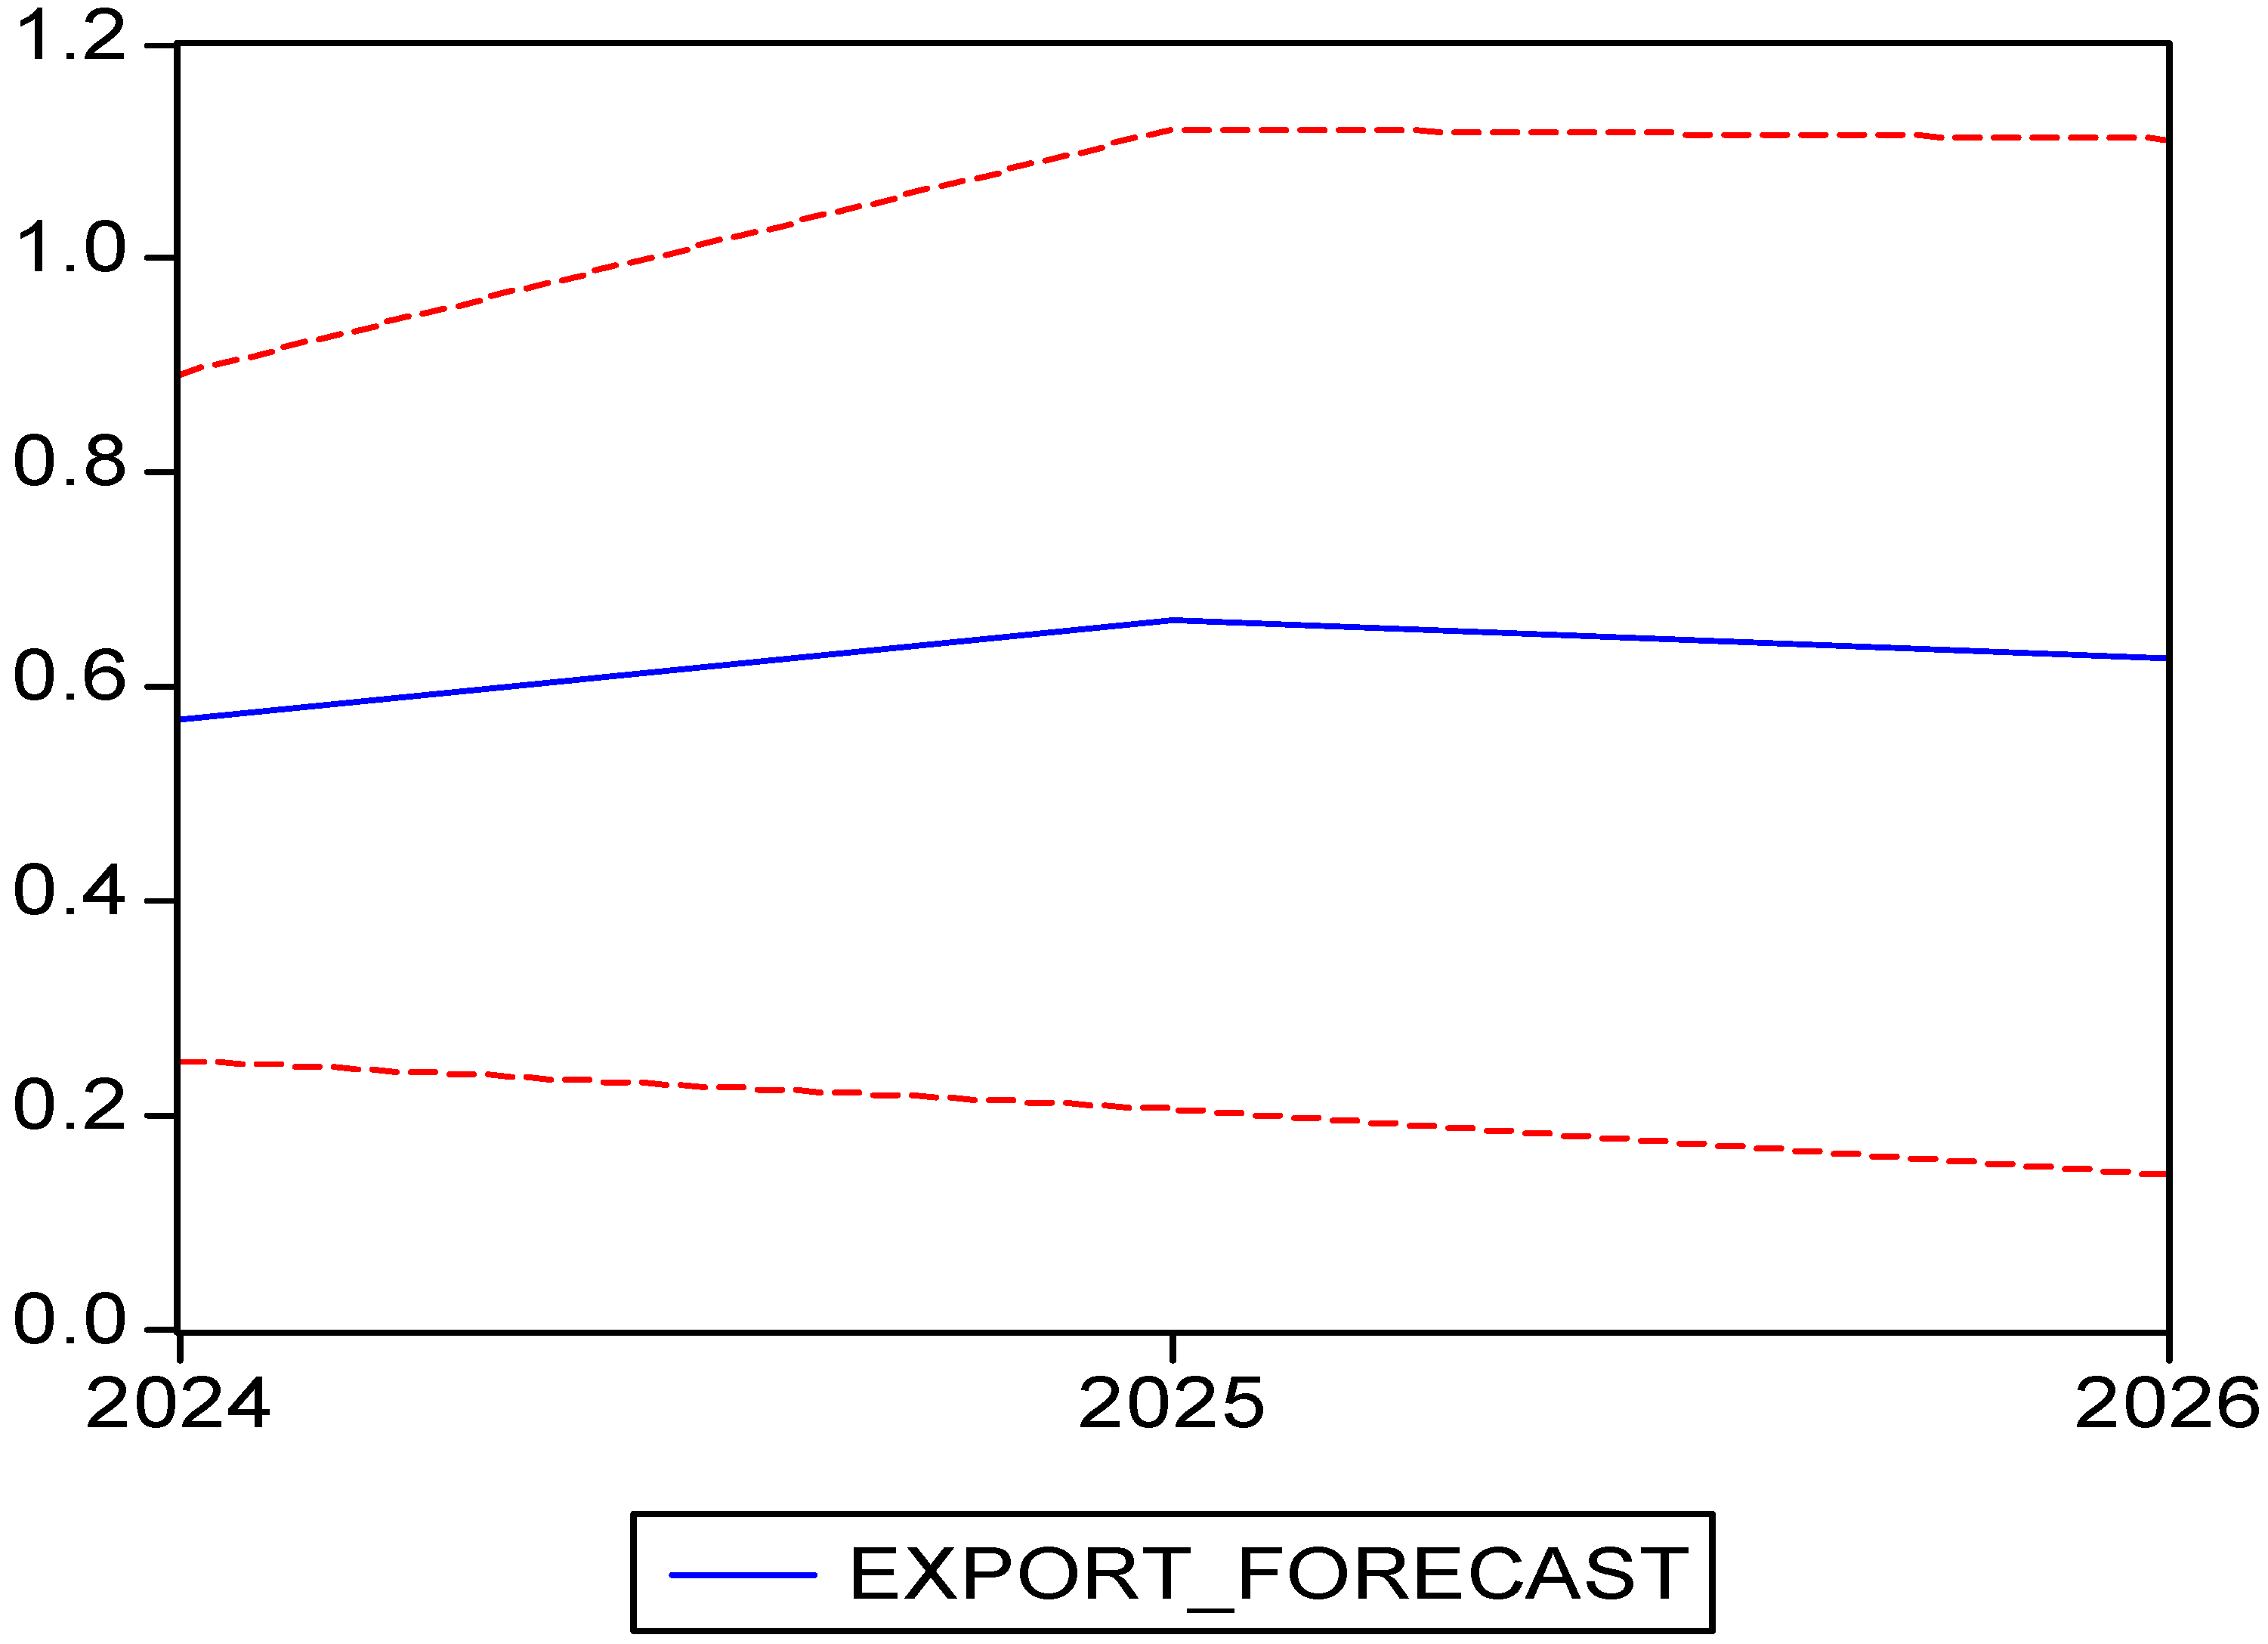
Table 9). The forecast for the export series is presented in
Table 10 and graphically illustrated with confidence intervals in
Figure 7. Historical data and forecasts are depicted together in
Figure 6. The ARIMA(2,1,6) model indicates a slight increase in 2025, followed by a decline to 0.62 in 2026.
4.4. Croatia
Between 1995 and 2023, the share of agricultural raw material exports in Croatia’s total merchandise exports changed significantly, reflecting shifts in the country’s economic structure and trade policies. In the first three years (1995–1997), Croatia recorded a substantial share of agricultural raw material exports, peaking at 6.20% in 1997. Afterward, this share followed a steady downward trend, reaching 3.63% in 2023, as seen in
Figure 8. This decline suggests a structural transformation of Croatia’s economy, marked by diversification and reduced reliance on raw agricultural exports. This indicates that Croatia has evolved toward a more complex economy, with a stronger focus on higher value-added products and more developed industrial and service sectors. In 2023, Croatia has been an important player in the international cereal markets, making a notable impact on the European agricultural sector with maize exports valued at approximately USD 337 million, wheat reaching 203 million USD, and sunflower seeds generating about USD 41.6 million in revenue.
The descriptive statistical analysis (
Table 3) reveals a mean value of 4.30, a standard deviation of 0.69, and a coefficient of variation of 15.95%, indicating a representative mean. The minimum value of 3.29 was recorded in 2006, while the maximum value of 6.19 occurred in 1997. Regarding the temporal evolution, it is observed that between 1995 and 2023, the share of agricultural product exports remained relatively stable, fluctuating between 3% and 6%. However, since 2014, a slight downward trend is evident, with a more pronounced decline in 2023, reaching 3.63%.
The stationarity of the initial series was tested using the Dickey–Fuller test for a model with a constant and linear trend. Since the
p-value associated with the test is 0.1609, which is greater than 0.05, the null hypothesis is accepted, indicating that the initial series is non-stationary (
Table 4). The first difference of the initial series was then applied, resulting in a new series D(EXPORT), which is stationary, as the
p-value associated with the Dickey–Fuller test for this differenced series is effectively zero.
For forecasting, the ARIMA (2,1,2) model was selected, meeting all validation criteria (
Table 11), thus demonstrating that this model is the most appropriate to describe the temporal dynamics of agricultural product exports.
The forecast is presented in
Table 12 and graphically illustrated with confidence intervals in
Figure 9. Historical data and the forecast are displayed together in
Figure 8. The ARIMA (2,1,2) model generates predictions for the period 2024–2026, indicating a slight increase in exports in the coming years.
4.5. Bulgaria
From 1995 to 2023, Bulgaria’s agricultural raw material exports, as a share of total goods exports, showed significant fluctuations. These fluctuations reflect structural changes in Bulgaria’s economy and shifts in its trade policies. Between 1995 and 1997, most of Bulgaria’s agricultural exports were directed toward the European Union, which accounted for approximately 54% of total exports. After 1997, the share of exports to the EU fell sharply to 27%, while trade with Eastern European countries increased. Data available for the period 2010–2022 indicate a revival in exports of agricultural raw materials, reflecting a strengthening of Bulgaria’s position in external markets. In this context, agricultural raw material exports to EU member states reached a value of EUR 1656.7 million in December 2022 [
33].
In 2023, Bulgaria further consolidated its position as a key cereal supplier on international markets. Cereal exports had a significant impact on the Bulgarian economy, with a total value of approximately USD 2.3 billion. Among the most important cereals exported were wheat, corn, barley, and rice, each contributing to the success of the country’s agricultural sector. Wheat was the most valuable crop, accounting for about 73% of total cereal exports, which translates to approximately USD 1.68 billion. Bulgaria continued to export large quantities of wheat to countries in North Africa and Europe, such as Algeria, Spain, and Greece. This product played a crucial role in the country’s agricultural trade and contributed to ensuring food security in the region. Corn also represented a significant segment of Bulgarian exports, with a value of approximately USD 381 million, constituting about 16.5% of the country’s total cereal exports. Corn was primarily destined for markets in Algeria, Spain, and China, strengthening trade relations with these nations. Barley and rice complemented Bulgaria’s agricultural export portfolio, with export values of USD 118 million and USD 92 million, respectively. These cereals were mainly demanded by markets in Spain, Morocco, and Indonesia, demonstrating the diversification of Bulgaria’s export destinations [
34].
The descriptive statistical analysis (
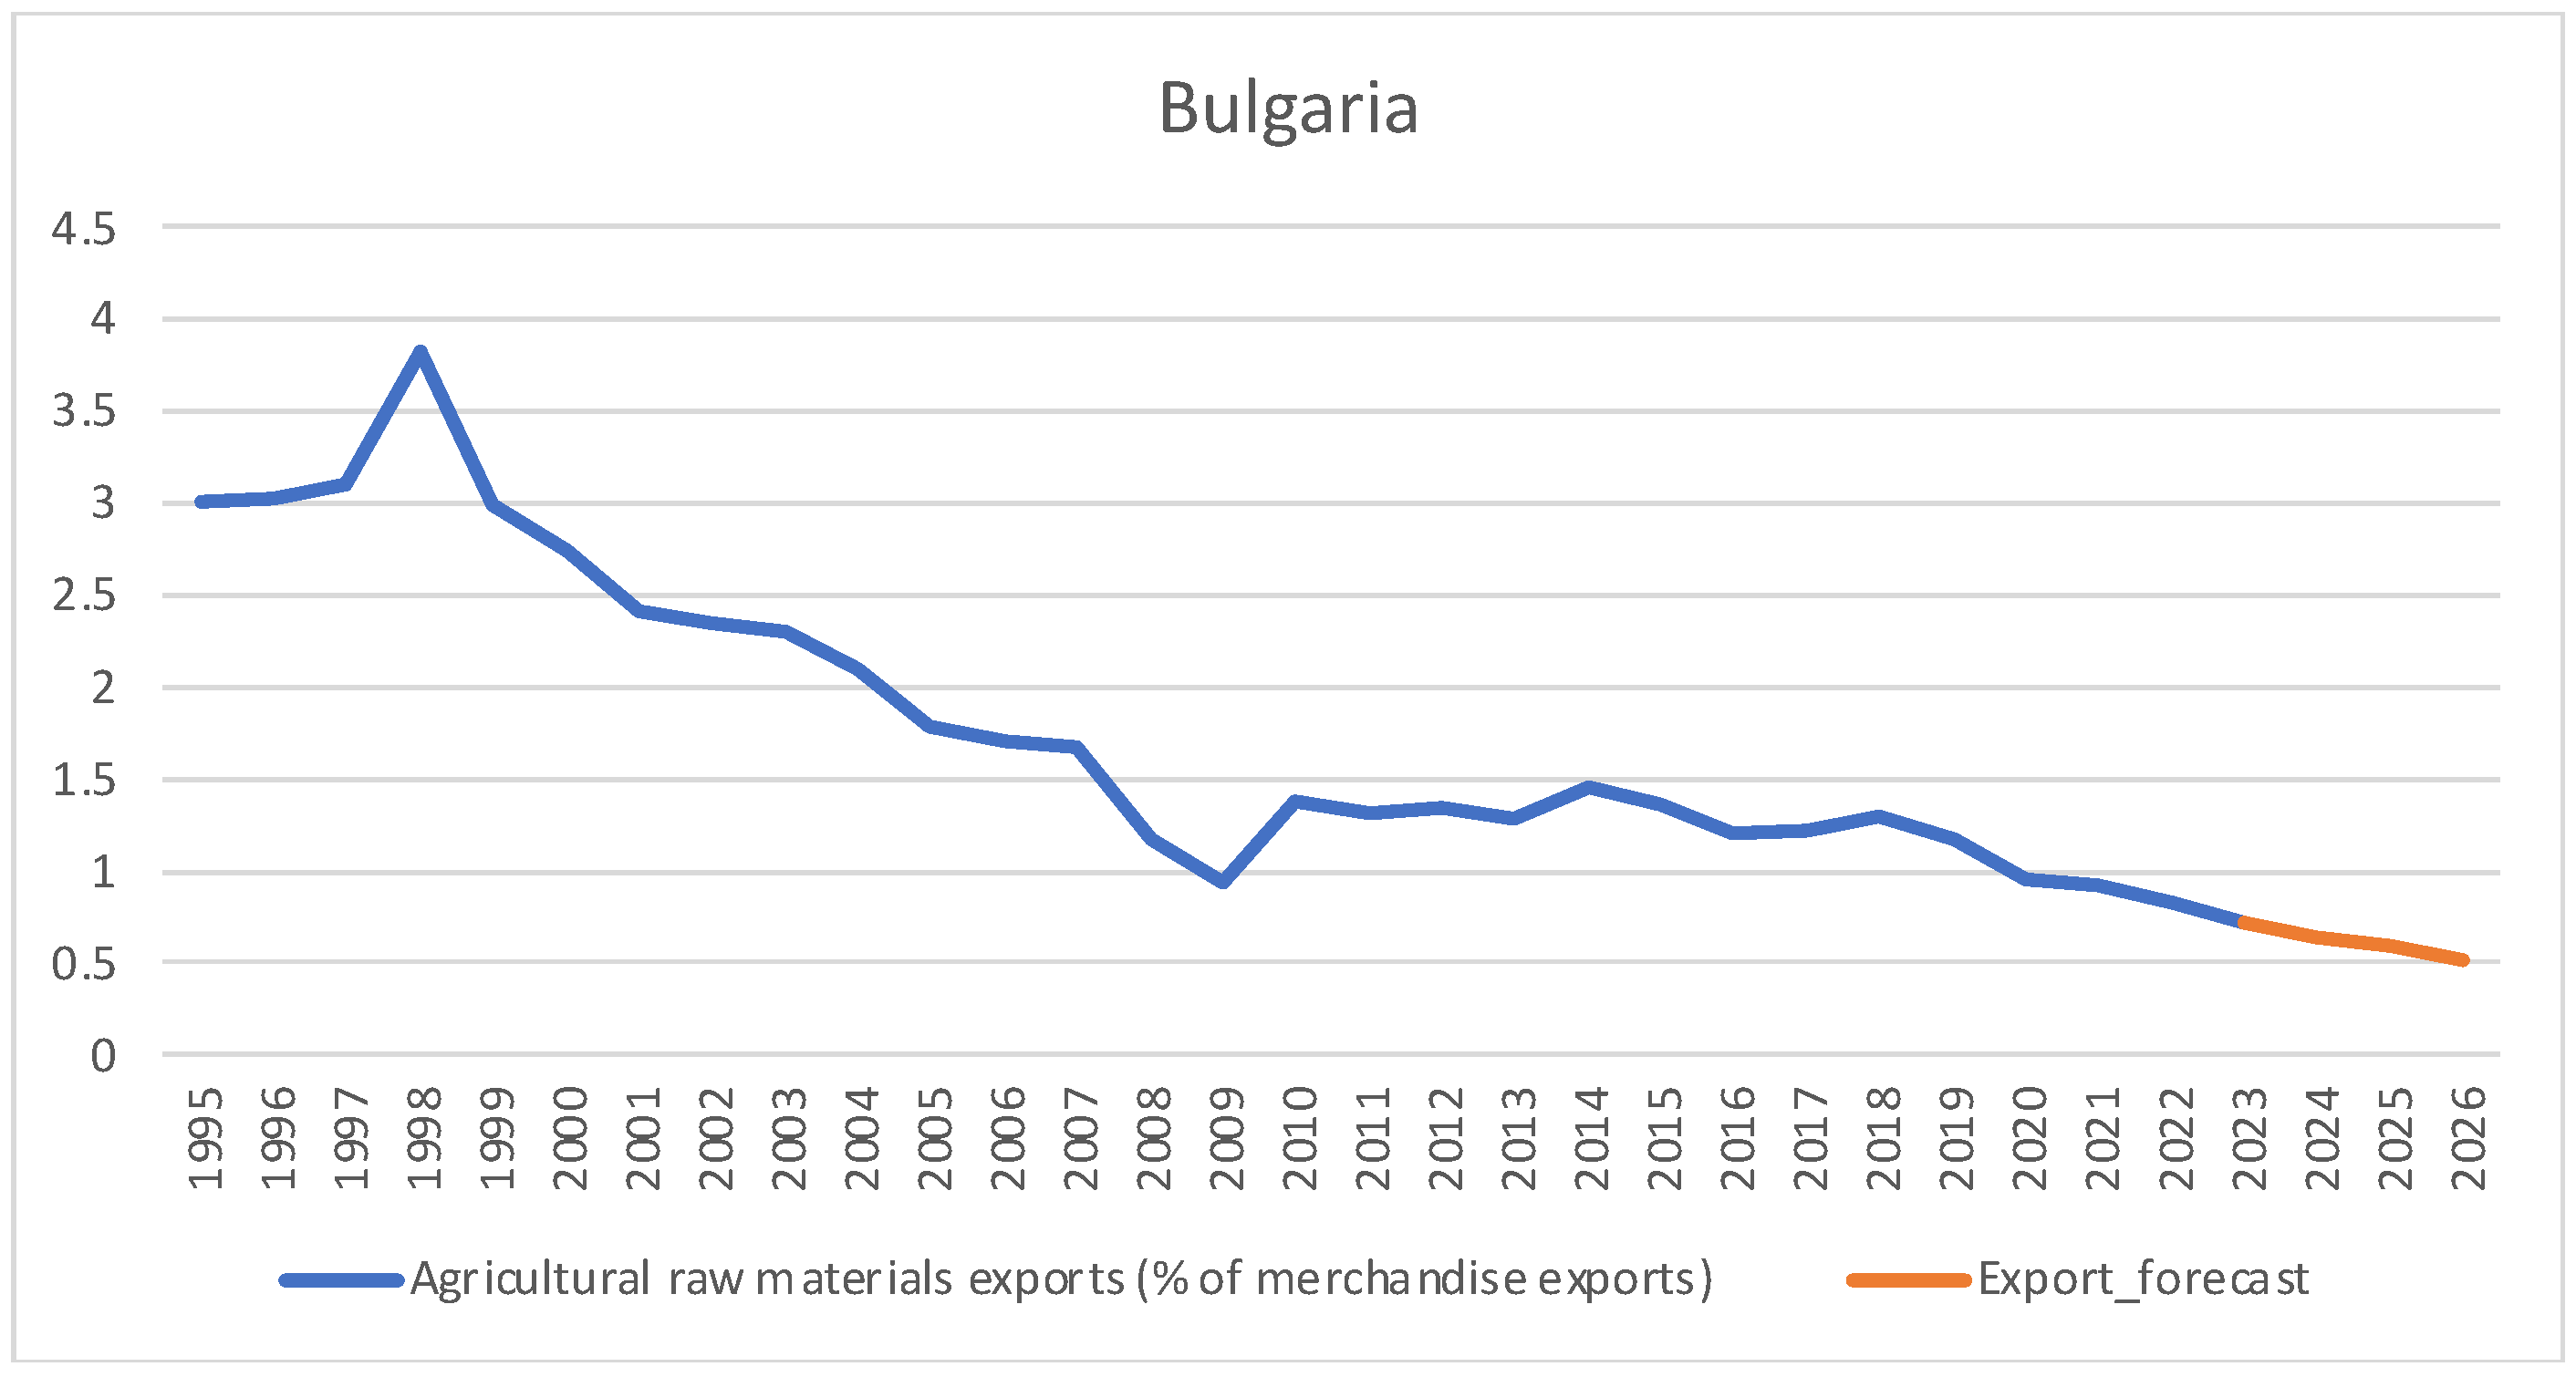
Table 3) of Bulgaria’s agricultural product exports over the period 1995–2023 reveals an average share of 1.77% in total merchandise exports, with a standard deviation of 0.83%. As seen in
Figure 10, the minimum value was recorded in 2023, when agricultural exports accounted for only 0.72% of total exports, while the peak value of 3.82% occurred in 1998. The coefficient of variation, at 46.77%, indicates a heterogeneous data series with dispersed values and an unrepresentative mean. Bulgaria experienced a significant decline in the share of agricultural exports within its total exports, decreasing from approximately 3% in 1995 to below 1% after 2010, reaching only 0.72% in 2023.
To apply the ARIMA method for forecasting purposes, the stationarity of the data series was tested using the Dickey–Fuller test. Since the associated
p-value is 0.5557, which is greater than 0.05, it is concluded that the original export series (EXPORT) is non-stationary (
Table 4), indicating the presence of a unit root. The first difference of the series was then taken, resulting in the differenced series D(EXPORT), which is stationary with a
p-value of 0.0122. Using the correlogram of D(EXPORT), multiple ARIMA models were evaluated, and ARIMA(4,1,11) was selected as it satisfies all validation criteria (
Table 13).
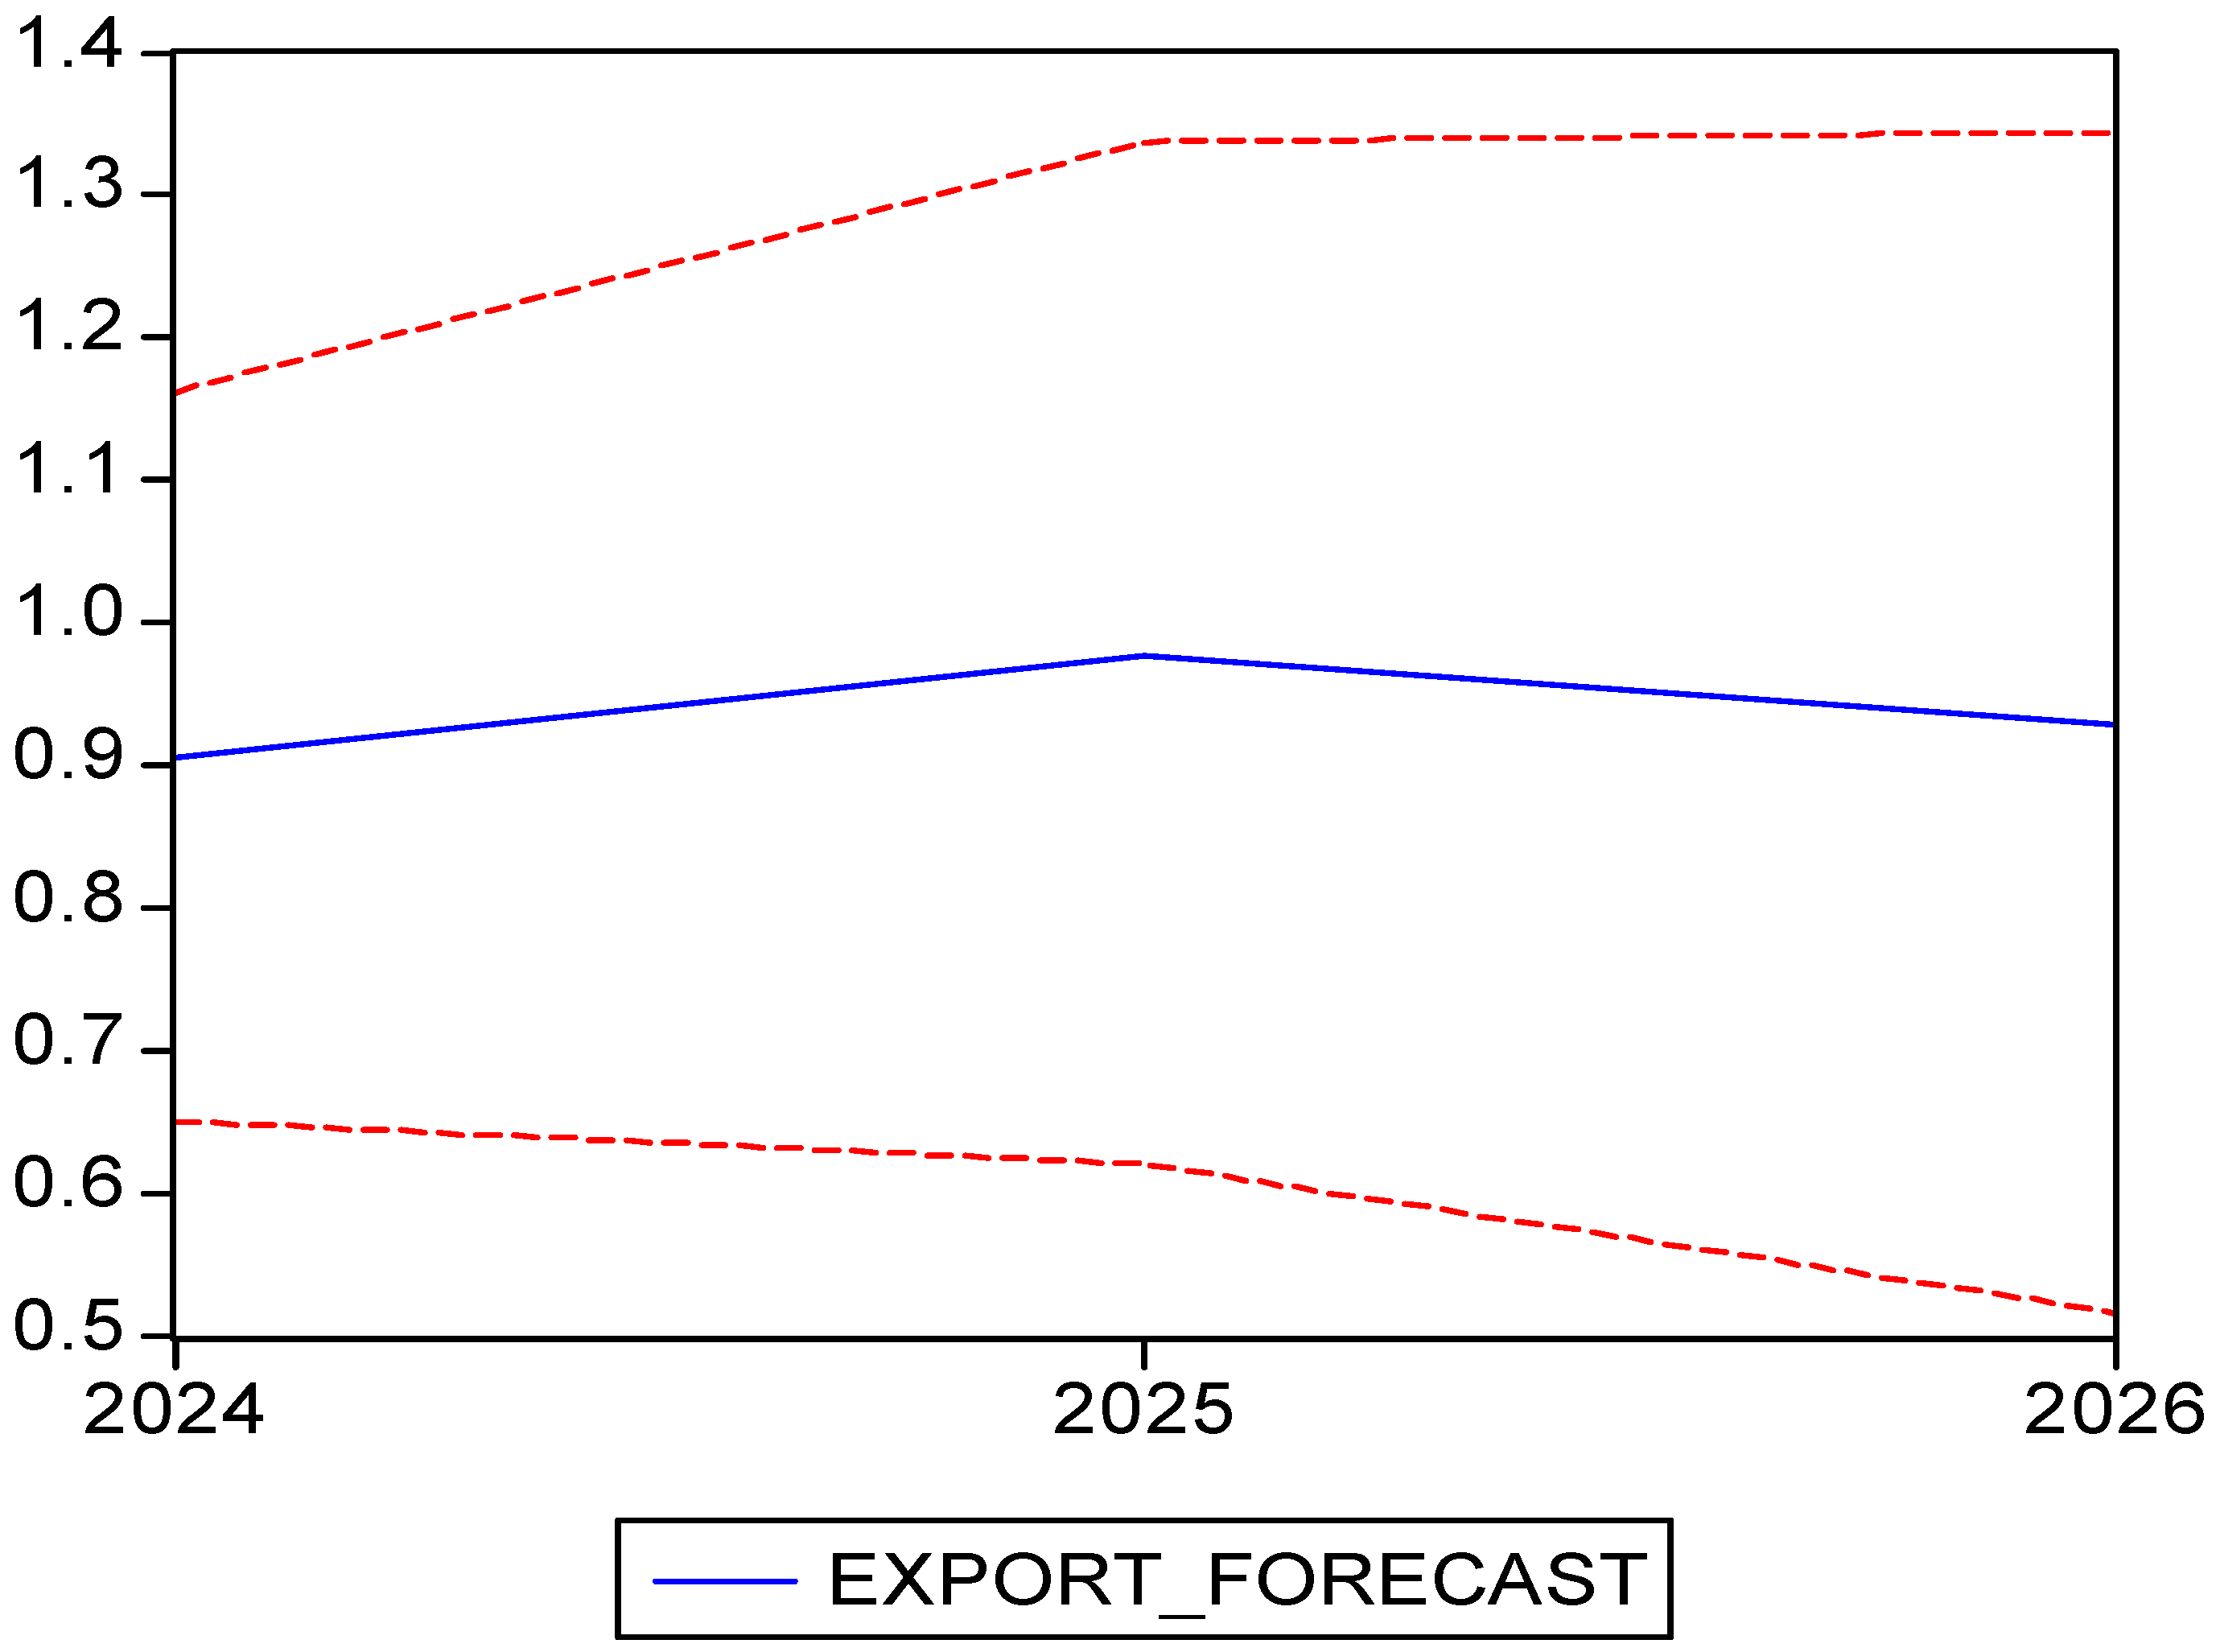
The forecast for the export series is presented in
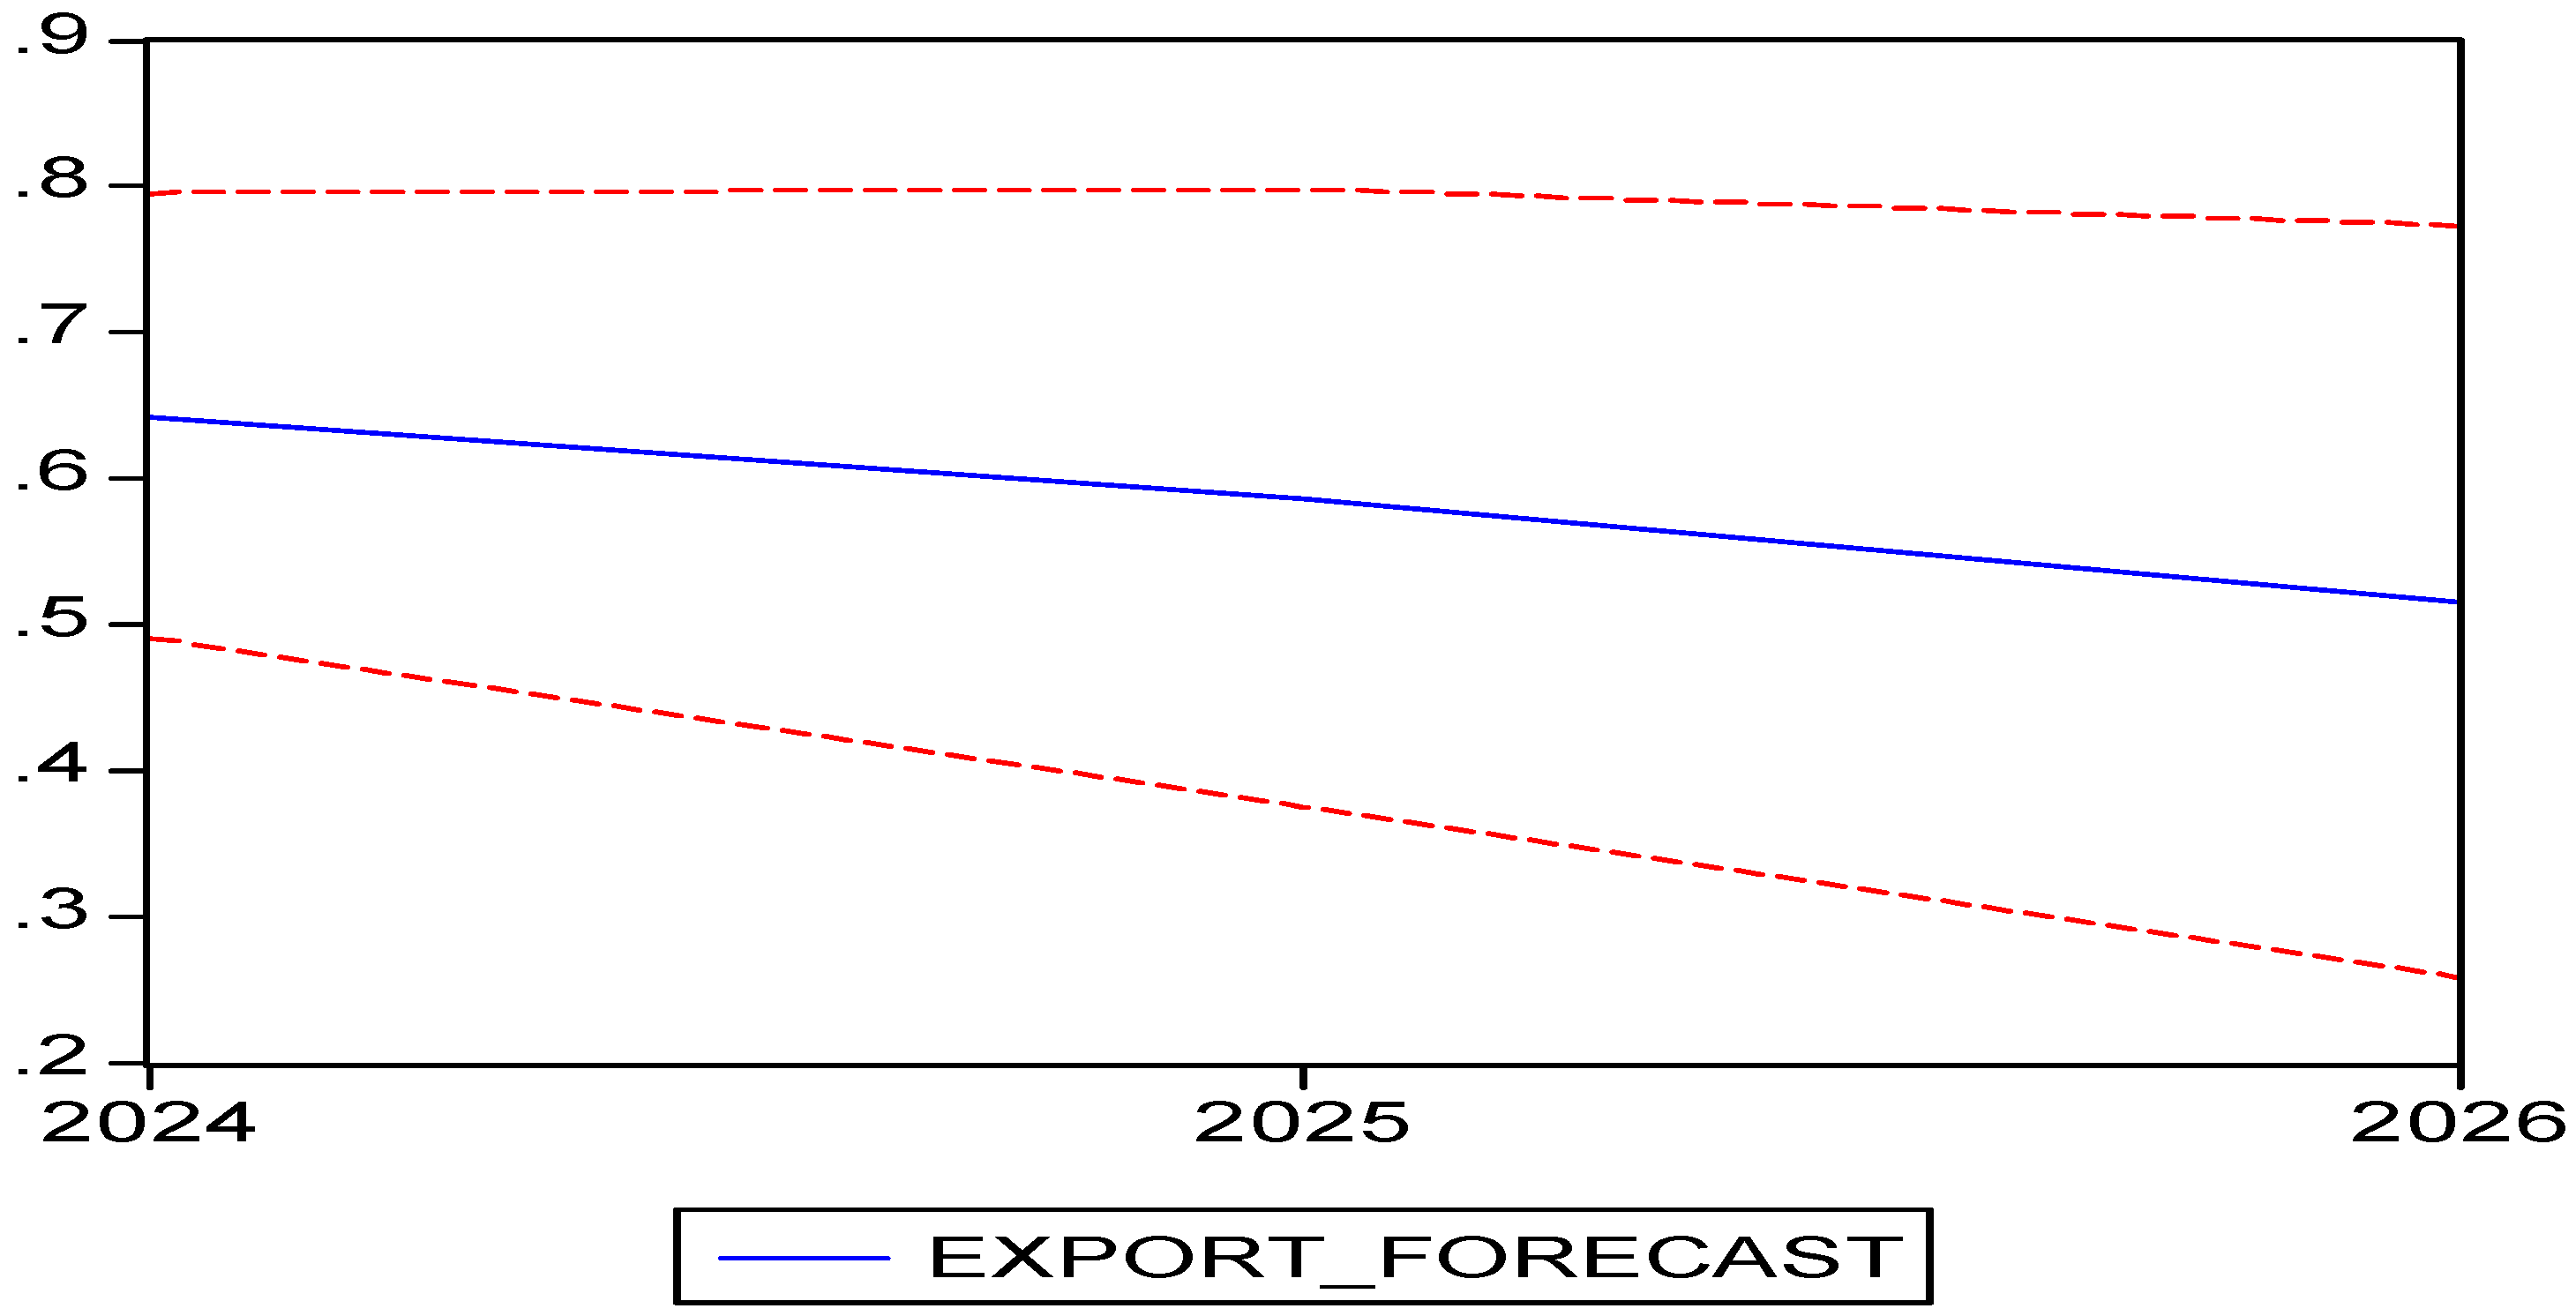
Table 14 and graphically illustrated with confidence intervals in
Figure 11. Historical data and forecasts are shown together in
Figure 10, revealing a downward trend.
4.6. Czech Republic
Between 1995 and 2023, the Czech Republic underwent a major economic transformation, reflected in the sharp decline in the share of agricultural raw material exports in the total merchandise exports. This shift reflects the Czech economy’s structural transformation toward industrial and technological sectors. As seen in
Figure 12, in 1994, the Czech Republic reached a peak in agricultural raw material exports, with a share of 4.88% of total merchandise exports, demonstrating the significant role of agriculture in the country’s foreign trade. However, as the Czech economy evolved, this share began to decline. By 2023, the share of agricultural raw material exports had decreased to just 0.97%, a substantial drop from the 1994 peak.
In 2023, among the most important cereals exported were durum wheat, wheat flour, corn seeds, and other cereals, each having a significant impact on the national economy. Durum wheat was the leading export product, with an export value of approximately USD 261.3 million and a quantity of nearly one million tons. The main markets were Germany, Austria, and Poland, highlighting the steady demand for this product in Central and Western Europe. Additionally, wheat and rye flour recorded a significant export value of USD 25.6 million, with key destinations including Slovakia, Germany, and Poland. Corn seeds remained an important product in the Czech market, with exports valued at USD 19.1 million, primarily to Hungary, Slovakia, and Poland. These exports highlight the Czech Republic’s role as a key cereal supplier to neighboring countries. Furthermore, the Czech Republic exported various other cereals worth USD 2.9 million, with principal markets in Latvia, Germany, and Italy.
Descriptive statistical analysis (
Table 3) reveals a mean value of 1.73 for the period 1995–2023, with a standard deviation of 0.66. The minimum value of 0.97 was recorded in 2023, while the maximum value of 3.73 occurred in 1995. The coefficient of variation is 38.11%, suggesting that the mean is not representative. Regarding the temporal evolution, it is observed that the value of agricultural product exports declined during the period analyzed. The share of agricultural exports in the Czech Republic dropped from over 3% in the 1990s to below 1.50% after 2005.
Using the Dickey–Fuller test (
Table 4), the probability is 0.0614, indicating that the initial export series (EXPORT) is non-stationary. After applying the first difference, the series D(EXPORT) became stationary, with a
p-value of 0.0051.
Using the correlogram analysis of D(EXPORT), several ARIMA models were tested. After evaluation, the ARIMA(1,1,1) model was selected, fulfilling all validation criteria (
Table 15).
Forecasts for the export series are presented in
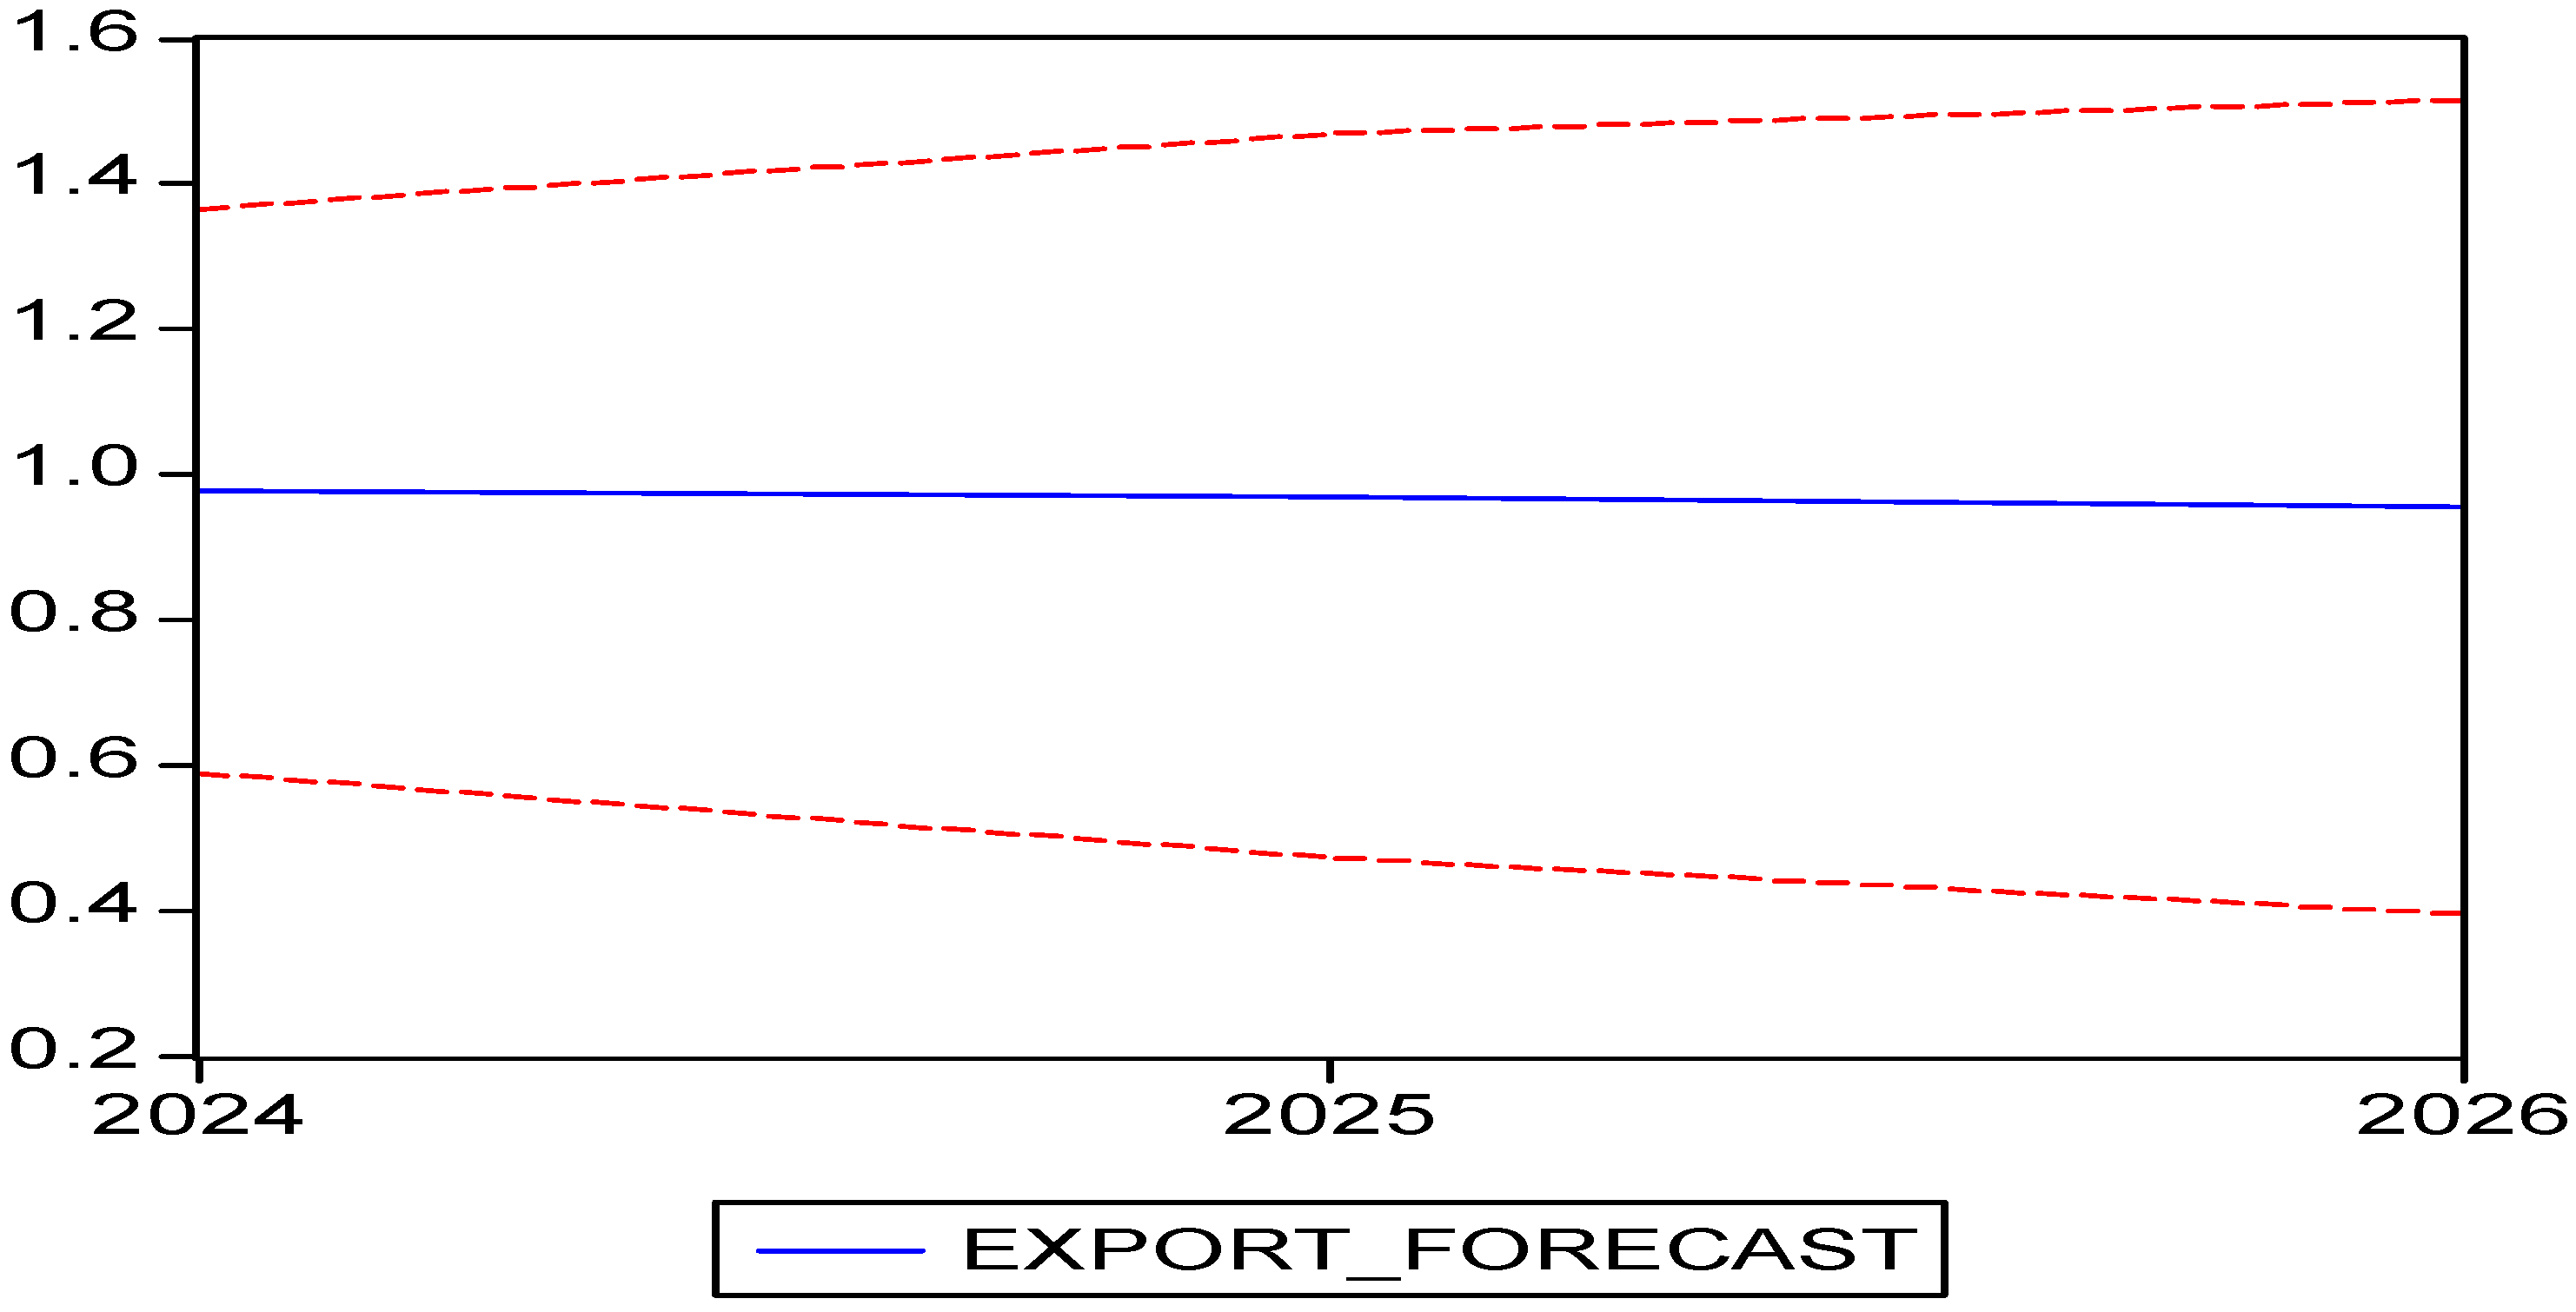
Table 16 and graphically illustrated with confidence intervals in
Figure 13. Historical data and forecasts are shown together in
Figure 12. The ARIMA(1,1,1) model indicates a slight stabilization of agricultural product exports in the upcoming period.
4.7. Hungary
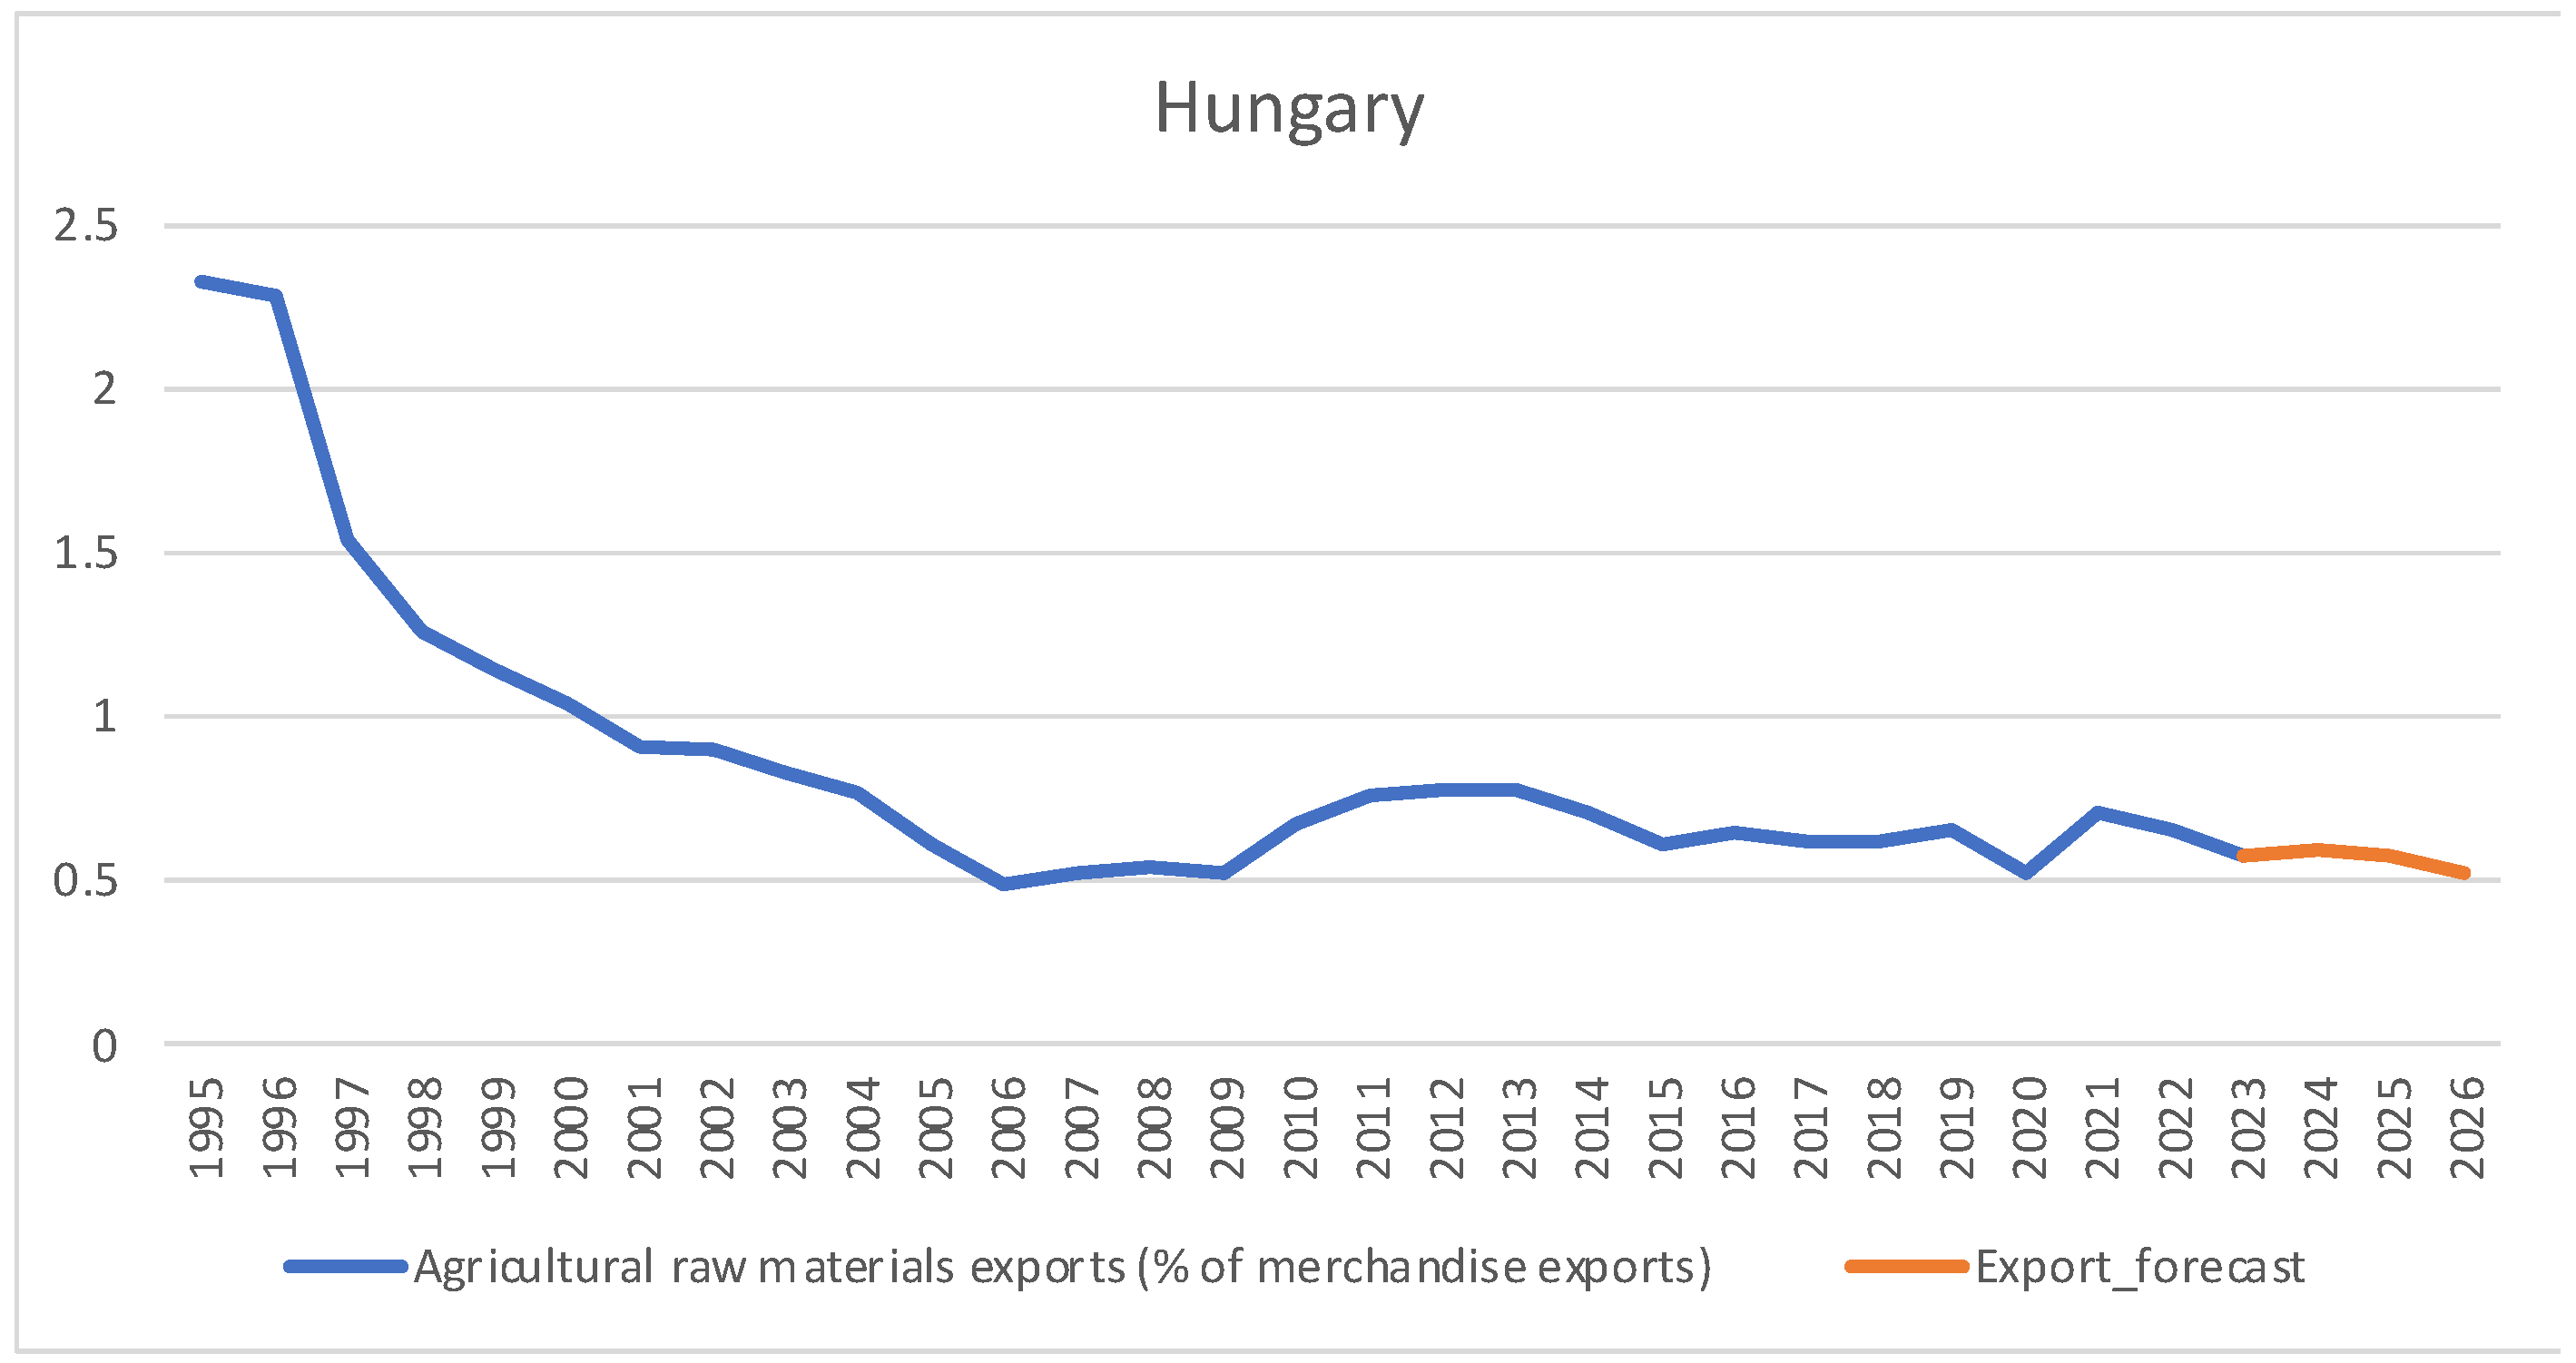
Hungary has gradually shifted from a high share of agricultural products in its total merchandise exports to a more diversified economy, with an increasing focus on industrial and technological sectors. In the 1990s, agriculture played a vital role in Hungary’s economy, with agricultural raw material exports representing a substantial share of total merchandise exports. In 1995, these exports represented nearly 2.4% of the total, highlighting the country’s agricultural importance, as seen in
Figure 14. However, over the following decades, this share steadily declined, reflecting a range of economic and political factors. By 2023, this share had dropped to roughly 0.5%, highlighting the transition toward a more industrialized economy. Nevertheless, agriculture still holds an important role in Hungary’s foreign trade, and the country remains one of the leading cereal exporters in Central and Eastern Europe.
In 2023, Hungary stood out as one of the leading cereal exporters in Central and Eastern Europe, with total cereal export values reaching approximately USD 1.84 billion. This performance reflects both the country’s agricultural potential and its capacity to meet international demand for essential agricultural products. Wheat and rye occupied the top position in the export structure, with a value of approximately EUR 765.3 million and a volume of 2.8 million tons. The main export markets were neighboring or nearby European countries, such as Italy, Austria, Germany, and Slovenia, confirming Hungary’s strategic position in the regional cereal market. Corn was the second most exported agricultural product, with a value of EUR 658 million and a volume of 2.5 million tons. High demand from Italy, Austria, Poland, and Slovakia emphasized the vital role of this product in European trade exchanges. Additionally, Hungary exported smaller quantities of buckwheat, millet, and canary seeds, valued at approximately EUR 9.6 million, destined for markets including France, the United Kingdom, and Belgium [
35].
Descriptive statistical analysis (
Table 3) shows a mean value of 0.86% for 1995–2023, with a standard deviation of 0.46% and a coefficient of variation of 54.01%, indicating an insignificant mean. The Shapiro–Wilk test, with an associated
p-value of 0.000, showed that the data are not normally distributed. The stationarity of the initial series was tested using the Dickey–Fuller test for a model with a constant and linear trend. Since the
p-value associated with the test was 0.0604, the null hypothesis of non-stationarity could not be rejected, indicating that the initial series is non-stationary (
Table 4). Applying the first difference yielded a new series, denoted as D(EXPORT), which was found to be stationary with a
p-value of 0.0046 from the Dickey–Fuller test.
For forecasting purposes, the ARIMA(8,1,8) model was selected (
Table 17) as it exhibited the lowest Akaike and Schwarz information criteria values and met all validation conditions.
The forecast produced by the ARIMA(8,1,8) model is presented in
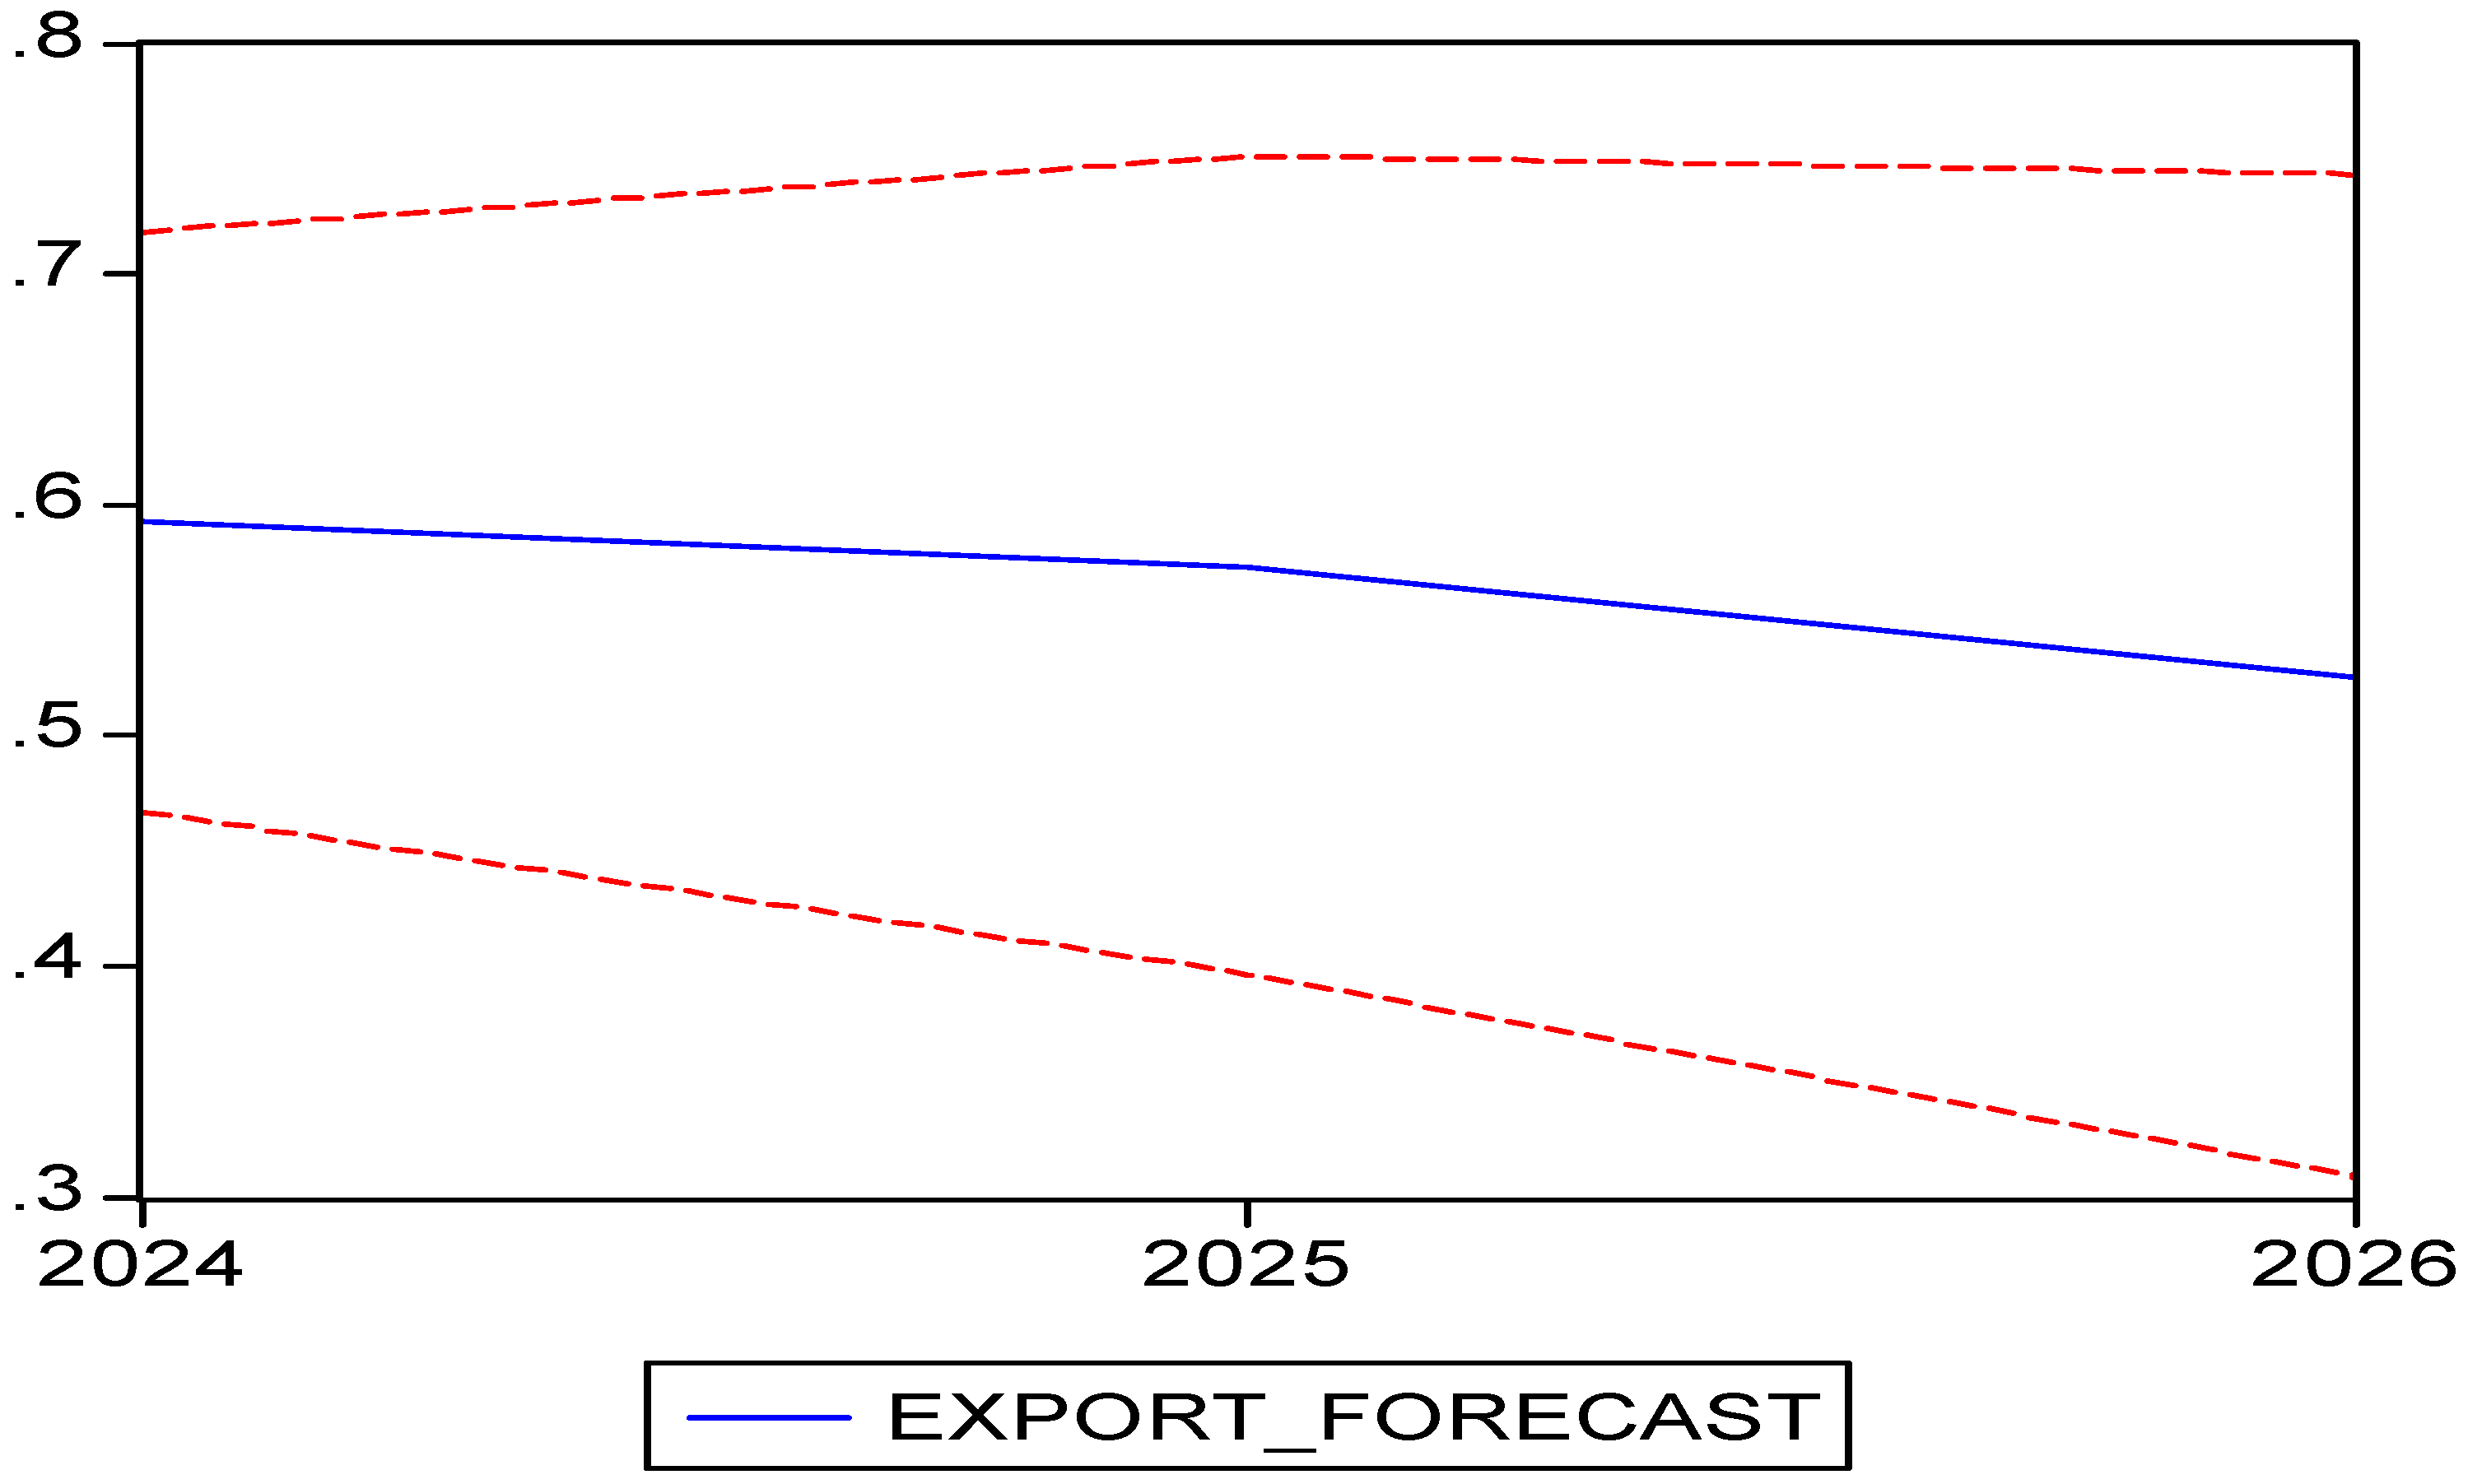
Table 18 and graphically illustrated with confidence intervals in
Figure 15. The historical data from the period 1995–2023, alongside the forecasts, are shown in
Figure 14. The ARIMA model suggests a moderate declining trend in the coming years.
To provide a concise overview of the dynamics of agricultural raw material exports in the analyzed countries,
Table 19 summarizes their historical maximum and minimum shares, long-term trends, ARIMA-based forecasts for 2024–2026, and key qualitative insights. This consolidated perspective highlights both the general downward trend in most countries and notable exceptions such as Croatia, which maintains a relatively high and stable share, and Bulgaria, which continues to play a significant role as a wheat exporter to North Africa and the EU.
The data in
Table 19 confirm a clear pattern of structural transformation across the analyzed countries, with most economies showing a steady or sharp decline in the share of agricultural raw material exports. Poland and Slovakia exemplify this shift through their consistent downward trends and growing orientation toward processed products and non-agricultural industries. In contrast, Croatia maintains a relatively stable share, while Bulgaria stands out for its significant wheat exports to North Africa and the EU despite a sharp overall decrease. These findings reinforce the need for targeted strategies that combine export diversification, value-added processing, and coordinated regional policies to enhance the competitiveness and resilience of the agricultural sector.
5. Conclusions
The results highlight the structural transformation of agricultural exports in these countries and provide a foundation for designing coordinated regional policies to strengthen the competitiveness and adaptability of the agricultural sector in the context of global economic changes.
Between 1995 and 2023, the share of raw agricultural exports in Romania’s total exports significantly declined, from 3.74% in 1995 to 0.83% in 2023, reflecting a restructuring toward higher value-added exports. Romania remains an important player in the European market for raw agricultural materials, being the largest exporter in the EU of products such as wheat, maize, and sunflower. ARIMA model forecasts indicate a continuation of the downward trend in the share of raw agricultural exports for the period 2024–2026, with estimated values below 0.7%. These findings confirm the declining role of raw agricultural exports in Romania’s foreign trade, driven by structural transformation and a shift toward higher value-added products.
Between 1995 and 2023, the share of raw agricultural exports in Poland’s total exports steadily declined from 2.78% in 1995 to 0.98% in 2023. Poland has been a significant exporter of cereals, and since the 2000s, exports of processed cereal products (such as flour and bakery goods) have increased. In 2023, cereal exports continued to grow (+15% compared to 2022), supported by demand from the EU and external markets. Forecasts for 2024–2026 indicate a slight decrease or stabilization in the share of raw agricultural exports, with estimated values around 0.9%. Poland’s raw agricultural exports show a moderate decline, consistent with its transition toward higher value-added products.
Between 1995 and 2023, the share of raw agricultural exports in Slovakia’s total exports significantly decreased from 3.60% to 0.66%, marking a major structural transformation. This trend reflects the diversification of the Slovak economy and a shift toward exports with higher added value. Slovakia was among the countries with the fastest reduction in the share of raw agricultural exports during the analyzed period. Forecasts for 2024–2026 indicate a slight increase in 2025, followed by a decline in 2026, maintaining values below 1% of total exports. Slovakia’s raw agricultural exports are expected to continue declining, reflecting the country’s shift toward higher value-added products.
Between 1995 and 2023, the share of raw agricultural exports in Croatia’s total exports experienced significant fluctuations, reaching a peak of 6.20% in 1997, followed by a downward trend to 3.63% in 2023. Croatia maintained a relatively stable level of agricultural exports between 3% and 6% throughout the analyzed period, with a slight decline after 2014. Forecasts for 2024–2026 indicate a moderate increase in the share of agricultural exports, reaching approximately 4.19% in 2026. In conclusion, Croatia is transitioning toward a more diversified economy, with stable agricultural exports and a moderate upward trend in the coming years.
During the analyzed period, Bulgaria’s raw agricultural exports, as a percentage of total merchandise exports, exhibited significant fluctuations, characterized by an overall substantial decline. Between 1995 and 1997, agricultural exports were predominantly directed toward the European Union (approximately 54%), but after 1997, the share of exports to the EU decreased considerably, while trade with Eastern European countries increased. Forecasts for 2024–2026 indicate a continuation of the downward trend, with exports estimated to decline to 0.515% by 2026. Bulgaria continues to experience a significant decline in the share of agricultural exports despite consolidation in specific markets and diversification of exported products.
Between 1995 and 2023, the share of raw agricultural exports in the Czech Republic’s total exports decreased significantly, from a peak of 4.88% in 1994 to only 0.97% in 2023, reflecting a structural transformation of the economy toward industrial and technological sectors. Forecasts for 2024–2026 indicate a relative stability of agricultural exports, with values slightly below 1%, suggesting that the low share of these exports in the total export structure will be maintained. Thus, the Czech Republic has experienced a clear decline in the role of agriculture in its exports, adapting its economy toward other sectors, while agricultural exports remain stable but at a reduced level.
During the analyzed period, the share of raw agricultural exports in Hungary’s total exports steadily declined from approximately 2.4% in 1995 to around 0.5% in 2023, reflecting the country’s transition toward a more industrialized and diversified economy. Nevertheless, agriculture remains important for Hungary’s foreign trade as the country is one of the main exporters of cereals in Central and Eastern Europe. Forecasts indicate a moderate downward trend in agricultural exports for the period 2024–2026, with estimated values of approximately 0.57% in 2025 and 0.53% in 2026. In conclusion, Hungary’s agricultural exports are gradually decreasing as a share of total exports, but agriculture remains a strategic sector with a significant role in regional cereal markets.
In conclusion, it is observed that all the analyzed countries experienced a significant decline in the share of raw agricultural exports within their total exports during the period 1995–2023. This reflects a common structural transition toward more industrialized economies focused on sectors with higher added value. Croatia stands out with a higher share and a more independent evolution compared to the other countries. Agriculture remains a strategic sector, especially in Central and Eastern Europe. Although the share of agricultural exports is decreasing, agriculture and cereal exports (wheat, corn, barley, etc.) continue to play a significant role in the economies of these countries and in the regional market, supported by well-established trade relations.
For all countries, agricultural export data exhibit significant fluctuations over time, with high coefficients of variation indicating that mean values are not representative. This suggests a high sensitivity of the sector to external factors such as market conditions, climate, and trade policies. Significant positive correlations among most countries point to synchronized developments, implying economic interdependencies and similar trade policies at the regional level. Export distributions are generally non-Gaussian, and the time series are non-stationary in their original form, becoming stationary only after differencing.
Forecasts based on ARIMA models indicate a trend of decline or stabilization in the share of agricultural exports over the coming years, with no clear prospects for significant growth under the current context. The analyzed countries are expanding or diversifying their export markets (e.g., Bulgaria is exporting heavily to North Africa, while the Czech Republic and Hungary have significant markets in neighboring European countries), which helps mitigate trade risks.
Moreover, through our findings, we have managed to validate the four research hypotheses proposed at the beginning of our study. The first hypothesis, which stated that exports of agricultural raw materials have registered a significant decline in their share of total exports due to the structural transformation of economies, proved to be true for most of the analyzed countries, except for Croatia. The second hypothesis, which assumed that there are positive correlations among the analyzed countries, indicating a synchronized regional dynamic, was confirmed as well. High positive values of correlation coefficients were recorded, except for Croatia, where correlations are below 0.5. This indicates that Croatia’s trajectory is more independent, possibly due to structural differences in foreign trade or to varying timelines and conditions of economic integration (e.g., EU accession). The third hypothesis, which stipulated that ARIMA models would confirm a downward trend or stabilization of agricultural raw material exports in the coming years, was verified as true. Yet again, Croatia is the outlier, with forecasts showing a slightly upward trend.
As for the last hypothesis, which stated that agriculture remains a strategic sector despite its declining share in total trade, we have several arguments supporting its validation. Although the share of raw agricultural exports has decreased (e.g., Romania: from 3.74% in 1995 to 0.83% in 2023), these products continue to ensure domestic food security and play a significant role in the trade balance for certain segments (e.g., cereals). Romania, Poland, and Hungary remain major exporters of cereals (wheat, corn, sunflower), acting as key suppliers to European and international markets. Bulgaria exports massive amounts of wheat to North Africa and the Middle East, while Croatia maintains high levels of agricultural exports (3–6%). Moreover, significant positive correlations (e.g., Poland–Slovakia 0.92, Czech Republic–Slovakia 0.96) demonstrate a synchronized dynamic, meaning that external shocks simultaneously affect several economies, making agriculture a strategic sector due to common vulnerability. The study also highlights large fluctuations and high coefficients of variation (e.g., Hungary: 54%), proving that agriculture is highly vulnerable to factors such as the war in Ukraine, energy crises, and climate change. This sensitivity justifies its strategic status. The existence of the Common Agricultural Policy (CAP) and support mechanisms further demonstrates that agriculture is institutionally recognized as strategic, regardless of its share in total trade.
On the other hand, this hypothesis cannot be considered false since the reduction in the share of agricultural exports does not reflect a loss of importance but rather economic diversification and a shift toward finished products. Agriculture remains essential for food security, social stability, and economic resilience. Even at low shares (<1% in some cases), agricultural exports may be critical for certain markets (e.g., cereals in the Balkans and North Africa). That being said, we can conclude that the last hypothesis is validated as well. Agriculture remains a strategic sector for the analyzed countries, not because of its current share in total trade but due to its role in food security, social stability, and regional interdependencies, which is clearly highlighted in the analyzed study.
Regarding the implications of the study’s results, a structural transformation of the emerging economies under analysis is evident. The decline in the share of raw agricultural exports confirms the transition toward industrial economies focused on higher value-added products. Agriculture no longer dominates trade but remains vital for food security and the trade balance. Furthermore, there is regional synchronization and shared vulnerability, as shown by the high correlations that indicate a common dynamic, which makes external shocks (wars, energy crises, climate change) simultaneously affect multiple economies. Unlike the other countries, Croatia maintains a relatively high share of agricultural exports (3–6%) and follows a more independent trajectory, suggesting a potential alternative model of agricultural development. Unfavorable forecasts indicated by ARIMA models show a decline or stabilization at low levels (<1% for most countries) for the period 2024–2026, with the exception of Croatia, where a slight increase is projected.
As for concrete recommendations, we suggest diversifying exports through the development of processing capacities (processed foods, organic products, semi-prepared goods) to increase added value and reduce dependence on raw exports. Additionally, investments in sustainable agricultural technologies—such as smart irrigation, digital agriculture, and advanced mechanization—are recommended to reduce vulnerability to climate change and increase productivity. This is particularly advisable for Slovakia, Bulgaria, and Romania, where the decline has been most pronounced. Furthermore, the expansion of export markets toward emerging or non-traditional regions (e.g., North Africa, Asia) should continue, as this can reduce dependence on European markets and mitigate associated risks. Additionally, governments should support the agricultural sector through appropriate policies, fiscal incentives, improved access to financing, and export promotion to maintain international competitiveness. Careful market monitoring and the implementation of risk management mechanisms (such as agricultural insurance and stabilization funds) are also necessary to sustain sector resilience.
Moreover, given the positive correlations among the countries, common EU-level policies are necessary, including funds for agricultural modernization, insurance schemes, and income stabilization for farmers, and anti-crisis mechanisms for shocks such as the war in Ukraine. In conclusion, the results suggest that although the share of raw agricultural exports is decreasing, agriculture must be treated as a strategic sector. The recommendations focus on increasing added value, investing in technology, diversifying markets, and adopting common regional policies to ensure the competitiveness and resilience of the sector in the face of external crises. These recommendations should be understood as practical implications derived from the study’s findings rather than definitive policy prescriptions, and future research will build on a broader, multi-dimensional analysis to further support policy formulation.
This study has several limitations that should be acknowledged. First, it relies on data from international institutions (World Bank [
19]), which may involve issues of availability, completeness, or accuracy. Second, the ARIMA models employed are suitable primarily for short-term forecasting (2024–2026), limiting the long-term applicability of the results. Third, the analysis focuses on export dynamics as a share of total exports and does not incorporate other influencing factors, such as climate change, trade policies, CAP subsidies, or international cereal prices—elements that will be addressed in future research. Furthermore, the conclusions are specific to the seven countries analyzed and should not be generalized to all emerging economies in Central and Eastern Europe without caution. Additionally, this study deliberately focuses on the share of agricultural raw materials in total exports as a primary indicator of structural transformation, while future research will integrate additional variables—such as trade policies, CAP subsidies, and climate-related factors—to provide a more comprehensive analysis. Finally, ARIMA assumes linearity and series stability after differencing, meaning that extreme events, such as wars or climate shocks, could significantly alter the forecasts.
