Article

Impact of Soil Tillage Systems on CO2 Emissions, Soil Chemical Parameters, and Plant Growth Physiological Parameters (LAI, SPAD) in a Long-Term Tillage Experiment in Hungary

1
Institute of Agronomy, Hungarian University of Agriculture and Life Sciences, 2100 Godollo, Hungary
2
Department of Horticulture, College of Agriculture and Natural Resources, Mekdela Amba University, Tulu Awuliya P.O. Box 32, Ethiopia
3
Field Crop Department, College of Agriculture, University of Al-Qadisiyah, Al Diwaniyah 58002, Iraq
4
Institute of Environmental Sciences, Hungarian University of Agriculture and Life Sciences, 2100 Godollo, Hungary
*
Author to whom correspondence should be addressed.
Agriculture 2025, 15(17), 1810; https://doi.org/10.3390/agriculture15171810
Submission received: 20 July 2025 / Revised: 19 August 2025 / Accepted: 22 August 2025 / Published: 25 August 2025
(This article belongs to the Special Issue Innovative Conservation Cropping Systems and Practices—2nd Edition)

Abstract

Choosing the most sustainable and ecologically stable soil tillage techniques requires dependence on long-term field trials, which are essential for successful interventions and evidence-based decision-making. This research evaluated several factors, including soil biological activity (CO2 emission), soil chemical properties (pH (KCl), soil organic matter (SOM)), plant growth physiological indicators (Leaf Area Index (LAI), Soil and Plant Analysis Development (SPAD)), crop yield, and grain quality (Zeleny index, protein %, oil %, and gluten % content), under six soil cultivation methods that represent varying degrees of soil disturbance in a long-term (23 years) tillage experiment. Conventional tillage (ploughing (P)) and conservational tillage techniques (loosening (L), deep cultivation (DC), shallow cultivation (SC), disking (D), and no-till (NT)) were examined for three years (2022, 2023, and 2024) in a winter barley–soybean–winter wheat cropping system. Results indicate that tillage intensity has a differential influence on soil biological parameters, with minor variations in SPAD values across treatments. The findings show significant variations in CO2 emissions, LAI values, and grain quality in certain years, likely due to the influence of P and L tillage treatments. The novelty of this study lies in determining that, although the short-term effects of soil tillage on crop physiological parameters and grain yield may be minimal under fluctuating climatic conditions, long-term tillage practices significantly influence existing disparities, underscoring the necessity for site-specific and climate-resilient tillage strategies in sustainable crop production.

1. Introduction

To ensure food security and soil health, global field crop production, especially wheat (Triticum aestivum L.), must sustain high yields in the face of increased climatic variability. Traditional tillage and monocropping practices reduce soil organic matter and microbial activity and increase sensitivity to drought and heat stress [1]. In the global agricultural system, tillage practices are crucial since they affect ecosystem health and food security [1]. Tillage is a fundamental agronomic practice that directly influences soil functionality and biodiversity. On one hand, tillage can improve seedbed conditions [2], enhance soil aeration [3], and temporarily increase nutrient mineralization, thereby supporting early plant growth and crop development. However, excessive or inappropriate soil tillage may lead to soil structure degradation [4], increased erosion [5], reduced water management, and disruption of soil microbial life [6], endangering long-term soil health and biodiversity.
Recent years have seen an increased focus on the environmental impacts of various tillage techniques, especially concerning soil organic matter (SOM) levels and soil CO2 emissions, both of which are critical markers of soil sustainability and health [7]. A multitude of research has investigated the impact of tillage techniques on CO2 fluxes and SOM levels [8,9,10]. Tillage-induced changes in soil physical structure, moisture content, and microbial activity may profoundly influence carbon dynamics, as consistently demonstrated in the literature [11,12]. Nevertheless, several environmental and agronomic factors, such as climate zone, seasonal variability, soil type, and vegetation characteristics, influence these effects, which are frequently context-dependent [13]. Therefore, site-specific research is needed to observe how these interacting factors modify the impact of different tillage practices on soil [14].
To comprehend the intricate relationships between tillage systems and agroecosystem processes, long-term field experiments are still essential [12,13]. In the literature, conservation tillage and no-tillage systems provide agronomic and environmental advantages, especially in climates with high temperatures and limited precipitation [15]. However, conservation tillage can reduce soil loss in areas at risk of agricultural soil erosion [16], and it may result in higher yields [17], although yield outcomes are strongly affected by environmental factors [18].
Plant–soil interactions, particularly soil respiration and crop physiological responses, are also influenced by these climate-driven factors. Leaf Area Index (LAI), a crucial metric of the photosynthetically active surface area of crops in agroecosystems, has been demonstrated to have a substantial correlation with soil respiration in previous studies [19,20]. To evaluate the nutritional and physiological state of crops, in addition to LAI, the leaf chlorophyll content is frequently measured using the Soil Plant Analysis Development (SPAD) index. Previous studies have shown that cultivation systems have a significant impact on crop physiological traits [21,22]. However, little is known about how tillage systems, vegetation indices (SPAD and LAI), and yield quality interact, especially in the context of long-term crop rotations. Addressing this knowledge gap can guide more effective field practices tailored to site-specific conditions and balanced productivity. Consequently, selecting the appropriate tillage method is crucial for promoting optimal root growth and nutrient uptake in crops.
The structure, nutrient retention, and water-holding capacity of wheat-based conservation agriculture systems are all dependent on the presence of soil organic matter. Root growth and plant survival are both facilitated with SOM, which improves cation exchange capacity and soil aggregate stability. The accumulation of SOM increases in conservation tillage systems, which enhances the nitrogen cycle and promotes soil fertility [7]. The rhizosphere, which is the biochemical interface between plants and soil, is where microbial populations make a contribution to the mineralization of nutrients and the overall health of plants. Rhizosphere respiration is an integrated measure of microbial and root metabolic activity [19,20]. Rhizosphere respiration is influenced by the retention of residues and reduced tillage. Microbial communities that are active contribute to an increase of nitrogen cycling and the production of growth-promoting compounds, which in turn protect field crops against abiotic stresses. The shape of the wheat canopy and the patterns of light interception have an effect on the efficiency of photosynthesis and the accumulation of biomass above ground. According to Yao et al. [19], crop residues have the ability to modulate canopy microclimates by reducing temperature extremes and conserving soil moisture [18]. Field crop production systems can be protected against the effects of climatic variability through the interaction of conservation agricultural methods and varied crop rotations. To improve plant resilience to the abiotic stresses of heat and drought, agricultural practices that develop soil organic matter, maintain residue cover, and incorporate legumes enhance water-use efficiency and root exploration depth. This integrated strategy enhances the adaptive capacity of different crop production systems, thereby improving the quality and quantity of the produce yield in the face of increasingly uncertain weather patterns [1].
This study hypothesizes that integrating conservation tillage with nutrient and water retention, and cereal–legume crop rotation, can result in a combined enhancement of SOM and soil microbial ecology, which indirectly improves crop canopy growth, the water-use efficiency of the crop, and better yield quantity and quality, along with improving crop resilience to abiotic stresses. In this study, we aimed to examine (a) the impact of six distinct tillage methods (both conventional and conservation) on specific soil biological (CO2 emissions) and chemical properties (pH (KCl) and soil organic matter) and (b) their effect on yield, seed quality, and vegetation indices (SPAD and LAI index) in winter wheat, winter barley, and soybean rotation under the climatic conditions of Central Hungary. Given its potential influence on soil characteristics and crop performance under seasonal conditions, the year of cultivation was also considered as a relevant experimental factor.
The objectives of this study are listed as follows:
  • To investigate the effects of conservation tillage and plant residue utilization on SOM and soil microbial respiration.
  • To measure the canopy’s physiological responses and photosynthetic efficiency under different soil tillage practices.
  • To evaluate the impact of crop rotations on soil, root, and yield in a conservation-managed agriculture system.
  • Integrate root-shoot surrounding system performance metrics to identify agronomic practices ideal for crop production and conservation of long-term soil health.

2. Materials and Methods

2.1. Description of the Experimental Site

The study site was located at the Jozsefmajor Experimental and Training Farm of the Hungarian University of Agriculture and Life Sciences (47°41′30.6″ latitude N, 19°36′46.1″ longitude E; 110 m a.s.l) in Hatvan, northeast of Budapest, Hungary. The topography of the study site is flat. The soil type was classified as an Endocalcic Chernozem with a clay–loam texture, following the WRB 2022 [23] (Table 1).
The upper 20 cm of the soil profile consists of 23% sand, 42% silt, and 35% clay [24]. According to Weldmichael et al. [25], the bulk density (BD) of the soil was 1.56 ± 0.02 g cm−3, as determined using the gravimetric method described by [26]. The soil contained available nitrogen at 57.20 mg kg−1, phosphorus pentoxide (P2O5) at 175.49 mg kg−1, and potassium oxide (K2O) at 211.55 mg kg−1 in 2024. The long-term tillage experiment, which was established in 2002, was set up in a Randomized Complete Block Design (RCBD) with four replication blocks, using a plot size of 13 × 180 m (Figure 1), and involved one-factor, the tillage system.

2.2. Weather Conditions and Precipitation Trends

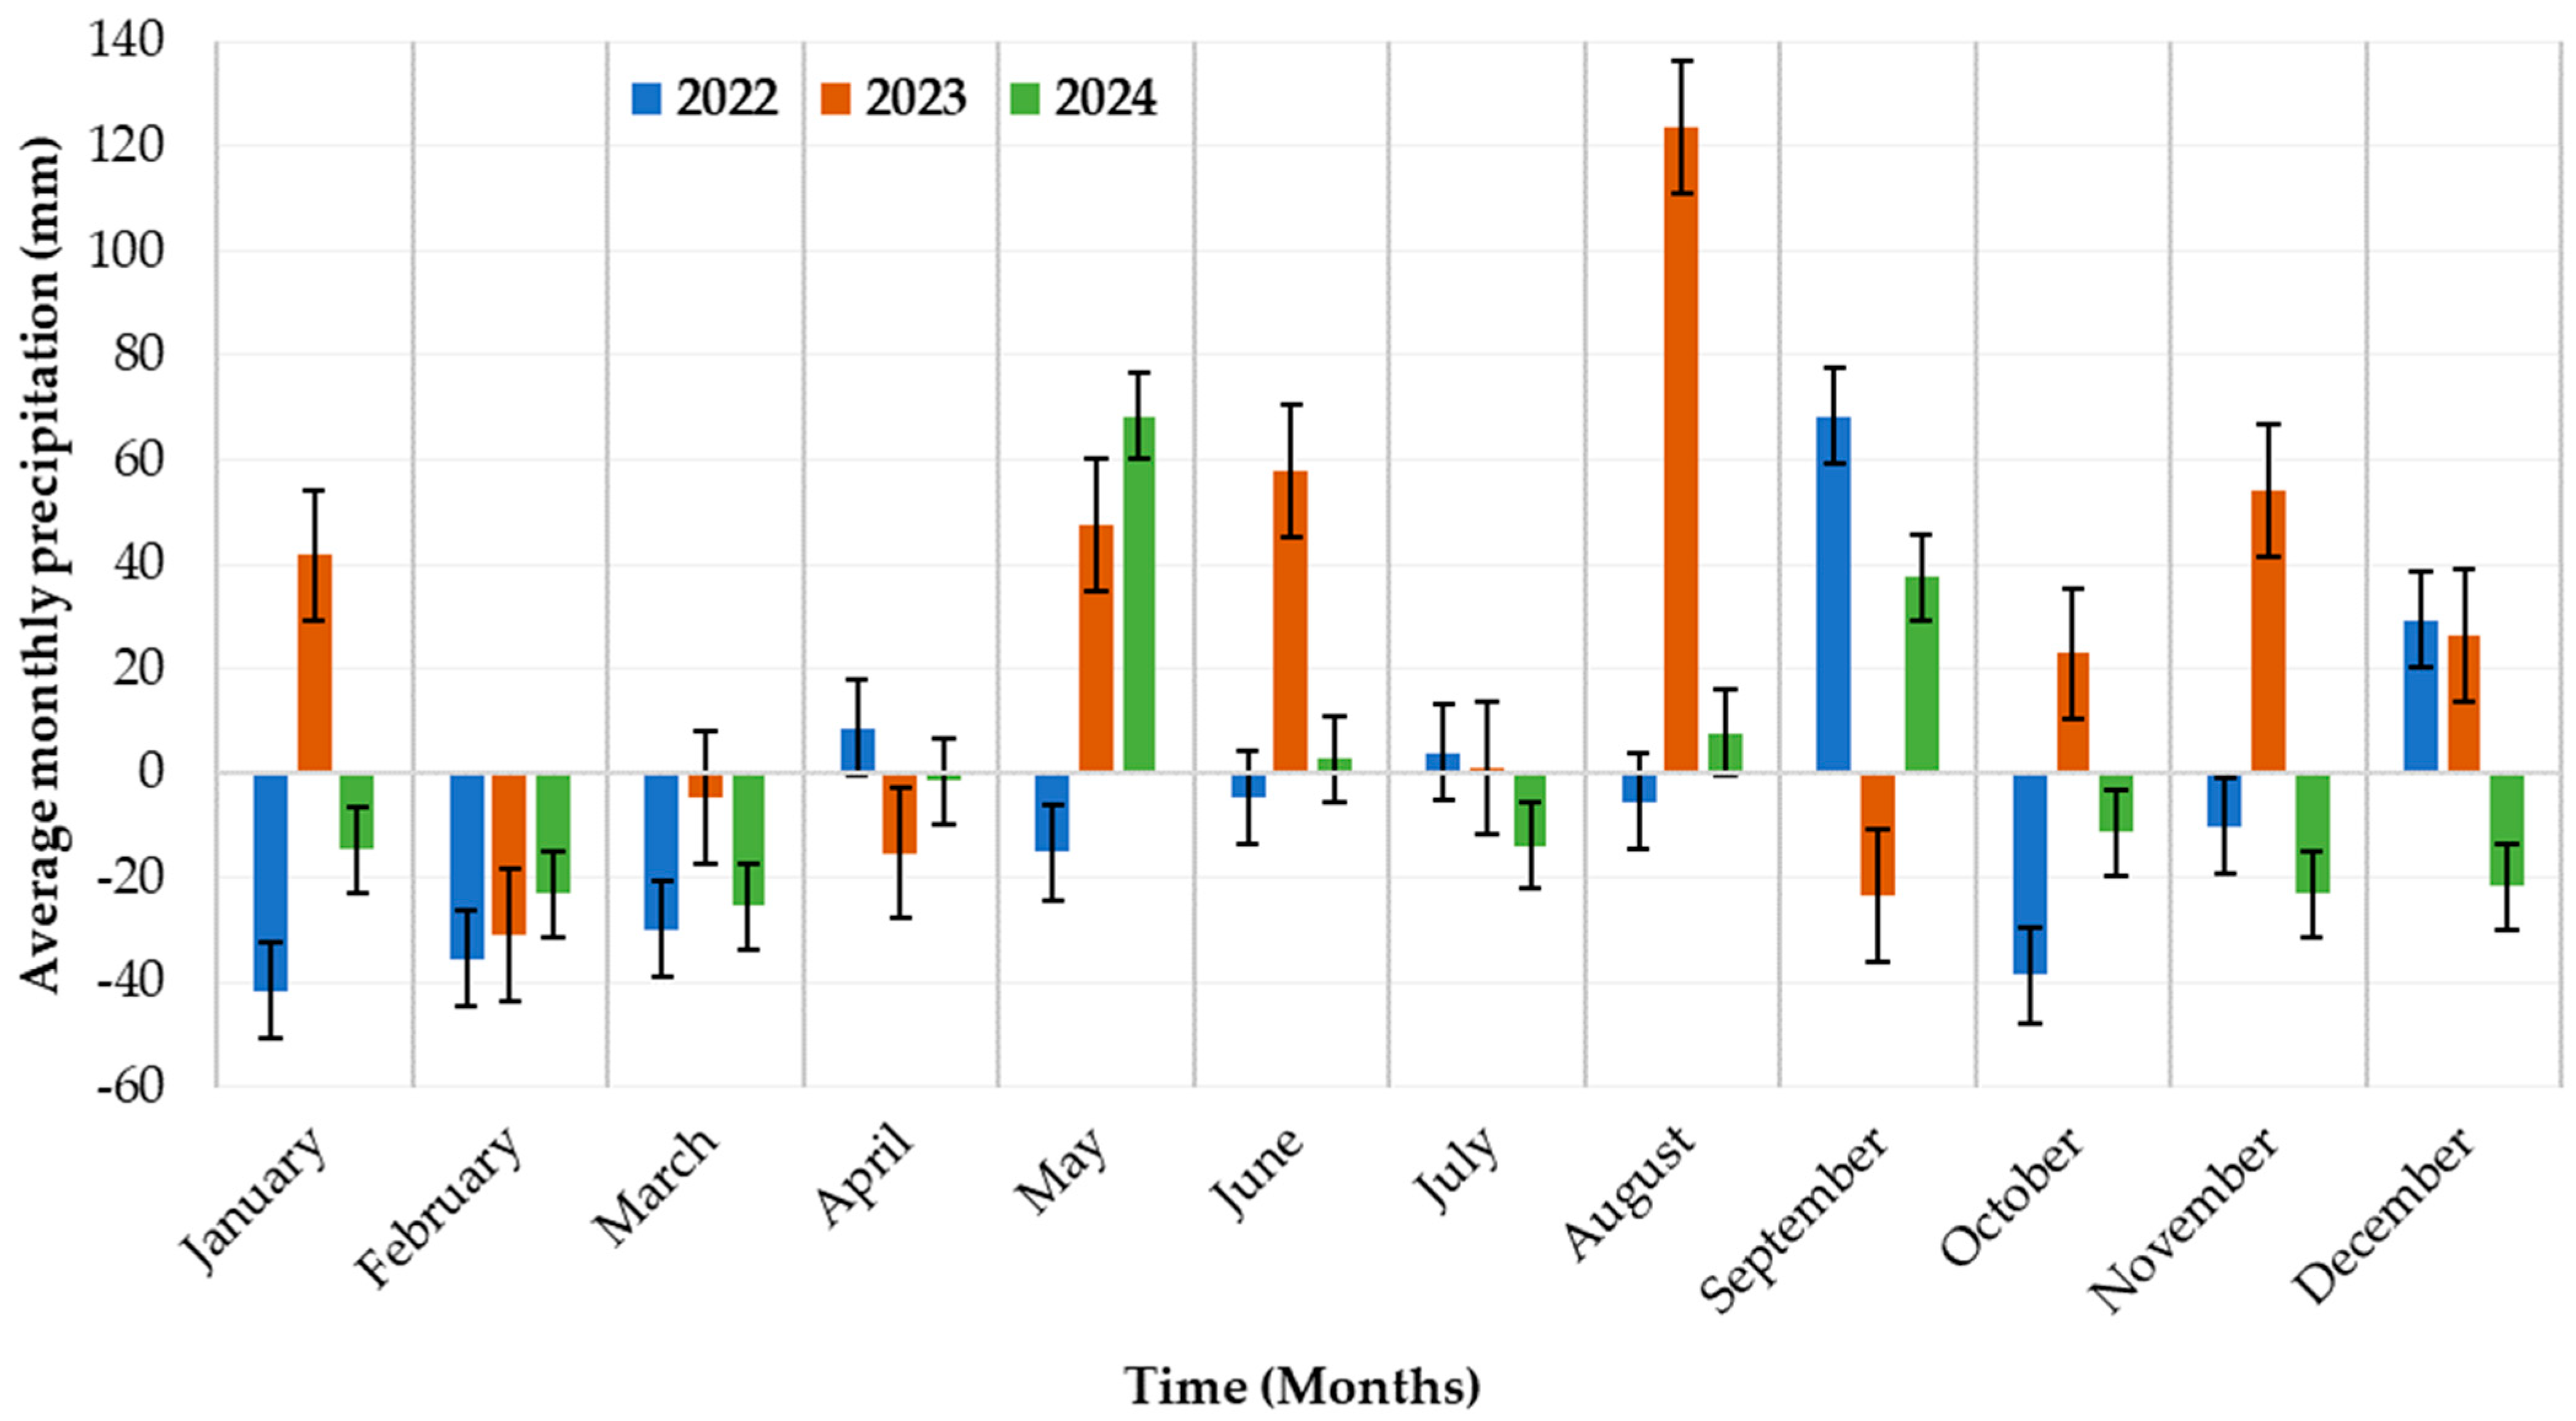
Climatic conditions were documented at the weather station of the Training Farm. The mean annual precipitation was 560 mm based on the 1961–1990 period [27]. The present study covers the 2022–2024 period. Comparing the meteorological data of the earlier period of 1901–2021 with the studied years (2022–2024), differences can be observed in monthly precipitation (Figure 2). Positive anomalies represent wetter-than-average months, while negative anomalies indicate drier-than-average conditions. The data suggest an emerging pattern of wetter-than-average conditions in late spring (May–June) and early autumn (September), combined with occasional extreme summer events (August 2023). Conversely, certain months, especially in mid-winter (January and February) and early spring (March), show substantial deficits in precipitation.
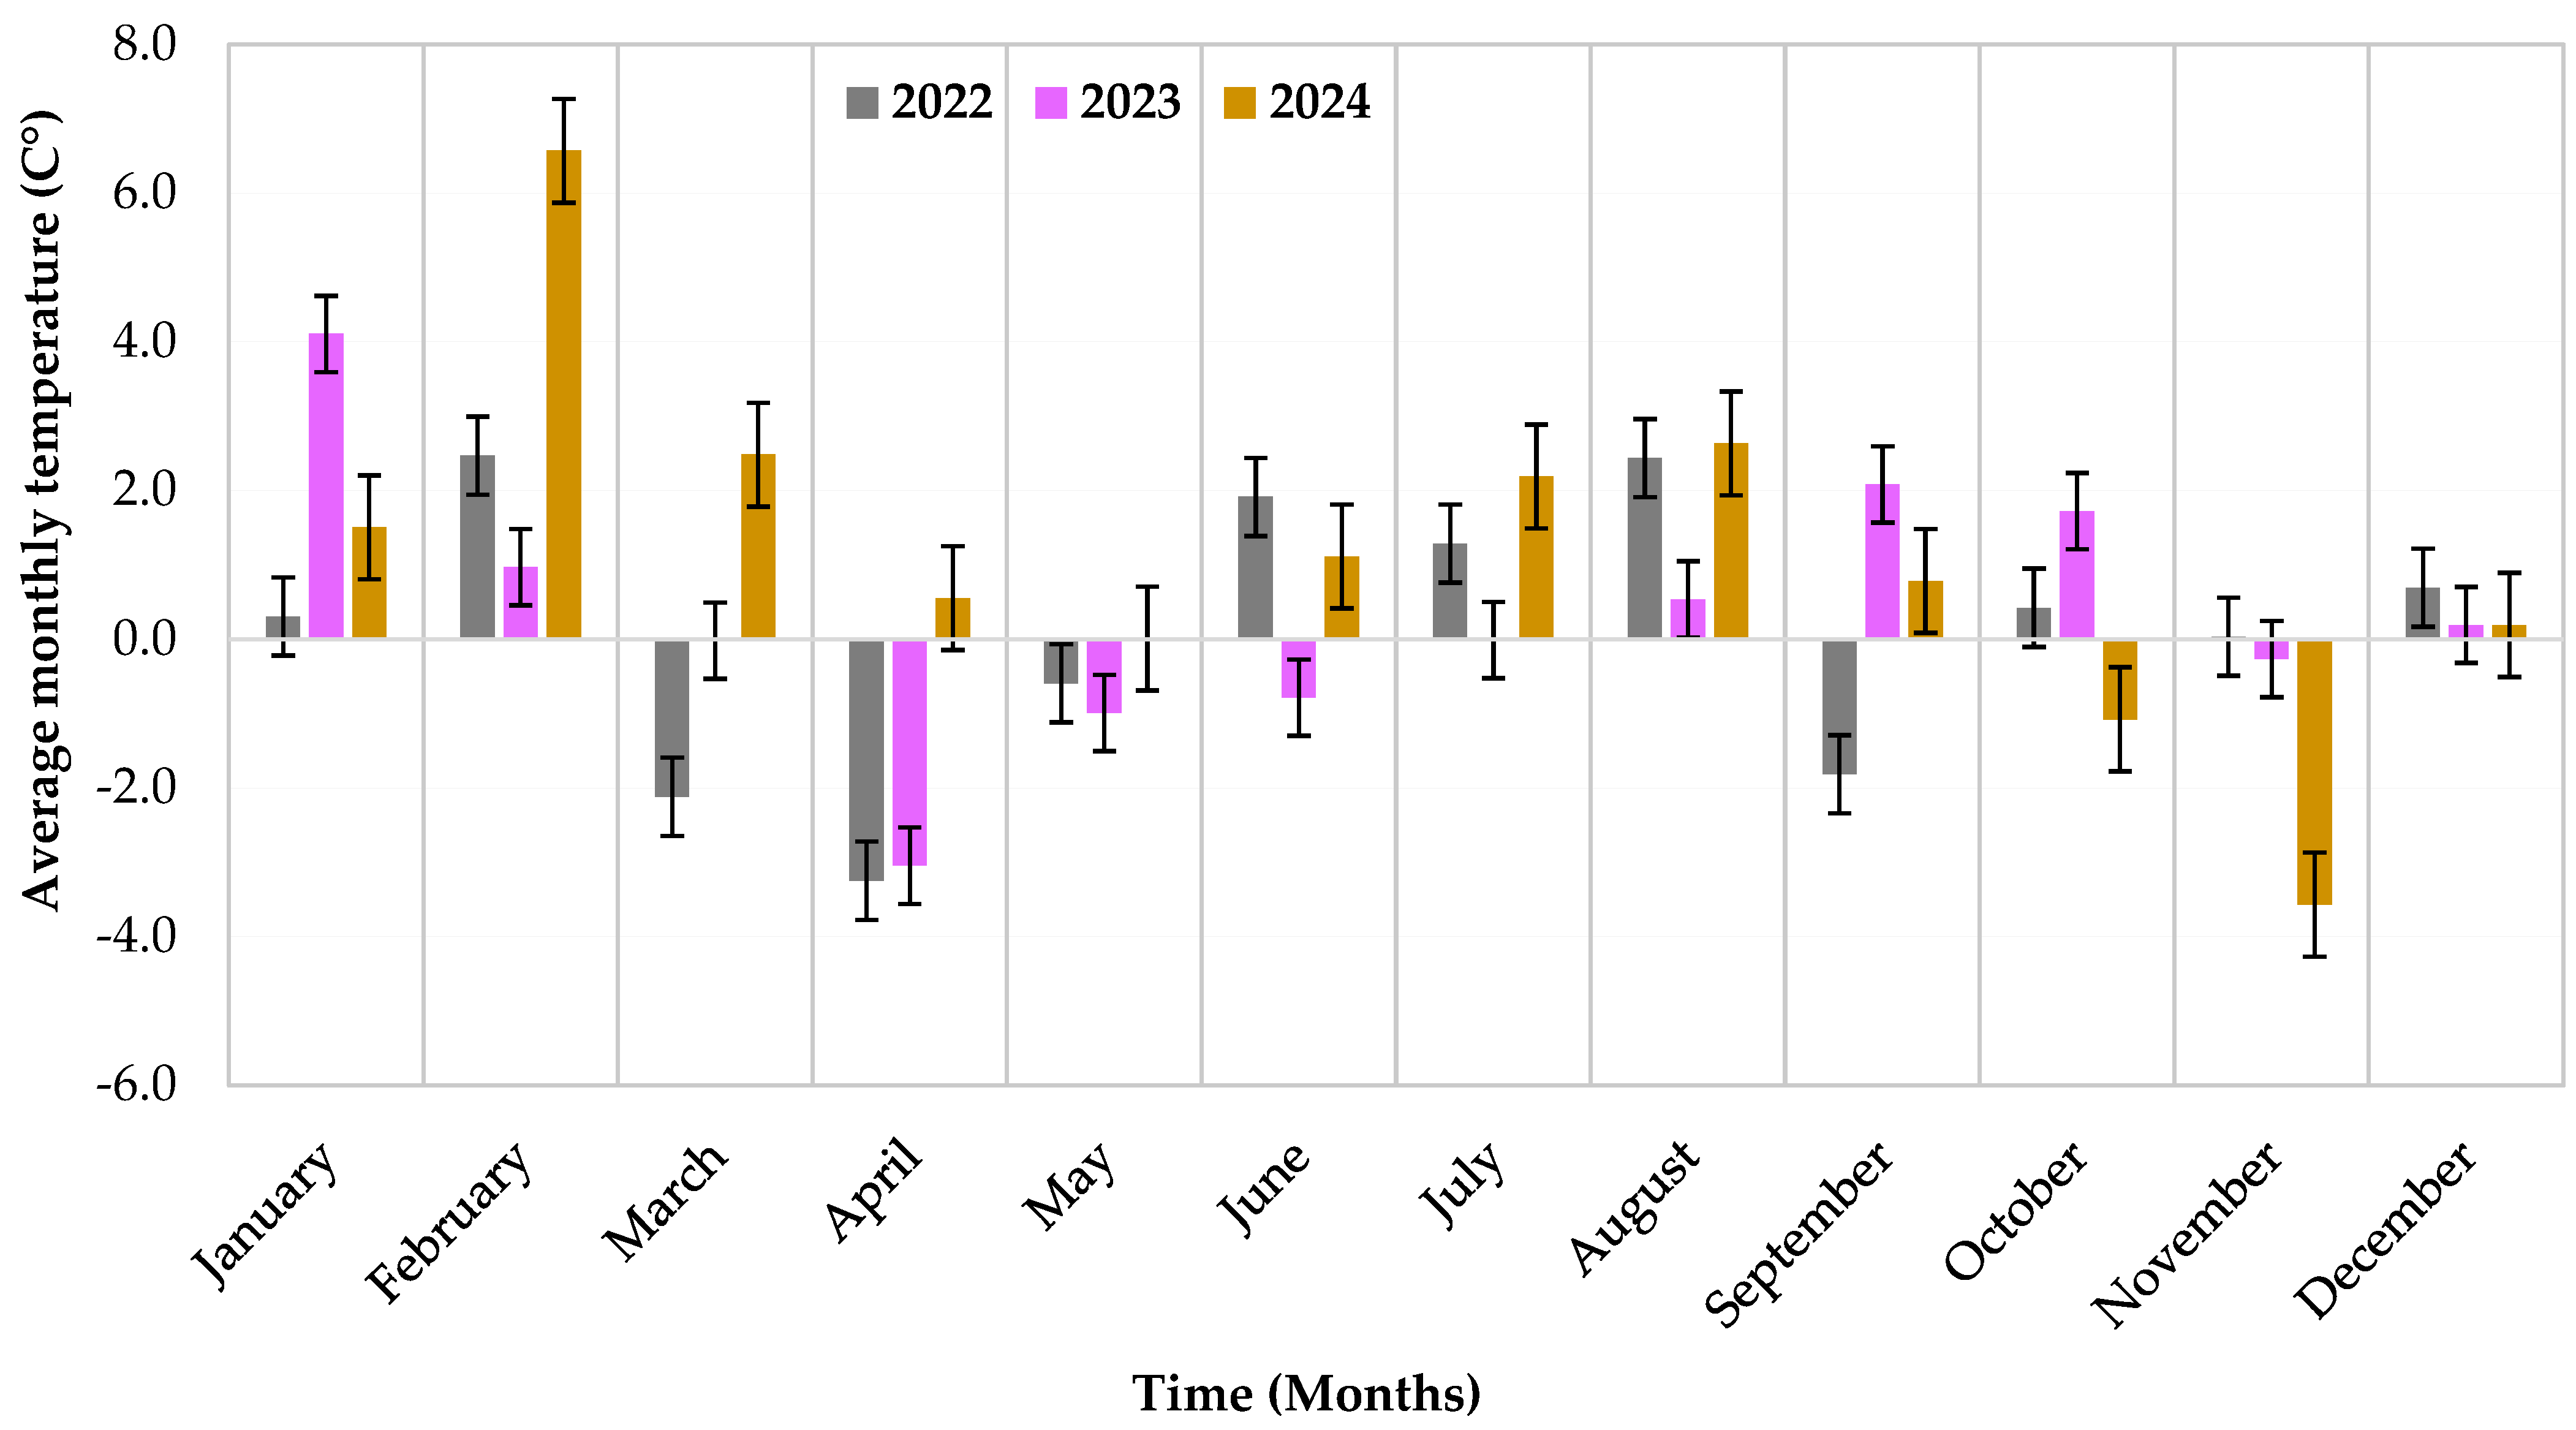
The analysis of average monthly temperature anomalies for 2022–2024, relative to the 1902–2021 climatological baseline, reveals marked interannual and seasonal variability (Figure 3). January 2023 (+4.10 °C) and February 2024 (+6.60 °C) showed the largest positive winter anomalies, while March 2024 was notably warm (+2.50 °C) compared to the 1901–2021 baseline. April 2022 (−3.20 °C) and November 2024 (−3.60 °C) were among the coldest months. Summer anomalies were generally positive (+0.50 °C to +2.60 °C), with smaller variations in June and July. The annual mean minimum temperature is −2.00 °C, while the mean maximum temperature is 11.00 °C.

2.3. Tillage Treatments

The long-term field experiment of the Hatvan Jozsefmajor site encompasses the following six distinct tillage techniques commonly utilized in Hungary, comprising both conventional and conservational tillage methods: moldboard ploughing (P) at a depth of 28–32 cm, loosening (L) at 40–45 cm, deep cultivation (DC) at 22–24 cm, shallow cultivation (SC) at 18–20 cm, disking (D) at 16–20 cm, and no-tillage (NT) or direct sowing. In this study, tillage treatments are defined as follows: conventional tillage refers to moldboard ploughing (carried out with plow); conservation or reduced tillage includes loosening (by using subsoiler), deep and shallow cultivation (done by tine cultivator), and disking, all performed without soil inversion; as well as no-tillage, where soil disturbance occurs only during sowing. While conventional tillage, moldboard ploughing, inverts the soil to manage weeds and mix in crop residues, conservation tillage, generally carried out without soil inversion, leaves crop residues on the soil surface, thereby ensuring soil cover and reducing evaporation. Conservation tillage also helps to preserve soil moisture, restrict erosion, and promote greater soil biodiversity [6,8,15].
The experiment consisted of six treatments, each replicated four times, forming a total of 24 experimental units. Tillage operations were conducted utilizing the following equipment: Vogel and Noot TerraFlex 300 (Vogel and Noot, Wartberg/Mürztal, Austria) (for L), Kverneland LM 100 with Packomat (Kubota, Osaka, Japan) (for P), Kverneland CLCpro 300 (Kubota, Osaka, Japan) (for SC and DC), and Väderstad Carrier 500 (Väderstad, Väderstad, Sweden) (for D), each designated for specific tillage treatments. Sowing was performed using a Väderstad Rapid 300 C ((Väderstad, Väderstad, Sweden) seed drill (for NT). Both tillage processes were subsequently accompanied by surface consolidation utilizing rollers simultaneously. No irrigation was carried out on the long-term experimental area. To enhance soil conservation and moisture retention, crop residues were left on the field after harvest. Their positioning differs according to the tillage technique; they were either incorporated into the soil via tillage or preserved on the surface under no-till circumstances.

2.4. Soil Chemical Analyses

The soil sampling was carried out in autumn 2024. The soil samples were collected at depths of 0–10, 10–20, 20–30, and 30–40 cm from each plot in triplicates. The soil parameters were determined according to the Official Hungarian Standards (MSZ) in the Central Analytical Laboratory of the Hungarian University of Agriculture and Life Sciences in Szarvas. The pH (KCl) was measured potentiometrically using a 1:2.5 soil-to-KCl-solution ratio with a digital pH meter (HACH-LANGE, HQ411D) (MSZ-08-0206/2:1978) [28]. According to Hungarian Standards (MSZ-08-0210:1977) [29], soil organic matter (SOM) was quantified by oxidation using a mixture of 5% K2Cr2O7 and concentrated H2SO4 in a 1:2 ratio. The hue of the amalgamation was assessed using the UNICAM Photometer (UV2 043,506).

2.5. Crop Sequence

The crop rotation strategy was designed to enhance soil quality and minimize weed pressure [30]. This research selected two winter crops, barley and wheat, which are typically cultivated in Northeastern Hungary [13,31]. The experimental field followed a Central European crop rotation pattern over the study period. In 2022, winter barley (Hordeum vulgare L). was harvested, followed by soybean (Glycine max L.) in 2023, and winter wheat (Triticum aestivum L.) in 2024. Over the 23 years, cereals (winter wheat, spring barley, and spring/winter oats) were cultivated for 13 years, wide-row crops (maize, sunflower, and sorghum) for 6 years, and legumes (peas and soybeans) for only 2 years [32]. Since the establishment of the long-term experiment, the following crop sequence has been implemented: white mustard (2002), winter wheat (2002/03), rye (2003/04), green pea (2004), winter wheat (2004/05), white mustard (2005), winter wheat (2005/06), phacelia (2006), maize (2007), sunflower (2008), winter wheat (2008/09), white mustard (2009), maize (2010), spring oat (2011), winter wheat (2011/12), spring barley (2013), sunflower (2014), winter wheat (2014/15), maize (2016), winter oat (2016/17), soybean (2018), winter wheat (2019), sunflower (2020), and winter barley (2021/22).
Due to the limited incorporation of legumes, a decision was made to include soybeans in the crop sequence for 2023 to enhance soil organic matter and facilitate the biological nitrogen fixation in the soil [33]. All management procedures, including sowing, fertilization, weed control, pesticide application, and harvesting, were consistently implemented throughout all plots, except for tillage (Table A1).

2.6. Soil CO2 Emissions

Experiments regarding the impacts of tillage systems on soil CO2 emissions were conducted using an Environmental Gas Monitor EGM-5 (PP Systems, Amesbury, MA, USA), a portable gas analyzer, according to the EGM-5 Portable CO2 Gas Analyzer Operation Manual by PP Systems (EGM-5 Portable CO2 Gas Analyzer Operation Manual [34]). The instrument employs an infrared gas analyzer (IRGA) as its principal component for CO2 detection. The device is also equipped with a Soil Respiration Chamber (SRC-2), which connects directly to the device to facilitate direct CO2 measurements from the soil surface. In our study, we conducted CO2 measurements (g m−2 h−1) every month, with three replicates per treatment, on non-rainy days from March to October. All measurements were conducted during the first part of the day (between 9:00 a.m. and 2:00 p.m.). The CO2 flux is automatically computed by the EGM-5 using a formula detailed in its operational manual.

2.7. Leaf Area Index and Leaf Chlorophyll Content

Throughout the growing season, the Leaf Area Index (LAI) was measured monthly at consistent intervals using a handheld ACCUPAR LP-80 (Decagon, Quincy, CA, USA) portable instrument to assess the LAI across various layers of the crop. The LAI ceptometer quantifies photosynthetically active radiation (PAR) with 80 distinct sensors (field of view: 180°) on its probe [35]. The Soil and Plant Analysis Development (SPAD) index was determined monthly using the Konica Minolta portable chlorophyll meter (SPAD-502PLUS, Konica Minolta Inc., Tokyo, Japan). According to the instruction manual, the SPAD instrument was calibrated before each measurement [36]. Rapid and non-invasive in situ measurements were conducted in triplicates at randomly chosen sites within the treatments across the growing seasons, avoiding the edges of the plots. The measurement of photosynthetically active radiation (PAR) included one reading above the canopy and another underneath it, while 10 randomly chosen plants per treatment were analyzed to assess leaf chlorophyll content during each instance.

2.8. Crop Yield

Harvesting occurred at the physiological maturity of the crop, namely at full grain ripeness (89–92 BBCH), with the actual grain yield assessed by simultaneously harvesting the whole field. A 12-row, 6.6 m-wide combine harvester fitted with a straw chopper was used to harvest winter barley, winter wheat, and soybeans. Grain weights were recorded immediately on the combine or before transmission to the gatherer wagon. The actual grain production from the plots was adjusted for a moisture content of 14% and computed per hectare, as follows in Equation (1) [37]:
G r a i n   Y i e l d = G r a i n   Y i e l d   O b t a i n e d   ( t   h a 1 )   ×   ( 100 M C % ) ( 100 2.5 )
where MC% is the moisture content of the grain, expressed as a percentage. Grain yield was represented in tons per hectare (t ha−1) to facilitate consistent comparisons across various plots and treatments.

2.9. Grain Quality

Samples were taken from different spots on the combine harvester during harvesting. The quality of grain, including protein content, gluten content, and Zeleny sedimentation index, was assessed using near-infrared (NIR) spectroscopic equipment (Mininfra Scan-T Plus version 2.02, Infracont, Ankara, Turkey). This device transmits light within a wavelength range of 800–1064 nm and utilizes high-quality infrared optics for measuring whole grain, flour, and feed. Approximately 100 g of grain samples were introduced into the hopper, measured, and the values were recorded. The obtained soybean samples were analyzed at the Central Analytical Laboratory of the Hungarian University of Agriculture and Life Sciences in Kaposvár. Results are related to the generally used Hungarian quality standards (MSZ EN ISO 5983-2:2009 [38] and MSZ 6830-11:1999 [39]).

2.10. Statistical Analysis

Before conducting statistical analyses, the normality of the data was assessed using the Shapiro–Wilk test [40], along with skewness and kurtosis metrics. The soil CO2 emission data violated the assumption of normality; hence, a non-parametric statistical test, the Kruskal–Wallis test, was employed for this parameter [41,42]. Conversely, all other examined parameters confirmed the assumption of normalcy; thus, a one-way analysis of variance (ANOVA) was conducted at a significant level of 0.05. Statistical analyses were performed using IBM SPSS Statistics (version 29.0.1.0; IBM Corp., Armonk, NY, USA) to evaluate variations across soil tillage treatments. Microsoft Excel (version 2021; Microsoft Corp., Redmond, WA, USA) was used for data collection, processing, graphical representation, and tabulation of results.

3. Results

3.1. Influence of Year Effect and Vegetation on Soil Carbon Dioxide (CO2) Emissions

Soil CO2 emissions significantly fluctuated monthly and annually at the experimental field (Figure 4). Throughout the three years, soil CO2 fluxes increased from late spring to early summer, peaking in May 2024 at 0.68 g m−2 h−1 and in June 2024 at 0.64 g m−2 h−1. The year 2024 exhibited higher CO2 emissions during the growing season compared to 2022 and 2023, suggesting a possible influence of meteorological and vegetation-related variables on CO2 flux. Based on previous studies, elevated soil temperatures stimulate metabolism by increasing enzyme kinetics and accelerating the turnover of soil organic matter, leading to greater rates of heterotrophic [43,44,45,46]. Notably, CO2 flux in August 2024 was significantly lower than in the corresponding months of preceding years (p < 0.05). Conversely, the 2023 data indicate an exponential rise from March to August; still, these variations were not statistically significant. The minimum soil CO2 emission was recorded in July 2022, at 0.10 g m−2 h−1. As a result, elevated temperatures increased CO2 emissions, as seen throughout the late spring and summer periods.

3.2. Soil Carbon Dioxide (CO2) Emissions Under Different Soil Tillage Methods

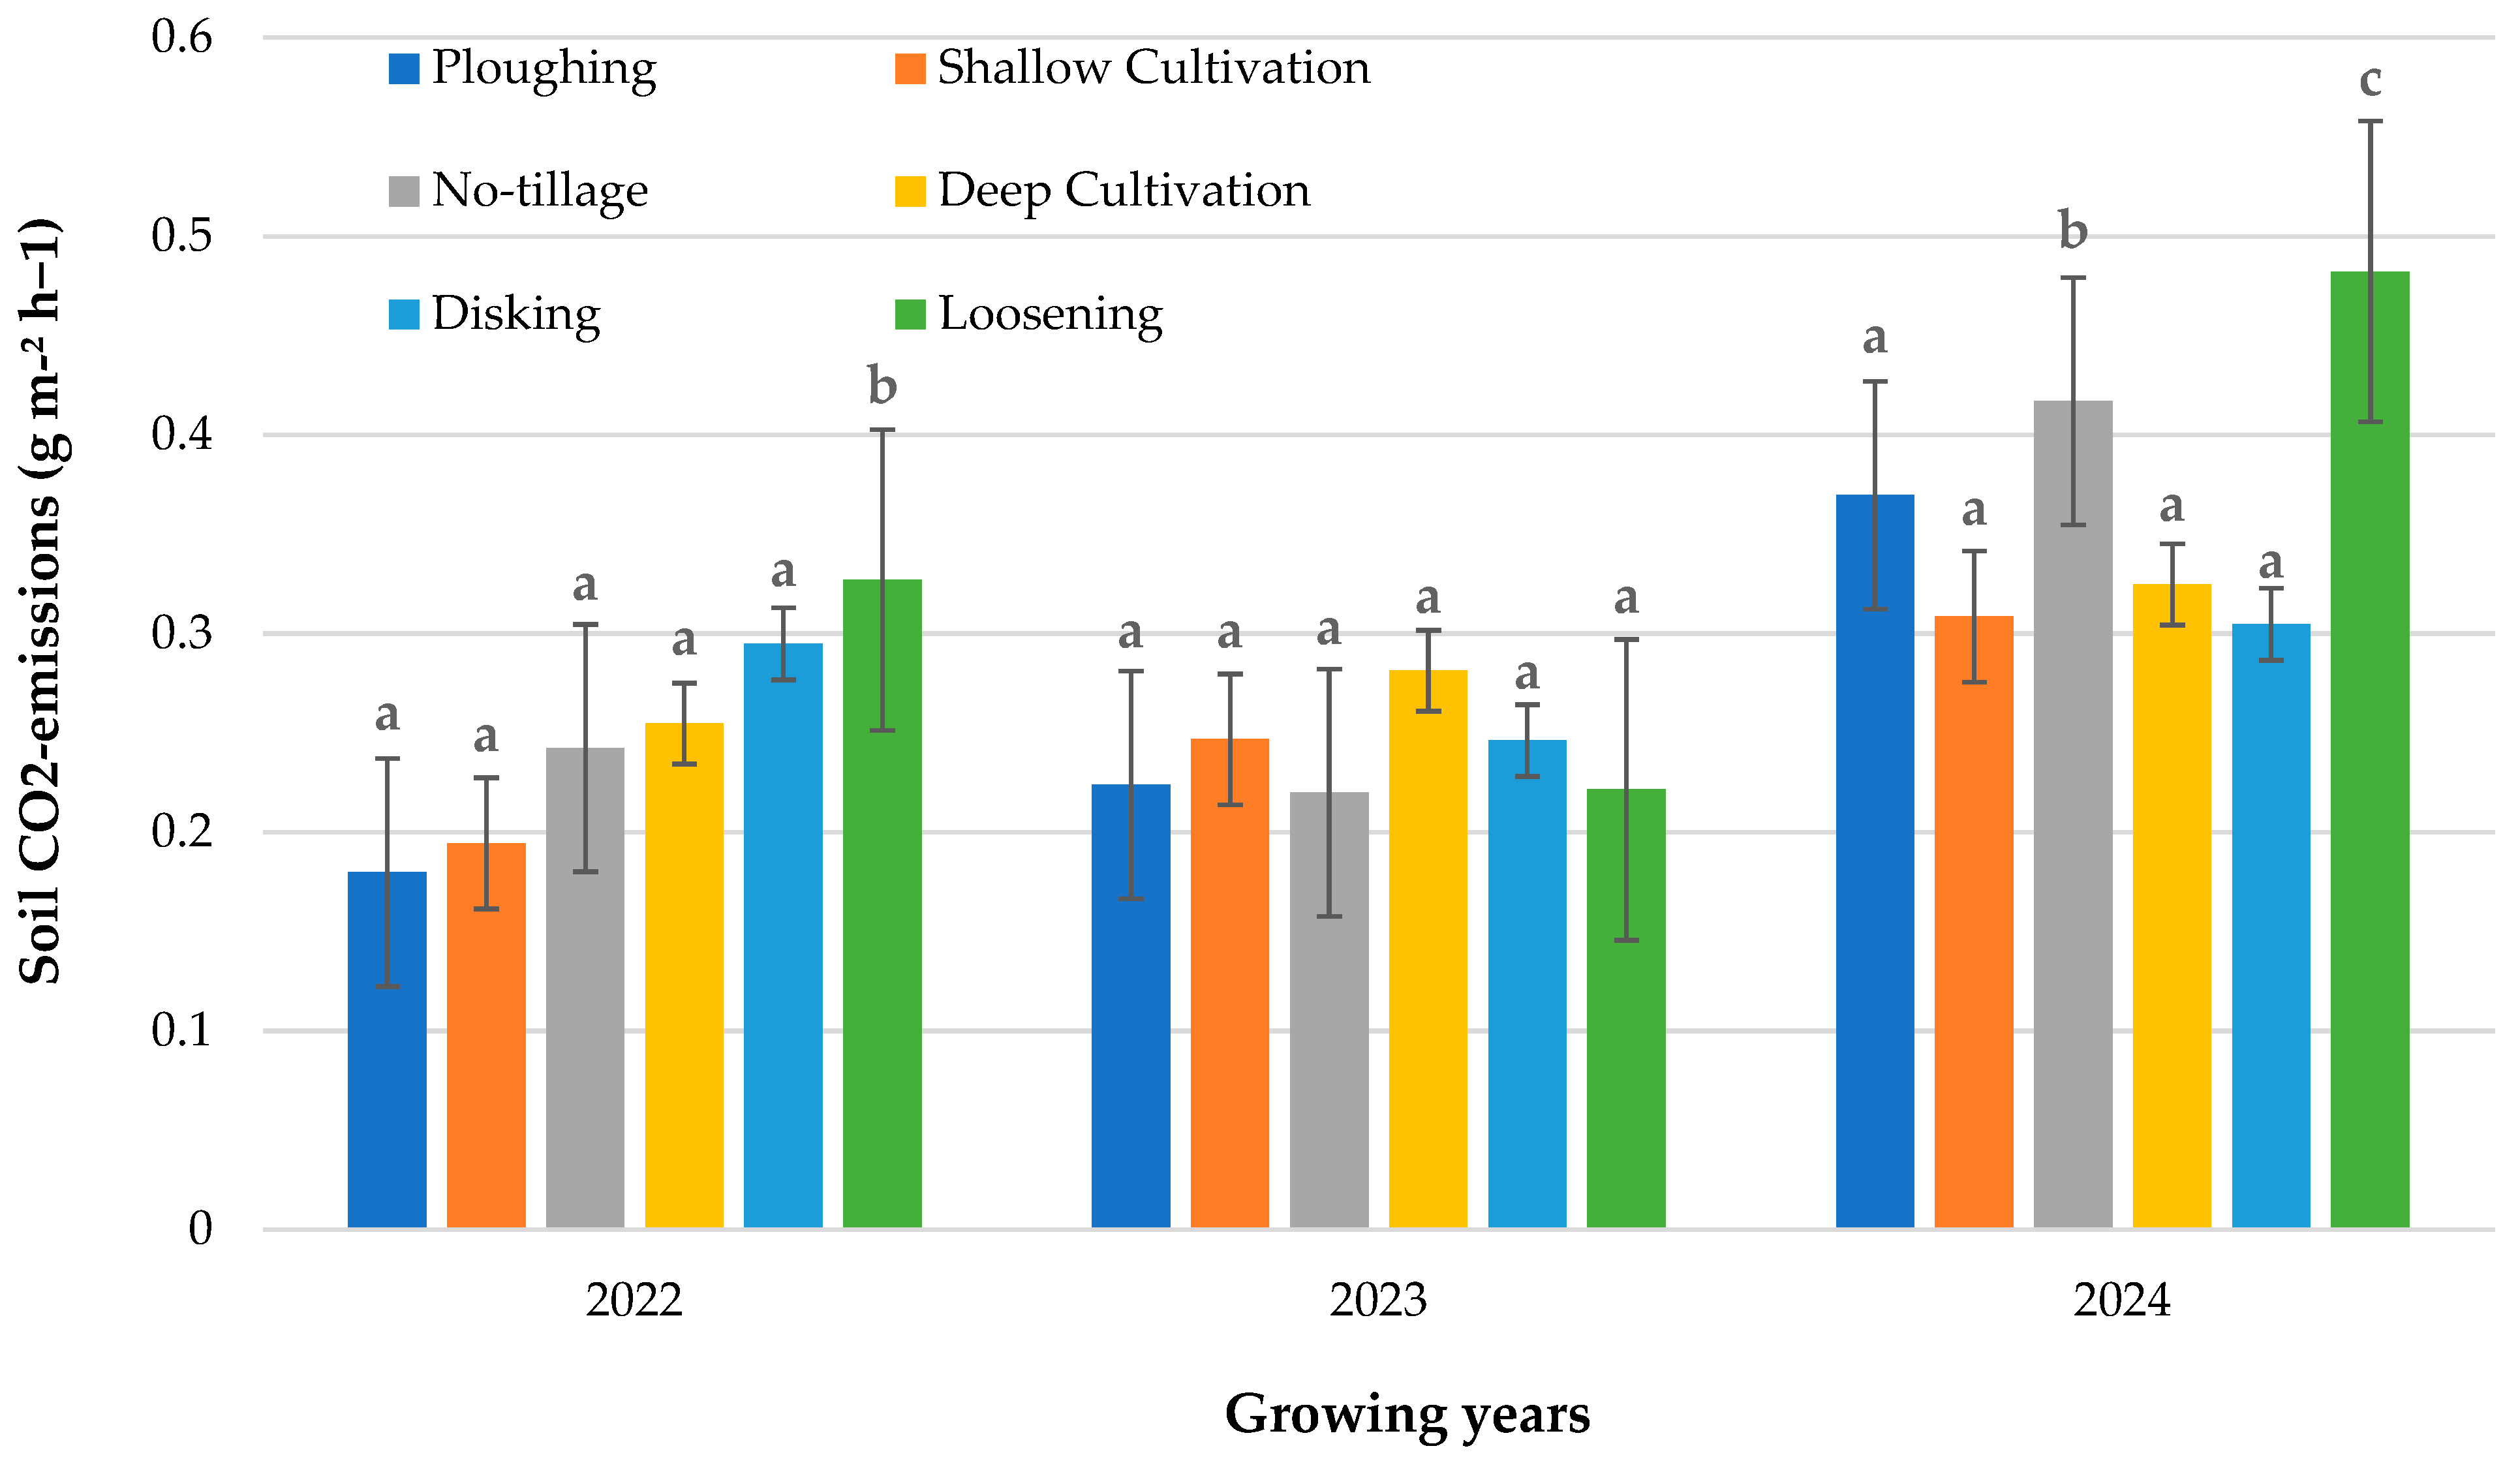
The analysis of soil CO2 emissions across the three growing seasons (2022, 2023, and 2024) revealed significant differences between tillage treatments; the CO2 emissions varied among soil tillage practices and within the studied years (Figure 5). During the growing seasons of 2022 and 2024, L caused predominantly higher CO2 emissions, at 0.33 g m−2 h−1 and 0.48 g m−2 h−1, compared to the other tillage practices. Conversely, the 2023 season exhibited no statistically significant variations across tillage methods. The lowest soil respiration rates in 2022 were observed in P, 0.18 g m−2 h−1, NT in 2023, 0.22 g m−2 h−1, and D in 2024, 0.30 g m−2 h−1.

3.3. Soil Chemical Properties Under Different Tillage Treatments

In general, soil pH (KCl) increased with depth across all treatments, with higher pH (KCl) values observed in P and L compared to other soil tillage treatments. Table 2 presents the average result of the soil analyses. Soil organic matter (SOM) (g kg −1) consistently decreased with depth, indicating a decline in organic matter accumulation in the deeper soil layers. The highest nitrogen (N) contents (mg kg−1) were observed in the topsoil 0–10 cm under D, 8.36 mg kg−1, and DC, 5.29 mg kg−1, while the deepest layers under NT, 14.50 mg kg−1, and D, 14.30 mg kg−1, also retained relatively higher nitrate levels. Phosphorus (P) concentrations were higher in the upper 0–20 cm soil layer (206.98 ± 54.62 mg kg−1) compared to the 20–40 cm soil layer (146.89 ± 18.88 mg kg−1). A similar pattern was observed in potassium (K), with mean values of 231.75 ± 38.37 mg kg−1 and 192.27 ± 10.74 mg kg−1 cm layer. Thus, the concentrations of extractable phosphorus and potassium were typically greater in the surface layers and diminished with increasing depth. In the 0–40 cm soil layer, the mean N concentration was 6.07 ± 3.13 mg kg−1. The corresponding values for P and K were 176.90 ± 50.40 mg kg−1 and 212.00 ± 34.10 mg kg−1, respectively. Consequently, D and NT exhibited elevated nutrient levels in contrast to the typical P approach, which recorded the lowest values across the examined soil profile.
The observed vertical variability in extractable N, P, and K across tillage treatments can be attributed to differences in mixing depth and nutrient mobility. Treatments that leave residues at the surface (no-tillage, shallow cultivation) concentrate P and K in the top 0–10 cm, while soluble NO3 migrates to deeper layers, producing mid-profile maxima. Conversely, deep tillage (disking, ploughing) mechanically inverts and homogenizes the soil to 25–30 cm, flattening nutrient gradients. These dynamics underscore how tillage intensity governs both the distribution and retention of key soil nutrients.

3.4. Leaf Area Index of Winter Barley–Soybean–Winter Wheat Crop Rotation Under Different Tillage Treatments

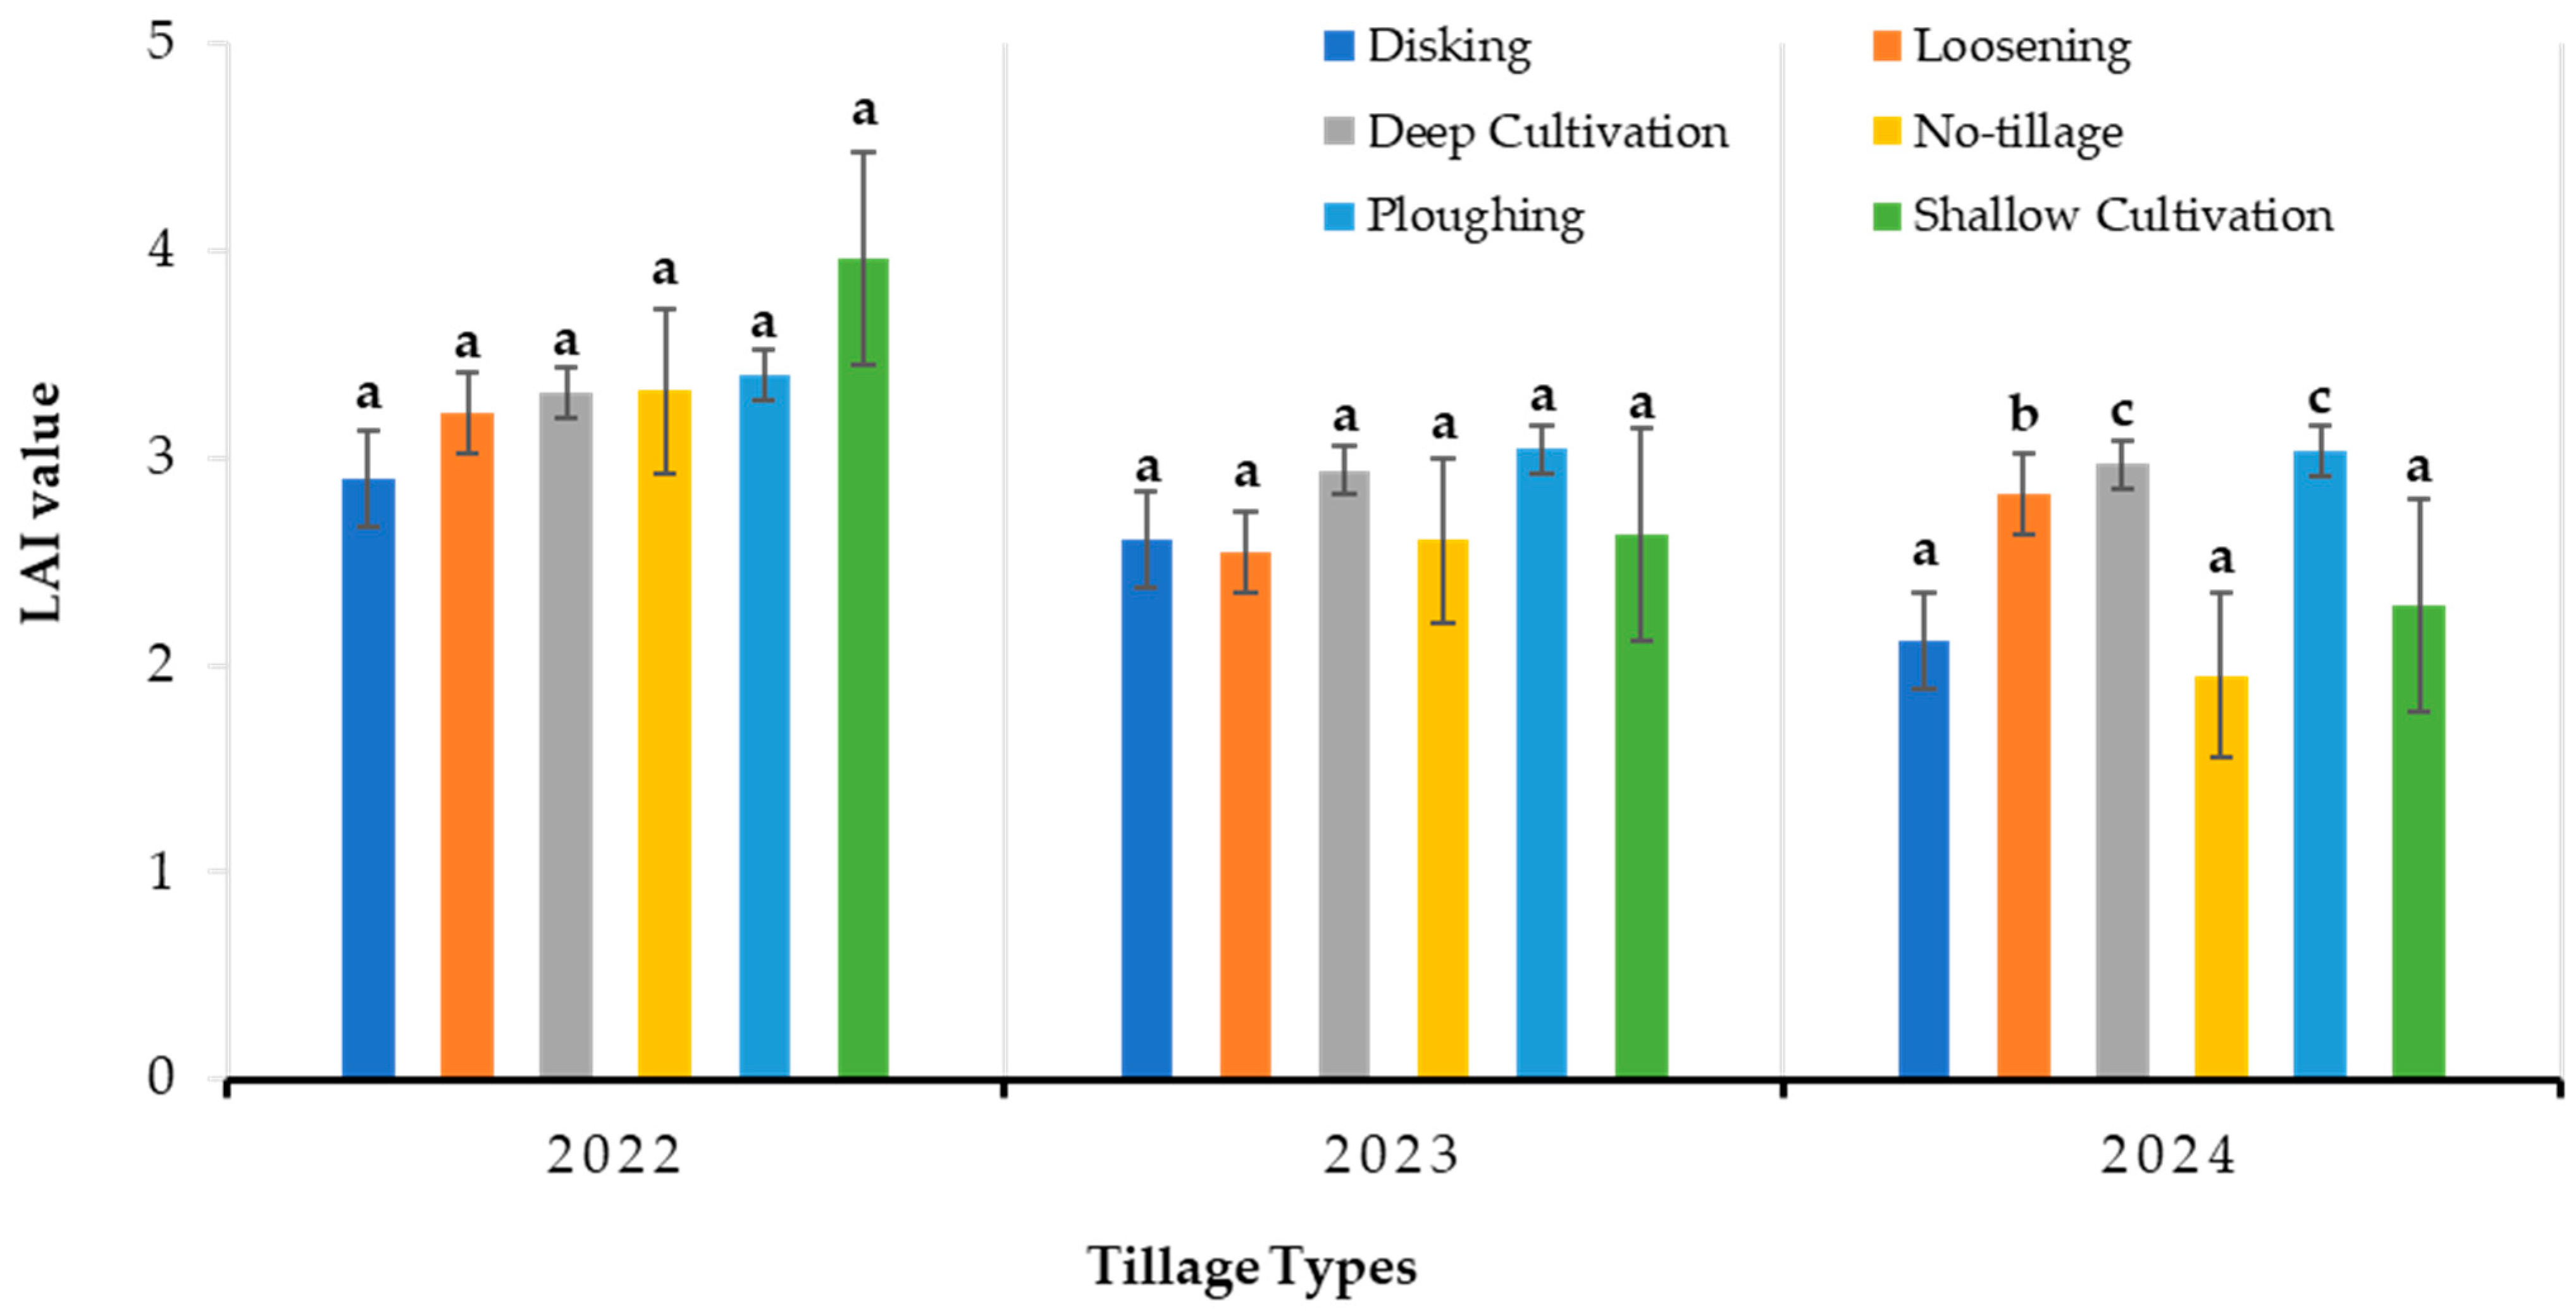
The analysis of variance (ANOVA) revealed that tillage treatments exerted differing effects on the LAI across the three growing seasons (Table 3). A statistically significant difference in LAI among tillage treatments was noted in the 2024 growing season (F = 8.66, p < 0.001). However, no significant differences were found during 2022 (F = 2.50, p = 0.052) and 2023 (F = 0.40, p = 0.847) growth seasons.
Post hoc analysis (Figure 6) indicated that the highest LAI values in 2024 were recorded under the DC (2.97) and P (3.03) tillage treatments. The L treatment (2.82) showed a significantly higher LAI compared to D (2.12), NT (1.95), and SC (2.29) treatments. Despite the absence of statistically significant differences across tillage treatments during the 2022 and 2023 growing seasons, numerical variations were observed. In 2023, P recorded the greatest LAI value (3.04), while L resulted in the lowest (2.54). In contrast, during the 2022 season, D produced the lowest LAI (2.90), whereas SC resulted in the highest LAI value (3.97).

3.5. Leaf Chlorophyll Content of Winter Barley–Soybean–Winter Wheat Crop Rotation Under Different Soil Tillage Methods

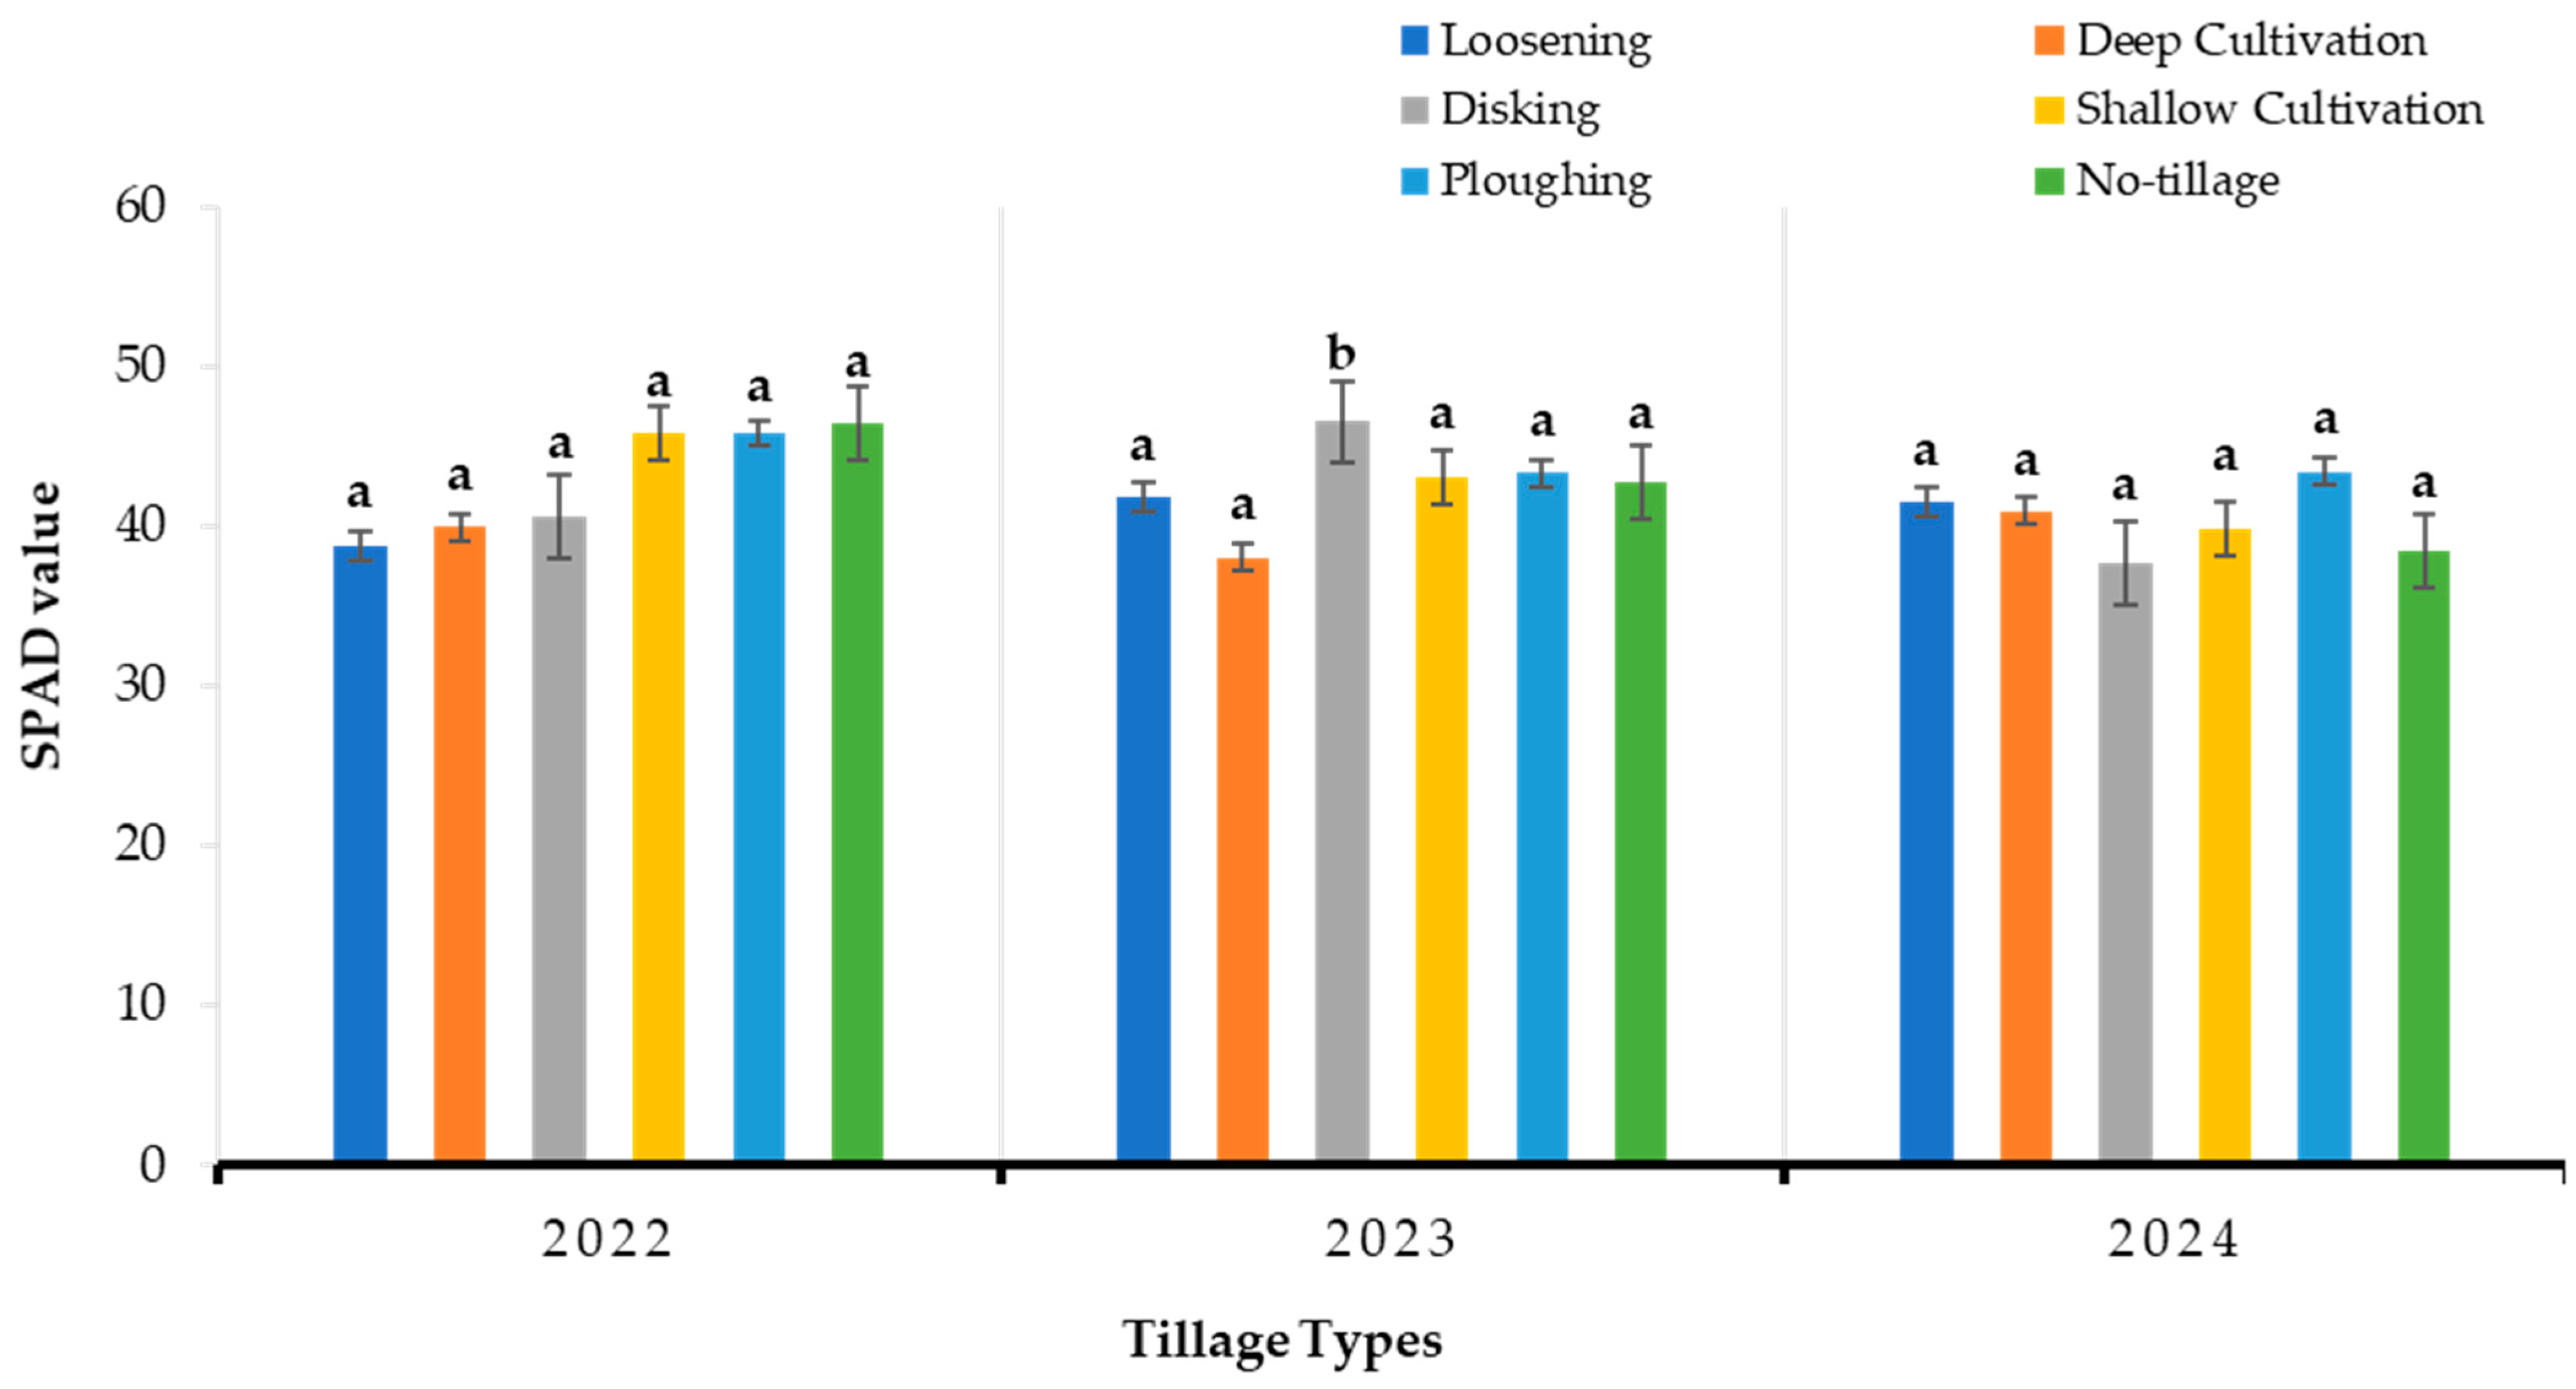
Statistically significant differences in the SPAD content were detected among soil tillage treatments over the growing season of 2023 (F = 2.32, p = 0.049) (Table 4). No significant differences were found between tillage treatments in the first season, 2022 (F = 2.10 p = 0.093), and the third season, 2024 (F = 1.25, p = 0.288). The mean findings in Figure 7 indicated that D treatment in 2023 yielded significantly higher SPAD value (46.50), marked by the letter b, while all other tillage treatments (loosening, cultivator, shallow cultivator, ploughing, and no-tillage) had statistically similar results.

3.6. Grain Yield Under Different Tillage Treatments

The ANOVA results (Table 5) indicated significant differences in grain yield among tillage treatments for winter barley (F = 6.07, p = 0.002) in the growing season of 2022 and for winter wheat (F = 4.52, p = 0.008) in the 2024 growing season. The yield of soybeans was not significantly influenced by tillage methods (F = 0.85, p = 0.530).
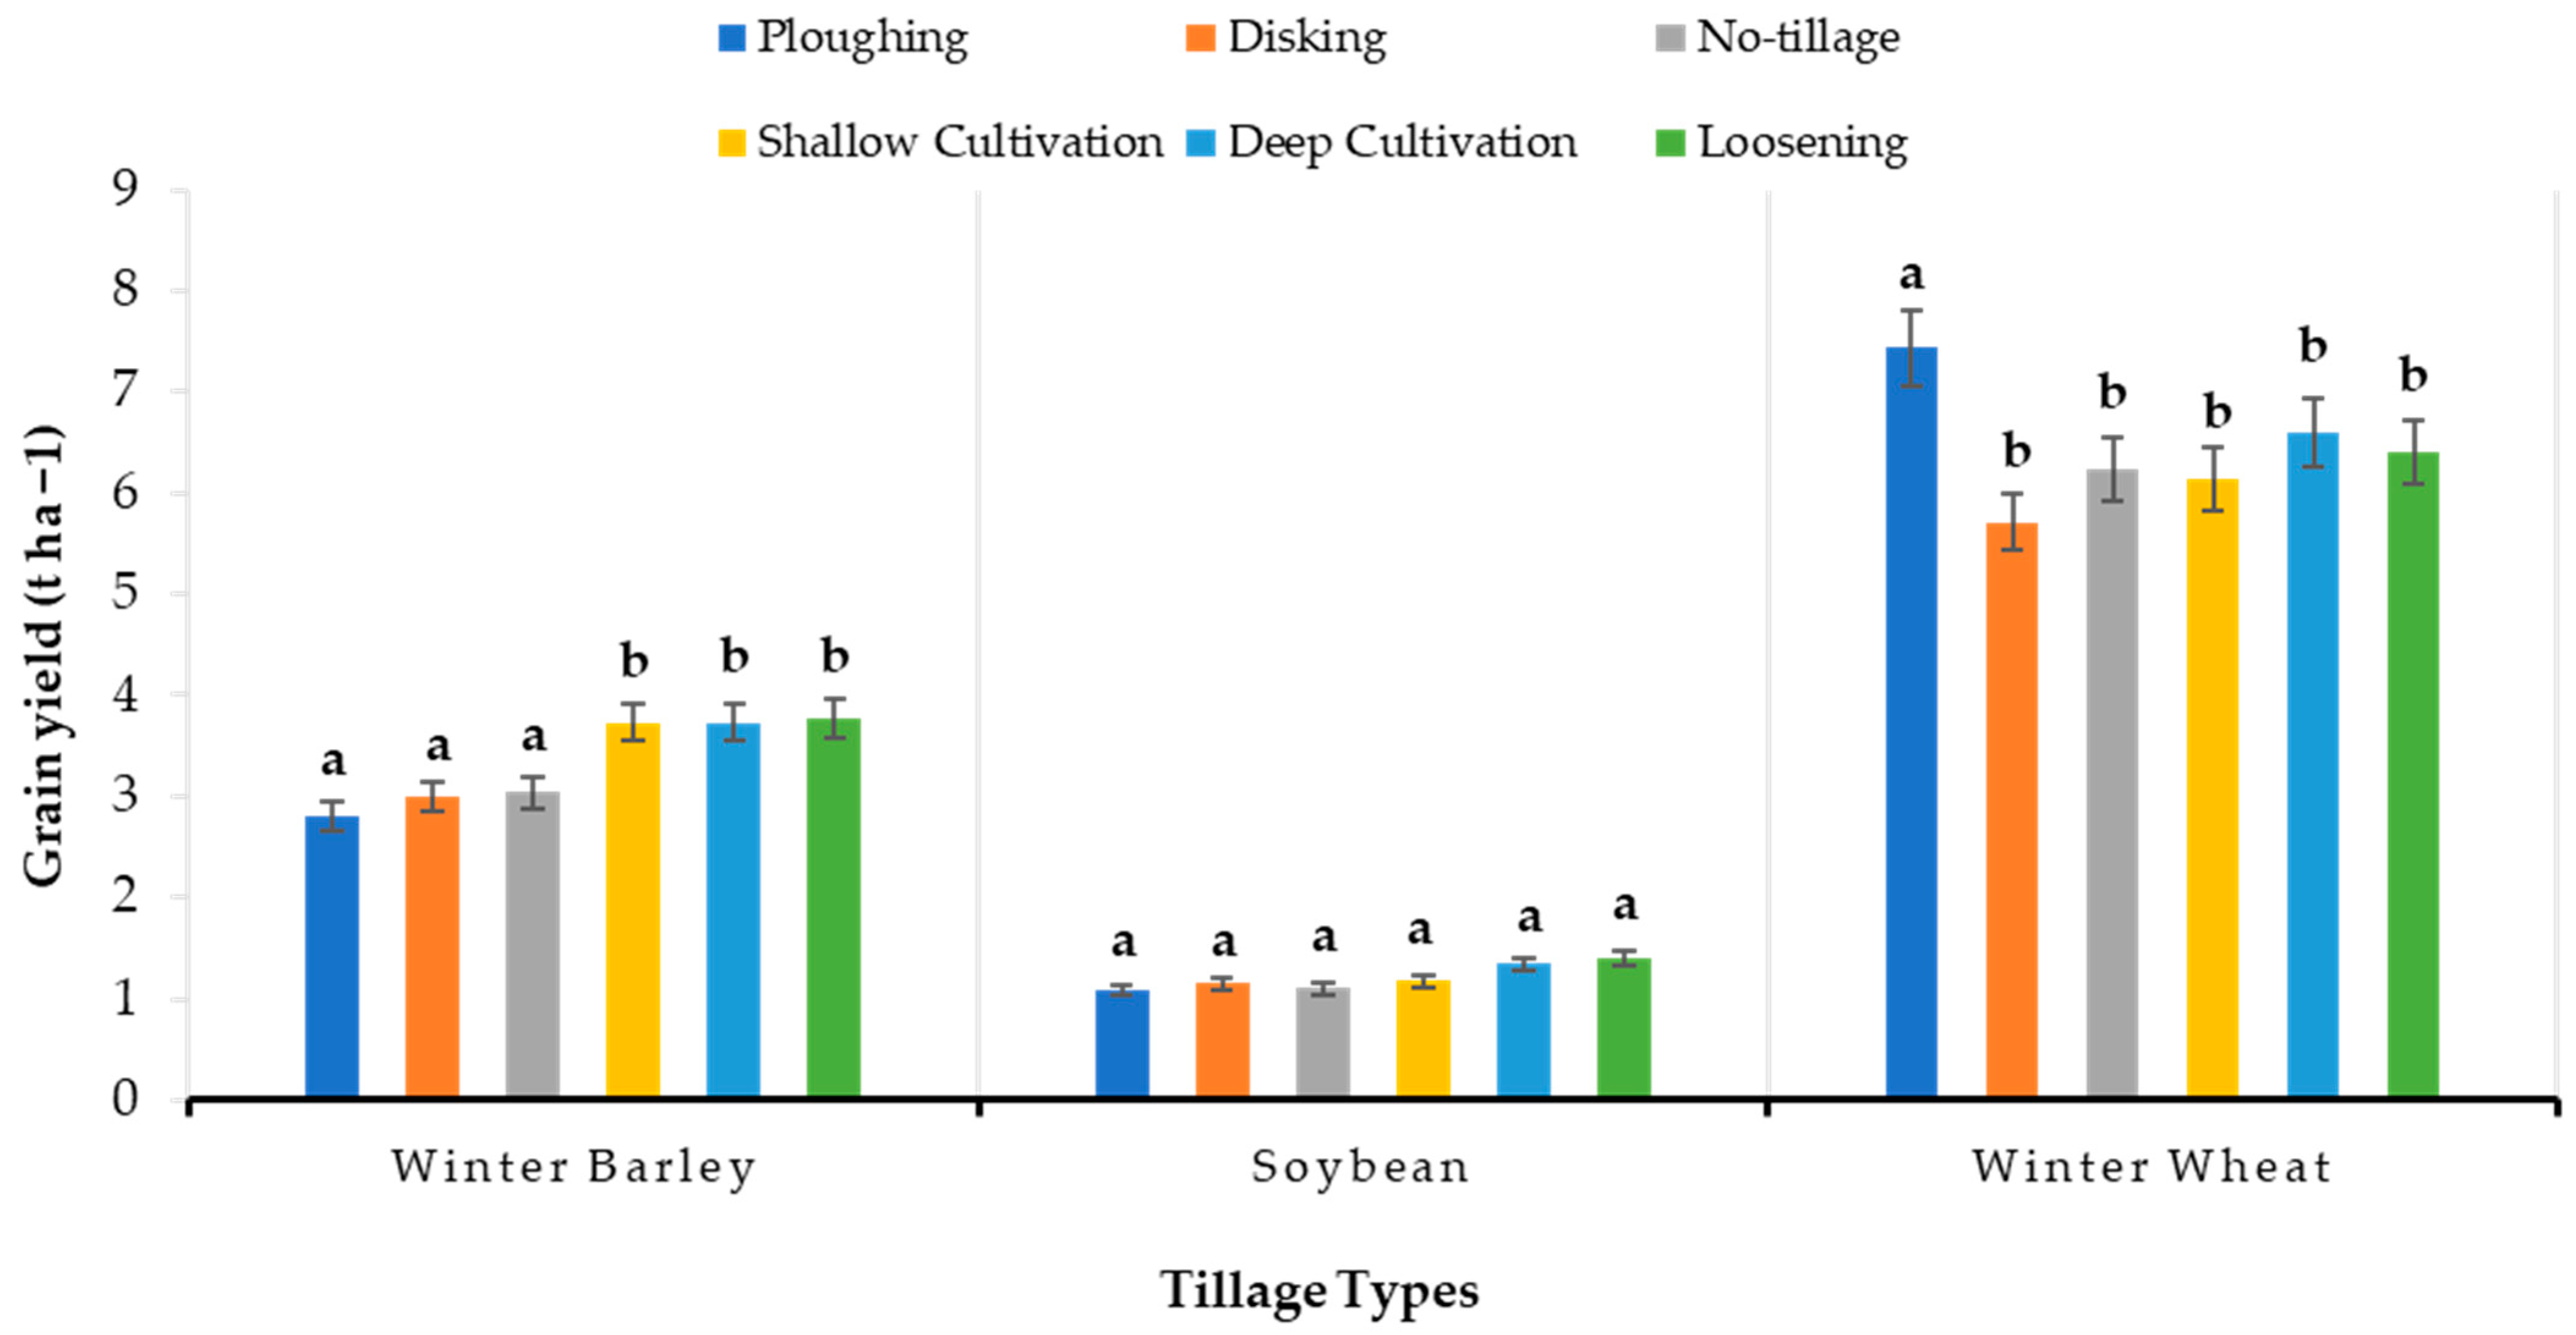
As illustrated in Figure 8, conventional tillage (P) produced the highest grain yield in winter wheat during the 2024 growing season (7.43 t ha−1), while the lowest yield was observed under the D treatment (5.71 t ha−1). During the 2022 growing season, the L treatment resulted in the highest grain yield for winter barley (3.77 t ha−1), while the lowest yield was gained at P (2.80 t ha−1). Despite the absence of statistical differences among tillage treatments for soybean yield in 2023, the L treatment resulted in the highest yield (1.40 t ha−1), while P yielded the lowest (1.09 t ha−1). Overall, across all tillage treatments, winter wheat exhibited the highest grain yield compared to winter barley and soybean.

3.7. Grain Qualities Under Different Soil Tillage Methods

The results indicated that protein content (%), oil content (%), gluten content (%), and Zeleny index (%) differed between tillage treatments in each growing year (Table 6). Analysis of variance presented that tillage significantly affected the protein content (%) of winter barley (F = 10.89, p = <0.001) and soybean (F = 6.60, p = <0.001), as well as the protein content (%) in winter wheat (F = 3.59, p = 0.020). In 2023, the oil content (%) of soybean observed a significant difference between the conventional and conservation tillage methods (F = 2.54, p = 0.037), while the gluten content (%) and Zeleny index (%) were significantly affected by different tillage methods (F = 4.57, p = 0.007 and F = 7.32, p = <0.001) in the season of 2024.
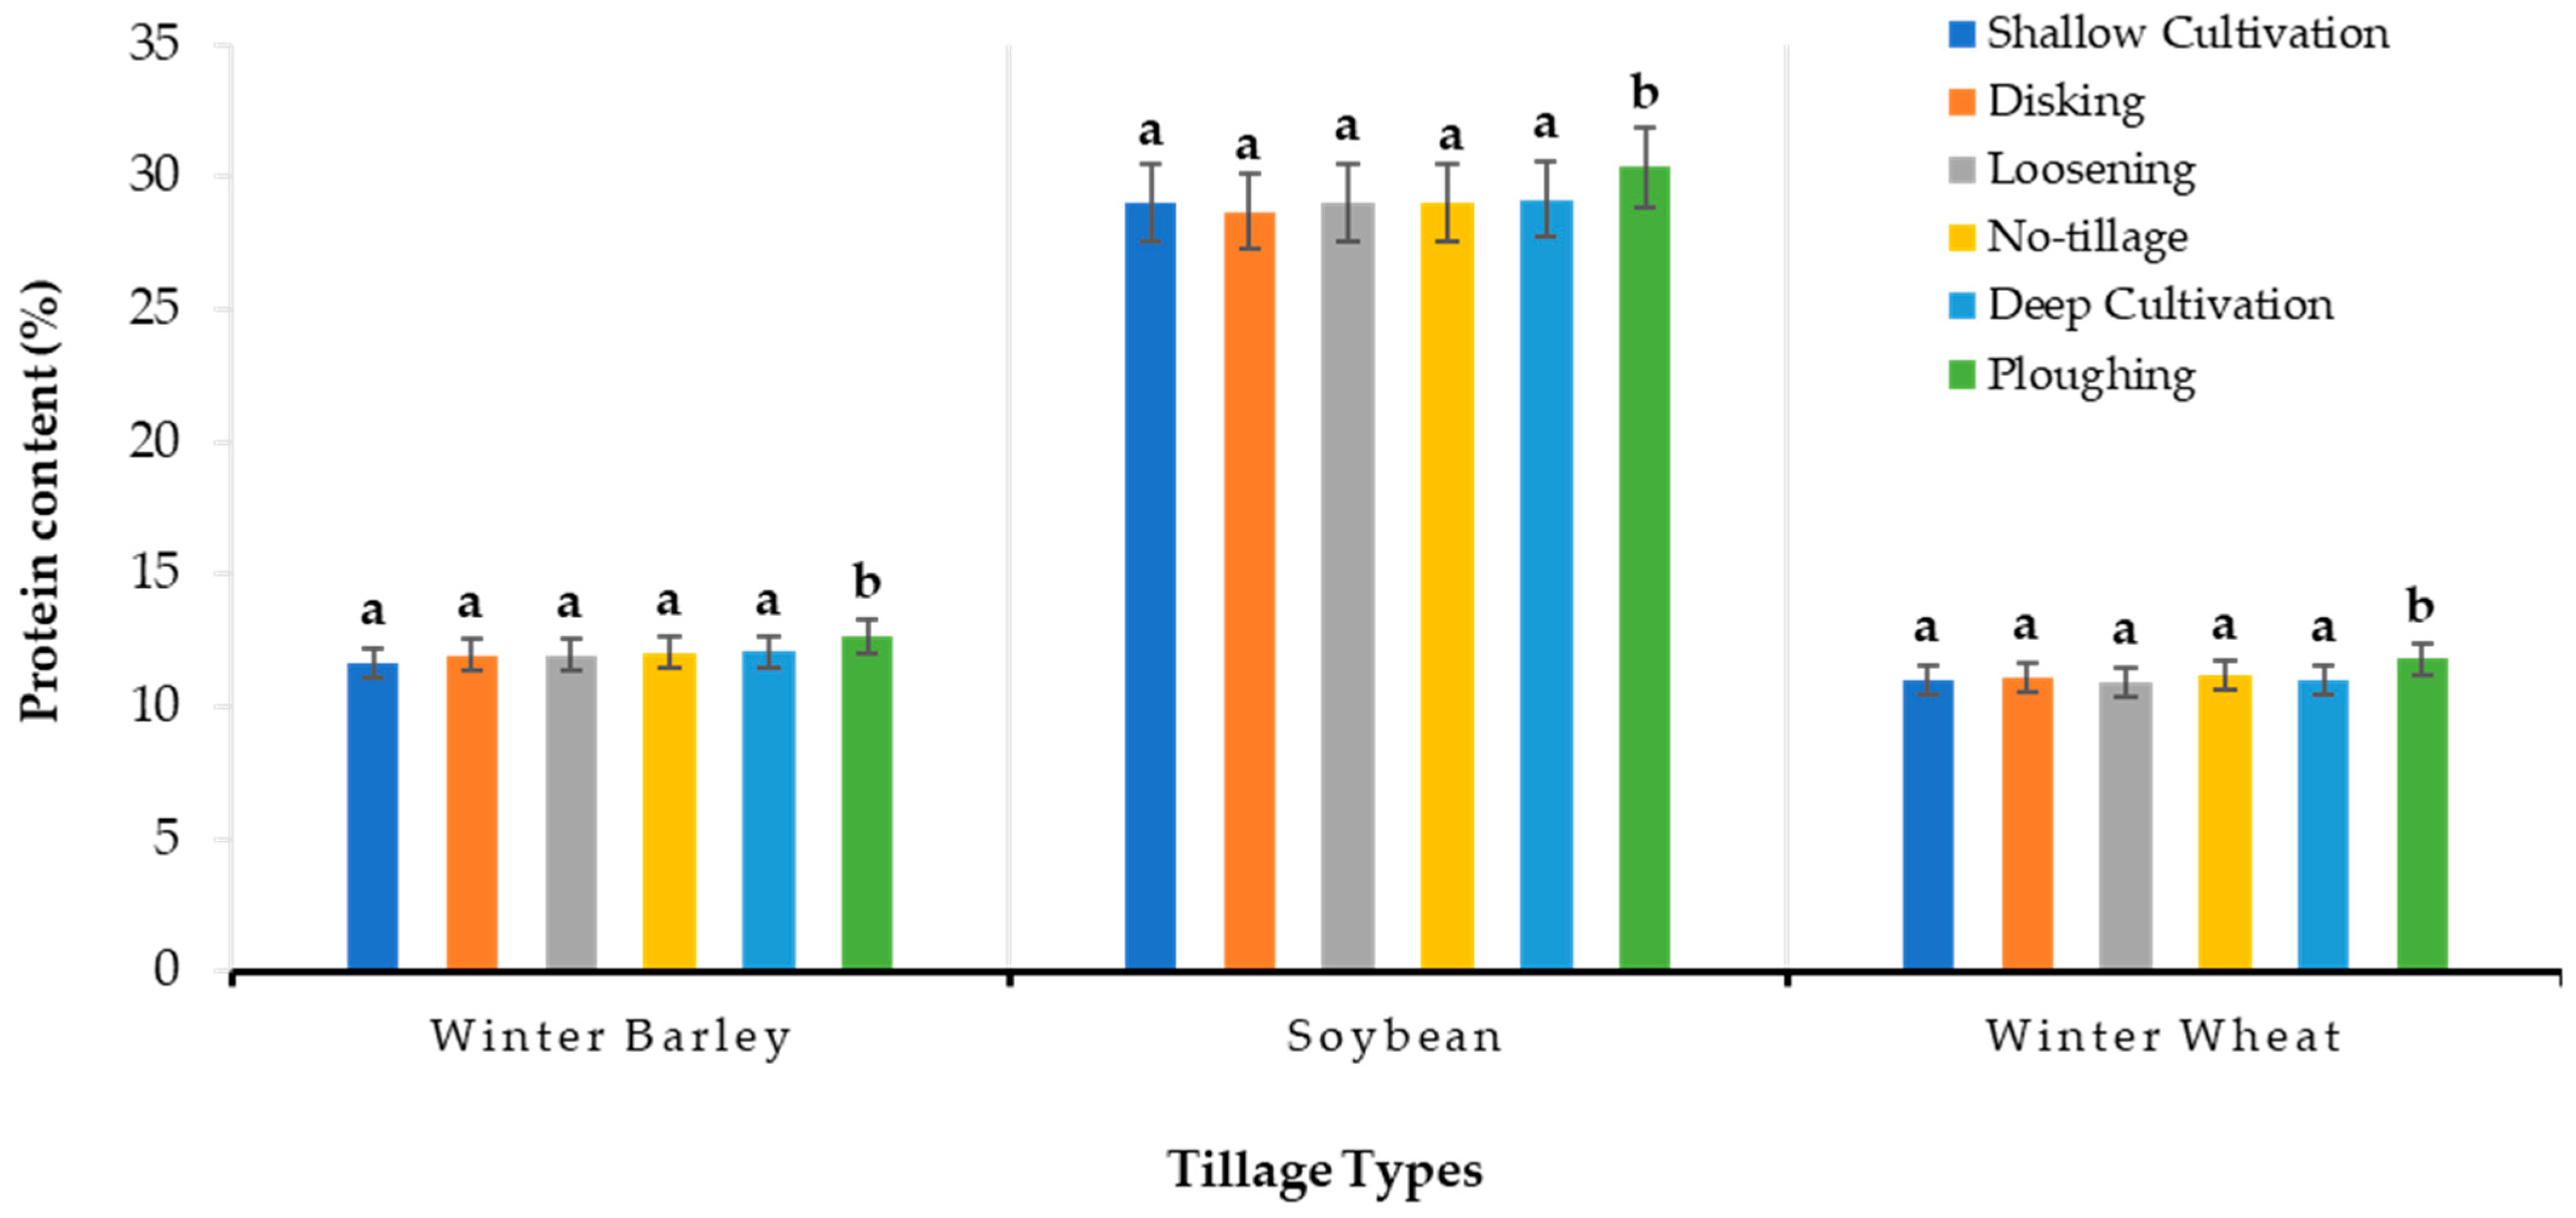
Figure 9 indicates variability in the grain protein content (%) of winter barley, soybean, and winter wheat under six tillage treatments. Among the implemented tillage treatments, P consistently resulted in the highest protein concentration across all three crops during the 2022–2024 period. Conservation tillage practices, including SC, NT, and D, showed no significant differences in protein content (%). P presented the highest protein content in winter barley (12.65%), in soybeans (30.38%), and in winter wheat (11.80%). Conversely, treatment of SC resulted in the lowest protein content (11.65%) in winter barley, while D presented the highest protein content in soybeans (28.68%). L resulted in the lowest protein content (10.95%) in winter wheat.
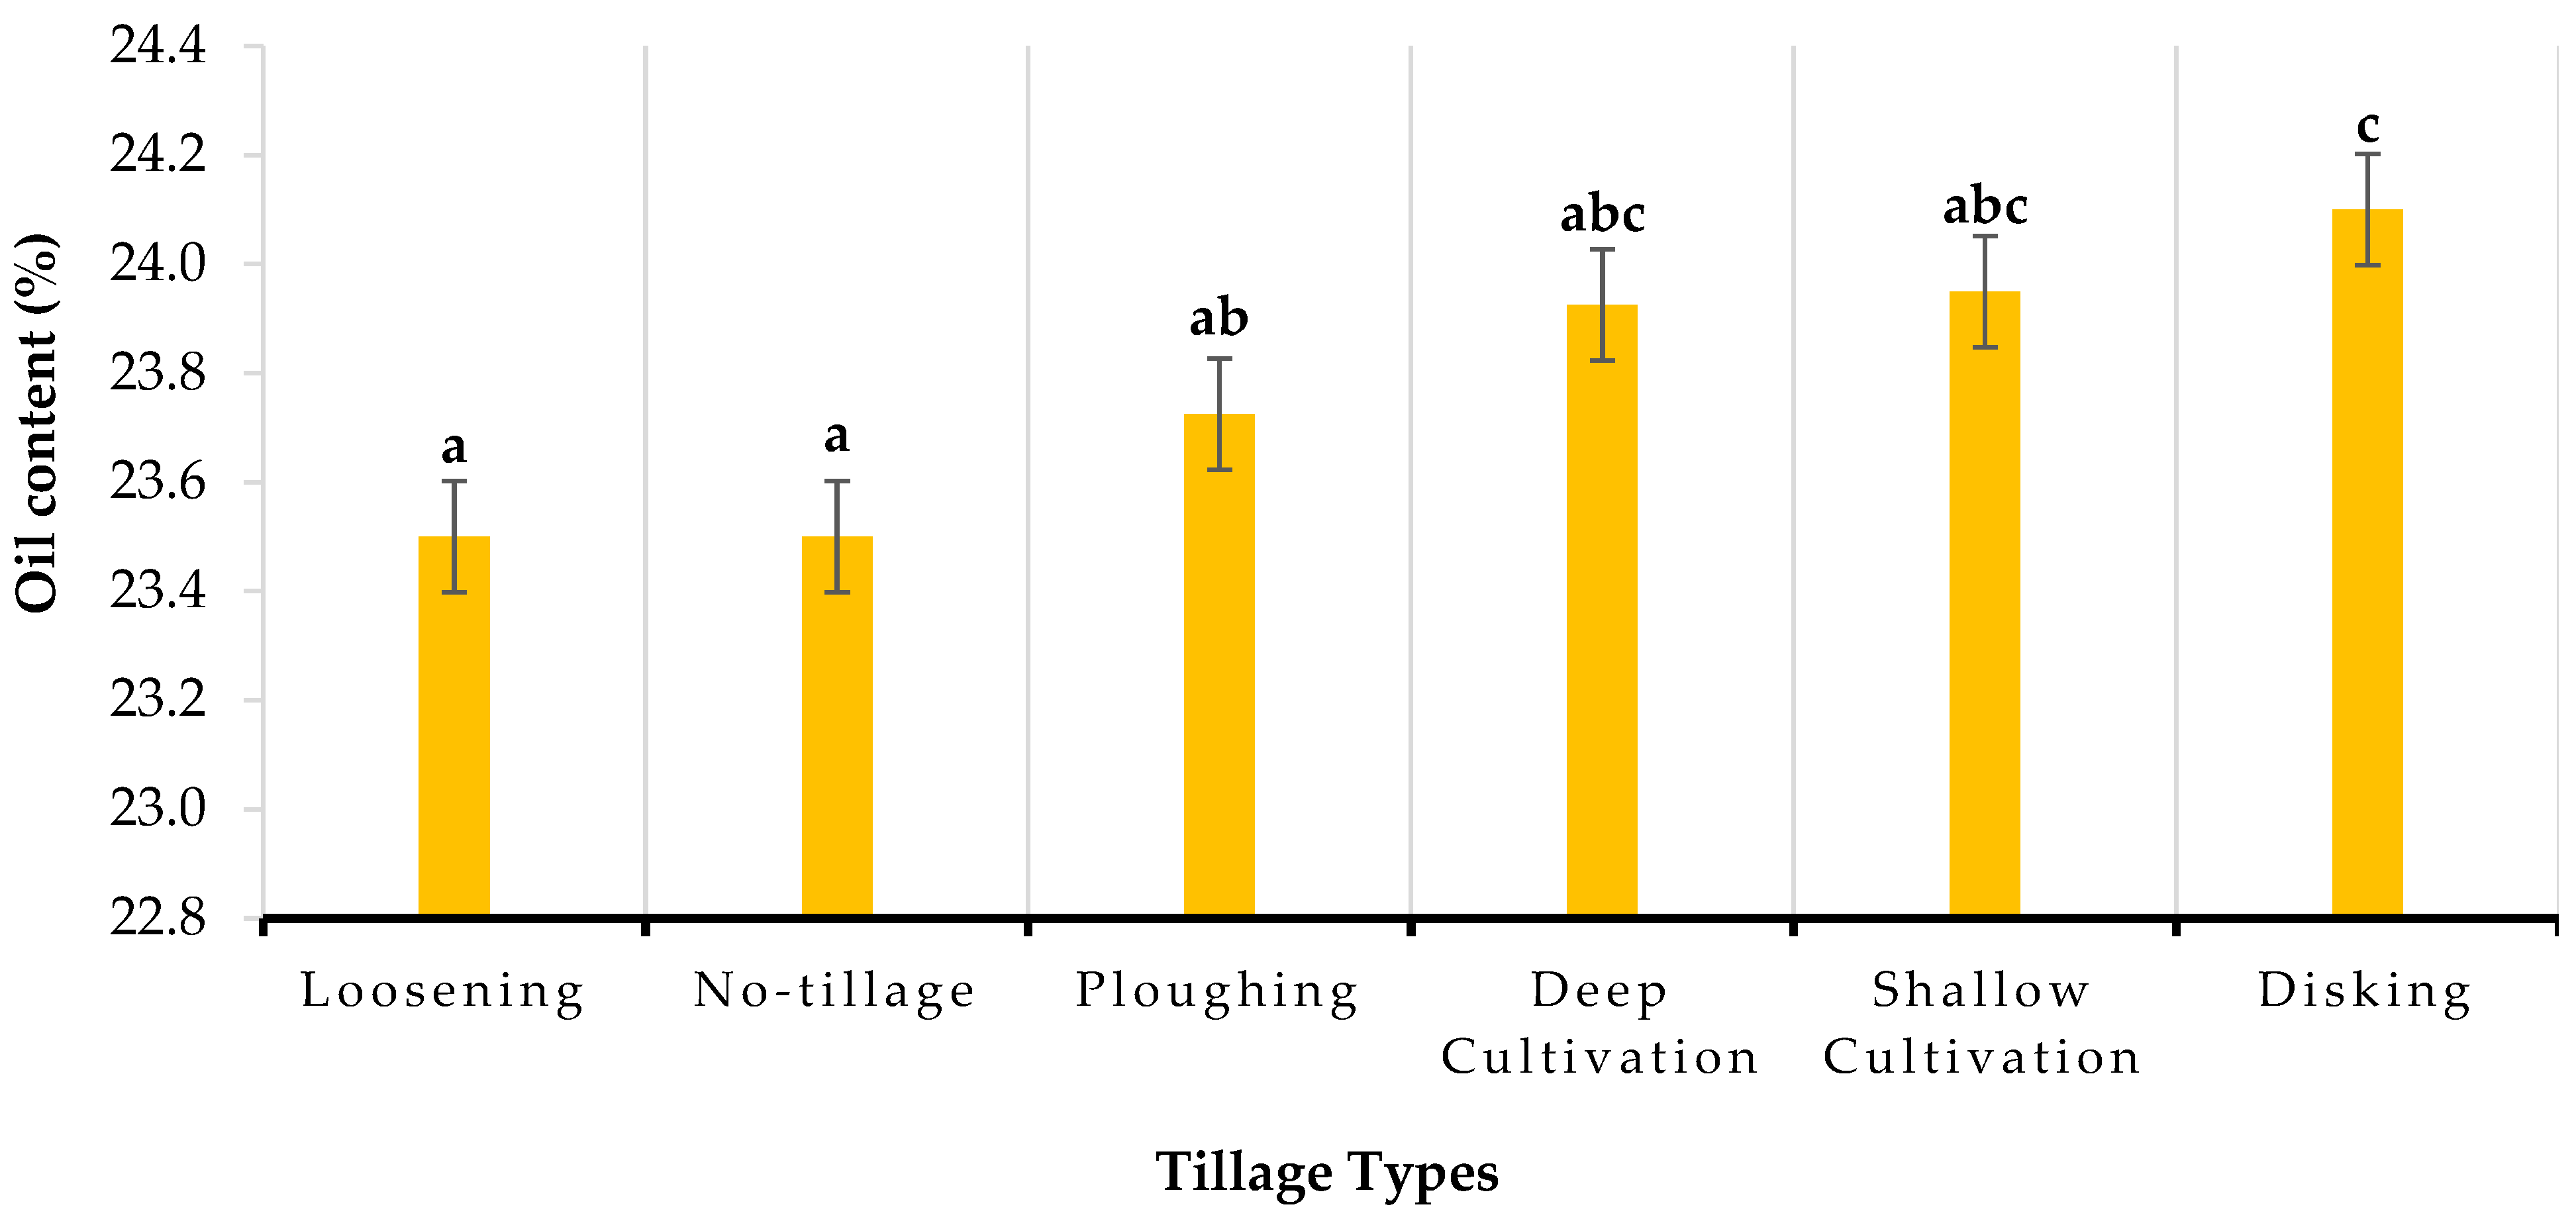
The oil content in soybean seeds was significantly influenced by the type of tillage applied (Figure 10). Among the tillage treatments, D (24.10%) resulted in the highest protein content, which was significantly different from loosening (23.50%) and NT (23.50%), as both tillage methods presented the lowest oil content values in 2023. P (23.73%), DC (23.93%), and SC (23.95%) resulted in intermediate oil content values, which did not differ significantly from one another but were higher than those observed under NT (23.50%) and L (23.50%).
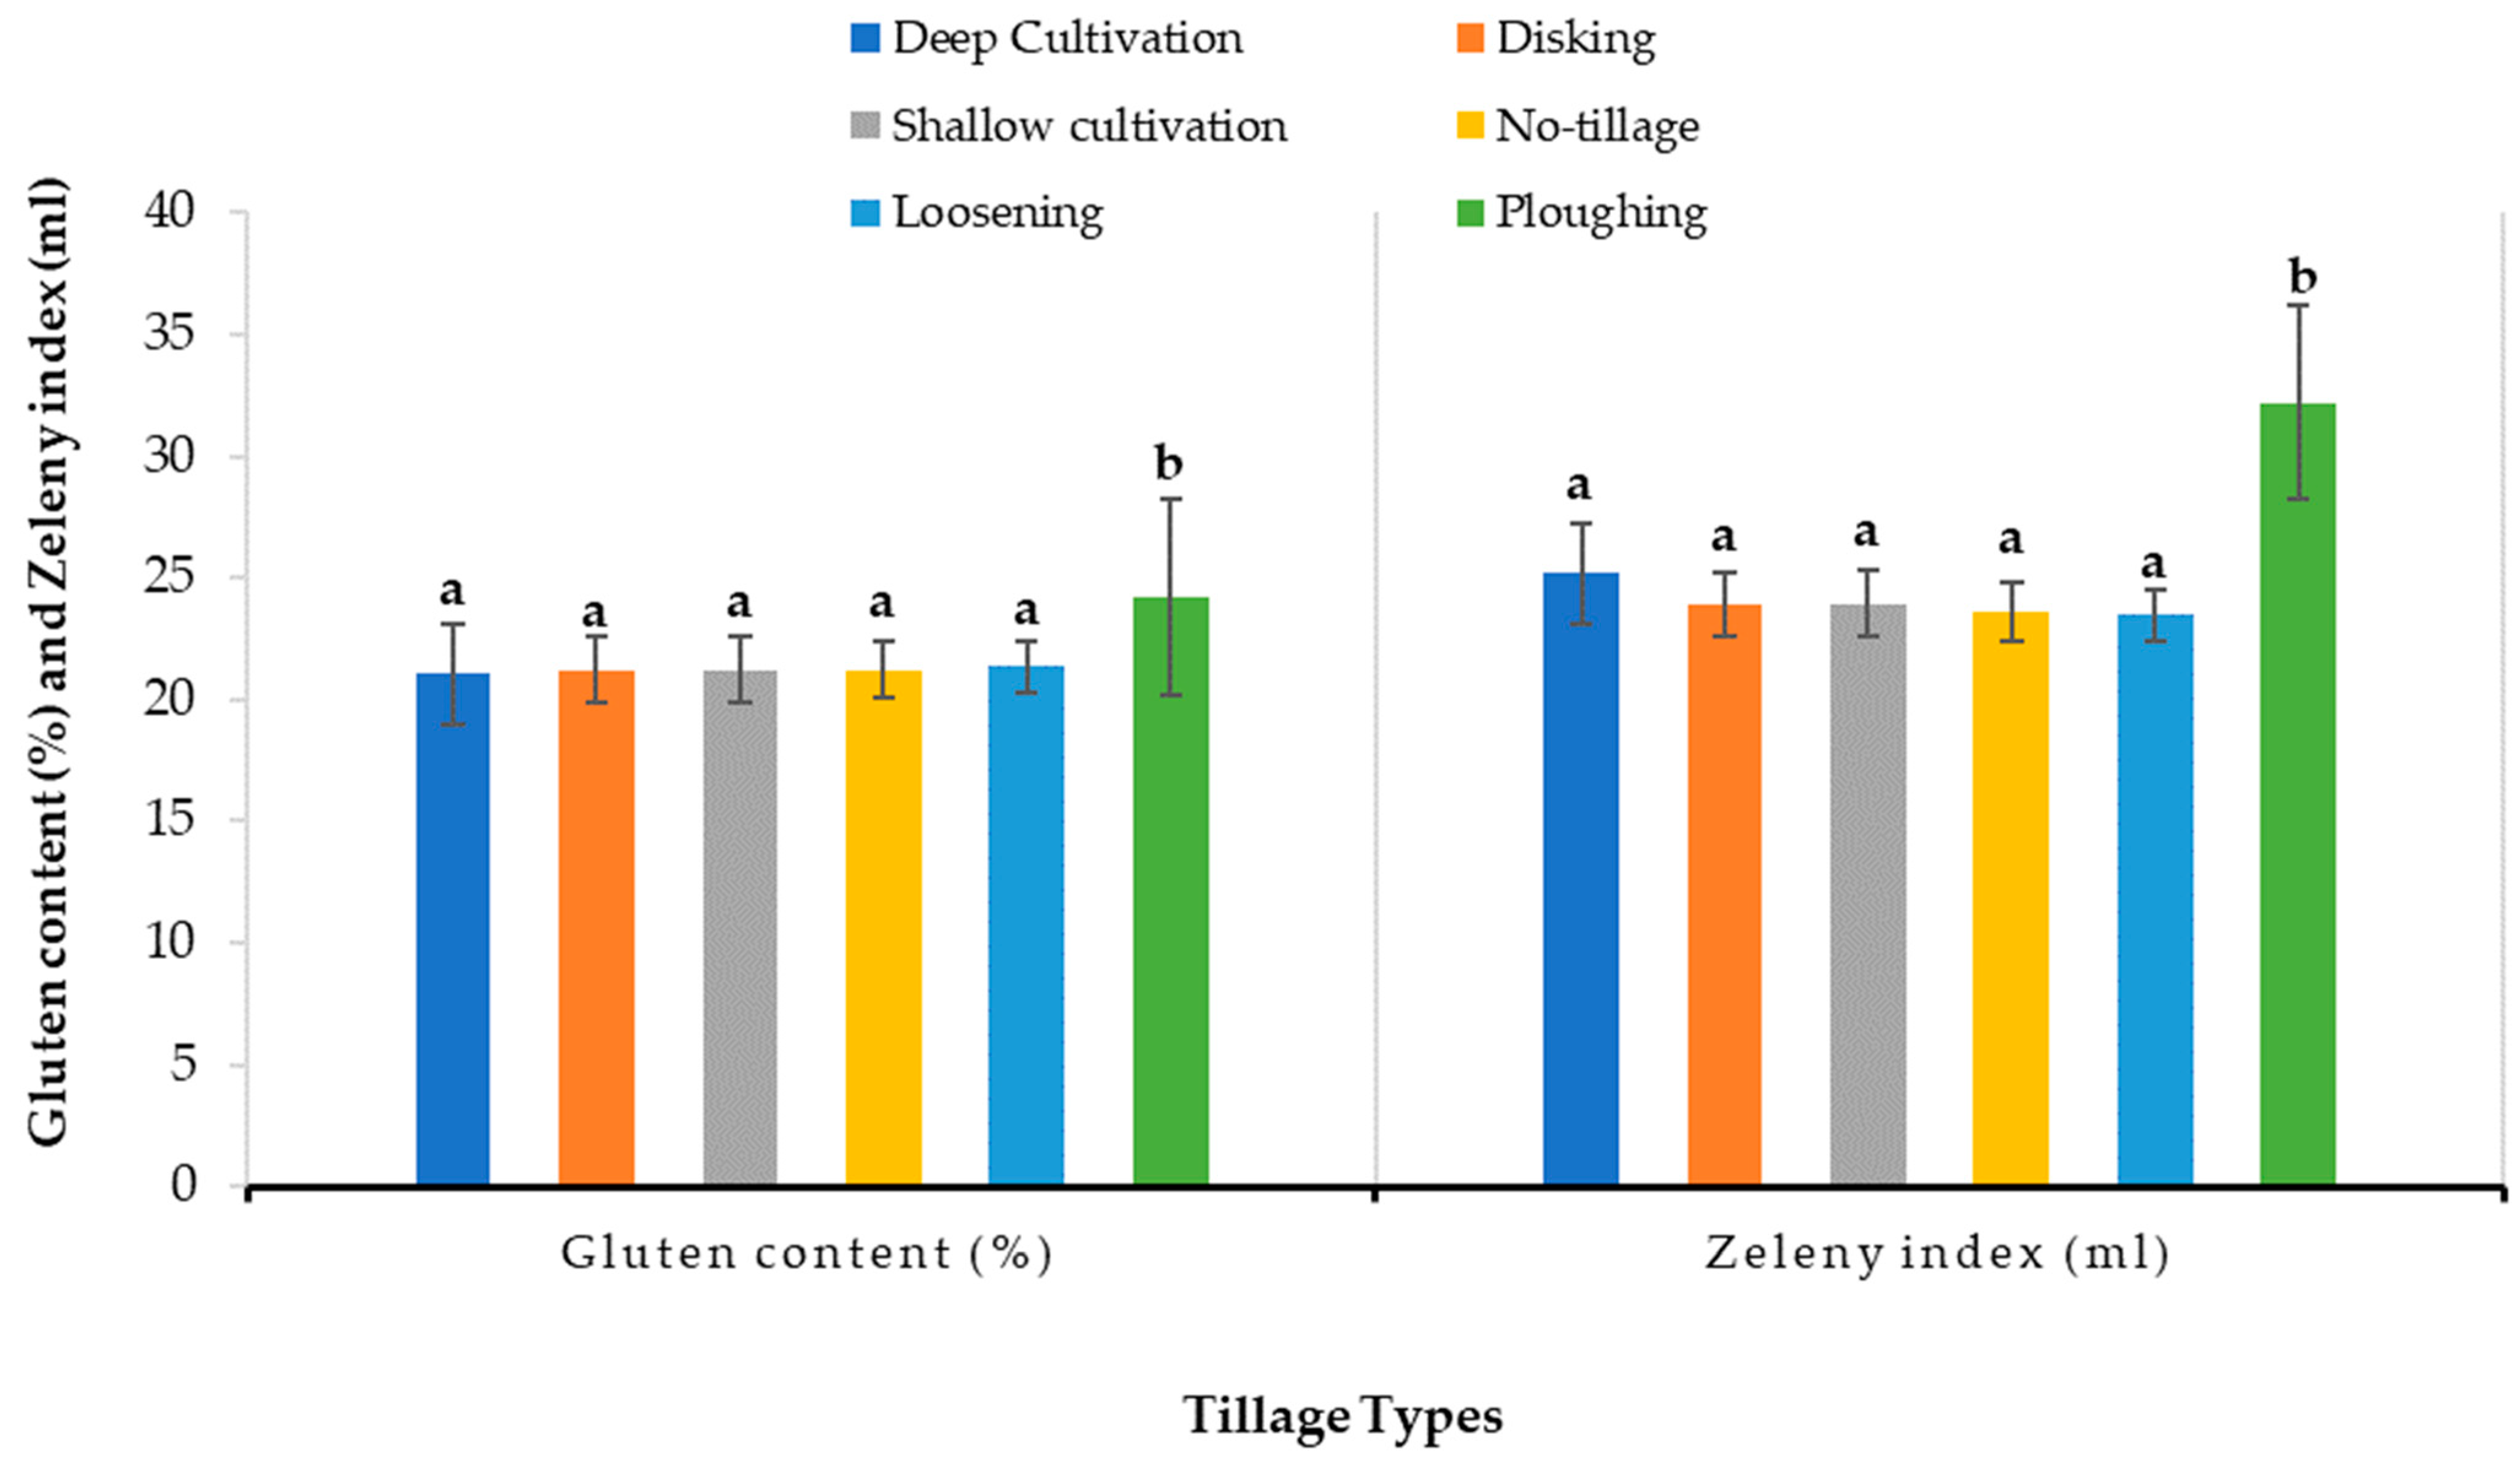
Similarly to protein content, the highest significant values for both gluten content and Zeleny index were also observed under P. For instance, except for P, all conservation tillage treatments, SC, NT, DC, D, and L, resulted in no significant correlations (p < 0.05) for gluten content or Zeleny index in winter wheat (marked with letter a, respectively). The analysis of statistical variance (ANOVA) revealed that treatment P had a significant effect on gluten content (24.18%) and Zeleny index (32.20) in the 2024 season (Figure 11). Conversely, among the tillage treatments used in the study area in 2024, DC presented the lowest gluten content (21.08%), while treatment L presented the lowest Zeleny index (23.48 mL).

4. Discussion

4.1. Influence of Year Effect and Crops on Soil Carbon Dioxide (CO2) Emissions

Soil carbon dioxide (CO2) emissions are a crucial element of agroecosystem carbon cycling that are shaped by environmental interactions within and beyond the soil, yielding substantial responses to varying conditions. The assessment of the seasons facilitated the acquisition of new insights, as the temporal variability in soil CO2 flux observed during the 2022–2024 growing seasons underscores the dynamic correlation between climatic conditions, vegetation, and soil biological activity [47]. The data indicate significant differences in CO2 emissions among years and months, demonstrating the responsiveness of soil respiration to seasonal effects and climatic variability during the years (Figure 4). This finding aligns with the literature, which presents numerous studies indicating that soil CO2 flux exhibits higher values during warmer periods due to enhanced root and microbial activity, influenced by soil temperature and moisture availability [48,49,50].
In this study, the highest CO2 emissions were recorded in late spring and early summer of 2024, particularly in May and June, with fluxes reaching values of 0.68 g m−2 h−1 and 0.64 g m−2 h−1. This increase may correlate with optimal soil moisture level, which is known to enhance microbial activity and root respiration in soil [51,52,53]. In comparison to 2022 and 2023, the persistently elevated CO2 emissions in 2024 indicate that interannual variability, likely associated with variations in precipitation, temperature, and crop growth phases, significantly influenced soil respiration [54,55]. Notwithstanding the heightened CO2 emissions in 2024, a significant decline in soil carbon dioxide flux was observed in August (0.24 g m−2 h−1); the results were significantly lower (p < 0.05) than those in the same months of the 2022 and 2023 years, considering the temperature extremes realized in 2024 [56,57]. This anomaly could be related to mid-summer soil drying caused by the extended drought period or the senescence of the crop canopy, both of which can reduce root and microbial respiration in the soil and have a significant impact on CO2 emissions.
In 2024, anomalously warm spring and summer air temperatures likely raised soil thermal regimes by 2–3 °C compared to the preceding two years, thereby enhancing both bacterial and fungal activity in the rhizosphere and bulk soil. This thermal stimulation would have accelerated the decomposition of labile carbon substrates—particularly fresh root exudates and surface residues—resulting in positive feedback on soil CO2 emission. Moreover, warmer soils often exhibit increased moisture variability, which can further interact with temperature to modulate microbial community composition and respiration rates. Taken together, these processes suggest that the elevated growing season CO2 flux observed in 2024 was driven, at least in part, by temperature-induced increases in soil microbiological activity.
The exponential increase in soil CO2 flux observed from March to August in 2023, although not statistically significant, may reflect the potential accumulation of biomass and progressive rhizosphere microbial activity under soybeans [58,59]. These findings align with a broader understanding that elevated temperatures typically increase soil respiration rates; however, the potential response is often limited by soil moisture availability and the stages of crop growth [60].

4.2. Effect of Different Soil Tillage Methods on Soil Carbon Dioxide (CO2) Emissions

Aligning with other factors, soil tillage methods have a significant impact on soil CO2 flux [61]. The significance of meticulously chosen land use management is increasingly acknowledged to mitigate the overall world carbon dioxide emissions generated by agriculture and soil cultivation. Our analysis revealed that variations in soil CO2 emissions across tillage treatments during the three observed growing seasons underscore the impact of soil management strategies on carbon fluxes in agricultural systems. The significant variation observed in emissions among tillage treatments and years highlights interactions between soil disturbance, crop vegetation, and the changes in climatic conditions (Figure 5).
Our results indicate that L consistently presented the highest CO2 flux in both 2022 and 2024, which is attributable to increased soil disturbance and aggregate disruption, which enhances the microbial decomposition of organic matter in the soil [62]. The elevated CO2 emissions observed in L in 2024 indicate that this soil tillage approach may enhance soil microbial activity more significantly [63] than other conventional (P) or conservational (D, SC, DC) tillage methods, which revealed lower soil flux (Figure 5). In comparison, deep cultivation had the most significant CO2 emissions in 2023. This finding aligns with prior findings [64,65], since cultivation technique moderates the soil disturbance that can enhance the microbial decomposition of surface and subsurface plant residues [66,67]. No significant differences were detected among the tillage treatments in 2023, indicating that various environmental conditions may have influenced microbial activity and root respiration, thereby reducing the expression of tillage-induced variability [68,69,70].
No-tillage is a conservation tillage method characterized by little soil disturbance and decreased CO2 emissions [71]. A similar finding was observed in our 2023 experiment, where NT resulted in the lowest CO2 flux (0.22 g m−2 h−1) (Figure 4). No-tillage exhibited significantly increased soil respiration in 2024 (0.42 g m−2 h−1) vs. conventional and alternative conservation tillage methods (Figure 5). This anomaly may reflect the long-term accumulation of plant residues on the surface, creating a microenvironmentally favorable condition for microbial decomposition, especially under optimal precipitation and other climatic factors [72]. This finding disagrees with Buragiené et al. [73], who noted significant differences in CO2 emissions, with NT resulting in the lowest emissions [74,75,76]. However, others found that NT often increases the soil CO2 emissions, respectively [77], which can be attributed to higher SOM of the topsoil [78]. The demonstrated lowest emissions for each season (P in 2022, NT in 2023, and D in 2024) underscore that no single tillage method can consistently minimize the soil CO2 flux under all conditions [77]. These findings were confirmed by the Hungarian [79,80] and international researches [81,82,83], highlighting the complexity of tillage’s impacts on soil CO2 emissions.

4.3. Effects of Soil Tillage on Soil Chemical Properties

The results suggest that reduced or minimum tillage methods, such as D and NT, improve nutrient levels and SOM compared to conventional tillage (P). The topsoil under D resulted in up to 3.76 g kg−1 SOM and 8.37 mg kg−1 of KCl-extractable nitrite + nitrate nitrogen, whereas P yielded 2.93 g kg−1 SOM and 2.64 mg kg−1 values in the same layer. These results align with recent findings by [84,85], who reported that conservation tillage practices can increase surface organic matter.
The observed increase in pH (KCl) with depth, from 4.53 in the topsoil to 5.39 at 30–40 cm under D, illustrates the moderating effect of deeper soil layers on root distribution and nutrient mobility. Such trends are consistent with the results of [86], who found that reduced tillage contributes to more layered nutrient and pH profiles, enhancing topsoil fertility.

4.4. Effects of Soil Tillage on Leaf Area Index of Winter Barley–Soybean–Winter Wheat Crop Rotation

The LAI index defines the surface area available on a crop for intercepting photosynthetically active radiation (PAR), which directly influences the efficiency of the photosynthetic process [87], and shows the plant nutritional status, which is influenced by soil moisture content, as well as soil tillage practices [88]. The LAI values did not differ between soil tillage treatments within the growing seasons of 2022 and 2023 (Table 3). However, the changes in LAI measured in the field showed significant differences in 2024 (F = 8.66, p < 0.001), indicating a strong influence of soil management practices on canopy development under the environmental conditions of the year [89]. Regarding the significant increase in LAI (Figure 6) under conventional tillage P (3.03) and conservation tillage type DC (2.97) in 2024, it was outlined that these tillage practices may enhance early-season root development and nutrient uptake by improving soil structure and reducing soil compaction [90]. However, not only a well-developed root system but also prior ploughing accelerated the mineralization of soil organic matter, providing an additional pool of nitrogen for plants, which allows them to develop better and build greater biomass, which affects LAI. Such differences were found by Różewicz et al. [91] when they ploughed before strip tillage. LAI was higher in wheat than when using stubble disking or only the strip-till technique. In contrast, the lowest LAI values in 2024 were associated with D (2.12) and NT (1.95). These results may be related to diminished seedbed preparation and quality, resulting in delayed crop emergence [92,93]. In short-term experiments [94,95,96], the advantages of conservation tillage techniques, particularly NT, may be underemphasized due to limited changes in soil structure and microbial dynamics. However, long-term experiments [97,98,99] have demonstrated that the improvement of soil properties under NT often requires several years to become agronomically apparent under variable climatic conditions [100]. These findings are common challenges in conservation crop production systems [87].
The long-term NT combined with cover crops further improved soil physical properties [101]. Combining NT and cover crops can be widely used for more sustainable arable cropping [102]. The absence of significant differences in LAI values among the same tillage treatments in 2022 and 2023 pointed out that the suboptimal environmental factors, like extreme rainfall or high temperatures, may have overridden the direct and indirect influence of soil tillage on canopy expansion. Upon reviewing the relevant literature, our results align with other research indicating that the agronomic benefits of tillage are suppressed under adverse environmental conditions [103], whereas in dry years, abiotic stressors dominate in plant growth responses, declining tillage-induced effects [104].

4.5. Effects of Soil Tillage on Leaf Chlorophyll Content of Winter Barley–Soybean–Winter Wheat Crop Rotation

The effects of conventional and conservation tillage on SPAD content have been emphasized by worldwide studies [105,106] and Hungarian research [20,107]. Our findings partially align with these studies. Considering all measurements of the effects of tillage treatments on SPAD values, we observed that soil tillage methods had a limited impact on SPAD values during the 2022–2024 period of the experiment (Table 4). The greatest SPAD value was recorded in the case of the D treatment (46.50), which was statistically different from the other tillage treatments examined (p < 0.05) (Figure 7). Out of them, the lowest SPAD index in 2022 was realized under L (38.77), which was followed by DC (38.02) in 2023. D tillage type showed the lowest SPAD value (37.65) in winter wheat in 2024; however, it reached the highest SPAD values, with a significant difference, in 2023 under soybeans. This could be attributed to moderate soil moisture retention, which is known to support chlorophyll synthesis during the early vegetative stages of crop systems [108,109].
Climatic conditions can have a significant influence on the changes in SPAD values in and across years [110]. This finding disagrees with Janusauskaite et al. [105], who underscored that they found the most favorable conditions for the crop’s photosynthetic processes under the P treatment. Compared to this, other researchers found that NT resulted in higher SPAD values compared to reduced or conservation tillage methods [111,112]. SPAD values are influenced by soil nitrogen availability, which can vary significantly due to factors such as tillage-related changes in soil microbial activity [113,114]. Consequently, the time of the leaf sample may significantly influence the accurate monitoring of SPAD [115].

4.6. Effects of Tillage Treatments on Grain Yield

The techniques of soil tillage may profoundly impact the development and composition of yield and its components, hence affecting the ultimate grain yield [116]. The interaction between soil tillage and yields of winter barley, soybean, and winter wheat is presented in t ha−1 at a 12.50% grain moisture content (Table 5). The grain yield was strongly influenced by the tillage strategy used and the year of study. This significant yield response to soil tillage practices in cereal crops and soybean cropping systems suggests that improved soil structure and moisture retention under specific tillage systems can enhance plant growth and grain filling under varying climatic conditions [117].
The highest grain yield in winter barley in 2022 was recorded in treatment L, 3.77 t ha−1 (Figure 8). This finding did not reveal a significant difference compared to other conservation tillage methods, including DC (3.73 t ha−1) and SC (3.73 t ha−1). Research [118] confirms an increase in the yield of winter barley grain under conservation tillage methods. This may be attributed to an enhanced soil structure and greater moisture retention, which is frequently linked to balanced soil microbial activity [119]. Concisely, this interaction supports root development, as well as nutrient uptake from the early growth stages [120]. However, the research of [121] contrasts with previous studies, which report that conservation tillage can improve yield levels compared to conventional tillage systems under different climatic and soil conditions in Europe. The lowest yield in winter barley was observed in P (2.80 t ha−1) and D (2.99 t ha−1). Comparable studies have shown that conventional tillage techniques lead to decreased grain yields [122]. However, Woźniak [123], who found the adverse effects of conservation tillage methods on the yield of winter barley [124], also found that conventional tillage practices, P in variations, increased crop development and resulted in higher yields for winter barley.
A similar finding was observed in the field experiment conducted in winter 2024 (Figure 8). The highest grain yield in winter wheat was obtained through ploughing (7.43 t ha−1), which aligns with the assessment by [37,125]. They reported that the conventional tillage method, P, observed higher grain yield in winter wheat compared to NT. The same results were reported by [25,126], who found that P improved winter wheat grain yield. The statistical difference between conventional (P) and conservation tillage methods, including L, DC, SC, D, and NT, may be attributed to the better root zone development provided by P, which in turn improves water and nutrient uptake efficiency, leading to higher yield performance [127]. The lowest yield in winter wheat was observed in D, with a value of 5.71 t ha−1. This may suggest that D, as a relatively shallow cultivation method, may not sufficiently influence soil compaction or soil structure, potentially restricting better root development [122]. Ref. [128] revealed research in which constant D was the most suitable tillage method for the expression of the production potential of winter wheat [129]. Moreover, ref. [121] highlighted that involving leguminous crops before winter wheat in the cropping system positively affects the yield of cereals.
In soybeans, the differences among the soil tillage treatments were not significant in 2023 (Figure 8). This indicates that the disparities in grain output across the tillage treatments were less pronounced than those reported in the winter barley yield in 2022 (Table 5). This may be attributable to the irrigation-free farming strategy, or this rotation may have shown greater resilience to variation in soil structure [130]. The absence of statistical differences in yield in 2023 may reflect that less favorable environmental conditions can decrease the significant effects of soil tillage on crop performance [130]. The greatest yield in soybeans was achieved with the L treatment (1.40 t ha−1), while the lowest yield was recorded with P (1.09 t ha−1). This finding does not show significant differences between the groups; the minor (non-significant) contrast between the two different tillage systems reflects a significant impact on grain yield. Similar findings were reported by [131,132]. Despite the significant differences in plant performance, the results were non-significant between L and P. Ref. [133] found that L improved soybean grain yield contrary to P in the Corn Belt of the USA.

4.7. Effects of Tillage Treatments on Grain Quality

The significant correlations between grain quality and soil tillage influenced by environmental conditions are shown in Table 6. Our investigation revealed that soil tillage significantly affected grain quality in winter barley, soybeans, and winter wheat, specifically in terms of protein, oil, gluten content, and Zeleny index (Figure 9, Figure 10 and Figure 11). The conventional P method consistently showed the highest grain protein levels across all three crops (Figure 9), aligned with the observation by Amato et al. [134], who reported that tillage intensity positively correlates with winter wheat grain protein content due to enhanced nitrogen mineralization. Pearsons et al. [135] stated that levels of protein in winter wheat were higher in a conventional tillage system, compared to reduced tillage methods. Chet et al. [136] found that soil tillage does not affect the quality parameters in soybeans; however, they noted that higher protein content values were recorded with a reduced tillage system. The maximum protein content in soybeans was achieved in the NT regime [137]. The minimum grain protein concentration in winter barley was observed in DC (11.65%), in D for soybean (28.68%), and in L for winter wheat (10.95%). These findings may be attributed to changes in environmental conditions, as recent studies [123,138,139] have suggested that grain quality parameters, such as protein content in winter barley, are more influenced by environmental factors than by tillage systems [140].
Concerning oil content in soybeans in 2023 (Figure 10), the significantly higher value under disking, 24.10%, may reflect a combination of reduced soil disturbance and residue incorporation [141], promoting lipid metabolism pathways in soybeans. This finding was significantly different from loosening, 23.50%, and no-tillage, 23.50%, since both tillage methods presented the lowest oil content values in 2023. Research results indicated a favorable association between conservation tillage practices and soybean oil content [132], emphasizing that techniques of decreased soil disturbance have a similar connection with soybean oil content.
As shown in Figure 11, for winter wheat studied in 2024, both gluten content and Zeleny index showed the highest values in ploughing, 24.18% and 32.20 mL [142]; enhanced gluten and Zeleny sedimentation values were also documented under the conventional tillage method, which may contribute to better soil–root interactions and nutrient availability in soil [143]. These results align with evidence from long-term field research indicating that conservation tillage enhances soil structure and SOM levels [144]. There were no significant differences between soil tillage treatments, gluten content, and the Zeleny index in other research [145]. Although, ref. [146] called attention to the adverse effect of climatic conditions, as he experienced higher values in gluten content and Zeleny index due to higher rainfall. Ref. [147] investigated the impact of climatic variables on grain constituents, specifically gluten content and the Zeleny index [148].

5. Conclusions

This research evaluated the effects of various soil tillage methods on crop performance and soil processes in a cereal–legume rotation. Soil respiration (CO2 flow) was significantly affected by soil moisture and temperature, exhibiting increased emissions in late spring and early summer. Winter wheat production in the crop rotation exhibited elevated CO2 flow, maybe associated with lingering impacts from preceding soybean production. However, the extremity of the 2024 summer markedly curtailed emissions, highlighting the vulnerability of soil biological processes to climate stressors.
Tillage practices affected crop canopy development (Leaf Area Index), where ploughing and cultivation promoted vegetative development rate, presumably via greater root development and nutrient adsorption. SPAD data exhibited a minor change across tillage methods, while disking in some cases enhanced SPAD, suggesting a complex interplay between tillage methods, soil properties, and climatic conditions.
Conservation tillage (loosening, cultivation) improved winter barley production; however, ploughing augmented the plant development and the quality of winter wheat. Soybean production was mainly unaffected by the tillage technique; however, oil content reached its peak with disking, indicating a benefit of reduced soil disturbance.
Overall, this extensive research highlights the complex and context-dependent effects of tillage on soil carbon dynamics, plant physiology, and agricultural productivity. However, it is important to note that our study has limitations that are inherent to site-specific conditions, temporal climatic variability, and the scale of the experimental setup, which may affect the broader applicability of the results. Further multi-site and multi-year studies are recommended to validate and expand upon these findings.

Author Contributions

Conceptualization, B.S. and A.A.B.; methodology, B.B.; statistical analysis, B.B., A.A.B. and H.K.; formal analysis, H.K., B.S. and Z.K.; laboratory analysis, Z.K. and B.B.; writing—original draft preparation, B.B., A.A.B. and H.K.; writing—review and editing, B.S., G.P.K. and C.G.; visualization, B.B. and A.A.B.; funding acquisition, C.G. All authors have read and agreed to the published version of the manuscript.

Funding

This research was funded by the Hungarian University of Agriculture and Life Sciences.

Institutional Review Board Statement

Not applicable.

Data Availability Statement

The raw data supporting the conclusions of this article will be made available by the authors upon request.

Acknowledgments

On behalf of all the authors, I express my many thanks to the Reviewers and the Editor for their insightful and thorough comments and constructive suggestions. We also express our deep appreciation to the colleagues of the MATE Agricultural Training Farm Ltd. for their committed efforts in the care and supervision of the experiment.

Conflicts of Interest

The authors declare no conflicts of interest.

Abbreviations

The following abbreviations are used in this manuscript:
LAILeaf Area Index
SPADSoil Plant Analysis Development
PARPhotosynthetically Active Radiation
NIRNear-infrared spectroscopic equipment
ANOVAAnalysis of Variance
SOMSoil Organic Matter
PPloughing
DCDeep Cultivation
SCShallow Cultivation
LLoosening
DDisking
NTNo-till

Appendix A

Table A1. The timetable of agricultural management in 2022–2024.
YearCultureManagement HistorySeeding RateDosesDate
2021Winter barleyFertilizing (NPK 8-21-21) 300 kg ha−18 October
Primary soil tillage 12 October
Seedbed preparation 14 October
Sowing200 kg ha−1 14 October
2022Winter barleyFertilizing (N 27) 250 kg ha−12 April
Plant protection pethoxamid + terbuthylazine
(3 L ha−1 formulation)
20 April
nicosulfuron
+ dicamba
+ rimsulfuron
(400 g ha−1 formulation) + ethoxy-isodecyl alcohol (0.1% ha−1)
13 May
Harvest 19 June
Weed control glyphosate (4 L ha−1 formulation)26 August
Fertilizing (NPK 8-24-24) 250 kg ha−15 October
Primary soil tillage for soybean 5 October
2023SoybeanWeed control glyphosate (4 L ha−1 formulation)31 March
Fertilizing (N 27) 200 kg ha−125 April
Seedbed preparation 25 April
Sowing100 kg ha−1 28 April
Weed control nicosulfuron
+ dicamba
+ rimsulfuron
(400 g ha−1 formulation) + ethoxy-isodecyl alcohol (0.1% ha−1)
28 April
Plant protection bentazone (2 L ha−1 formulation)5 June
Harvest 28 September
Fertilizing (NPK 8-21-21) 300 kg ha−16 October
Primary soil tillage 6 October
Seedbed preparation 11 October
Sowing of winter wheat 200 kg ha−1 11 October
2024Winter wheatFertilizing (N 27) 250 kg ha−110 April
Plant protection pethoxamid + terbuthylazine (3 L ha−1 formulation)26 April
Weed control 5 L ha−1
nicosulfuron
+ dicamba
+ rimsulfuron
(400 g ha−1 formulation) + ethoxy-isodecyl alcohol (0.1% ha−1)
21 May
Harvest 5 July

References

  1. Rzaliyev, A.; Goloborodko, V.; Bekmuhametov, S.; Ospanbayev, Z.; Sembayeva, A. Influence of Tillage Methods on Food Security and Its Agrophysical and Water-Physical Properties. Food Sci. Technol. 2023, 43, e76221. [Google Scholar] [CrossRef]
  2. Lamichhane, J.R.; Boiffin, J.; Boizard, H.; Dürr, C.; Richard, G. Seedbed Structure of Major Field Crops as Affected by Cropping Systems and Climate: Results of a 15-Year Field Trial. Soil Tillage Res. 2021, 206, 104845. [Google Scholar] [CrossRef]
  3. Ben-Noah, I.; Fiedman, S.P. Review and Evaluation of Root Respiration andof atural and Agricultural Processes of Soil Aeriation. Vadose Zone J. 2018, 17, 1–47. [Google Scholar] [CrossRef]
  4. Nunes, M.R.; Karlen, D.L.; Moorman, T.B. Tillage Intensity Effects on Soil Structure Indicators—A US Meta-Analysis. Sustainability 2020, 12, 2071. [Google Scholar] [CrossRef]
  5. Schillaci, C.; Saia, S.; Lipani, A.; Perego, A.; Zaccone, C.; Acutis, M. Validating the Regional Estimates of Changes in Soil Organic Carbon by Using the Data from Paired-Sites: The Case Study of Mediterranean Arable Lands. Carbon Balance Manag. 2021, 16, 19. [Google Scholar] [CrossRef] [PubMed]
  6. Niewiadomska, A.; Majchrzak, L.; Borowiak, K.; Wolna-Maruwka, A.; Waraczewska, Z.; Budka, A.; Gaj, R. The Influence of Tillage and Cover Cropping on Soil Microbial Parameters and Spring Wheat Physiology. Agronomy 2020, 10, 200. [Google Scholar] [CrossRef]
  7. Liu, Z.; Cao, S.; Sun, Z.; Wang, H.; Qu, S.; Lei, N.; He, J.; Dong, Q. Tillage Effects on Soil Properties and Crop Yield after Land Reclamation. Sci. Rep. 2021, 11, 1–12. [Google Scholar] [CrossRef] [PubMed]
  8. Liu, X.; Li, R.; Lv, Y.; Zhang, X.; Zhang, Y.; Gao, Q.; Ma, Y.; Bizimana, F.; Liu, L.; Han, H.; et al. Two Pathways for Reducing Soil Aggregate Organic Carbon Mineralisation via Minimum Tillage under a Long-Term Field Experiment. J. Environ. Manag. 2025, 381, 125195. [Google Scholar] [CrossRef]
  9. da Silva Souza, C.B.; da Silva Farias, P.G.; Rosset, J.S.; Schiavo, J.A.; Ozório, J.M.B.; de Souza Oliveira, N.; da Silva Coêlho, R.; Tomazi, M.; Salton, J.C. Soil Quality and CO2 Emissions in Response to Six Years of Conventional and Integrated Agricultural Production in the Central-West Region of Brazil. J. Soil Sci. Plant Nutr. 2025, 25, 3954–3970. [Google Scholar] [CrossRef]
  10. Chang, F.; Yue, S.; Li, S.; Wang, H.; Chen, Y.; Yang, W.; Wu, B.; Sun, H.; Wang, S.; Yin, L.; et al. Periodic Straw-Derived Biochar Improves Crop Yield, Sequesters Carbon, and Mitigates Emissions. Eur. J. Agron. 2025, 164, 127516. [Google Scholar] [CrossRef]
  11. Weidhuner, A.; Hanauer, A.; Krausz, R.; Crittenden, S.J.; Gage, K.; Sadeghpour, A. Tillage Impacts on Soil Aggregation and Aggregate-Associated Carbon and Nitrogen after 49 Years. Soil Tillage Res. 2021, 208, 104878. [Google Scholar] [CrossRef]
  12. Steponavičienė, V.; Bogužas, V.; Sinkevičienė, A.; Skinulienė, L.; Vaisvalavičius, R.; Sinkevičius, A. Soil Water Capacity, Pore Size Distribution, and CO2 Emission in Different Soil Tillage Systems and Straw Retention. Plants 2022, 11, 614. [Google Scholar] [CrossRef]
  13. Huzsvai, L.; Zsembeli, J.; Kovács, E.; Juhász, C. Response of Winter Wheat (Triticum aestivum L.) Yield to the Increasing Weather Fluctuations in a Continental Region of Four-Season Climate. Agronomy 2022, 12, 314. [Google Scholar] [CrossRef]
  14. Wang, S.; Wang, H.; Hafeez, M.B.; Zhang, Q.; Yu, Q.; Wang, R.; Wang, X.; Li, J. No-Tillage and Subsoiling Increased Maize Yields and Soil Water Storage under Varied Rainfall Distribution: A 9-Year Site-Specific Study in a Semi-Arid Environment. Field Crops Res. 2020, 255, 107867. [Google Scholar] [CrossRef]
  15. Wittwer, R.A.; Klaus, V.H.; Oliveria, E.M.; Sun, Q.; Liu, Y.; Gilgen, A.; Buchmann, N.; van der Heijden, M.A. Limited capability of organic farming and conservation tillage to enhance agroecosystem resilience to severe drought. Agric. Syst. 2023, 211, 103721. [Google Scholar] [CrossRef]
  16. Peng, Q.; Liu, B.; Hu, Y.; Wang, A.; Guo, Q.; Yin, B.; Cao, Q.; He, L. The Role of Conventional Tillage in Agricultural Soil Erosion. Agric. Ecosyst. Environ. 2023, 348, 108407. [Google Scholar] [CrossRef]
  17. van Balen, D.; Cuperus, F.; Haagsma, W.; de Haan, J.; van den Berg, W.; Sukkel, W. Crop Yield Response to Long-Term Reduced Tillage in a Conventional and Organic Farming System on a Sandy Loam Soil. Soil Tillage Res. 2023, 225, 105553. [Google Scholar] [CrossRef]
  18. Su, Y.; Gabrielle, B.; Makowski, D. A Global Dataset for Crop Production under Conventional Tillage and No Tillage Systems. Sci. Data 2021, 8, 1–17. [Google Scholar] [CrossRef] [PubMed]
  19. Yao, X.; Chen, S.; Ding, S.; Zhang, M.; Cui, Z.; Linghu, S.; Xu, J. Temperature, Moisture, Hyperspectral Vegetation Indexes, and Leaf Traits Regulated Soil Respiration in Different Crop Planting Fields. J. Soil Sci. Plant Nutr. 2021, 21, 3203–3220. [Google Scholar] [CrossRef]
  20. Assefa Bogale, A.; Percze, A. The Influence of Primary Soil Tillage Methods and Foliar Nutrient Provision on the Growth, Yield, and Associated Traits of Winter Barley (Hordeum Vulgare L.). Acta Agrar. Debreceniensis 2025, 1, 19–26. [Google Scholar] [CrossRef] [PubMed]
  21. Abd Ghani, R.; Omar, S.; Jolánkai, M.; Tarnawa, Á.; Kende, Z.; Khalid, N.; Gyuricza, C.; Kassai, M.K. Soilless Culture Applications for Early Development of Soybean Crop (Glycine max L. Merr). Agriculture 2023, 13, 1713. [Google Scholar] [CrossRef]
  22. Liebhard, G.; Klik, A.; Neugschwandtner, R.W.; Nolz, R. Effects of Tillage Systems on Soil Water Distribution, Crop Development, and Evaporation and Transpiration Rates of Soybean. Agric. Water Manag. 2022, 269, 107719. [Google Scholar] [CrossRef]
  23. Documents|WRB. Available online: https://wrb.isric.org/documents/ (accessed on 18 July 2025).
  24. Farkas, C.; Birkás, M.; Várallyay, G. Soil Tillage Systems to Reduce the Harmful Effect of Extreme Weather and Hydrological Situations. Biologia 2009, 64, 624–628. [Google Scholar] [CrossRef]
  25. Weldmichael, T.G.; Szegi, T.; Denish, L.; Gangwar, R.K.; Michéli, E.; Simon, B. The Patterns of Soil Microbial Respiration and Earthworm Communities as Influenced by Soil and Land-Use Type in Selected Soils of Hungary. Soil Sci. Annu. 2020, 71, 139–148. [Google Scholar] [CrossRef]
  26. Bencsik, K.; Ujj, A.; Mikó, P. Evaluation of Different Soil Tillage Methods Regarding Sustainability and Soil Protection. Cereal Res. Commun. 2007, 35 Pt 1, 233–236. [Google Scholar] [CrossRef]
  27. Jakab, G.; Madarász, B.; Masoudi, M.; Karlik, M.; Király, C.; Zacháry, D.; Filep, T.; Dekemati, I.; Centeri, C.; Al-Graiti, T.; et al. Soil Organic Matter Gain by Reduced Tillage Intensity: Storage, Pools, and Chemical Composition. Soil Tillage Res. 2023, 226, 105584. [Google Scholar] [CrossRef]
  28. MSZ-08-0206/2-1978; pH-érték Potenciometria (KCl-os Szuszpenzió). Magyar Szabványügyi Testület: Budapest, Hungary, 1978.
  29. MSZ-08-0210:1977; Humusz Fotometria. Magyar Szabványügyi Testület: Budapest, Hungary, 1977.
  30. Kende, Z.; Sallai, A.; Kassai, K.; Mikó, P.; Percze, A.; Birkás, M. The Effects of Tillage-Induced Soil Disturbance on Weed Infestation of Winter Wheat. Pol. J. Environ. Stud. 2017, 26, 1131–1138. [Google Scholar] [CrossRef]
  31. Anda, A.; Simon-Gáspár, B.; Simon, S.; Soós, G.; Menyhárt, L. Modeling Risk in Fusarium Head Blight and Yield Analysis in Five Winter Wheat Production Regions of Hungary. Agriculture 2024, 14, 1093. [Google Scholar] [CrossRef]
  32. Kovács, G.P.; Simon, B.; Balla, I.; Bozóki, B.; Dekemati, I.; Gyuricza, C.; Percze, A.; Birkás, M. Conservation Tillage Improves Soil Quality and Crop Yield in Hungary. Agronomy 2023, 13, 894. [Google Scholar] [CrossRef]
  33. Palmero, F.; Fernandez, J.A.; Garcia, F.O.; Haro, R.J.; Prasad, P.V.V.; Salvagiotti, F.; Ciampitti, I.A. A Quantitative Review into the Contributions of Biological Nitrogen Fixation to Agricultural Systems by Grain Legumes. Eur. J. Agron. 2022, 136, 126514. [Google Scholar] [CrossRef]
  34. PP SYSTEMS EGM-5 OPERATION MANUALS Pdf Download|ManualsLib. Available online: https://www.manualslib.com/manual/1420959/Pp-Systems-Egm-5.html (accessed on 18 July 2025).
  35. DEVICES. AccuPAR LP-80. Available online: https://metergroup.com/products/accupar-lp-80/ (accessed on 17 June 2025).
  36. Chlorophyll Meter SPAD-502Plus for Agricultural Products|KONICA MINOLTA. Available online: https://sensing.konicaminolta.eu/mi-en/products/colour-measurement/chlorophyll-meter/spad-502plus (accessed on 18 July 2025).
  37. Gawęda, D.; Haliniarz, M. Grain Yield and Quality of Winter Wheat Depending on Previous Crop and Tillage System. Agriculture 2021, 11, 133. [Google Scholar] [CrossRef]
  38. MSZ ISO 5983-2:2009; Animal Feeding Stuffs—Determination of Nitrogen Content and Calculation og Crude Protein Content. Magyar Szabványügyi Testület: Budapest, Hungary, 2009.
  39. MSZ-6830-11:1999; Peroxidszám-Meghatározás. Magyar Szabványügyi Testület: Budapest, Hungary, 1999.
  40. Shapiro, S.S.; Wilk, M.B. An Analysis of Variance Test for Normality (Complete Samples). Biometrika 1965, 52, 591–611. [Google Scholar] [CrossRef]
  41. Breslow, N. A Generalized Kruskal-Wallis Test for Comparing K Samples Subject to Unequal Patterns of Censorship. Biometrika 1970, 57, 579. [Google Scholar] [CrossRef]
  42. Drebee, H.A.; Abdul Razak, N.A.; Brisam, A.A. What Are the Determinants of Investment in the Iraqi Agricultural Sector? IOP Conf. Ser. Earth Environ. Sci. 2021, 735, 012038. [Google Scholar] [CrossRef]
  43. Zhang, Y.; Hou, W.; Chi, M.; Sun, Y.; An, J.; Yu, N.; Zou, H. Simulating the effects of soil temperature and soil moisture on CO2 and CH4 emissions in rice-straw-enriched paddy soil. Catena 2020, 194, 104677. [Google Scholar] [CrossRef]
  44. Ruan, Y.; Kuzyakov, Y.; Liu, X.; Zhang, X.; Xu, Q.; Guo, J.; Guo, S.; Shen, Q.; Yang, Y.; Ling, N. Elevated temperature and CO2 strongly affect the growth strategies of soil bacteria. Nat. Commun. 2023, 14, 391. [Google Scholar] [CrossRef]
  45. Darenova, E.; Adamič, P.C.; Čater, M. Effect of temperature, water availability, and soil properties on soil CO2 efflux in beech-fir forests along the Carpathian Mts. Catena 2024, 240, 107974. [Google Scholar] [CrossRef]
  46. Ray, R.L.; Griffin, R.W.; Fares, A.; Elhassan, A.; Awal, R.; Woldesenbet, S.; Risch, E. Soil CO2 emission in response to organic amendments temperature, and rainfall. Sci. Rep. 2020, 10, 5849. [Google Scholar] [CrossRef] [PubMed]
  47. Sergeevna Kozun, Y.; Shagidullovich Kazeev, K.; Ilich Kolesnikov, S. Climatic Gradients of Biological Properties of Zonal Soils of Natural Lands. Geoderma 2022, 425, 116031. [Google Scholar] [CrossRef]
  48. Fernández-Martínez, M.; Sardans, J.; Chevallier, F.; Ciais, P.; Obersteiner, M.; Vicca, S.; Canadell, J.G.; Bastos, A.; Friedlingstein, P.; Sitch, S.; et al. Global Trends in Carbon Sinks and Their Relationships with CO2 and Temperature. Nat. Clim. Change 2019, 9, 73–79. [Google Scholar] [CrossRef]
  49. Wang, N.; Quesada, B.; Xia, L.; Butterbach-Bahl, K.; Goodale, C.L.; Kiese, R. Effects of Climate Warming on Carbon Fluxes in Grasslands—A Global Meta-Analysis. Glob. Change Biol. 2019, 25, 1839–1851. [Google Scholar] [CrossRef]
  50. Wang, J.; Quan, Q.; Chen, W.; Tian, D.; Ciais, P.; Crowther, T.W.; Mack, M.C.; Poulter, B.; Tian, H.; Luo, Y.; et al. Increased CO2 Emissions Surpass Reductions of Non-CO2 Emissions More under Higher Experimental Warming in an Alpine Meadow. Sci. Total Environ. 2021, 769, 144559. [Google Scholar] [CrossRef]
  51. Sushko, S.; Ananyeva, N.; Ivashchenko, K.; Vasenev, V.; Kudeyarov, V. Soil CO2 Emission, Microbial Biomass, and Microbial Respiration of Woody and Grassy Areas in Moscow (Russia). J. Soils Sediments 2019, 19, 3217–3225. [Google Scholar] [CrossRef]
  52. Sushko, S.V.; Ananyeva, N.D.; Ivashchenko, K.V.; Kudeyarov, V.N. Soil CO2 Emission, Microbial Biomass, and Basal Respiration of Chernozems under Different Land Uses. Eurasian Soil Sci. 2019, 52, 1091–1100. [Google Scholar] [CrossRef]
  53. Zhang, K.; Duan, M.; Xu, Q.; Wang, Z.; Liu, B.; Wang, L. Soil Microbial Functional Diversity and Root Growth Responses to Soil Amendments Contribute to CO2 Emission in Rainfed Cropland. Catena 2020, 195, 104747. [Google Scholar] [CrossRef]
  54. Piao, S.; Wang, X.; Wang, K.; Li, X.; Bastos, A.; Canadell, J.G.; Ciais, P.; Friedlingstein, P.; Sitch, S. Interannual Variation of Terrestrial Carbon Cycle: Issues and Perspectives. Glob. Change Biol. 2020, 26, 300–318. [Google Scholar] [CrossRef]
  55. Tao, F.; Li, Y.; Chen, Y.; Yin, L.; Zhang, S. Daily, Seasonal and Inter-Annual Variations in CO2 Fluxes and Carbon Budget in a Winter-Wheat and Summer-Maize Rotation System in the North China Plain. Agric. For. Meteorol. 2022, 324, 109098. [Google Scholar] [CrossRef]
  56. Ionita, M.; Nagavciuc, V. 2024: The Year with Too Much Summer in the Eastern Part of Europe. Weather 2025, 99. [Google Scholar] [CrossRef]
  57. Lennert, J.; Kovács, K.; Koós, B.; Swain, N.; Bálint, C.; Hamza, E.; Király, G.; Rácz, K.; Váradi, M.M.; Kovács, A.D. Climate Change, Pressures, and Adaptation Capacities of Farmers: Empirical Evidence from Hungary. Horticulturae 2024, 10, 56. [Google Scholar] [CrossRef]
  58. Szili-Kovács, T.; Takács, T. Advanced Research of Rhizosphere Microbial Activity. Agriculture 2023, 13, 911. [Google Scholar] [CrossRef]
  59. Yang, Y.; Zou, J.; Huang, W.; Olesen, J.E.; Li, W.; Rees, R.M.; Harrison, M.T.; Feng, B.; Feng, Y.; Chen, F.; et al. Drivers of Soybean-Based Rotations Synergistically Increase Crop Productivity and Reduce GHG Emissions. Agric. Ecosyst. Environ. 2024, 372, 109094. [Google Scholar] [CrossRef]
  60. Hao, Y.; Mao, J.; Bachmann, C.M.; Hoffman, F.M.; Koren, G.; Chen, H.; Tian, H.; Liu, J.; Tao, J.; Tang, J.; et al. Soil Moisture Controls over Carbon Sequestration and Greenhouse Gas Emissions: A Review. NPJ Clim. Atmos. Sci. 2025, 8, 1–14. [Google Scholar] [CrossRef]
  61. Juhász, C.; Huzsvai, L.; Kovács, E.; Kovács, G.; Tuba, G.; Sinka, L.; Zsembeli, J. Carbon Dioxide Efflux of Bare Soil as a Function of Soil Temperature and Moisture Content under Weather Conditions of Warm, Temperate, Dry Climate Zone. Agronomy 2022, 12, 3050. [Google Scholar] [CrossRef]
  62. Das, A.; Brown, L.; McFarlane, A. Asymmetric Effects of Financial Development on CO2 Emissions in Bangladesh. J. Risk Financ. Manag. 2023, 16, 269. [Google Scholar] [CrossRef]
  63. Steponavičienė, V.; Žiūraitis, G.; Rudinskienė, A.; Jackevičienė, K.; Bogužas, V. Long-Term Effects of Different Tillage Systems and Their Impact on Soil Properties and Crop Yields. Agronomy 2024, 14, 870. [Google Scholar] [CrossRef]
  64. Mühlbachová, G.; Růžek, P.; Kusá, H.; Vavera, R. CO2 Emissions from Soils under Different Tillage Practices and Weather Conditions. Agronomy 2023, 13, 3084. [Google Scholar] [CrossRef]
  65. Sawinska, Z.; Radzikowska-Kujawska, D.; Blecharczyk, A.; Świtek, S.; Piechota, T.; Cieślak, A.; Cardenas, L.M.; Louro-Lopez, A.; Gregory, A.S.; Coleman, K.; et al. How Tillage System Affects the Soil Carbon Dioxide Emission and Wheat Plants Physiological State. Agronomy 2024, 14, 2220. [Google Scholar] [CrossRef]
  66. Cui, H.; Wang, Y.; Luo, Y.; Jin, M.; Chen, J.; Pang, D.; Li, Y.; Wang, Z. Tillage Strategies Optimize SOC Distribution to Reduce Carbon Footprint. Soil Tillage Res. 2022, 223, 105499. [Google Scholar] [CrossRef]
  67. Franco-Luesma, S.; Cavero, J.; Plaza-Bonilla, D.; Cantero-Martínez, C.; Arrúe, J.L.; Álvaro-Fuentes, J. Tillage and Irrigation System Effects on Soil Carbon Dioxide (CO2) and Methane (CH4) Emissions in a Maize Monoculture under Mediterranean Conditions. Soil Tillage Res. 2020, 196, 104488. [Google Scholar] [CrossRef]
  68. Gao, L.; Wang, B.; Li, S.; Han, Y.; Zhang, X.; Gond, D.; Ma, M.; Liang, G.; Wu, H.; Wu, X.; et al. Effects of different long-term tillage systems on the composition of organic matter by 13C CP/TOSS NMR in physical fractions in the Loess Plateau of China. Soil Tillage Res. 2019, 194, 104321. [Google Scholar] [CrossRef]
  69. Mohammed, S.; Mirzaei, M.; Pappné Törő, Á.; Anari, M.G.; Moghiseh, E.; Asadi, H.; Szabó, S.; Kakuszi-Széles, A.; Harsányi, E. Soil Carbon Dioxide Emissions from Maize (Zea mays L.) Fields as Influenced by Tillage Management and Climate*. Irrig. Drain. 2022, 71, 228–240. [Google Scholar] [CrossRef]
  70. Ruis, S.J.; Blanco-Canqui, H.; Jasa, P.J.; Jin, V.L. No-till Farming and Greenhouse Gas Fluxes: Insights from Literature and Experimental Data. Soil Tillage Res. 2022, 220, 105359. [Google Scholar] [CrossRef]
  71. Ogle, S.M.; Alsaker, C.; Baldock, J.; Bernoux, M.; Breidt, F.J.; McConkey, B.; Regina, K.; Vazquez-Amabile, G.G. Climate and Soil Characteristics Determine Where No-Till Management Can Store Carbon in Soils and Mitigate Greenhouse Gas Emissions. Sci. Rep. 2019, 9, 1–8. [Google Scholar] [CrossRef]
  72. Jaskulski, D.; Jaskulska, I.; Różniak, E.; Radziemska, M.; Brtnický, M. Cultivation of Crops in Strip-Till Technology and Microgranulated Fertilisers Containing a Gelling Agent as a Farming Response to Climate Change. Agriculture 2023, 13, 1981. [Google Scholar] [CrossRef]
  73. Buragienė, S.; Šarauskis, E.; Romaneckas, K.; Adamavičienė, A.; Kriaučiūnienė, Z.; Avižienytė, D.; Marozas, V.; Naujokienė, V. Relationship between CO2 Emissions and Soil Properties of Differently Tilled Soils. Sci. Total Environ. 2019, 662, 786–795. [Google Scholar] [CrossRef]
  74. Li, Z.; Zhang, Q.; Li, Z.; Qiao, Y.; Du, K.; Yue, Z.; Tian, C.; Leng, P.; Cheng, H.; Chen, G.; et al. Responses of Soil Greenhouse Gas Emissions to No-Tillage: A Global Meta-Analysis. Sustain. Prod. Consum. 2023, 36, 479–492. [Google Scholar] [CrossRef]
  75. Pareja-Sánchez, E.; Cantero-Martínez, C.; Álvaro-Fuentes, J.; Plaza-Bonilla, D. Tillage and Nitrogen Fertilization in Irrigated Maize: Key Practices to Reduce Soil CO2 and CH4 Emissions. Soil Tillage Res. 2019, 191, 29–36. [Google Scholar] [CrossRef]
  76. Shakoor, A.; Shahbaz, M.; Farooq, T.H.; Sahar, N.E.; Shahzad, S.M.; Altaf, M.M.; Ashraf, M. A Global Meta-Analysis of Greenhouse Gases Emission and Crop Yield under No-Tillage as Compared to Conventional Tillage. Sci. Total Environ. 2021, 750, 142299. [Google Scholar] [CrossRef]
  77. Bregaglio, S.; Mongiano, G.; Ferrara, R.M.; Ginaldi, F.; Lagomarsino, A.; Rana, G. Which Are the Most Favourable Conditions for Reducing Soil CO2 Emissions with No-Tillage? Results from a Meta-Analysis. Int. Soil Water Conserv. Res. 2022, 10, 497–506. [Google Scholar] [CrossRef]
  78. Dencső, M.; Horel, Á.; Bakacsi, Z.; Birkás, M.; Takács, T.; Füzy, A.; Szili-Kovács, T.; Balla, I.; Tóth, E. Is Soil Respiration of a Chernozem under Shallow Cultivation Similar to Moldboard Plowing or No-Tillage? Soil Tillage Res. 2025, 253, 106644. [Google Scholar] [CrossRef]
  79. Kulmány, I.M.; Giczi, Z.; Beslin, A.; Bede, L.; Kalocsai, R.; Vona, V. Impact of Environmental and Soil Factors in the Prediction of Soil Carbon Dioxide Emissions under Different Tillage Systems. Ecocycles 2022, 8, 27–39. [Google Scholar] [CrossRef]
  80. Balla Kovács, A.; Juhász, E.K.; Béni, Á.; Kincses, I.; Tállai, M.; Sándor, Z.; Kátai, J.; Rátonyi, T.; Kremper, R. Changes in Microbial Community and Activity of Chernozem Soil under Different Management Systems in a Long-Term Field Experiment in Hungary. Agronomy 2024, 14, 745. [Google Scholar] [CrossRef]
  81. Firth, A.G.; Brooks, J.P.; Locke, M.A.; Morin, D.J.; Brown, A.; Baker, B.H. Dynamics of Soil Organic Carbon and CO2; Flux under Cover Crop and No-Till Management in Soybean Cropping Systems of the Mid-South (USA). Environments 2022, 9, 109. [Google Scholar] [CrossRef]
  82. Silva, B.d.O.; Moitinho, M.R.; Santos, G.A.d.A.; Teixeira, D.D.B.; Fernandes, C.; La Scala, N. Soil CO2 Emission and Short-Term Soil Pore Class Distribution after Tillage Operations. Soil Tillage Res. 2019, 186, 224–232. [Google Scholar] [CrossRef]
  83. Wolff, M.W.; Alsina, M.M.; Stockert, C.M.; Khalsa, S.D.S.; Smart, D.R. Minimum Tillage of a Cover Crop Lowers Net GWP and Sequesters Soil Carbon in a California Vineyard. Soil Tillage Res. 2018, 175, 244–254. [Google Scholar] [CrossRef]
  84. Man, M.; Wagner-Riddle, C.; Dunfield, K.E.; Deen, B.; Simpson, M.J. Long-term Crop Rotation and Different Tillage Practices Alter Soil Organic Matter Composition and Degradation. Soil Tillage Res. 2021, 209, 104960. [Google Scholar] [CrossRef]
  85. Gao, Q.; Ma, L.; Fang, Y.; Zhang, A.; Li, G.; Wang, J.; Wu, D.; Wu, W.; Du, Z. Conservation Tillage for 17years Alters the Molecular Composition of Organic Matter in Soil Profile. Sci. Total Environ. 2021, 762, 143116. [Google Scholar] [CrossRef] [PubMed]
  86. Lv, L.; Gao, Z.; Liao, K.; Zhu, Q.; Zhu, J. Impact of Conservation Tillage on the Distribution of Soil Nutrients with Depth. Soil Tillage Res. 2023, 225, 105527. [Google Scholar] [CrossRef]
  87. Vincent-Caboud, L.; Casagrande, M.; David, C.; Ryan, M.R.; Silva, E.M.; Peigne, J. Using Mulch from Cover Crops to Facilitate Organic No-till Soybean and Maize Production. A Review. Agron. Sustain. Dev. 2019, 39, 1–15. [Google Scholar] [CrossRef]
  88. Li, Y.; Chen, H.; Feng, H.; Dong, Q.; Wu, W.; Zou, Y.; Chau, H.W.; Siddique, K.H.M. Influence of Straw Incorporation on Soil Water Utilization and Summer Maize Productivity: A Five-Year Field Study on the Loess Plateau of China. Agric. Water Manag. 2020, 233, 106106. [Google Scholar] [CrossRef]
  89. Liu, S.; Gao, Y.; Lang, H.; Liu, Y.; Zhang, H. Effects of Conventional Tillage and No-Tillage Systems on Maize (Zea mays L.) Growth and Yield, Soil Structure, and Water in Loess Plateau of China: Field Experiment and Modeling Studies. Land 2022, 11, 1881. [Google Scholar] [CrossRef]
  90. Ali, A.M.; Savin, I.; Poddubskiy, A.; Abouelghar, M.; Saleh, N.; Abutaleb, K.; El-Shirbeny, M.; Dokukin, P. Integrated Method for Rice Cultivation Monitoring Using Sentinel-2 Data and Leaf Area Index. Egypt. J. Remote Sens. Space Sci. 2021, 24, 431–441. [Google Scholar] [CrossRef]
  91. Różewicz, M.; Grabiński, J.; Wyzińska, M. Effect of Strip-till and Cultivar on Photosynthetic Parameters and Grain Yield of Winter Wheat. Int. Agrophys 2024, 38, 279–291. [Google Scholar] [CrossRef]
  92. Cañete-Salinas, P.; Zamudio, F.; Yáñez, M.; Gajardo, J.; Valdés, H.; Espinosa, C.; Venegas, J.; Retamal, L.; Ortega-Farias, S.; Acevedo-Opazo, C. Evaluation of Models to Determine LAI on Poplar Stands Using Spectral Indices from Sentinel-2 Satellite Images. Ecol. Model. 2020, 428, 109058. [Google Scholar] [CrossRef]
  93. Irmak, S.; Kukal, M.S.; Mohammed, A.T.; Djaman, K. Disk-till vs. No-till Maize Evapotranspiration, Microclimate, Grain Yield, Production Functions and Water Productivity. Agric. Water Manag. 2019, 216, 177–195. [Google Scholar] [CrossRef]
  94. Geris, J.; Verrot, L.; Gao, L.; Peng, X.; Oyesiku-Blakemore, J.; Smith, J.U.; Hodson, M.E.; McKenzie, B.M.; Zhang, G.; Hallett, P.D. Importance of Short-Term Temporal Variability in Soil Physical Properties for Soil Water Modelling under Different Tillage Practices. Soil Tillage Res. 2021, 213, 105132. [Google Scholar] [CrossRef]
  95. Hu, R.; Liu, Y.; Chen, T.; Zheng, Z.; Peng, G.; Zou, Y.; Tang, C.; Shan, X.; Zhou, Q.; Li, J. Responses of Soil Aggregates, Organic Carbon, and Crop Yield to Short-Term Intermittent Deep Tillage in Southern China. J. Clean. Prod. 2021, 298, 126767. [Google Scholar] [CrossRef]
  96. Yang, Y.; Wu, J.; Du, Y.L.; Gao, C.; Pan, X.; Tang, D.W.S.; van der Ploeg, M. Short- and Long-Term Straw Mulching and Subsoiling Affect Soil Water, Photosynthesis, and Water Use of Wheat and Maize. Front. Agron. 2021, 3, 708075. [Google Scholar] [CrossRef]
  97. Dang, Y.P.; Balzer, A.; Crawford, M.; Rincon-Florez, V.; Liu, H.; Melland, A.R.; Antille, D.; Kodur, S.; Bell, M.J.; Whish, J.P.M.; et al. Strategic Tillage in Conservation Agricultural Systems of North-Eastern Australia: Why, Where, When and How? Environ. Sci. Pollut. Res. 2018, 25, 1000–1015. [Google Scholar] [CrossRef]
  98. Li, Z.; Lai, X.; Yang, Q.; Yang, X.; Cui, S.; Shen, Y. In Search of Long-Term Sustainable Tillage and Straw Mulching Practices for a Maize-Winter Wheat-Soybean Rotation System in the Loess Plateau of China. Field Crops Res. 2018, 217, 199–210. [Google Scholar] [CrossRef]
  99. Liu, X.; Dong, W.; Jia, S.; Liu, Q.; Li, Y.; Hossain, M.E.; Liu, E.; Kuzyakov, Y. Transformations of N Derived from Straw under Long-Term Conventional and No-Tillage Soils: A 15N Labelling Study. Sci. Total Environ. 2021, 786, 147428. [Google Scholar] [CrossRef]
  100. Cai, A.; Han, T.; Ren, T.; Sanderman, J.; Rui, Y.; Wang, B.; Smith, P.; Xu, M.; Li, Y. Declines in Soil Carbon Storage under No Tillage Can Be Alleviated in the Long Run. Geoderma 2022, 425, 116028. [Google Scholar] [CrossRef]
  101. Nouri, A.; Lee, J.; Yin, X.; Tyler, D.D.; Saxton, A.M. Thirty-Four Years of No-Tillage and Cover Crops Improve Soil Quality and Increase Cotton Yield in Alfisols, Southeastern USA. Geoderma 2019, 337, 998–1008. [Google Scholar] [CrossRef]
  102. Nunes, M.R.; van Es, H.M.; Schindelbeck, R.; Ristow, A.J.; Ryan, M. No-till and Cropping System Diversification Improve Soil Health and Crop Yield. Geoderma 2018, 328, 30–43. [Google Scholar] [CrossRef]
  103. Yang, H.; Wu, G.; Mo, P.; Chen, S.; Wang, S.; Xiao, Y.; Ma, H.A.; Wen, T.; Guo, X.; Fan, G. The Combined Effects of Maize Straw Mulch and No-Tillage on Grain Yield and Water and Nitrogen Use Efficiency of Dry-Land Winter Wheat (Triticum aestivum L.). Soil Tillage Res. 2020, 197, 104485. [Google Scholar] [CrossRef]
  104. Dekemati, I.; Simon, B.; Bogunovic, I.; Kisic, I.; Kassai, K.; Kende, Z.; Birkás, M. Long Term Effects of Ploughing and Conservation Tillage Methods on Earthworm Abundance and Crumb Ratio. Agronomy 2020, 10, 1552. [Google Scholar] [CrossRef]
  105. Janusauskaite, D.; Kadziene, G. Influence of Different Intensities of Tillage on Physiological Characteristics and Productivity of Crop-Rotation Plants. Plants 2022, 11, 3107. [Google Scholar] [CrossRef]
  106. Hirooka, Y.; Shoji, K.; Watanabe, Y.; Izumi, Y.; Awala, S.K.; Iijima, M. Ridge Formation with Strip Tillage Alleviates Excess Moisture Stress for Drought-Tolerant Crops. Soil Tillage Res. 2019, 195, 104429. [Google Scholar] [CrossRef]
  107. Binder, A.; Jócsák, I.; Varga, Z.; Knolmajer, B.; Keszthelyi, S. Non-Invasive Evaluation of Different Soil Tillage and Seed Treatment Effects on the Microbial Originating Physiological Reactions of Developing Juvenile Maize. Plants 2022, 11, 2506. [Google Scholar] [CrossRef]
  108. Li, Q.; Wang, M.; Fu, Q.; Li, T.; Liu, D.; Hou, R.; Li, H.; Cui, S.; Ji, Y. Short-Term Influence of Biochar on Soil Temperature, Liquid Moisture Content and Soybean Growth in a Seasonal Frozen Soil Area. J. Environ. Manag. 2020, 266, 110609. [Google Scholar] [CrossRef]
  109. Yin, Q.; Zhang, Y.; Li, W.; Wang, J.; Wang, W.; Ahmad, I.; Zhou, G.; Huo, Z. Better Inversion of Wheat Canopy SPAD Values before Heading Stage Using Spectral and Texture Indices Based on UAV Multispectral Imagery. Remote Sens. 2023, 15, 4935. [Google Scholar] [CrossRef]
  110. Szulc, P.; Bocianowski, J.; Nowosad, K.; Zielewicz, W.; Kobus-cisowska, J. Spad Leaf Greenness Index: Green Mass Yield Indicator of Maize (Zea mays L.), Genetic and Agriculture Practice Relationship. Plants 2021, 10, 830. [Google Scholar] [CrossRef]
  111. Farhangi-Abriz, S.; Ghassemi-Golezani, K.; Torabian, S. A Short-Term Study of Soil Microbial Activities and Soybean Productivity under Tillage Systems with Low Soil Organic Matter. Appl. Soil Ecol. 2021, 168, 104122. [Google Scholar] [CrossRef]
  112. Yadav, K.; Singh, R.; Kumar, J.; Nayak, P.; Gaurav, K.; Mangaraj, A.; Shukla, D.K.; Naresh, R. Effect of Different Tillage and Nutrient Management Practices on Initial Population and SPAD Value in Wheat (Triticum aestivum L.). Pharm. Innov. J. 2022, 11, 408–412. [Google Scholar]
  113. Yang, H.; Yang, J.P.; Li, F.H.; Liu, N. Replacing the Nitrogen Nutrition Index by SPAD Values and Analysis of Effect Factors for Estimating Rice Nitrogen Status. Agron. J. 2018, 110, 545–554. [Google Scholar] [CrossRef]
  114. Yue, X.; Hu, Y.; Zhang, H.; Schmidhalter, U. Evaluation of Both SPAD Reading and SPAD Index on Estimating the Plant Nitrogen Status of Winter Wheat. Int. J. Plant Prod. 2020, 14, 67–75. [Google Scholar] [CrossRef]
  115. Gabriel, J.L.; Quemada, M.; Alonso-Ayuso, M.; Lizaso, J.I.; Martín-Lammerding, D. Predicting N Status in Maize with Clip Sensors: Choosing Sensor, Leaf Sampling Point, and Timing. Sensors 2019, 19, 3881. [Google Scholar] [CrossRef] [PubMed]
  116. Piao, L.; Li, M.; Xiao, J.; Gu, W.; Zhan, M.; Cao, C.; Zhao, M.; Li, C. Effects of Soil Tillage and Canopy Optimization on Grain Yield, Root Growth, and Water Use Efficiency of Rainfed Maize in Northeast China. Agronomy 2019, 9, 336. [Google Scholar] [CrossRef]
  117. de Cárcer, P.S.; Sinaj, S.; Santonja, M.; Fossati, D.; Jeangros, B. Long-Term Effects of Crop Succession, Soil Tillage and Climate on Wheat Yield and Soil Properties. Soil Tillage Res. 2019, 190, 209–219. [Google Scholar] [CrossRef]
  118. Scapino, M.; Meloni, R.; Blandino, M. A Comparison of the Agronomic Management of a Winter Barley Hybrid and a Conventional Genotype: Effect of the Seeding Rate, Soil Tillage and Nitrogen Fertilization. Front. Agron. 2025, 7, 1546989. [Google Scholar] [CrossRef]
  119. Wang, H.; Wang, S.; Yu, Q.; Zhang, Y.; Wang, R.; Li, J.; Wang, X. No Tillage Increases Soil Organic Carbon Storage and Decreases Carbon Dioxide Emission in the Crop Residue-Returned Farming System. J. Environ. Manag. 2020, 261, 110261. [Google Scholar] [CrossRef]
  120. Blanco-Canqui, H.; Hassim, R.; Shapiro, C.; Jasa, P.; Klopp, H. How Does No-till Affect Soil-Profile Compactibility in the Long Term? Geoderma 2022, 425, 116016. [Google Scholar] [CrossRef]
  121. Jensen, J.L.; Thomsen, I.K.; Eriksen, J.; Christensen, B.T. Spring Barley Grown for Decades with Straw Incorporation and Cover Crops: Effects on Crop Yields and N Uptake. Field Crops Res. 2021, 270, 108228. [Google Scholar] [CrossRef]
  122. Orzech, K.; Wanic, M.; Załuski, D. The Effects of Soil Compaction and Different Tillage Systems on the Bulk Density and Moisture Content of Soil and the Yields of Winter Oilseed Rape and Cereals. Agriculture 2021, 11, 666. [Google Scholar] [CrossRef]
  123. Woźniak, A. Effect of Various Systems of Tillage on Winter Barley Yield, Weed Infestation and Soil Properties. Appl. Ecol. Environ. Res. 2020, 18, 3483–3496. [Google Scholar] [CrossRef]
  124. Shahadha, S.S.; Wendroth, O. Modeling the Effect of Tillage and Irrigation Management on Water and Barley Productivity for Different Soil Textures. Soil Tillage Res. 2025, 250, 106505. [Google Scholar] [CrossRef]
  125. Shi, X.; Li, C.; Li, P.; Zong, Y.; Zhang, D.; Gao, Z.; Hao, X.; Wang, J.; Lam, S.K. Deep Plowing Increases Soil Water Storage and Wheat Yield in a Semiarid Region of Loess Plateau in China: A Simulation Study. Field Crops Res. 2024, 308, 109299. [Google Scholar] [CrossRef]
  126. Buczek, J.; Migut, D.; Jańczak-Pieniażek, M. Effect of Soil Tillage Practice on Photosynthesis, Grain Yield and Quality of Hybrid Winter Wheat. Agriculture 2021, 11, 479. [Google Scholar] [CrossRef]
  127. Aixia, R.; Weifeng, Z.; Anwar, S.; Wen, L.; Pengcheng, D.; Ruixuan, H.; Peiru, W.; Rong, Z.; Jin, T.; Zhiqiang, G.; et al. Effects of Tillage and Seasonal Variation of Rainfall on Soil Water Content and Root Growth Distribution of Winter Wheat under Rainfed Conditions of the Loess Plateau, China. Agric. Water Manag. 2022, 268, 107533. [Google Scholar] [CrossRef]
  128. Nankova, M.; Bankova-Atanasova, G. Effect of the Main Soil Tillage Types on the Agronomic Response of Wheat in the Region of Souht Dobrudzha. Agric. Conspec. Sci. 2018, 83, 63–69. [Google Scholar]
  129. Abdollahi, L.; Getahun, G.T.; Munkholm, L.J. Eleven Years’ Effect of Conservation Practices for Temperate Sandy Loams: I. Soil Physical Properties and Topsoil Carbon Content. Soil Sci. Soc. Am. J. 2017, 81, 380–391. [Google Scholar] [CrossRef]
  130. Lin, T.S.; Song, Y.; Lawrence, P.; Kheshgi, H.S.; Jain, A.K. Worldwide Maize and Soybean Yield Response to Environmental and Management Factors Over the 20th and 21st Centuries. J. Geophys. Res. 2021, 126, e2021JG006304. [Google Scholar] [CrossRef]
  131. Adamič, S.; Leskovšek, R. Soybean (Glycine max (L.) Merr.) Growth, Yield, and Nodulation in the Early Transition Period from Conventional Tillage to Conservation and No-Tillage Systems. Agronomy 2021, 11, 2477. [Google Scholar] [CrossRef]
  132. Faligowska, A.; Panasiewicz, K.; Szymańska, G.; Ratajczak, K. Optimizing Soybean Productivity: A Comparative Analysis of Tillage and Sowing Methods and Their Effects on Yield and Quality. Agriculture 2025, 15, 626. [Google Scholar] [CrossRef]
  133. Bryant, C.J.; Krutz, L.J.; Reynolds, D.B.; Locke, M.A.; Golden, B.R.; Irby, T.; Steinriede, R.W.; Spencer, G.D.; Mills, B.E.; Wood, C.W. Conservation Soybean Production Systems in the Mid-Southern USA: I. Transitioning from Conventional to Conservation Tillage. Crop Forage Turfgrass Manag. 2020, 6, e20055. [Google Scholar] [CrossRef]
  134. Amato, G.; Ruisi, P.; Frenda, A.S.; di Miceli, G.; Saia, S.; Plaia, A.; Giambalvo, D. Long-Term Tillage and Crop Sequence Effects on Wheat Grain Yield and Quality. Agron. J. 2013, 105, 1317–1327. [Google Scholar] [CrossRef]
  135. Pearsons, K.A.; Omondi, E.C.; Heins, B.J.; Zinati, G.; Smith, A.; Rui, Y. Reducing Tillage Affects Long-Term Yields but Not Grain Quality of Maize, Soybeans, Oats and Wheat Produced in Three Contrasting Farming Systems. Sustainability 2022, 14, 631. [Google Scholar] [CrossRef]
  136. Chet, F.; Chet, C.; Bogdan, I.; Pop, A.I.; Moraru, P.I.; Rusu, T. The Effects of Management (Tillage, Fertilization, Plant Density) on Soybean Yield and Quality in a Three-Year Experiment under Transylvanian Plain Climate Conditions. Land 2021, 10, 200. [Google Scholar] [CrossRef]
  137. Urdă, C.; Suciu, L.; Mureşanu, F.; Păcurar, L.; Tritean, N.; Negrea, A.; Crișan, I.; Rezi, R.; Russu, F.; Tărău, A. Influence of Soil Tillage System, Fertilizer and Treatment Applied to Seeds on Soybean Chemical Composition. Rom. J. Plant Prot. 2021, 14, 17–23. [Google Scholar] [CrossRef]
  138. Jug, I.; Jug, D.; Sabo, M.; Stipešević, B.; Stošić, M. Winter Wheat Yield and Yield Components as Affected by Soil Tillage Systems. Turk. J. Agric. For. 2011, 35, 1–7. [Google Scholar] [CrossRef]
  139. Morris, C.F.; Li, S.; King, G.E.; Engle, D.A.; Burns, J.W.; Ross, A.S. A Comprehensive Genotype and Environment Assessment of Wheat Grain Ash Content in Oregon and Washington: Analysis of Variation. Cereal Chem. 2009, 86, 307–312. [Google Scholar] [CrossRef]
  140. Panasiewicz, K.; Faligowska, A.; Szymanska, G.; Szukała, J.; Ratajczak, K.; Sulewska, H. The Effect of Various Tillage Systems on Productivity of Narrow-Leaved Lupin-Winter Wheat-Winter Triticale-Winter Barley Rotation. Agronomy 2020, 10, 304. [Google Scholar] [CrossRef]
  141. Xu, L.; Tang, G.; Wu, D.; Han, Y.; Zhang, J. Effects of Tillage and Maturity Stage on the Yield, Nutritive Composition, and Silage Fermentation Quality of Whole-Crop Wheat. Front. Plant Sci. 2024, 15, 1357442. [Google Scholar] [CrossRef]
  142. Šíp, V.; Vavera, R.; Chrpová, J.; Kusá, H.; Růžek, P. Winter Wheat Yield and Quality Related to Tillage Practice, Input Level and Environmental Conditions. Soil Tillage Res. 2013, 132, 77–85. [Google Scholar] [CrossRef]
  143. Woźniak, A.; Haliniarz, M. Response of Winter Wheat to 35-Year Cereal Monoculture. Agriculture 2025, 15, 489. [Google Scholar] [CrossRef]
  144. Kerbouai, I.; Sfayhi, D.; Sassi, K.; M’hamed, H.C.; Jenfaoui, H.; Riahi, J.; Arfaoui, S.; Chouaibi, M.; Ben Ismail, H. Influence of Conservation Agriculture on Durum Wheat Grain, Dough Texture Profile and Pasta Quality in a Mediterranean Region. Agriculture 2023, 13, 908. [Google Scholar] [CrossRef]
  145. Peigné, J.; Messmer, M.; Aveline, A.; Berner, A.; Mäder, P.; Carcea, M.; Narducci, V.; Samson, M.F.; Thomsen, I.K.; Celette, F.; et al. Wheat Yield and Quality as Influenced by Reduced Tillage in Organic Farming. Org. Agric. 2014, 4, 1–13. [Google Scholar] [CrossRef]
  146. Buczek, J. Quality and Productivity of Hybrid Wheat Depending on the Tillage Practices. Plant Soil Environ. 2020, 66, 415–420. [Google Scholar] [CrossRef]
  147. Yilmaz, H.; Karatas, R.; Demirel, F.; Soysal, S.; Türkoğlu, A.; Yilmaz, A.; Ciftci, V. Variations in Protein, Gluten, Zeleny Sedimentation and Yield of Certain Wheat (Triticum aestivum L.) Cultivars under Different Climatic Conditions. Euphytica 2024, 220, 1–11. [Google Scholar] [CrossRef]
  148. Eliş, S.; Yıldırım, M. Changes in Quality Components of Durum Wheat Genotypes Under Temperature Stress and Sufficient Rainfall Conditions During the Growth Period. Proc. Bulg. Acad. Sci. 2024, 77, 1888–1898. [Google Scholar] [CrossRef]
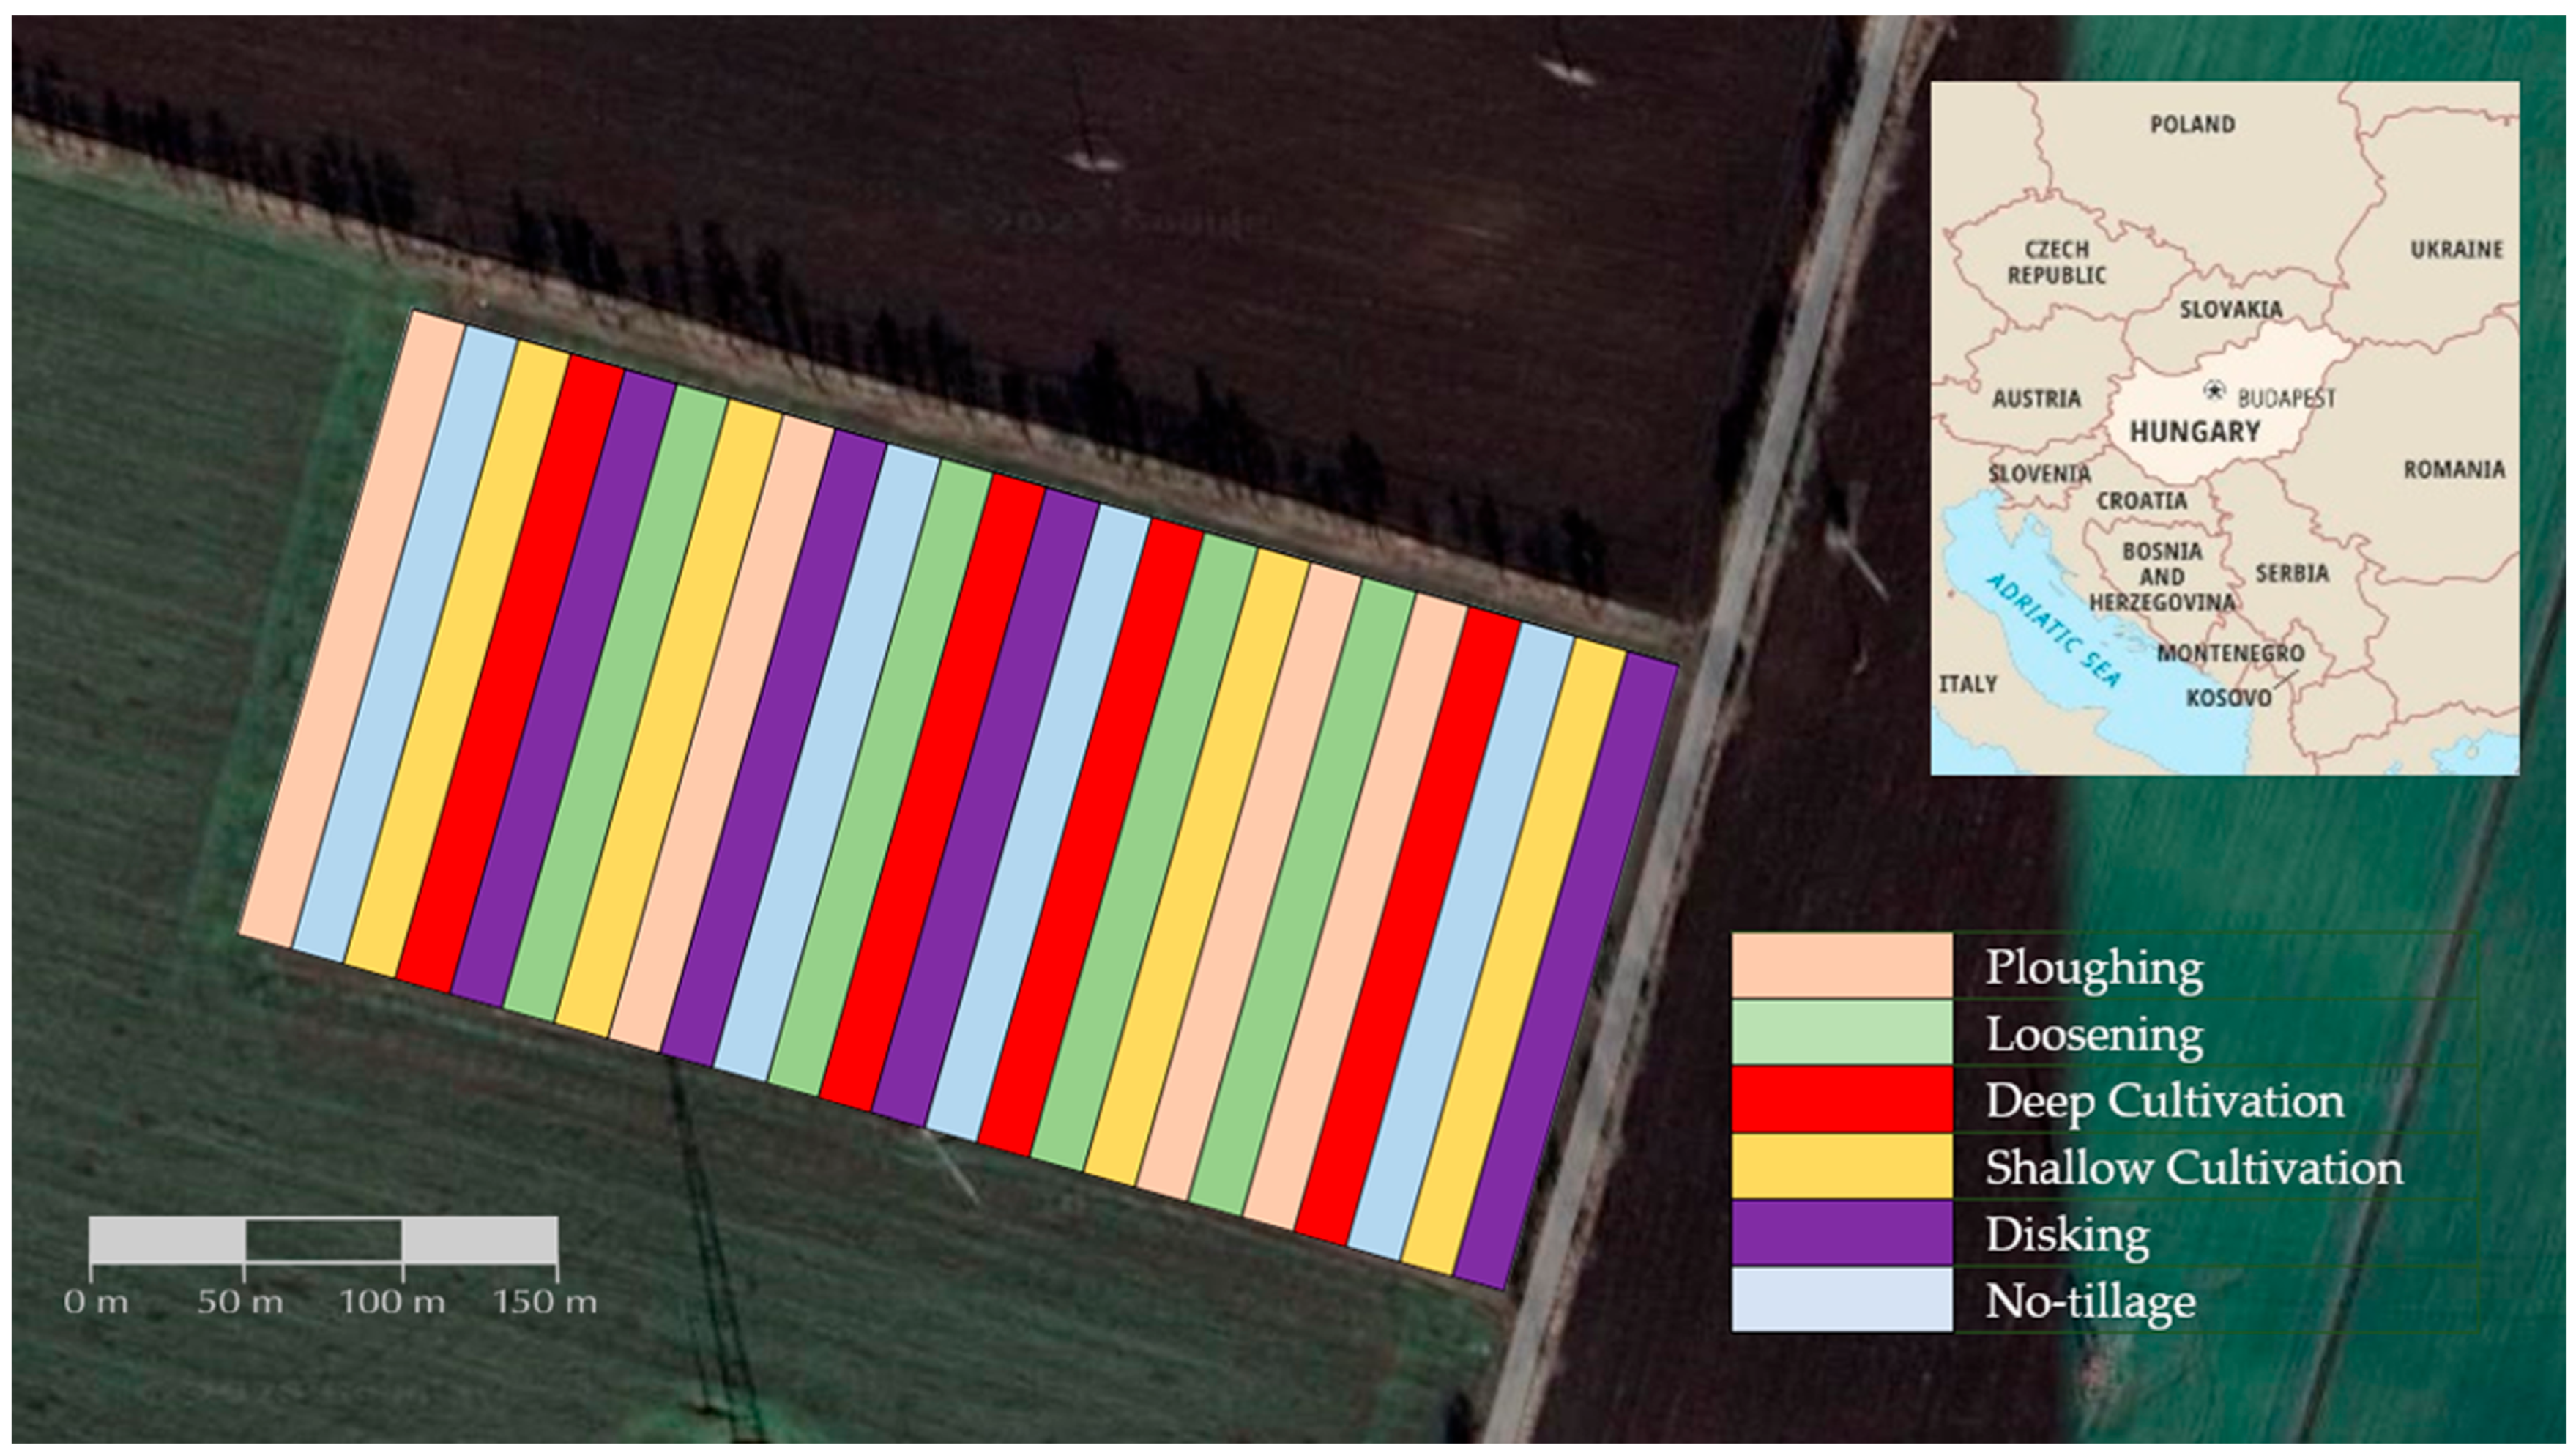
Figure 1. Location of the long-term field experiment at Jozsefmajor (https://earth.google.com/web) (Google LLC, Mountain View, CA, USA) (accessed on 18 April 2025). Source: authors’ work.
Agriculture 15 01810 g001
Figure 2. Monthly precipitation anomalies for the studied period 2022–2024, relative to the 1901–2021 climatological mean for the Hatvan Jozsefmajor site (https://odp.met.hu/climate/homogenized_data/station_data_series/from_1901/) (HungaroMet, Budapest, Hungary) (accessed on 4 August 2025).
Agriculture 15 01810 g002
Figure 3. Monthly mean temperature anomalies for the studied period 2022–2024, relative to the 1901–2021 climatological baseline for the Hatvan Jozsefmajor site (https://odp.met.hu/climate/homogenized_data/station_data_series/from_1901/) (HungaroMet, Budapest, Hungary) (accessed on 4 August 2025).
Agriculture 15 01810 g003
Figure 4. Soil CO2 emissions response to various recording time points throughout the 2022–2024 growing seasons under winter barley, soybean, and winter wheat cropping systems. Monthly soil CO2 emissions (g m−2 h−1) were measured in the years of 2022, 2023, and 2024. Different letters denote a statistically significant difference between treatments p < 0.05, following LSD (Fisher test). They began in order, with the letter (a) being the most significant.
Agriculture 15 01810 g004
Figure 5. Effects of soil tillage practices, including ploughing, shallow cultivation, no-tillage, cultivation, disking, and loosening, on soil CO2 emissions (g m−2 h−1) in winter barley, soybean, and winter wheat crops during the 2022, 2023, and 2024 growing seasons. Different letters denote a statistically significant difference between treatments p < 0.05, following LSD (Fisher test). They begin in order, with the letter (a) being the most significant.
Agriculture 15 01810 g005
Figure 6. The effects of soil tillage, ploughing, shallow cultivation, no-tillage, cultivation, disking, and loosening on LAI in winter barley, soybean, and winter wheat crops during the 2022, 2023, and 2024 cropping seasons, respectively. Different letters denote a statistically significant difference between treatments p < 0.05, following LSD (Fisher test). They begin in order, with the letter (a) being the most significant.
Agriculture 15 01810 g006
Figure 7. The effects of soil tillage methods, including ploughing, shallow cultivation, no-tillage, cultivation, disking, and loosening, on SPAD value in winter barley, soybean, and winter wheat crops during 2022, 2023, and 2024 cropping seasons, respectively. Different letters denote a statistically significant difference between treatments, p < 0.05, following LSD (Fisher test). They begin in order, with the letter (a) being the most significant.
Agriculture 15 01810 g007
Figure 8. Effects of different soil tillage methods, including ploughing, shallow cultivation, no-tillage, cultivation, disking, and loosening, on grain yield in winter barley, soybean, and winter wheat crops during 2022, 2023, and 2024 cropping seasons, respectively. Different letters denote a statistically significant difference between treatments, p < 0.05, following LSD (Fisher test). They begin in order, with the letter (a) being the most significant.
Agriculture 15 01810 g008
Figure 9. Effects of soil tillage methods, including ploughing, shallow cultivation, no-tillage, cultivation, disking, and loosening, on protein content in winter barley, soybean, and winter wheat crops during the 2022, 2023, and 2024 cropping seasons, respectively. Different letters denote a statistically significant difference between treatments, p < 0.05, following LSD (Fisher test). They begin in order, with the letter (a) being the most significant.
Agriculture 15 01810 g009
Figure 10. Effects of soil tillage methods, including ploughing, shallow cultivation, no-tillage, cultivation, disking, and loosening, on oil content in soybean crop during the 2023 cropping season, respectively. Different letters denote a statistically significant difference between treatments, p < 0.05, following LSD (Fisher test). They begin in order, with the letter (a) being the most significant.
Agriculture 15 01810 g010
Figure 11. Effects of soil tillage methods, including ploughing, shallow cultivation, no-tillage, cultivation, disking, and loosening, on gluten content and Zeleny index in winter wheat crops during the 2024 cropping season, respectively. Different letters denote a statistically significant difference between treatments p < 0.05, following LSD (Fisher test). They begin in order, with the letter (a) being the most significant.
Agriculture 15 01810 g011
Table 1. Soil chemical, physical, and biological characteristics in the Hatvan Jozsefmajor long-term experimental site.
TraitsValuesUnits
Soil ComponentsClay350g kg soil−1
Sand230
Silt420
Soil TextureClay loam-
Bulk Density1.56g cm−3
Organic Matter3.04g kg soil−1
Soil pH (KCl)4.83-
Available IonsN57.20mg kg−1 soil
P175.49
K211.55
Table 2. Land use effect on soil chemical properties in 2024.
Tillage TreatmentSoil Depth
cm
pH (KCl)Soil Organic Matter
g kg −1
Nitrite + Nitrate
(KCl-Extractable)
mg kg−1
Phosphorus-Pentoxide
(AL-Extractable)
mg kg−1
Potassium-Oxide
(AL-Extractable)
mg kg−1
Disking0–104.533.768.37314.00312.50
10–204.723.116.53215.00228.75
20–304.922.916.12164.25194.00
30–405.392.7614.30146.38197.25
Shallow Cultivation0–104.703.264.21226.50251.00
10–204.703.044.33209.00209.00
20–304.892.905.18171.25196.50
30–405.092.746.29141.25182.25
Deep Cultivation0–104.583.335.29211.50237.25
10–204.573.215.09177.25198.25
20–304.673.005.97147.75179.75
30–404.882.866.57153.75214.25
No-tillage0–104.403.764.66303.50295.50
10–204.593.317.51193.25219.00
20–304.853.0411.33167.00208.00
30–405.212.7414.05124.35185.50
Loosening0–104.813.253.75183.75233.00
10–204.843.104.02162.25204.00
20–304.892.924.09149.25194.25
30–405.072.645.12101.90181.75
Ploughing0–105.012.932.64142.25204.25
10–204.942.873.15145.50188.50
20–305.042.853.49146.50189.75
30–404.972.853.71149.00184.00
Table 3. Analysis of variance (ANOVA) for the Leaf Area Index (LAI) of winter barley, soybean, and winter wheat crops during 2022, 2023, and 2024 growing seasons.
Source of VariationsLAI
202220232024
df555
Mean Square0.720.7810.48
F-value2.500.408.66
p-value0.0520.847<0.001
df is the degree of freedom; LAI is the Leaf Area Index; p-value is the probability value at α = 0.05.
Table 4. Analysis of variance for SPAD values of winter barley, soybean, and winter wheat crops during the 2022, 2023, and 2024 growing seasons.
Source of VariationsSPAD
202220232024
df555
Mean Square71.92135.05210.18
F-value2.102.321.25
p-value0.0930.0490.288
df is the degree of freedom; LAI is the Leaf Area Index; p-value is the probability value at α = 0.05.
Table 5. Analysis of variance (ANOVA) for grain yield of winter barley, soybean, and winter wheat crops during the 2022, 2023, and 2024 growing seasons.
Tillage Treatments
Dependent VariablesdfMean SquareF-Valuep-Value
Winter Barley Yield (t ha−1) 5 0.79 6.07 0.002
Soybean Yield (t ha−1)5 0.07 0.85 0.530
Winter Wheat Yield (t ha−1) 5 1.34 4.52 0.008
df is the degree of freedom; t ha−1 is the yield measured as a ton per hectare; and p-value is the probability value at α = 0.05.
Table 6. Analysis of variance (ANOVA) for grain components of winter barley, soybean, and winter wheat crops during 2022, 2023, and 2024 growing seasons.
Tillage Treatments
Dependent VariablesdfMean SquareF-Valuep-Value
Protein (%) content of winter barley 5 0.44 10.89 <0.001
Protein (%) content of soybean54.186.60<0.001
Oil (%) content of soybean50.752.540.037
Protein (%) content of winter wheat 5 0.39 3.59 0.020
Gluten (%) of winter wheat 5 5.85 4.57 0.007
Zeleny index (%) of winter wheat 5 46.12 7.32 <0.001
df is the degree of freedom, and p-value is the probability value at >0.05.
Disclaimer/Publisher’s Note: The statements, opinions and data contained in all publications are solely those of the individual author(s) and contributor(s) and not of MDPI and/or the editor(s). MDPI and/or the editor(s) disclaim responsibility for any injury to people or property resulting from any ideas, methods, instructions or products referred to in the content.