Article

Research on Delineation and Assessment Methods for Cultivated Land Concentration and Contiguity in Southeastern China

1
Chinese Academy of Surveying and Mapping, Beijing 100036, China
2
Department of Natural Resources Survey and Monitoring, Ministry of Natural Resources, Beijing 100812, China
3
Shanxi Institute of Surveying Mapping and Geoinformation, Taiyuan 030001, China
4
Yunnan Provincial Geomatics Center, Kunming 650034, China
5
Hubei Provincial Geographic National Conditions Monitoring Center, Wuhan 430060, China
6
Guangdong Provincial Institute of Land and Resources Surveying and Mapping, Guangzhou 510663, China
7
Anhui Provincial Basic Surveying and Mapping Information Center, Hefei 230031, China
*
Author to whom correspondence should be addressed.
Agriculture 2025, 15(17), 1803; https://doi.org/10.3390/agriculture15171803 (registering DOI)
Submission received: 10 June 2025 / Revised: 17 August 2025 / Accepted: 19 August 2025 / Published: 23 August 2025
(This article belongs to the Section Agricultural Technology)

Abstract

Cultivated land concentration and contiguity, as a core element of agricultural modernization development, holds strategic significance for enhancing agricultural production efficiency and ensuring national food security. This study employs vector patches as research units and classifies spatial connections between patches into direct and indirect connections. We quantify six types of spatial relationships between patches using binary encoding, enabling precise delineation of concentrated contiguous cultivated land. A Patch Connectivity Index is proposed. Combined with the Patch Area Index and Patch Shape Index, an evaluation system for cultivated land concentration and contiguity is established. Using Suixi County as a case study, we investigate the spatiotemporal evolution of its cultivated land concentration and contiguity from 2019 to 2023. Overall, patch connectivity exhibits a “single-element dominant, multi-element complementary” structural pattern, while the evaluation grading of cultivated land concentration and contiguity follows a normal distribution. Between 2019 and 2023, the average patch area decreased while the average number of connections between patches increased, indicating significant improvement in cultivated land concentration and contiguity levels. By adjusting spatial relationships between patches, the effective integration and utilization of cultivated land resources can provide theoretical foundations and practical references for agricultural modernization development.

1. Introduction

As a core element of agricultural production, cultivated land constitutes a strategic resource for maintaining national food security and regional sustainable development [1,2]. This necessitates more rigorous requirements for cultivated land protection, including the implementation of stringent measures to enforce farmland preservation. While advancing the rule of law comprehensively and safeguarding food security, it remains imperative to uphold the strictest cultivated land protection system. Concurrently, the demand for grain has increased significantly with population growth [3,4]. This rapid escalation exerts substantial pressure on finite land resources, resulting in reduced per capita cultivated land area and posing significant challenges to food security [5]. Under these circumstances, integrating fragmented cultivated land resources and promoting contiguous cultivated land consolidation emerge as critical pathways to enhance land use efficiency, reinforce the foundation of food security, and drive the transformation towards agricultural modernization [6].
Globally, China ranks third in total cultivated land resources, following India and the United States, yet confronts challenges of suboptimal land quality and insufficient reserves [7,8]. Despite achieving sustained growth in grain production through advanced agricultural technologies and policy support, with total output leading globally in 2023, its per capita cultivated land area remains critically low at <0.001 km2, significantly below the global average [9]. More critically, China’s cultivated land resources face multidimensional challenges; ecological degradation affects >40% of total arable land area, while anthropogenic drivers (e.g., construction land expansion through cropland conversion) and natural constraints (e.g., complex topographic relief) have intensified fragmentation. The Third National Land Survey reveals ~130,000 km2 of fragmented cultivated land, accounting for 10% of total cultivated land area, which severely restricts mechanized farming and scaled operations, thereby emerging as a key bottleneck for yield enhancement [10,11,12]. Since the 18th National Congress of the Communist Party of China incorporated ecological civilization into the national strategic framework, the Chinese government has established a comprehensive cultivated land protection policy system [13]. Institutionally, the Land Administration Law and related regulations have delineated permanent basic farmland, placing premium cropland under permanent protection. Operationally, significant progress has been made in high-standard farmland construction, with over 666,666.67 km2 cumulatively developed during 2019–2023. Concurrently, the requisition–compensation balance system has been refined to establish a tripartite protection mechanism integrating “quantity, quality, and ecology” [14,15,16]. However, accelerated urbanization and industrialization have driven a net loss of 7.53 km2 of cultivated land between the Second and Third National Land Surveys (https://www.gov.cn/xinwen/2021-08/26/content_5633497.htm, accessed on 20 April 2025). Meanwhile, cultivated land abandonment persists in ecologically constrained regions and areas experiencing labor outmigration [17]. Regarding grain production patterns, the 2023 grain crop sown area reached over 1,180,000 km2, constituting 69.3% of total agricultural sown area. Specifically, rice, wheat, and maize—the three staple crops—collectively accounted for 81.4% of grain crop area and 79.2% of total cultivated land [18,19]. Over the past decade, the sown area of grain crops has exhibited a fluctuating trajectory marked by an initial decline followed by gradual stabilization and recent recovery. Nevertheless, sustaining stable grain production remains challenging amid tightening constraints on cultivated land resources [20]. These realities underscore cultivated land concentration and contiguity as a pivotal strategy for addressing China’s dual challenges of land conservation and food security [21,22]. Defined as spatially aggregated cultivated land parcels with pronounced scale effects, such configurations not only align with high-standard farmland construction requirements but also optimize land use patterns to reduce production costs, enhance efficiency, and strengthen systemic resilience—critical mechanisms for safeguarding national food security and driving agricultural modernization.
The delineation of concentrated contiguous areas was initially designed for prime farmland protection, utilizing spatial connectivity algorithms, fuzzy texture quantification, and prime farmland protection indices within ArcGIS 10.2 to assess spatial contiguity through raster data processing for graded agricultural land [23]. However, spatial connectivity algorithms demonstrate strong generalizability in characterizing agricultural land quality gradients while failing to adequately capture detailed spatial adjacency characteristics of land parcels [24]. Fuzzy texture quantification requires complex data acquisition and processing workflows, lacking capacity to derive direct indicators of holistic contiguity. Moreover, the prime farmland protection index method exhibits computational redundancy and semantic ambiguity, where the determination of indicator weights lacks standardized criteria, ultimately compromising result objectivity and comparability. Recent land-use planning mandates for prime farmland have necessitated the development of GIS-based contiguity analysis systems employing uniform/non-uniform grids under quality constraints of contiguous parcels [25,26]. While non-uniform grids alleviate data redundancy and representational inaccuracies inherent in uniform grid systems, their threshold determination poses significant technical challenges [27]. To meet large-scale mechanization demands, object-based segmentation approaches have been adopted to delineate consolidated agricultural management parcels through cultivated land patch optimization [28], effectively facilitating land circulation to safeguard national food security. Nevertheless, refinement of scale selection and parameter calibration in segmentation algorithms remains imperative to enhance spatial precision and operational accuracy. Current research predominantly employs raster-based spatial analysis for cultivated land, which effectively captures macro-scale distribution patterns but demonstrates limitations in delineating parcel-level spatial morphology and precise localization [29,30]. In contrast, vector parcel data preserves spatial topology and geometric attributes of land parcels, exhibiting superior capability in quantitative analysis of cultivated land spatial configuration [31].
Although China’s cultivated land protection policies increasingly emphasize quality improvement and consistently strengthen the focus on cultivated land concentration and contiguity [32,33], current research on this topic still faces several unresolved issues. The main problems include ambiguous spatial delineation criteria for concentrated contiguous cultivated land, lacking scientific and quantitative identification standards, and the predominance of qualitative analysis in existing evaluation methods, resulting in poor comparability of assessment outcomes. Addressing these issues can significantly enrich the technical approaches and methodologies for studying cultivated land concentration and contiguity, enhancing the rationality and scientific rigor of such research, thereby providing a valuable theoretical underpinning for guiding the delineation of cultivated land concentration and contiguity.
Located on the southern periphery of mainland China, Guangdong Province belongs to the Guangxi–Guangdong Hills sub-region of the Southeastern Hilly Region, characterized by gentle topography and a resource distribution pattern of “70% mountains, 10% water, and 20% farmland” [34]. As a typical region with acute human–land conflicts, its cultivated land resources face severe constraints; per capita arable land area stands at merely 0.00015 km2, less than 20% of the national average, while cultivable reserve resources total 627.13 km2, exhibiting spatial dispersion and significant development constraints [35,36]. Under these dual pressures of rapid urbanization and limited reserve resources, cultivated land preservation and sustainable utilization confront critical challenges [37]. Guangdong has proactively implemented land consolidation initiatives to address fragmentation issues, progressively enhancing spatial contiguity and optimizing cultivated land spatial configuration [38].
This study selects Suixi County in Guangdong Province as a representative research area. Utilizing data from the Third National Land Survey and land change surveys, we employ vector patches as fundamental research units. By defining connecting element types and width thresholds between plots, we analyze spatial relationships and develop a classification coding system, thereby conducting precise delineation and comprehensive evaluation of cultivated land concentration and contiguity using Geographic Information System technology. This approach aims to provide new methodological perspectives for spatial optimization of cultivated land resources.

2. Materials and Methods

2.1. Study Area

Suixi County, renowned as the “granary and fishery hub” of South China, is administratively affiliated with Zhanjiang City in Guangdong Province (Figure 1). Situated on the Leizhou Peninsula (109°40′–110°25′ E, 21°00′–21°30′ N) bordering the South China Sea, the county features a platform-dominated terrain with gentle elevation variation (20–45 m), characterized by higher central areas and low hills in the northeast. The region experiences a tropical marginal maritime climate with annual precipitation averaging 1620 mm (http://gd.cma.gov.cn/zjsqxj/zwgk_2986/gggs_2995/202404/t20240412_6194218.html, accessed on 6 May 2025), predominantly concentrated from June to September, exhibiting an east–west precipitation gradient. According to the Third National Land Resource Survey (2019), Suixi County encompasses a total area of 2120 km2, with cultivated land occupying 920 km2 (43.53% of total area). Agricultural statistics indicate 445 km2 of grain crop sown area yielding 237,800 metric tons annually (http://www.suixi.gov.cn/zwgk/tjsj/content/post_1461914.html, accessed on 6 May 2025). The geographical location and land use map of Suixi County, Guangdong Province, China, is presented in Figure 1. The DEM data were derived from the ASTGTM V003 dataset—a product developed through a collaboration between the National Aeronautics and Space Administration (NASA), Washington, DC, USA, and the Ministry of Economy, Trade and Industry (METI), Tokyo, Japan—obtained from the Geospatial Data Cloud (https://www.gscloud.cn/, accessed on 12 May 2025) at 30 m resolution. The land use data were obtained from the GlobeLand30 (2020) dataset provided by the National Geomatics Center of China (NGCC), Beijing, China (https://www.webmap.cn/mapDataAction.do?method=globalLandCover, accessed on 14 May 2025), which also has a spatial resolution of 30 m.

2.2. Data Sources

The geospatial datasets utilized in this study originate from China’s Third National Land Survey (hereafter “TNLS”; 2019) and the National Land Change Survey (hereafter “NLCS”; 2023), acquired through standardized investigation protocols established by the Ministry of Natural Resources (MNR). The TNLS employed satellite remote-sensing imagery with spatial resolution exceeding 1 m to generate survey base maps. Annually, the MNR coordinates NLCS to collect patches exhibiting ≥200 m2 area changes, conduct nationwide field verification, update TNLS datasets, and produce authoritative land category vector datasets. Consequently, NLCS data constitute the authoritative annually revised geospatial information derived from the foundational TNLS dataset.
The land classification schema of the TNLS adheres to Technical Regulation of the Third Nationwide Land Survey (TD/T 1055-2019) [39]. This standard encompasses critical datasets utilized in this study, including cultivated land, ditches, rural roads, highways, rivers, and county-level administrative boundaries. Using the “Select By Attributes” tool in ArcGIS 10.2, vector data layers were extracted by filtering feature attributes for cultivated land, ditches, rural roads, paved roads, and rivers. These layers constitute foundational datasets for subsequent analyses. Furthermore, the TNLS database includes dedicated repositories for county-level administrative boundaries.

2.3. Methods

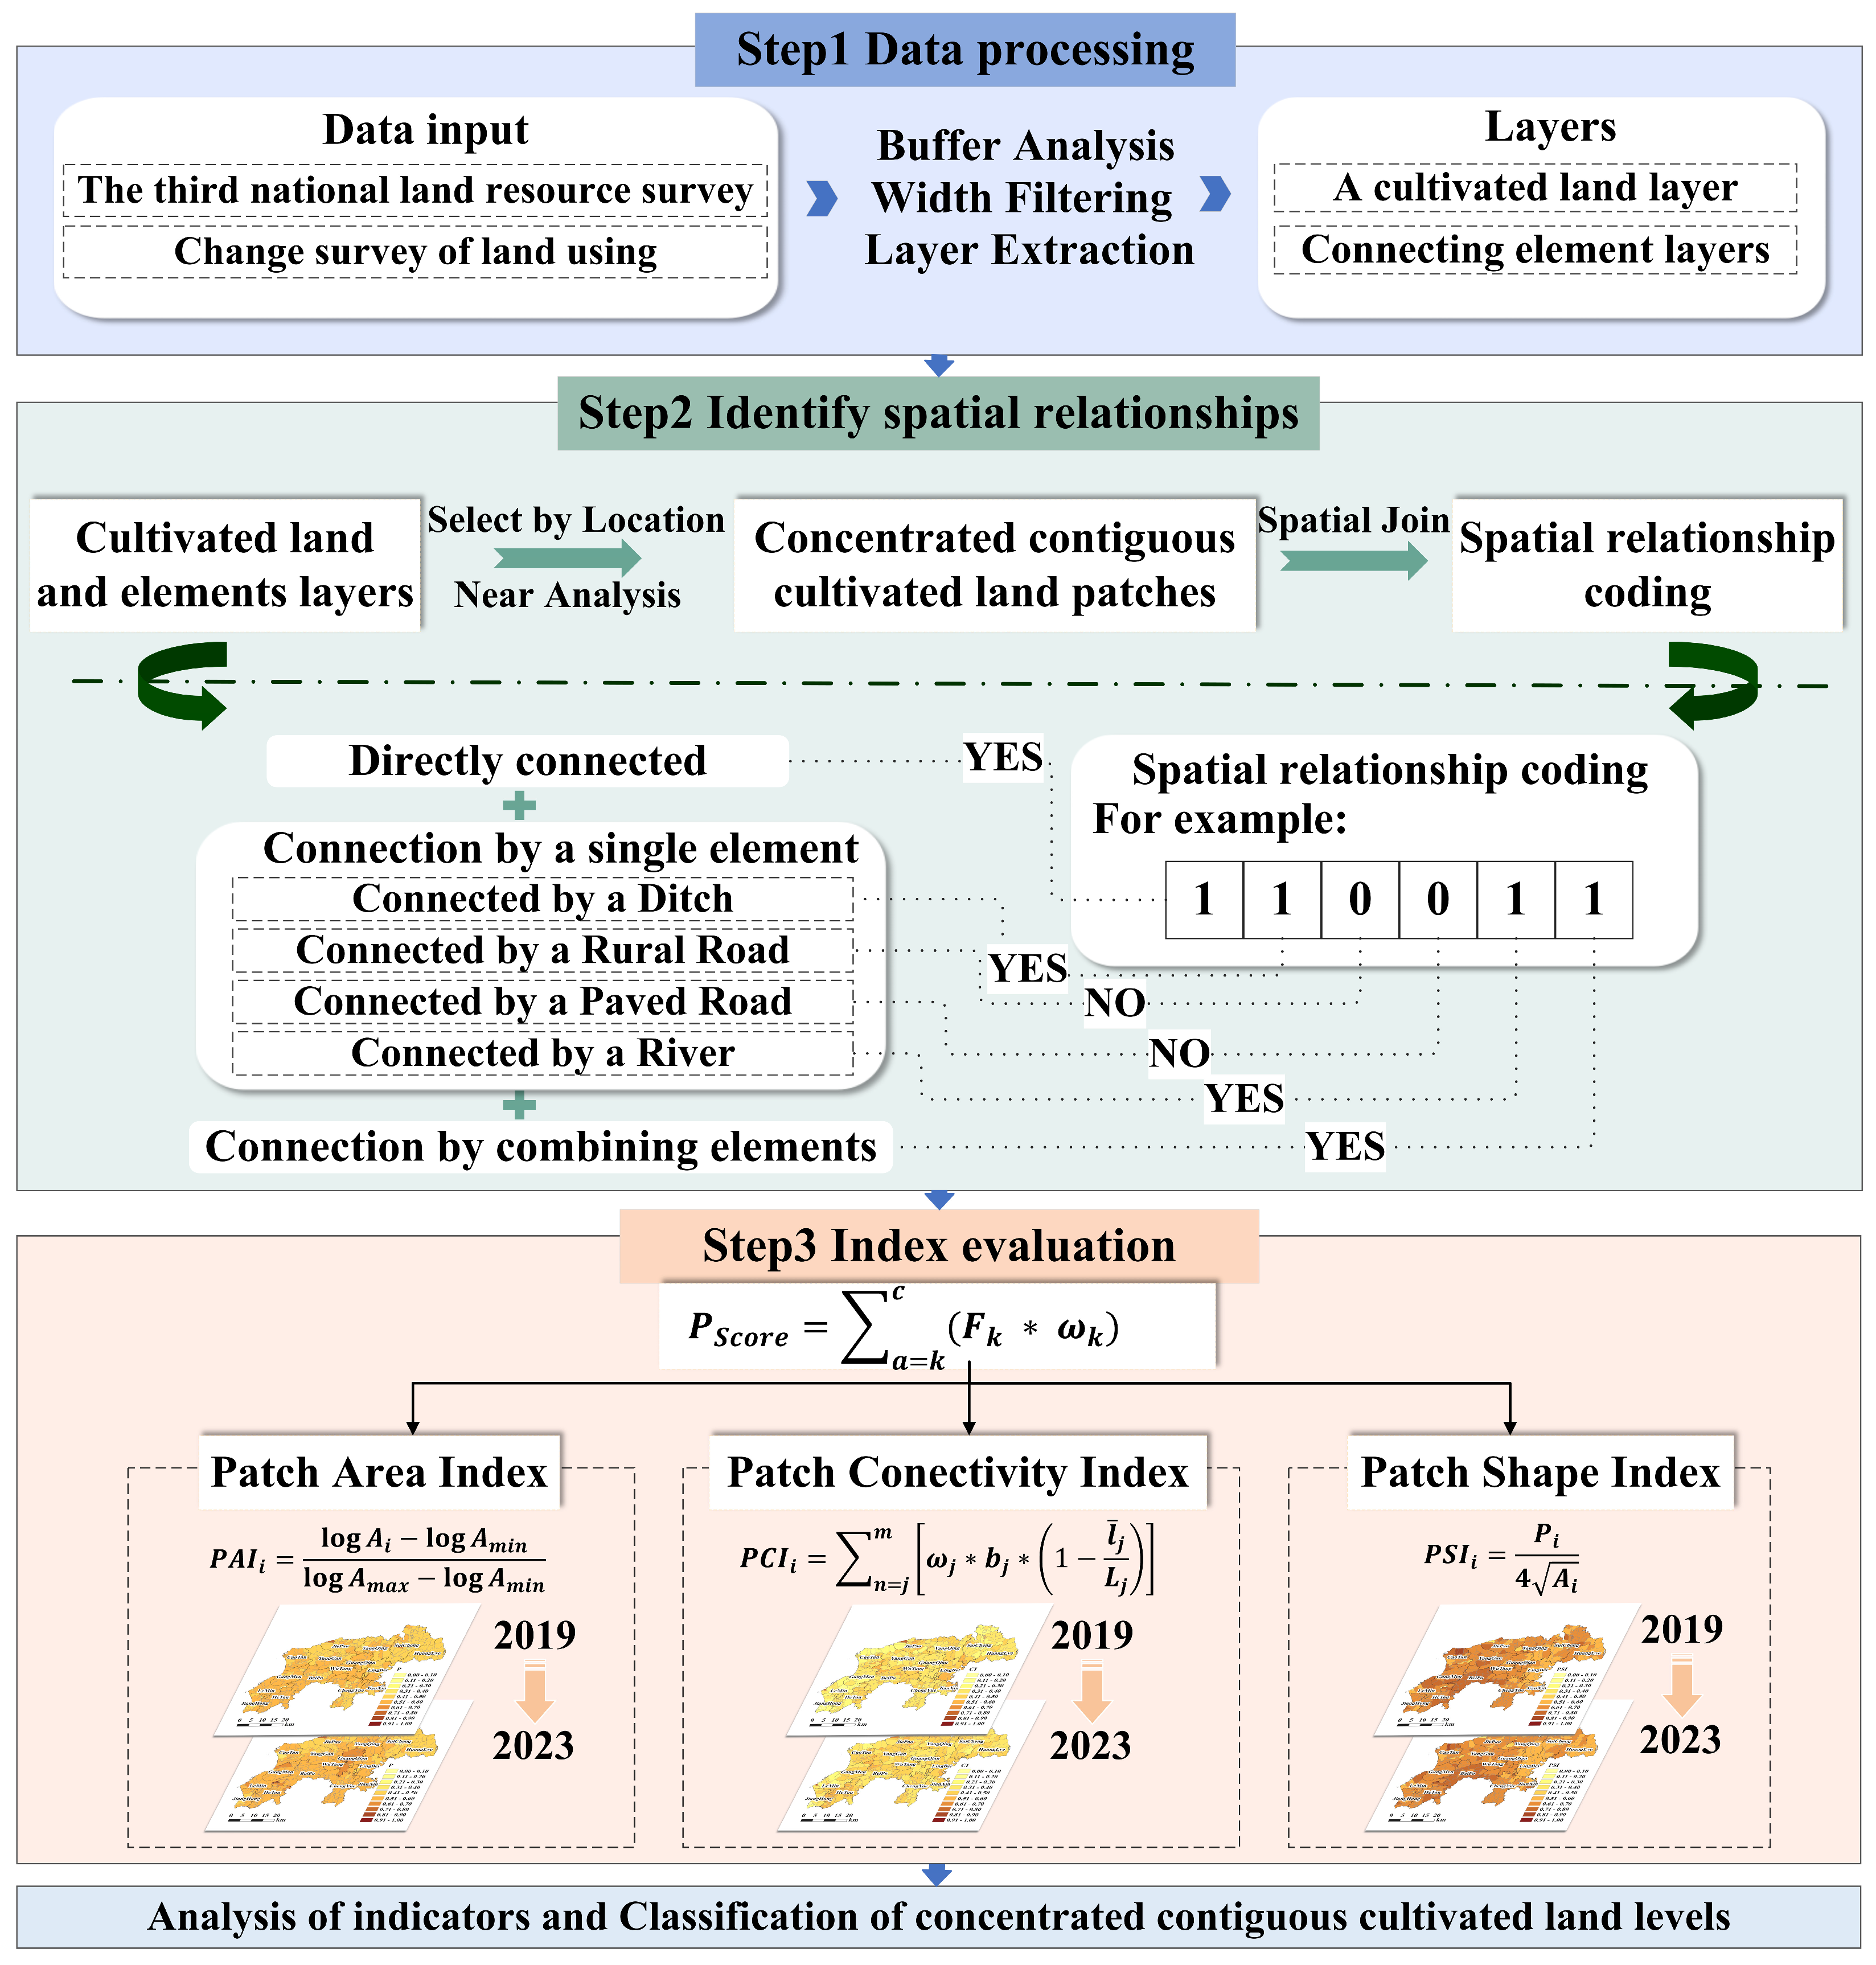
This study investigates cultivated land concentration and contiguity through spatial relationship analysis between land parcels, deliberately transcending administrative boundary-induced spatial fragmentation [40]. The methodology involves two critical phases: (1) identification and binary coding of inter-patch spatial relationship types and (2) comprehensive evaluation integrating connectivity patterns with intrinsic patch attributes (area and shape index). The operational workflow (Figure 2) generates hierarchical contiguity classifications, enabling systematic spatial optimization of cultivated land resources.

2.3.1. Related Definitions and Regulations

Concentrated contiguous cultivated land patches are defined as spatially aggregated parcels where inter-patch distances fall below specified thresholds, either through direct adjacency or via connecting elements. Direct connectivity occurs when parcels share common boundaries or boundary points [41], whereas indirect connectivity involves traversable barrier units (i.e., connecting elements) with intervening distances below critical width thresholds [42].
The construction of high-standard farmland, characterized by “grid-patterned fields with integrated road and irrigation networks,” significantly enhances cultivated land concentration and contiguity through systematic infrastructure development (http://www.moa.gov.cn/xw/qg/202401/t20240116_6445762.htm, accessed on 19 May 2025). According to the National Standard for High-standard Farmland Construction [43], field parcels are defined as basic tillage units demarcated by terminal fixed ditches, canals, and roads to meet agricultural operational requirements. Irrigation systems prioritize surface water sources (rivers/canals) supplemented by groundwater, employing strategic water storage and diversion methods. Therefore, rural roads, ditches, paved road, and rivers are selected as connecting elements for indirect connections between cultivated land plots, with their combinations also serving as connecting elements, termed composite elements.
According to the Technical Specifications for the Generalization of National Land Survey Data (TD/T 1076-2023) [44], which stipulates a minimum patch width and minimum spacing of 0.4 mm on the map (equivalent to 20 m in real-world distance under the 1:50,000 scale) as specified in the technical indicators for national land survey data generalization, 20 m was determined as the maximum width threshold for identifying contiguous cultivated land patches. Rural roads are defined as transportation routes serving inter-village and field operations, existing outside the national local road network system and primarily functioning to support agricultural production. Following the National High-standard Farmland Construction Plan (2021–2030) (hereinafter referred to as “the Plan”) approved by the State Council in 2021, the width of farm machinery roads should preferably range between 3 and 6 m, with permissible expansion in large-scale mechanized operation areas. To facilitate mechanized management, the maximum width of rural roads was set at less than 6 m based on the upper limit specified in the plan. Field investigations indicate that ditch widths should generally not exceed 5 m. In accordance with the Technical Standard of Local Road Engineering (JTG B01-2014) [45], while expressways and first-class local roads require median strips and second-class local roads should install them, fourth-class local roads (designed for 30 km/h speed with two-lane configuration) typically maintain a maximum pavement width of 7 m (including travel lanes and shoulders) without median strips. Therefore, paved road widths were constrained to less than 7 m for farmland management convenience. For naturally formed rivers serving as connecting elements between cultivated land parcels, the width threshold was similarly set at 20 m. The composite width threshold for any combination comprising two or more connecting elements (including rural roads, ditches, paved road, and rivers) was established at 20 m, requiring each constituent element to simultaneously satisfy its individual width constraints.
Field reconnaissance conducted in 2024 (Figure 3) confirmed that the typological classification and width thresholds established for connecting elements not only ensure agricultural machinery accessibility and field management feasibility but also define the maximum width criterion for delineating concentrated contiguous cultivated land parcels.

2.3.2. Data Processing

Taking Suixi County, Zhanjiang City, Guangdong Province, as the study area, buffer analysis was conducted to extract spatial relationships between cultivated land patches and other layers (including canals, rural roads, paved road, rivers, and composite elements), eliminating administrative boundary-induced fragmentation. Eligible connecting elements were filtered based on predefined width thresholds, with the composite element width calculated using:
d = 2 S / D ,
Here,   d denotes the element width (m); S represents the element area (m2); and D indicates the element perimeter (m).
Spatial relationships between plots are classified into direct connections, indirect connections, and disconnections. Indirect connections include four types: plot linkages via ditches, rural roads, paved roads, or composite elements. This study develops a six-digit spatial coding system to characterize inter-plot spatial relationships, which simplifies and directly represents connection modalities. This encoding employs binary digits (0 or 1) to indicate the presence or absence of specific connecting elements between patches, with each digit sequentially corresponding to a distinct connection type. The spatial code comprises six digits, each representing a particular connectivity modality defined as follows:
  • First digit: Indicates direct adjacency between patches (1 denotes direct connection, 0 signifies no direct contact);
  • Second digit: Represents connectivity through irrigation ditches (as connecting elements);
  • Third digit: Signifies linkage via rural roads (as connecting elements);
  • Fourth digit: Denotes connection through paved road (as connecting elements);
  • Fifth digit: Indicates connectivity via river systems (as connecting elements);
  • Sixth digit: Indicates composite element connectivity between patches.
In this experimental design, plots are defined as completely disconnected when either (1) inter-patch distances exceed 20 m or (2) distances range between 0 and 20 m but lack connecting elements. A modeling framework is implemented by using Geographic Information System technology: (1) Direct connections between cultivated land patches are identified through proximity analysis of the cultivated land layer with zero-meter distance constraints; (2) Indirect connections are established by filtering connecting elements (ditches < 5 m, rural roads < 6 m, paved roads < 7 m, rivers < 20 m, composite elements < 20 m) and spatially selecting adjacent cultivated land patches. For each element type, proximity analysis is conducted using element-specific width thresholds, followed by spatial relationship encoding. Finally, spatial joins between resultant layers and connecting element layers integrate attribute data (e.g., element widths).

2.3.3. Spatial Relationship Evaluation

The Patch Connectivity Index (PCI) quantitatively characterizes the connectivity level between cultivated land patches. Based on spatial coding derived from spatial connectivity relationships between patches, this index evaluates inter-patch connectivity by quantifying the influence of connecting element types and their widths on spatial connectivity. PCI more authentically reflects the actual connectivity efficiency between patches [46]. Well-established connectivity relationships between patches help maintain the healthy development of farmland ecosystems, promote rational allocation and optimization of agricultural production factors, and facilitate the realization of sustainable agricultural development [47,48,49]. This study employs an integrated approach combining the Analytic Hierarchy Process (AHP) and entropy weight method [50] to determine weight coefficients for different connecting elements, subsequently calculating the weighted PCI through the following formula:
P C I i = n = j k ω j b j 1 l ¯ j / L j
Here, P C I i represents the Patch Connectivity Index score for the i patch; ω j denotes the resistance weight of the j -th connecting element contributing to concentrated contiguous cultivated land formation; b j denotes the encoded value for the j-th type of connecting element within the spatial relationship encoding of the patch; l ¯ j indicates the average width (m) of the j -th connecting element within the patch; and L j signifies the width threshold (m) of the j -th connecting element. A higher P C I i value reflects stronger connectivity between the target patch and surrounding patches, indicating enhanced capacity for material, energy, and information flows. This parameter serves as a positive indicator in the evaluation system.

2.3.4. Integrated Contiguity Assessment

Incorporating both spatial relationships and intrinsic patch characteristics, the PCI integrates the Patch Area Index (PAI) [51] and Patch Shape Index (PSI) [52] as evaluation metrics. The combined weighting method was employed to determine indicator weights (Table 1). Standardized scores of these metrics were subsequently weighted to derive the evaluation results of cultivated land concentration and contiguity within the study area. The specific weight determination method is as follows.
(1) Analytic Hierarchy Process (AHP)
(a)
Construct pairwise comparison matrix
The AHP effectively quantifies qualitative problems. It calculates the weight values of indicators or factors within one level relative to those at the upper level using the maximum eigenvalue and the corresponding eigenvector of a pairwise comparison matrix [53]. This pairwise comparison matrix B = b i j m m is constructed using a scale of Arabic numerals 1 to 9 and their reciprocals. The weights are derived from the eigenvector, calculated as:
B W = λ m a x W
Here, λ m a x is the maximum eigenvalue of the pairwise comparison matrix, B is the hierarchical pairwise comparison matrix, and W is the weight vector. In this study, the order of importance, from highest to lowest, is PAI, PCI, and PSI. The fundamental scale for pairwise comparisons (Table 2) follows Saaty’s AHP framework where a value of 5 indicates element i is strongly more important than j .
(b)
Perform consistency verification
To avoid bias in the weight vector, a consistency check is performed on the pairwise comparison matrix. Two consistency indices are introduced: the Consistency Index (CI), which measures the deviation of the pairwise comparison matrix, and the Random Consistency Index (RI). The RI value can be obtained from a lookup table.
C I = λ m a x m / m 1
C R = C I   /   R I
Here, λ m a x denotes the maximum eigenvalue of the pairwise comparison matrix and m represents its order. CR is the consistency ratio. If CR < 0.1, the pairwise comparison matrix passes the consistency check; otherwise, the assignment of values in the pairwise comparison matrix must be appropriately revised until it meets this criterion.
(2) Entropy Weight Method (EWM)
In information theory, entropy quantifies the inherent disorder of a system and the uncertainty of indicator variation [54]. The fundamental steps of the EWM are as follows, where j = 1, …, p ; i = 1, 2, …, n .
(a)
First, an initial evaluation matrix is constructed using p objects and n indicators:
X = x j i p n
(b)
Second, based on the specific indicator type, the evaluation matrix X undergoes positive or negative directional standardization.
Positive directional standardization:
s j i = x j i m i n x 1 i , , x p i m a x x 1 i , , x p i m i n x 1 i , , x p i
Negative directional standardization:
s j i = m a x x 1 i , , x p i x j i m a x x 1 i , , x p i m i n x 1 i , , x p i
(c)
Then, the information entropy F i for each indicator is calculated:
F i = 1 ln p j = 1 p U j i ln U j i
U j i = s j i i = 1 n s j i
(d)
Finally, the entropy weight for each indicator is determined:
ω = E i i = 1 n E i
E i = 1 F i
(3) Combined Weighting Method (CWM)
To comprehensively determine the final weights, a linear combination method is employed to compute the combined weights. The subjective weight ω′ is derived from the AHP, while the objective weight ω″ is determined using the EWM.
d ω i , ω i = 1 2 i = 1 n ω i ω i 2 1 2
The combined weight coefficient ω i is calculated as ω i = α ω i + β ω i , where α and β are combination coefficients satisfying the constraints d ω i , ω i 2 = α β 2 and α + β = 1 .

3. Results

The evaluation results of individual indicators were obtained by calculating patches in Suixi County using the PCI, PAI, and PSI, respectively. Subsequently, a comprehensive assessment of cultivated land concentration and contiguity was conducted based on these individual evaluations, classifying the outcomes into five distinct tiers.

3.1. Spatiotemporal Distribution Characteristics of Indices

3.1.1. Patch Connectivity Index (PCI)

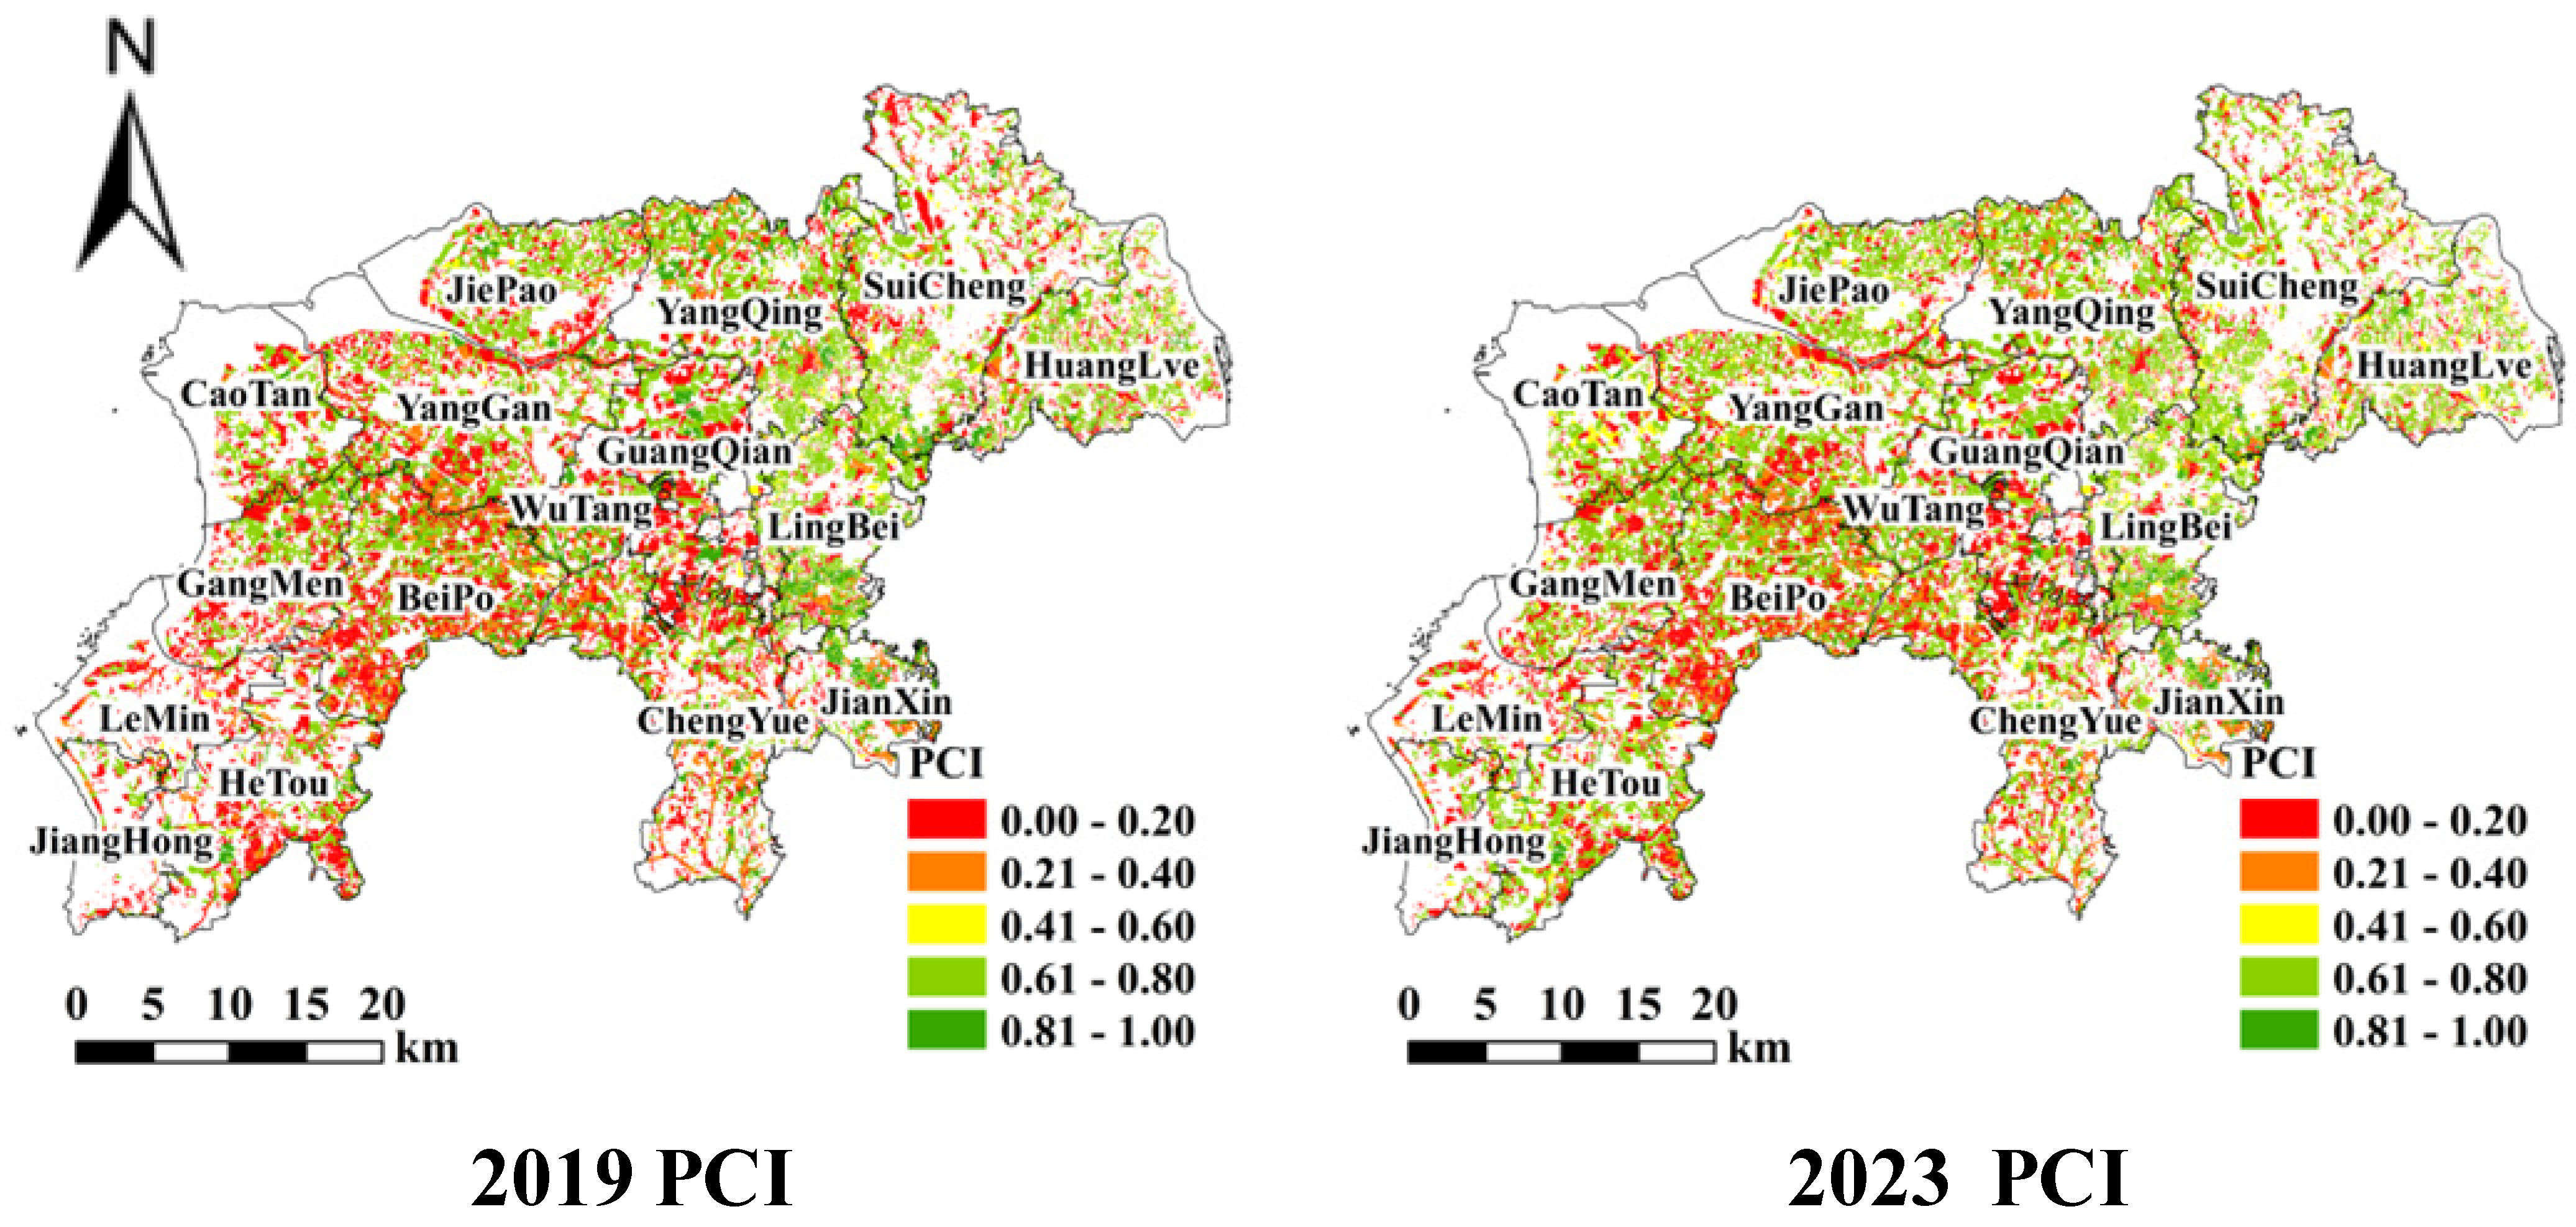
In studies of cultivated land spatial patterns, patch connectivity metrics are pivotal for understanding the degree of cultivated land concentration and contiguity. The analysis of the PCI in Suixi County for 2019–2023 (Figure 4) demonstrated superior connectivity in northeastern patches compared to southwestern areas in 2019. During 2019–2023, the county’s mean PCI increased from 0.48 to 0.59 (a 22.9% rise), indicating significantly enhanced spatial connectivity between patches (Figure 5). Particularly in southwestern towns—Haitou, Jianghong, Lemin, and Gangmen—PCI surged by 34.1%, 50.3%, 32.4%, and 25.1%, respectively, substantially improving regional connectivity. This advancement critically facilitates cultivated land concentration and contiguity while boosting land-use efficiency.
Further analysis reveals that, in 2019, Suixi County had 3947 completely disconnected cultivated land patches, totaling 25.67 km2 (2.78% of the total cultivated land area). By 2023, the number of completely disconnected patches (in delineating concentrated contiguous cultivated land, a patch is defined as completely disconnected when (1) inter-patch distances exceed 20 m or (2) distances range between 0 and 20 m but lack connecting elements, thus failing to establish spatial contiguity) increased to 4259, while their total area decreased by 3.80 km2. A systematic analysis of patch connectivity characteristics from 2019 to 2023 (Table 3) indicates that the increase in patch quantity significantly outpaced the growth in patch area, leading to a decline in average patch size from 0.024 km2 in 2019 to 0.019 km2 in 2023. Despite the reduction in average patch size, inter-patch connectivity exhibited an upward trend, with the average number of connections per patch rising from 2 in 2019 to 3 in 2023, suggesting an optimized spatial structure for cultivated land concentration and contiguity.
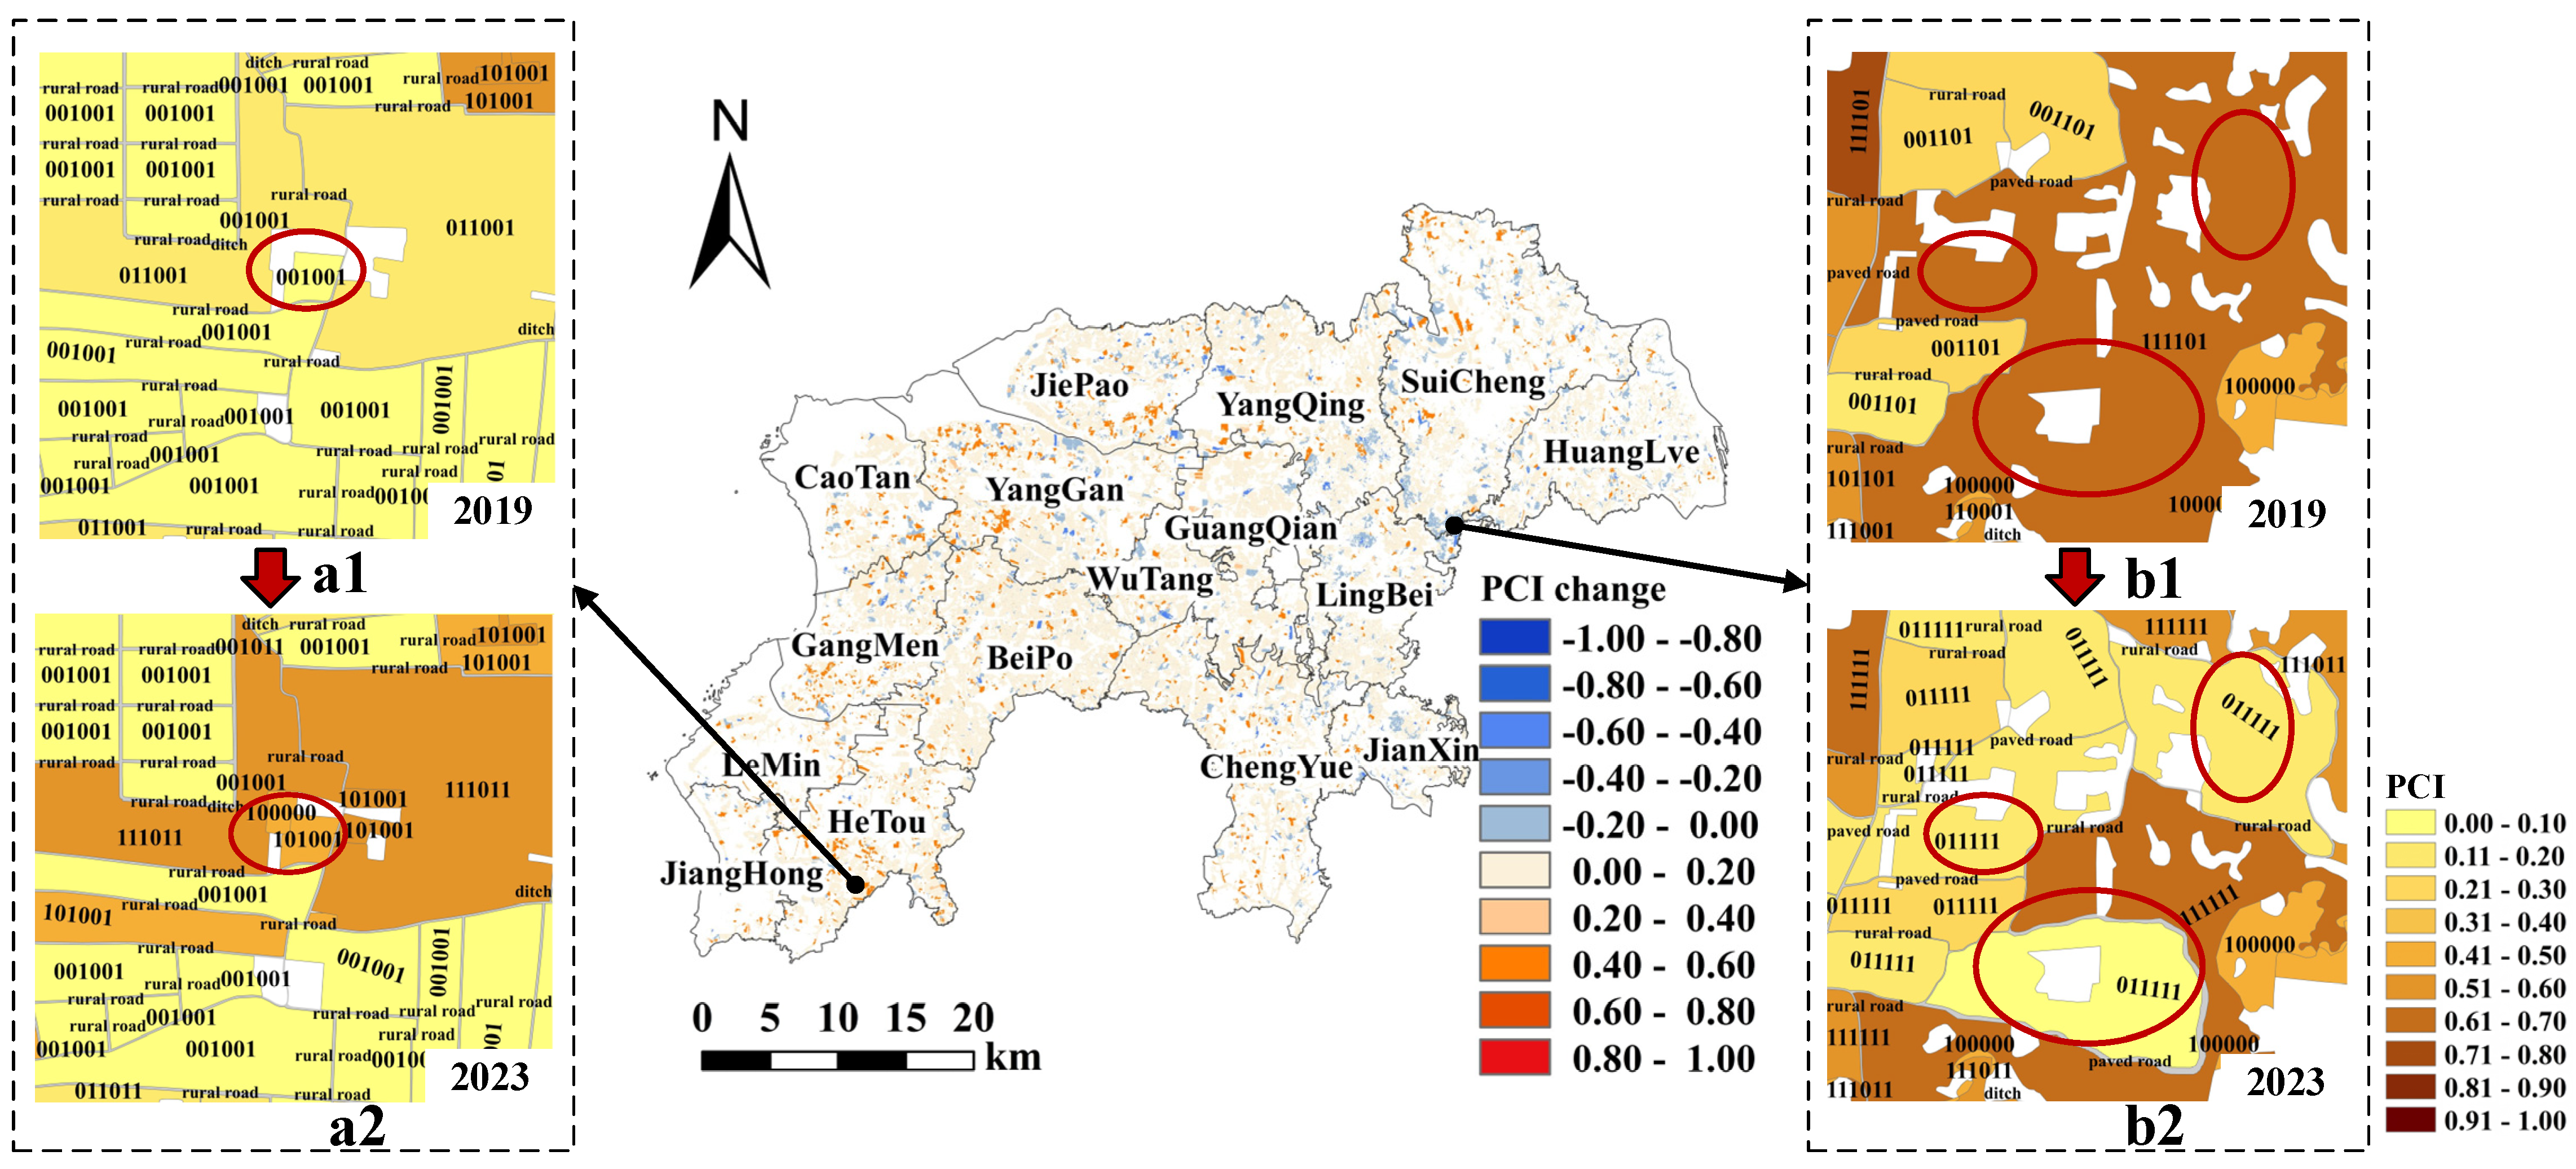
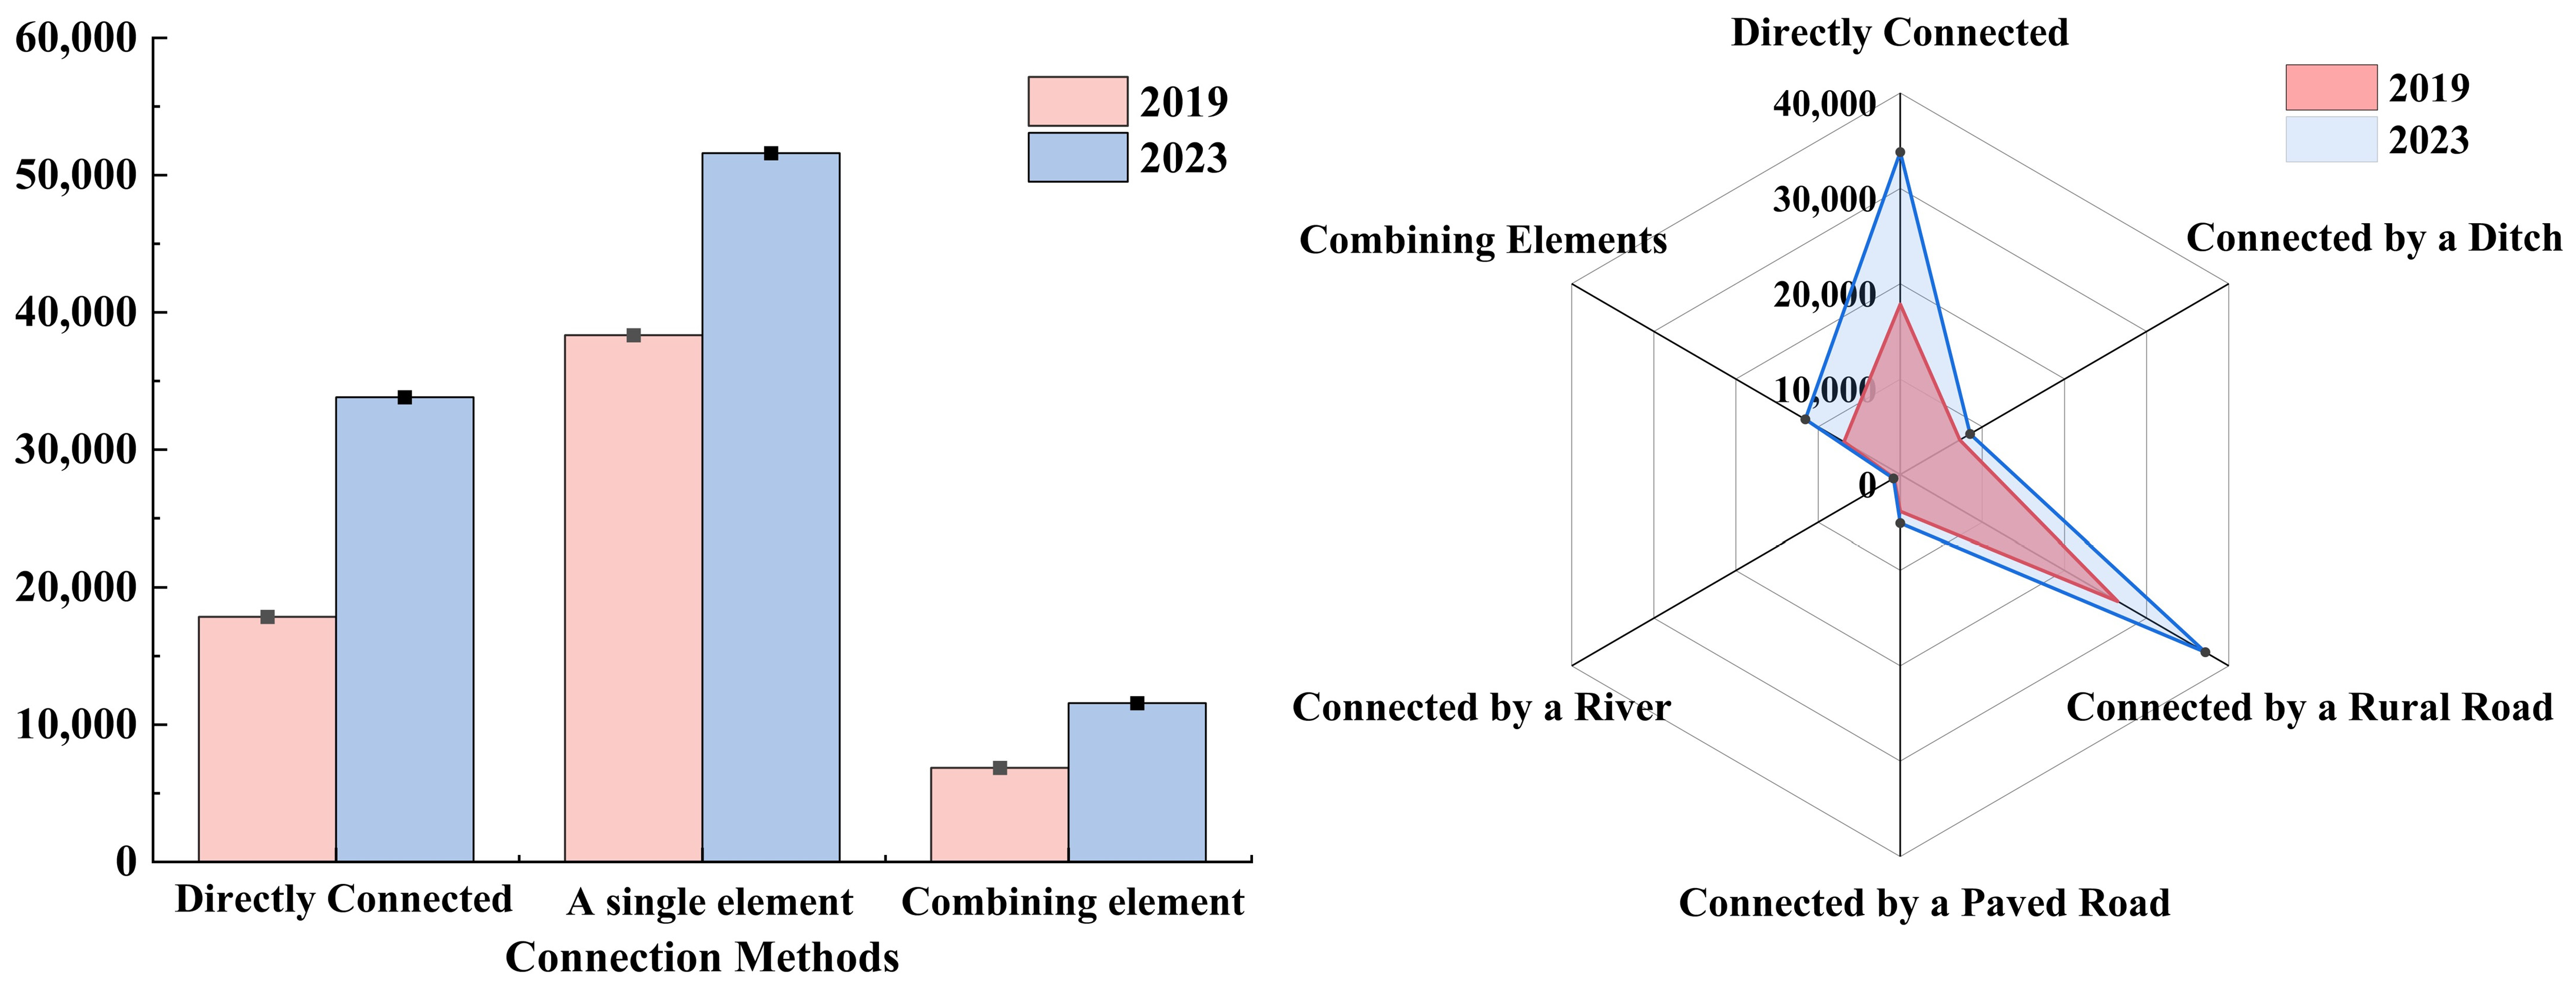
In terms of patch connectivity patterns, direct connections are identified as the most conducive to cultivated land concentration and contiguity. This study reveals that indirect connections between patches exhibit a distinct characteristic of “single-element connections dominating, supplemented by composite-element connections” (Figure 6). Among single-element connection types, rural roads account for the highest proportion as connecting elements, followed by ditches, while rivers show the lowest proportion. Notably, compared to 2019, the number of directly connected patches increased by approximately 90% in 2023. This phenomenon is likely attributable to patch expansion enabling the transition from indirect to direct connections (as seen in the transition from Figure 5(a1) to Figure 5(a2)); the number of indirectly connected patches also increased by approximately 40%, potentially resulting from enhanced road construction (e.g., rural roads or paved roads) between cultivated land patches, as demonstrated by the transition from Figure 5(b1) to Figure 5(b2).

3.1.2. Patch Area Index (PAI)

The cultivated land patch structure in the county exhibits a “large-scale concentration with small-scale dispersion” pattern in terms of area distribution. In 2019, specifically, patches larger than 25,000 m2 account for 78.94% of the total patch count, with those exceeding 50,000 m2 contributing 58.03% of the total cultivated land area. Notably, ultra-large patches over 500,000 m2 constitute only 2.42% of the total cultivated land area. Temporal analysis from 2019 to 2023 reveals significant structural evolution; while the total cultivated land area increased, a trend toward spatial agglomeration emerged. Patches larger than 25,000 m2 showed a net increase of 13.79 km2, whereas those exceeding 50,000 m2 decreased by 3.89 km2, reflecting strategic adjustments in patch scale optimization.
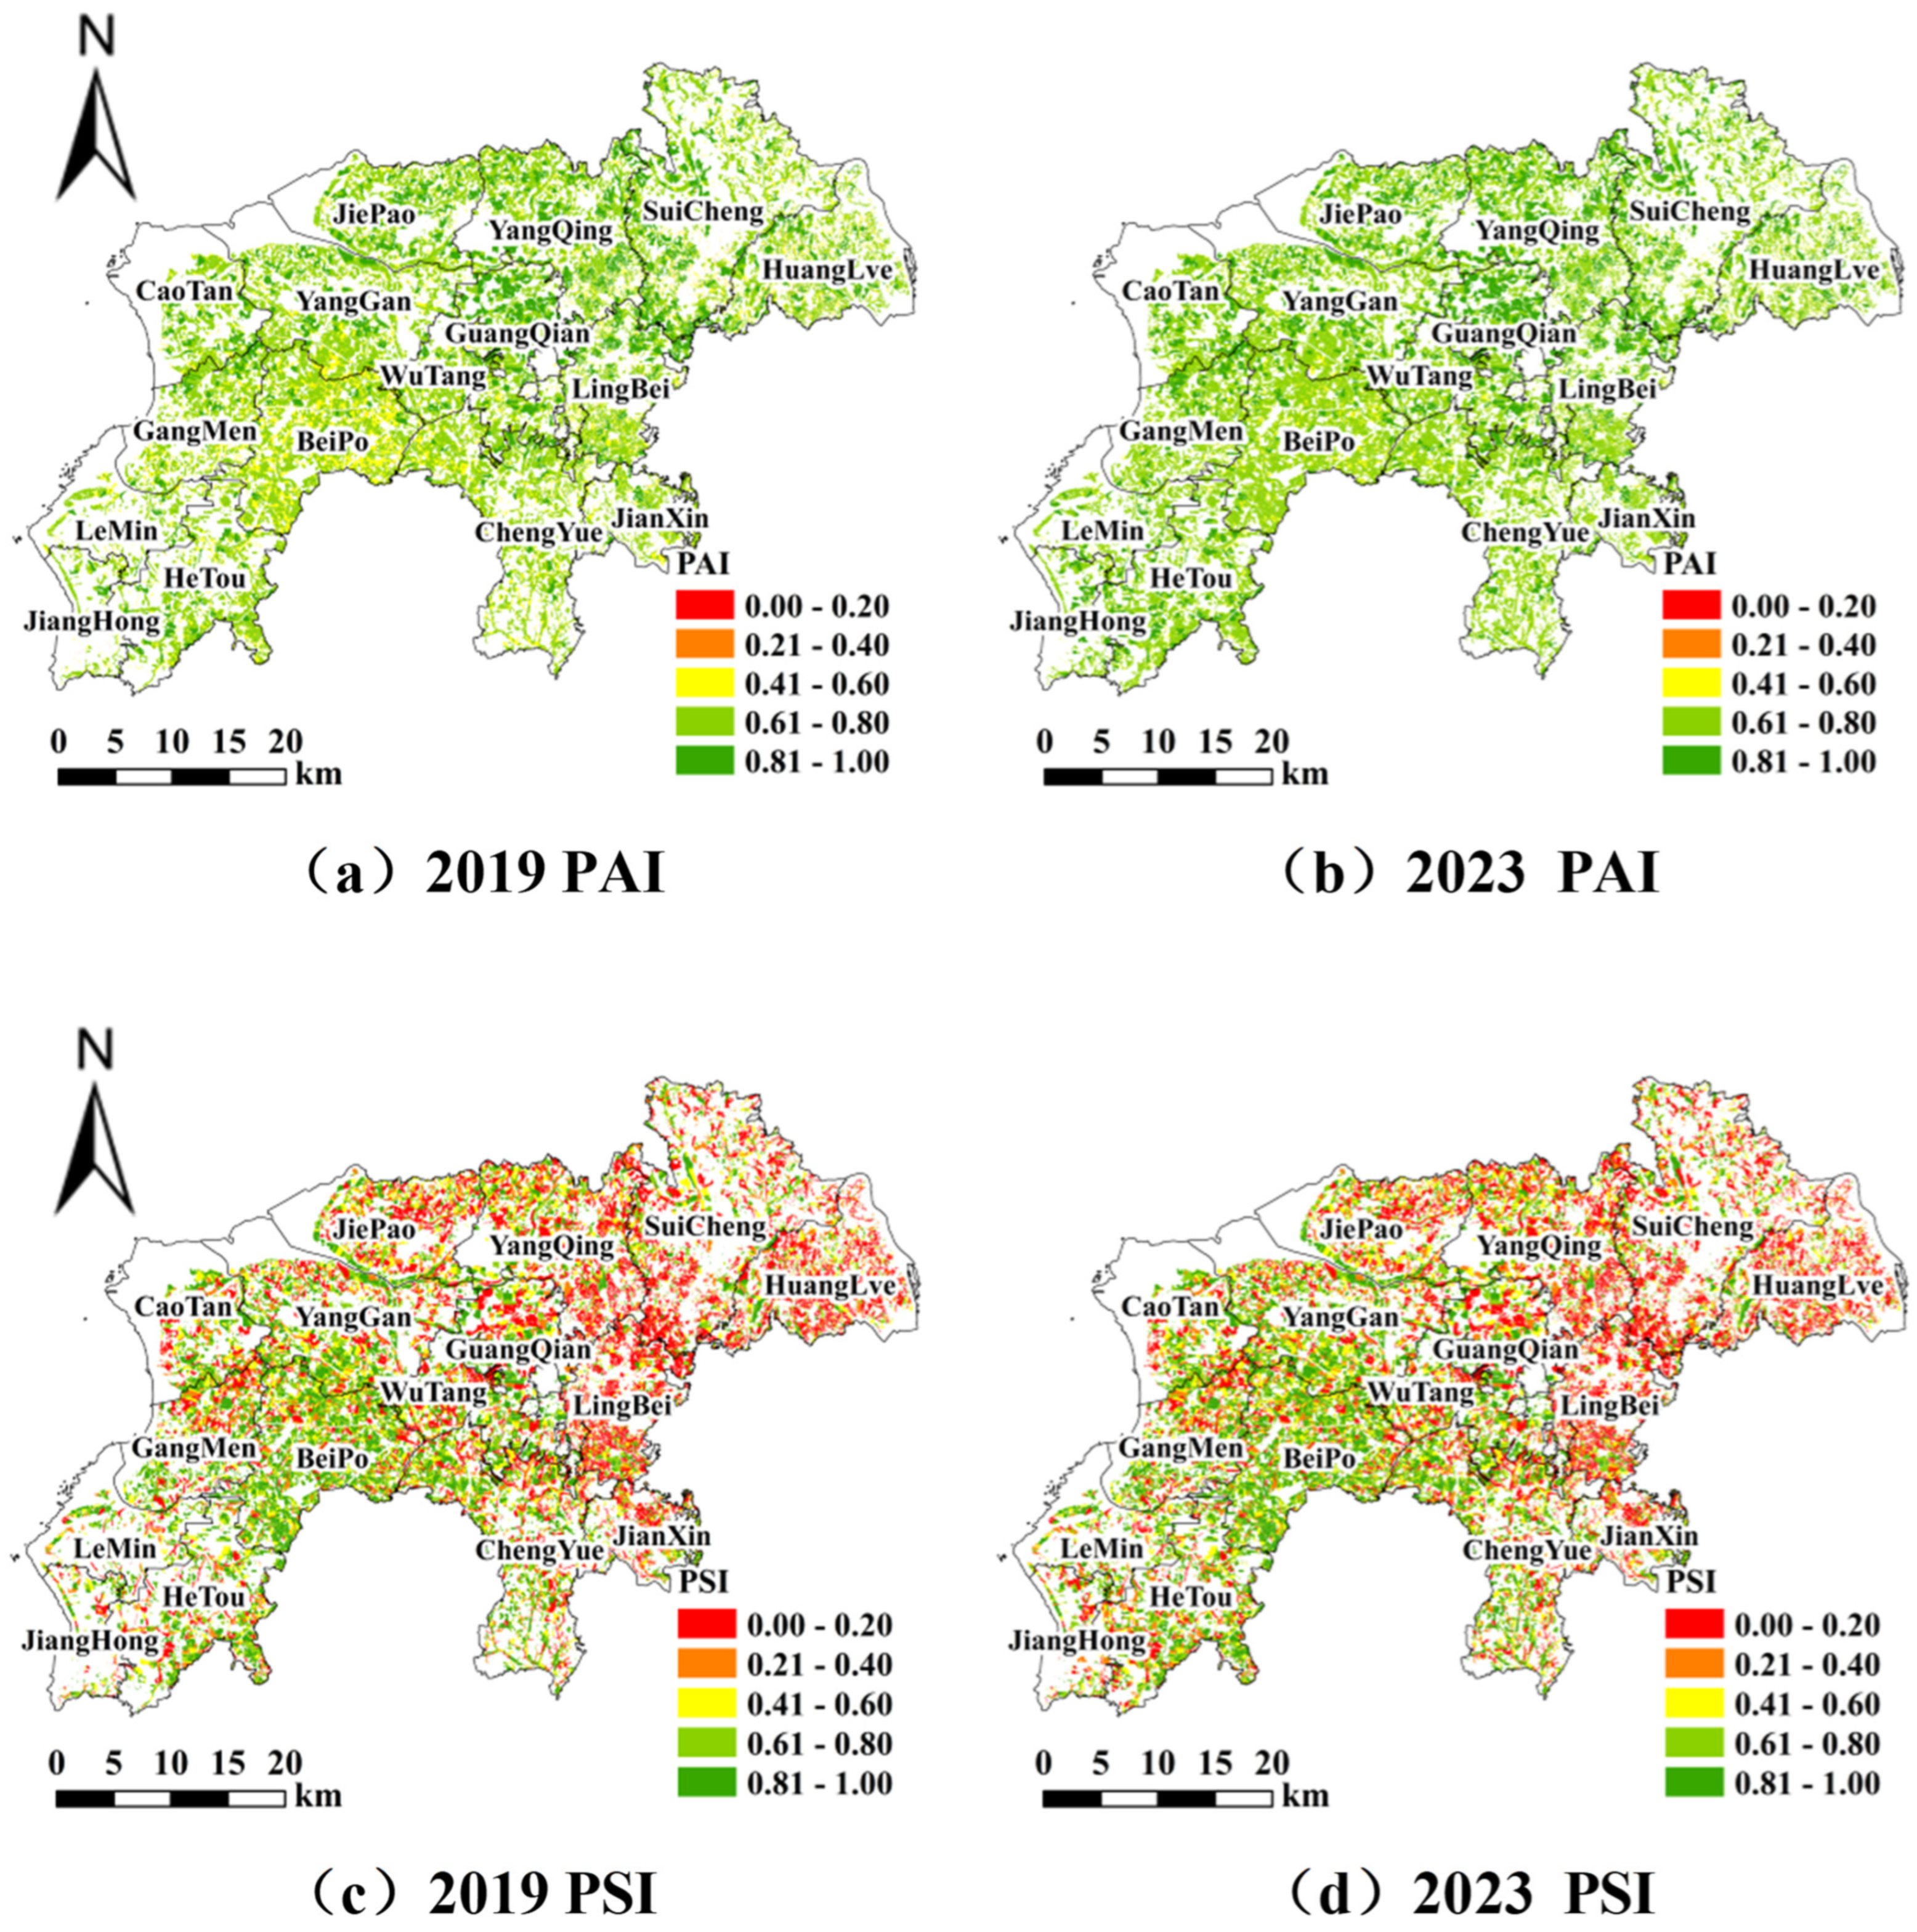
Spatially, the 2019 PAI exhibited a “high-center, low-periphery” pattern (Figure 7a). By 2023 (Figure 7b), southwestern towns—Lemin, Beipo, Hetou, and Gangmen—demonstrated marked PAI increases of 23.1%, 39.6%, 35.4%, and 33.7%, respectively. Overall, most county regions showed expanding patch areas during the study period, with the mean PAI rising from 0.70 to 0.78, evidencing cultivated land consolidation trends.

3.1.3. Patch Shape Index (PSI)

Cultivated land patches in Suixi County exhibit pronounced spatial heterogeneity in morphological characteristics. In 2019, the shape regularity of cultivated land patches displayed a “southwest-to-northeast gradient decline”, with the most regular-shaped patches predominantly clustered in the northern areas of Beipo Town, the northern sections of Caotan, and the southern zone of Gangmen Town. During the 2019–2023 period (Figure 7c,d), the mean patch shape index decreased slightly from 0.72 to 0.69 (where values closer to 1 indicate higher shape regularity), suggesting marginal fragmentation of patch morphology. The overall structural configuration of cultivated land patches remained stable, with no statistically significant morphological alterations observed at the county scale. The decline occurred due to increased cultivated land area during 2019–2023, which expanded the number of patches exceeding the concentration–contiguity delineation threshold. These newly added patches exhibited irregular shapes—a transitional state during remediation—necessitating future unitary management of fine-scale patches.

3.2. Classification of Cultivated Land Concentration and Contiguity Grades

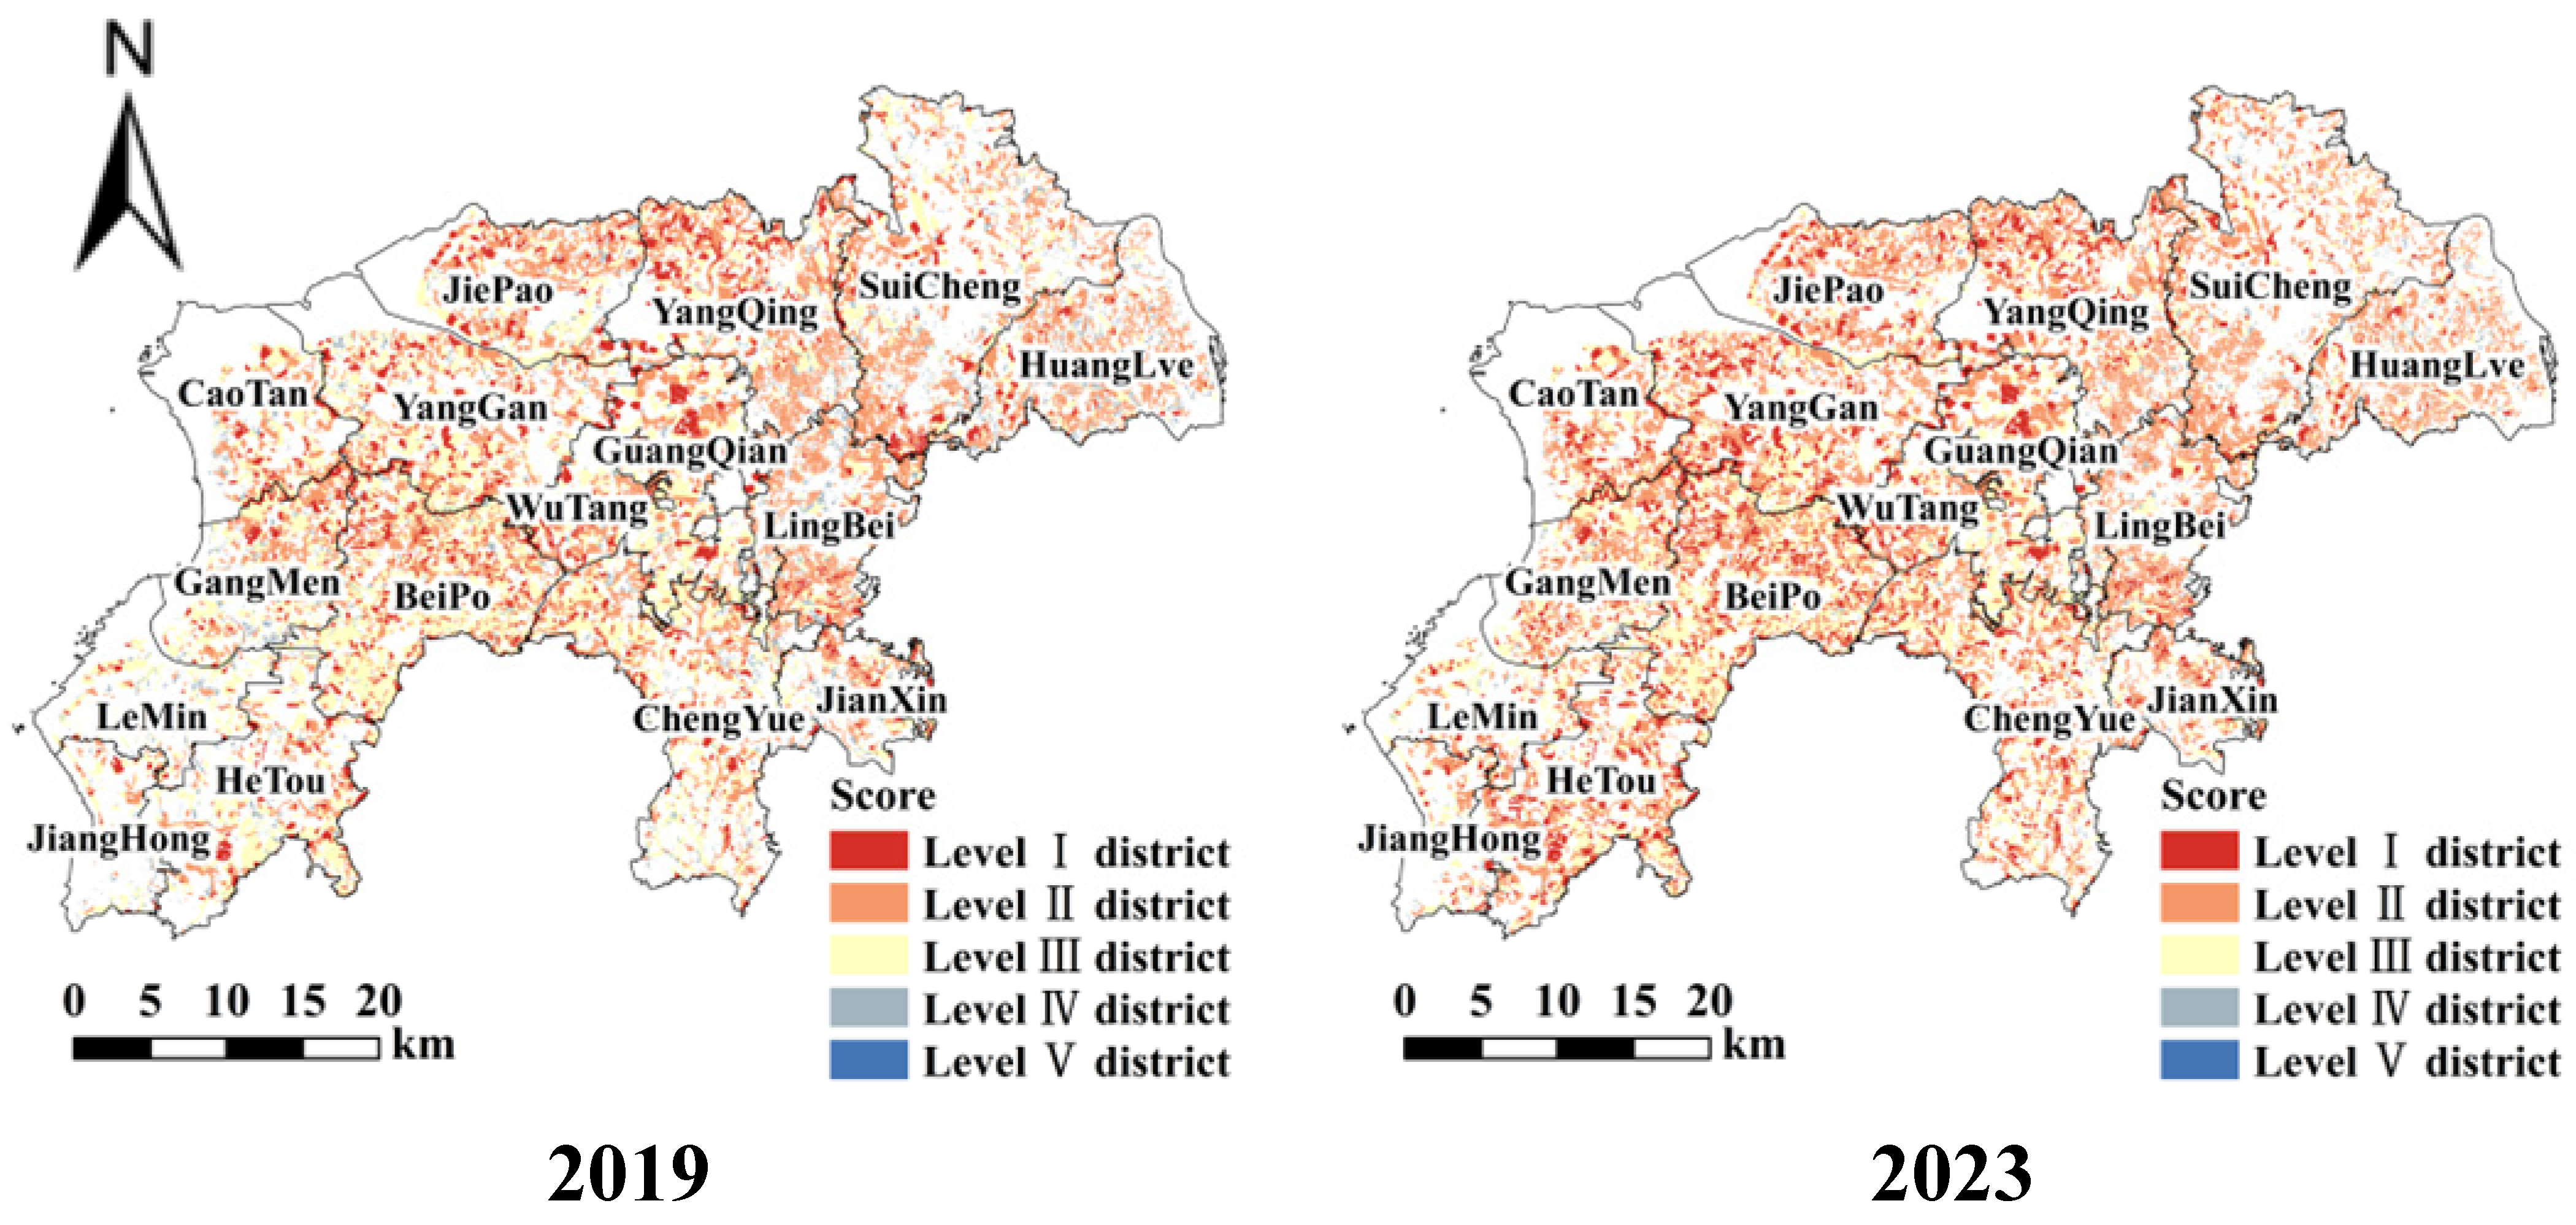
Based on the equal-interval classification method, the concentrated contiguous cultivated land in Suixi County was categorized into five grades: Grade I (0.8–1.0), Grade II (0.6–0.8), Grade III (0.4–0.6), Grade IV (0.2–0.4), and Grade V (0–0.2). Spatial distribution maps of cultivated land concentration and contiguity grades for 2019 and 2023 were generated (Figure 8). The study revealed a significant improvement in the quality of cultivated land concentration and contiguity in Suixi County during 2019–2023, with spatial distribution exhibiting a characteristic “high-central, low-peripheral” normal distribution pattern. A Markov transition matrix (Table 4) was constructed to quantitatively analyze the dynamic evolution of cultivated land area across grades, elucidating the spatial structural transformation mechanisms.
In terms of total area changes, Grade II and Grade III cultivated lands demonstrated a significant increase, rising from 275.93 km2 and 407.06 km2 in 2019 to 298.73 km2 and 458.2 km2 in 2023, representing growth rates of 8.26% and 12.56%, respectively. These grades emerged as the primary drivers of county-grade cultivated land concentration and contiguity quality enhancement. In contrast, Grade I, IV, and V cultivated lands exhibited declining trends. Notably, Grade IV lands experienced the most substantial reduction, decreasing by 65.47 km2 over the five-year period, while Grade V lands declined by 6.40 km2 (49.37% reduction), indicating pronounced efficacy of remediation and improvement efforts targeting low concentration and contiguity cultivated lands.
Analysis of grade transition characteristics revealed frequent bidirectional conversions between Grade II and Grade III cultivated lands. Among Grade II lands in 2019, 12.61% (34.80 km2) transitioned to Grade III, while 6.15% (25.07 km2) of Grade III lands reverted to Grade II, indicating relative instability in the spatial configuration of cultivated land. Notably, substantial upgrades occurred from Grade IV to Grades II and III; 17.75% (35.87 km2) of Grade IV lands improved to Grade II and 22.69% (45.93 km2) advanced to Grade III, strongly correlating with Suixi County’s implementation of high-standard farmland construction and land remediation projects. Additionally, partial transitions from Grade I to Grade II (2.33 km2) were observed, suggesting intra-grade cultivated land concentration and contiguity differentiation and dynamic adjustments even among high-grade lands. Spatial distribution maps and transition matrices collectively demonstrate an evolutionary trajectory of cultivated land concentration and contiguity enhancement in the county, characterized by sequential upward shifts from lower to medium-high grades. This pattern confirms the positive effects of concentrated contiguous cultivated land remediation projects in optimizing spatial structures and enhancing comprehensive productivity. Minor land swaps between cultivated and non-cultivated categories (excluded from matrix calculations) were identified in the table, warranting further analysis with land-use change data in subsequent studies.

4. Discussion

4.1. Delineation Methodology for Cultivated Land Concentration and Contiguity

This study proposes a cultivated land concentration and contiguity delineation method based on a multi-element coupling analysis framework, innovatively establishing a tripartite technical system encompassing “element type-width threshold-spatial coding”. By defining connecting element types (including ditches, rural roads, and paved road) and their spatial interaction thresholds between cultivated land patches (ditches ≤ 5 m, rural roads ≤ 6 m, and paved road ≤ 7 m), combined with a 6-digit binary coding system, precise deconstruction of complex cultivated land spatial patterns was achieved. Furthermore, we developed a spatial-relationship-oriented PCI that integrates patch connection types and intensities, establishing a quantitative correlation model between spatial contiguity and connecting elements.
Taking Suixi County, a typical agricultural region in western Guangdong, as the empirical study area, this research systematically evaluated the evolution characteristics of county-level cultivated land patterns from 2019 to 2023 through a vector-based spatial analysis model. Results demonstrate that the mean PCI of cultivated land increased from 0.38 to 0.42 (10.5% growth), effectively revealing the dynamic evolution of spatial agglomeration. In contrast to traditional landscape metrics like connectivity index employed in previous studies [55,56], this work innovatively proposes vector-based evaluation indices that integrate agricultural production efficiency parameters (connecting element types and widths) with geometric distance, achieving functional connectivity assessment beyond mere geometric connectivity. Empirical findings highlight two methodological advantages over raster-based approaches: (1) The vector data model precisely characterizes patch topological relationships, effectively mitigating edge effects inherent in raster data models [57]; (2) Spatial resolution of evaluation results reaches the individual patch scale, providing scientific support for agricultural spatial optimization and land management decisions.
However, current spatial coding systems exhibit limitations in interpreting composite connection patterns: (1) The binary coding system fails to distinguish heterogeneous composite types (e.g., ditch–rural road vs. ditch–paved road combinations); (2) Existing models lack integration of three-dimensional terrain parameters such as slope gradient and elevation difference. Future studies could establish a multidimensional spatial relationship analytical model through directional coding and connection weight matrices, thereby enhancing simulation accuracy for complex agricultural landscapes. Subsequent research will compare the delineation methodology proposed with existing methods for identifying concentrated contiguous cultivated land, further validating its accuracy and feasibility. Crucially, current models lack explicit linkages to agricultural cost–benefit dynamics, reflecting insufficient integration of economic dimensions.

4.2. Analysis of Cultivated Land Concentration and Contiguity Evaluation Results

This study, based on spatiotemporal data analysis from 2019 to 2023, reveals significant spatial optimization in the landscape pattern of cultivated land in Suixi County. Both the quantity and area of cultivated land patches increased synchronously, while the PCI demonstrated enhanced spatial connectivity between patches through linear infrastructure (e.g., field roads and irrigation ditches). Spatial correlation analysis indicates a three-tier hierarchical structure in patch connectivity: direct connections dominated (34.87%), single-element connections prevailed (53.20%), and multi-element collaborative connections supplemented (11.93%). Notably, the proportion of directly connected patches increased by nearly seven percentage points compared to 2019, effectively promoting the optimized allocation of agricultural production elements.
The spatial distribution of cultivated land concentration and contiguity grades in Suixi County exhibits pronounced regional heterogeneity across the study area. High-grade concentrated contiguous cultivated land is predominantly clustered in the central to southwestern regions, with Beipo Town and Gangmen Town serving as exemplary cases. These towns belong to the Northern Vegetable and Fruit Production Advantage Zone, where large-scale contiguous cultivated land provides optimal conditions for industrialized vegetable and fruit cultivation, mechanized farming, and efficient logistics. This spatial configuration enhances the market competitiveness of agricultural products and ensures stable supply chains for northern-transported crops. In contrast, low-grade concentration and contiguity are observed in the northeastern and partial northern regions, which spatially align with urban development boundaries defined in territorial planning (http://www.suixi.gov.cn/gggs/gggs/content/post_2015139.html, accessed on 21 August 2024). This spatial differentiation validates the effectiveness of land consolidation projects, establishing a positive feedback mechanism characterized by infrastructure optimization landscape connectivity enhancement → agricultural productivity improvement.
By constructing a “pattern-process-effect” analytical framework, this study demonstrates the quantifiable impact of land consolidation projects on enhancing cultivated land landscape functionality, providing an empirical case for territorial spatial optimization under rural revitalization strategies. Notably, the spatial relationship between cultivated land concentration and contiguity and urbanization processes requires long-term monitoring. To address this, it is recommended to establish a dynamic cultivated land quality assessment system based on multi-source remote sensing data, integrating indicators such as connectivity, soil fertility, and land-use efficiency. This system would enable real-time tracking of spatiotemporal changes in cultivated land patterns, supporting adaptive policy-making for sustainable agricultural and urban development.

4.3. Prospects

A well-organized layout of concentrated contiguous cultivated land facilitates the scientific planning and implementation of irrigation systems, ensuring uniform and efficient water distribution across farmlands. This lays a robust foundation for stabilizing and enhancing grain yields while improving crop quality. From an agricultural production perspective, unitary management of contiguous cultivated land by third-party entities or a limited number of farming households maximizes the benefits of scale and mechanized operations, effectively mitigating land abandonment. Unitary management of contiguous cultivated land is a critical driver of agricultural sustainability [58]. By integrating resources and rationally planning crop structures, such practices significantly reduce non-point-source pollution, safeguarding national food security while maintaining the balance and stability of agricultural ecosystems.
Contiguous cultivated land creates favorable conditions for unitary management, which, in turn, amplifies the inherent advantages of land contiguity. These two aspects mutually reinforce each other, jointly supporting the transformation of agriculture toward scale, mechanization, modernization, and sustainable development. Specifically, for completely disconnected patches, proactively promote land transfer and large-scale farming operations. Among connecting elements, rural roads contribute more to patch connectivity than the combined contributions of all other elements. Therefore, priority should be given to upgrading rural roads to enhance inter-patch connectivity and cultivate land concentration and contiguity. Complementing this, increased ditch construction—including quantity expansion and hardened linings—is critical in central-eastern Suixi County, where irrigation ditch coverage remains deficient, to further bolster contiguity. Areas within China’s ecological conservation redlines and urban–rural development boundaries are excluded from concentrated contiguous cultivated land delineation. The synergy between contiguous land and unitary management optimizes resource allocation, minimizes fragmentation, and enhances production efficiency—key factors in achieving long-term agricultural resilience and competitiveness.

5. Conclusions

This study developed a vector-based patch-scale evaluation system for cultivated land contiguity, enabling refined spatial analysis of contiguity characteristics in Suixi County through a spatial relationship coding model. Innovatively, we proposed the PCI and established a three-dimensional evaluation framework integrating area, shape, and connectivity indices. This framework revealed significant spatial differentiation in the county’s cultivated land patterns: (1) Connection Structure: Dominated by single-element indirect connections with supplementary combined-element connections. (2) Area Distribution: Followed a power-law pattern, where the top 20% of patches contributed 76.5% of the total cultivated land area. (3) Shape Regularity: Decreased along the SW–NE axis, with the mean PSI declining from 0.79 to 0.61. Temporal analysis (2019–2023) demonstrated substantial improvements in cultivated land contiguity, with total area increasing by 5.97% and the proportion of high-contiguity patches (Grades I–II) rising by 6.89%. These findings underscore the effectiveness of spatial optimization strategies in reducing fragmentation and enhancing agricultural productivity.
Theoretical perspective: This study transcends the limitations of traditional raster-based analysis methods, establishing a patch-scale evaluation model that provides a quantitative tool for spatial topological relationships in cultivated land pattern optimization. Practical perspective: We propose enhancing agricultural production efficiency through farmland morphological consolidation and the promotion of innovative management models.
Future research will integrate three-dimensional topographic parameters and spatial locational weights to develop a multi-scale comprehensive evaluation model for cultivated land contiguity. Concurrently, we will quantify the coupling mechanism between land contiguity degree and agricultural production efficiency through modeling, thereby providing decision-making support for agricultural modernization.

Author Contributions

Conceptualization, R.Z., C.D. and C.H.; Software, X.K.; Formal Analysis, L.W. and L.Z.; Investigation, R.Z., L.Z., D.W., J.Z., L.H., X.L., and Y.W.; Writing—Original Draft Preparation, L.W.; Writing—Review and Editing, L.W., R.Z., C.D., C.H., X.K., L.Z., D.W., J.Z., L.H., X.L., and Y.W.; Visualization, L.W. and X.K.; Supervision, L.Z. and C.H.; Project Administration, R.Z.; Funding Acquisition, C.D. All authors have read and agreed to the published version of the manuscript.

Funding

This work was supported by Ministry of Natural Resources of the People’s Republic of China (Grant No. A2507 and Grant No. A2508), Special Project of the Ministry of Natural Resources (Grant No. 2024ZRBSHZ035 and Grant No. 2024ZRBSHZ038), and Fundamental Scientific Research Business Expenses of Central Public Welfare Research Institutes (Grant No. AR2521 and AR2422).

Data Availability Statement

Restrictions apply to the availability of the national land change survey data due to government regulations. Data were obtained from the Ministry of Natural Resources of China (MNR) and are available at [https://gk.mnr.gov.cn/ysqgk/201905/t20190515_2411660.html, accessed on 1 August 2025] with the permission of MNR.

Acknowledgments

The authors sincerely acknowledge all individuals who contributed to this work. This study was supported by the Institute of Surveying and Mapping and the Anhui Provincial Department of Natural Resources, Ministry of Natural Resources, China.

Conflicts of Interest

The authors declare no competing interests. The sponsors had no role in the design, execution, interpretation, or writing of the study.

References

  1. Tian, R.; Yang, Z.; Shao, Q. China’s Arable Land Investment in the “Belt and Road” Region: An Empirical Study of Overseas Arable Land Resources. Sustainability 2019, 12, 97. [Google Scholar] [CrossRef]
  2. Zhao, T.; Zhang, X.; Liu, W.; Wang, J.; Li, Z.; Liu, L. Increase in Global per Capita Cropland Imbalance across Countries from 1985 to 2022: A Threat to Achieving Sustainable Development Goals. Geogr. Sustain. 2025, 6, 100239. [Google Scholar] [CrossRef]
  3. Du, Z.; Yu, L.; Chen, X.; Li, X.; Peng, D.; Zheng, S.; Hao, P.; Yang, J.; Guo, H.; Gong, P. An Operational Assessment Framework for Near Real-Time Cropland Dynamics: Toward Sustainable Cropland Use in Mid-Spine Belt of Beautiful China. J. Remote Sens. 2023, 3, 0065. [Google Scholar] [CrossRef]
  4. Lee, C.-C.; Li, J.; Zeng, M. Construction of China’s Food Security Evaluation Index System and Spatiotemporal Evolution. Environ. Sci. Pollut. Res. 2024, 31, 25014–25032. [Google Scholar] [CrossRef]
  5. Yang, D.; Liu, Z.; Zhang, P.; Chen, Z.; Chang, Y.; Wang, Q.; Zhang, X.; Lu, R.; Li, M.; Xing, G.; et al. Understanding Relationships between Cultivated Land Pressure and Economic Development Level across Spatiotemporal Characteristics: Implications for Supporting Land-Use Management Decisions. Int. J. Environ. Res. Public Health 2022, 19, 16362. [Google Scholar] [CrossRef]
  6. Zhao, S.; Yin, M. Change of Urban and Rural Construction Land and Driving Factors of Arable Land Occupation. PLoS ONE 2023, 18, e0286248. [Google Scholar] [CrossRef] [PubMed]
  7. Liu, Y. Reflections on China’s Food Security and Land Use Policy under Rapid Urbanization. Land Use Policy 2021, 109, 105699. [Google Scholar] [CrossRef]
  8. Yang, S.; Li, D.; Liao, H.; Zhu, L.; Zhou, M.; Cai, Z. Analysis of the Balance between Supply and Demand of Arable Land in China Based on Food Security. Sustainability 2023, 15, 5706. [Google Scholar] [CrossRef]
  9. Hua, Y.; Ong, P.Y.; Tran, C.N.; Lee, C.T.; Nagasaka, K. A Novel Stereoscopic Mode of Planting and Breeding Shed. Plant Sci. Today 2024, 12. [Google Scholar] [CrossRef]
  10. Chen, M.; Liu, T.; Zhou, B.; Xu, X. The Effectiveness of Cultivated Land Protection and Strategies in China. In Proceedings of the 2013 International Academic Workshop on Social Science (IAW-SC-13), Changsha, China, 18–20 October 2013; Atlantis Press: Hunan, China, 2013. [Google Scholar]
  11. Guan, X.; Wang, X.; Zhang, J.; Dai, Z. Regulation and Optimization of Cultivated Land in Different Ecological Function Areas under the Guidance of Food Security Goals-a Case Study of Mengjin County, Henan Province, China. Front. Environ. Sci. 2023, 11, 1115640. [Google Scholar] [CrossRef]
  12. Zheng, L.; Wang, J.; Zeng, Y.; Gu, T.; Chen, W. Impacts of Construction Land Expansion on Cultivated Land Fragmentation in China, 2000–2020. Environ. Monit. Assess. 2025, 197, 300. [Google Scholar] [CrossRef]
  13. Xiao, Y.; Chen, J.; Yin, P. Institutionalization of Ecological Civilization Construction in China: Measurements and Influencing Factors. Sustainability 2025, 17, 1719. [Google Scholar] [CrossRef]
  14. Li, Y.; Zhang, F. Problems and Solutions of High Standard Farmland Construction. Front. Sustain. Dev. 2024, 4, 50–54. [Google Scholar] [CrossRef]
  15. Lin, L.; Ye, Z.; Gan, M.; Shahtahmassebi, A.; Weston, M.; Deng, J.; Lu, S.; Wang, K. Quality Perspective on the Dynamic Balance of Cultivated Land in Wenzhou, China. Sustainability 2017, 9, 95. [Google Scholar] [CrossRef]
  16. Wang, W.; Chen, Y.; Liu, K.; Dang, Y.; Li, G.; Wen, L.; Cao, Y. Optimization and Classification Control of Permanent Basic Farmland Based on Quality Classification. Front. Environ. Sci. 2024, 12, 1331534. [Google Scholar] [CrossRef]
  17. Jiang, G.; Ma, W.; Li, Y.; Zhou, D.; Zhou, T. Mapping Abandoned Cultivated Land in China: Implications for Grain Yield Improvement. Appl. Sci. 2024, 15, 165. [Google Scholar] [CrossRef]
  18. National Bureau of Statistics of China. China Statistical Yearbook 2024; China Statistics Press: Beijing, China, 2024; pp. 379–381. [Google Scholar]
  19. Liu, S.; Wang, L.; Zhang, J. The Dataset of Main Grain Land Changes in China over 1985–2020. Sci. Data 2024, 11, 1430. [Google Scholar] [CrossRef] [PubMed]
  20. Li, J.; Feng, Y.; Gu, L. Telecoupling Effects among Provinces of Cultivated Land Grain Production in the Last 30 Years: Evidence from China. Agriculture 2024, 14, 1121. [Google Scholar] [CrossRef]
  21. Chen, W.; Wang, N. Study on the Construction of Evaluation System of Cultivated Land Intensive Use in Different Spatial Scales. Front. Humanit. Soc. Sci. 2024, 4, 312–316. [Google Scholar] [CrossRef]
  22. Rahman, T.U.; Shah, S.; Hassan, S.; Fahad, S. Food Security Challenges and Adaptation Strategies in China amidst Global Climate Change. J. Umm Al-Qura Univ. Appll. Sci. 2025, 1–14. [Google Scholar] [CrossRef]
  23. Zhou, S.; Zhu, A.; Qiu, W.; Liu, F.; Dai, J. GIS based connectivity analysis and its application in prime farmland protection planning. Trans. Chin. Soc. Agric. Eng. 2008, 24, 72–77+313. [Google Scholar]
  24. Ma, S.; Zhang, S. Map Vector Tile Construction for Arable Land Spatial Connectivity Analysis Based on the Hadoop Cloud Platform. Front. Earth Sci. 2023, 11, 1234732. [Google Scholar] [CrossRef]
  25. Guo, Z.; Yang, Y. GIS-Based Farmland Connectivity Analysis Methods Research and System Implementation. Geogr. Geo-Inf. Sci. 2010, 63–66+117. [Google Scholar]
  26. Tian, H.; Zhang, X.; Bi, R.; Yang, J.; Li, G.; Zhang, J. Prime Farmland Demarcation Based on Arable Land Quality and Concentricity in Non-Uniform Grid Environment. Trans. Chin. Soc. Agric. Eng. 2020, 36, 254–262+321. [Google Scholar] [CrossRef]
  27. Li, Z.; Bagan, H.; Yamagata, Y. Analysis of Spatiotemporal Land Cover Changes in Inner Mongolia Using Self-Organizing Map Neural Network and Grid Cells Method. Sci. Total Environ. 2018, 636, 1180–1191. [Google Scholar] [CrossRef] [PubMed]
  28. Fan, Y. Distribution Extraction and Influencing Factors of Farmland Concentrated Contiguous Management—A Case Study of Yunzhou District, Datong City of China. Master’s Thesis, Shanxi Agricultural University, Taigu, China, 2023. [Google Scholar]
  29. Bhermana, A.; Nursafingi, A.; Purwoko, S.; Haryanto, B.; Nugroho, W.A.; Agustini, S.; Nuraini, L.; Wardi; Heryanto, R.B.; Prasetyo, C. Agricultural Land Use Planning on Sustained Basis Using Landform and Land Evaluation Approach with Geospatial Analysis (A Case Study in East Barito District, Central Kalimantan Province). IOP Conf. Ser. Earth Environ. Sci. 2023, 1264, 012039. [Google Scholar] [CrossRef]
  30. Churko, G.; Walter, T.; Szerencsits, E.; Gramlich, A. Improving Wetland Connectivity through the Promotion of Wet Arable Land. Wetl. Ecol. Manag. 2020, 28, 667–680. [Google Scholar] [CrossRef]
  31. Zhang, X.; Liao, Q.; Zhao, H.; Li, P. Vector Maps and Spatial Autocorrelation of Carbon Emissions at Land Patch Level Based on Multi-Source Data. Front. Public Health 2022, 10, 1006337. [Google Scholar] [CrossRef] [PubMed]
  32. Si, R.; Yao, Y.; Zhang, X.; Lu, Q.; Aziz, N. Exploring the Role of Contiguous Farmland Cultivation and Adoption of No-Tillage Technology in Improving Transferees’ Income Structure: Evidence from China. Land 2022, 11, 570. [Google Scholar] [CrossRef]
  33. Yang, H.; Li, J.; Sieber, S.; Long, K. Does Digital Village Construction Affect the Sustainable Intensification of Cultivated Land Use? Evidence from Rural China. Agriculture 2025, 15, 978. [Google Scholar] [CrossRef]
  34. Deng, Y.; Mao, Z.; Huang, J.; Yan, F.; Han, S.; Li, A. Spatial Patterns of Natural Protected Areas and Construction of Protected Area Groups in Guangdong Province. Int. J. Environ. Res. Public Health 2022, 19, 14874. [Google Scholar] [CrossRef]
  35. Fang, W.; Yang, Z.; Liu, Z.; Hatab, A.A. Green Recovery of Cropland Carrying Capacity in Developed Regions: Empirical Evidence from Guangdong, China. Econ. Change Restruct. 2023, 56, 2405–2436. [Google Scholar] [CrossRef]
  36. Su, M.; Sun, K.; Deng, B.; Cheng, N.; Cao, Y. Quantification and Driving Factors of Cultivated Land Fragmentation in Rapidly Urbanizing Area: A Case Study in Guangdong Province. Remote Sens. 2024, 16, 2633. [Google Scholar] [CrossRef]
  37. Xiao, Y.; Zhao, J.; Zhang, Y.; Wang, S. Grain Self-Sufficiency in Guangdong, China: Current Trends and Future Perspectives. Foods 2025, 14, 1126. [Google Scholar] [CrossRef]
  38. Wang, D.; Yang, H.; Hu, Y.; Zhu, A.-X.; Mao, X. Analyzing Spatio-Temporal Characteristics of Cultivated Land Fragmentation and Their Influencing Factors in a Rapidly Developing Region: A Case Study in Guangdong Province, China. Land 2022, 11, 1750. [Google Scholar] [CrossRef]
  39. TD/T 1055-2019; Technical Regulation of the Third Nationwide Land Survey. Ministry of Natural Resources of the People’s Republic of China: Beijing, China, 2019.
  40. Huang, H.; Lan, Y. The Analysis and Application of Guangxi’s Concentrated Arable Land Based on ArcGIS on Boundary Line of Guangxi’s Arable Land (Research Paper III). J. Guangxi Teach. Educ. Univ. (Philos. Soc. Sci. Ed.) 2018, 39, 142–148. [Google Scholar] [CrossRef]
  41. Bunn, A.G.; Urban, D.L.; Keitt, T.H. Landscape Connectivity: A Conservation Application of Graph Theory. J. Environ. Manag. 2000, 59, 265–278. [Google Scholar] [CrossRef]
  42. Lu, X.; Wu, P.; Guo, X. Application of binary morphological closing operation for aggregation connectivity planning in high-quality arable land. J. Image Graph. 2016, 21, 199–206. [Google Scholar] [CrossRef]
  43. GB/T 30600-2022; Well-Facilitated Farmland Construction—General Rules. National Standardization Administration Standardization Administration of China, State Administration for Market Regulation: Beijing, China, 2022.
  44. TD/T 1076-2023; Technical Specification for Generalization of Land Survey Data. Ministry of Natural Resources of the People’s Republic of China: Beijing, China, 2023.
  45. JTG B01-2014; Technical Standard of Highway Engineering. Highway Administration, Ministry of Transport of the People’s Republic of China: Beijing China; CCCC FIRST CCCC First Highway Consultants Co., Ltd.: Xi’an, China, 2014.
  46. Penghui, J.; Dengshuai, C.; Manchun, L. Farmland Landscape Fragmentation Evolution and Its Driving Mechanism from Rural to Urban: A Case Study of Changzhou City. J. Rural Stud. 2021, 82, 1–18. [Google Scholar] [CrossRef]
  47. Wang, Z.; Wang, J.; Zhang, G.; Wang, Z. Evaluation of Agricultural Extension Service for Sustainable Agricultural Development Using a Hybrid Entropy and TOPSIS Method. Sustainability 2021, 13, 347. [Google Scholar] [CrossRef]
  48. Shi, Y.; Jin, X.; Liang, X.; Han, B.; Ying, S.; Wang, S.; Zhou, Y. Spatial-Temporal Characteristics and Strategies for the Classification and Optimization of Cultivated Land Agglomeration Connectivity in Jiangsu Province of China. Trans. Chin. Soc. Agric. Eng. 2024, 40, 250–260. [Google Scholar] [CrossRef]
  49. Shengwu, Z.; Juan, H. Impact of Interprovincial Pairing Assistance Policies on Sustainable Agricultural Development in Xinjiang of China. Sci. Rep. 2025, 15, 8372. [Google Scholar] [CrossRef]
  50. Zhu, J.; Li, G.; Zhang, J.; Liu, H. A Decision Model for High School Students’ Summer Job Choices: A Study Combining Hierarchical Analysis and Entropy Power Methods. Int. J. Educ. Humanit. 2024, 14, 23–28. [Google Scholar] [CrossRef]
  51. Chen, H.; Zhu, D.; Yun, W.; Yang, L.; Tang, H.; Tang, C. Analysis on Cultivated Land Fragmentation and Spatial Agglomeration Pattern in Jiaxing City. Trans. Chin. Soc. Agric. Eng. 2012, 28, 235–242. [Google Scholar]
  52. Wang, X.; Jiang, G.; Zhang, R.; Zhao, T.; Qu, Y. Zoning Approach of Suitable Areas for High Quality Capital Farmland Construction. Trans. Chin. Soc. Agric. Eng. 2013, 29, 241–250. [Google Scholar]
  53. Ren, X. Evaluation of Cabin Energy Consumption Based on Combination Weighting and Grey Fuzzy Comprehensive Model. EURASIP J. Adv. Signal Process. 2022, 2022, 36. [Google Scholar] [CrossRef]
  54. Cui, Z.; Tian, W.; Wang, X.; Chenyang, F.; Guo, Q.; Xu, H. Safety Integrity Level Analysis of Fluid Catalytic Cracking Fractionating System Based on Dynamic Simulation. J. Taiwan Inst. Chem. Eng. 2019, 104, 16–26. [Google Scholar] [CrossRef]
  55. Liu, Q.; Qiao, J.; Han, D.; Li, M.; Shi, L. Spatiotemporal Evolution of Cultivated Land Use Eco-Efficiency and Its Dynamic Relationship with Landscape Pattern Change from the Perspective of Carbon Effect: A Case Study of Henan, China. Agriculture 2023, 13, 1350. [Google Scholar] [CrossRef]
  56. Tang, F.; Li, Y.; Liu, X.; Huang, J.; Zhang, Y.; Xu, Q. Understanding the Relationships between Landscape Eco-Security and Multifunctionality in Cropland: Implications for Supporting Cropland Management Decisions. Int. J. Environ. Res. Public Health 2023, 20, 1938. [Google Scholar] [CrossRef]
  57. Wang, Y.; Cheng, L.; Zheng, Y. An Adjusted Landscape Ecological Security of Cultivated Land Evaluation Method Based on the Interaction between Cultivated Land and Surrounding Land Types. Land 2023, 12, 833. [Google Scholar] [CrossRef]
  58. Wu, Y.; Zhang, W. The Impact of Land Transfer on Sustainable Agricultural Development from the Perspective of Green Total Factor Productivity. Sustainability 2024, 16, 7076. [Google Scholar] [CrossRef]
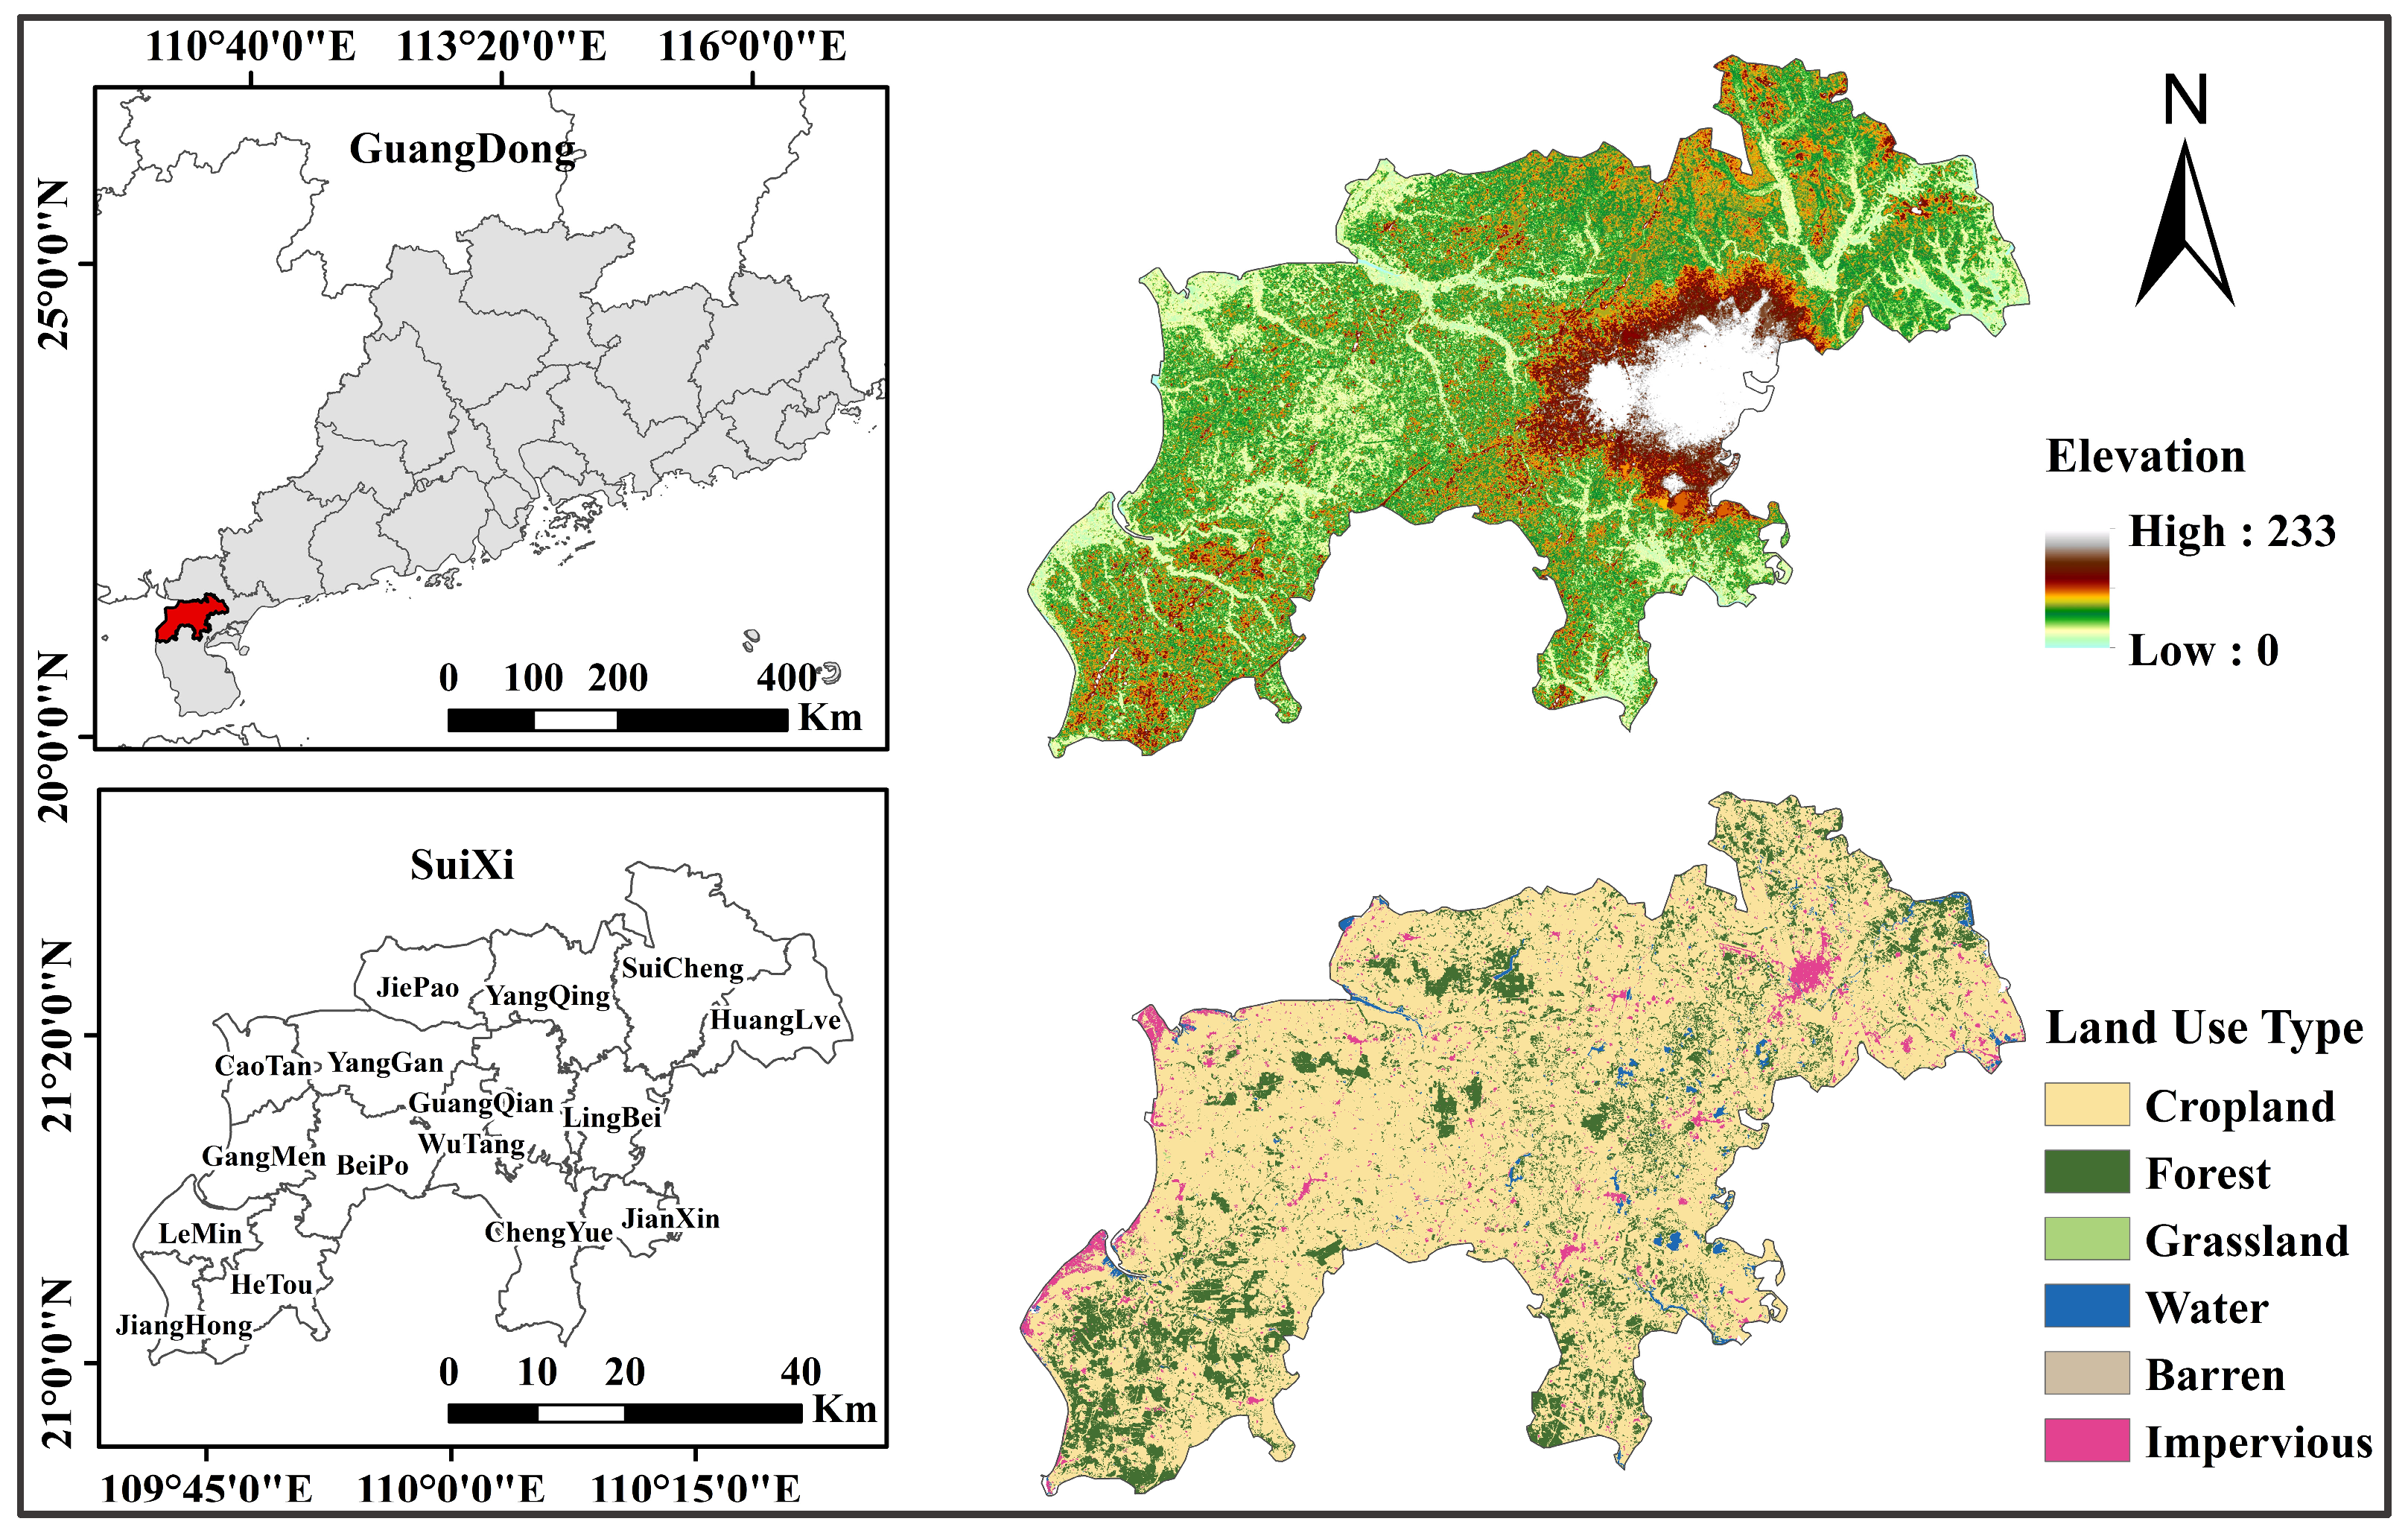
Figure 1. Geographical location and land use major structure of studied area.
Agriculture 15 01803 g001
Figure 2. Operational framework for delineation and multi-criteria evaluation of cultivated land concentration and contiguity.
Agriculture 15 01803 g002
Figure 3. In situ documentation of field reconnaissance.
Agriculture 15 01803 g003
Figure 4. PCI evaluation of cultivated land patches in Suixi County (2019–2023).
Agriculture 15 01803 g004
Figure 5. Spatiotemporal dynamics of PCI assessment for cultivated land patches in Suixi County (2019–2023). ((a1): Partial patch distribution in PCI-increased zones (2019); (a2): Corresponding patch patterns in PCI-increased zones (2023); (b1): Partial patch distribution in PCI-decreased zones (2019); (b2): Corresponding patch patterns in PCI-decreased zones (2023)).
Agriculture 15 01803 g005
Figure 6. Comparison of the number of connected cultivated land patches under different connection methods from 2019 to 2023.
Agriculture 15 01803 g006
Figure 7. PAI and PSI evaluation of cultivated land patches in Suixi County (2019–2023).
Agriculture 15 01803 g007
Figure 8. Grades of cultivated land concentration and contiguity in Suixi County (2019–2023).
Agriculture 15 01803 g008
Table 1. Evaluation indicators and their weights for cultivated land concentration and contiguity.
IndicatorsFormulaIndicator MeaningWeight
Patch Connectivity Index P C I i = n = j m ω j b j 1 l ¯ j / L j inter-patch spatial connectivity0.43
Patch Area Index P A I i = ( log A i log A m i n ) / ( log A m a x log A m i n ) relative patch area magnitude0.39
Patch Shape Index P S I i = 0.25 P i / A i patch shape regularity0.18
Notes: w j is the resistance weight of the j -th connecting element contributing to concentrated contiguous patch formation; l ¯ j is the average width (m) of the j -th connecting element within the patch; L j is the width threshold (m) of the j -th connecting element within the patch; A i is the area (m2) of patch i ; A m a x and A m i n are the maximum and minimum areas (m2) of patch i , respectively; P i is the perimeter (m) of the cultivated land patch; A i is the area (m2) of the cultivated land patch. A higher P C I i value indicates stronger connectivity between the target cultivated land patch and adjacent patches, reflecting enhanced capacity for material, energy, and information flows, and serves as a positive indicator; the P A I i value ranges between 0 and 1, with larger values signifying greater relative area of the cultivated land patch (also a positive indicator); P S I i value closer to 1 demonstrates higher geometric regularity of cultivated land patches.
Table 2. Interpretation of the pairwise comparison scale.
Scale ValueInterpretation
1Equal importance
3Moderate importance
5Strong importance
7Very strong importance
9Extreme importance
2, 4, 6, 8Intermediate values
ReciprocalsInverse comparisons (1/3, 1/5……)
Table 3. Statistical characteristics of patch connectivity during 2019–2023.
YearTotal PatchesCompletely Disconnected PatchesAverage Connectivity per PatchAverage Patch Area (km2)
201938,356394720.024
202349,909425930.019
Table 4. Cultivated land concentration and contiguity grade transition matrix (2019–2023) (km2).
2023
Grade IGrade IIGrade IIIGrade IVGrade VSum
2019Grade I1.352.310.130.003.79
Grade II0.27235.3934.805.000.45275.92
Grade III0.0825.04375.096.720.17407.09
Grade IV0.0135.8645.91119.880.67202.34
Grade V0.102.295.275.2512.91
Sum1.71298.71458.22136.876.54902.05
The symbol “—" denotes class stability with null areal variation, while “0.00” indicates statistically negligible values at the given precision.
Disclaimer/Publisher’s Note: The statements, opinions and data contained in all publications are solely those of the individual author(s) and contributor(s) and not of MDPI and/or the editor(s). MDPI and/or the editor(s) disclaim responsibility for any injury to people or property resulting from any ideas, methods, instructions or products referred to in the content.