Article

Comparative Assessment of Fractional and Erosion Plot Methods for Quantifying Soil Erosion and Nutrient Loss Under Vetiver Grass Technology on Two Contrasting Slopes in Rainforest Agroecology

1
Agricultural Clean Watershed Research Group, Institute of Environment and Sustainable Development in Agriculture, Chinese Academy of Agricultural Sciences (CAAS), Haidian District, Beijing 100081, China
2
Department of Soil Resources Management, University of Ibadan, Ibadan 200284, Nigeria
3
Department of Soil Science and Land Management, University of Uyo, Uyo 520003, Nigeria
4
Department of Soil Science and Land Management, University of Benin, Benin 300283, Nigeria
*
Author to whom correspondence should be addressed.
Agriculture 2025, 15(16), 1762; https://doi.org/10.3390/agriculture15161762
Submission received: 26 June 2025 / Revised: 11 August 2025 / Accepted: 12 August 2025 / Published: 16 August 2025
(This article belongs to the Special Issue Assessing Soil Erosion and Associated Nutrient Losses in Agrosystems)

Abstract

The erosion plot method (EPM) is the most accurate method for measuring total runoff and soil loss in the field, but it is expensive, time-consuming, and tedious to use, thereby limiting the scope of soil erosion research. Alternatively, the fractional method (FM) involves measuring a portion of total runoff and soil loss to estimate the total erosion. Although the FM may be easier to use in rainforest agroecology, it has not been evaluated under vetiver grass technology (VGT). Thus, a 2-year field study was conducted to verify the efficacy of the FM under VGT by comparing soil nutrient erosion between the FM and the EPM on two slopes (5% and 10%). Three piped drums (left, central, and right) were used to collect total runoff under the EPM, while only a central piped drum was used under the FM (usual practice). The FM’s runoff and soil loss values were similar to those under the EPM (R2 = 0.98–0.99; p < 0.001). Runoff nutrients (R2 = 0.90; p < 0.001) and eroded nutrients (R2 = 0.97; p < 0.001) from the FM were highly similar to those of the EPM on the 5% slope. Similarly, runoff nutrients (R2 = 0.86; p < 0.001) and eroded nutrients (R2 = 0.95; p < 0.001) from the FM were strongly similar to those of the EPM on a 10% slope. The FM accounted for 92% of the total nutrient erosion measured by the EPM under VGT management. Thus, the FM will make research more efficient, cost-effective, and attractive, particularly in large-scale water erosion studies.

1. Introduction

Globally, water erosion is a major environmental problem that threatens the ability of the soil to produce crops on a sustainable basis [1]. It is regarded as the number one threat to soil functions (infiltration, storage of water, retention of plant nutrients, and carbon sequestration) in many countries [2,3]. The impact of soil nutrient erosion is very prominent in Nigeria due to the high rainfall erosivity and soil erodibility coupled with undulating topography, resulting in poor crop productivity. Shimeles et al. [4] and Adegboyega [5] reported that severe soil and nutrient loss caused by heavy rainfall affects the production of crops such as maize, millet, and sorghum in West African countries, including Nigeria. In an experiment that also affirmed the impact of topography on erosion, Oshunsanya et al. [6] reported that a 10% slope produced more runoff (61.2%) and soil loss (77.4%) than a 5% slope. To control erosion, researchers have developed several soil conservation measures, such as contour bunding, terracing, mulching, vetiver grass hedgerows, etc. Among the biological erosion control measures, vetiver grass technology (VGT) has been most effective in controlling soil erosion [7,8,9].
VGT is a vegetative obstacle or a hedge of grass planted across the direction of water flow in the field. It reduces runoff velocity and traps soil particles (sediments) carried by runoff, consequently increasing runoff water infiltration. Vetiver grass hedgerows are suitable for performing these functions due to their stiff, dense, porous, and interwoven arrangement of foliage [9,10]. In many countries, vetiver grass hedgerows have effectively curtailed soil erosion and improved crop yields. For instance, research shows that they decreased soil loss by 75%, increased cassava yield by 3.2%, reduced runoff by 31–69%, and improved maize yield by 21–49% in Nigeria [6,11,12,13]. Similarly, it was reported that VGT stabilised slopes in Australia by reducing runoff water and erosion rates on a steep slope [9]. Therefore, the vetiver grass hedgerows management system is a desirable measure for soil erosion control.
One of the problems hindering the study of soil erosion in the field is the cost of setting up the experiments [14,15]. Consequently, many erosion studies are usually simulated in the laboratory, which may not precisely reflect the reality in the field [16]. Accurate measurement of water erosion is necessary for any conservation method to be reliable and adaptable for end-users (farmers). The erosion plot method (EPM) has been the most accurate method of measuring the total runoff water on the runoff plots. Under the EPM, several pipes convey runoff and soil loss into a corresponding number of drums, and soil erosion measurements are taken from these drums. However, this method is limited because it is cumbersome, highly expensive, time-consuming, and tedious [14,17]. In addition, it is usually difficult to measure soil water erosion when the time interval between two successive rainfall events is short, especially in rainforest agroecology. This is because sufficient time is needed to measure runoff, empty the drums, and wash them in preparation for the next rainfall. Thus, the fractional method (FM) was developed as an alternative method of measuring water erosion in the field by soil water conservationists. The FM of measuring water erosion is a process by which a fraction (a representative) of the entire runoff is measured and used to estimate the total runoff and soil loss in the field. Under the FM, effluent from only one pipe, amongst others, is conveyed into a drum, where a soil erosion measurement is taken. The measurement taken is considered to be representative of the effluent that is conveyed by other pipes. Many researchers from different countries have embraced this technology because it is cheap, easy to operate, and requires less time [6,12,18,19]. For the fractional measurement of soil nutrient erosion to be reliable, it must be truly representative of the total runoff and soil nutrient loss as measured by the erosion plot method. However, no study has compared the erosion plot method and fractional method in a high-rainfall agroecological environment to ascertain the agreement between the methods. Lang [18] compared the concentrations of runoff at different depths within the runoff drum; he did not compare the fractional method with the erosion plot method. He concluded that sampling with a bottle at the bottom of the runoff drum, where the soil water was vigorously stirred, resulted in an underestimation of sediment concentration by a range of −17 to −74%. Similarly, the liquid content was stirred, and the mixture was sampled simultaneously at three depths in the runoff drum, with the average concentration used to represent the entire depth of the mixture content [20]. The authors also noted an underestimation (−6 to −66%) of the mixture’s concentration, which was attributed to non-uniform sediment distribution in the runoff drum. Based on the above literature, we hypothesised that fractional methods of determining water erosion can quantitatively estimate the field’s entire runoff and soil nutrient loss, if correctly set up and representative samples are taken. Accurate water erosion measurements will help to enhance decision-making processes on soil conservation and sustainability. To date, the accuracy of measurement of soil nutrient erosion using the fractional technique has not been ascertained worldwide. The objective of this research was to compare the fractional and erosion plot methods of measuring runoff and soil nutrient loss under VGT on two contrasting slopes in the Nigerian rainforest agroecology.

2. Materials and Methods

2.1. Experimental Site

The Teaching and Research Farm of the University of Uyo, Nigeria, was used for the experiment, with latitudes 4°30′ and 5°3ʹ N and longitudes 7°31′ and 8°20′ E, in 2021 and 2022 (Figure 1). The site is a humid tropical rainforest with an altitude ranging from 78 m to 103 m above sea level. The area has two seasons: a wet season that lasts 7 months (April–October), and a dry season that lasts 5 months (November–March). The annual rainfall ranges from 2000 to 3000 mm, with a mean temperature that varies between 26 °C and 30 °C, and relative humidity ranging from 75% to 95% [21].
The experimental site has a sandy soil texture (899 g kg−1 sand, 44 g kg−1 silt, and 57 g kg−1 clay), with a pH of 5.3 and an organic carbon content of 5.20 g kg−1. The bulk density and total soil porosity are 1.47 Mg m−3 and 0.45 m3 m−3, respectively. The chemical properties include total nitrogen (0.26 g kg−1), available phosphorus (11.80 Mg kg−1), potassium (0.30 cmol kg−1), calcium (2.43 cmol kg−1), and magnesium (1.53 cmol kg−1).
Uyo is a lowland with an undulating topography. The soil is deep, with porous red soil typified by well-graded acid sand with low-activity clay that discourages soil aggregation. Soils developed on coastal plains are acid sands [22], prone to water erosion. The soil of the area is an Ultisol with the order of Typic Kandiudult according to the USDA classification [23]. Ultisols are distinguished by high clay mineral translocation to accumulate in the argillic or kandic horizon with low-activity clay, making the site prone to erosion. It is also characterised by the leaching of base-forming cations in the profile, low base saturation (≤35%), low cation-exchange capacity, and high acidity, which encourage a generally low fertility status [24]. The soils are highly susceptible to disintegration and sliding due to the high rainfall erosivity frequently experienced in Uyo [25]. Commonly grown crops include tree crops (cocoa, oil palm, rubber, coffee, cotton) and arable crops (cassava, yams, cocoyams, potatoes, melons, groundnut, rice, maize, and cowpeas) [1].

2.2. Nursery and Field Establishment of Vetiver Grass Hedgerows

Fresh and mature vetiver grass clumps were collected from the University of Ibadan. Harvested vetiver grass slips were trimmed to 30 cm long, packed inside kenaf-sack bags, and moistened to prevent the grass from drying when transported to Uyo. The nursery was established on 5 April 2020 by carefully splitting the mother clump into tillers. The latter were planted in the nursery during the rainy season to facilitate quick and vigorous growth. The vetiver grass was transplanted in the field when the grasses were 6 months old. The vetiver grass hedgerows were established in the field by digging a groove (500 cm long, 25 cm wide, and 25 cm deep) across the slope for each vetiver grass hedgerow (Figure 2). The clumps from the nursery were slit into slips, trimmed to 20 cm height, and planted at a spacing of 10 cm intervals at two slips per stand. When the vetiver grass strips were fully established in March 2021, trimming of the strips was carried out three times per year using secateurs to prevent the grass from shading crops (Figure 2).

2.3. Rainfall and Precipitation Concentration Index Determination

A standard rain gauge was installed in the field to measure the amount of rainfall, as described in [26]. The precipitation concentration index (PCI) was calculated using the Modified Fournier Index equation, as presented in Equation (1) [26]:
P C I a n n u a l = i = 1 n X i 2 p
where i = number of months, X = monthly rainfall (mm), and P = average annual rainfall (mm).
The PCI classification scale developed in [27,28] was adopted as follows: PCI < 10 indicates low rainfall concentration, PCI values of 11–15 indicate moderate rainfall concentration, PCI values of 16–20 indicate an irregular rainfall distribution, and PCI > 20 indicates a strong irregularity (high rainfall concentration).

2.4. Experimental Plot Description, Installations, and Measurement of Soil Erosion

The experiment was carried out at two sites with varying slopes (5% and 10%). Each site had 0.36 ha of land area. Each runoff plot was 60 m × 5 m. The experiment consisted of four treatments: (i) vetiver grass hedgerows spaced at 10 m intervals down the slope (VGH10), (ii) vetiver grass hedgerows spaced at 20 m intervals down the slope (VGH20), (iii) vetiver grass hedgerows spaced at 30 m intervals down the slope (VGH30), and a plot without vetiver grass (control). The four treatments were replicated three times across the slope, amounting to 12 plots. The experiment was carried out for two years (2021 and 2022).
Twelve runoff plots were established on each slope. Each plot (60 m × 5 m in dimension) was demarcated using asbestos sheets 50 cm high. Half the height of the sheets was buried in the soil, while the other half prevented runoff from crossing to the adjoining plots.
At the bottom end of each plot, the runoff collection devices, made up of concrete weirs (30 cm high), were constructed to channel runoff into a slanty cemented ditch (120 cm long, 30 cm wide, and 10 mm deep). The ditch received runoff and soil nutrient loss, and then conveyed effluent into three PVC pipes at the same level (Figure 2). The three PVC pipes (1 m long and 10 cm in diameter) shared the entire 30 cm width of the lower side of the ditch, and they channelled the runoff into their respective drums (90 cm high and 58 cm in diameter). In this study, the runoff collection device for the erosion plot method consisted of three drums used to measure the total runoff and soil nutrient loss from the field. However, only the central piped drum was used under the fractional method to estimate runoff and soil nutrient loss. A trench was constructed to accommodate 36 drums on each slope (Figure 2). Each drum had a tap at its base, which was used to discharge runoff. Runoff and soil loss were determined as described in [29]. To determine the volume of runoff collected in the drum, the height (h) of runoff water inside the drum and the radius (r) of the drum were calculated using Equation (2):
R u n o f f   v o l u m e = π r 2 h
Runoff in mm was obtained using Equation (3):
R u n o f f = i = 1 n v o l .   o f   w a t e r   ( m m 3 ) a r e a   o f   p l o t   ( m m 2 )
One-litre aliquots were taken from the top, middle, and bottom of the drum after the contents (sediment and runoff) had been well mixed to achieve a homogeneous concentration [30]. The sediment retained after filtration (paper type: Whatman No. 1, pore size: 1.2 µm) was oven-dried at 105 °C for 24 h, weighed, and compared with another weight of filter paper of the same size after filtration of an equal volume of pure water, which served as a control [31]. In this study, the estimation of soil loss (Mg ha−1) was based on runoff volume and sediment content, excluding a negligible amount of soil particles in the ditch. This was due to the interception of coarse particles by the dense and highly interwoven configuration of the VGH. Soil loss from each plot was calculated using Equation (4):
S o i l   l o s s M g   h a 1 = s o i l   l o s s   ( M g ) a r e a   ( h a )

2.5. Determination of Runoff and Sediment Nutrients

Composite samples were taken for nutrient analysis after thoroughly stirring the contents of the runoff drums. The samples were kept in the bottles and refrigerated for 5 h in the laboratory for sedimentation. Thereafter, the topmost water in each bottle was collected for runoff nutrient analysis and estimation of runoff-associated nutrient outflow. Runoff nutrient analysis was carried out, and nutrient losses from runoff for each plot were estimated by multiplying the average concentration for each nutrient in the runoff by the total runoff volume. In the same way, the settled sediment in the containers was air-dried and used for analysis of soil nutrient losses. Water samples were analysed to determine nitrate nitrogen (NO3N) and phosphate phosphorus (PO4P). Runoff Ca, Mg, K, Mn, and Zn levels were determined using standard methods described in [32]. The eroded sediments were sieved with a 0.5 mm sieve and thereafter analysed to determine the sediment-associated nutrients. Organic carbon (OC) was determined by the Walkley–Black wet oxidation method [33]. Total nitrogen (N) was determined by the Kjeldahl method. Available phosphorus (P) was determined using Bray’s P1 method [34] and read with an atomic absorption spectrophotometer (AAS). Exchangeable cations (K, Mg, and Ca) were determined by first extracting the element from the soil sediment with 1 M NH4OAc (ammonium acetate) solution, as described in [32], and the K extract was determined using flame photometry, while the Ca and Mg extracts were read with atomic absorption spectrophotometry [32].

2.6. Cost Benefits of Using the Fractional and Erosion Plot Methods

Economic analysis was carried out to compare the gross profit margin for the conventional and fractional methods of soil erosion measurement. This was to ascertain the method that is more cost-effective for researchers. The items used for calculating the gross profit margin were the costs of drums, sampling, and nutrient analysis, which differ between the methods. The gross profit margin was calculated using Equation (5):
G r o s s   P r o f i t   M a r g i n % = T o t a l   i n c o m e C o s t   o f   p r o d u c t i o n C o s t   o f   p r o d u c t i o n × 100

2.7. Statistical Data Analyses

All data were first subjected to a normality test (Levene’s test) to verify the distribution pattern of the variables before being subjected to statistical analysis. The data for the two cropping seasons (2021–2022) had a normal distribution under the two contrasting slopes.
The runoff and soil loss obtained from the EPM and FM were compared using a paired T-test. Similarly, the runoff nutrients and soil nutrient losses obtained from the EPM and FM were subjected to paired comparison plot analysis. The correlation between nutrient losses (runoff nutrients and soil nutrient losses) from the EPM and FM was determined. To ascertain the comparability between the central pipe (used under FM) and the left and right pipes, the runoff nutrient losses from the three pipes were correlated. More importantly, the economic benefits of the FM and EPM were compared in terms of the costs of the drums, sampling, and nutrient analysis.

3. Results

3.1. Comparison of Runoff and Nutrient Loss Discharged Between the Fractional and Erosion Plot Methods

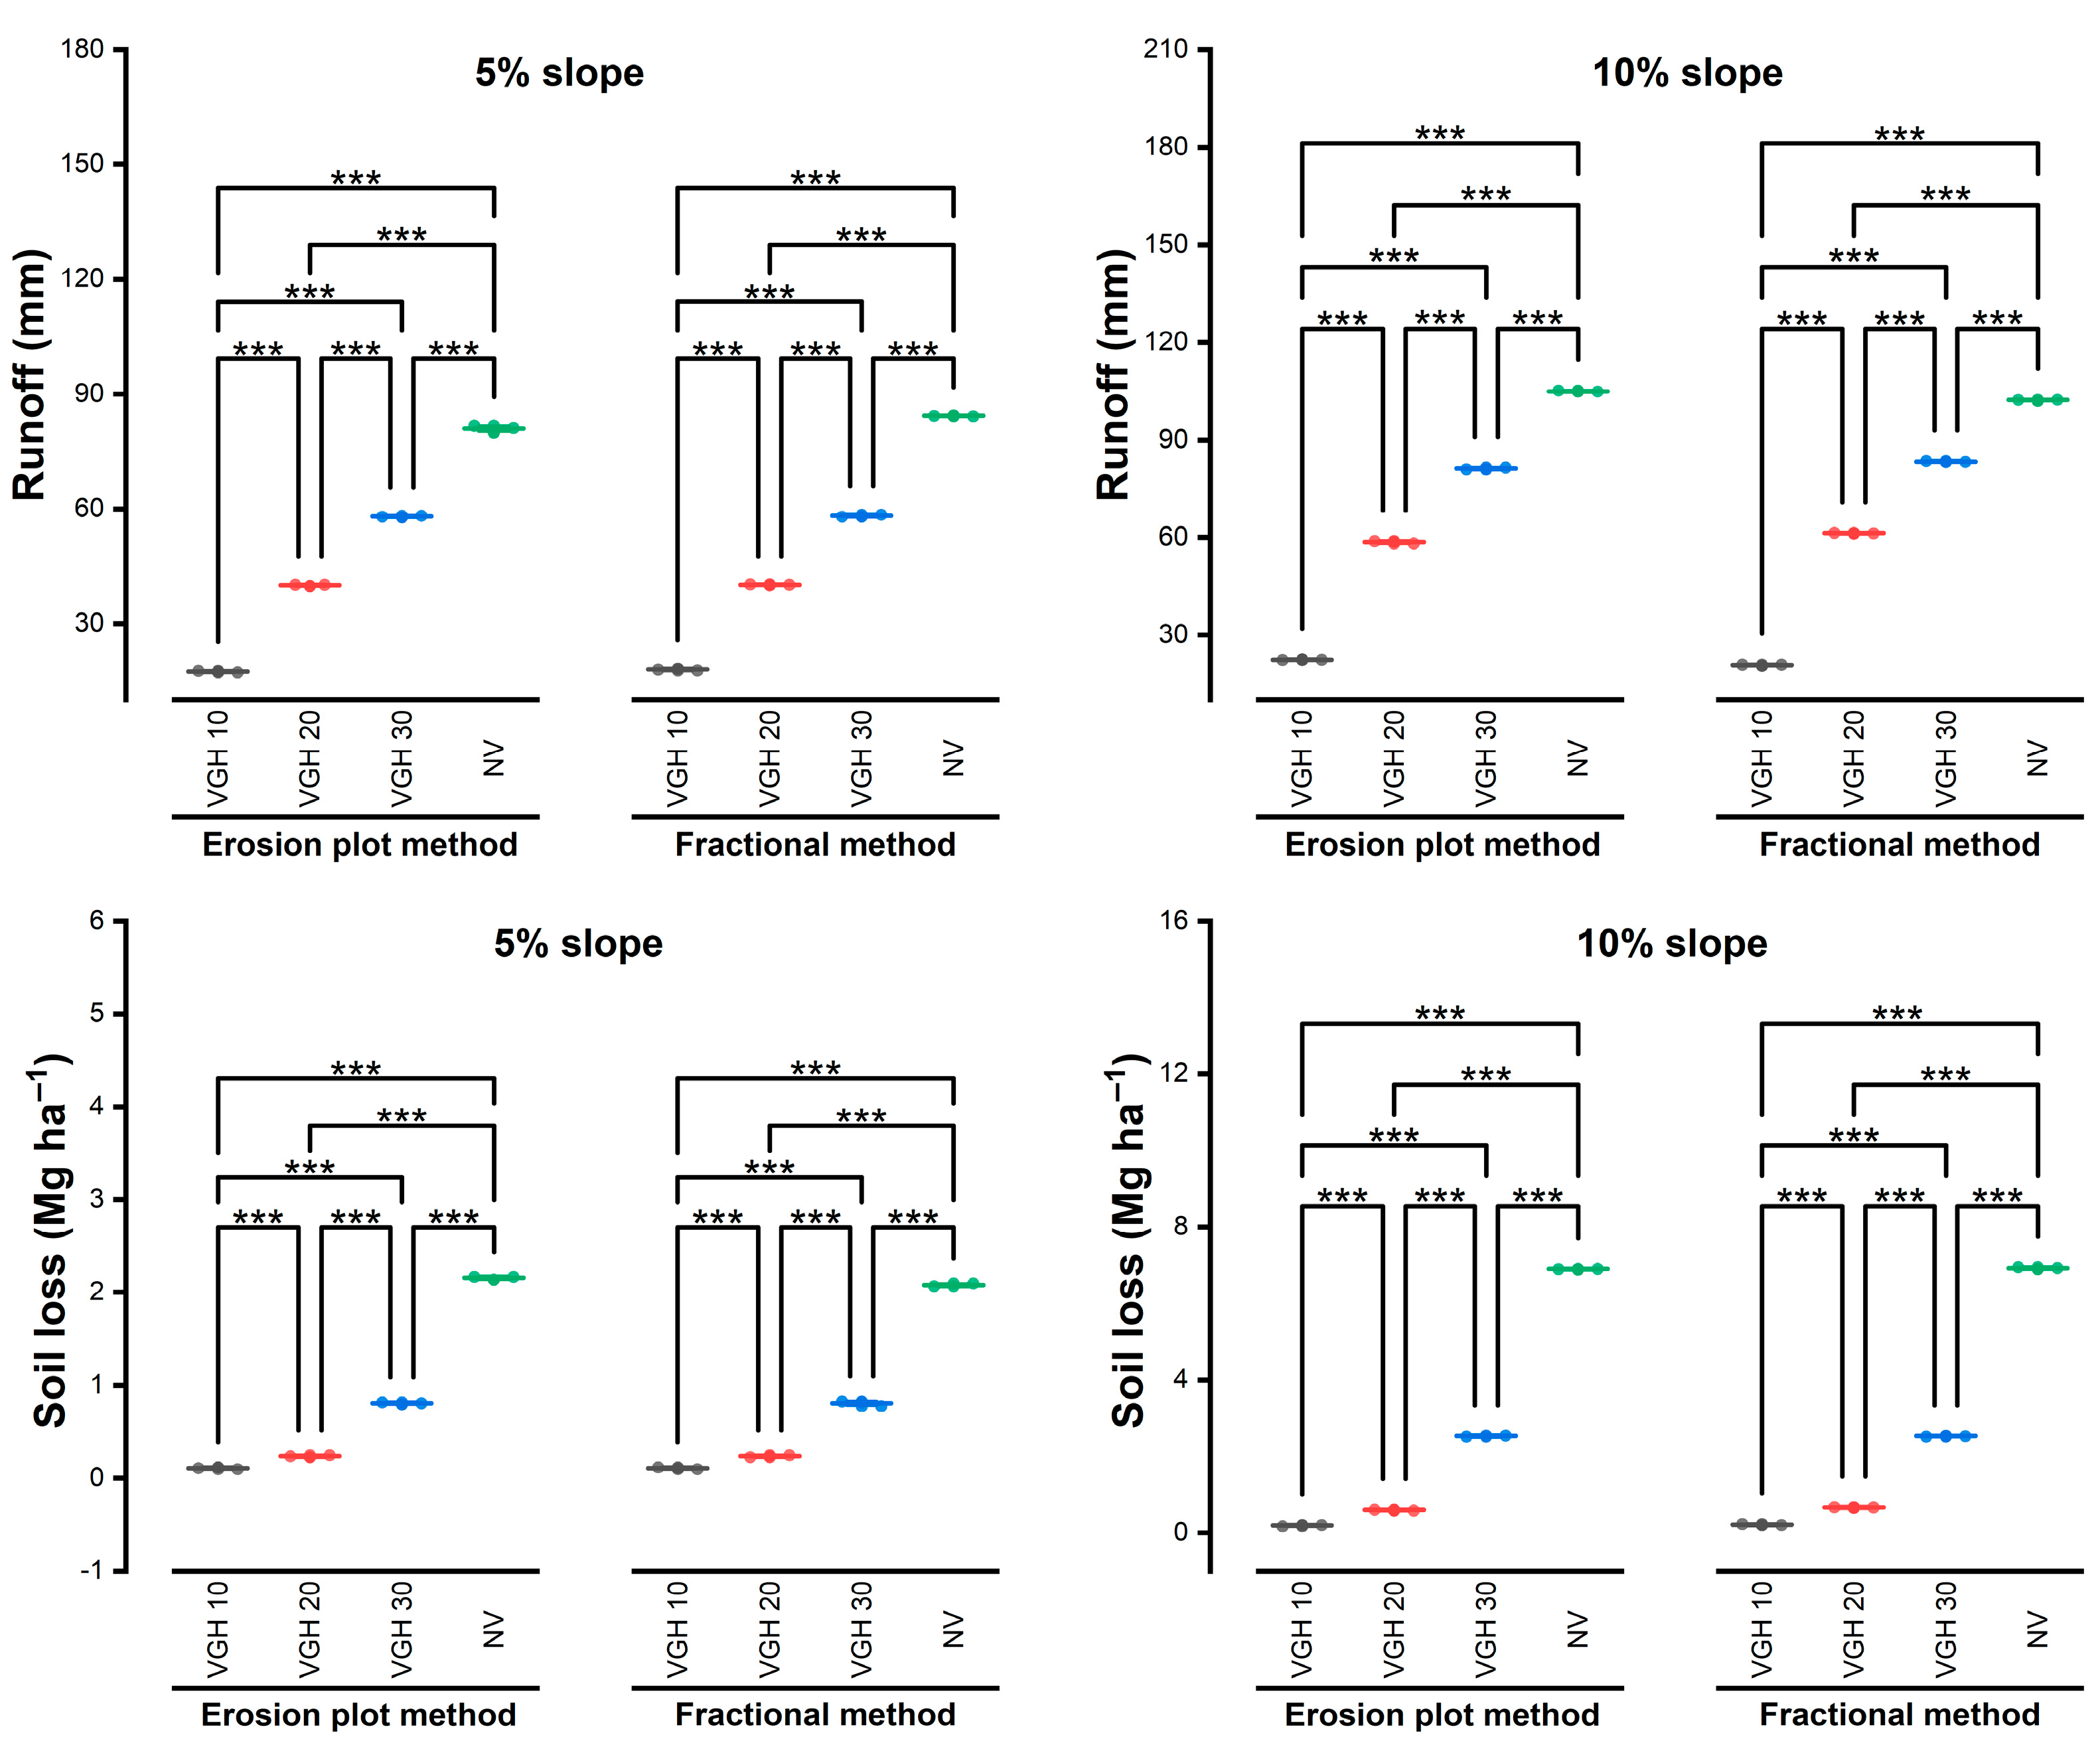
The runoff volumes from the FM and EPM were compared under the two contrasting slopes for the two years (Figure 3). The estimated runoff from the FM and EPM was nearly equal, with an infinitesimal difference of 0.2% for both slopes. Of the total runoff estimated for the two years, the slope did not affect the method of collecting runoff.
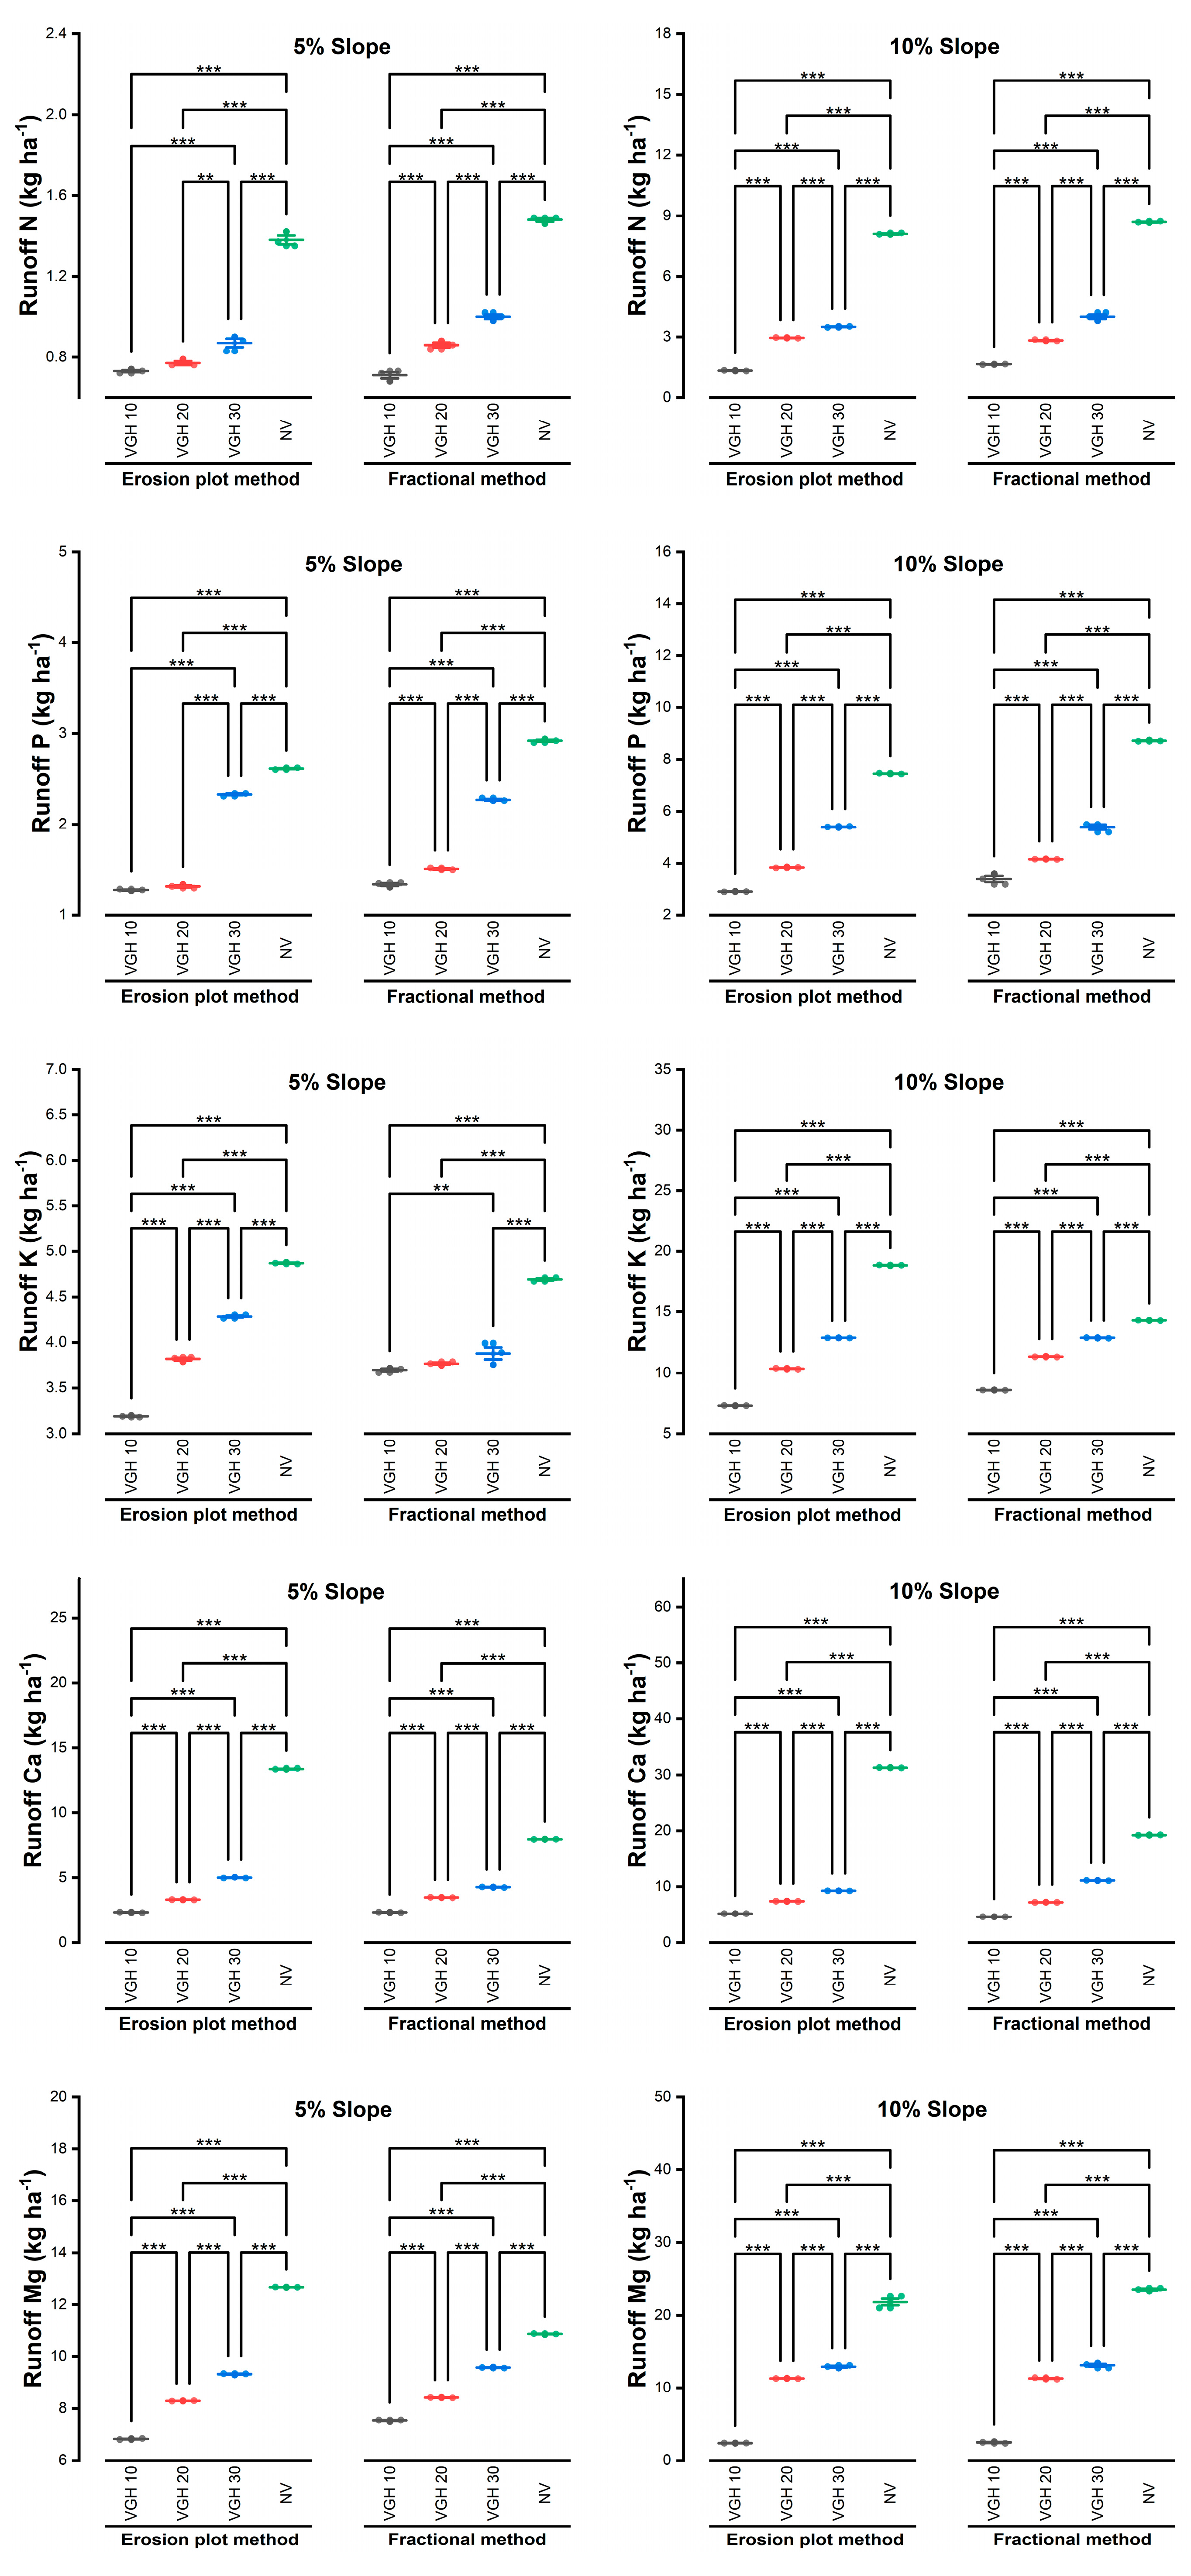
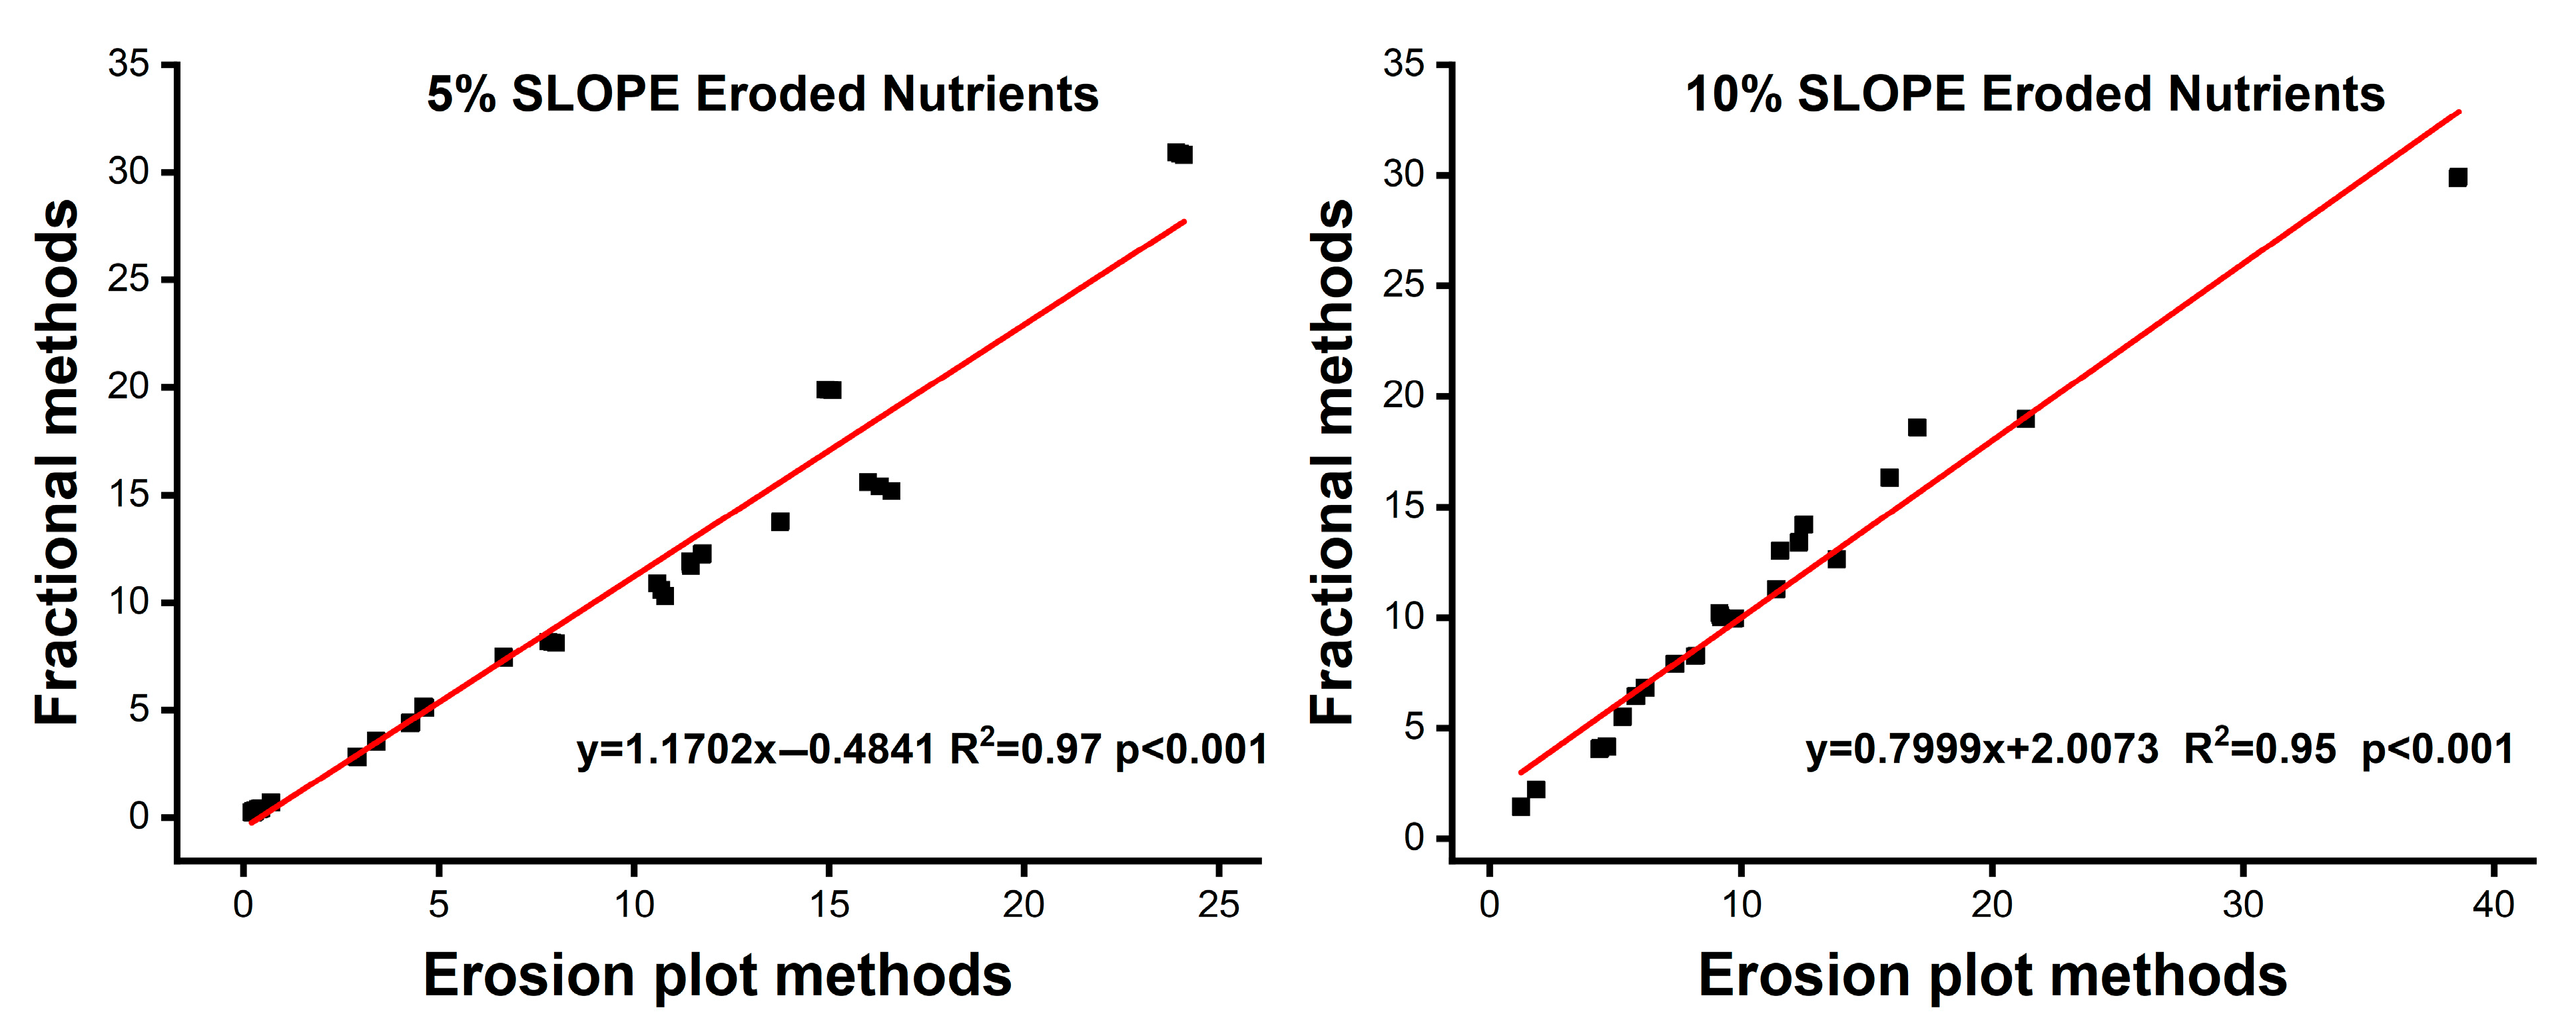
An assessment of runoff nutrients discharged by the FM and EPM on the two slopes is presented in Figure 4. On the two slopes, the runoff nutrients (NO3N, PO3P, K, Ca, and Mg) obtained from the FM were not significantly different from those of the EPM. In the first year, the nutrient concentrations from the FM deviated from those of the EPM by an average of 5.4% ± 0.03 on the 5% slope and 7.7% ± 0.14 on the 10% slope. In the second year, the concentration of runoff nutrients released by the FM deviated from that of the EPM by a mean of 5.1% ± 0.35 on the 5% slope and 3.8% ± 0.17 on the 10% slope. Regardless of slope, a strong relationship was observed in the runoff nutrients discharged by the FM and EPM (Figure 5). The runoff nutrients released from the FM were correlated (R2 = 0.90; p < 0.001) with those from the EPM on the 5% slope. In the same way, the eroded nutrients registered by the FM were significantly (R = 0.95; p < 0.001) correlated with the EPM results on the 10% slope.

3.2. Differences in Soil and Nutrient Losses Obtained from Fractional and Erosion Plot Methods
The differences in soil loss estimated by the FM and EPM for the two contrasting slopes are presented in Figure 3. On average, the soil loss produced by the EPM was 2.5% ± 0.00 higher than that produced by the FM on the 5% slope and 0.2% ± 0.01 higher on the 10% slope during the two years of the study. Overall, the slope did not affect the method of measuring soil loss.
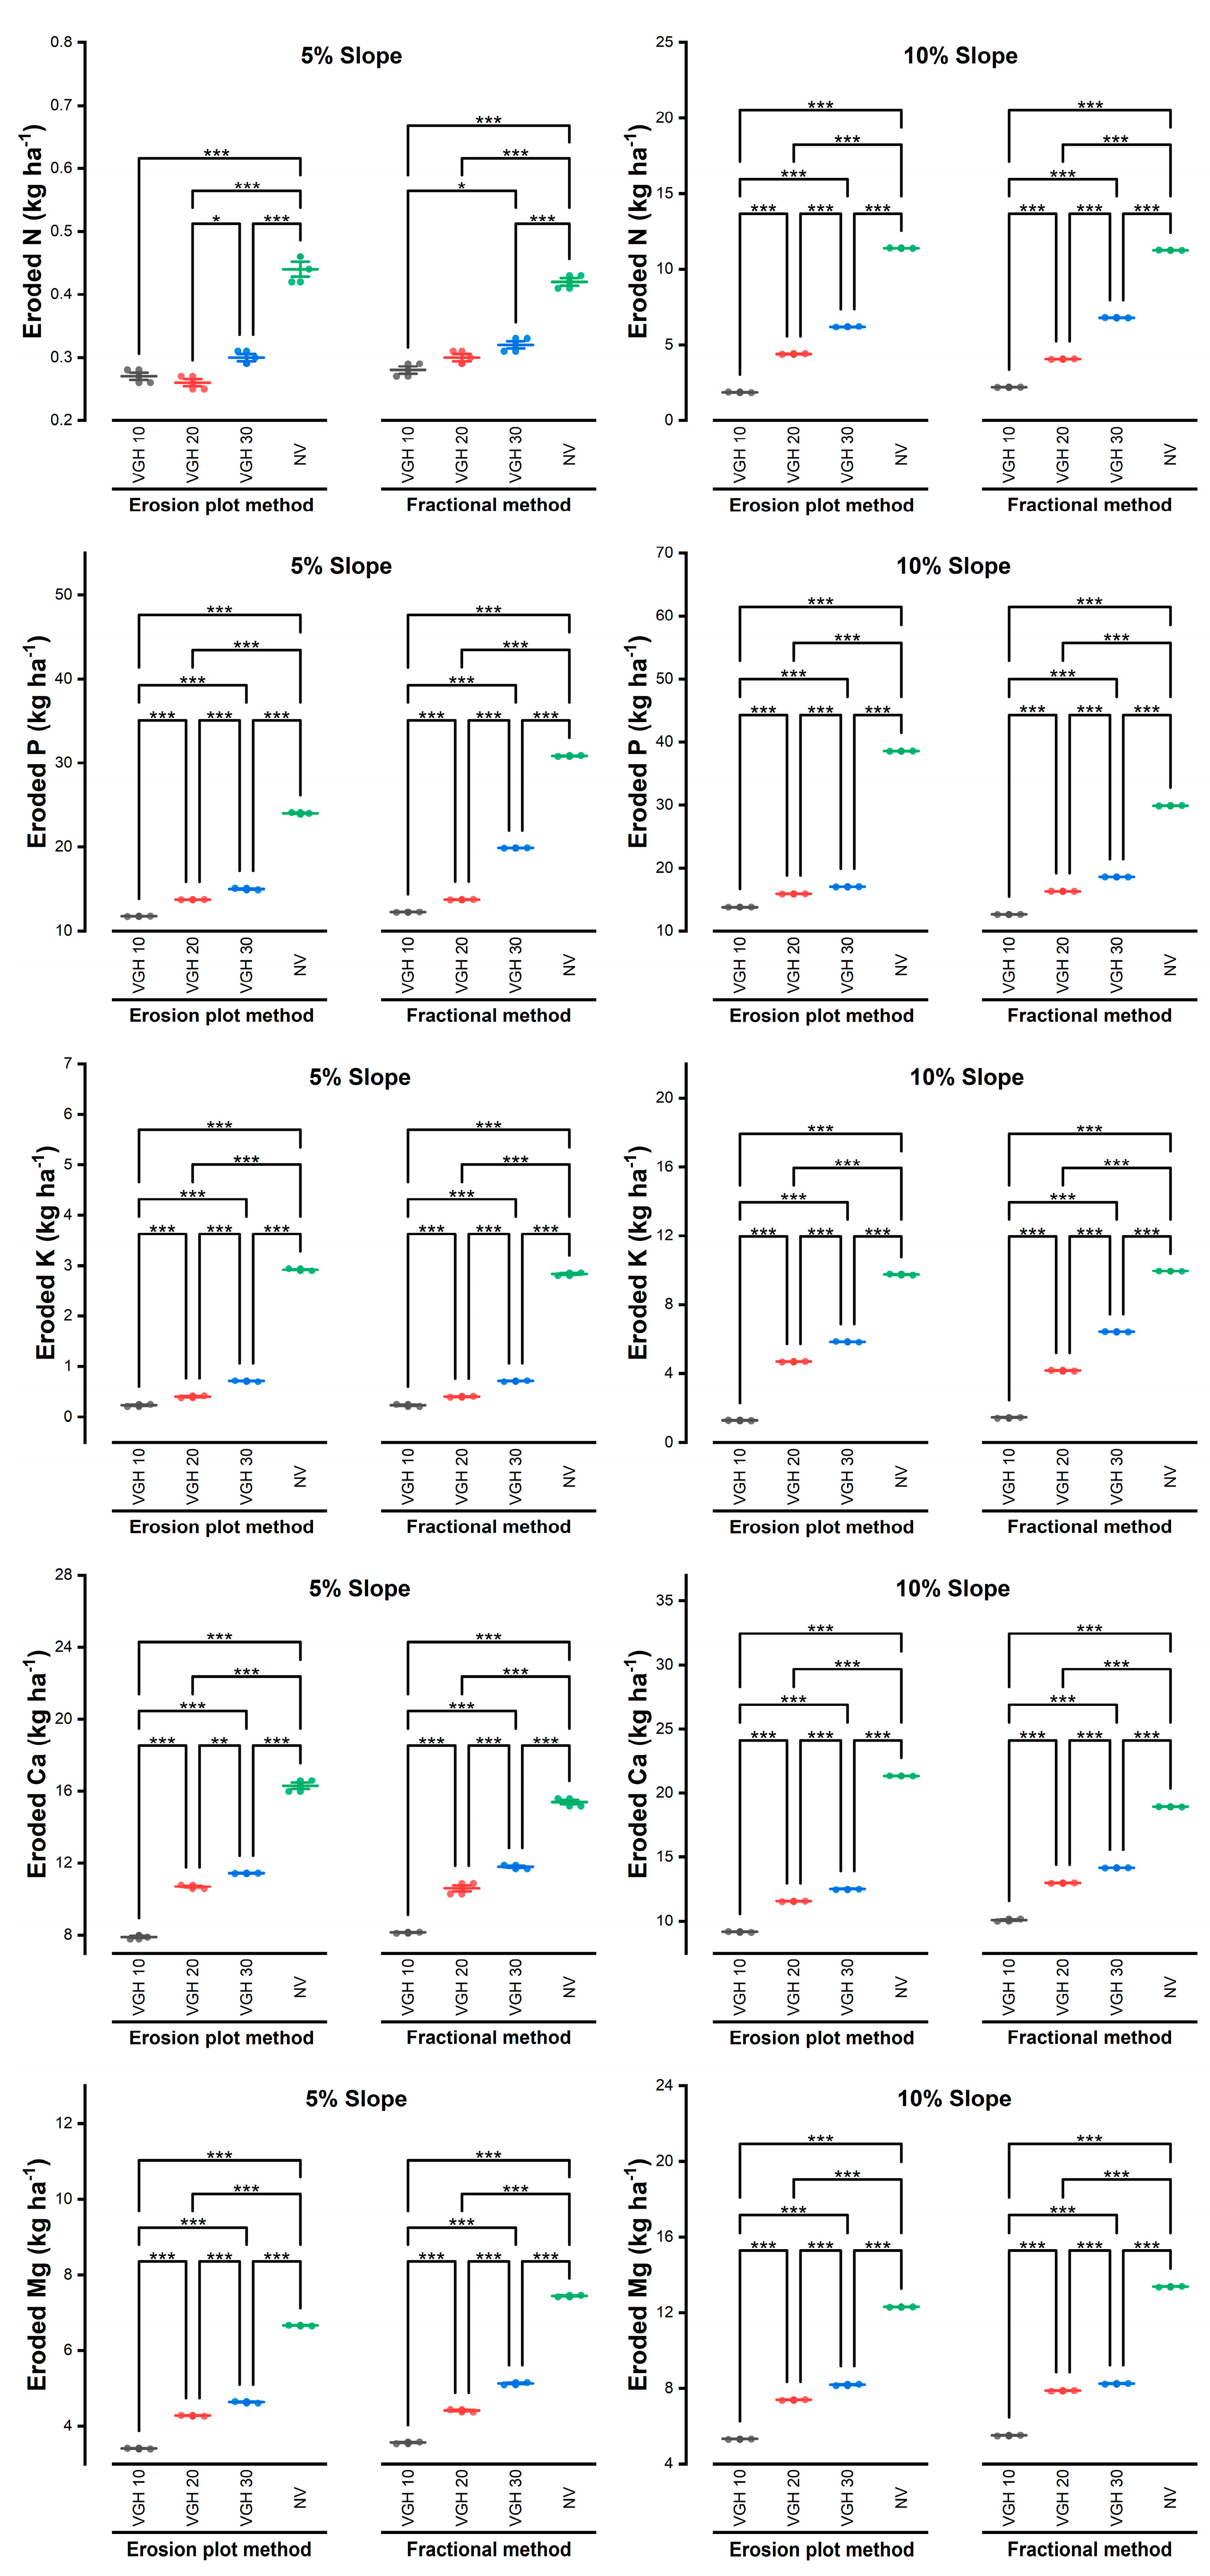
Figure 6 compares the soil nutrient losses discharged by the FM and EPM for the two slopes. The concentrations of eroded nutrients (NO3N, PO3P, Ca, Mg, and K) registered by the two methods varied on the 5% slope (0.7–9.9%) and 10% slope (0.3–7.9%). Regardless of the slope, the eroded nutrients estimated by the FM were similar to those of the EPM. Quantitatively, the FM deviated from the EPM by 5.0 ± 0.55 kg ha−1 and 4.0 ± 0.16 kg ha−1 eroded nutrients on the 5% and 10% slopes, respectively. There was a strong agreement between the FM and EPM for most soil nutrient losses on the 5% slope (R2 = 0.97 at p < 0.001) and the 10% slope (R2 = 0.95 at p < 0.001) (Figure 5). On average, the FM can explain 96% of soil nutrient losses observed by the EPM on 5% and 10% slopes in rainforest agroecology.
Figure 6. Comparison of eroded soil nutrients from fractional and erosion plot methods on two contrasting slopes in rainforest agroecology. VGH10, VGH20, VGH30: mean vetiver grass hedgerows at 10 m, 20 m, and 30 m surface intervals, respectively; NV means no vetiver (control); *, ** and *** indicate significant difference at p < 0.05, p < 0.01 and p < 0.001, respectively. Runoff nutrients (NO3N, PO3P, K, Ca, and Mg) infinitesimally differed among the three piped drums (Table 1). Most of the runoff nutrients in the central-piped drum correlated with those of the right- and left-piped drums on the two slopes (Figure 7). Overall, the central-piped drum (source of FM) explained ≥98% to ≤99% of the left- and right-piped drums.
Agriculture 15 01762 g006
Figure 7. Relationship between nutrients discharged into the right-piped drum, left-piped drum, and central-piped drum on two contrasting slopes.
Agriculture 15 01762 g007
Table 1. Comparison among the right-piped drum, central-piped drum, and left-piped drum in terms of runoff and soil loss for two contrasting slopes in rainforest agroecology.
Left-Piped DrumCentral-Piped DrumRight-Piped Drum X ¯ CV (%) Left-Piped DrumCentral-Piped DrumRight-Piped Drum X ¯ CV (%)
Year 1 Year 2
5% Slope
Runoff (mm)VGH105.46 ± 0.035.93 ± 0.035.80 ± 0.035.73 ± 0.035.1 5.55 ± 0.006.13 ± 0.056.51 ± 0.006.06 ± 0.027.3
VGH2010.81 ± 0.0112.23 ± 0.0112.06 ± 0.0111.70 ± 0.017.02 13.42 ± 0.0014.45 ± 0.0014.74 ± 0.0014.20 ± 0.006
VGH3018.67 ± 0.0217.83 ± 0.0217.70 ± 0.0218.07 ± 0.022.9 21.83 ± 0.0021.41 ± 0.0022.50 ± 0.0121.91 ± 0.015
NV26.37 ± 0.0128.17 ± 0.0126.07 ± 0.0126.87 ± 0.014.65 29.65 ± 0.0227.45 ± 0.0328.33 ± 0.0128.48 ± 0.023.89
Soil loss (kg ha−1)VGH1030.56 ± 0.0231.89 ± 0.0430.75 ± 0.0231.07 ± 0.035.18 33.93 ± 0.0134.13 ± 0.0235.93 ± 0.0134.66 ± 0.013.18
VGH2062.15 ± 0.0262.52 ± 0.0261.84 ± 0.0262.17 ± 0.026.2 81.40 ± 0.0179.47 ± 0.0182.13 ± 0.0181.00 ± 0.011.7
VGH30242.67 ± 0.01249.55 ± 0.01261.08 ± 0.01251.10 ± 0.015.1 270.00 ± 0.01274.43 ± 0.01268.57 ± 0.01271.00 ± 0.011.13
NV692 ± 0.01671.23 ± 0.01730.47 ± 0.02697.90 ± 0.014.31 737.33 ± 0.01715.15 ± 0.01778.52 ± 0.01743.67 ± 0.014.32
10% slope
Runoff (mm)VGH1011.27 ± 0.0211.15 ± 0.0111.18 ± 0.0111.20 ± 0.018.62 12.87 ± 0.0112.25 ± 0.0111.38 ± 0.0012.17 ± 0.013.9
VGH2018.52 ± 0.0118.81 ± 0.0118.07 ± 0.0018.47 ± 0.013.9 19.18 ± 0.0118.51 ± 0.0018.03 ± 0.0018.57 ± 0.004.21
VGH3033.00 ± 0.0034.03 ± 0.0033.27 ± 0.0233.43 ± 0.012.29 23.11 ± 0.0022.93 ± 0.0023.87 ± 0.0223.30 ± 0.012.29
NV53.40 ± 0.0352.10 ± 0.0151.90 ± 0.0252.47 ± 0.022.51 34.41 ± 0.0134.12 ± 0.0133.93 ± 0.0334.15 ± 0.022.51
Soil loss (kg ha−1)VGH1074.67 ± 0.0178.11 ± 0.0175.32 ± 0.0176.03 ± 0.015.58 90.27 ± 0.0289.82 ± 0.0186.92 ± 0.0189.00 ± 0.012.04
VGH20173.70 ± 0.01175.00 ± 0.01179.30 ± 0.01176.00 ± 0.013.06 216.67 ± 0.02228.00 ± 0.02213.33 ± 0.01219.33 ± 0.023.51
VGH30815.33 ± 0.02800.00 ± 0.00840.67 ± 0.01818.67 ± 0.016.88 866.00 ± 0.01848.67 ± 0.01902.33 ± 0.01872.33 ± 0.013.14
NV2090.33 ± 0.002257.33 ± 0.012376.33 ± 0.012241.33 ± 0.016.41 2210.00 ± 0.012297.00 ± 0.002367.00 ± 0.012291.33 ± 0.013.43
VGH10, VGH20, VGH30 = vetiver grass hedgerows at 10 m, 20 m, and 30 m surface intervals, respectively; NV means no vetiver (control); X ¯ = mean; SD = standard deviation; CV = coefficient of variation.

3.3. Comparison of Soil Erosion Discharged by the Central Pipe and Side Pipes

The runoff volume discharged by the central pipe was not significantly different from that discharged by the side pipes (left and right pipes) on the two contrasting slopes (Table 1), although the average runoff received by the central-piped drum slightly deviated from that of the left-piped drum and the right-piped drum—by 2.9% ± 0.77 and 3.8% ± 0.56, respectively—on the 5% slope. In the case of the 10% slope, the runoff in the central-piped drum was lower than that in the left-piped drum, by 1.0% ± 0.32, and higher than that in the right-piped drum, by 1.3% ± 0.15.
The positioning of the runoff pipe did not affect soil loss for both slopes (Table 1). The soil loss discharged by the three pipes into their respective drums was similar in quantity, with a 3.5% CV for the 5% slope and a 4.3% CV for the 10% slope (Table 1). The similarities in the concentrations of NO3N, PO4P, Ca, Mg, and K among the three piped drums are presented in Figure 7. Overall, the soil nutrient losses discharged by the central-piped drum were strongly correlated (R2 = 0.99; p ≤ 0.001) with those of the left-piped drum and right-piped drum for both the 5% and 10% slopes (Figure 7).

3.4. The Difference Between the Cost Analyses of the Fractional and Erosion Plot Methods

The soil erosion measurement cost analysis was separately compared between the EPM and FM for each slope over two years (Table 2). The adoption of the FM instead of the EPM attracted a gross margin of 13,926 USD yr−1 per 180 m2 land area (64.4% gain) for the 5% slope and 14,731 USD yr−1 per 180 m2 land area (65.0% gain) for the 10% slope. On average, using the FM for estimating runoff and soil loss is cheaper than using the EPM by 14,329 USD yr−1 per 180 m2 land area in a rainforest agroecological environment.

4. Discussion

4.1. Relationship Between Soil Erosion Produced by Fractional and Erosion Plot Methods

A close relationship exists between the runoff nutrients discharged by the fractional and erosion plot methods, regardless of the slope degree. The FM was able to account for 88% of the runoff nutrients measured by the EPM. The T-test analysis further supports the high degree of agreement between the runoff nutrients (NO3N, PO3P, K, Ca, and Mg) produced by the FM and EPM. This is due to the high interconnection (98% to 99%) between the runoff nutrients discharged by the three pipes that conveyed runoff and its associated nutrients into the drums. This can be attributed to having collecting samples at three levels (top, middle, and bottom) in the sedimentation drum, which helps overcome variations in the concentrations of the soil–water mixture within the drum [18,35]. According to Lang [18], the erosion plot method of measuring total sediment yield is preferable to dip sampling (use of a bottle or pipette) of soil–water mixtures in the drum to estimate runoff sediment. He attributed the poor sampling to the rapid settling of larger particles. In addition, the high degree of correlation between soil erosion produced by the FM and EPM could be attributed to the thorough agitation of the soil mixture when sampling. Paying less attention to this could significantly increase the sampling error [20,36]. In this study, vetiver grass hedgerows (VGHs) played a significant role in reducing runoff velocity and trapping coarse particles [10,12,13,19]. Thus, only dissolved fine particles diffused through the interwoven filter-like VGH. The ability of VGHs to sieve runoff soil loss content enhanced the uniform distribution of runoff into the pipes. The uniform distribution of runoff concentration among the pipes is highly dependent on the alignment of the pipes at the point where runoff is shared on the sloping land. The runoff from the three pipes was similar in volume and concentration, which suggests that each drum was a true representative of the other drums. Boardman and Evans [37] reported that volumetric estimation of water erosion rates is an acceptable method. Thus, implementing the FM will be less laborious and more efficient for erosion investigations. Under the FM, conducting extensive research on water erosion can be carried out with less stress.
Furthermore, the positioning of the pipes conveying soil erosion into the respective drums did not have an influence on the quantity and quality of runoff in the drums (left-piped drum, central-piped drum, and right-piped drum). The relationship between the three piped drums further demonstrated how the central-piped drum—typically employed for the FM—can represent the left- and right-piped drums in soil erosion studies (Figure 7). Although the runoff distribution (at the sharing point) into the drums varied slightly (standard error: ±0.00 to ±0.05), and there was a time lag between the stirring and sampling, the central-piped drum accounted for 99% of soil erosion discharged by the left- and right-piped drums. This result is consistent with our hypothesis that the FM can quantitatively estimate the total soil erosion measured by the EPM. Pampalone et al. [38] reported that predicted soil loss explained 88.9% of field-measured soil loss. Other studies [13,19,39,40] have also demonstrated that good results could be obtained for measuring soil erosion using the central pipe. Soil nutrient losses exhibited no variation among the drums. This can be attributed to the thorough mixing of the runoff and sediment in the drums and sampling at a uniform depth. In similar experiments conducted in [41] and [20], sampling was carried out at different depths within the same runoff drum to test whether there would be variations in concentrations. They concluded that the concentrations of the mixtures varied (17–74%) at different depths within the runoff drums.

4.2. Economic Benefit of Replacing the Erosion Plot Method with the Fractional Method

The difference between the FM and EPM is better appreciated in monetary terms. The economic implications of adopting the FM in place of the EPM would generate an average economic benefit of 14,740 USD yr−1 per 180 m2 land area. The FM is cheaper than the EPM due to the reduced numbers of pipes, drums, and samples needed, coupled with the lower cost of runoff and soil loss analysis. A similar report [36] showed that measuring soil erosion in the field can be time-consuming and costly. The relatively high cost of employing the EPM to quantify soil water erosion [37] may dissuade researchers from carrying out field experiments on soil water erosion, potentially leading to adverse consequences for food security. It has been established that simulating water erosion in laboratories is unrepresentative of field research in many different nations [42,43]. Thus, the lower cost of conducting water erosion studies using the FM instead of the EPM could be an incentive to conduct large-scale water erosion studies in the field for sustainable agriculture.

4.3. Limitations of the Study

The use of the ditch to convey runoff and soil loss into the pipes may trap less-coarse soils, depending on the volume of runoff, the degree of interwovenness of the VGH (determined by the age of the VGH), and the number of VGHs per slope length. In this study, the error due to soil entrapment in the ditch was minimised by the highly interwoven one-year-old VGH at the commencement of the erosion study.

5. Conclusions

The fractional method provides a more realistic estimate of the soil erosion output registered by the erosion plot method under vetiver grass technology. The quantity and quality of water erosion measured by the two methods were highly correlated. This is possibly due to the good connection between the three piped drums. The degree of conformity of both methods will make research efficient and attractive, particularly in large-scale water erosion studies. To ensure a uniform distribution of runoff and soil loss into the drums, all pipes must be aligned at the point of sharing water erosion in the field. Regardless of slope degree, the fractional method can be used to replace the erosion plot method, which is laborious and time-consuming. Researchers would have saved 14,328 USD per year per 180 m2 land area by adopting the fractional method in place of the erosion plot method. The high-cost implications associated with the erosion plot method will diminish the extent of research studies. Although the runoff distribution (at the sharing point) into the drums varied slightly (standard error: ±0.00 to ±0.05), and there was a time lag between the stirring and sampling, the central-piped drum accounted for 99% of the soil erosion discharged by the left and right drums. There is no need to collect the runoff for the entire erosion plot, which saves labour, materials, and time. Thus, it is technically and economically viable to use the fractional method for soil water erosion studies under vetiver grass technology in a rainforest agroecological environment.

Author Contributions

S.O.O.: conceptualisation (lead); writing—initial draft (lead); methodology (lead). H.Y.: supervision (lead); software (supporting); funding acquisition (lead); writing—reviewing and editing (supporting). A.M.O.: writing—reviewing and editing (lead); writing—original draft (supporting). I.D.E.: investigation (lead); methodology (supporting). T.S.O.: software (lead); resources (lead); writing—initial draft (supporting). E.E.I.: writing—initial draft (supporting); methodology (supporting). D.E.O.: writing—reviewing and editing (supporting); software (supporting). All authors have read and agreed to the published version of the manuscript.

Funding

This work was supported by the National Key Research and Development Program of China (2023YFE0125600) and was also part of the projects supported by the National Natural Science Foundation of China (31000944).

Data Availability Statement

The raw data supporting the conclusions of this article will be made available by the authors upon request.

Acknowledgments

The authors would like to thank all support and assistance from their organizations. We express our sincere gratitude to the Assistant Editor and the three anonymous reviewers for their exceptional comments that greatly enhanced the readability and quality of this article.

Conflicts of Interest

The authors declare that there are no known competing financial interests or personal relationships that could have appeared to influence the work reported in this paper.

References

  1. FAO. Soils for Nutrition: State of the Art; FAO: Rome, Italy, 2022. [Google Scholar]
  2. FAO. Outcome Document of the Global Symposium on Soil Erosion; FAO: Rome, Italy, 2019. [Google Scholar]
  3. El Mazi, M.; Hmamouchi, M.; Saber, E.; Bouchantouf, S.; Houari, A. Deforestation effects on soil properties and erosion: A case study in the central Rif, Morocco. Eurasian J. Soil Sci. 2022, 11, 275–283. [Google Scholar] [CrossRef]
  4. Shimeles, A.; Verdier-Chouchane, A.; Boly, A. Conclusions: Enhancing the resilience and sustainability of the agriculture sector in sub-Saharan Africa. In Building a Resilient and Sustainable Agriculture in Sub-Saharan Africa; Shimeles, A., Verdier-Chouchane, A., Boly, A., Eds.; Palgrave Macmillan: Cham, Switzerland, 2018. [Google Scholar] [CrossRef]
  5. Adegboyega, E.R. The impact of soil erosion on agricultural land and productivity in Efon Alaaye, Ekiti State. Int. J. Agric. Pol. Res. 2019, 7, 32–40. [Google Scholar] [CrossRef]
  6. Oshunsanya, S.O.; Yu, H.; Opara, C.C.; Odebode, A.M.; Oluwatuyi, T.S.; Babalola, O. Integration effect of vetiver grass strips with maize population density on soil erosion under two contrasting slopes of rainforest agroecology. Catena 2023, 221, 106728. [Google Scholar] [CrossRef]
  7. World Bank. Vetiver Grass: A Method of Vegetative Soil and Soil Moisture Conservation; Asia Technical Department, Agricultural Division; The World Bank NW: Washington, DC, USA, 1990. [Google Scholar]
  8. NRC (National Research Council). Vetiver Grass: A Thin Green Line Against Erosion; The National Academies Press: Washington DC, USA, 1993. [Google Scholar] [CrossRef]
  9. Truong, P. Vetiver Roots: The Vetiver System Technology Hidden Half; The Vetiver Network International: Cedar Crest, NM, USA, 2021; p. 173. [Google Scholar]
  10. Grimshaw, R.G. Past achievements and future direction of The Vetiver Network International (TVNI). In Proceeding of the First Philippines Vetiver Conference, Manila, Philippines, 12–14 March 2014. [Google Scholar]
  11. Howeler, R.; Watananonta, W.; Vongkasem, W.; Klakhaeng, K.; Jantawat, S.; Randaway, S.; Vankaew, B. Working with Farmers: The Key to Adoption of Vetiver Grass Hedgerows to Control Erosion in Cassava Fields in Thailand. In Vetiver and Water, Proceeding Third International Conference on Vetiver and Exhibition, Guangzhou, China, 6–9 October 2003; International Center for Tropical Agriculture: Cali, Colombia, 2004. [Google Scholar]
  12. Oshunsanya, S.O. Spacing effects of vetiver grass (Vetiveria nigritana Stapf) hedgerows on soil accumulation and yields of maize-cassava intercropping system in southwest Nigeria. Catena 2013, 104, 120–126. [Google Scholar] [CrossRef]
  13. Huang, Z.; Oshunsanya, S.O.; Li, Y.; Yu, H.; Are, K.S. Vetiver grass hedgerows significantly trap P but little N from sloping land: Evidenced from a 10-year field observation. Agric. Ecosyst. Environ. 2019, 281, 72–80. [Google Scholar] [CrossRef]
  14. Evans, R. Some methods of directly assessing water erosion of cultivated land—A comparison of measurements made on plots and in fields. Prog. Phys. Geog. 1995, 19, 115–129. [Google Scholar] [CrossRef]
  15. Chen, X.Y.; Zhao, Y.; Mo, B.; Mi, H.X. An improved experimental method for simulating erosion processes by concentrated channel flow. PLoS ONE 2014, 9, e99660. [Google Scholar] [CrossRef]
  16. Remke, A.A.; Rodrigo-Comino, J.; Wirtz, S.; Ries, J.B. Finding possible weakness in the runoff simulation experiments to assess rill erosion changes with non-intermittent surveying capabilities. Sensors 2020, 20, 6254. [Google Scholar] [CrossRef]
  17. Lal, R. Soil Erosion in the Tropics Principles and Management; McGraw Hill: New York, NY, USA, 1990; p. 588. [Google Scholar]
  18. Lang, R.D. Accuracy of two sampling methods used to estimate sediment concentration in runoff from soil loss plots. Ear. Sur. Proc. Landf. 1992, 17, 841–844. [Google Scholar] [CrossRef]
  19. Babalola, O.; Oshunsanya, S.O.; Are, K. Effects of vetiver grass (Vetiveria nigritana) strips, vetiver grass mulch and an organomineral fertilizer on soil, water and nutrient losses and maize (Zea mays L.) yield. Soil Till. Res. 2007, 96, 6–18. [Google Scholar] [CrossRef]
  20. Ciesiolka, C.A.A.; Yu, B.; Rose, C.W.; Ghadiri, H.; Lang, D.; Rosewell, C. Improvement in soil loss estimation in USLE-type experiments. J. Soil Water Conser. 2006, 61, 223–229. [Google Scholar] [CrossRef]
  21. Abraham, C.M.; Giadom, L. Assessment of devastating spectacular gullies scenario in some agro-communities in rural and urban fringes in Akwa Ibom State, Nigeria. Environmental Planning and Resource Development in Niger Delta Region. In A Book of Reading; Uyanga, J., Ikurekong, E., Eds.; University of Uyo: Uyo, Nigeria, 2014; pp. 51–68. [Google Scholar] [CrossRef]
  22. Smyth, A.J.; Montgomery, R.F. Soils and Land Use in Central Western Nigeria; Government Printer: Ibadan, Nigeria, 1962; p. 265. [Google Scholar]
  23. USDA (United States Department of Agriculture). Soil Taxonomy. Keys to Soil Taxonomy, 9th ed.; USDA-NRCS: Washington, DC, USA, 2003; p. 332.
  24. Soil Survey Staff. Soil Taxonomy: A Basic System of Soil Classification for Making and Interpreting Soil Surveys, 13th ed.; Natural Resources Conservation Service (USDA-NRCS): Washington, DC, USA, 2022. Available online: https://nrcspad.sc.egov.usda.gov/DistributionCenter/pdf.aspx?productID=1709 (accessed on 11 August 2025).
  25. Abraham, C.M.; Saturday, U.; Tom, A.A.; Ibanga, I. Soil physical properties: A determinant of soils susceptibility to gully erosion menace in Uyo metropolis, Akwa Ibom State, Nigeria. Int. J. Soc. Sci. 2018, 12, 125–138. [Google Scholar]
  26. Manickam, V.; Kotapati, S.S.; Muralikrishna, I.V.K. Analysis of precipitation concentration index and rainfall prediction in various agro-climatic zones of Andhra Pradesh, India. Int. Res. J. Environ. Sci. 2013, 2, 53–61. [Google Scholar]
  27. Cleene, A.D.; Helba, A.D.; Palacio, E.M.; de Andrade, J.C.N.; Paulilo, P.B. Characteristics of rainfall and erosion under natural conditions of land use in semiarid regions. Rev. Bras. Eng. Agrícola Ambient. 2013, 17, 1222–1229. [Google Scholar] [CrossRef]
  28. De Luis, M.; Gonzalez-Hidalgo, J.C.; Brunetti, M.; Longares, L.A. Precipitation concentration changes in Spain 1946–2005. Nat. Haz. Ear. Sys. Sci. 2011, 11, 1259–1265. [Google Scholar] [CrossRef]
  29. Lal, R. Soil degradation by erosion. Land Degrad. Dev. 2001, 12, 519–539. [Google Scholar] [CrossRef]
  30. Polyakov, V.O.; Lal, R. Soil organic matter and CO2 emission as affected by water erosion on field runoff plots. Geoderma 2008, 143, 216–222. [Google Scholar] [CrossRef]
  31. Kothyari, B.P.; Verma, P.K.; Joshi, B.K.; Kothyari, U.C. Rainfall–runoff-soil and nutrient loss relationships for plot size areas of Bhetagad watershed in Central Himalaya, India. J. Hydro. 2004, 293, 137–150. [Google Scholar] [CrossRef]
  32. IITA (International Institute of Tropical Agriculture). Automated and Semi-Automated Methods for Soil and Plant Analysis, Manual Series No. 8; International Institute of Tropical Agriculture: Ibadan, Nigeria, 1991; p. 34. [Google Scholar]
  33. Nelson, D.W.; Sommers, L.E. Total organic carbon and organic matter. In Methods of Soil Analysis; Part 2; Agronomy Monograph 9; ASA: Madison, WI, USA, 1982; pp. 539–594. [Google Scholar]
  34. Bray, R.H.; Kurtz, L.T. Determinations of total organic and available form of phosphorous in soils. Soil Sci. 1945, 59, 39–44. [Google Scholar] [CrossRef]
  35. Kinnell, P.I.A. Laboratory studies on the effect of drop size on splash erosion. J. Agric. Engr. Res. 1982, 27, 431–439. [Google Scholar] [CrossRef]
  36. Roels, J.M.; Jonker, P.J. Representativity and accuracy of measurements of soil loss from runoff plots. Trans. Amer. Soc. Agric. Engr. 1985, 28, 1458–1465. [Google Scholar] [CrossRef]
  37. Boardman, J.; Evans, R. The measurement, estimation and monitoring of soil erosion by runoff at field scale: Challenges and possibilities with particular reference to Britain. Prog. Phys. Geog. Ear. Environ. 2019, 44, 31–49. [Google Scholar] [CrossRef]
  38. Pampalone, V.; Carollo, F.G.; Nicosia, A.; Palmeri, V.; Di Stefano, C.; Bagarello, V.; Ferro, V. Measurement of water soil erosion at Sparacia Experimental Area (Southern Italy): A summary of more than twenty years of scientific activity. Water 2022, 14, 1881. [Google Scholar] [CrossRef]
  39. Oshunsanya, S.O. Crop yield as influenced by land preparation methods established within vetiver grass alleys for sustainable agriculture in Southwest Nigeria. Agroecol. Sust. Food Sys. 2013, 37, 578–591. [Google Scholar] [CrossRef]
  40. Oshunsanya, S.O. Surface soil properties and maize yields in runoff plots planted with vetiver grass (Vetiveria nigritana Stapf) hedges. Soil Sci. 2013, 178, 205–213. [Google Scholar] [CrossRef]
  41. Bagarello, V.; Di Piazza, G.V.; Ferro, V. Manual sampling and tank size effects on the calibration curve of plot sediment storage tanks. Trans. Amer. Soc. Agric. Biol. Sci. 2014, 47, 1105–1112. [Google Scholar] [CrossRef]
  42. Hudson, N.W. Field Measurement of Soil Erosion and Runoff; Food and Agriculture Organization of the United Nations: Rome, Italy, 1993. [Google Scholar]
  43. Hsieh, Y.P.; Grant, K.T.; Bugna, G.C. A field method for soil erosion measurements in agricultural and natural lands. J. Soil Water 2009, 64, 374–382. [Google Scholar] [CrossRef]
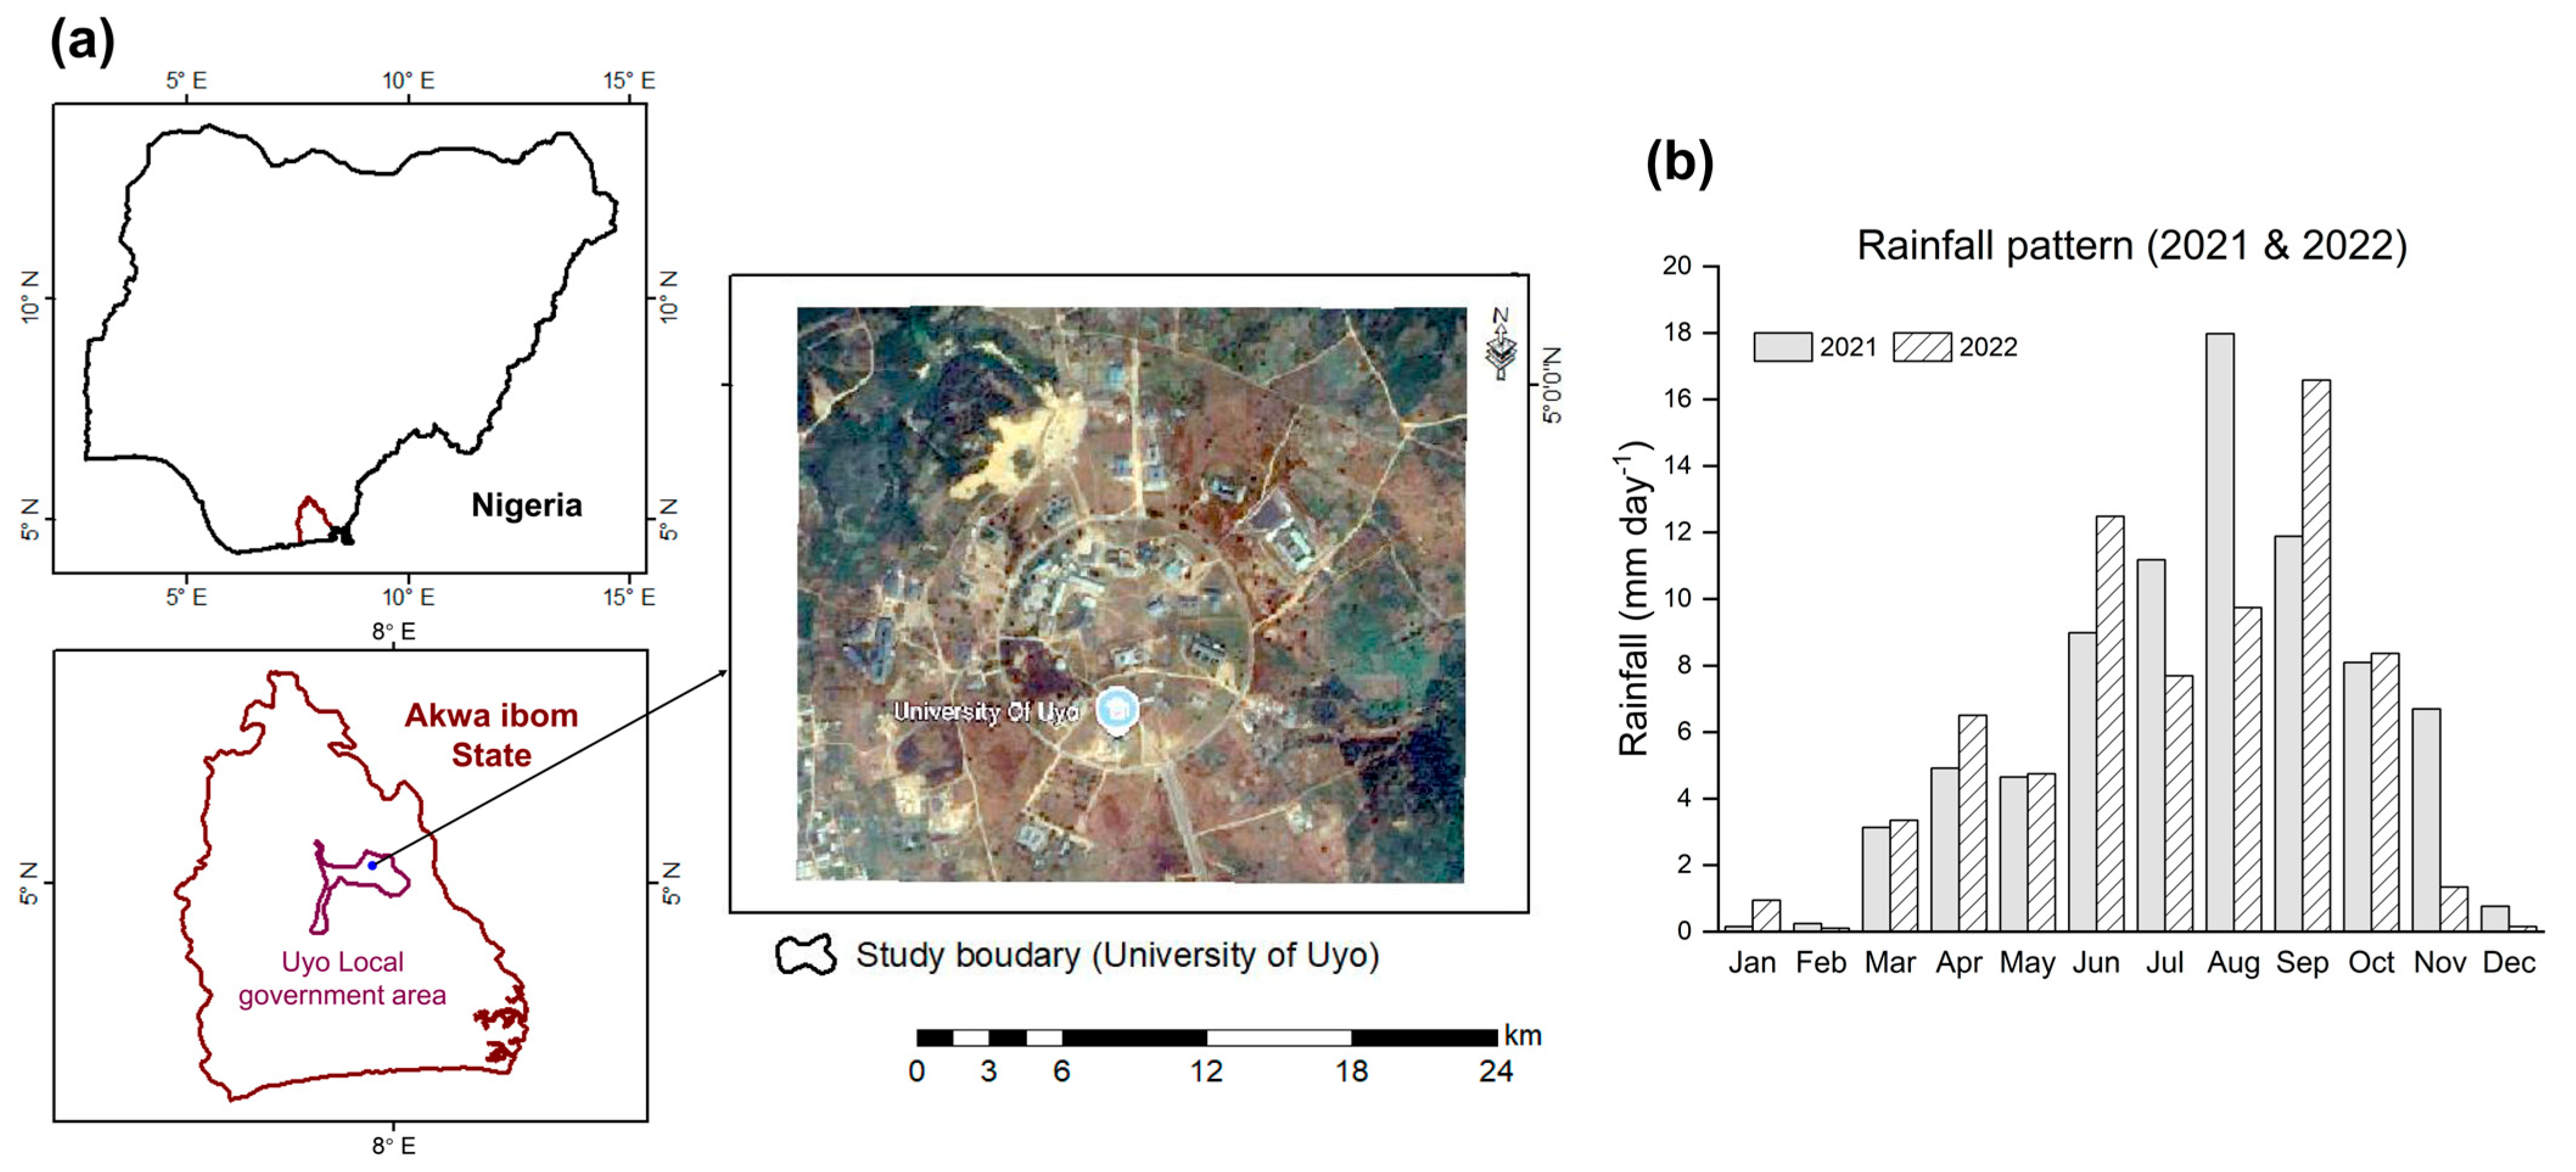
Figure 1. Map of experimental site (a) and rainfall patterns during investigations (b) in Nigerian rainforest agroecology.
Agriculture 15 01762 g001
Figure 2. Schematic representation of vetiver grass hedgerows’ spacing in the field, and arrangement of pipes with respective drums in the trench for the collection of runoff and soil loss.
Agriculture 15 01762 g002
Figure 3. Comparison of runoff and soil loss discharged by fractional and erosion plot methods on two contrasting slopes in rainforest agroecology. VGH10, VGH20, VGH30: mean vetiver grass hedgerows at 10 m, 20 m, and 30 m surface intervals, respectively; NV means no vetiver (control); *** means level of significant difference.
Agriculture 15 01762 g003
Figure 4. Comparison of runoff nutrients obtained from fractional and erosion plot methods on two contrasting slopes in rainforest agroecology. VGH10, VGH20, VGH30: mean vetiver grass hedgerows at 10 m, 20 m, and 30 m surface intervals, respectively; NV means no vetiver (control); ** and *** indicate significant difference at p < 0.01 and p < 0.001, respectively.
Agriculture 15 01762 g004
Figure 5. Regression between runoff nutrients and eroded nutrients obtained from erosion plot and fractional methods on two contrasting slopes.
Agriculture 15 01762 g005
Table 2. Comparison of the cost of measuring soil erosion using erosion plot and fractional techniques in rainforest agroecology.
S/NItemsQtyCost (₦)Cost (₦)Number of SamplesNumber of SamplesTotal Cost (NGN)
for 300 m2 Land Area
Total Cost (USD)
for 300 m2 Land Area
5% Slope10% Slope5% Slope10% Slope5% Slope10% Slope5% Slope10% Slope
Erosion plot method
1Drums (250 litres)366600.006600.00--237,600.00237,600.001284.001284.00
2Pipes (100 m)363740.003740.00--134,640.00134,640.00728.00728.00
3Sampling and emptying the drums per measurement36250.00450.003131279,000.00502,200.001508.002715.00
4Analysis (N, P, K, C, Ca, Mg)363000.003000.0031313,348,000.003,348,000.0018,097.0018,097.00
Fractional method
1Drums (250 litres)126600.006600.00--79,200.0079,200.00428.00428.00
2Pipes (100 m)363740.003740.00--134,640.00134,640.00728.00728.00
3Sampling and emptying the drums per measurement12250.00450.00313193,000.00167,400.00503.00905.00
4Analysis (N, P, K, C, Ca, Mg)123000.003000.0031311,116,000.001,116,000.006032.006032.00
5% slope10% slope5% slope10% slope
Total cost under the erosion plot method3,999,240.004,222,440.0021,618.0022,824.00
Total cost under the fractional method1,422,840.001,497,240.007691.008093.00
Gross margin2,576,400.002,725,200.0013,926.0014,731.00
FM indicates the fractional method; EPM indicates the conventional method; 1 USD = 185 NGN as of 2015, when the experiment was conducted; Qty indicates quantity.
Disclaimer/Publisher’s Note: The statements, opinions and data contained in all publications are solely those of the individual author(s) and contributor(s) and not of MDPI and/or the editor(s). MDPI and/or the editor(s) disclaim responsibility for any injury to people or property resulting from any ideas, methods, instructions or products referred to in the content.