Article

Design and Experiment of a Vertical Cotton Stalk Crushing and Returning Machine with Large and Small Dual-Blade Discs

1
Xinjiang Academy of Agricultural and Reclamation Science, Shihezi 832000, China
2
College of Agricultural Engineering, Jiangsu University, Zhenjiang 212013, China
*
Author to whom correspondence should be addressed.
These authors contributed equally to this work.
Agriculture 2025, 15(15), 1572; https://doi.org/10.3390/agriculture15151572
Submission received: 27 June 2025 / Revised: 19 July 2025 / Accepted: 20 July 2025 / Published: 22 July 2025
(This article belongs to the Section Agricultural Technology)

Abstract

To address the problems of low crushing efficiency and uneven distribution in traditional straw crushing and returning machines for cotton stalk return operations in Xinjiang, a vertical straw crushing and returning machine with large and small dual-blade discs was designed, adapted to Xinjiang’s cotton planting model. The machine employs a differentiated configuration of large and small blade discs corresponding to four and two rows of cotton stalks, respectively, effectively reducing tool workload while significantly improving operational efficiency. A simulation model of the crushing and returning machine was developed using the discrete element method (DEM), and a flexible cotton stalk model was established to systematically investigate the effects of machine forward speed, crushing blade rotational speed, and knife tip-to-ground clearance on operational performance. Single-factor simulation experiments were conducted using crushing qualification rate and broken stalk drop rate as evaluation indicators. Subsequently, a multi-factor orthogonal field experiment was designed with Design-Expert software (13.0.1.0, Stat-Ease Inc, Minneapolis, MN, USA). The optimal working parameters were determined to be machine forward speed of 3.5 m/s, crushing blade shaft speed of 1500 r/min, and blade tip ground clearance of 60 mm. Verification tests demonstrated that under these optimal parameters, the straw crushing qualification rate reached 95.9% with a broken stalk drop rate of 15.5%. The relative errors were less than 5% compared to theoretical optimization values, confirming the reliability of parameter optimization. This study provides valuable references for the design optimization and engineering application of straw return machinery.

1. Introduction

Cotton represents a vital economic crop globally, with China standing as one of the world’s leading producers, contributing approximately 30% of total global production [1]. Statistical data from China’s National Bureau of Statistics [2] indicate that the nation’s cotton production amounted to 6.164 million metric tons in 2024, with Xinjiang serving as the predominant source. This positions Xinjiang not merely as China’s primary cotton production base but also as a region possessing substantial cotton stalk resources [3]. In this region, a high-density planting mode suitable for mechanized picking is widely adopted. As an important cotton-producing area, Xinjiang has a cotton planting area of 2.7273 million hectares, and the output of cotton stalks per hectare of cotton is about 6 tons. Based on this calculation, the total output of cotton stalks in Xinjiang can exceed 16.36 million tons. Cotton stalks have utilization value in aspects such as fertilizer production, feed production, and energy production [4,5] However, energy utilization requires equipment investment and consumes high energy; feed utilization needs preprocessing and has poor palatability; and composting and returning to the field is land- and time-consuming. In contrast, the technology of directly crushing and returning cotton stalks adopted in Xinjiang has significant advantages: it is simple to operate, requires no additional treatment, and has low cost. It can directly improve soil fertility, enhance physical and chemical properties, and is suitable for large-scale cotton field management, thus becoming the mainstream choice [6,7].
Existing cotton stalk shredding and return implements are primarily categorized as horizontal-type and vertical-type [8,9]. However, horizontal shredders exhibit severe vibration, rendering them unsuitable for high-speed operation. Furthermore, post-shredding results often show uneven stubble height and non-compliant stalk lengths. Xinjiang’s cotton production employs plastic film mulching techniques [10,11,12,13], but delayed residue ejection by horizontal shredders interferes with subsequent plastic film recovery and separation of plastic-contaminated residues. In contrast, vertical-type shredders ensure consistent stubble height by cutting stalks parallel to the ground Currently. Developed nations initiated the research and production of mechanized straw shredding/returning and recovery systems earlier, establishing technological leadership in this field [14,15]. Their research focus centers on analyzing the influence of structural components and operational parameters on shredder performance [16,17]. Bhavya et al. designed a rice straw shredding–scattering–return implement, establishing a quantitative relationship between straw fragment length and fuel consumption through parameter optimization experiments [18]. Singh et al. developed a unit equipped with four rows of flail hammers and two rows of stationary blades, achieving an average working efficiency of 0.33 hm2/h at 2 km/h forward speed with over 83.1% qualified shredding length rate.
Compared to developed nations, China initiated technological R&D for straw shredding and return implements later. Nevertheless, through assimilating advanced foreign designs and implementing localized innovations, significant breakthroughs have been achieved in core component development and whole-machine performance optimization, essentially realizing comprehensive mechanization of straw return operations for major crops [19,20,21]. Wang et al. analyzed the influence patterns of parameters like feeding rate and blade clearance on shredding performance using detection systems and finite element simulation [22] Addressing blade wear issues, Xu et al. designed a novel shredding–return device featuring sequentially arranged cutters that effectively reduce stress distribution [23]. Applying bionic principles, Zhang et al. developed serrated shredding blades modeled after blue shark dentition. Simulation and field tests verified enhanced cutting capability for banana stalks, increasing shredding qualification rate by 8.2% and distribution uniformity by 12.7% [24].Yuan et al. engineered a centralized deep-burial implement performing integrated operations—collecting, shredding, conveying, deep trenching, and soil compaction—demonstrating 23% higher soil nutrient enrichment versus conventional methods [25]. Despite these multi-dimensional advances, dedicated shredding technologies and equipment for high-toughness, coarse-fiber stalks like cotton remain underdeveloped.
Xinjiang’s cotton-growing regions predominantly adopt a 660 + 100 mm row configuration for mechanical harvesting compatibility. Nevertheless, existing two-row return implements demonstrate low operational efficiency, while six-row single-disc models suffer from excessive vibration due to large cutter disc radii. Additionally, eight-row implements are incompatible with Xinjiang’s planting patterns. Consequently, designing specialized shredders for Xinjiang’s unique cotton cultivation system carries significant technical importance. In this study, a dual-size vertical cutter disc straw shredder and return implement was designed based on Xinjiang’s cotton cultivation patterns. By analyzing the morphological characteristics and mechanical properties of cotton stalks, key components were engineered to address operational constraints. Simulation analysis investigated the influence patterns of various factors on performance metrics. Subsequently, multi-factorial experimentation validated parameter effects and determined the optimized parameter combination.

2. Materials and Methods

2.1. Cotton Cultivation Patterns & Morphological Characteristics

2.1.1. Cotton Cultivation Patterns

Xinjiang, as China’s core cotton production region, has established a highly mechanized modern cultivation system. To date, the full-process mechanization rate of cotton farming exceeds 90% [26], forming a stable and standardized cultivation pattern. As shown in Figure 1, the dominant planting configuration adopts a “single-film six-row” layout—planting six cotton rows under one plastic film cover, arranged in three paired-row groups. Within-group plant spacing is 100 mm, while inter-group row spacing measures 660 mm. This configuration optimizes land utilization while facilitating mechanized operations and field management. To investigate the diameter distribution and mechanical properties of cotton stalks, field samples of three machine-harvested cotton varieties were collected in October (autumn) from Liuhudi Village, Shihezi City, Xinjiang (85°59′ E, 43°26′ N). The varieties included Xinluzao 45, Xinluzao 66, and Xinluzao 83—all widely cultivated in Xinjiang. These varieties exhibit both common characteristics and reasonable variations in key traits such as growth cycle, plant architecture, and stress resistance, comprehensively representing the overall characteristics of local cotton germplasm. For each variety, 50 plants were randomly selected, and their morphological parameters were measured using a measuring tape (Deli Group Co., Ltd., Ningbo, China) for subsequent statistical analysis.
Measurements revealed an average main stem height of 78.3 cm from apex to ground, with the lowest branch point averaging 18.3 cm above ground. Based on vertical distance from soil surface, stalks were segmented into three analytical zones: 0–270 mm (Lower), 270–540 mm (Middle), and >540 mm (Top) for subsequent characterization.

2.1.2. Morphological Characteristics of Cotton Stalks

After the cotton harvesting operation, the cotton stalks remaining in the field generally exhibit a morphology characterized by a smaller diameter at the top and a larger diameter at the bottom. The main stalks are covered with small branches, cotton bolls, and other attachments. To accurately understand the diameter variation patterns of different parts of cotton stalks, a random sampling method was employed. A vernier caliper with a precision of 0.01 mm (Vernier Caliper, Deli Group Co., Ltd., Ningbo, China) was used to measure the diameters of 50 cotton stalks from each of the three varieties at various positions. The measurement results are shown in Figure 2. After calculating the average diameters of each part, the average diameters of the top, middle, and lower sections of the cotton stalk were found to be 6.13 mm, 7.79 mm, and 10.03 mm, respectively, showing a gradual increase. Considering that the branch structure has lower strength and requires significantly less external force to break compared to the main stem, the main stem was selected as the primary focus of research in the mechanical model of the cotton stalk crushing and returning machine, in order to enhance the relevance and effectiveness of the modeling process.

2.1.3. Mechanical Characterization of Cotton Stalks

The mechanical properties of the operating object are an important prerequisite for mechanical design [27,28]. The shear force of cotton stalks is a key factor in the design and optimization of the crushing mechanism, directly affecting whether the crushing rate meets the standard. Therefore, cotton stalk mechanical property tests were conducted to explore the effect of different parts of the cotton stalk on shear force. “Xinluzao 66” is widely popular in northern Xinjiang due to its drought and salt–alkali resistance, stable yield and excellent fiber quality, and its cotton stalk mechanical tests are representative. Preliminary measurements show that the basal diameter of this variety is 9.95 mm, “Xinluzao 45” is 9.12 mm, and “Xinluzao 83” is 11.03 mm. The differences among the three are small, and “Xinluzao 66” has a medium thickness distribution, which can represent the typical morphological characteristics of cotton varieties in this region. The main stem of the “Xinluzao 66” cotton variety was selected as the sample. Using a random sampling method, cotton stalks with smooth appearance, no damage, and no abnormal nodules were selected. A 20 cm segment of the cotton stalk was taken from the upper, middle, and lower parts to serve as experimental samples. In the experiment, a fixed block with an inclined angle at the top was used as a supporting fixture to simulate the fixed blade structure. The self-made cutting knife was fixed to a lifting press head using the fixture. When placing the cotton stalks, it was ensured that they were positioned exactly in the center between the two supporting blocks, and the blade was kept perpendicular to the horizontal plane (θ = 90°) to ensure the repeatability of the cutting process.
During the experiment, except for the different sampling locations of the cotton stalk, all other experimental variables remained constant. As shown in Figure 3, the stalk was placed on supporting fixtures with a distance L = 70 mm. The universal material testing machine E1000 full electronic fatigue testing system (maximum load: 1000 N, loading accuracy: ±0.25%) was started, and the press head moved downward at a loading speed of 100 mm/min. Each sampling location was tested 10 times, and the average value was taken as the shear force of the cotton stalk at that location.

2.2. Straw Crushing and Returning Machine Structure and Working Principle

2.2.1. Structure of the Straw Crushing and Returning Machine

The structural configuration of the vertical cotton stalk shredder is illustrated in Figure 4, encompassing core components such as the large cutter disc, small cutter disc, frame housing, transmission system, and support wheels. The two cutter discs feature an identical structural design, each equipped with three sets of double-layer flail hammers arranged in a concentric pattern. Upper and lower blades are symmetrically fastened to the disc frame via bolts, while stationary blades are fixedly mounted on the inner side of the frame housing. During operation, the flail hammers and stationary blades work in tandem to achieve efficient stalk shredding. Specifically, the large cutter disc is designed to process four crop rows, and the small one handles two rows, which precisely aligns with the common “single-film six-row” cotton planting pattern in Xinjiang. The polygonal frame housing serves as an integrated carrier, accommodating the cutting mechanism, transmission components, and support system. The support system, consisting of rear and lateral wheels, not only bears the machine’s weight but also enables adaptive adjustment to terrain variations for contour-following operation and precise regulation of the disc height. Meanwhile, the transmission system is responsible for power transmission and maintaining synchronized rotational speeds among various components.

2.2.2. Operational Principles

The operation process is shown in Figure 5. The power output of the tractor is transmitted to the large friction clutch and large over-running clutch in sequence through the universal joint drive shaft and then enters the large gearbox to achieve speed change and direction conversion, thereby driving the large cutting cutterhead in the frame to rotate at high speed. At the same time, the power is also transmitted to the small friction clutch and small over-running clutch through another set of universal joint drive shafts, and then drives the small cutting cutterhead to run at high speed after being shifted by the small gearbox, forming a dual-cutterhead cooperative crushing system. As the tractor moves forward slowly, cotton stalks are continuously guided into the machine shell from the operation area. During the rotation of the cutterhead, the moving knife and fixed knife form a shearing cooperation, and the cotton stalks are cut multiple times through high-frequency cutting, tearing and kneading, finally being crushed into straw pieces of appropriate length. The crushed straw is thrown under the combined action of the air flow generated by the high-speed rotating cutter shaft and centrifugal force: the high-speed rotating cutter shaft drives the surrounding air to form a directional air flow, which exerts a forward thrust on the crushed straw; at the same time, the crushed straw obtains centrifugal force when the cutterhead rotates, which makes the crushed straw move outward along the tangential direction of the cutterhead. The superposition of the two forces causes the crushed straw to form a projectile trajectory after leaving the cutterhead, completing the operation process of cotton stalk cutting, crushing and throwing. This returning method not only avoids damage to the mulch film, but also provides a good foundation for subsequent residual film recycling and field operations.

2.3. Key Component Structural Design and Parameter Determination

2.3.1. Frame Assembly Design of Straw Shredding and Return Implement

The frame is one of the core structures of the straw crushing and returning machine, accounting for more than 40% of the total machine weight and has a decisive impact on operational accuracy and vibration resistance. During operation, the frame frequently comes into contact with field materials and must possess good rigidity and wear resistance. Its dimensions are directly related to the arrangement of the moving blade, fixed blade, and transmission system, and therefore, selecting appropriate materials and optimizing structural dimensions are critical in the design process. Considering the common “660 + 100 mm” planting pattern used in Xinjiang cotton fields, the machine design meets the requirement of crushing six rows of cotton stalks in a single pass. According to the standard of GB/T 24675.6-2021 [29] , combined with the 2050 mm width mulch film and multiple field tests, the key dimensions of the frame are determined as follows: the entrance width is 2450 mm; the large cutterhead cavity is 1750 mm in length and 1690 mm in width; the small cutterhead cavity is 1400 mm in length and 990 mm in width; the height of both cutterheads is 300 mm. The frame as a whole is formed by welding steel plates and rectangular tubes, taking into account both strength and manufacturing convenience.

2.3.2. Moving and Fixed Blade Structure Design

Different types of crushing blades have different cutting methods, significantly affecting the straw crushing performance. Common crushing blades include straight blades, hammer claws, and flail blades, each with its own advantages and disadvantages. To address the issues of high energy consumption and wear in existing blades, a new type of crushing blade has been designed, which is safe, wear-resistant, strong, and has a long service life. The blade consists of a moving blade and a fixed blade. During operation, the cotton stalks are repeatedly subjected to force under the cooperative action of the moving blade, fixed blade, and machine frame to achieve crushing and returning to the field. The fixed blade adopts a straight blade design, as shown in Figure 6. It is primarily used to stabilize the moving blade’s shearing action and provide a cutting reference surface. The fixed knife blade features a bilaterally symmetric structure. Based on the frame layout, its dimensions are determined as 125 mm in length, 68 mm in width, and 8.5 mm in thickness, with a weight of approximately 0.57 kg. It is fixedly mounted on the inner side of the frame’s side guard plates, with one fixed knife arranged beside the large cutterhead and another beside the small cutterhead, respectively.
The flail hammer consists of shank, head, and cutting edge, with its structure detailed in Figure 7. An offset angle is incorporated between the head and shank, manufactured through monolithic fabrication for enhanced bending strength and damage resistance. The symmetrically ground cutting edge features homogeneous microstructure, delivering superior wear resistance and operational safety. According to “GB/T 24675.6-2021”, the equipment’s trouble-free working time shall be no less than 120 h. Blade wear can be comprehensively determined by measuring dimensional changes, weighing, observing the edge condition, and evaluating the crushing effect and energy consumption.
The flail hammer design encompasses both holistic configuration and critical parameter determination—including edge thickness, shank thickness, width, length, and offset angle—each significantly influencing tool strength and cutting performance, necessitating comprehensive optimization. The structural parameters of the moving knife are shown in Table 1, and the mass of each moving knife is approximately 0.66 kg.

2.3.3. Number and Arrangement of Crushing Blades

Proper arrangement of the number and layout of crushing blades ensures the crushing quality and stability of the machine. The blade arrangement should avoid missed cuts, blockages, and repeated cutting to ensure good crushing performance. Additionally, it should effectively reduce wear and ensure that the axial resultant force of the blade is zero when the machine operates stably. Thus, the crushing blade arrangement adopts a configuration with main and auxiliary blades installed vertically. The main and auxiliary blades use the same flail type and are fixed to the connecting plate with bolts. The angle between the flails is 120°. This main and auxiliary blade design increases the crushing area and facilitates disassembly and maintenance, allowing damaged blades to be replaced individually. To avoid missed cuts and blockages and ensure crushing quality and machine stability, three sets of crushing blades are designed, each set consisting of a main and an auxiliary blade, totaling 12 blades. The arrangement of the crushing blades is shown in Figure 8. A small gap between the moving and fixed blades may cause them to contact each other, damaging the blades. After multiple tests, it was determined that the gap between the moving and fixed blades should be 50 mm, and the gap between the auxiliary moving blade and the fixed blade should be 32 mm, ensuring the cotton stalk crushing qualification length does not exceed 200 mm.

2.4. Cotton Stalk Force Analysis

2.4.1. Analysis of the Conditions for Cutting Cotton Stalks by the Crushing Mechanism

During the actual operation of a vertical cotton stalk crushing and returning machine, the crushing knife performs a circular rotational motion in a plane, and the moving knife is used to push the cotton stalks toward the fixed knife to achieve cutting. When the moving knife is at different positions relative to the fixed knife, it can produce chopping and oblique cutting effects, as shown in Figure 9. Figure 9a shows the transverse tangential cutting when the cotton stalk is perpendicular to the moving and fixed knives. At this time, the cutting speed is equal to the speed of the moving knife. Figure 9b shows the oblique cutting situation, that is, when there is a certain angle between the cotton stalk and the moving and fixed knives, the moving knife speed can be decomposed into the vertical cutting speed Vn and the tangential sliding cutting speed Vt. Among them, τ represents the sliding cutting angle, and the complementary angle γ of the sliding cutting angle is called the cutting angle.
In the stress analysis of cotton stalk cutting, cotton stalks are assumed to be homogeneous materials. Although cotton stalks are actually composed of epidermis, phloem, xylem, etc., based on the macro mechanical properties and the need for model simplification, local structural differences are ignored to establish the analysis model. Subsequent experimental verification shows that the error between the results under this assumption and the actual working conditions is within an acceptable range. During the process of shearing cotton stalks by the straw crushing mechanism, the resultant force acting on the cotton stalk changes as the angle between the moving blade edge and the fixed blade edge changes. The force analysis is shown in Figure 10.
In the figure, FN1 represents the normal force exerted on the moving blade by the cotton stalk, FN2 represents the normal force exerted on the fixed blade by the cotton stalk, Ff is the frictional force on the cotton stalk, and α is the angle between the blade and the horizontal X-axis. φ is the friction angle between the stalk and the tool, and the relationship between the friction coefficient μ and the friction angle is given by: μ = tan ϕ . Thus, the total frictional force between the cotton stalk and the moving and fixed blades in the tangential direction along the X-axis is expressed by Formula (1):
F f x = F N 1 + F N 2 tan φ cos α 2
According to the principle of force composition and decomposition, the expressions of the two normal pressures on the tangential X-axis are as shown in Formula (2):
F w x = F N 1 + F N 2 sin φ
Combining Formulas (1) and (2), when F w x > F f x , α > 2φ, the resultant force FW pushes the cotton stalk outward along the blade edge. Conversely, when F w x < F f x , the resultant force FW squeezes the cotton stalk inward along the blade edge, which facilitates cutting. This inward direction of the resultant force is a prerequisite for realizing cotton stalk cutting. In the design of vertical shaft straw crushing and returning machines, the cutting angle and matching form of the moving and fixed blades of the crushing mechanism are important considerations. The selected moving blade has a bending angle of 164° at the shank, with the installation mode featuring hole pitches parallel to the radial direction of the cutter disc, and the fixed blade is horizontally arranged. When the device crushes straw, the angle between the moving blade edge and the fixed blade edge is α = 16°. Given that the friction coefficient μ between the cotton stalk and steel is 0.3, the calculated φ value is 16.7°. The installation angle of the moving and fixed blades satisfies α < 2φ, meeting the cutting conditions for cotton stalks in rotating machinery.

2.4.2. Mechanical Analysis of Crushing Blades Cutting Cotton Stalks

When the moving blade cuts the cotton stalk, the force on the bilateral cutting edges is considered to be consistent, and the force analysis of the unilateral cutting edge is shown in Figure 11.
In the figure, δ is the angle between the tool shaft and the vertical direction during the cutting of the moving blade, Rzg is the reaction force of the extruded cotton stalk layer on the moving blade, and Rd is the reaction force of the cutting edge surface on the pressure of the cotton stalk layer. Then, the reaction force of the pressure acting on the moving blade edge surface is:
R = R zg sin β + R d cos β
The frictional force on the cutting edge is:
T 2 = μ R = μ ( R zg sin β + R d cos β )
The vertical projection of the frictional force is:
T 2 = μ R cos β = μ ( R zg sin β + R d cos β ) cos β = μ ( R zg sin 2 β 2 + R d cos 2 β )
To achieve cutting, the cutting pressure Fp on the blade edge must satisfy the following condition:
F P R c + R z g + T 2 + T 2
In the formula, Rc represents the reaction force of the cotton stalk against the blade. The calculation formula is as follows:
R c = a e × σ c
In the formula, a represents the thickness of the blade, e represents the length of the blade, and σc represents the compressive stress of the material.
After substituting the corresponding parameters of the cotton stalk, the minimum cutting pressure Fp of the blade is 85.7 N. Since the cutting force of the small knife disc is less than that of the large knife disc, the minimum operating speed of the small crushing knife disc is set to 900 r/min, with the center of the moving blade located 474 mm from the rotation center. Substituting into calculation Formula (8):
F = V 2 R = ω 2 R
The theoretical cutting force of the moving blade is 4210.37 N, which is much greater than the blade cutting pressure Fp. Based on the mechanical properties of the cotton stalk from experimental results, the maximum shear force at the bottom of the cotton stalk is 99.5 N. Therefore, it can be concluded that the selection of the moving blade is reasonable.

2.5. Analysis of the Blade Shaft Motion Speed of the Straw Crushing and Returning Machine

The rotational speed of the crushing blade shaft directly affects the straw crushing effect and is a key parameter in the operation of the machine. If the speed is too high, it will increase energy consumption, vibration, and noise; if the speed is too low, the expected crushing effect cannot be achieved [30]. By analyzing the motion trajectory of the throwing blade, the blade shaft rotational speed can be determined. The cutting direction of the crushing blade is counterclockwise. The absolute motion of the tool is a combination of rotational and translational motions, and the trajectory changes with the speed of motion. A coordinate system is established with the blade shaft axis as the origin O. The X-axis is the positive direction of the machine’s forward motion, and the Y-axis is the positive direction perpendicular to the blade shaft axis and to the left. Let the forward speed of the straw crushing and returning machine be vm, the angular velocity of the blade shaft be w, and the distance from the tool’s tip to the axis be R. From the start of the machine’s operation to time t, the motion trajectory formula of the tool’s tip point A(x,y) is given by Formula (9), and the motion trajectory is shown in Figure 12.
x = v m t + R cos ( w t ) y = R sin ( w t )
In the formula, vm is the forward speed of the machine, m/s; w is the angular velocity of the blade shaft, rad/s; R is the distance from the tool’s tip to the axis, m; and t is the working time of the machine, s.

2.5.1. Crushing Blade Crushing Speed

By differentiating the motion formula of the tool, the crushing speed in each direction and the absolute crushing speed can be derived. Differentiating Formula (10) gives:
v x = d x d t = v m R w sin ( w t ) v y = d y d t = R w cos ( w t )
The absolute crushing speed of the tool’s tip is:
v = v x 2 + v y 2 = v m 2 + R 2 w 2 2 R w v m sin ( w t )
In the formula, vx is the component of the velocity of the tool tip A in the x, m/s; vy is the component of the velocity of the tool tip A in the y, m/s; v is the absolute velocity of the tool tip, m/s.

2.5.2. Crushing Blade Acceleration

By differentiating the crushing speed and the velocity components of the tool, the absolute crushing acceleration and the acceleration components of the tool can be derived from Formula (10).
a x = v x = d 2 x d t 2 = R w 2 cos ( w t ) a y = v y = d 2 x d t 2 = R w 2 sin ( w t )
The absolute crushing acceleration of the tool’s tip is:
a = a x 2 + a y 2 = R w 2
The formula for the rotational speed of the crushing blade shaft is:
n = 30 ( v + v m ) π R

2.6. Simulation and Field Tests of the Straw Crushing Machine

2.6.1. Simulation Model and Parameter Settings

EDEM simulation technology is widely applied in the agricultural field. It can simulate crop stress, straw returning to the field, etc., helping optimize agricultural machinery and improve agricultural production efficiency [31,32,33,34,35,36,37] To explore the impact of various factors on the operational performance of the straw crushing machine, the discrete element method (DEM) was employed for simulation analysis in this study. First, a 3D simulation model of the straw crushing machine was created using SOLIDWORKS 2016 (SP02, Dassault Systèmes Americas Corp, West Lafayette, IN, USA). Components that do not affect the experimental results were simplified, and key components were retained. The model was then saved in IGS format and imported into EDEM (2022, Altair Engineering, Inc., Troy, MI, USA) software for simulation processing. The simulation model mainly includes the moving blade, fixed blade, machine frame, and the cotton stalk to be crushed.
In this study, to accurately simulate the mechanical behavior and fracture characteristics of cotton stalks, the linear particle stacking method was employed to construct the cotton stalk model [38]. By sequentially arranging spherical particles along coordinates, a cotton stalk model of length L was created [39,40,41]. To further enhance the model’s accuracy and simulate the flexible properties of cotton stalks, BondV2 was employed to establish bonds between particles, thereby constructing a flexible and easily breakable cotton stalk model as shown in Figure 13. This model not only accurately reproduces the crushing and throwing processes of cotton stalks in the straw crusher but also facilitates in-depth analysis of the force mechanism and fracture behavior of cotton stalks. Moreover, while ensuring accuracy, it reduces the computational load and accelerates the simulation process. The parameter calibration of the model was conducted with reference to relevant literature on cotton stalks [42,43,44], the parameters for the cotton stalk and straw crusher were set, with the specific parameters shown in Table 2.
As shown in Figure 14, a rectangular mulch-covered area with dimensions of 2000 mm × 2050 mm is created, and 6 rows of cotton stalk plant models are arranged along the longitudinal direction of the mulch according to the planting specifications of 660 mm row spacing and 100 mm plant spacing. In the simulation test, the operation length is set to 2 m, and the simulation running time is determined according to different operation speeds. In the single-factor test, the operation speeds of the crusher are 1 m/s, 2 m/s, 3 m/s, 4 m/s, and 5 m/s, with the corresponding simulation times being 2 s, 1 s, 0.7 s, 0.5 s, and 0.4 s, respectively. In accordance with the requirements of the single-factor test, parameters such as the forward speed of the machine, the rotational speed of the cutterhead, and the tip clearance from the ground are set, respectively, before starting the simulation experiment, and the test process is shown in Figure 15.

2.6.2. Single-Factor Simulation Experiment Factors

The primary factors influencing the qualification rate of straw crushing length are the forward speed of the machine and the rotational speed of the blade disc, whereas the straw stubble height is closely associated with the machine’s forward speed, the rotational speed of the blade disc, and the tip-to-ground clearance. Considering that the rotational speed of the small blade disc varies proportionally with that of the large blade disc, this study selects the machine’s forward speed, the rotational speed of the large blade disc, and the tip-to-ground clearance as experimental factors to carry out single-factor simulation experiments. The experimental factors and their selected levels are presented in Table 3.

2.6.3. Multi-Factor Field Test Factors

To further investigate the effects of various experimental factors and their interactions on the field performance of the cotton stalk crushing and returning device, with the cotton stalk crushing qualification rate and the falling rate of crushed straw as the experimental indicators, the machine forward speed X1, crushing blade shaft rotational speed X2, and knife tip-to-ground clearance X3 were selected as experimental factors for the field tests. Based on the results of the single-factor simulation experiments, 2 m/s, 3 m/s, and 4 m/s were selected as the levels for the machine forward speed X1, 1500 r/min, 1700 r/min, and 1900 r/min as the levels for the crushing blade shaft rotational speed X2, and 50 mm, 60 mm, and 70 mm as the levels for the knife tip-to-ground clearance X3. The factor and level coding table for the orthogonal experiment is shown in Table 4.
Using the Box–Behnken experimental design method in Design-Expert 13.0 software, a three-factor, three-level experiment was designed, with a total of 17 experimental runs [45]. Each experiment was repeated three times, and the average value was taken as the experimental result for that group. The experimental process is shown in Figure 16. Before starting the experiment, five sampling points were selected in a blank sampling area. Each sampling point had a length of 2000 mm, with the width matching the working width of the machine. The entire stalks in the sampling area were collected, weighed, and the average mass was recorded as M1. After the experiment, straw with a length greater than 20 mm within the test area was collected. The stubble height at each corresponding sampling point was measured, and stubble greater than 80 mm was collected. The mass of unqualified crushed straw and stubble was weighed and recorded as M2. The crushed straw on the surface of the mulch was counted, weighed, and the mass recorded as M3.

2.6.4. Evaluation Indicators

To achieve sustainable land use, it is necessary to recover the surface mulch after cotton harvesting. However, excessive impurities on the mulch can lead to high impurity content in the recovered mulch, which affects subsequent agricultural use. Therefore, while ensuring the uniformity of straw crushing and returning, it is crucial to minimize the dropping rate of stems on the residual mulch to ensure the quality of mulch recovery. According to the NY/T 500-2015 [46] “Straw Crushing and Returning Machine-Operational Quality” and subsequent agricultural requirements, this experiment selects straw crushing qualification rate and crushed straw dropping rate as evaluation indicators. The straw crushing qualification rate includes both the qualified crushing length rate and the stubble height. Cotton stalks crushed to a length ≤ 200 mm are considered qualified. The crushing length qualification rate of the device should be ≥85%, the stubble height should be ≤80 mm, and the straw dropping rate should be ≤40% to be considered qualified.
Before the experiment, five sampling points were selected in a blank sampling area. Each sampling point had a length of 2000 mm, with the width matching the working width of the machine. The entire stalks in the sampling area were collected, weighed, and the average mass was recorded as M1. After the experiment, straw with a length greater than 20 mm within the test area was collected. The stubble height at each corresponding sampling point was measured, and stubble greater than 80 mm was collected. The mass of unqualified crushed straw and stubble was weighed and recorded as M2. The crushed straw on the surface of the mulch was counted, weighed, and the mass recorded as M3.
The formula for calculating the crushing qualification rate is as follows:
y 1 = ( M 1 M 2 M 1 ) 5 × 100
In the formula, M1 is the total weight of the cotton stalks in the sample area, g; M2 is the total mass of the unqualified straw (with incorrect length) and the stubble with an unqualified height after crushing in the measurement area, g.
The formula for calculating the dropping rate of crushed straw is as follows:
y 2 = ( M 1 M 3 M 1 ) 5 × 100
In the formula, M1 is the total weight of the cotton stalks in the sample area, g; M3 is the total mass of the crushed straw that falls onto the surface mulch during the cotton stalk crushing and returning process in the measurement area, g.

3. Results and Discussion

3.1. Analysis of Cotton Stalk Shear Force Characteristics

Before conducting the experiment, a vernier caliper (parameters) was used to measure the diameters of each cotton stalk at three sections: the upper, middle, and lower parts, and then the average values were calculated. The results showed that the average diameter of the upper part of the cotton stalk samples was 6.08 cm, the middle part was 7.95 cm, and the bottom part was 10.23 cm. The shear force results of different sampling parts of the cotton stalks are shown in Figure 17. The shear forces at each part exhibited complex and irregular changing trends. Among them, the shear force of the bottom cotton stalks reached a peak of 99.5 N in test group 1, and decreased significantly in groups 3, 6, and 10, but the overall level was still relatively high, with an average value of 76.6 N. The maximum shear force of the middle cotton stalks was 62.6 N, the minimum was 34.2 N, and the average was 51.04 N. The shear force of the upper cotton stalks reached a peak of 55.4 N in the first test group, and the changes in other groups were more complex, with an average value of 44.45 N. It can be seen that there are significant differences in the mechanical properties of different parts of the cotton stalks. This is mainly because the lower part near the root has a denser organizational structure, while the upper part is relatively loose. At the same time, it is also affected by various factors such as the growth state and water content. According to the average shear force, the order of the shear force required to crush different parts of the cotton stalks is: lower part > middle part > upper part. The results indicate that the bottom straw has higher toughness and strength than the middle and top straws, and can better resist crushing and cutting.

3.2. Single-Factor Simulation Test Results and Analysis

3.2.1. Influence of Machine Forward Speed on Operation Effect

As shown in Figure 18, the influence of the machine’s forward speed on the operation effect is as follows: the qualified rate of straw crushing first increases and then decreases with the increase in the machine’s forward speed, while the straw dropping rate first decreases and then increases. When the forward speed increases from 1 m/s to 3 m/s, the crushing qualified rate rises from 87.2% to 95.3%, but when the forward speed increases to 4 m/s, the qualified rate drops rapidly. This is because when the machine’s speed is lower than 3 m/s, the slower forward movement allows the straw to stay in the cutter disc cutting area for a longer time, resulting in more sufficient cutting, and the qualified rate increases with the increase in speed. After the speed exceeds 3 m/s, the time for the straw to pass through the cutting area is sharply reduced, the cutter disc is difficult to crush sufficiently, the number of uncut long straws increases, and the qualified rate decreases accordingly. Based on the comprehensive consideration of the test results, 2 m/s, 3 m/s, and 4 m/s are selected as the factor levels of the machine’s forward speed in the orthogonal test.

3.2.2. Effect of Crushing Blade Shaft Rotational Speed on Operational Performance

The effect of the crushing blade shaft rotational speed on the operational performance is shown in Figure 19. As the crushing blade shaft rotational speed increases, the overall trend of the crushing qualification rate continuously increases. With the increase in rotational speed, the number of impacts and cuts on the straw per unit time increases, leading to more thorough cutting of the straw, a reduction in the length of the remaining straw, and thus a higher qualification rate as the speed increases. However, the trend of the straw dropping rate follows a pattern of initially decreasing and then increasing. When the crushing blade shaft rotational speed increased from 1300 r/min to 1700 r/min, the straw dropping rate rapidly decreased from 34.5% to 22.3%. Afterward, as the rotational speed increased to 2100 r/min, the straw dropping rate quickly recovered to 32.6%. This is because, at lower rotational speeds, the machine and blade disc work in better synergy, making it harder for the straw to hit and remain on the machine frame, thus reducing the dropping rate. As the speed increases, the straw moves too fast and collides with the machine frame, altering the trajectory of the straw and making it harder to be thrown out from the outlet, leading to an increase in the dropping rate. The experimental results show that the crushing qualification rate is greater than 90% for all conditions, and the highest crushing qualification rate of 94.3% occurs when the crushing blade shaft rotational speed is 1900 r/min. Considering the impact of the crushing blade shaft rotational speed on the experimental indicators, 1500 r/min, 1700 r/min, and 1900 r/min were selected as the levels for this factor in the orthogonal experiment.

3.2.3. Effect of Knife Tip-to-Ground Clearance on Operational Performance

The effect of blade tip clearance on operational performance is shown in Figure 20. The crushing qualification rate increases as the blade tip clearance increases, with a trend of first rising and then decreasing. The straw drop rate, however, first decreases and then increases. When the blade tip clearance is 60 mm, the crushing qualification rate reaches its maximum value of 94.5%, while the straw drop rate drops to its minimum value of 23.5%. When the blade tip clearance increases from 60 mm to 80 mm, the crushing efficiency rate drops sharply from 94.5% to 88.3%, while the straw drop rate rapidly increased from 23.5% to 35.8%. This is because, before the clearance reaches 60 mm, the coordination between the blade disc, straw, and ground improves as the clearance increases, resulting in more thorough straw cutting and an increase in the qualified rate. However, when the clearance exceeds 60 mm, the cutting disc struggles to effectively cut the straw, leading to more instances of incomplete cutting and a decrease in the qualified rate. Based on the experimental results and actual field operating conditions, three levels—50 mm, 60 mm, and 70 mm—were selected as the factor levels for the cutting disc tip clearance in the orthogonal experiment.

3.3. Results and Analysis of Multi-Factor Field Trials

3.3.1. Multi-Factor Field Test Results

To further analyze the performance of the straw powder return machine, a three-factor, three-level trial was conducted, using the qualified crushing rate y1 and the straw drop rate y2 as indicators. After statistical analysis of the trial results, the results for each group are shown in Table 5.
Using Design-Expert 13.0, variance analysis was conducted on the test results, and the variance analysis results of the straw crushing qualification rate and the crushed straw drop rate are shown in Table 6. It can be seen from Table 6 that in the models of y1 and y2, p ≤ 0.001, which indicates that the quadratic regression models are extremely significant. The lack-of-fit term with p > 0.05 is not significant, so it can be known that the regression models have a high degree of fitting. In the straw crushing qualification rate y1: X1, X2, X3, X22 and X32, with p ≤ 0.05 indicate a significant impact on the crushing qualification rate y1; X1X3 and X12 with p ≤ 0.01 indicate an extremely significant impact on y1; X2X3 and X32 with p ≥ 0.05 indicate no significant impact. In the crushed straw drop rate y2: X2X3 and X32 with p ≤ 0.05 indicate a significant impact on y2; X3, X1X2, X12, and X22 with p ≤ 0.01 indicate an extremely significant impact on the model. The coefficient of determination of the regression model for y1 is R12 = 0.9638, and that for y2 is R22 = 0.9535, indicating that the corresponding regression models can be applied to more than 95% of the evaluation indicators. After removing the non-significant terms, the regression equations for the crushing qualification rate y1 and the crushed straw drop rate y2 are obtained as (17) and (18), respectively.
Using Design-Expert 13.0, an analysis of variance was performed on the experimental results, and the results for the variance analysis of the straw crushing qualification rate and straw dropping rate are shown in Table 6. From Table 6, it can be seen that the models for y1 and y2 have p ≤ 0.001, indicating that the quadratic regression models are highly significant, and the lack of fit with p > 0.05 is not significant, which shows that the regression models have a high degree of fit. In the straw crushing qualification rate y1, the factors X1, X2, X3, X22, and X32 have a significant effect on y1, while the interactions X1X3 and X12 have an extremely significant effect. The interactions X2X3 and X32 are not significant. In the straw dropping rate y2, the interactions X2X3 and X32 have a significant effect on y2, while X3, X1X2, X12, and X22 have an extremely significant effect on the model. After removing the non-significant terms, the regression formulas for the crushing qualification rate y1 and the straw dropping rate y2 are given by Formulas (17) and (18), respectively.
y 1 = 97 + 1.67 X 1 2.14 X 2 1.66 X 3 1.90 X 1 X 2 3.30 X 1 X 3 7.19 X 1 2 2.01 X 2 2
y 2 = 2614 3.15 X 3 + 2.32 X 1 X 2 1.78 X 2 X 3 + 2.49 X 1 2 2.36 X 2 2 + 1.64 X 3 2

3.3.2. Analysis of the Impact of Interaction Effects on Straw Crushing Qualification Rate

To determine the trends in how the interaction effects of various factors influence the straw crushing qualification rate and straw drop rate of the device, an analysis was conducted using response surface plots generated through data processing using the Design-Expert 13.0 software.
The effects of machine forward speed X1, crushing knife shaft speed X2, and knife tip-to-ground clearance X3 on the straw crushing pass rate y1 are shown in Figure 21. As shown in Figure 21a, when the knife tip ground clearance is fixed, as the machine forward speed X1 and crushing knife shaft speed X2 increase, the trend of the crushing pass rate first increases and then decreases. As shown in Figure 21b, when the shredding knife shaft speed is fixed, y1 rapidly increases and then decreases as the machine’s forward speed X1 increases, while it decreases steadily as the blade tip clearance X3 increases. As shown in Figure 21c, when the forward speed of the machine is fixed, y1 first increases and then decreases as the crushing knife shaft speed X2 increases, then increases slightly, and then decreases as X3 increases.
The trend in the impact of various factors on the crushing qualification rate is as follows: When the forward speed of the machinery and the rotational speed of the crushing knife shaft are altered, the quantity of cotton stalks within the crushing chamber of the machinery undergoes significant changes. As the machinery advances, the moving knives synchronously cut the bases of the cotton stalks and then feed the stalks into the crushing chamber for processing. When the forward speed of the machinery is appropriately increased or the rotational speed of the crushing knife shaft is elevated, the feed rate of the straw increases, and the cotton stalks in the crushing chamber continuously collide with each other in a disordered state, increasing the number of impacts on the stationary blades, thereby improving the crushing pass rate. However, when both speeds are too high, an excessive amount of straw in the crushing chamber may be discharged before being fully crushed, resulting in a decrease in the crushing pass rate. Additionally, adjusting the clearance between the blade tips and the ground has a relatively small impact on the amount of straw in the crushing chamber, with changes occurring at a relatively gradual rate.

3.3.3. Analysis of the Effect of Interaction on Straw Drop Rate

The effects of machine forward speed X1, shredding knife shaft speed X2, and knife tip-to-ground clearance X3 on straw drop rate y2 are shown in Figure 22. As shown in Figure 22a, when the knife tip ground clearance is fixed, y2 decreases first and then increases as the machine forward speed X1 increases; while it first increases and then decreases as the shredding knife shaft speed X2 increases. As shown in Figure 22b, when the shredding knife shaft speed is fixed, y2 decreases first and then increases as both the machine’s forward speed X1 and the blade tip clearance X3 increase. As shown in Figure 22c, when the machine’s forward speed is fixed, y2 first increases and then decreases as the shredding knife shaft speed X2 increases, and first decreases and then increases as X3 increases.
The trend in the impact of various factors on the crushing qualification rate is as follows: When the device is in operation, at low forward speeds X1, the machine experiences significant vibration due to its relatively high forward speed. During operation, the base plate inevitably tilts forward and experiences increased vertical vibration, thereby increasing the probability of straw fragments falling out. As the forward speed increases, this phenomenon is alleviated, reducing the drop rate of straw fragments. However, if the speed is too high, it increases the straw content in the crushing chamber and the airflow at the chamber inlet, thereby increasing the drop rate of smaller straw fragments. The shredding knife shaft experiences an increasing airflow as the rotational speed increases. When the airspeed generated by the shredding knife shaft is low, it increases the number of shredding and cutting cycles, resulting in smaller individual straw particles that are easily blown out through the debris discharge port. At intermediate rotational speeds, the straw is not fully crushed, and the airflow generated by the wind field is insufficient to blow out larger straw pieces, causing them to fall to the ground. As the rotational speed increases further, the airflow becomes stronger, enabling larger straw pieces to be blown out, thereby reducing the drop rate of crushed straw. When the blade tip clearance is at a low level, the bottom exhaust port is less smooth than at an intermediate level, easily forming vortices that counteract the inertial force of the crushed straw, causing it to fall directly to the ground and resulting in a higher drop rate. As the distance from the ground increases, the drop rate of the chopped straw decreases. However, at high levels, the gap between the ground and the blade becomes too large, increasing the likelihood of the chopped straw falling, resulting in a higher drop rate.

3.4. Parameter Optimization and Experimental Validation

3.4.1. Parameter Optimization

To obtain the optimal operating parameters for the machinery, based on the above analysis and combined with the actual operating conditions of the current season, the Optimization–Numerical module in the aforementioned software was used to perform multi-objective optimization on the straw shredding qualification rate and shredded straw drop rate. The optimal parameter combinations were determined by setting the following constraints: the forward speed of the machinery X1, the rotational speed of the shredding knife shaft X2, and the clearance between the knife tip-to-ground clearance X3 were each set within their respective optimal ranges. The experimental objectives were set as a dual-objective optimization aiming for the highest shredding qualification rate and the lowest straw drop rate. The established parameter combination optimization model is expressed in Formula (17):
max   y 1 min   y 2 X 1 2 , 4 X 2 1500 , 1900 X 3 50 , 70
The optimization results show that the optimal values for each factor are as follows: machine forward speed of 3.3 m/s, shredding knife shaft speed of 1500 r/min, and knife tip clearance from the ground of 61.9 mm. At these values, the comprehensive response value of the model surface reaches its maximum, with a predicted straw shredding qualification rate as high as 97.3% and a predicted shredded straw drop rate as low as 15.8%.

3.4.2. Field Validation Tests

To validate the accuracy of the model predictions and the actual operational performance of the device under optimal parameter combinations, field validation tests were conducted. The test site and other conditions were maintained consistent with those used in the orthogonal experiments. Under actual operational conditions, the following parameters were controlled: machine forward speed of 3.5 m/s, shredding blade shaft speed of 1500 r/min, blade tip clearance from the ground: 60 mm. The test samples were processed using the same method and weighed for calculation. This validation test was conducted three times, and the average value was taken as the test result. The results were then compared with the theoretically optimized values, as shown in Table 7.
As can be seen from Table 7, when the machine was tested with the optimized working parameters, the crushing qualification rate reached 95.9% and the crushed straw drop rate was 15.5%. The relative errors compared with the theoretically optimized values were 1.4% and 1.9%, respectively, indicating that the optimization results of the model parameters are reliable. It also proves that the designed vertical cotton stalk crushing and returning machine with large and small cutterheads has good working performance. Since this study adopts a traction-type walking mode, the straightness of the operation mainly depends on the driver’s experience, which is difficult to ensure stably; at the same time, all parameters are adjusted manually, and the accuracy is easily affected by operations. Therefore, future research can be optimized on the existing basis: first, add an automatic walking control system to improve the accuracy of operation alignment; second, introduce a rotational speed detection and automatic ground clearance adjustment system to ensure the accuracy and stability of key parameters, so as to further enhance the automation level and operation reliability of the equipment [47,48,49].

4. Conclusions

To address the issue of poor cotton stalk crushing efficiency, a vertical straw crushing and returning machine with large and small cutterheads was designed for cotton planting patterns in Xinjiang, and its key components were analyzed. Through single-factor simulation tests, the effects of machine forward speed, crushing cutter shaft rotational speed, and cutter tip ground clearance on working performance were explored. Combined with field multi-factor tests and parameter optimization using the response surface methodology, the optimal working parameters were determined and verified. The conclusions are as follows:
(1) After conducting tests on the physical and mechanical properties of cotton stalks, their morphological characteristic parameters and maximum shear force data were obtained: the order of force values at different positions of cotton stalks is lower part (76.6 N) > middle part (51.04 N) > upper part (44.45 N). To simulate the bending characteristics of cotton stalks, a flexible cotton stalk simulation model was constructed in EDEM based on the BondV2 bonding model. The experimental results confirmed that EDEM simulation can effectively simulate the crushing process of cotton stalks in the straw crusher.
(2) The test results showed that with the increase in the machine’s forward speed, the cotton stalk crushing qualification rate first increased and then decreased, while the crushed stalk drop rate first decreased and then increased; when the rotational speed of the crushing cutter shaft increased, the crushing qualification rate continued to rise, but the crushed stalk drop rate first decreased and then increased; when the cutter tip ground clearance was increased, the crushing qualification rate first rose and then fell, and the crushed stalk drop rate also showed a trend of first decreasing and then increasing.
(3) The parameter optimization results show that the optimal working parameters of the cotton stalk crushing and returning machine are as follows: the forward speed of the machine is 3.5 m/s, the rotational speed of the crushing cutter shaft is 1500 r/min, and the ground clearance of the cutter tip is 60 mm.
(4) The verification test data show that when the machine operates under the optimal parameters, the cotton stalk crushing qualification rate is 95.9% and the cotton stalk drop rate is 15.5%. Compared with the theoretically optimized values, the relative errors are 1.4% and 1.9%, respectively. This fully indicates that the parameter optimization model has high reliability, and also proves that under these working parameters, the designed vertical cotton stalk crushing and returning machine with large and small cutterheads has excellent working performance.

Author Contributions

X.G.: Conceptualization, Methodology, Formal analysis, Writing—original draft, Writing—review and editing, Project administration; B.L.: Conceptualization, Investigation, Data curation, Writing—original draft, Writing—review and editing, Supervision; Y.L.: Conceptualization, Supervision, Project administration, Funding acquisition; S.W.: Conceptualization, Formal analysis, Validation; Z.T.: Conceptualization, Methodology, Resources; Y.D.: Conceptualization, Software, Validation; X.L.: Methodology, Validation, Data curation. All authors have read and agreed to the published version of the manuscript.

Funding

This research was funded by the Science and Technology Plan Project of the Production and Construction Corps (2022CB003-01) and the Institute-level Scientific Research Project of Xinjiang Academy of Agricultural and Reclamation Sciences (2020YJ014).

Institutional Review Board Statement

Not applicable.

Data Availability Statement

The data used to support the findings of this study are available from the corresponding author upon request.

Conflicts of Interest

The authors declare no conflict of interest.

References

  1. Zhu, Y.; Sun, L.; Luo, Q.; Chen, H.; Yang, Y. Spatial optimization of cotton cultivation in Xinjiang: A climate change perspective. Int. J. Appl. Earth Obs. Geoinf. 2023, 124, 103523. [Google Scholar] [CrossRef]
  2. National Bureau of Statistics of the People’s Republic of China. China Statistical Yearbook-2022; China Statistics Press: Beijing, China, 2021.
  3. Feng, L.; Wan, S.; Zhang, Y.; Dong, H. Xinjiang cotton: Achieving super-high yield through efficient utilization of light, heat, water, and fertilizer by three generations of cultivation technology systems. Field Crops Res. 2024, 312, 109401. [Google Scholar] [CrossRef]
  4. Cai, C.; Wang, Z.; Ma, L.; Xu, Z.; Yu, J.; Li, F. Cotton stalk valorization towards bio-based materials, chemicals, and biofuels: A review. Renew. Sustain. Energy Rev. 2024, 202, 114651. [Google Scholar] [CrossRef]
  5. Hu, R.; Wu, D.; Liang, X.; Wang, Z.; Zou, H.; Wu, F.; Zhou, Z. Solid state fermentation improves the utilization value of cotton stalk. Ind. Crops Prod. 2025, 230, 121113. [Google Scholar] [CrossRef]
  6. Rasool, G.; Guo, X.; Wang, Z.; Chen, S.; Ullah, I.; Ali, M.U.; Saifullah, M. Effect of fertigation levels on water consumption, soil total nitrogen, and growth parameters of Brassica chinensis under straw burial. Commun. Soil Sci. Plant Anal. 2021, 52, 32–44. [Google Scholar] [CrossRef]
  7. Wang, N.; Zhao, Y.H.; Yu, J.G.; Xue, L.H.; Li, H.B.; Yang, L.Z. Roles of bulk and rhizosphere denitrifying bacteria in denitrification from paddy soils under straw return condition. J. Soils Sediments 2021, 21, 2179–2191. [Google Scholar] [CrossRef]
  8. Li, W.; Zhang, F.; Luo, Z.; Zheng, E.; Pan, D.; Qian, J.; Wang, X. Straw movement and flow field in a crushing device based on CFD-DEM coupling with flexible hollow straw model. Biosyst. Eng. 2024, 242, 140–153. [Google Scholar] [CrossRef]
  9. Li, Y.; Wu, Z.; Li, Y.; Guo, C.; Wei, S. Design and test of vertical banana straw crushing and returning machine based on piranha tooth structure. J. Chin. Inst. Eng. 2023, 46, 591–600. [Google Scholar] [CrossRef]
  10. Wu, X.; Wang, Z.; Guo, L.; Liu, J.; Dhital, Y.P.; Zhu, Y.; Wen, Y. Timing and water temperature of drip irrigation regulate cotton growth and yield under film mulching in arid areas of Xinjiang. J. Sci. Food Agric. 2023, 103, 5754–5769. [Google Scholar] [CrossRef] [PubMed]
  11. Gao, Y.; Li, Y.; Wei, S.Q.; Huang, C.; Wu, Z.H.; Li, Y. Optimized design and test of key components of vertical banana straw crushing device. J. Chin. Agric. Mech. 2024, 45, 131. [Google Scholar]
  12. Li, J.W.; Wu, P.H.; Shi, H.L.; Li, C.Y.; Cui, J.P.; Zhang, J.S. Characteristics of plant morphological parameters and correlation analysis for machine picking cotton in the different planting models. Agric. Res. Arid. Areas 2018, 36, 82–87. [Google Scholar]
  13. Masienko, I.; Fedulenko, D.; Tatarintsev, V. Development prospects of mobile rice straw crushers. In E3S Web of Conferences; EDP Sciences: Les Ulis, France, 2019. [Google Scholar]
  14. Sharma, S.; Pappu, A.; Asolekar, S.R. Sustainable recycling of paddy straw through development of short-fiber-reinforced composites: Exploring gainful utilization of agricultural waste. Clean Technol. Environ. Policy 2023, 26, 109–127. [Google Scholar] [CrossRef]
  15. Chen, Y.; Xing, R.; Liu, X.; Zhang, H.; Li, H. Design and Test of Potato Seedling Killing and Residual Film Recycling Integrated Machine. Agronomy 2024, 14, 2269. [Google Scholar] [CrossRef]
  16. Singh, A.; Dhaliwal, I.S.; Dixit, A. Performance evaluation of tractor mounted straw chopper cum spreader for paddy straw management. Indian J. Agric. Res. 2011, 45, 21–29. [Google Scholar]
  17. Verma, A.; Singh, A.; Singh, A.; Sidhu, G.S.; Dixit, A. Performance evaluation of tractor operated paddy straw mulcher. Krishi Vigyan 2016, 4, 70–75. [Google Scholar] [CrossRef]
  18. Sushilendra, B.; Veerangouda, M.; Palled, V.; Yadalli, G.S. Performance Evaluation of Straw chopper cum spreader for Paddy crop. Int. J. Curr. Microbiol. Appl. Sci. 2020, 9, 3209–3215. [Google Scholar] [CrossRef]
  19. Wu, T.; Chen, X.; Yan, L.; Gou, H.; Li, Y.; Zhang, J.; Fu, X. Optimization Design and Experiment of a Cotton Straw-Crushing Device Based on Computational Fluid Dynamics. Agriculture 2024, 14, 533. [Google Scholar] [CrossRef]
  20. Lun, X.; Li, C.; Zhai, Z.; Lan, Y.; Gan, S. Prediction of vibration radiation noise from shell of straw crushing machine. Noise Vib. Worldw. 2021, 52, 271–284. [Google Scholar] [CrossRef]
  21. Zhang, X.; Gan, S.; Zheng, K.; Li, Y.; Liang, D. Design and experiment on cut roll feeding type horizontal shaft flail machine for banana pseudostem crushing and returning. Trans. Chin. Soc. Agric. Eng. 2015, 31, 33–41. [Google Scholar]
  22. Wang, W.; Li, J.; Chen, L.; Qi, H.; Liang, X. Effects of key parameters of straw chopping device on qualified rate, non-uniformity and power consumption. Int. J. Agric. Biol. Eng. 2018, 11, 122–128. [Google Scholar] [CrossRef]
  23. Xu, L.; Che, Y.; Zhu, R.; Zhu, J.; Zhang, R. Design and Simulation of Chopping Device of Straw Returning Machine. J. Phys. Conf. Ser. 2021, 1748, 062066. [Google Scholar] [CrossRef]
  24. Zhang, X.R.; Ni, S.L.; Liu, J.X.; Hu, X.H.; Zhang, Z.F.; Fu, S.H. Design and Flow Field Analysis of Bionic Blade of Banana Straw Crushing and Throwing Machine. Trans. Chin. Soc. Agric. Mach. 2024, 55, 138–151+160. [Google Scholar]
  25. Yuan, X.M.; Li, X.H.; Jiao, H.T.; Zhou, S.L.; Zhang, J.; Wu, H.Y. Design and Experiment of Straw Chopping Centralized Full Depth and Returning Machine. Trans. Chin. Soc. Agric. Mach. 2023, 54, 27–35. [Google Scholar]
  26. Guo, X.; Wang, S.; Chen, S.; Li, B.; Tang, Z.; Hu, Y. Impact of Structural Parameters on the Collision Characteristics and Coefficient of Restitution of Soybean Particles on Harvester’s Cleaning Screens. Agriculture 2024, 14, 1201. [Google Scholar] [CrossRef]
  27. Chandio, F.A.; Li, Y.; Ma, Z.; Ahmad, F.; Syed, T.N.; Shaikh, S.A.; Tunio, M.H. Influences of moisture content and compressive loading speed on the mechanical properties of maize grain orientations. Int. J. Agric. Biol. Eng. 2021, 14, 41–49. [Google Scholar] [CrossRef]
  28. Xu, Y.; Zhang, X.; Sun, X.; Wang, J.; Liu, J.; Li, Z.; Guo, Q.; Li, P. Tensile mechanical properties of greenhouse cucumber cane. Int. J. Agric. Biol. Eng. 2016, 9, 1–8. [Google Scholar]
  29. GB/T 24675.6-2021; Conservation Tillage Equipment-Part 6: Smashed Straw Machine. State Administration for Market Regulation, Standardization Administration of the People’s Republic of China: Beijing, China, 2021.
  30. Gao, Y.; Hu, Y.; Yang, Y.; Feng, K.; Han, X.; Li, P.; Song, Q. Optimization of Operating Parameters for Straw Returning Machine Based on Vibration Characteristic Analysis. Agronomy 2024, 14, 2388. [Google Scholar] [CrossRef]
  31. Ahmad, F.; Qiu, B.; Ding, Q.; Ding, W.; Khan, Z.M.; Shoaib, M.; Khaliq, A. Discrete element method simulation of disc type furrow openers in paddy soil. Int. J. Agric. Biol. Eng. 2020, 13, 103–110. [Google Scholar] [CrossRef]
  32. Bai, S.; Yang, Q.; Niu, K.; Zhao, B.; Zhou, L.; Yuan, Y. Discrete element-based optimization parameters of an experimental corn silage crushing and throwing device. Trans. ASABE 2021, 64, 1019–1026. [Google Scholar] [CrossRef]
  33. Niu, K.; Yang, Q.; Bai, S.; Zhou, L.; Chen, K.; Wang, F.; Xiong, S.; Zhao, B. Simulation analysis and experimental research on silage corn crushing and throwing device. Appl. Eng. Agric. 2021, 37, 725–734. [Google Scholar] [CrossRef]
  34. Xu, B.; Liu, J.; Jin, Y.; Yang, K.; Zhao, S.; Peng, Y. Vibration–Collision Coupling Modeling in Grape Clusters for Non-Damage Harvesting Operations. Agriculture 2025, 15, 154. [Google Scholar] [CrossRef]
  35. Chen, X.; Bai, J.; Wang, X.; Fang, W.; Hong, T.; Zang, N.; Fang, L.; Wang, G. Calibration and testing of discrete elemental simulation parameters for pod pepper seeds. Agriculture 2024, 14, 831. [Google Scholar] [CrossRef]
  36. Chen, X.; Wang, X.; Bai, J.; Fang, W.; Hong, T.; Zang, N.; Wang, G. Virtual parameter calibration of pod pepper seeds based on discrete element simulation. Heliyon 2024, 10, e31686. [Google Scholar] [CrossRef] [PubMed]
  37. Zhu, X.; Xu, Y.; Han, C.; Yang, B.; Luo, Y.; Qiu, S.; Huang, X.; Mao, H. Parameter Calibration and Experimental Verification of the Discrete Element Model of the Edible Sunflower Seed. Agriculture 2025, 15, 292. [Google Scholar] [CrossRef]
  38. Liu, F.; Zhang, J.; Chen, J. Modeling of flexible wheat straw by discrete element method and its parameter calibration. Int. J. Agric. Biol. Eng. 2018, 11, 42–46. [Google Scholar] [CrossRef]
  39. Zhang, B.; Chen, X.; Liang, R.; Li, J.; Wang, X.; Meng, H.; Kan, Z. Cotton stalk restitution coefficient determination tests based on the binocular high-speed camera technology. Int. J. Agric. Biol. Eng. 2022, 15, 181–189. [Google Scholar] [CrossRef]
  40. Liang, R.; Chen, X.; Zhang, B.; Wang, X.; Kan, Z.; Meng, H. Calibration and test of the contact parameters for chopped cotton stems based on discrete element method. Int. J. Agric. Biol. Eng. 2022, 15, 1–8. [Google Scholar] [CrossRef]
  41. Du, C.; Han, D.; Song, Z.; Chen, Y.; Chen, X.; Wang, X. Calibration of contact parameters for complex shaped fruits based on discrete element method: The case of pod pepper (Capsicum annuum). Biosyst. Eng. 2023, 226, 43–54. [Google Scholar] [CrossRef]
  42. Zhao, W.; Chen, M.; Xie, J.; Cao, S.; Wu, A.; Wang, Z. Discrete element modeling and physical experiment research on the biomechanical properties of cotton stalk. Comput. Electron. Agric. 2022, 204, 107502. [Google Scholar] [CrossRef]
  43. Zhang, J.X.; Zhang, P.; Zhang, H.; Tan, C.L.; Wan, W.Y.; Wang, Y.C. Characteristics of plant morphological parameters and correlation analysis for machine picking cotton in the different planting models. Trans. Chin. Soc. Agric. Mach. 2024, 055. [Google Scholar]
  44. Zhang, B.; Chen, X.; Liang, R.; Wang, X.; Meng, H.; Kan, Z. Calibration and test of contact parameters between chopped cotton stalks using response surface methodology. Agriculture 2022, 12, 1851. [Google Scholar] [CrossRef]
  45. Wang, J.; Zhao, W.; Liu, X.; Dai, F.; Shi, R.; Zhang, K.; Liang, J. The Design and Testing of a Combined Operation Machine for Corn Straw Crushing and Residual Film Recycling. Agriculture 2025, 15, 916. [Google Scholar] [CrossRef]
  46. NY/T 500-2015; Operating Quality for Straw-Smashing Machines. Ministry of Agriculture of the People’s Republic of China: Beijing, China, 2015.
  47. Liu, Y.; Li, Y.; Ji, K.; Yu, Z.; Ma, Z.; Xu, L.; Niu, C. Development of a hydraulic variable-diameter threshing drum control system for combine harvester part I: Adaptive monitoring method. Biosyst. Eng. 2025, 250, 174–182. [Google Scholar] [CrossRef]
  48. Zhu, Z.; Chai, X.; Xu, L.; Quan, L.; Yuan, C.; Tian, S. Design and performance of a distributed electric drive system for a series hybrid electric combine harvester. Biosyst. Eng. 2023, 236, 160–174. [Google Scholar] [CrossRef]
  49. Chen, J.; Ning, X.; Li, Y.; Yang, G.; Wu, P.; Chen, S. A fuzzy control strategy for the forward speed of a combine harvester based on KDD. Appl. Eng. Agric. 2017, 33, 15–22. [Google Scholar] [CrossRef]
Figure 1. Schematic diagram of Xinjiang cotton planting model and plant height. 1. Soil. 2. Surface mulch. 3. Cotton stalk.
Agriculture 15 01572 g001
Figure 2. Diameter distribution of cotton stalk at different positions.
Agriculture 15 01572 g002
Figure 3. Cotton stalk double-support shearing test.
Agriculture 15 01572 g003
Figure 4. 
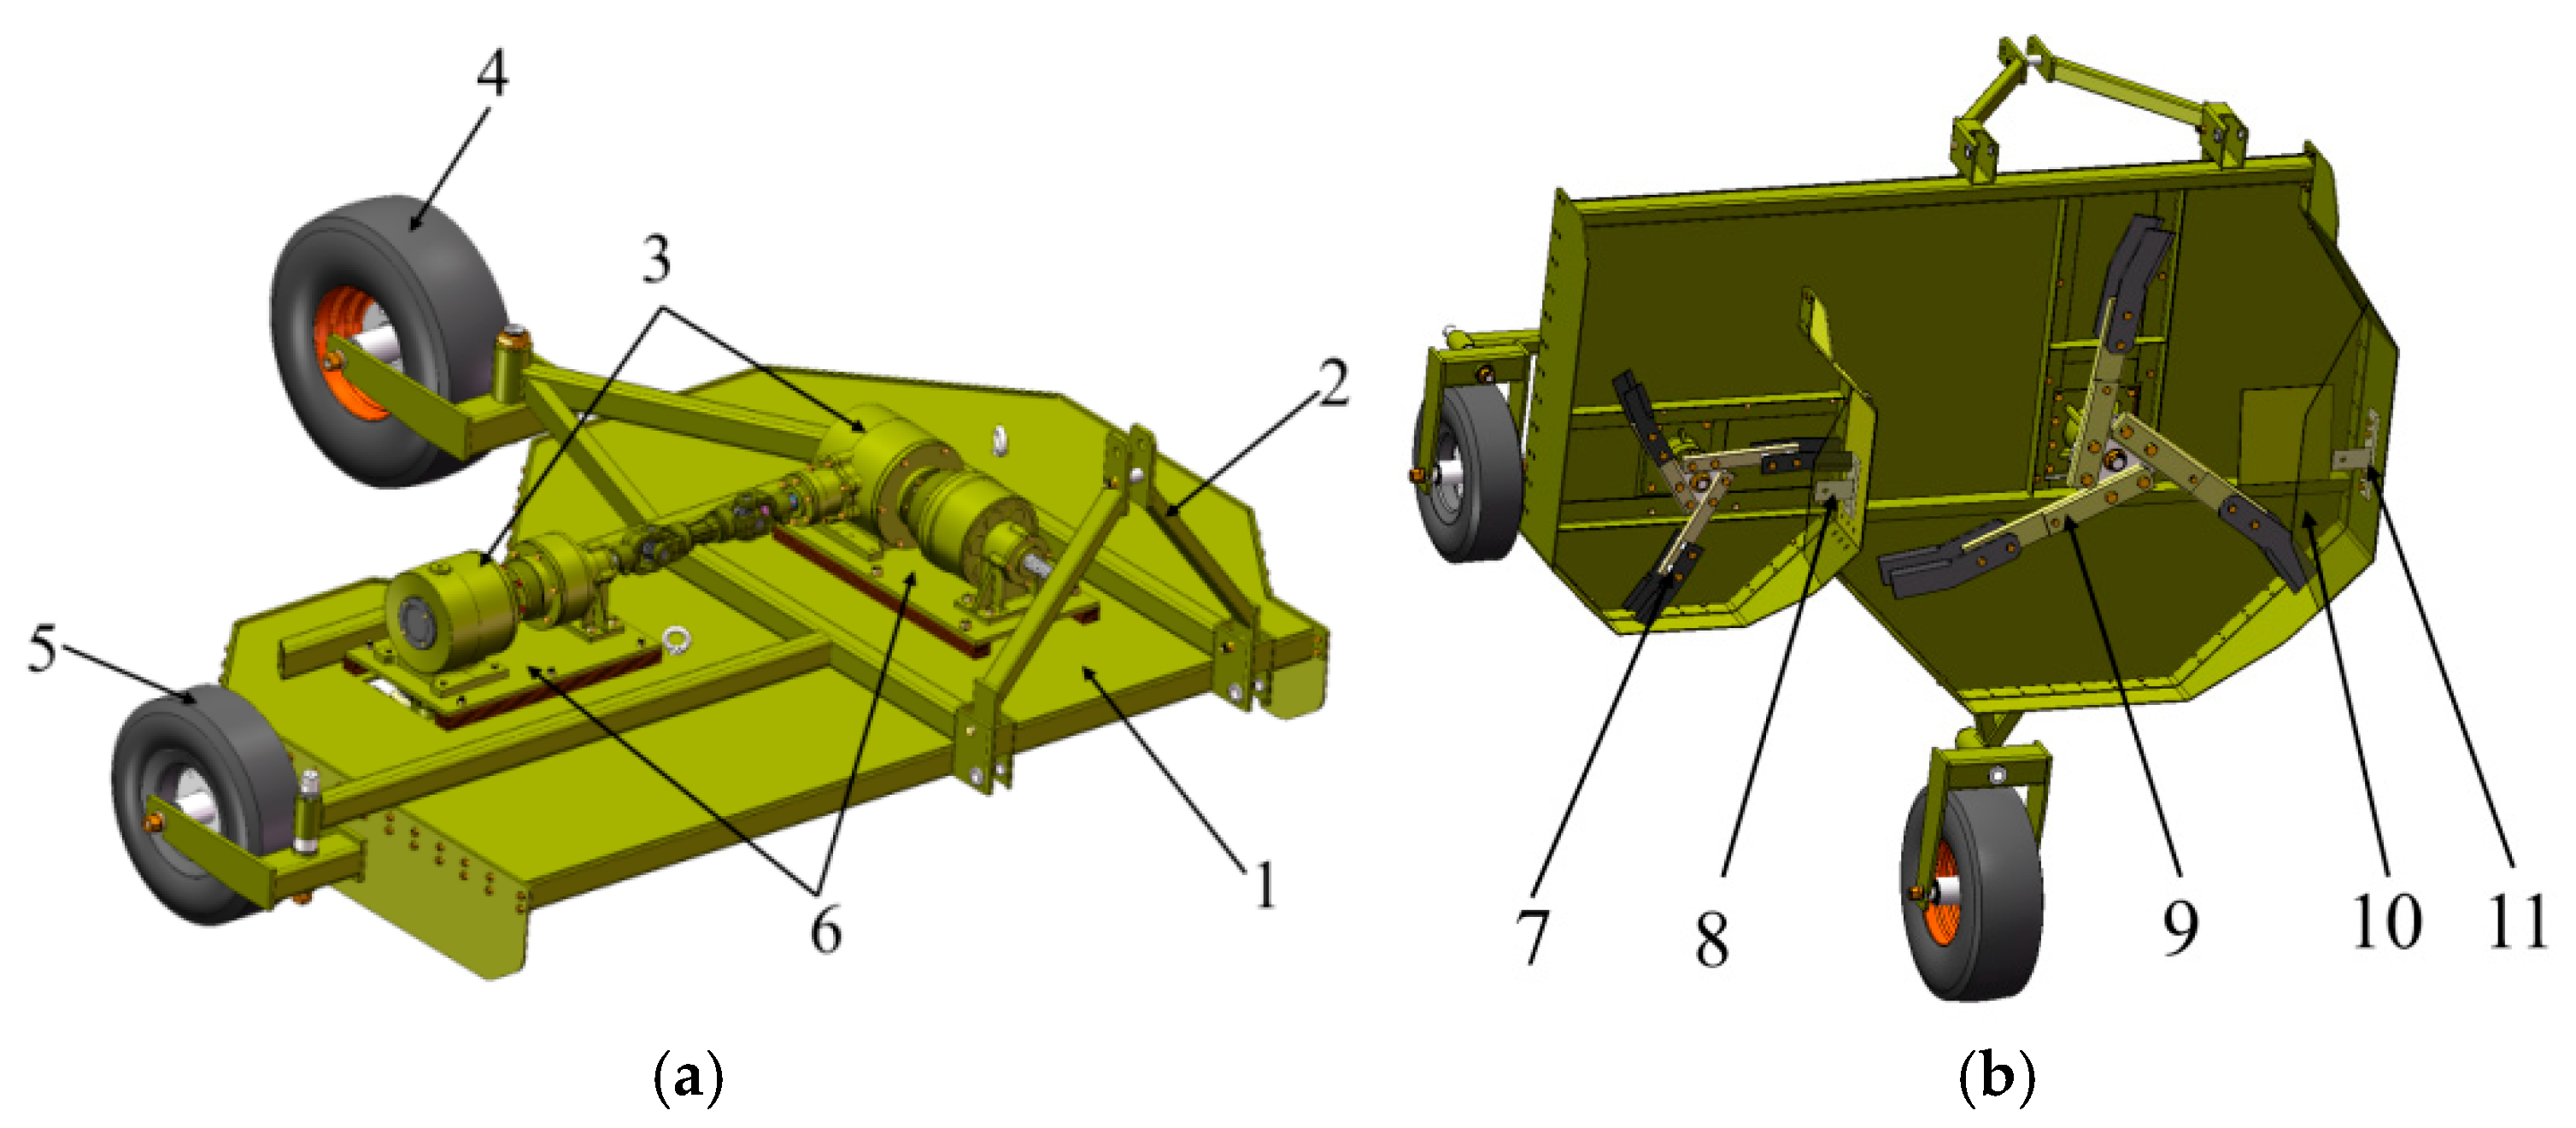
Overall structure diagram of the straw crushing device. (a). Front view of the straw crusher. (b). Bottom view of the straw crusher. 1. Frame guard plate. 2. Triangular suspension. 3. Gearbox. 4. Large contour wheel. 5. Support wheel. 6. Shock-absorbing pad. 7. Small cutting blade disc. 8. Fixed knife. 9. Large cutting blade disc. 10. Large guard plate. 11. Fixed knife.
Agriculture 15 01572 g004
Figure 5. Schematic diagram of the working principle. 1. Small gearbox. 2. Small cutterhead. 3. Fixed knife. 4. Small over-running clutch, 5. Small friction clutch. 6. Small gearbox. 7. Fixed knife. 8. Large over-running clutch. 9. Large friction clutch. 10. Large cutterhead.
Agriculture 15 01572 g005
Figure 6. Schematic diagram of the fixed blade. 1. Fixed blade edge. 2. Fixed blade body. 3. Fixed blade seat.
Agriculture 15 01572 g006
Figure 7. Schematic diagram of the moving blade structure.
Agriculture 15 01572 g007
Figure 8. Installation position of the crushing knife. (a). Installation structure diagram of the crushing knife in the transmission device. (b). Installation structure diagram of the crushing knife in the complete machine.
Agriculture 15 01572 g008
Figure 9. Chopping and slant cutting of the moving blade relative to the fixed blade. (a). Tangential cutting speed analysis of cotton stalk. (b). Slant cutting speed analysis of cotton stalk. 1. Crushing moving blade. 2. Crushing fixed blade.
Agriculture 15 01572 g009
Figure 10. Force analysis of cotton stalk shearing by rotating machinery.
Agriculture 15 01572 g010
Figure 11. Force on one side of the cutting edge of the moving blade during cotton stalk cutting.
Agriculture 15 01572 g011
Figure 12. Trajectory of the tool motion.
Agriculture 15 01572 g012
Figure 13. Schematic diagram of the cotton stalk plant and model.
Agriculture 15 01572 g013
Figure 14. Simulation model experimental layout.
Agriculture 15 01572 g014
Figure 15. Cotton stalk crushing simulation process.
Agriculture 15 01572 g015
Figure 16. Field test photos.
Agriculture 15 01572 g016
Figure 17. Effect of different sampling positions on the shear force of straw.
Agriculture 15 01572 g017
Figure 18. Effect of different forward speeds of the machine on operational performance.
Agriculture 15 01572 g018
Figure 19. Effect of different rotational speeds of the crushing blade shaft on operational performance.
Agriculture 15 01572 g019
Figure 20. Influence of different knife tip-to-ground clearances on operation effect.
Agriculture 15 01572 g020
Figure 21. The effect of factor interactions on crushing qualification rate. (a). y1 = (X1, X2, 60); (b). y1 = (X1, 1700, X3); (c). y1 = (3, X2, X3).
Agriculture 15 01572 g021
Figure 22. The effect of factor interactions on straw dropping rate. (a). y2 = (X1, X2, 60); (b). y2 = (X1, 1700, X3); (c). y2 = (3, X2, X3).
Agriculture 15 01572 g022
Table 1. Structural Parameters of Flail Hammers.
ParametersLarge Cutter DiscSmall Cutter Disc
Rake Angle α16°16°
Edge Thickness a2 mm2 mm
Blade Camber b10 mm6 mm
Blade Width c100 mm60 mm
Cutting Edge Length e 166 mm108 mm
Overall Tool Length f 420 mm300 mm
Shank Offset Angle β164°164°
Table 2. Simulation Parameters Table.
ParameterValueParameterValue
Cotton stalk Poisson’s ratio0.35Crushing blade Poisson’s ratio0.3
Cotton stalk density/(kg·m−3)1080Crushing blade density/(kg·m−3)7850
Cotton stalk shear modulus7.9 × 1010Crushing blade shear modulus6.9 × 108
Cotton stalk—Crushing blade restitution coefficient0.5Cotton stalk—Cotton stalk restitution coefficient0.5
Cotton stalk—Crushing blade static/dynamic friction coefficient0.37Cotton stalk—Cotton stalk static friction coefficient0.41
Cotton stalk—Crushing blade rolling friction coefficient0.08Cotton stalk—Cotton stalk rolling friction coefficient0.06
Cotton stalk normal stiffness6.73 × 1010Cotton stalk critical normal stress4 × 107
Cotton stalk tangential stiffness5.38 × 1010Cotton stalk critical shear stress2 × 107
Table 3. Experimental Factors and Levels.
LevelsFactors
Forward Speed of the Machine (m/s)Crushing Blade Shaft Rotational Speed (r/min)Knife Tip-to-Ground Clearance (mm)
11130040
22150050
33170060
44190070
55210080
Table 4. Orthogonal Experiment Factor and Level Coding.
LevelsForward Speed of the Machine X1 (m/s)Crushing Blade Shaft Rotational Speed X2 (r/min)Knife Tip-to-Ground Clearance X3 (mm)
−12150050
03170060
14190070
Table 5. Orthogonal experimental design and results.
Test Serial NumberForward Speed of the Machine X1 (m/s)Crushing Blade Shaft Rotational Speed X2 (r/min)Knife Tip-to-Ground Clearance X3 (mm)Crushing Qualification Rate y1/%Straw Drop Rate y2/%
1−1−1085.219.7
21−1093.114.6
3−11086.316.4
411086.617.4
5−10−187.621.9
610−196.821.9
7−10190.517.6
810186.517.1
90−1−198.317.0
1001−195.719.6
110−1198.615.6
1201189.513.7
1300096.917.8
1400098.216.1
1500095.417.0
1600095.816.7
1700098.717.2
Table 6. Analysis of Variance for Orthogonal Experimental Results.
Source of VariationDegrees of FreedomCrushing Qualification Rate (y1/%)Straw Drop Rate (y2/%)
Sum of SquaresF-ValueSignificance Level p-ValueSum of SquaresF-ValueSignificance Level p-Value
Model9391.3220.690.0003 **178.5515.930.0007 **
X1122.4410.680.0137 *6.124.920.0621
X2136.5517.40.0042 *0.0050.0040.9512
X3122.1110.520.0142 *79.3863.74<0.0001 **
X1X2114.446.870.0343 *21.6217.360.0042 **
X1X3143.5620.730.0026 **0.20250.16260.6988
X2X3110.565.030.059912.610.120.0155 *
X121217.52103.53<0.0001 **26.1621.010.0025 **
X22117.058.120.0247 *23.418.790.0034 **
X3211.220.580.471611.369.120.0194 *
Residual Error714.71 8.72
Lack of Fit36.371.020.47285.262.03
Pure Error48.34 3.45
Total16406.03 187.27
Note: According to statistical principles, p ≤ 0.01 is highly significant and is indicated by **; 0.01 < p ≤ 0.05 is significant and is indicated by *; p > 0.05 is not significant.
Table 7. Comparison of validation test results and theoretically optimized values.
ProjectQualification Rate of Crushing y1/%Straw Drop Rate y2/%
Experimental results95.915.5
Theoretical optimization values97.315.8
Relative error1.41.9
Disclaimer/Publisher’s Note: The statements, opinions and data contained in all publications are solely those of the individual author(s) and contributor(s) and not of MDPI and/or the editor(s). MDPI and/or the editor(s) disclaim responsibility for any injury to people or property resulting from any ideas, methods, instructions or products referred to in the content.

