Article

Combined High Irradiance and Water Deficit Alters the Anatomy and Physiology of Photomorphogenic Mutant Micro-Tom Plants

by
Ariana Bertola Carnevale
1,2,
Alan Carlos da Costa
2,3,4,*,
Emily Carolina Duarte Santos
2,
Adinan Alves da Silva
3,5,
Priscila Ferreira Batista
2,
Fábia Barbosa da Silva
6,
Luciana Minervina de Freitas Moura
2,3 and
Caroline Müller
2,3
1
Centro Universitário de Mineiros (UNIFIMES), Mineiros 75833-130, GO, Brazil
2
Laboratório de Ecofisiologia e Produtividade Vegetal, Instituto Federal de Educação, Ciência e Tecnologia Goiano (IFGoiano), Rio Verde 75901-970, GO, Brazil
3
Centro de Excelência em Agricultura Exponencial (CEAGRE), Rio Verde 75905-360, GO, Brazil
4
Centro de Excelência em Bioinsumos (CEBIO), Goiânia 74085-010, GO, Brazil
5
Instituto Federal de Educação, Ciência e Tecnologia Goiano (IFGoiano), Cristalina 73850-166, GO, Brazil
6
Laboratório de Estudos Avançados em Agricultura Vertical, Instituto Federal de Educação, Ciência e Tecnologia Goiano (IFGoiano), Rio Verde 75901-970, GO, Brazil
*
Author to whom correspondence should be addressed.
Agriculture 2025, 15(14), 1518; https://doi.org/10.3390/agriculture15141518
Submission received: 25 May 2025 / Revised: 9 July 2025 / Accepted: 10 July 2025 / Published: 14 July 2025

Abstract

Plants are continuously exposed to multiple environmental stressors throughout their lifecycle. Understanding their integrated physiological, biochemical, and anatomical responses under combined stress conditions is crucial for developing effective approaches to improve stress tolerance and maintain crop productivity. This study aimed to investigate the physiological, biochemical, and anatomical changes in photomorphogenic Micro-Tom plants exposed to high irradiance and water deficit—an abiotic stress combination that commonly co-occurs in natural environments but remains poorly understood in light-sensitive genotypes. We hypothesized that the high pigment 1 (hp1) mutant, due to its enhanced light responsiveness, would display improved stress acclimation compared to the wild-type when exposed to combined stress factors. This study was conducted in a controlled plant growth chamber, using a randomized block design with five replicates. Two Micro-Tom genotypes (wt and hp1) were exposed to control (soil at field capacity (FC) + 450 μmol m−2 s−1 PPFD) and combined stress (40% FC + 1800 μmol m−2 s−1 PPFD) conditions. Despite the higher concentration of chloroplast pigments in hp1, its photosynthetic performance under combined stress was not significantly improved, and its defense mechanisms did not effectively mitigate the stress impacts. Anatomically, wt exhibited greater structural adjustment, observed by adaptations in the spongy parenchyma and mesophyll. Overall, the wt genotype showed stronger defense mechanisms, while hp1 was more susceptible to combined abiotic stress.

1. Introduction

Plants are frequently exposed to adverse environmental conditions throughout their life cycle, which can impair their metabolism and development [1]. Among the major challenges in agriculture is the need to mitigate the economic losses caused by abiotic stress on crop productivity—an issue that is becoming increasingly severe due to climate change [2]. Both water deficits [3] and high irradiance [4] affect growth and productivity. Typically, irradiance and temperature stresses result from the plant’s inability to compensate for water loss. As a result, these conditions often occur simultaneously, intensifying the damage to plant physiology and anatomy [5].
High irradiance combined with a water deficit can increase the stress responses of plants [6]. One example is the reduction in the photosynthetic rate caused by stomatal closure, which limits CO2 assimilation and, consequently, restricts plant growth [7,8]. This leads to reduced chloroplast pigments and decreased Rubisco enzyme expression, resulting in cellular oxidative stress, reduced plant growth, and lower production [7,8].
In response to adverse environmental conditions, plants increase the synthesis of protective metabolites, such as proline—an amino acid that acts as an osmolyte—and activate antioxidant enzymes, including superoxide dismutase, catalase, and peroxidases, which play a key role in detoxifying reactive oxygen species [9,10,11].
Plants acclimate to environmental stimuli through physiological, structural, or biochemical adjustments that can be reversible or irreversible. Studying the effects of combined stresses compared to isolated ones enables a better understanding of how plants respond to simultaneous environmental challenges, which represent a more realistic and increasingly common scenario in the context of global climate change. This approach is crucial for identifying specific physiological and metabolic responses that are key to plant adaptation to multifactorial stresses. As extreme environmental conditions become more frequent, understanding these combined effects is essential for developing strategies to maintain agricultural productivity and ensure food security [12,13,14,15]. The combination of water deficit and high irradiance was selected because these stressors frequently co-occur in natural and agricultural environments, particularly in tropical and subtropical regions. Both stresses exacerbate impacts on photosynthesis, stomatal regulation, water relations, and oxidative metabolism, making them particularly relevant for evaluating stress responses in light-sensitive genotypes.
Micro-Tom plants have been used as a model for the study of biochemical and physiological processes and other responses of plant development due to their small size, short generation time, ease of handling [16,17], and associated mutation techniques [18]. They are a viable alternative to Arabidopsis thaliana for research purposes. Additionally, light-responsive mutants such as hp1 are known to exhibit altered pigment content and photomorphogenic regulation, but their performance under concurrent abiotic challenges has not been thoroughly characterized.
Recent research on Micro-Tom has focused on phytochromes and signaling mechanisms that shed light on how light influences responses to abiotic stress and affects plant morphology, physiology, and metabolism [19,20]. While several studies have examined the effects of water stress [21] and high temperatures [22,23] individually, the combined impact of multiple stress factors—such as water deficit and high irradiance—remains underexplored. Consequently, exploring this particular stress combination in Micro-Tom genotypes provides valuable insights into genotype-specific acclimatation mechanisms under environmental conditions intensified by climate change.
This study tests the following hypotheses: (i) Due to the higher pigment concentration, the photomorphogenic high-pigment (hp1) mutant genotype has a photosynthetic apparatus that is more tolerant to combined stress compared to the wild-type (wt); (ii) the hp1 genotype has more active stress defense mechanisms than the wt genotype; and (iii) combined stress of water stress and high irradiance induces anatomical and physiological changes in the photomorphogenic Micro-Tom genotypes and promotes stress acclimatization. To test these hypotheses, we exposed wt and hp1 plants to water deficit and high irradiation to characterize their physiological, biochemical, and anatomical changes.

2. Materials and Methods

2.1. Plant Material, Experimental Conditions, and Experimental Design

The experiments were carried out in the Ecophysiology and Plant Productivity Laboratory at the Instituto Federal Goiano, Rio Verde Campus (17°48′06.8″ S, 50°54′22.4″ W), under controlled conditions in a plant growth chamber (Instalafrio, Pinhais, Brazil). Temperature, relative humidity, irradiance, and photoperiod were monitored and regulated using EnviroPlant software V021A (Instalafrio, Pinhais, Brazil).
Seeds of the Solanum lycopersicum cultivar Micro-Tom (MT), including the wild-type (wt) genotype and the high pigment 1 mutant (hp1)—a photomorphogenic mutant—were provided by the Laboratory of Hormonal Control of Plants Development, Escola Superior de Agricultura Luiz de Queiroz, University of São Paulo. Before sowing, the seeds were placed in running water for 8 h to overcome dormancy and then sown in 8 L pots containing Bioplant® commercial substrate (Araçuaí, Minas Gerais, Brazil). The pots were kept in the growth chamber under a constant temperature of 25 °C, approximately 65% relative humidity photosynthetic photon flux density (PPFD) of 450 μmol m−2 s−1, and a 12 h photoperiod (7:00–19:00).
Fifteen days after sowing, plants exhibiting uniform development were chosen and transplanted into 3 L plastic pots filled with a soil mixture of dystrophic Red Latosol and sand in a 2:1 ratio. The substrate was previously fertilized based on physicochemical analysis and nutrient recommendation for tomato cultivation [24].
Plants were maintained under the same conditions, and substrate moisture was kept at field capacity (FC). Following the initial growth period, both wt and hp1 plants were subjected to two water and light regimes for 7 days: (1) control: substrate at 100% FC + 450 μmol m−2 s−1 PPFD; (2) combined stress: substrate at 40% FC (water deficit) + 1800 μmol m−2 s−1 PPFD (high irradiance).
High irradiance was applied daily from 10 am to 4 pm. Afterwards, the plants were again placed under low irradiance conditions (450 μmol m−2 s−1 PFFD) until a new cycle of stress was applied the next day.
Field capacity was measured gravimetrically according to Costa et al. [6]. Pots were weighed daily at 4 pm to replace water lost by evapotranspiration.
The experiment employed a randomized block design with a 2 × 2 factorial scheme involving two Micro-Tom genotypes (wt and hp1), and two environmental treatments (control and combined stresses), with five replicates. The plants were evaluated approximately 53 days after planting (Figure S1. Supplementary Materials).

2.2. Evaluations

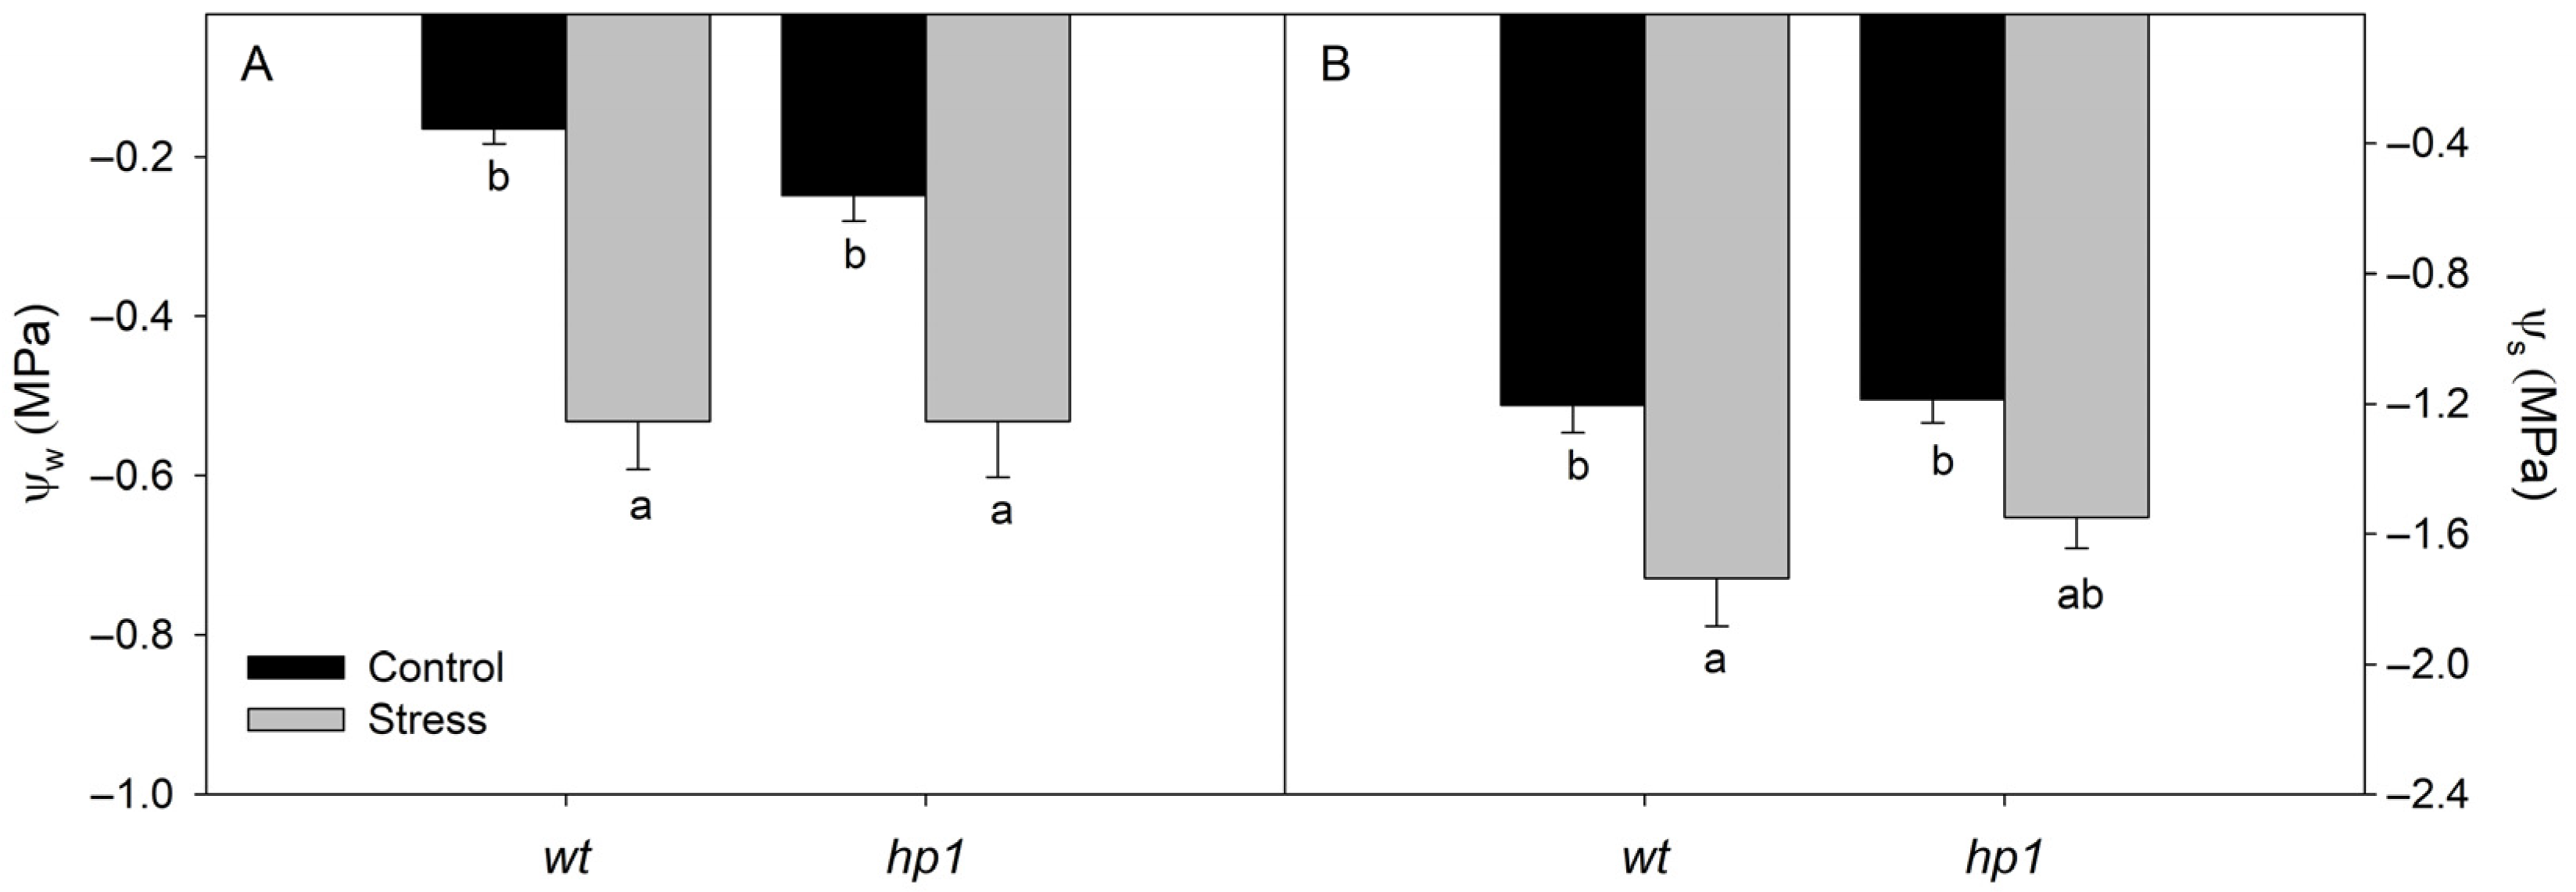
2.2.1. Leaf Water and Osmotic Potential

Predawn leaf water potential (Ψw) was assessed in fully developed leaves from the middle third of the plant with a Scholander-type pressure chamber [25]. For osmotic potential (Ψs), leaf samples were collected at predawn, frozen at −20 °C, thawed at room temperature, and macerated to extract sap. After centrifugation (5000 rpm 10 min), osmolality was measured in 10 μL of the supernatant using a vapor pressure osmometer (Vapro 5520—Wescor, Logan, UT, USA). The Ψs was calculated using the van’t Hoff equation (Equation (1)):
Ψs = −(R × T × C)
where R is the gas constant, T is temperature in Kelvin, and C is osmolality in mol·kg−1. Results were reported in MPa.

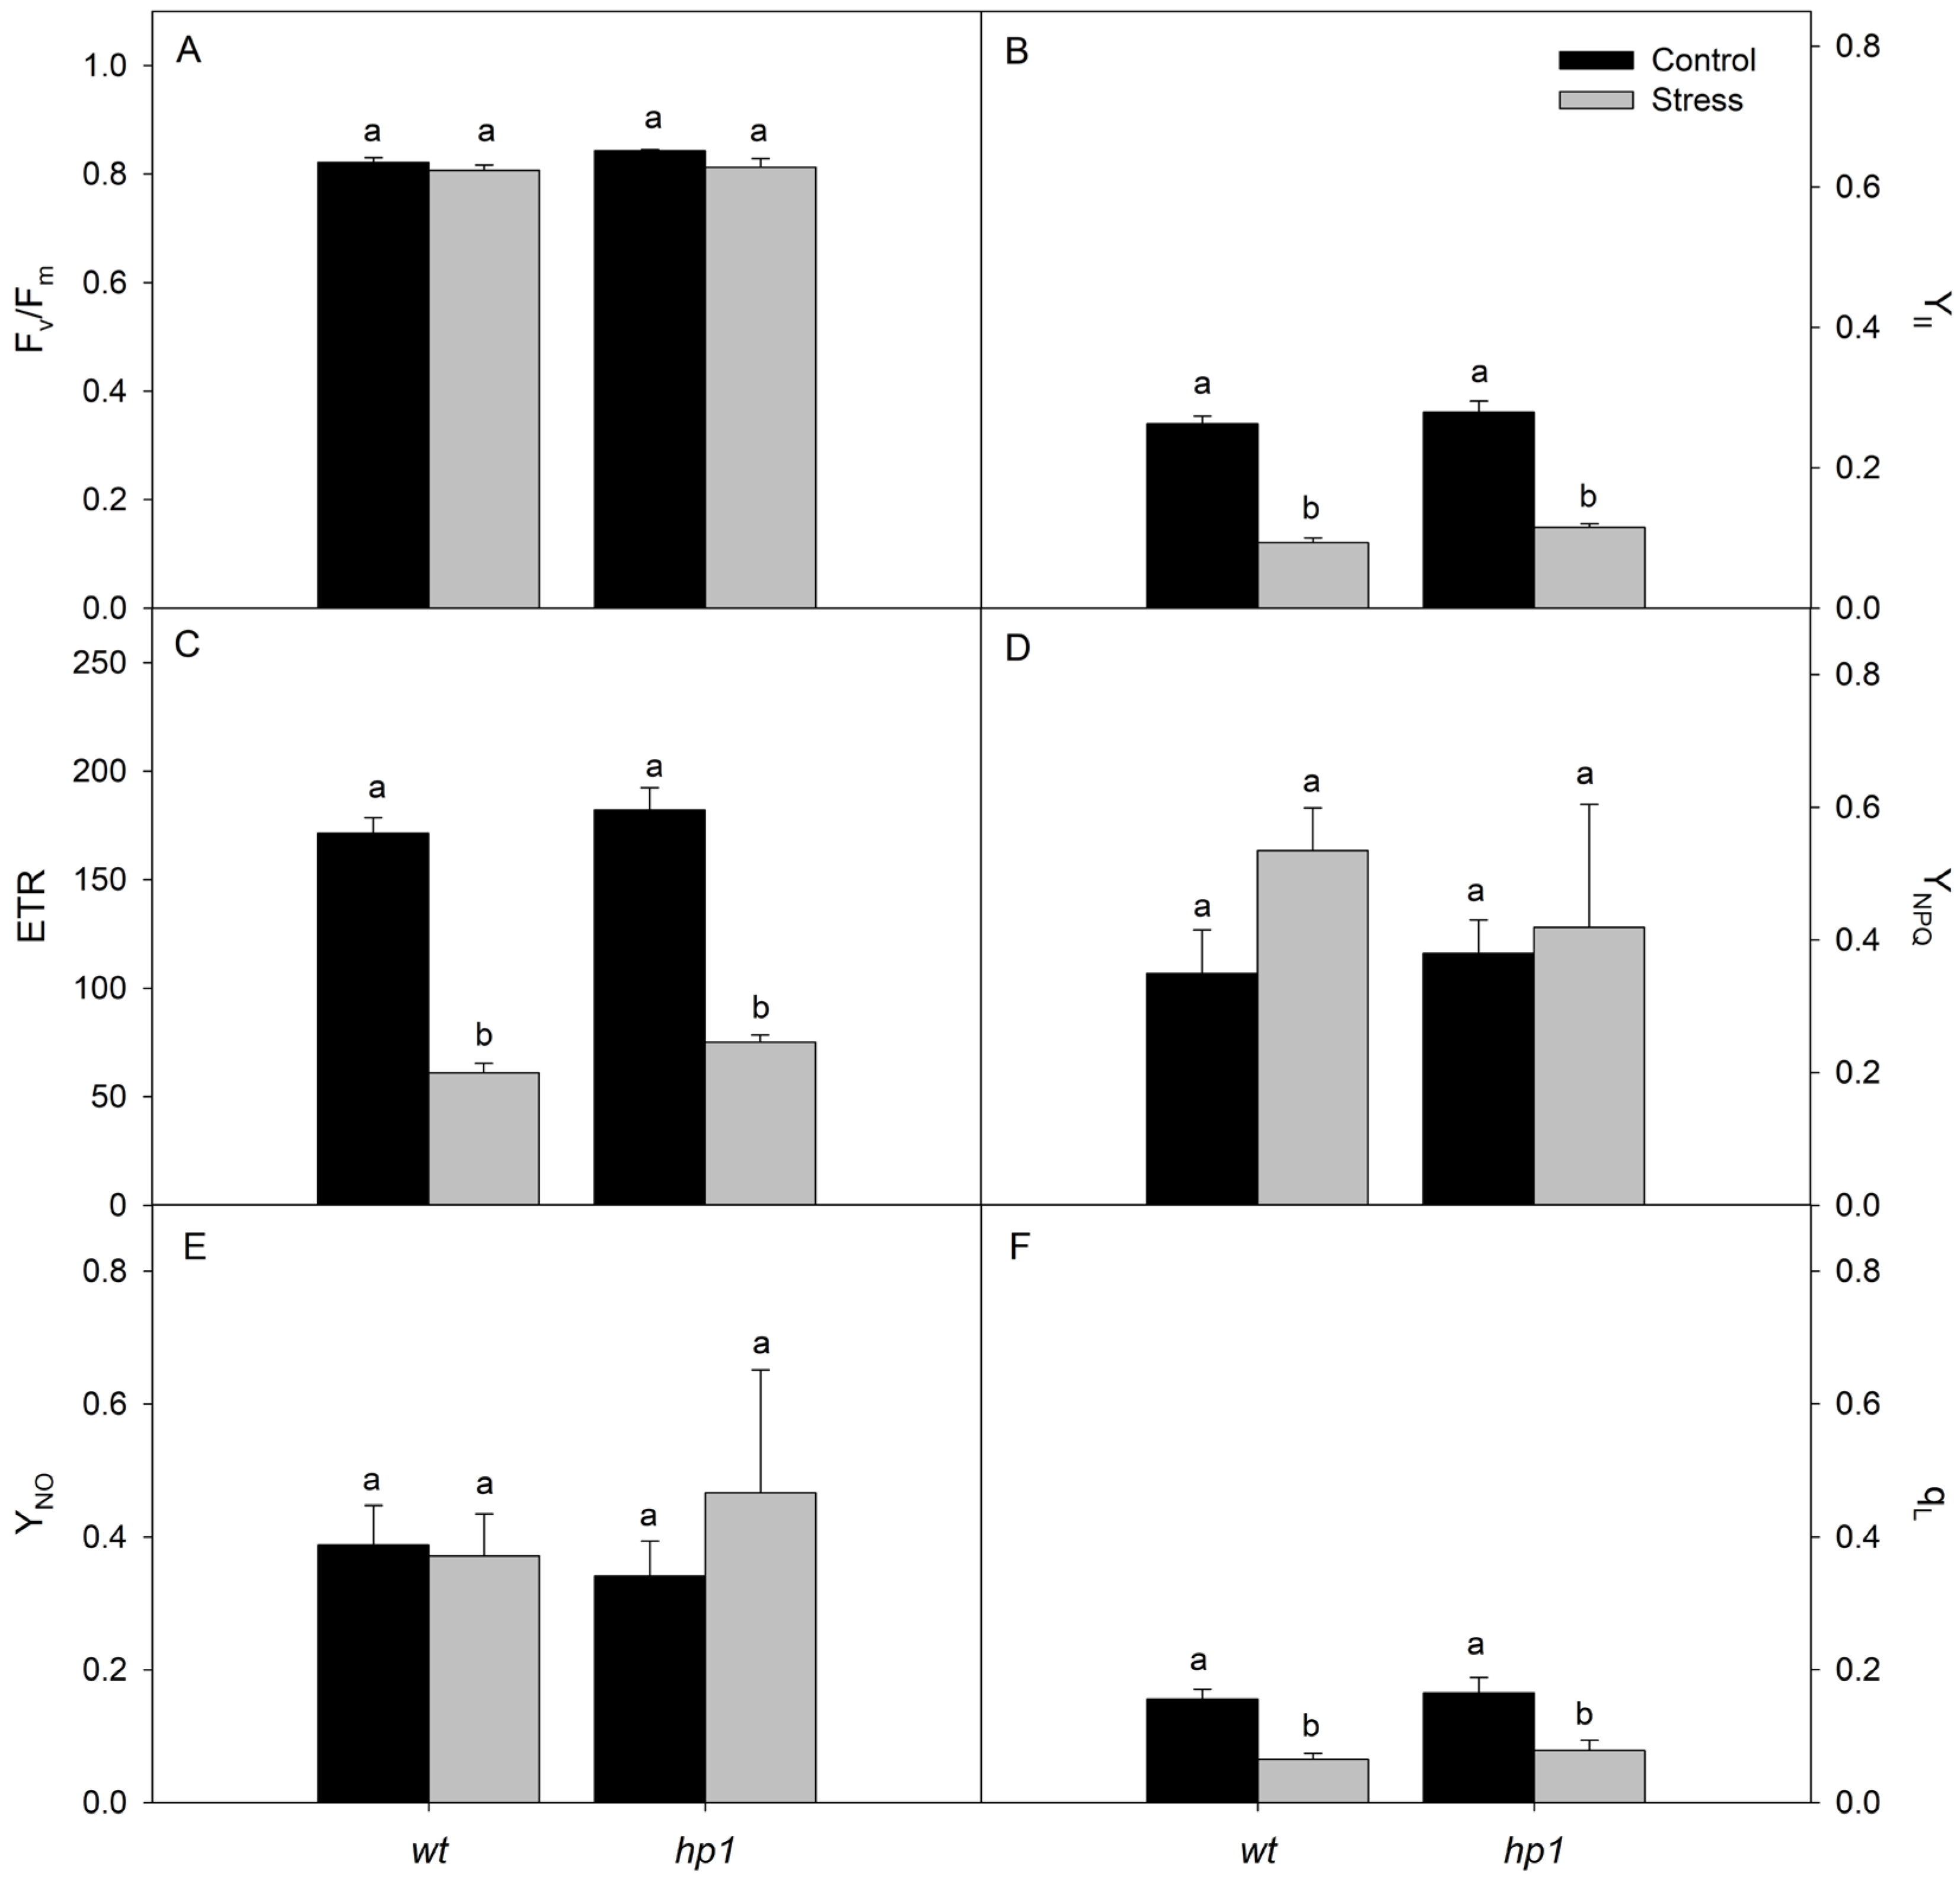
2.2.2. Gas Exchange and Chlorophyll Fluorescence

Net photosynthetic rate (A, μmol CO2 m−2 s−1), stomatal conductance (gS, mol H2O m−2 s−1), transpiration (E, mmol H2O m−2 s−1), and the ratio between internal and external CO2 concentration (Ci/Ca) were measured on a fully developed leaf with an infrared gas analyzer (IRGA, LI-6800, Licor, Lincoln, NE, USA), between 8 and 11 am. Conditions were kept constant: PPFD at 1000 μmol m−2 s−1, atmospheric CO2 (Ca) at 400 ± 7 μmol mol−1, temperature at 25.5 ± 0.5 °C, and relative humidity at 65 ± 2%. Water use efficiency (WUE) was calculated as A/gS.
Chlorophyll fluorescence was recorded on the same leaf area with an fluorometer attached to the IRGA. Leaves were dark-adapted with the reaction centers fully open and minimal heat loss (oxidized primary acceptors) to determine the initial (F0) and maximum fluorescence (Fm) [26]. From these values, the potential quantum yield of photosystem II (PSII), denoted as Fv/Fm, was calculated according to Genty et al. [26], using Equation (2):
Fv/Fm = (Fm − F0)/Fm
Subsequently, slow-phase fluorescence parameters were obtained following exposure to actinic light and a saturating pulse, including the steady-state fluorescence (F) and the maximum fluorescence in a light-adapted sample (Fm′), which were used to calculate the effective quantum yield of PSII (YII) and the non-photochemical quenching coefficient (YNPQ), as described by Bilger et al. [27]:
YII = (Fm′ − F)/Fm
YNPQ = (Fm − Fm′)/Fm
Additionally, YII was also used to estimate the apparent electron transport rate (ETR), as described by Bilger et al. [27], using Equation (5):
ETR = YII × PAR × LeafABS × 0.5′
where PAR is the photon flux density incident on the leaf (μmol m−2 s−1), LeafABS represents the fraction of absorbed light, and 0.5 assumes equal energy distribution between PSII and PSI [28].

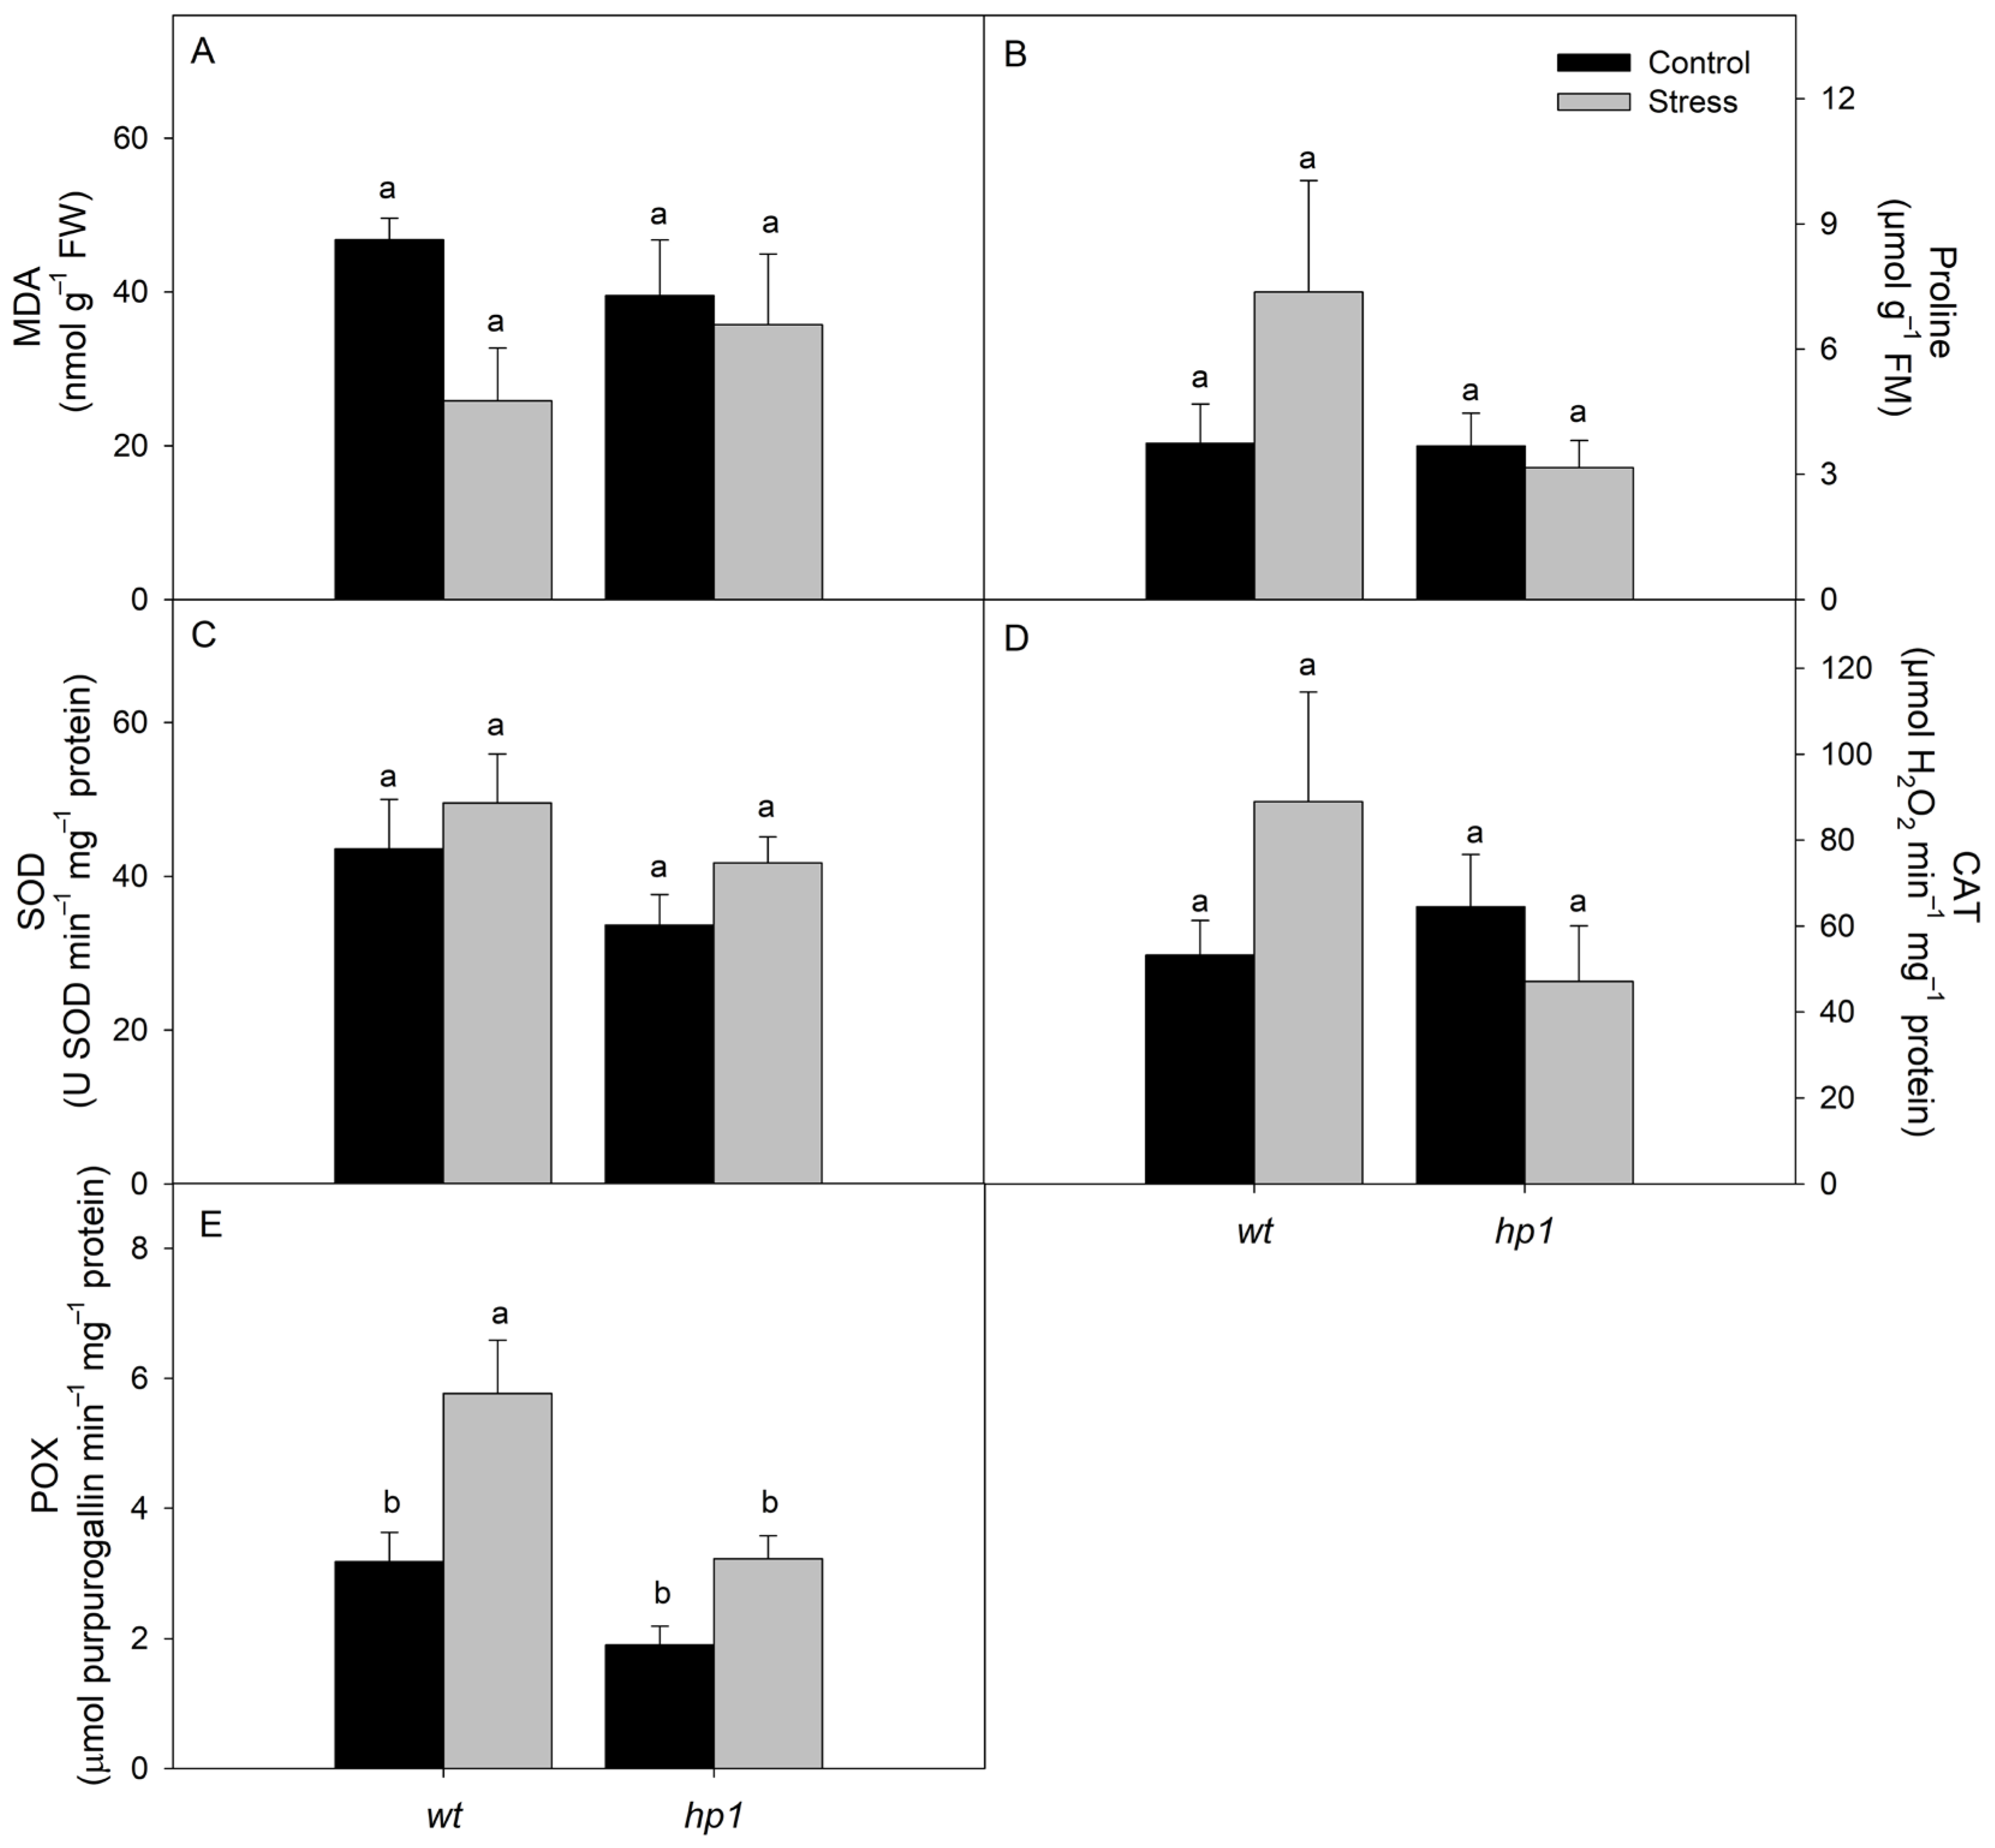
2.2.3. Malondialdehyde (MDA) Concentration

Lipid peroxidation was quantified by measuring MDA content, following Heath & Packer [29]. Fresh leaves (~160 mg) were homogenized in 2 mL-0.1% trichloroacetic acid (TCA) and centrifuged (12,000× g, 15 min, 4 °C), and 500 μL of the supernatant was reacted with 1.5 mL-0.5% thiobarbituric acid (TBA) in 20% TCA solution at 90 °C for 20 min. After cooling in an ice bath (1 min) and further centrifugation (3000× g, 4 min), absorbance at 532 and 600 nm was measured in a UV-VIS spectrophotometer (model Evolution 60S, Thermo Fisher Scientific, Madison, WI, USA). MDA was calculated according to Equation (6) and expressed in nmol g−1 FM.
MDA (nmol mL−1) = [(A532 − A600)/155,000] × 106
where A532 and A600 are the absorbance values measured at 532 and 600 nm, respectively; 155000 refers to the molar extinction coefficient (155 mM−1 cm−1) [29].

2.2.4. Proline Concentration

Proline was determined using a modified method from Bates et al. [30]. Leaf tissue (~30 mg) was homogenized in 6 mL-3% (w/v) sulfosalicylic acid and centrifuged (7500 rpm, 10 min, 4 °C), and 2 mL of the supernatant was reacted with 2 mL ninhydrin acid solution and 2 mL glacial acetic acid. After incubation (100 °C, 1 h) and cooling (ice bath), 4 mL toluene was added, and absorbance was read at 520 nm. Proline content was calculated based on a standard curve (0 to 100 μg mL−1) and expressed in µmol g−1 FM.

2.2.5. Antioxidant Enzyme Activity

The activity of the enzyme’s superoxide dismutase (SOD), catalase (CAT), and peroxidase (POX) was assessed. Fresh leaves (~200 m) were homogenized in 1 mL extraction buffer (0.1 M potassium phosphate, pH 6.8; 0.1 mM EDTA; 1 mM phenylmethylsulfonic acid fluoride (PMSF) and 1% PVPP_ and centrifuged (12,000 rpm, 15 min, 4 °C). Protein content was measured according to the Bradford method [31]. SOD activity in the enzymatic extract was quantified in a reaction medium (50 mM potassium phosphate, pH 7.8; 0.1 mM EDTA; 75 mM p-nitroblue tetrazolium (NBT); 13 mM methionine, pH 7.8; 2 μM riboflavin) [32], after exposing the samples in a closed chamber with fluorescent light (15 watts, 10 min) and quantifying the photochemical production of formazan blue at 560 nm. For the blank samples, the tubes were kept in the dark. SOD activity was quantified by inhibition of 50% NBT photoreduction [33] and expressed as U SOD mg−1 protein. CAT activity was assessed by adding the enzyme extract to the reaction medium (50 mM potassium phosphate, pH 7.0; 12.5 mM H2O2) and determining, during the first minute, the H2O decomposition at 240 nm (25 °C) [34]. CAT activity was determined using an extinction coefficient of 36 M−1 cm−1 [35] and reported in μmol H2O2 min−1 mg−1 protein. POX activity was assessed reacting 0.10 mL of the enzymatic extract to 4.9 mL solution (25 mM potassium phosphate, pH 6.8; 20 mM pyrogallol, 20 mM H2O2) to measure the production of purpurogallin formation at 420 nm (25 °C) during the first minute of the reaction [36]. POX activity was determined using the molar extinction coefficient of 2.47 mM−1 cm−1 [37] and reported in μmol min−1 mg−1 protein.

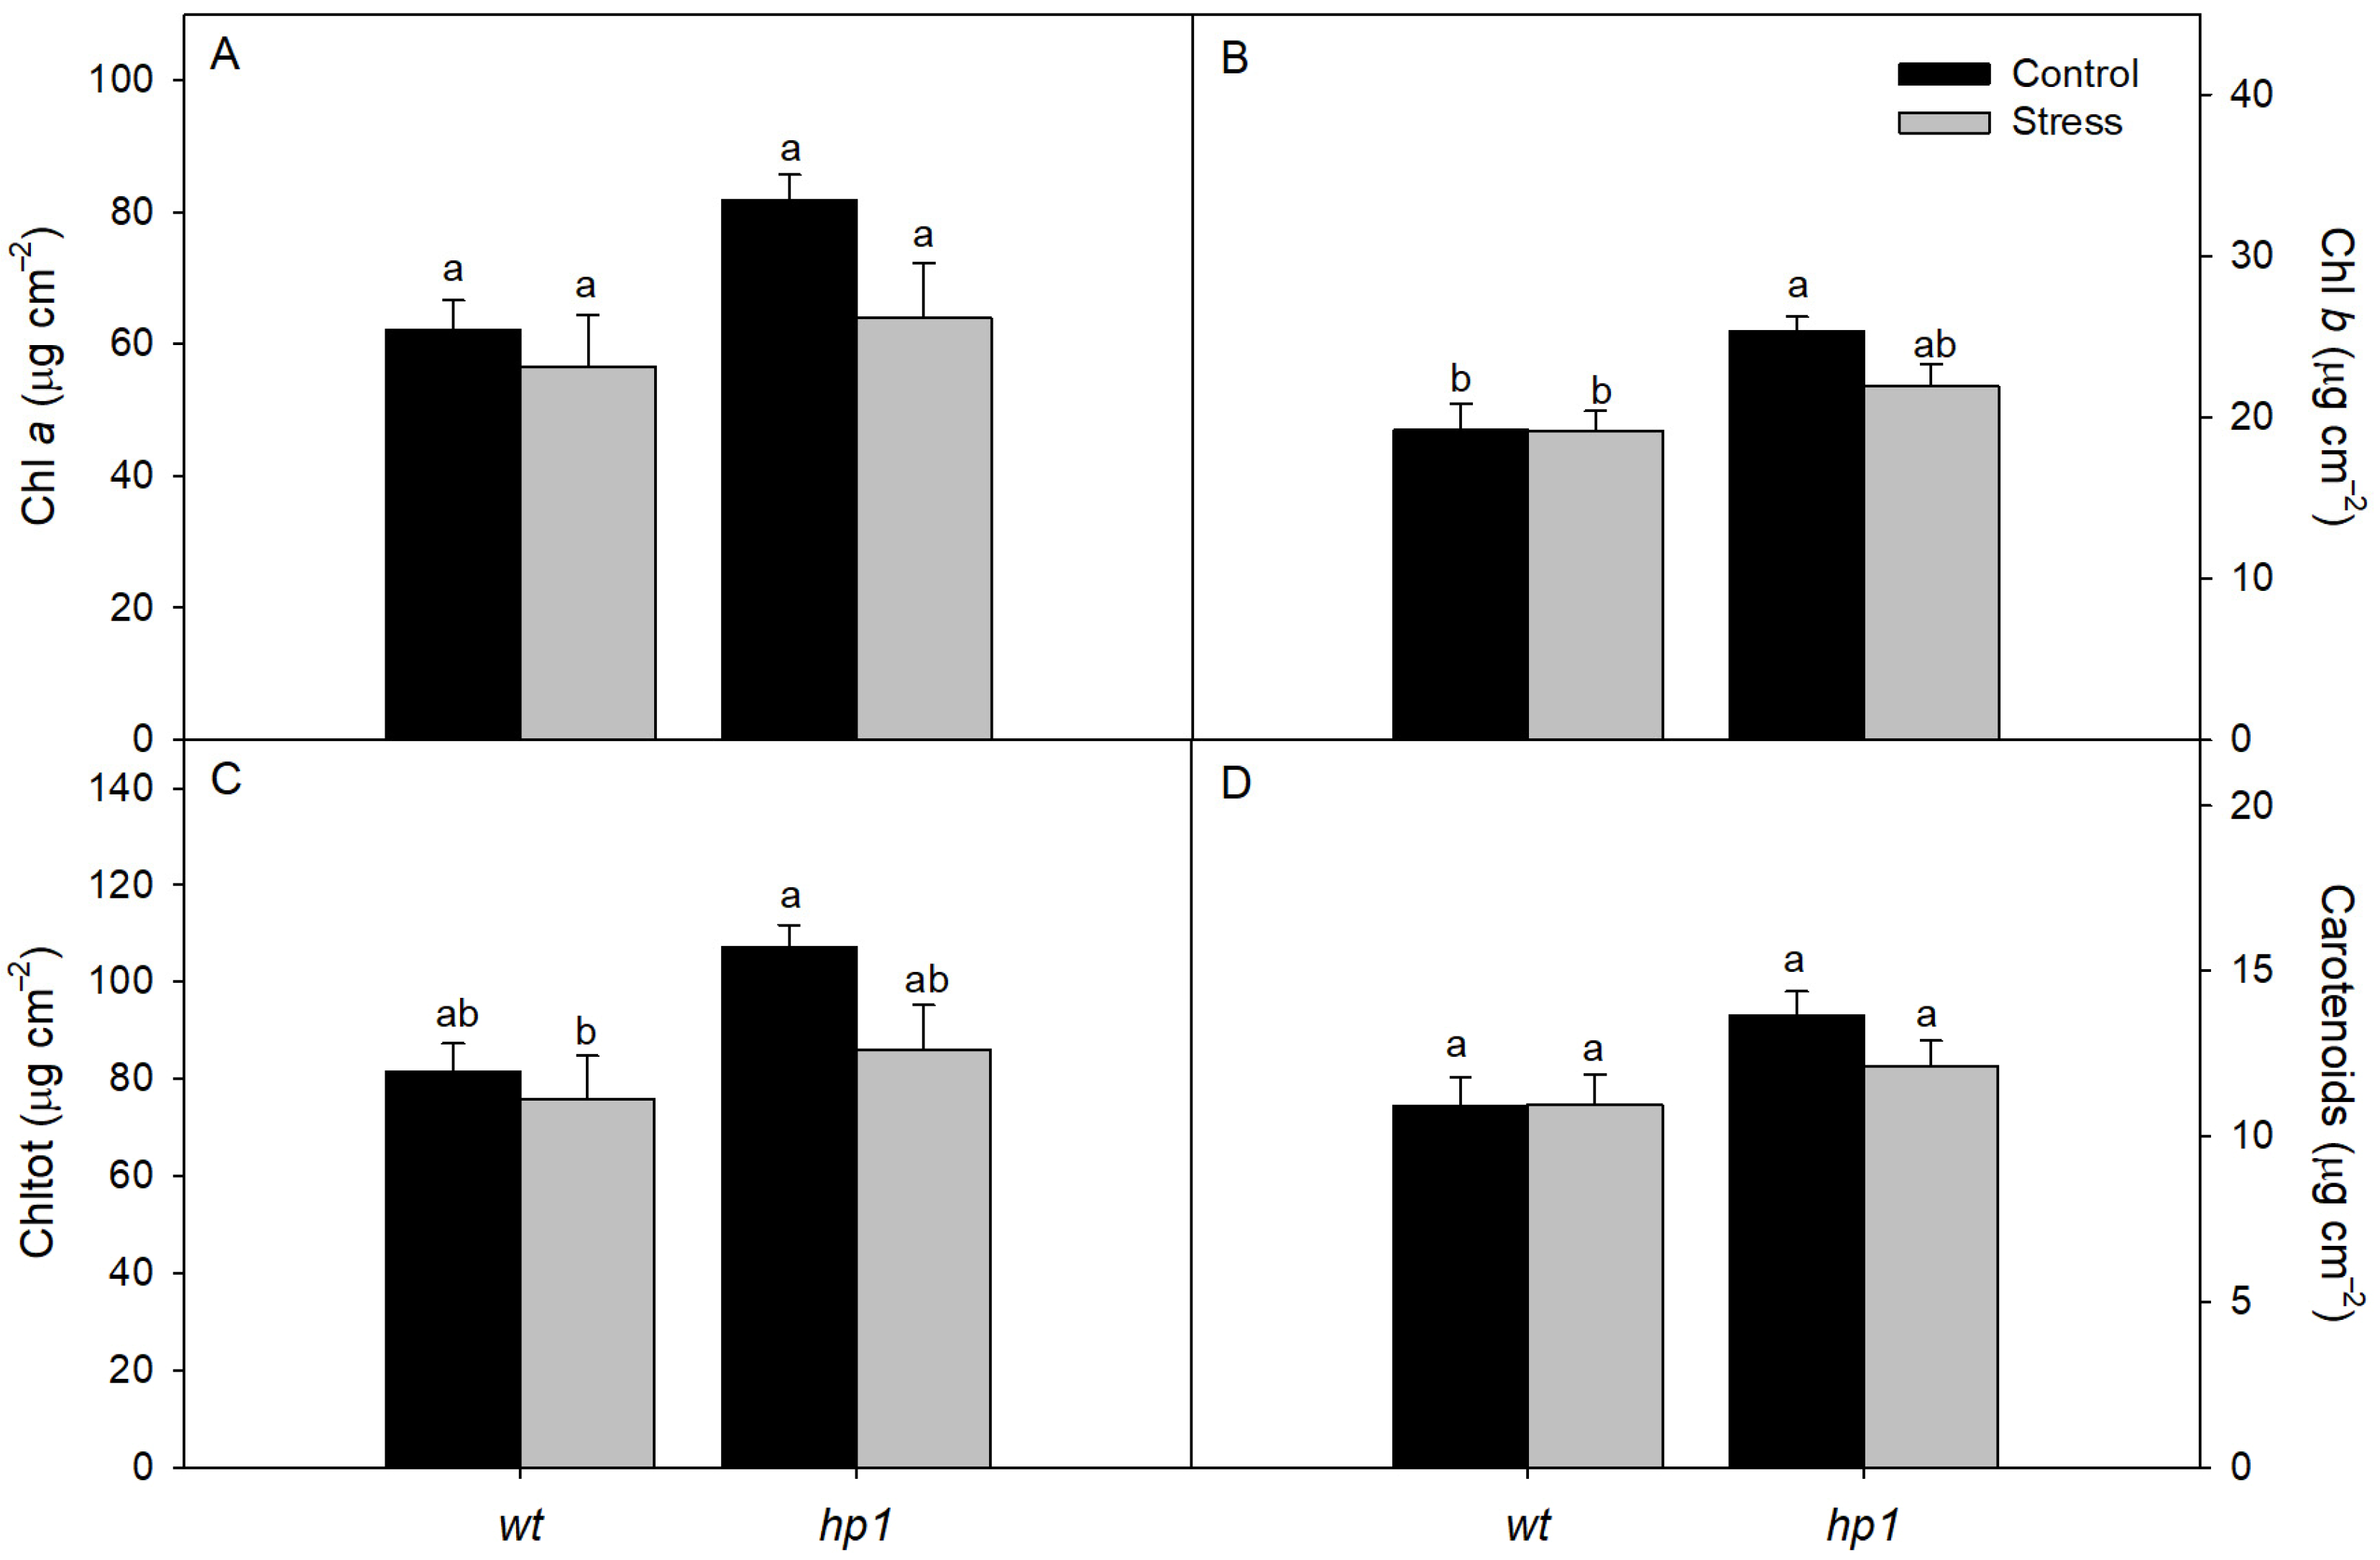
2.2.6. Leaf Pigment Concentration

Three leaf disks (0.5 cm diameter) were incubated in 5 mL DMSO saturated with CaCO3 at 60 °C, for 6 h. Chlorophyll a, chlorophyll b, and carotenoids were quantified spectrophotometrically at 665, 649, and 480 nm, calculated according to Wellburn [38], and results were expressed in μg cm2.

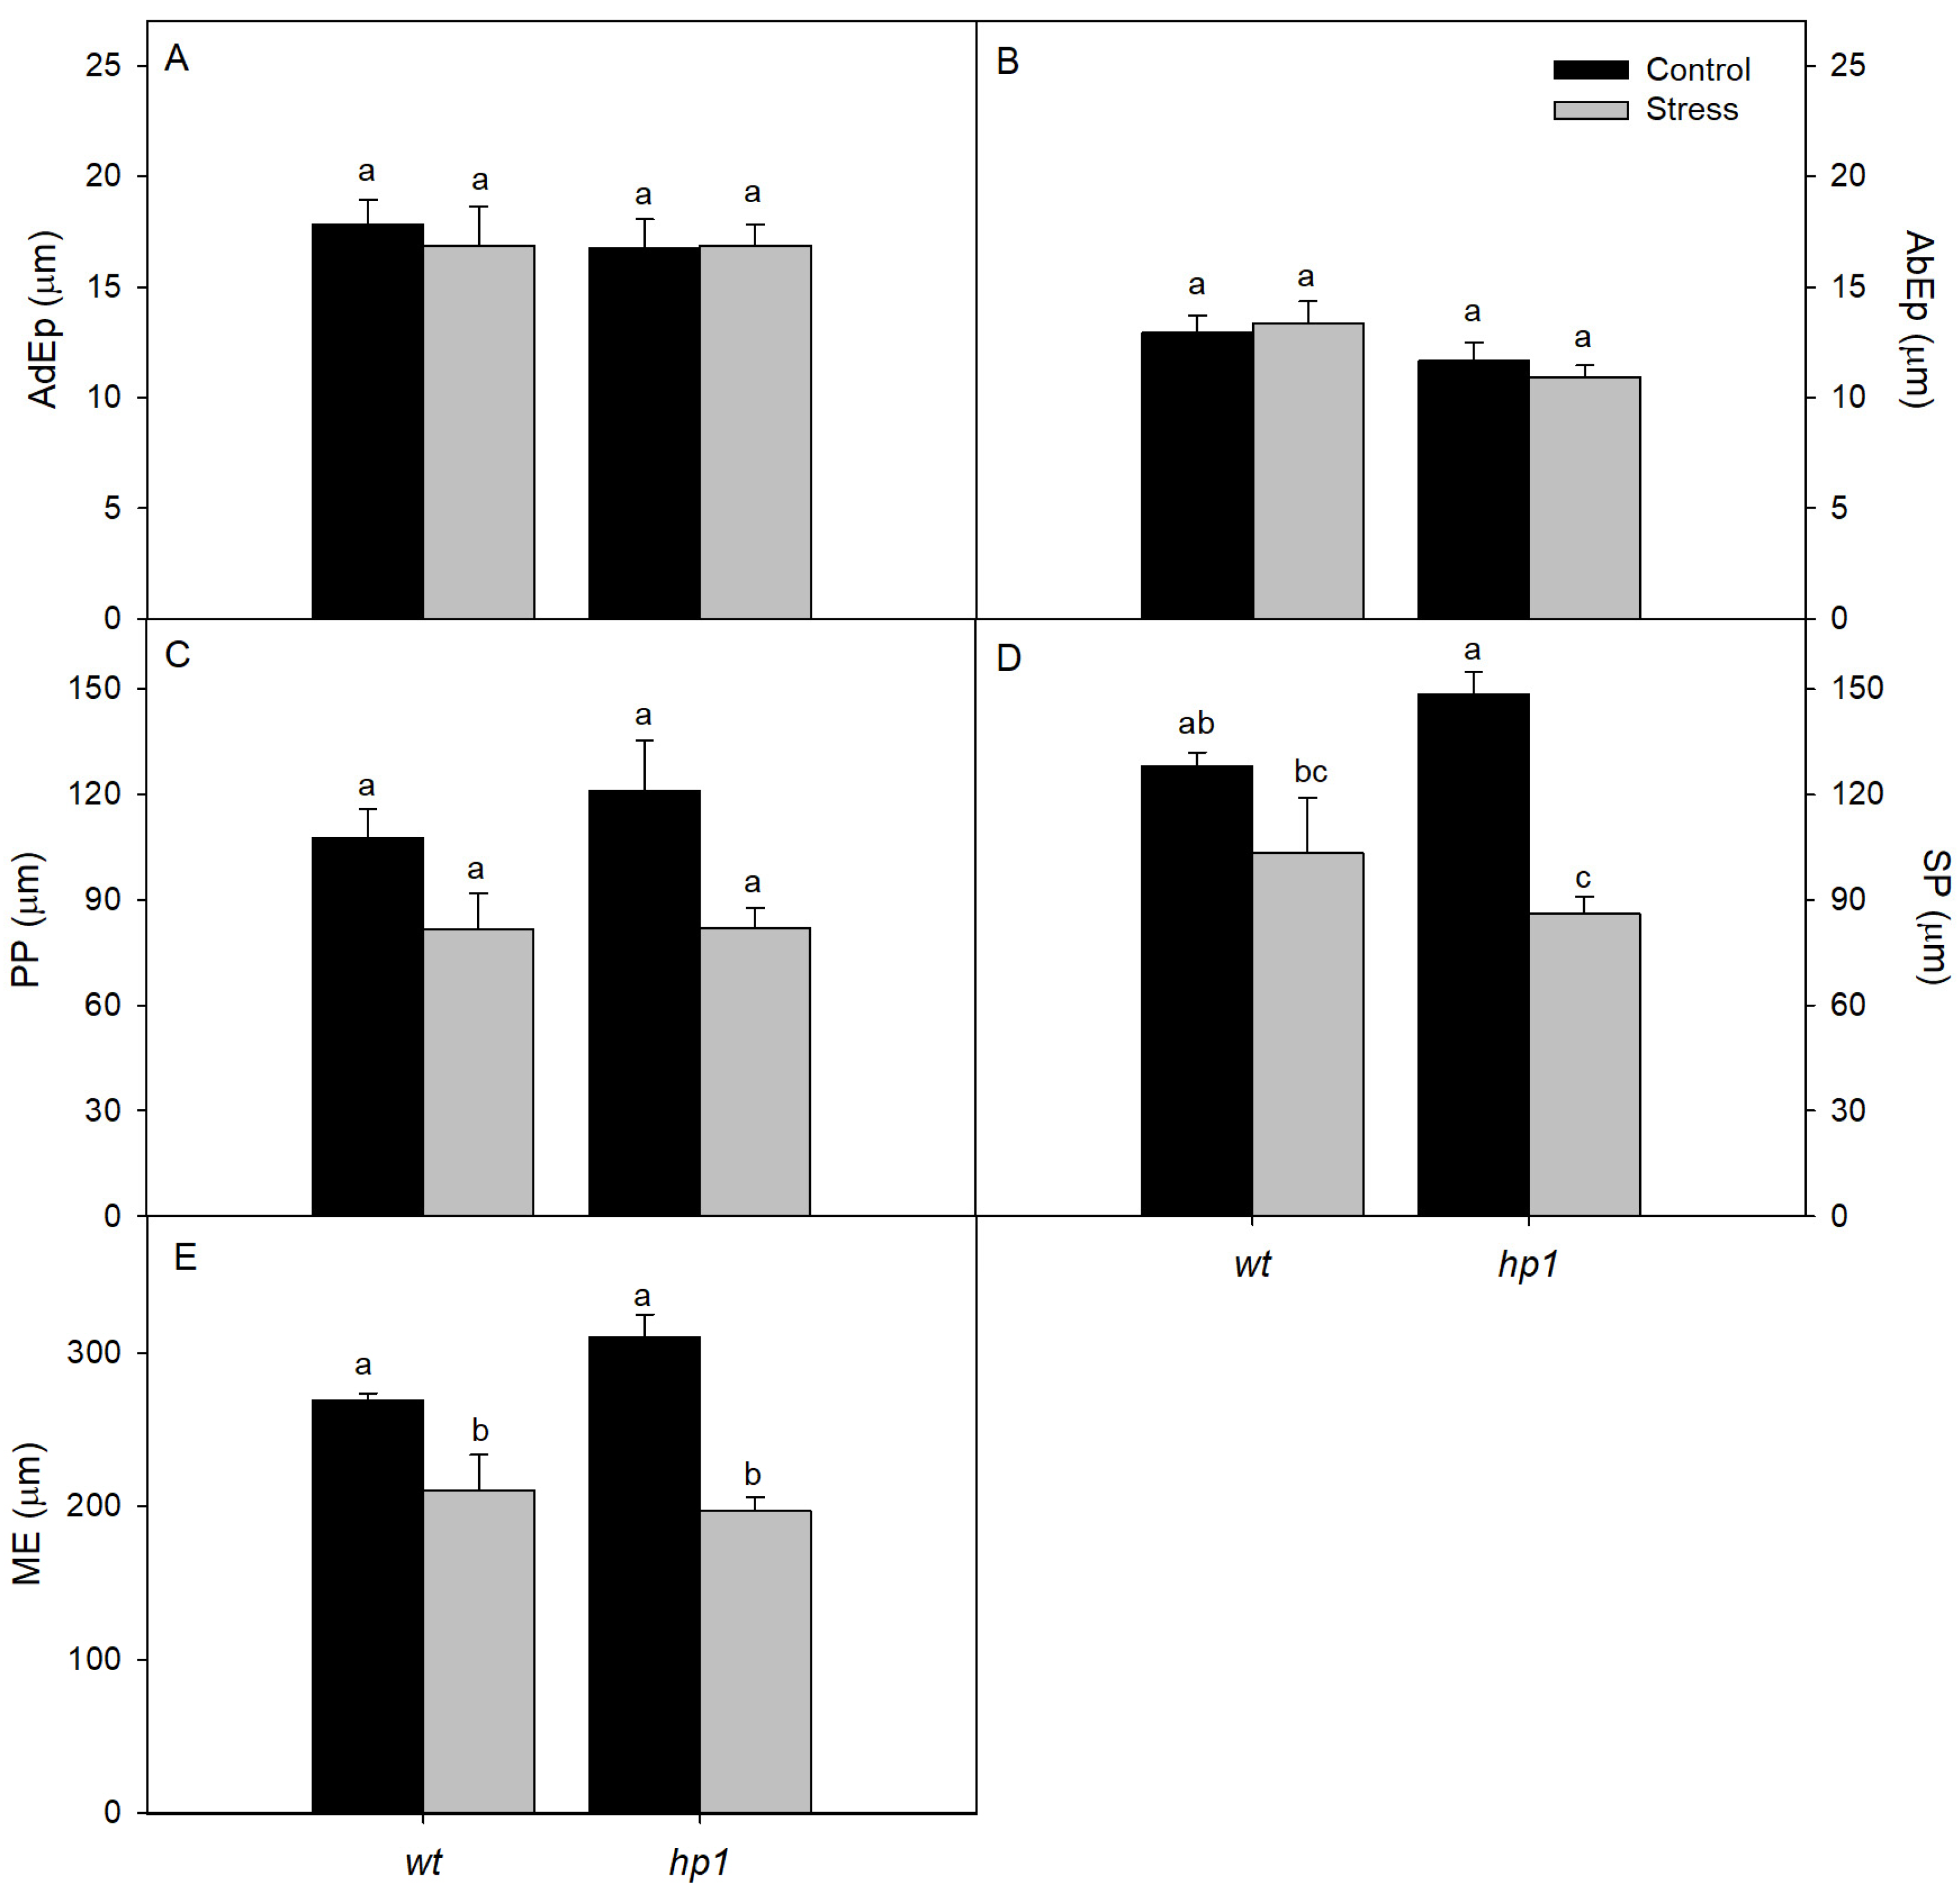
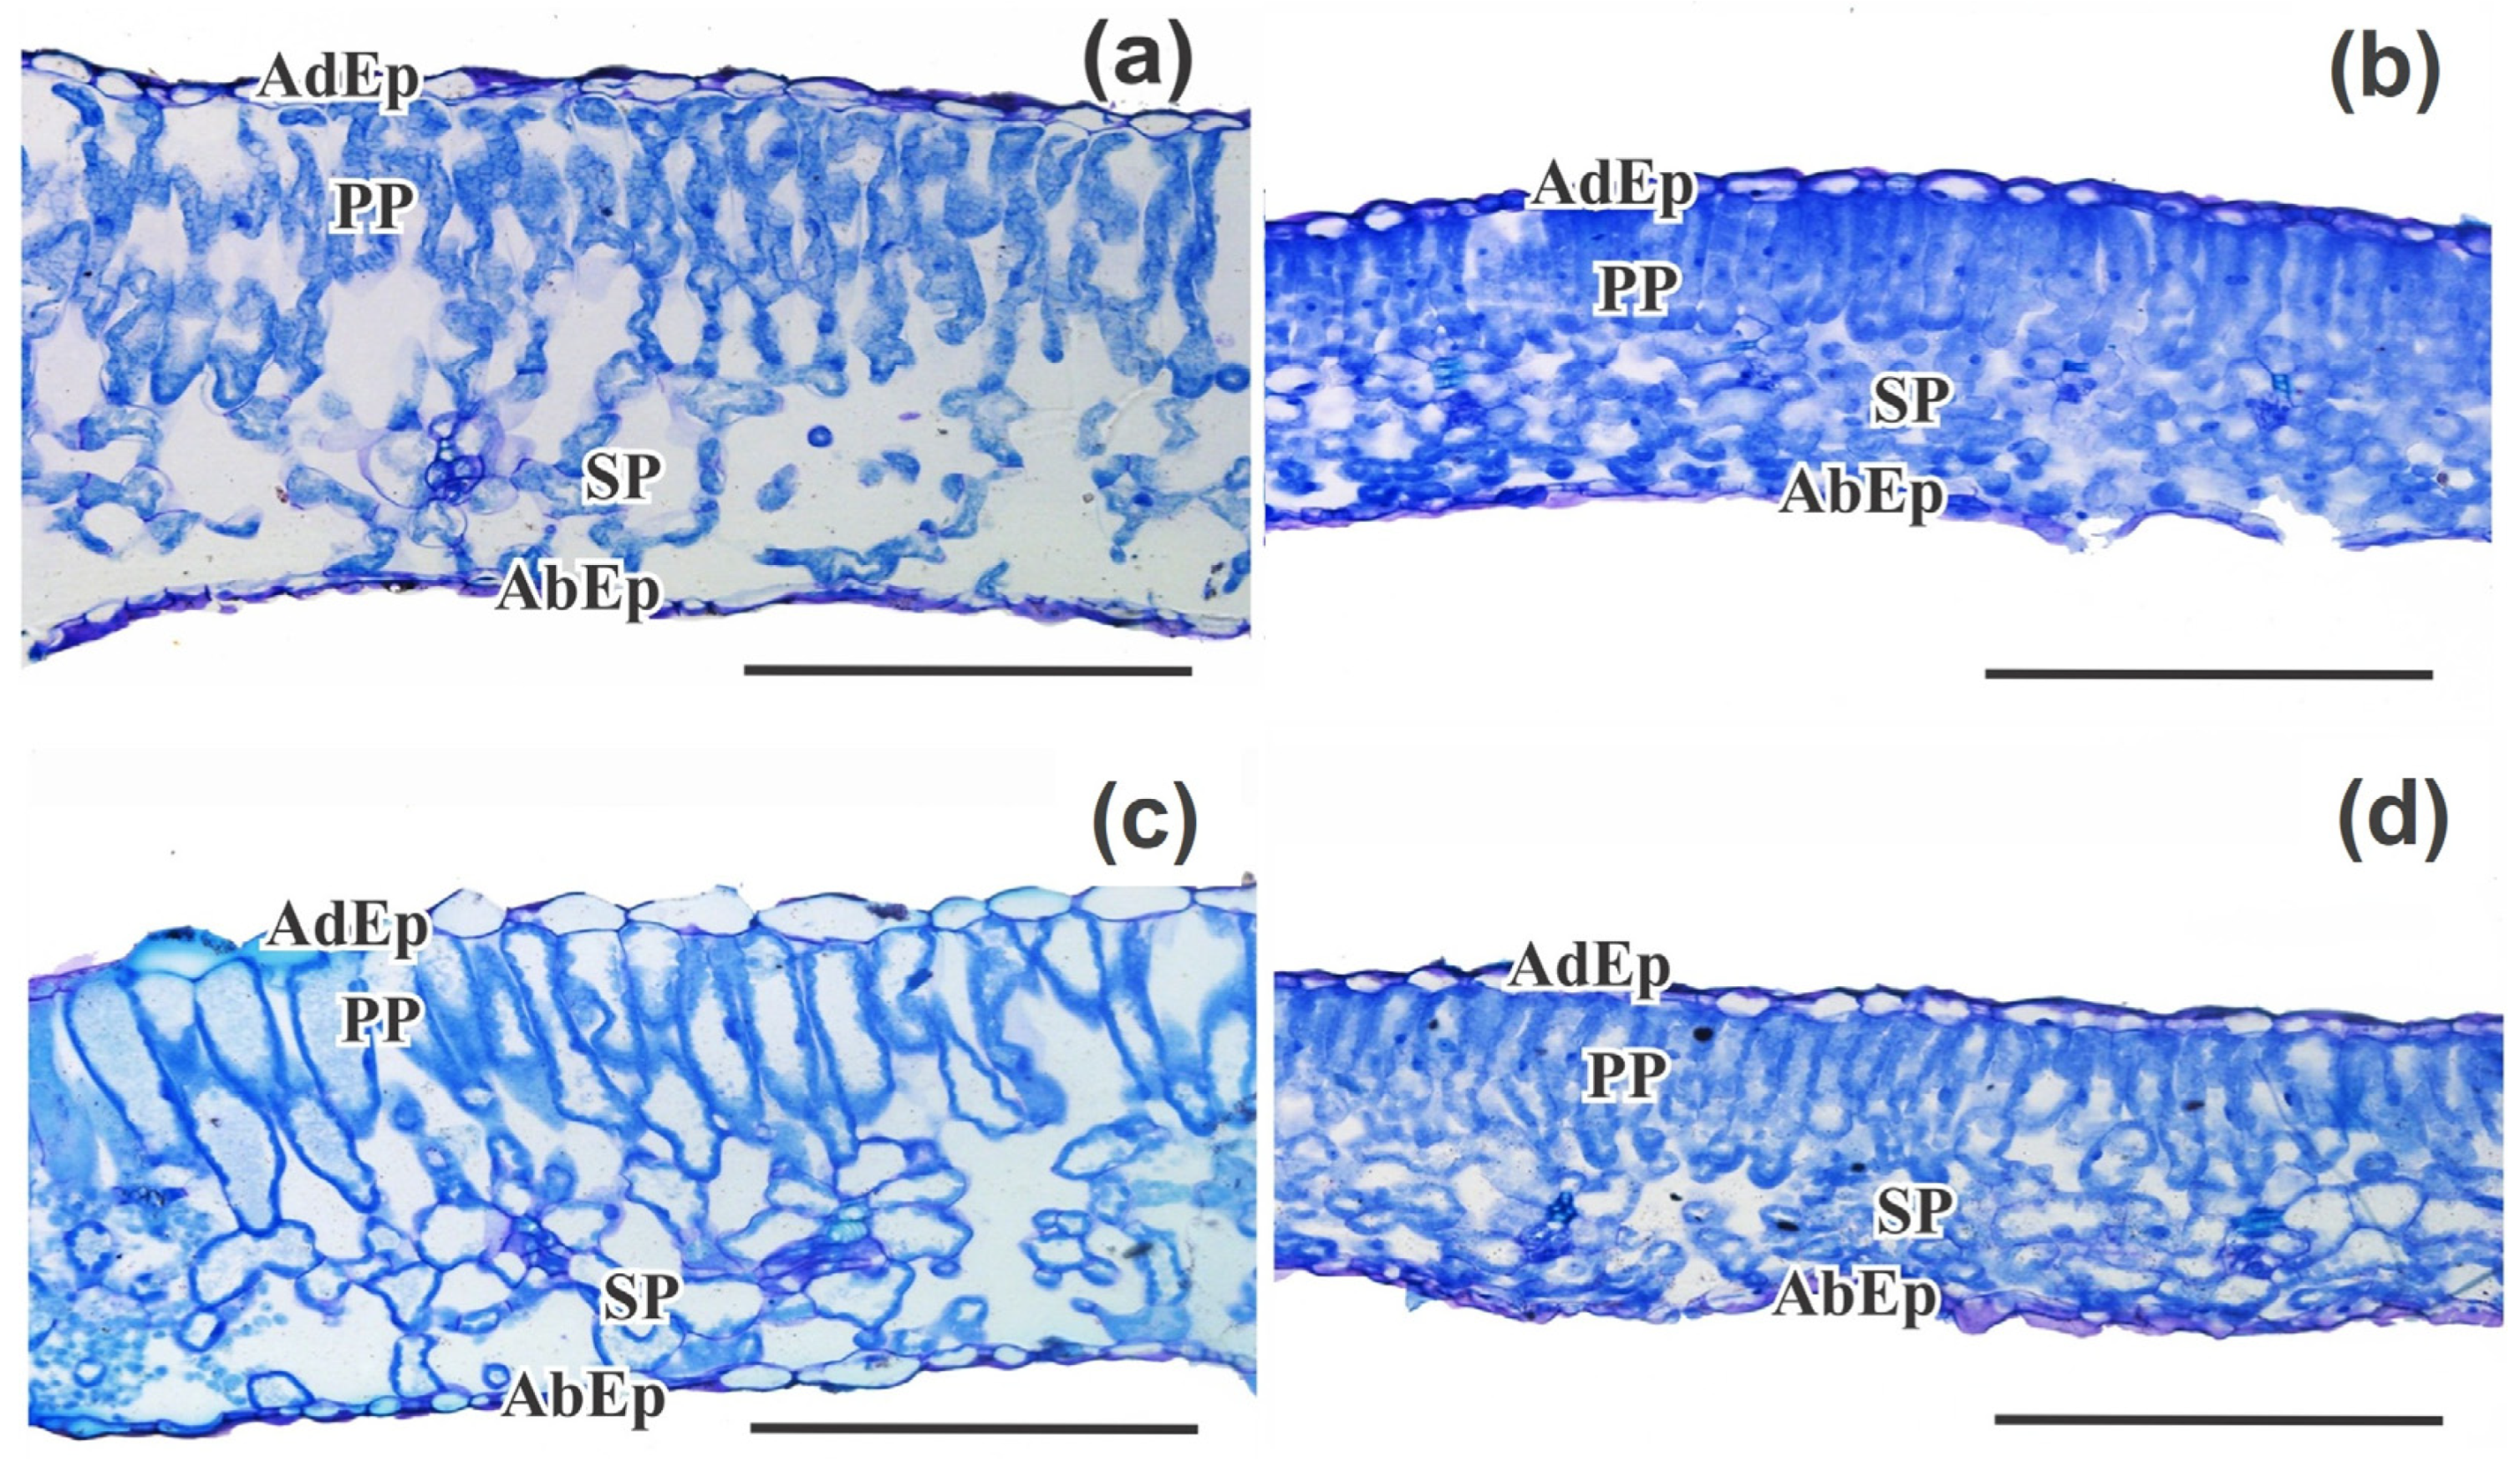
2.2.7. Leaf Micromorphometry

Leaf samples from the median region of fully developed leaves were collected and immediately fixed in Karnovsky’s solution [39]. The samples were first rinsed with phosphate buffer, then dehydrated through a series of ethanol solution, followed by pre-infiltration with historesin (Leica Instruments, Heildelberg, Germany). Transverse sections (5 μm thick) were cut out using a rotary microtome (model 1508R, Logen Scientific, Jinhua, Zhejiang, China) and stained with 0.05% toluidine blue in 0.1 M phosphate buffer at pH 6.8 [40]. Structures analyzed included the adaxial epidermis (EpAd), abaxial epidermis (EpAb), palisade parenchyma (PP), spongy parenchyma (SP), and mesophyll (ME). Images were captured with an Olympus BX61 microscope (Tokyo, Japan) equipped with a DP 72 camera (brightfield mode) and processing using Image J software v. 1.8.0_172 (National Institutes of Health, Bethesda, MD, USA).

2.3. Statistical Analysis

Data were analyzed using analysis of variance (ANOVA) after confirming normality (Shapiro–Wilk test) and homogeneity of variance (Barlett test). Means were compared using Tukey’s test (p ≤ 0.05) in SISVAR 5.4 software [41]. Multivariate analysis of variance (MANOVA) was used for dendrogram clustering and heatmap analysis, based on Mahalanobis distance and UPGMA, optimized via Tocher’s method [42]. Principal component analysis (PCA) was performed using R Core Team software v. R 3.6.0 [43] to identify key traits contributing to stress response variation.

3. Results

Leaf water potential and osmotic potential were both significantly reduced when plants were exposed to the combined stress of water deficit (WD) and high irradiance (HI) (Figure 1). Similarly, key gas exchange parameters—including A, E, gS, and Ci/Ca—also declined notably under these combined stress conditions (Figure 2A–D). In contrast, WUE increased significantly in stressed plants (Figure 2E).
The analysis of chlorophyll fluorescence showed that the Fv/Fm, along with the YNPQ and YNO, was not significantly affected by the treatments (Figure 3). However, both the YII and the ETR were significantly affected by the treatments, with lower values recorded under combined stress conditions (Figure 3A,B).
Biochemical analyses revealed that MDA and proline levels, as well as the activities of SOD and CAT, were not significantly influenced by the treatments (Figure 4). The POX activity, however, differed significantly between genotypes and treatments: The hp1 mutant exhibited lower POX activity than the wild-type (wt), while plants subjected to combined stress showed higher POX activity compared to those under control conditions (Figure 4B).
The hp1 mutant accumulated greater amounts of photosynthetic pigments—including chlorophyll a, chlorophyll b, total chlorophyll, and carotenoids—than the wt genotype (Figure 5).
Anatomical analysis showed no significant differences in the thicknesses of the adaxial (AdEp) and abaxial epidermis (AbEp) between treatments (Figure 6 and Figure 7). However, the palisade parenchyma (PP), spongy parenchyma (SP), and mesophyll (ME) were all significantly thinner in both genotypes under combined conditions (Figure 6 and Figure 7).
Under control conditions, hp1 exhibited greater PP thickness than the wt genotype. This difference was not maintained under combined stress, where both genotypes exhibited comparable values. A similar trend was observed for SP and ME thickness: Under control conditions, hp1 showed higher values than wt, but under combined stress, the reverse was observed (Figure 6 and Figure 7).
Cluster analysis grouped the four treatments into two distinct clusters. Group A included wt and hp1 genotypes under combined stress (40% FC + 1800 µmol m−2 s−1 PFFD), while group B included both genotypes under control conditions (FC + 450 µmol m−2 s−1 PFFD) (Figure 8). In group A, several traits tended to increase with stress, especially in the wt genotype, as reflected in defense mechanisms such as antioxidant enzyme activity (SOD, CAT, and POX), and proline accumulation. Notable responses in the hp1 mutant included higher levels of photosynthetic pigments and higher YNO, although these differences were not sufficient to segregate the genotypes into distinct groups under combined stress (Figure 8). In group B, similar responses were observed between genotypes for gas exchange and chlorophyll fluorescence traits, with hp1 showing much higher levels of photosynthetic pigments and thicker leaf tissue compared to wt (Figure 8).
Principal component analysis (PCA) indicated that the first two principal components (PC1 and PC2) explained 59.8% of the variation (Figure 9). The scores observed for wt plants under combined stress were 0.9228 [A] + 0.9075 [gS] + 0.9144 [E]. The largest effect in hp1 under stress was 0.8803 [ME] (PC1). PC2 was mainly affected by 0.48319 [POX] and −0.2923 [Ψw] in the hp1 mutants under stress.

4. Discussion

The combination of water deficit and high irradiance is known to trigger a suite of physiological and structural changes in plants aimed at maintaining homeostasis and minimizing damage. In this study, reductions in gas exchange variables (A, gS, E, and Ci/Ca) under stress conditions in both genotypes wt and mutant hp1 Micro-Tom plants reflect classical drought-induced limitations on CO2 assimilation, as widely reported in the literature [44,45]. These responses serve to reduce transpirational water loss but inevitably limit carbon gain, creating a trade-off between survival and growth. Although Ψs values decreased in plants under combined stress (reaching about –1.6 MPa), cluster analysis showed that wt plants were able to induce osmotic adjustment and defense mechanisms. This ability is attributed to the increased proline accumulation and increased activity of antioxidant enzymes (SOD, CAT, and POX), typically observed in response to water deficit in different species [9,10,11] and under conditions where excess light energy cannot be effectively dissipated [46]. The activation of these defense mechanisms in the Micro-Tom plants likely contributed to the stabilization of Fv/Fm levels and the absence of significant fluctuations in MDA, indicative of oxidative stress. In contrast, hp1 primarily relied on non-enzymatic photoprotection, including higher carotenoid content and increased YNO, indicative of enhanced non-photochemical dissipation, including thermal energy dissipation.
Anatomical changes, including reduced mesophyll thickness and altered palisade parenchyma organization in the wt genotype, may represent adaptive modifications to improve water use efficiency and reduce internal evaporative surfaces [4,47]. However, under controlled environmental conditions and combined stress, hp1 invested in micromorphological and optical responses such as adjustments in cell volume, stabilization of palisade parenchyma thickness, increase in mesophyll thickness, and photosynthetic pigment content. This phenotypic response in hp1 includes greater periclinal expansion of PP and ME cells [48], as observed in the cluster analysis of mutants in the absence of stress in this study and previously reported by Pereira et al. [49].
It is known that the higher concentration of photosynthetic pigments in hp1 forms an optical filter that enhances the absorption and utilization of light energy for photosynthetic processes and may require a greater flux of CO2 to supply this pathway [19,47]. Consequently, Pereira et al. [49] observed higher PP, chlorophyll content, photosynthetic rates, and ETR in hp1 under high irradiance and natural light conditions than in wt. In our study, PCA analysis revealed that hp1 had a higher photosynthetic rate and MES thickness even in the absence of stress. These results suggest that hp1 exhibits greater plasticity in its photosynthetic apparatus in response to high irradiance, depending on the coordination of light-harvesting complexes for the photosystems, as reported by Kunderlikova et al. [50]. However, under combined stress, the enhanced ability of hp1 to absorb light energy does not result in improved photosynthetic performance (e.g., reduction in A and Ci/Ca). This could imply a metabolic cost for the plant if no additional compounds or energy (ATP) are produced [49]. This effect may be partly related to stomatal closure (gs), which directly limits CO2 availability for photosynthesis [51] and is the main response to drought.
Water deficit in combination with high irradiance can enhance the effects on stomatal opening and photosynthetic efficiency [4,52], as observed in this study. Consequently, increased carotenoid content and non-photochemical quenching (YNO) play a role in acclimation and may help to mitigate the deleterious effects of oxidative stress in hp1 [53]. These non-enzymatic defense mechanisms in hp1 are likely due to the redistribution of carotenoids in the epidermis, subepidermal layer, and mesophyll, as well as the increased activity of the ANS gene (anthocyanin biosynthesis) and the HY5 gene (carotenoid biosynthesis) [54].
The contrasting responses observed between the hp1 mutant and the wt under combined high irradiance and water deficit stress can also be partly explained by molecular mechanisms related to photomorphogenesis and stress signaling pathways. The hp1 carries a mutation in the DET1 (DE-ETIOLATED 1) gene, a negative regulator of photomorphogenesis. This mutation leads to the constitutive activation of light-responsive genes, including those involved in chloroplast development, carotenoid biosynthesis, and anthocyanin accumulation [54,55]. While this enhances light-harvesting capacity under normal or high light conditions, it may concurrently limit the flexibility of stress-responsive pathways, particularly those related to ABA-dependent stomatal regulation and ROS detoxification.
Furthermore, DET1 forms part of the CUL4-DDB1 E3 ubiquitin ligase complex, which regulates the degradation of key transcription factors involved in photoprotection, stress responses, and DNA repair [53,54]. The upregulation of the HY5 transcription factor in hp1 mutants promotes carotenoid and flavonoid biosynthesis, contributing to the reliance on non-enzymatic photoprotective mechanisms, as evidenced by the higher YNO and carotenoid content in hp1. However, under combined drought and high light stress, this photomorphogenic prioritization may impair the activation of more efficient osmotic adjustment and antioxidant enzymatic systems, as observed in the wt genotype. These findings suggest that the constitutive photomorphogenic state of hp1, while advantageous for light harvesting, imposes metabolic trade-offs that compromise resilience under multifactorial stress conditions.
The different defense strategies of wt and hp1 are of crucial importance. They are modulated to meet the metabolic needs of plants without accumulating toxic amounts of reactive oxygen species (ROS). The strategies employed by the hp1 genotype appear to require less metabolic energy for defense responses, such as the activation of non-enzymatic mechanisms to eliminate ROS. In contrast, the wt genotype employs a broader array of defense mechanisms to adapt to stress, which is typically observed in response to water deficit in various species. Responses to abiotic conditions such as light regulate numerous aspects of growth and development [56].
The findings of this study can be further contextualized in light of the comprehensive review by He et al. [57], which highlights the multilayered regulatory networks involved in drought resistance. While our results demonstrate distinct physiological and structural adaptations in wt and hp1 genotypes under combined drought and high irradiance stress, He et al. emphasize that such responses are orchestrated by a complex interplay of phytohormonal signaling, transcriptional regulation, post-translational modifications, and epigenetic mechanisms. The fact that hp1 primarily relies on photoprotective pigment accumulation and non-enzymatic ROS quenching, rather than classical antioxidant enzymatic defenses, may be associated with altered hormonal or transcriptional regulatory pathways not yet fully characterized. The authors also suggest that the limited success of drought-resistance gene introgression in breeding programs stems from an incomplete understanding of regulatory hierarchies and underscores the importance of integrative approaches combining physiological, molecular, and genomic data to guide the development of stress-resilient cultivars.
Understanding these mechanisms is crucial for breeding or engineering crops with enhanced tolerance to multifactorial stresses, which are increasingly common under current and future climate change scenarios [58]. The implications of these results extend to agricultural management and breeding strategies, where genotypes with robust antioxidant responses and effective osmotic regulation may be more suitable for cultivation in high-radiation, drought-prone environments. Conversely, genotypes with enhanced pigment accumulation but limited stress plasticity may require targeted genetic improvement to optimize resilience without compromising photoprotection.

5. Conclusions

Although the hp1 mutant exhibits greater light capture capacity and improved photosynthetic adaptation under high irradiance, it did not show a significant advantage in terms of photosynthetic performance when subjected to combined water deficit and high irradiance stress. This outcome reflects the trade-offs associated with its constitutive photomorphogenic state, driven by the mutation in the DET1 gene. While this mutation promotes the accumulation of photosynthetic pigments and enhances light-harvesting efficiency, it also appears to limit the activation of key stress-responsive pathways, particularly those involved in enzymatic antioxidant defense and osmotic adjustment.
In contrast, the wild-type (wt) genotype activated a wider range of stress defense mechanisms, including osmotic adjustment and increased activity of antioxidant enzymes (SOD, CAT, and POX), providing greater resilience under combined stress. The hp1 mutant relied more heavily on non-enzymatic photoprotective mechanisms, such as carotenoid accumulation and energy dissipation through non-photochemical quenching (YNO), which were insufficient to fully mitigate the adverse effects of combined stress. These findings highlight the complexity of the trade-offs between photomorphogenic advantages and stress tolerance in plants, suggesting a high metabolic cost under these conditions. Thus, the differences between genotypes indicate that more robust defense strategies, such as those in the wt, are crucial for survival under extreme conditions.

Supplementary Materials

The following supporting information can be downloaded at: https://www.mdpi.com/article/10.3390/agriculture15141518/s1, Figure S1. Micro-Tom wt and hp1 genotypes exposed to two contrasting environmental treatments (control and combined stress of water deficit and high irradiance) in a controlled growth chamber for 7 days.

Author Contributions

Conceptualization, A.B.C., A.C.d.C. and A.A.d.S.; methodology, A.B.C., E.C.D.S. and P.F.B.; validation and formal analysis, A.B.C., F.B.d.S. and L.M.d.F.M.; writing—original draft preparation, A.B.C. and F.B.d.S.; writing—review and editing, A.A.d.S., C.M. and L.M.d.F.M.; supervision, A.C.d.C. and A.A.d.S.; funding acquisition, A.C.d.C. All authors have read and agreed to the published version of the manuscript.

Funding

This research was funded by Instituto Federal de Educação, Ciência e Tecnologia Goiano (IFGoiano), Centro de Excelência em Agricultura Exponencial (CEAGRE), Centro de Excelência em Bioinsumos (CEBIO), Fundação de Amparo à Pesquisa do Estado de Goiás (FAPEG), Financiadora de Estudos e Projetos (FINEP), Coordenação de Aperfeiçoamento de Pessoal de Nível Superior (CAPES), and Conselho Nacional de Desenvolvimento Científico e Tecnológico (CNPq). The APC was funded by Instituto Federal de Educação, Ciência e Tecnologia Goiano (IFGoiano).

Institutional Review Board Statement

The seeds used in the study were donated by Prof. Dr. Lázaro Eustáquio Pereira Peres, coordinator of the Laboratory of Hormonal Control of Plant Development at the Luiz de Queiroz College of Agriculture of the College of São Paulo, where the collections of the wild-type and the high pigment 1 (hp1) (Accession: Ph3 (LA4472)) mutant are deposited. As Pro-Rector for Research, Graduate Studies and Innovation at IFGoiano, I certify that the study followed all University research ethics guidelines and complied with local or national guidelines with no need for further affirmation.

Data Availability Statement

Data supporting the findings of this study are available within the paper.

Acknowledgments

The authors would like to thank Lázaro Eustáquio Pereira Peres, coordinator of the Laboratory of Hormonal Control of Plant Development at the “Escola Superior de Agricultura Luiz de Queiroz”, University of São Paulo, for kindly providing the seeds used in this study. The authors are also thankful to the Instituto Federal de Educação, Ciência e Tecnologia Goiano (IFGoiano), the Centro de Excelência em Agricultura Exponencial (CEAGRE), the Fundação de Amparo à Pesquisa do Estado de Goiás (FAPEG), the Coordenação de Aperfeiçoamento de Pessoal de Nível Superior (CAPES), and the Conselho Nacional de Desenvolvimento Científico e Tecnológico (CNPq) for scholarships, and fellowships.

Conflicts of Interest

The authors declare no conflicts of interest.

References

  1. Derbyshire, M.C.; Batley, J.; Edwards, D. Use of multiple ‘omics techniques to accelerate the breeding of abiotic stress tolerant crops. Curr. Plant Biol. 2022, 32, 100262. [Google Scholar] [CrossRef]
  2. Mesa, T.; Polo, J.; Arabia, A.; Caselles, V.; Munné-Bosch, S. Differential physiological response to heat and cold stress of tomato plants and its implication on fruit quality. J. Plant Physiol. 2022, 268, 153581. [Google Scholar] [CrossRef] [PubMed]
  3. Pereira, A.I.A.; Guimarães, J.J.; Costa, J.V.; Cantuário, F.S.; Salomão, L.C.; Oliveira, R.C.; Luz, J.M.Q. Growth of sweet pepper plants submitted to water tensions in soil and potassium silicate doses. Hortic. Bras. 2019, 37, 82–88. [Google Scholar] [CrossRef]
  4. Sharma, A.; Kumar, V.; Shahzad, B.; Ramakrishnan, M.; Sidhu, G.P.S.; Bali, A.S.; Luz, J.M.Q. Photosynthetic response of plants under different abiotic stresses: A review. J. Plant Growth Regul. 2020, 39, 509–531. [Google Scholar] [CrossRef]
  5. Becklin, K.M.; Anderson, J.T.; Gerhart, L.M.; Wadgymar, S.M.; Wessinger, C.A.; Ward, J.K. Examining plant physiological responses to climate change through an evolutionary lens. Plant Physiol. 2016, 172, 635–649. [Google Scholar] [CrossRef]
  6. Costa, A.C.; Rezende-Silva, S.L.; Megguer, C.A.; Moura, L.M.F.; Rosa, M.; Silva, A.A. The effect of irradiance and water restriction on photosynthesis in young jatobá-do-cerrado (Hymenaea stigonocarpa) plants. Photosynthetica 2015, 53, 118–127. [Google Scholar] [CrossRef]
  7. Jumrani, K.; Bhatia, V.S. Combined effect of high temperature and water-deficit stress imposed at vegetative and reproductive stages on seed quality in soybean. Indian J. Plant Physiol. 2018, 23, 227–244. [Google Scholar] [CrossRef]
  8. Castro, J.N.; Müller, C.; Almeida, G.M.; Costa, A.C. Physiological tolerance to drought under high temperature in soybean cultivars. Aust. J. Crop Sci. 2019, 13, 976–987. [Google Scholar] [CrossRef]
  9. Batista, P.F.; Costa, A.C.; Müller, C.; Silva-Filho, R.O.; Barbosa da Silva, F.; Merchant, A.; Mendes, G.C.; Nascimento, K.J.T. Nitric oxide mitigates the effect of water deficit in Crambe abyssinica. Plant Physiol. Biochem. 2018, 129, 310–322. [Google Scholar] [CrossRef]
  10. Ghosh, U.K.; Islam, M.N.; Siddiqui, M.N.; Cao, X.; Khan, M.A.R. Proline, a multifaceted signalling molecule in plant responses to abiotic stress: Understanding the physiological mechanisms. Plant Biol. 2022, 24, 227–239. [Google Scholar] [CrossRef]
  11. Mishra, N.; Jiang, C.; Chen, L.; Paul, A.; Chatterjee, A.; Shen, G. Achieving abiotic stress tolerance in plants through antioxidative defense mechanisms. Front. Plant Sci. 2023, 14, 1110622. [Google Scholar] [CrossRef] [PubMed]
  12. Morales, A.; Kaiser, E. Photosynthetic acclimation to fluctuating irradiance in plants. Front. Plant Sci. 2020, 11, 268. [Google Scholar] [CrossRef] [PubMed]
  13. Zandalinas, S.I.; Fritschi, F.B.; Mittler, R. Global warming, climate change, and environmental pollution: Recipe for a multifactorial stress combination disaster. Trends Plant Sci. 2021, 26, 588–599. [Google Scholar] [CrossRef]
  14. Rivero, R.M.; Mittler, R.; Blumwald, E.; Zandalinas, S.I. Developing climate-resilient crops: Improving plant tolerance to stress combination. Plant J. 2022, 109, 373–389. [Google Scholar] [CrossRef]
  15. Zandalinas, S.I.; Mittler, R. Plant responses to multifactorial stress combination. New Phytol. 2022, 234, 1161–1167. [Google Scholar] [CrossRef]
  16. Marti, E. Genetic and physiological characterization of tomato cv. Micro-Tom. J. Exp. Bot. 2006, 57, 2037–2047. [Google Scholar] [CrossRef]
  17. Alves, F.R.R.; de Melo, H.C.; Crispim-Filho, A.J.; Costa, A.C.; Nascimento, K.J.T.; Carvalho, R.F. Physiological and biochemical responses of photomorphogenic tomato mutants (cv. Micro-Tom) under water withholding. Acta Physiol. Plant. 2016, 38, 155. [Google Scholar] [CrossRef]
  18. Huther, C.M.; Martinazzo, E.G.; Schock, A.A.; Rombaldi, C.V.; Bacarin, M.A. Production components in transformed and untransformed ‘Micro-Tom’ tomato plants. Rev. Ciênc. Agron. 2018, 49, e20180010. [Google Scholar] [CrossRef]
  19. Parrotta, L.; Aloisi, I.; Faleri, C.; Romi, M.; Del Duca, S.; Cai, G. Chronic heat stress affects the photosynthetic apparatus of Solanum lycopersicum L. cv Micro-Tom. Plant Physiol. Biochem. 2020, 154, 463–475. [Google Scholar] [CrossRef]
  20. Gavassi, M.A.; Monteiro, C.C.; Campos, M.L.; Melo, H.C.; Carvalho, R.F. Phytochromes are key regulators of abiotic stress responses in tomato. Sci. Hortic. 2017, 222, 126–135. [Google Scholar] [CrossRef]
  21. D’Amico-Damião, V.; Cruz, F.J.R.; Gavassi, M.A.; Santos, D.M.M.; Melo, H.C.; Carvalho, R.F. Photomorphogenic modulation of water stress in tomato (Solanum lycopersicum L.): The role of phytochromes A, B1, and B2. J. Hortic. Sci. Biotechnol. 2015, 90, 25–30. [Google Scholar] [CrossRef]
  22. Klose, C.; Nagy, F.; Schäfer, E. Thermal reversion of plant phytochromes. Mol. Plant 2020, 13, 386–397. [Google Scholar] [CrossRef] [PubMed]
  23. Crispim Filho, A.J.; Costa, A.C.; Alves, F.R.R.; Batista, P.F.; Rodrigues, A.A.; Vasconcelos Filho, S.C.; Nascimento, K.J.T. Deficiency in phytochromobilin biosynthesis enhances heat-stress-induced impairments to the photosynthetic apparatus in tomato. Biol. Plant. 2019, 63, 134–144. [Google Scholar] [CrossRef]
  24. Pino-Nunes, L.E.; Lattarulo, M.; Peres, L.E.P. Capítulo 2: Plantio, Irrigação e Adubação nas Canaletas/Vasos e Cultivo no Canteiro. In Manual do Modelo Vegetal Micro-Tom. Available online: https://www.esalq.usp.br/docentes/lazaropp/MMTCap2Cultivo.pdf (accessed on 12 February 2025).
  25. Scholander, P.F.; Bradstreet, E.D.; Hemmingsen, E.A.; Hammel, H.T. Sap pressure in vascular plants: Negative hydrostatic pressure can be measured in plants. Science 1965, 148, 339–346. [Google Scholar] [CrossRef]
  26. Genty, B.; Briantais, J.-M.; Baker, N.R. The relationship between the quantum yield of photosynthetic electron transport and quenching of chlorophyll fluorescence. Biochim. Biophys. Acta Gen. Subj. 1989, 990, 87–92. [Google Scholar] [CrossRef]
  27. Bilger, W.; Schreiber, U.; Bock, M. Determination of the quantum efficiency of photosystem II and of non-photochemical quenching of chlorophyll fluorescence in the field. Oecologia 1995, 102, 425–432. [Google Scholar] [CrossRef]
  28. Laisk, A.; Loreto, F. Determining photosynthetic parameters from leaf CO2 exchange and chlorophyll fluorescence (ribulose-1,5-bisphosphate carboxylase/oxygenase specificity factor, dark respiration in the light, excitation distribution between photosystems, alternative electron flow). Plant Physiol. 1996, 110, 903–912. [Google Scholar] [CrossRef]
  29. Heath, R.L.; Packer, L. Photoperoxidation in isolated chloroplasts. Arch. Biochem. Biophys. 1968, 125, 189–198. [Google Scholar] [CrossRef]
  30. Bates, L.S.; Waldren, R.P.; Teare, I.D. Rapid determination of free proline for water-stress studies. Plant Soil 1973, 39, 205–207. [Google Scholar] [CrossRef]
  31. Bradford, M.M. A rapid and sensitive method for the quantitation of microgram quantities of protein utilizing the principle of protein-dye binding. Anal. Biochem. 1976, 72, 248–254. [Google Scholar] [CrossRef]
  32. Giannopolitis, C.N.; Ries, S.K. Superoxide dismutases. Plant Physiol. 1977, 59, 309–314. [Google Scholar] [CrossRef]
  33. Beauchamp, C.; Fridovich, I. Superoxide dismutase: Improved assays and an assay applicable to acrylamide gels. Anal. Biochem. 1971, 44, 276–287. [Google Scholar] [CrossRef]
  34. Havir, E.A.; McHale, N.A. Biochemical and developmental characterization of multiple forms of catalase in tobacco leaves. Plant Physiol. 1987, 84, 450–455. [Google Scholar] [CrossRef]
  35. Anderson, M.D.; Prasad, T.K.; Stewart, C.R. Changes in isozyme profiles of catalase, peroxidase, and glutathione reductase during acclimation to chilling in mesocotyls of maize seedlings. Plant Physiol. 1995, 109, 1247–1257. [Google Scholar] [CrossRef]
  36. Kar, M.; Mishra, D. Catalase, peroxidase, and polyphenoloxidase activities during rice leaf senescence. Plant Physiol. 1976, 57, 315–319. [Google Scholar] [CrossRef]
  37. Chance, B.; Maehly, A.C. Assay of catalases and peroxidases. Methods Enzymol. 1955, 2, 764–775. [Google Scholar] [CrossRef]
  38. Wellburn, A.R. The spectral determination of chlorophylls a and b, as well as total carotenoids, using various solvents with spectrophotometers of different resolution. J. Plant Physiol. 1994, 144, 307–313. [Google Scholar] [CrossRef]
  39. Karnovsky, M.J. A formaldehyde-glutaraldehyde fixative of high osmolarity for use in electron microscopy. J. Cell Biol. 1965, 27, 137–138. [Google Scholar]
  40. O’Brien, T.P.; Feder, N.; McCully, M.E. Polychromatic staining of plant cell walls by toluidine blue O. Protoplasma 1964, 59, 368–373. [Google Scholar] [CrossRef]
  41. Ferreira, D.F. Sisvar: A computer statistical analysis system. Ciênc. Agrotec. 2011, 35, 1039–1042. [Google Scholar] [CrossRef]
  42. Rao, R.C. Advanced Statistical Methods in Biometric Research; John Wiley & Sons: New York, NY, USA, 1952. [Google Scholar]
  43. R Core Team. R: A Language and Environment for Statistical Computing; R Foundation for Statistical Computing: Vienna, Austria, 2019. [Google Scholar]
  44. Flexas, J.; Bota, J.; Loreto, F.; Cornic, G.; Sharkey, T.D. Diffusive and metabolic limitations to photosynthesis under drought and salinity in C3 plants. Plant Biol. 2004, 6, 269–279. [Google Scholar] [CrossRef]
  45. Chaves, M.M.; Flexas, J.; Pinheiro, C. Photosynthesis under drought and salt stress: Regulation mechanisms from whole plant to cell. Ann. Bot. 2009, 103, 551–560. [Google Scholar] [CrossRef]
  46. Foyer, C.H.; Noctor, G. Redox homeostasis and antioxidant signaling: A metabolic interface between stress perception and physiological responses. Plant Cell 2005, 17, 1866–1875. [Google Scholar] [CrossRef]
  47. Melo, H.C.; Castro, E.M.; Alves, E.; Perina, F.J. Anatomia foliar de microtomateiros fitocromo-mutantes e ultra-estrutura de cloroplastos. Ciênc. Agrotec. 2011, 35, 11–18. [Google Scholar] [CrossRef]
  48. Cookson, P.J.; Kiano, J.W.; Shipton, C.A.; Fraser, P.D.; Romer, S.; Schuch, W.; Bramley, P.M.; Pyke, K.A. Increases in cell elongation, plastid compartment size and phytoene synthase activity underlie the phenotype of the high pigment-1 mutant of tomato. Planta 2003, 217, 896–903. [Google Scholar] [CrossRef]
  49. Pereira, A.M.; Martins, A.O.; Batista-Silva, W.; Condori-Apfata, J.A.; Nascimento, V.L.; Silva, V.F.; Oliveira, L.A.; Medeiros, D.B.; Martins, S.C.V.; Fernie, A.R.; et al. Elevated carbon assimilation and metabolic reprogramming in tomato high pigment mutants support the increased production of pigments. Plant Cell Rep. 2022, 41, 1907–1929. [Google Scholar] [CrossRef]
  50. Kunderlikova, K.; Brestic, M.; Živčák, M.; Kusniarova, P. Photosynthetic responses of sun- and shade-grown chlorophyll b deficient mutant of wheat. J. Cent. Eur. Agric. 2016, 17, 950–956. [Google Scholar] [CrossRef]
  51. Xiong, D.; Douthe, C.; Flexas, J. Differential coordination of stomatal conductance, mesophyll conductance, and leaf hydraulic conductance in response to changing light across species. Plant Cell Environ. 2018, 41, 436–450. [Google Scholar] [CrossRef]
  52. Gollan, P.J.; Aro, E.-M. Photosynthetic signalling during high light stress and recovery: Targets and dynamics. Philos. Trans. R. Soc. B Biol. Sci. 2020, 375, 20190406. [Google Scholar] [CrossRef]
  53. Wang, A.; Chen, D.; Ma, Q.; Rose, J.K.C.; Fei, Z.; Liu, Y.; Giovannoni, J.J. The tomato HIGH PIGMENT1/DAMAGED DNA BINDING PROTEIN 1 gene contributes to regulation of fruit ripening. Hortic. Res. 2019, 6, 15. [Google Scholar] [CrossRef]
  54. Pashkovskiy, P.; Kreslavski, V.; Khudyakova, A.; Ashikhmin, A.; Bolshakov, M.; Kozhevnikova, A.; Kosobryukhov, A.; Kuznetsov, V.V.; Allakhverdiev, S.I. Effect of high-intensity light on the photosynthetic activity, pigment content and expression of light-dependent genes of photomorphogenetic Solanum lycopersicum hp mutants. Plant Physiol. Biochem. 2021, 167, 91–100. [Google Scholar] [CrossRef]
  55. Menconi, J.; La Monaca, M.; Cataldo, I.; Niccolini, P.M.; Perata, P.; Gonzali, S. Loss of DET1 in High pigment 2 tomato prevents high temperature repression of anthocyanin biosynthesis in fruit through HY5 stabilization. Plant Cell Environ. 2025. online ahead of print. [Google Scholar] [CrossRef]
  56. Choudhury, F.K.; Devireddy, A.R.; Azad, R.K.; Shulaev, V.; Mittler, R. Local and systemic metabolic responses during light-induced rapid systemic signaling. Plant Physiol. 2018, 178, 1461–1472. [Google Scholar] [CrossRef]
  57. He, Z.; Zhang, P.; Jia, H.; Zhang, S.; Nishawy, E.; Sun, X.; Dai, M. Regulatory mechanisms and breeding strategies for crop drought resistance. New Crops 2024, 1, 100029. [Google Scholar] [CrossRef]
  58. Bartlett, M.K.; Zhang, Y.; Kreidler, N.; Sun, S.; Ardy, R.; Cao, K.; Sack, L. Global analysis of plasticity in turgor loss point, a key drought tolerance trait. Ecol. Lett. 2014, 17, 1580–1590. [Google Scholar] [CrossRef]
Figure 1. Water relation: Leaf water potential (Ψw, (A)) and leaf osmotic potential (Ψs, (B)) of wt and hp1 Micro-Tom genotypes exposed to two contrasting environmental treatments (control and combined stress of water deficit and high irradiance) for 7 days. Bars represent means ± SEM (n = 10). Mean values with the same letter are not significantly different by the Tukey test (p ≤ 0.05).
Agriculture 15 01518 g001
Figure 2. Gas exchange: Photosynthesis rate (A, (A)), stomatal conductance (gS, (B)), transpiration rate (E, (C)), ratio of internal to external CO2 concentration (Ci/Ca, (D)), and intrinsic water use efficiency (WUE, (E)) of wt and hp1 Micro-Tom genotypes exposed to two contrasting environmental treatments (control and combined stress of water deficit and high irradiance) for 7 days. Bars represent means ± SEM (n = 10). Mean values with the same letter are not significantly different by the Tukey test (p ≤ 0.05).
Agriculture 15 01518 g002
Figure 3. Chlorophyll fluorescence: Potential quantum yield of PSII (Fv/Fm; (A)), effective quantum yield of PSII (YII; (B)), electron transport rate (ETR; (C)), regulated energy dissipation quantum yield (YNPQ; (D)), unregulated energy dissipation quantum yield (YNO; (E)), and fraction of open PSII reaction centers (qL; (F)) of wt and hp1 Micro-Tom genotypes exposed to two contrasting environmental treatments (control and combined stress of water deficit and high irradiance) for 7 days. Bars represent means ± SEM (n = 10). Mean values with the same letter are not significantly different by the Tukey test (p ≤ 0.05).
Agriculture 15 01518 g003
Figure 4. Biochemical traits: Malondialdehyde (MDA; (A)), proline (PRO; (B)), and activities of superoxide dismutase (SOD; (C)), catalase (CAT; (D)), and peroxidase (POX; (E)) of wt and hp1 Micro-Tom genotypes exposed to two contrasting environmental treatments (control and combined stress of water deficit and high irradiance) for 7 days. Bars represent means ± SEM (n = 10). Mean values with the same letter are not significantly different by the Tukey test (p ≤ 0.05).
Agriculture 15 01518 g004
Figure 5. Pigments: Concentrations of chlorophyll a (Chl a; (A)), chlorophyll b (Chl b; (B)), total chlorophyll (Chl t; (C)) and total carotenoids (D) of wt and hp1 Micro-Tom genotypes exposed to two contrasting environmental treatments (control and combined stress of water deficit and high irradiance) for 7 days. Bars represent means ± SEM (n = 10). Mean values with the same letter are not significantly different by the Tukey test (p ≤ 0.05).
Agriculture 15 01518 g005
Figure 6. Anatomical traits: Micromorphometry of adaxial epidermis (AdEp; (A)), abaxial epidermis (AbEp; (B)), palisade parenchyma (PP; (C)), spongy parenchyma (SP; (D)), and mesophyll (ME; (E)) of wt and hp1 Micro-Tom genotypes exposed to two contrasting environmental treatments (control and combined stress of water deficit and high irradiance) for 7 days. Bars represent means ± SEM (n = 10). Mean values with the same letter are not significantly different by the Tukey test (p ≤ 0.05).
Agriculture 15 01518 g006
Figure 7. Anatomical traits: Morphoanatomical analyses of the adaxial epidermis (AdEp), abaxial epidermis (AbEp), palisade parenchyma (PP), and spongy parenchyma (SP) in Micro-Tom genotypes under the following conditions: (a) wt control; (b) wt under combined stress (water deficit and high irradiance); (c) hp1 control; and (d) hp1 under combined stress (water deficit and high irradiance) for 7 days. Bar scale = 200 µm.
Agriculture 15 01518 g007
Figure 8. Dendrogram associated with a heatmap of the physiological, biochemical, and anatomical characteristics of wt and hp1 Micro-Tom genotypes exposed to two contrasting environmental treatments (control and combined stress of water deficit and high irradiance) for 7 days. Ψw, predawn water potential; Ψs, osmotic potential; A, photosynthetic rate; gS, stomatal conductance; E, transpiration, Ci/Ca, the ratio between internal and external; WUE, intrinsic water use efficiency; Fv/Fm, potential quantum yield of photosystem II (PSII); YII, effective quantum yield of photochemical energy conversion in PSII; YNPQ, non-photochemical extinction coefficient; ETR, electron transport rate; Chl a, chlorophyll a; Chl b, chlorophyll b; Chl tot, total chlorophyll; Crt, carotenoids; MDA, malondialdehyde content; PRO, proline concentration; SOD, superoxide dismutase activity; CAT, catalase activity; POX, peroxidase activity; EpAd, adaxial epidermis; EpAb, abaxial epidermis; PP, palisade parenchyma; SP, spongy parenchyma; ME, mesophyll. a and b represent the cluster division resulting from the hierarchical clustering analysis.
Agriculture 15 01518 g008
Figure 9. Principal component analysis of physiological, biochemical, and anatomical characteristics: Ψw, predawn water potential; Ψs, osmotic potential; A, photosynthetic rate; gS, stomatal conductance; E, transpiration, Ci/Ca, the ratio between internal and external; Chl a, chlorophyll a; Chl b, chlorophyll b; MDA, malondialdehyde content; PRO, proline concentration; SOD, superoxide dismutase activity; CAT, catalase activity; POX, peroxidase activity; EpAd, adaxial epidermis; EpAb, abaxial epidermis; MES, mesophyll of wt and hp1 Micro-Tom genotypes exposed to two contrasting environmental treatments (control and combined stress of water deficit and high irradiance) for 7 days.
Agriculture 15 01518 g009
Disclaimer/Publisher’s Note: The statements, opinions and data contained in all publications are solely those of the individual author(s) and contributor(s) and not of MDPI and/or the editor(s). MDPI and/or the editor(s) disclaim responsibility for any injury to people or property resulting from any ideas, methods, instructions or products referred to in the content.

