1. Introduction
At the United Nations Sustainable Development Forum in 2017, Zhu Tianju, a senior researcher at the International Food Policy Research Institute, pointed out that China has about 8% of the world’s arable land, but supports about 20% of the world’s population, and maintains almost complete food self-sufficiency, especially in major crops such as rice and wheat. This achievement is closely related to national poverty alleviation and rural revitalization, and highlights China’s key role in global food security and economic development. However, the traditional agricultural model centered on yield maximization and heavily on chemical inputs has led to severe ecological degradation, which poses long-term risks for sustainable development and green transformation. Digital technology provides a good solution for optimizing agricultural processes, improving resource efficiency, and achieving precision agriculture, visual management, and intelligent decision-making. In addition, People’s Daily (“Promoting the Development of Smart Agricultural Clusters with Digital Productivity”) and “Qiushi Magazine” (“Taking digital productivity as the guide, Injecting Impetus into the high-quality development of Agriculture”, “Promoting the Improvement of New quality productivity of Agriculture through Digital Intelligent Transformation”) pointed out that “the wide application of digital technology will promote the development of agriculture to a higher quality and more sustainable direction”. In October 2024, Reuters reported that China’s Ministry of Agriculture and Rural Affairs released their Smart Agriculture Action Plan 2024–2028. It emphasizes “improving cost efficiency, yield and productivity through digital transformation” to support high-quality agricultural development. Internationally, in Japan, the Digital Garden City National Concept (2022) emphasizes narrowing the urban–rural digital divide, while the Smart Agriculture Promotion Package (2020) aims to ensure that core farmers adopt data-driven practices by 2025 to enhance production efficiency and sustainability (OECD, 2023). The European Union, through its CAP (2023–2027), has designated agricultural and rural digitalization as a key pillar to modernize and improve competitiveness. It has initiated programs such as precision farming and smart villages, and supported Horizon Europe projects like ATLAS and DEMETER to apply IoT, data analytics, and blockchain across the agri-food chain. India’s Digital Agriculture Mission (2021–2025) focuses on smallholders and promotes the integration of AI, GIS, and remote sensing technologies through platforms like AgriStack. States such as Maharashtra and Andhra Pradesh are actively deploying AI-powered decision-making, forecasting, and crop-tracking systems. In Australia, the National Agricultural Innovation Agenda envisions the country as a global leader in digital agriculture by 2030. The 2022 Strategy for Digital Infrastructure in Agriculture outlines foundational efforts in data governance and connectivity. According to the Financial Times, Australia is becoming a global testing ground for agri-tech, investing in sensors, robotics, and AI to accelerate digital transformation. This highlights the growing global consensus that the DRC is critical for addressing agricultural challenges and advancing modernization.
Digital transformation has emerged as a pivotal driver and enabler of innovation in the pursuit of HAD. This transformation necessitates elevated standards and technical requirements for DRC. The enhancement of core subsystems—industrial infrastructure, operational frameworks, and production mechanisms—lays a foundation conducive to the integration and advancement of digital applications in agriculture. As DRC progresses, it not only accelerates improvements in agricultural quality but also catalyzes digital industrialization and the broader DRC. This synergistic relationship facilitates the widespread adoption of digital technologies, fostering sustainable agricultural growth and creating new pathways for productivity enhancement. However, substantial regional disparities in development stages and resource endowments have resulted in uneven advancement of the DRC and rural modernization. This brings up essential questions: How do DRC and HAD interact and evolve together across different spatial and temporal scales? What are the key characteristics and dynamics of their coupling and coordination? Exploring the relationship between DRC and HAD is both theoretically important and practically urgent. A nuanced understanding of their spatio-temporal dynamics is essential to advancing global agricultural modernization. DRC presents strategic opportunities to enhance agrarian efficiency, promote rural prosperity, and ensure ecological sustainability. For developing countries, accelerating the application of digital technologies in agriculture—underpinned by sound policy, technological innovation, and talent cultivation—is imperative for achieving sustainable agricultural outcomes. This study aims to construct a coupling coordination evaluation framework to assess the interrelationship between DRC and HAD. By analyzing the spatio-temporal characteristics of their interaction across 31 provinces in China, the research seeks to elucidate the mechanisms and pathways that promote coordinated development. The findings are expected to provide valuable insights to guide the integrated advancement of digital village initiatives and sustainable agricultural modernization.
Literature review: The concept of “digital villages” has gained global attention as a key strategy for rural revitalization and modernization. The European Union defines the digital countryside as a transformative process that leverages digital technologies to enhance networks, create new infrastructures, and reshape urban–rural dynamics, utilizing local resources to drive development. Sutriadi (2018) frames the digital countryside as a model for sustainable, innovative development, emphasizing ICT integration to enhance rural human capital and drive efficient, integrated development [
1]. Realizing this vision depends on the holistic development of digital infrastructure in rural areas.
The digital countryside encompasses the digitization of agriculture, improved internet access, e-commerce platforms, and digital financial inclusion [
2,
3]. Malik et al. view it as a model for advanced rural areas, requiring transformation across agricultural, ecological, and human systems [
4]. Park and Cha describe DRC as a smart platform for sustainable rural development [
5]. Despite substantial research, the specific impact on agriculture remains underexplored. Studies by Hartatik and Darmawan et al. highlight the role of mobile apps and ICT in rural management [
6], but fragmented data resources hinder agricultural progress. Recent studies increasingly adopt quantitative methods, such as statistical econometrics, to evaluate DRC [
7]. Ko et al. assessed digital literacy and economic vitality [
8], while Zhao et al. examined rural development, financial growth, and technological innovation through a coupled coordination model [
9]. Anastasiou et al. found a negative correlation between DRC and spatial vulnerability [
10], and Onitsuka et al. explored generational disparities in Internet usage [
11]. Adiningtyas et al. analyzed e-commerce’s role in digital village challenges [
12], while Tosida et al. identified barriers to rural development through structural equation modeling [
13].
Coupling and coordination models are used to assess interactions between systems, examining mutual influence [
14]. These models, applied in ecology, agriculture, geography, and economics, provide insights into spatio-temporal dynamics [
15,
16]. Despite significant research, studies on the interaction between DRC and HAD remain limited, focusing mainly on DRC indices [
9], digital governance [
17,
18], and digital transformation in agriculture [
19,
20]. The industrial system underpins agricultural development, while the production system drives it and the management system ensures stability [
21,
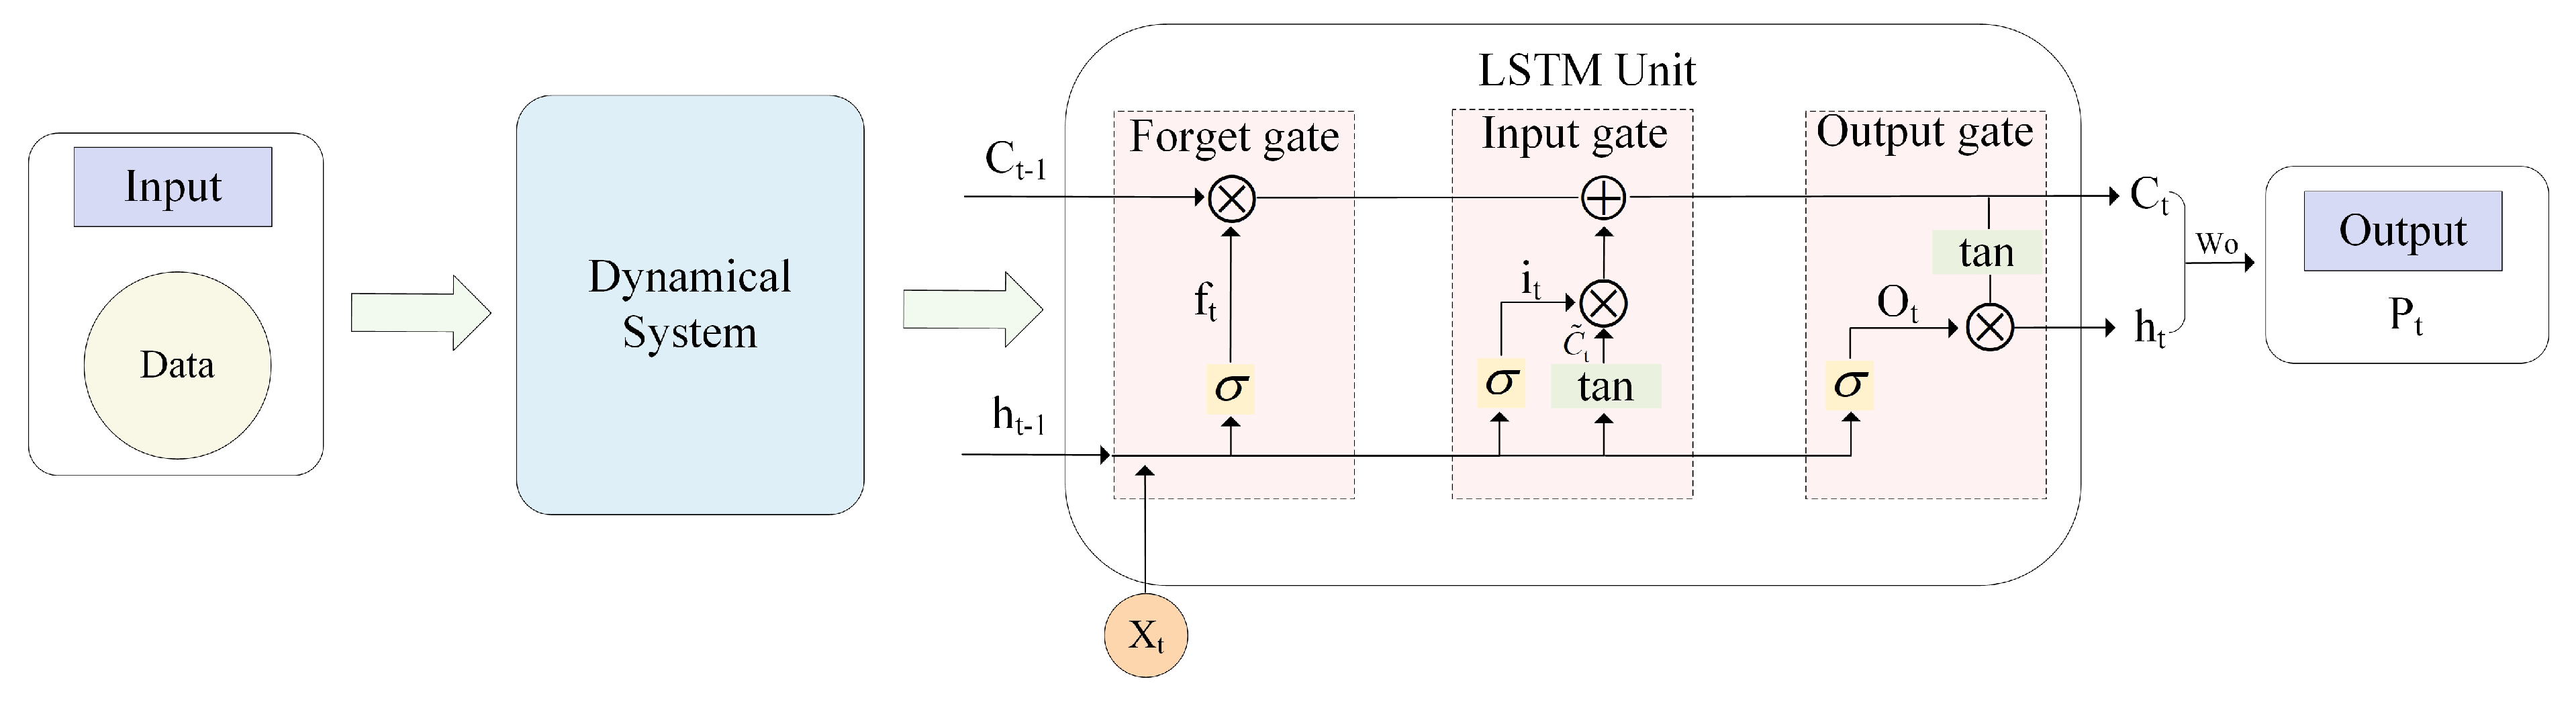
22]. LSTM networks, effective for time series forecasting, are widely used for coupling coordination [
23,
24], and the NOA-LSTM hybrid model improves prediction accuracy [
25].
SD models simulate dynamic systems, capturing feedback loops and nonlinearities to understand system behavior over time, such as water resource impact on agriculture and ecosystems [
26]. This study integrates SD and LSTM to predict coupling coordination, offering a framework for analyzing the spatio-temporal relationship between DRC and HAD across 31 Chinese provinces. By exploring subsystem coordination and overall synergy, we highlight the mutual influence between DRC and HAD, essential for optimizing resource allocation, improving agricultural efficiency, and advancing sustainable growth.
This research assesses DRC and HAD interplay through systems theory, offering recommendations for the green and sustainable advancement of regional agriculture.
4. Result Analysis
4.1. Overall Development Status of DRC and HAD
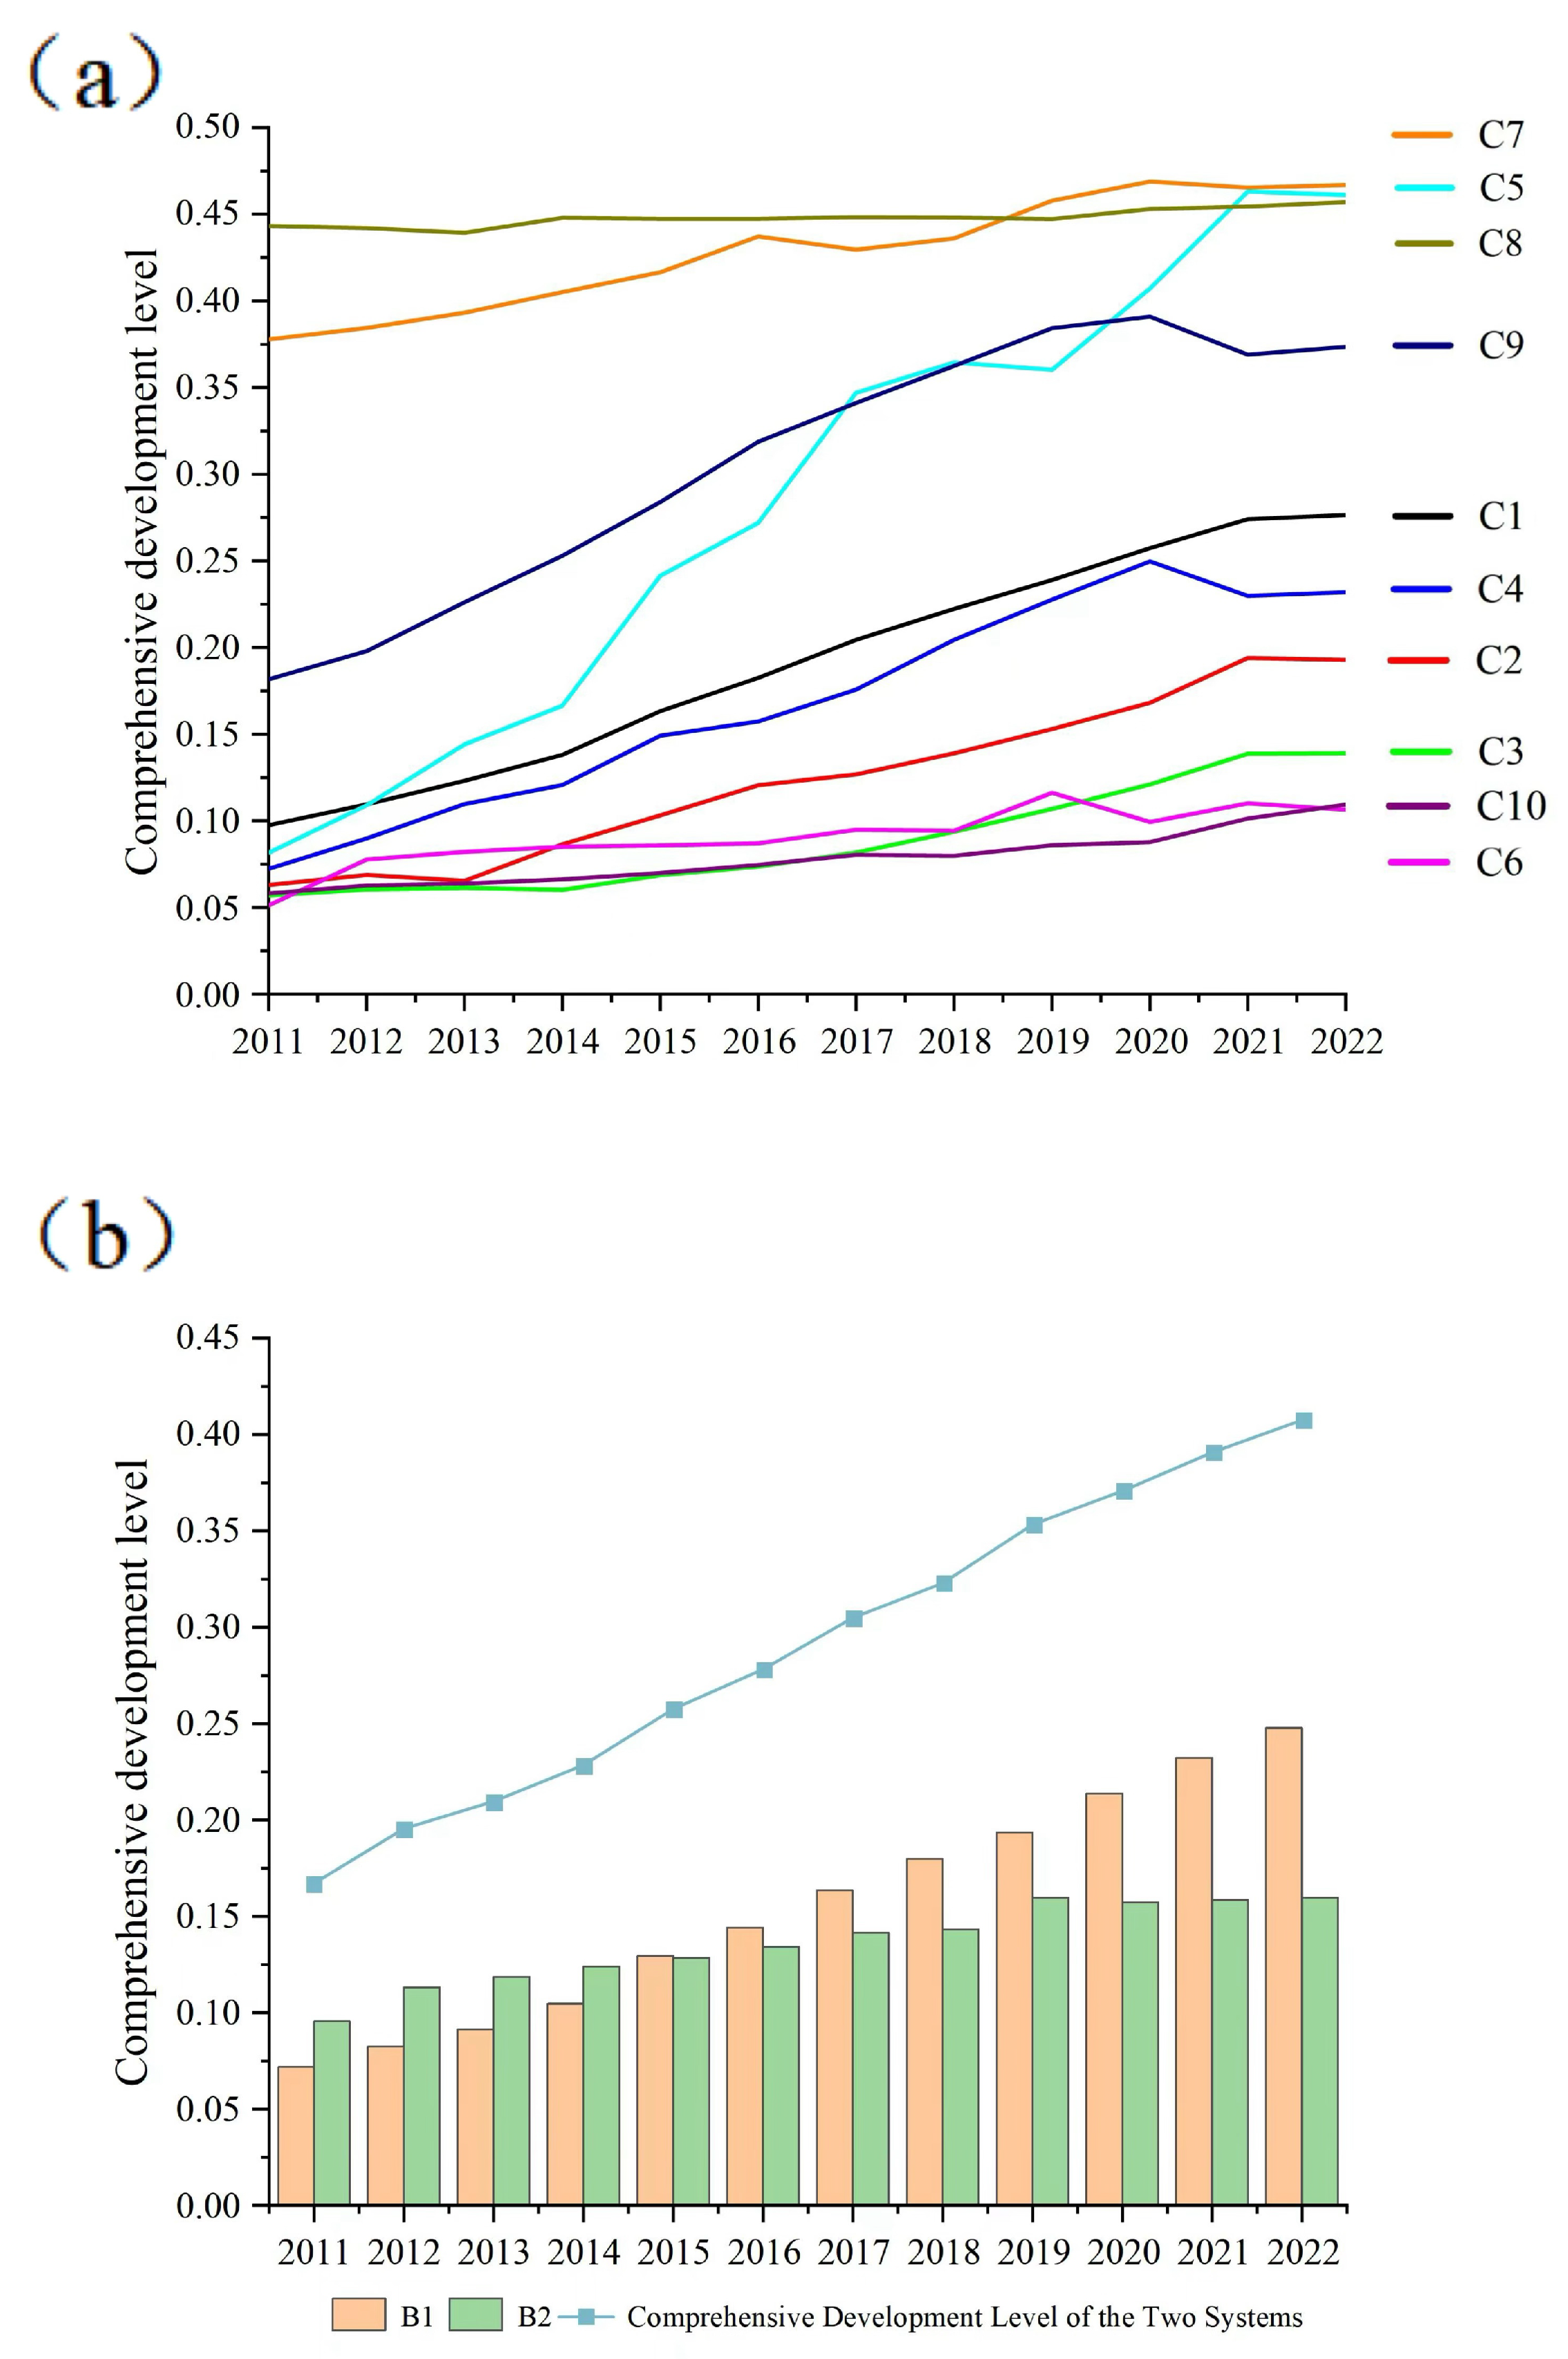
Figure 5a illustrates fluctuations in the comprehensive development levels of ten secondary indicators across two systems—DRC and HAD—from 2011 to 2022. Notably, indicators such as rural industry digitalization (C4), rural life service digitalization (C5), agricultural innovation (C6), and agricultural shared development (C9) exhibit significant instability, highlighting the need for all 31 provinces in China to prioritize sustainable development strategies, including agricultural innovation and increased investment. Further integration of science, technology, and industry is crucial for enhancing agricultural stability and sustainability. From 2011 to 2014, DRC lagged behind HAD, reflecting the early stage of China’s digital rural initiatives. Progress in policies, infrastructure, and technology was slow, and traditional agricultural practices prevailed, with limited digital technology in rural areas. However, from 2015 to 2022, DRC outpaced HAD, driven by government support, infrastructure expansion, and technological innovation, positioning it as a central pillar of agricultural modernization and rural revitalization.
The comprehensive development index for DRC (B1) steadily increased from 0.071 in 2011 to 0.247 in 2022. This growth was driven by key policy initiatives, starting with the 2011 Outline of the National 12th Five-Year Plan, which emphasized the integration of informatization with agricultural modernization. In 2018, the State Council’s Strategic Plan for Rural Revitalization (2018–2022) further prioritized DRC. Over the period from 2011 to 2022, the index rose by 247.89%, with a stable growth rate, divided into two phases: steady growth (2011–2014) and accelerated progress (2015–2022).
However, the comprehensive index alone does not capture the internal dynamics of the DRC system, as shown in
Figure 5b. Therefore, this study disaggregated the analysis into five sub-systems to explore the index changes in these components. The rural digital infrastructure (C1) steadily improved from 2011 to 2022, with a total increase of 0.173. Similarly, the digitalization of rural operations (C2) showed an upward trend over the same period, increasing by 0.13. The digitization of rural production (C3) experienced a more gradual pace of change.
The digitalization of rural industries (C4) and the provision of rural life services (C5) both exhibited positive overall trends from 2011 to 2022, though with notable fluctuations. This volatility was primarily due to the global economic impact of the COVID-19 pandemic, which disrupted economic activities and slowed the digital transformation of rural industries, particularly in areas with limited infrastructure and technology adoption. Nevertheless, the overall upward trend was reinforced by the 2020 release of the Outline of the DRC Strategy, which accelerated rural digital transformation. The “Internet + agriculture” initiative further facilitated rural digitization by enabling agricultural producers to utilize e-commerce, online payments, and big data analytics, thereby enhancing production efficiency and improving agricultural product sales channels.
The comprehensive development index for the HAD system (B2) shows a steady upward trend, increasing from 0.095 in 2011 to 0.159 in 2022, with minimal variation. Given the limited fluctuations, this study further analyzes changes in the five sub-systems of the HAD system (
Figure 5b). Agricultural innovation and development (C6) exhibited an upward trend from 2011 to 2022, though with significant fluctuations, rising from 0.051 in 2011 to 0.106 in 2021. In contrast, the coordinated development (C7), green development (C8), and open development (C10) of agriculture showed stable positive trends. However, agricultural shared development (C9) experienced more pronounced fluctuations, particularly a decline in 2020, attributed to pandemic-related restrictions on personnel movement and local financial constraints, which hindered progress in building information platforms and promoting shared technologies. Compared to the rapid growth of DRC, the HAD system has progressed more slowly. Digital rural initiatives, supported by modern information technologies, offer faster and more adaptable solutions. In contrast, HAD involves the complex integration of production, technology, environmental management, and policy measures, leading to a slower pace of advancement. The tension between traditional agricultural practices and innovative approaches, coupled with the digital divide between urban and rural areas, underscores the need for greater cross-regional collaboration and sustained strategic support for HAD.
4.2. Distribution Dynamics of DRC
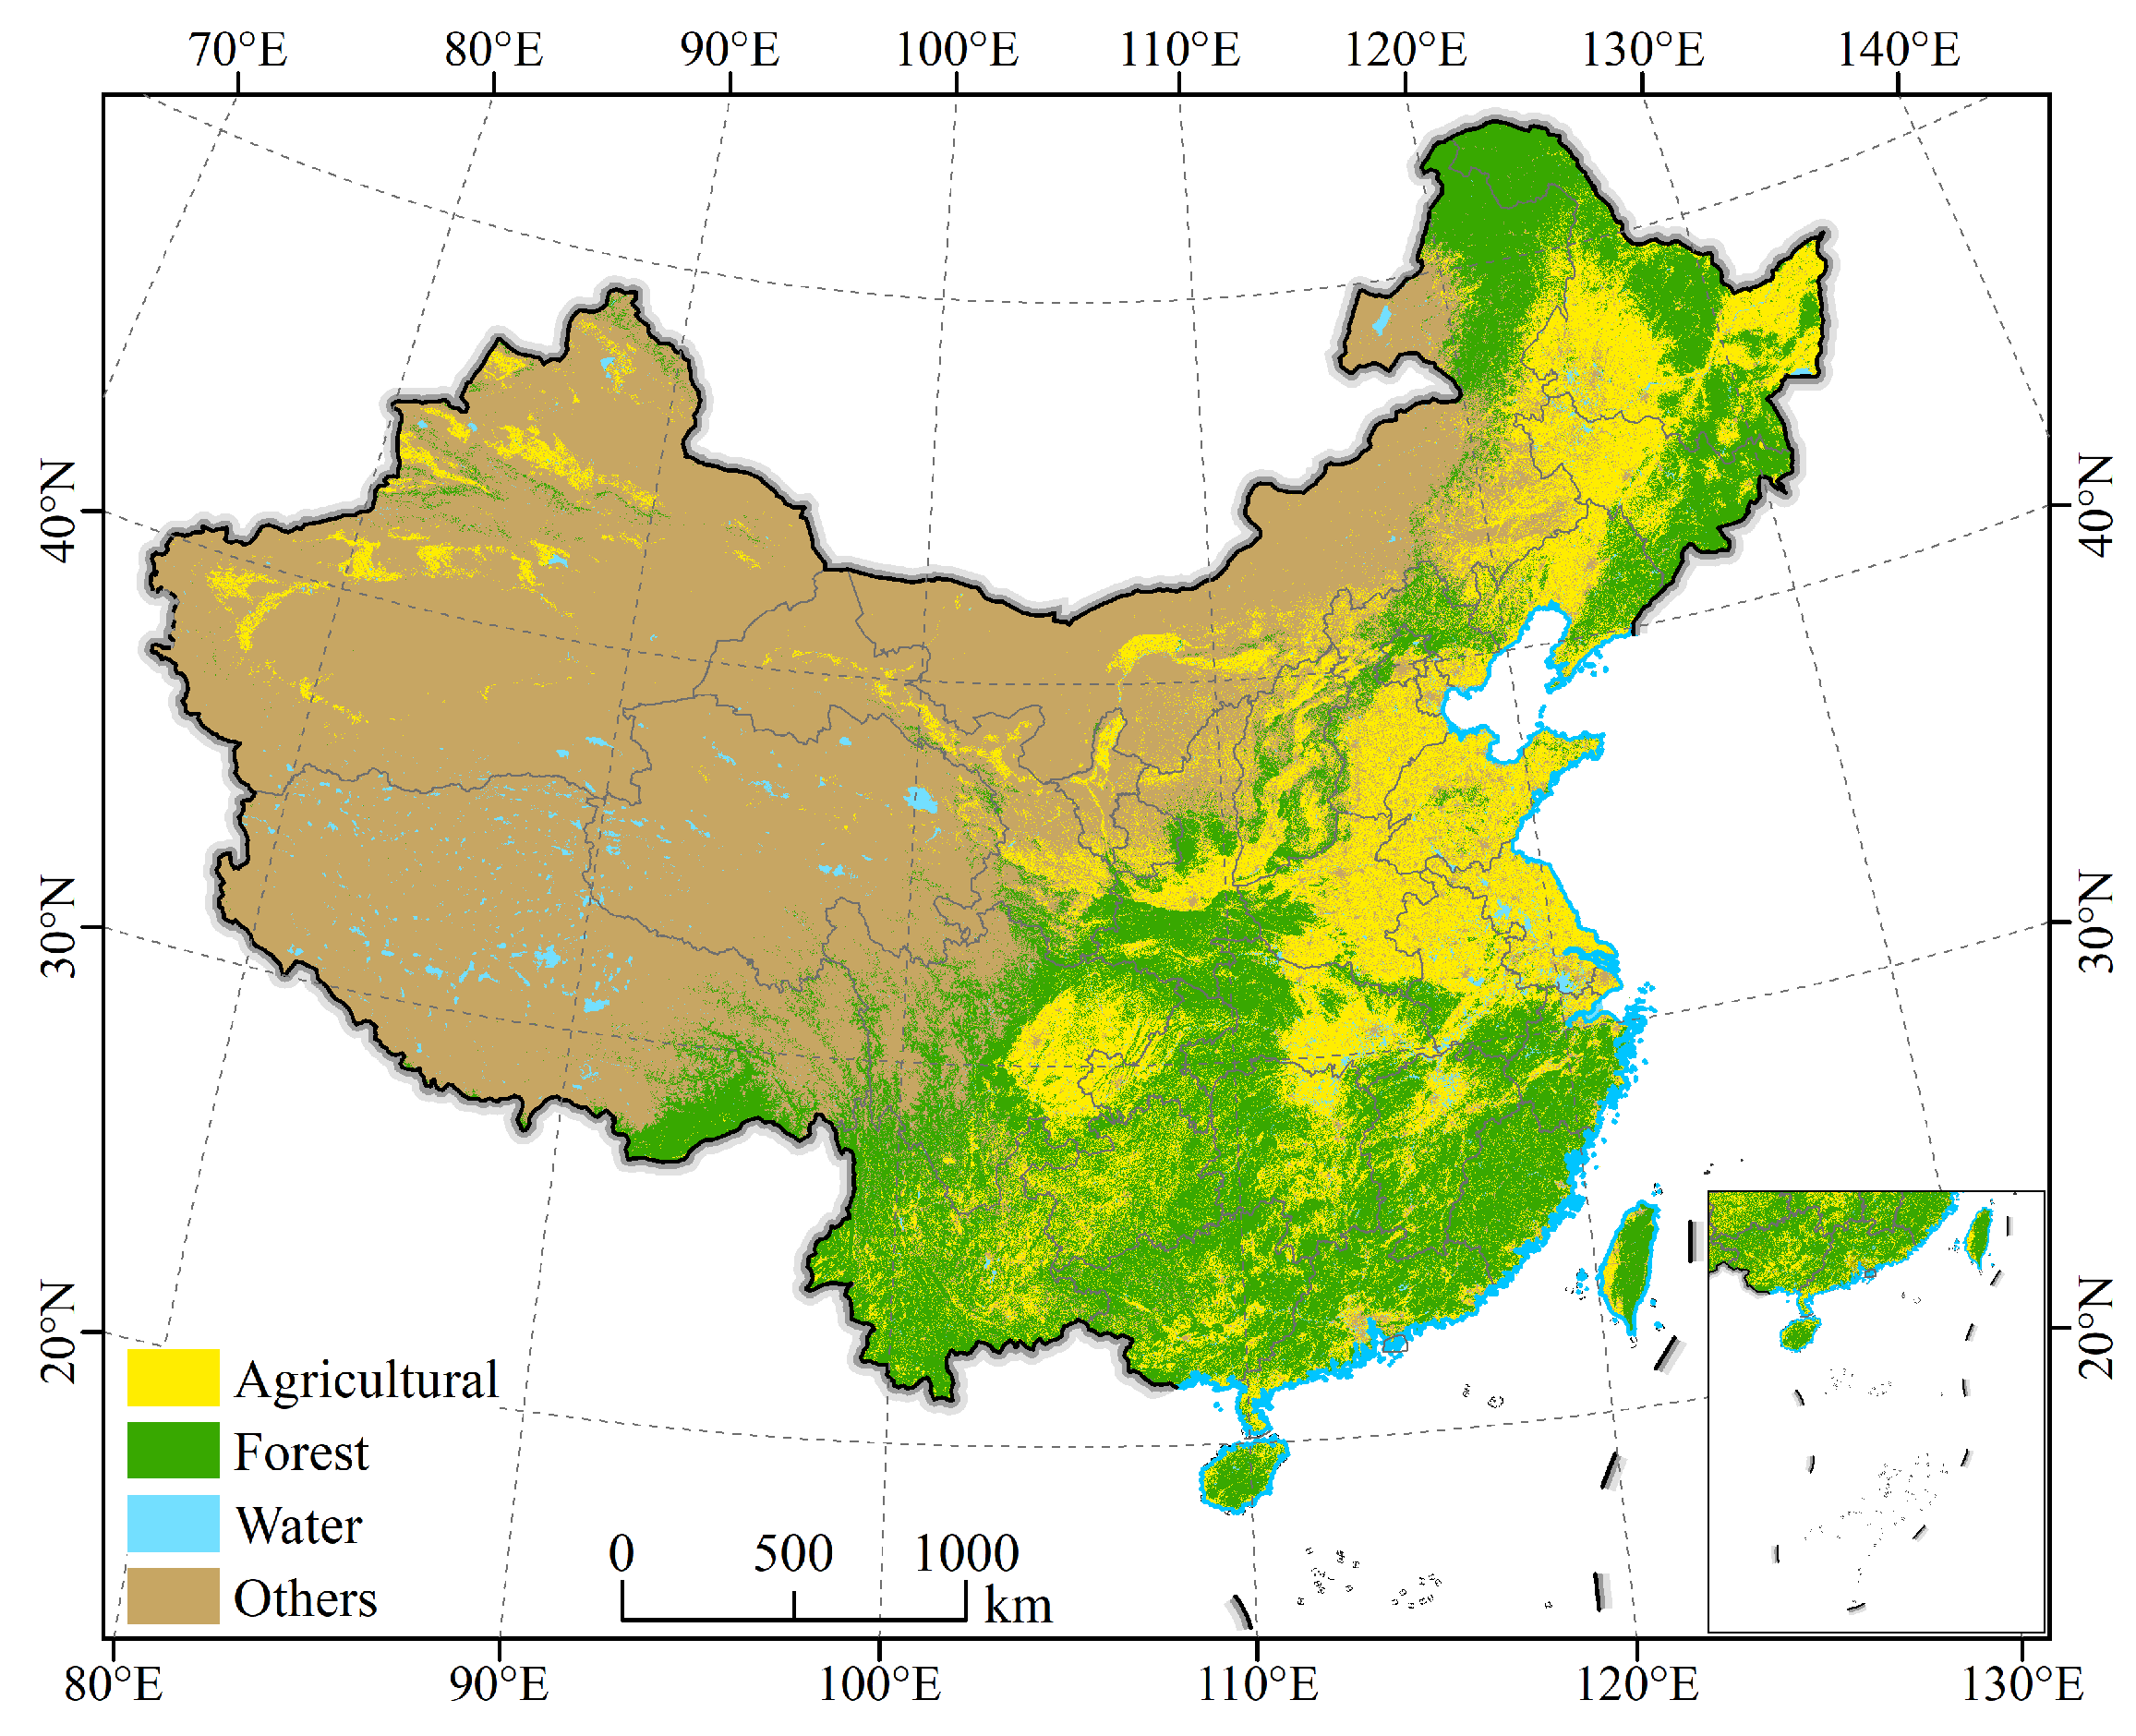
To analyze regional characteristics, China’s 31 provinces, autonomous regions, and municipalities are classified into four economic regions based on national bureau of statistics standards: the eastern region, the central region, the northeast region, and the western region.
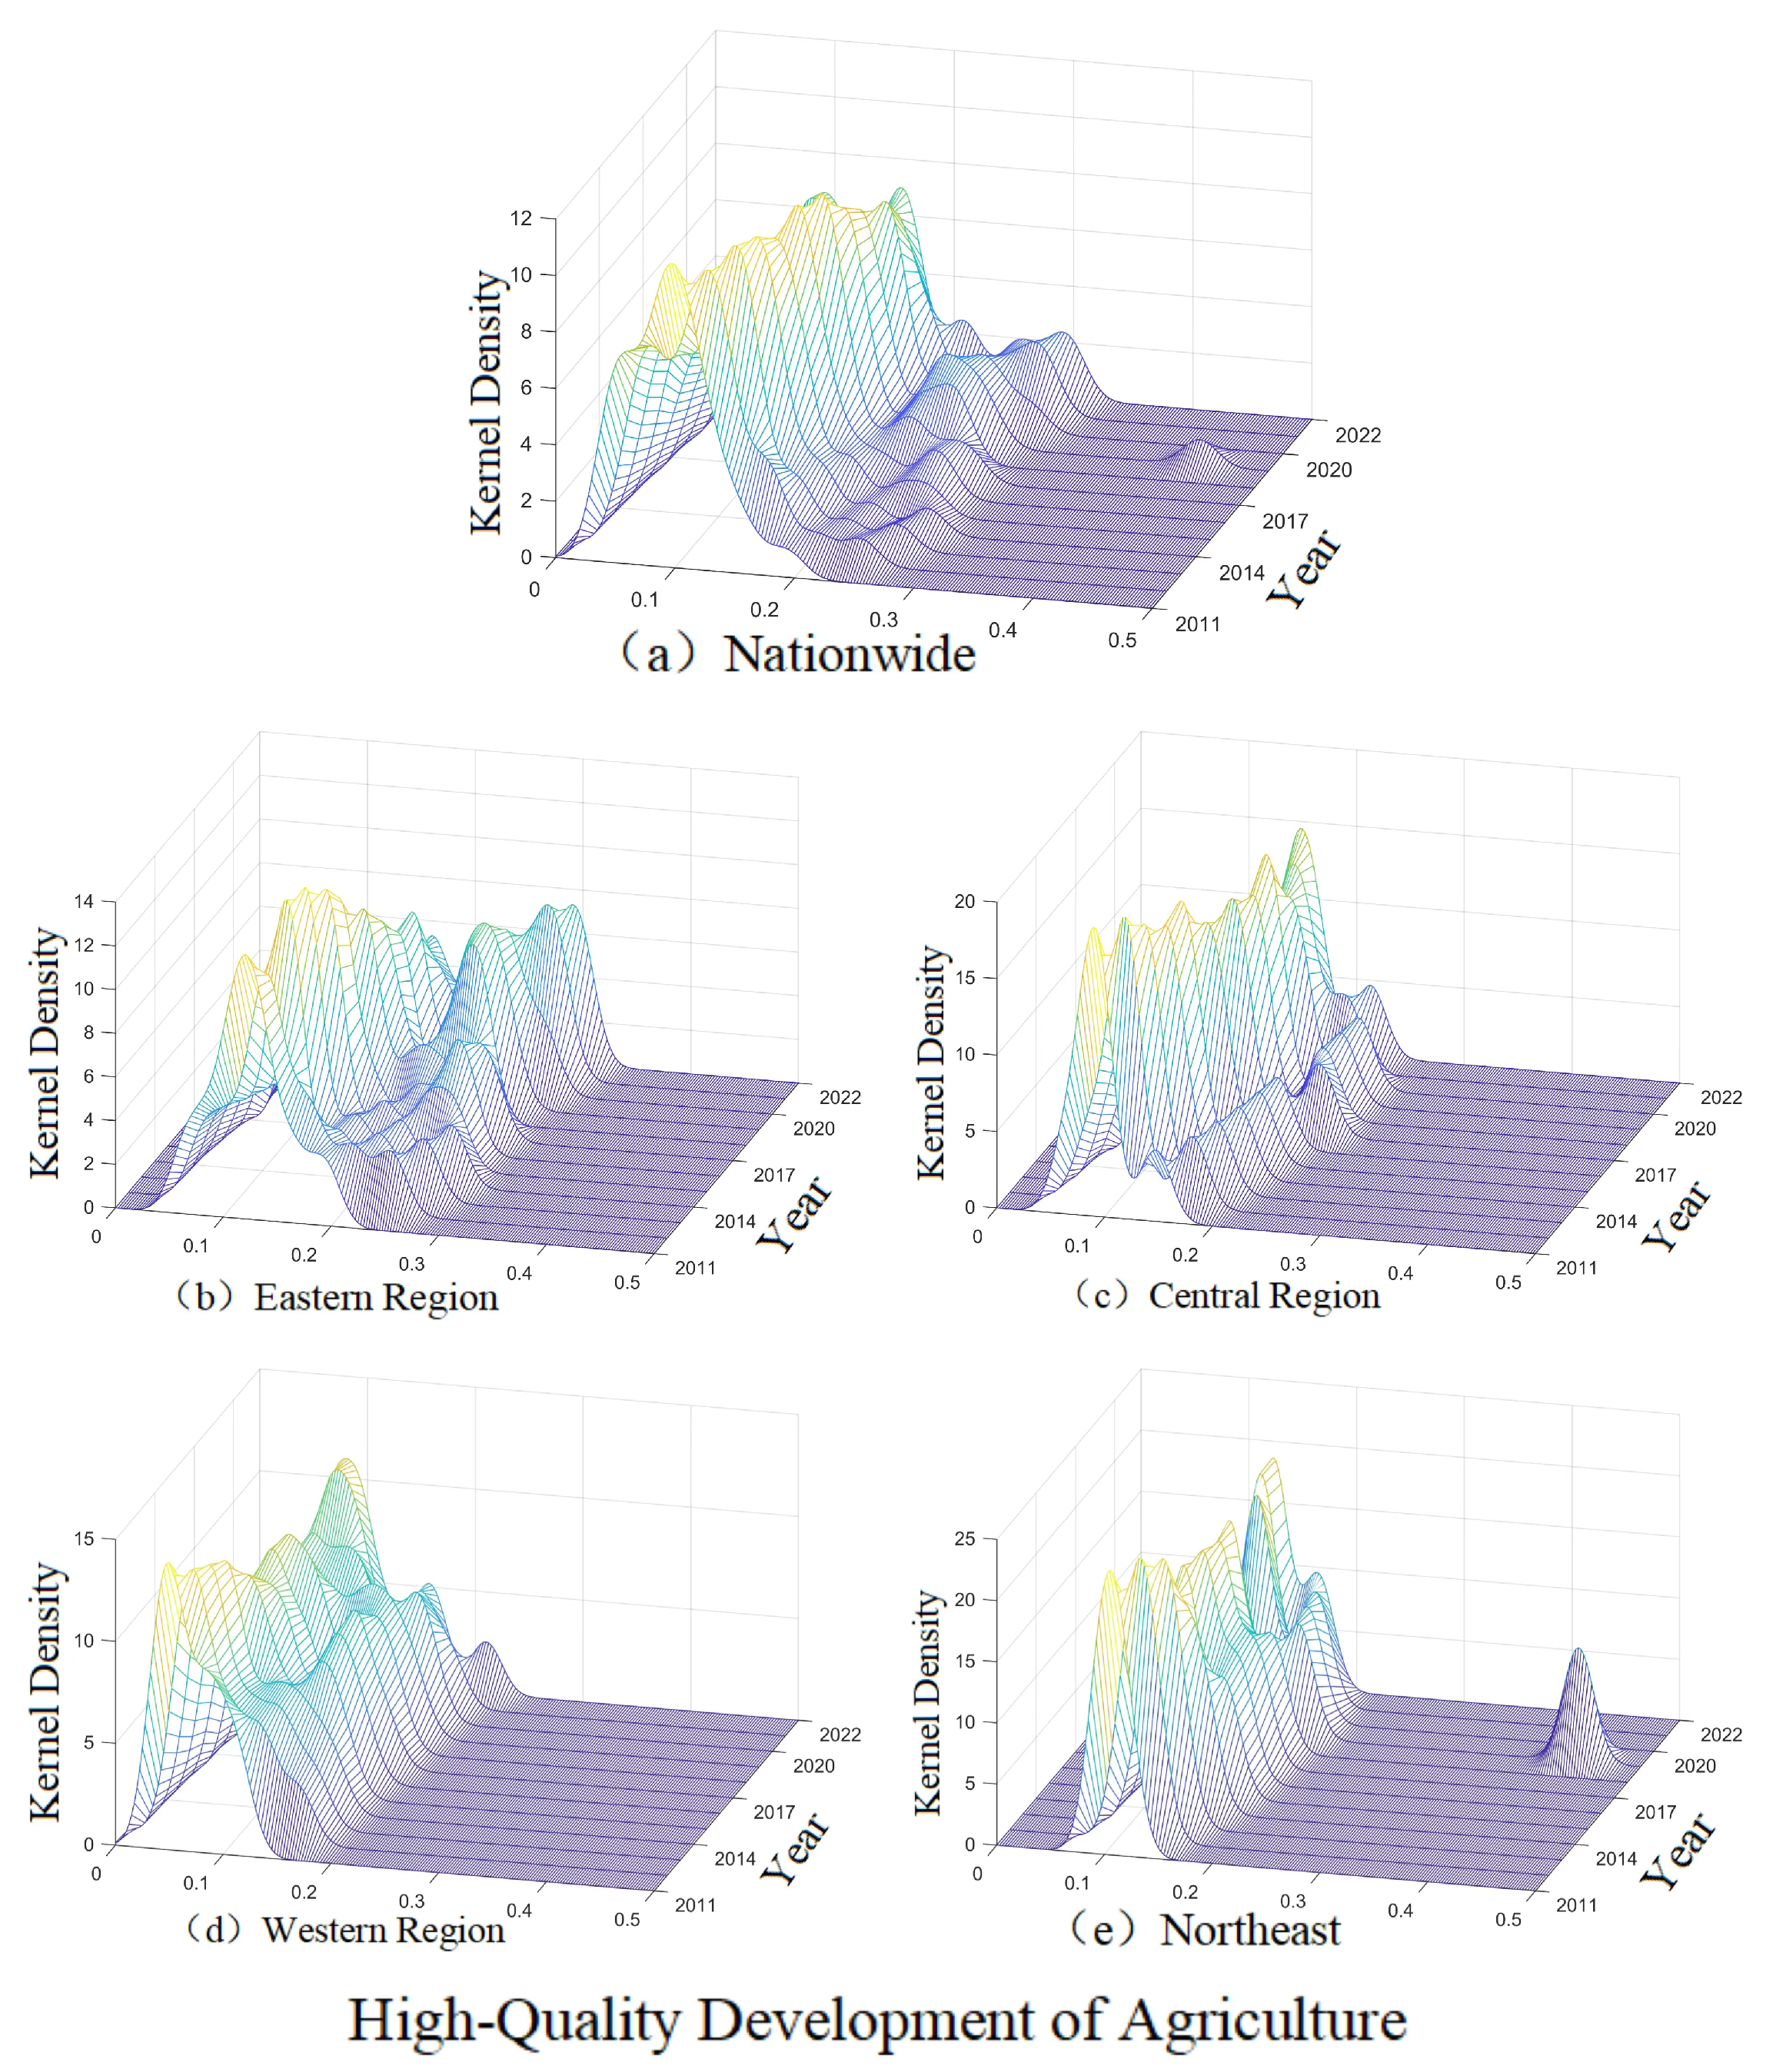
As shown in
Figure 6a, the comprehensive development index of DRC reveals distribution dynamics. The central position of the kernel density curve shifted from right to left over time. Comparing 2011 to 2022, the position initially moved rightward before shifting leftward again. This trend is largely attributed to the January 2021 release of the Outline of the DRC Strategy, which set the goal of establishing a foundational digital rural system by 2025. This policy framework has driven DRC, with economically stronger regions advancing faster during the pandemic, while less developed areas faced greater challenges, worsening regional disparities. Post-pandemic recovery will require a longer stabilization period. The primary peak value declined, and the distribution widened, reflecting increased dispersion driven by pilot projects in advanced regions, such as “digital rural demonstration counties.” Government support for initiatives like Ningxia’s “Smart Village Demonstration Project” (2020) has accelerated progress. Cooperation between Guangdong and Ningxia has also narrowed the digital gap through shared agricultural technology and e-commerce practices.
Figure 6b–e illustrate regional evolution, with peak positions following the national trend and a rightward shift indicating improved resilience. However, regional differences persist: the eastern region shows multiple peaks and growing internal disparities due to varying policy support. For example, Zhejiang and Jiangsu have received substantial backing, while Hebei has seen weaker support.
The central and northeast regions follow a unimodal pattern, with increased dispersion indicating greater access to digital technology and reduced concentration in rural construction. Initiatives like Henan’s “Digital Village Construction Action Plan” (2020) and Anhui’s “Digital Agriculture” plan have driven progress. Hubei and Hunan have promoted digital farmers and agricultural e-commerce. In the western region, both unimodal and bimodal patterns emerge, with broader wave crests reflecting a shift from multipolar to bipolar differentiation. Guizhou’s “Digital Village” initiative (2019) focused on network infrastructure, while Xinjiang’s cooperation with neighboring countries advanced agricultural digital technology. Tibet has progressed through partnerships with inland provinces and external resources.
4.3. Distribution Patterns of HAD
As shown in
Figure 7a, the dynamic distribution of HAD in China from 2011 to 2022 exhibits a clear rightward shift in the nuclear density curve, indicating steady progress. Key drivers include the 2015 Agricultural Product Quality and Safety Law, which enhanced regulatory oversight and standardized production, and national programs such as the “863” and “973” Plans, which spurred technological innovation. Additionally, the 2021 National Agricultural High-Quality Development Conference promoted structural adjustments and technological upgrades, further advancing the sector.
This study analyzes regional disparities in HAD across Chinese provinces using principal component analysis. Results reveal reduced convergence (decreased amplitude of the primary principal component peak), narrowing gaps between top and bottom performers (right-tailed distribution patterns), temporal dependence trends (indicative of spatio-temporal distribution heterogeneity), and a multi-modal pattern of development (multiple wave peaks). The data indicate increased national-level inequalities, driven by the concentration of agricultural science and technology parks in developed coastal regions. Rural e-commerce further facilitates product circulation in Zhejiang and Guangdong, while targeted policies in Hainan and Guangxi encourage modern fruit cultivation practices. In contrast, slower development persists in northwest China, associated with traditional apple and wolfberry farming practices. The narrowing regional gap (right-tailed distribution) is attributed to the 2018 rural revitalization initiative and the “Three Regions and Three States” poverty alleviation measures, which have enhanced resource allocation efficiency for Tibet’s agricultural modernization.
Figure 7b–e illustrate the dynamic evolution of HAD across China’s three regions: the eastern region exhibits oscillatory growth with rising and falling peaks, driven by policy support and technological advancement (e.g., Zhejiang’s green agricultural products gaining favor); the central region shows stable polarization due to political initiatives and market demands (e.g., Henan’s grain production fostering a robust agricultural sector); the western region displays bimodal trends reflecting internal inequality; and the northeast region exhibits multi-peak dynamics, with Liaoning’s focus on modern technologies accelerating growth compared to Heilongjiang, which lags behind. The kernel density curve clearly shows a significant peak in 2020, with the corresponding index value concentrated around 0.25. This indicates that the level of high-quality agricultural development across most regions is clustered within a specific range, showing a "middle agglomeration” pattern. First, the concentrated release of national policies—such as the “Five Action Plans for Agricultural Green Development” and the “High-Standard Farmland Upgrading Project”—provided strong policy support for underdeveloped regions, accelerating their development convergence. Second, the implementation of the Outline for the Digital Rural Development Strategy and the rapid deployment of digital agriculture projects narrowed the development gap between regions, contributing to uniform improvements. Third, the COVID-19 pandemic accelerated agricultural digitalization, forcing regions to adopt digital platforms and intelligent technologies, which further promoted convergence in development levels. Additionally, the 2020 dataset had high integrity, sufficient valid samples, and consistent statistical standards, enhancing the reliability of the kernel density estimation. The possible completion of indicator data collection in some regions that year may have also contributed to the increased density within the corresponding interval, resulting in the observed peak.
4.4. Degree of Coupling Coordination
The coupling coordination analysis integrates subsystem metrics into computational models to analyze the spatial distribution of coordinated development between DRC and HAD. This assessment covers several key steps: defining subsystems (C1–C5 for digital rural construction; C6–C10 for agricultural high-quality development) and calculating coupling coordination degrees, as well as determining coupling linkage and coordination types. Using data from 2013, 2016, 2019, and 2022, the analysis evaluates the development trends of both subsystems across China’s 31 provinces. The results are visualized using ArcGIS tools to create spatial distribution maps (
Figure 8 and
Figure 9), which highlight the coordinated growth patterns between DRC and HAD over time, providing insights into their interdependence and overall system behavior.
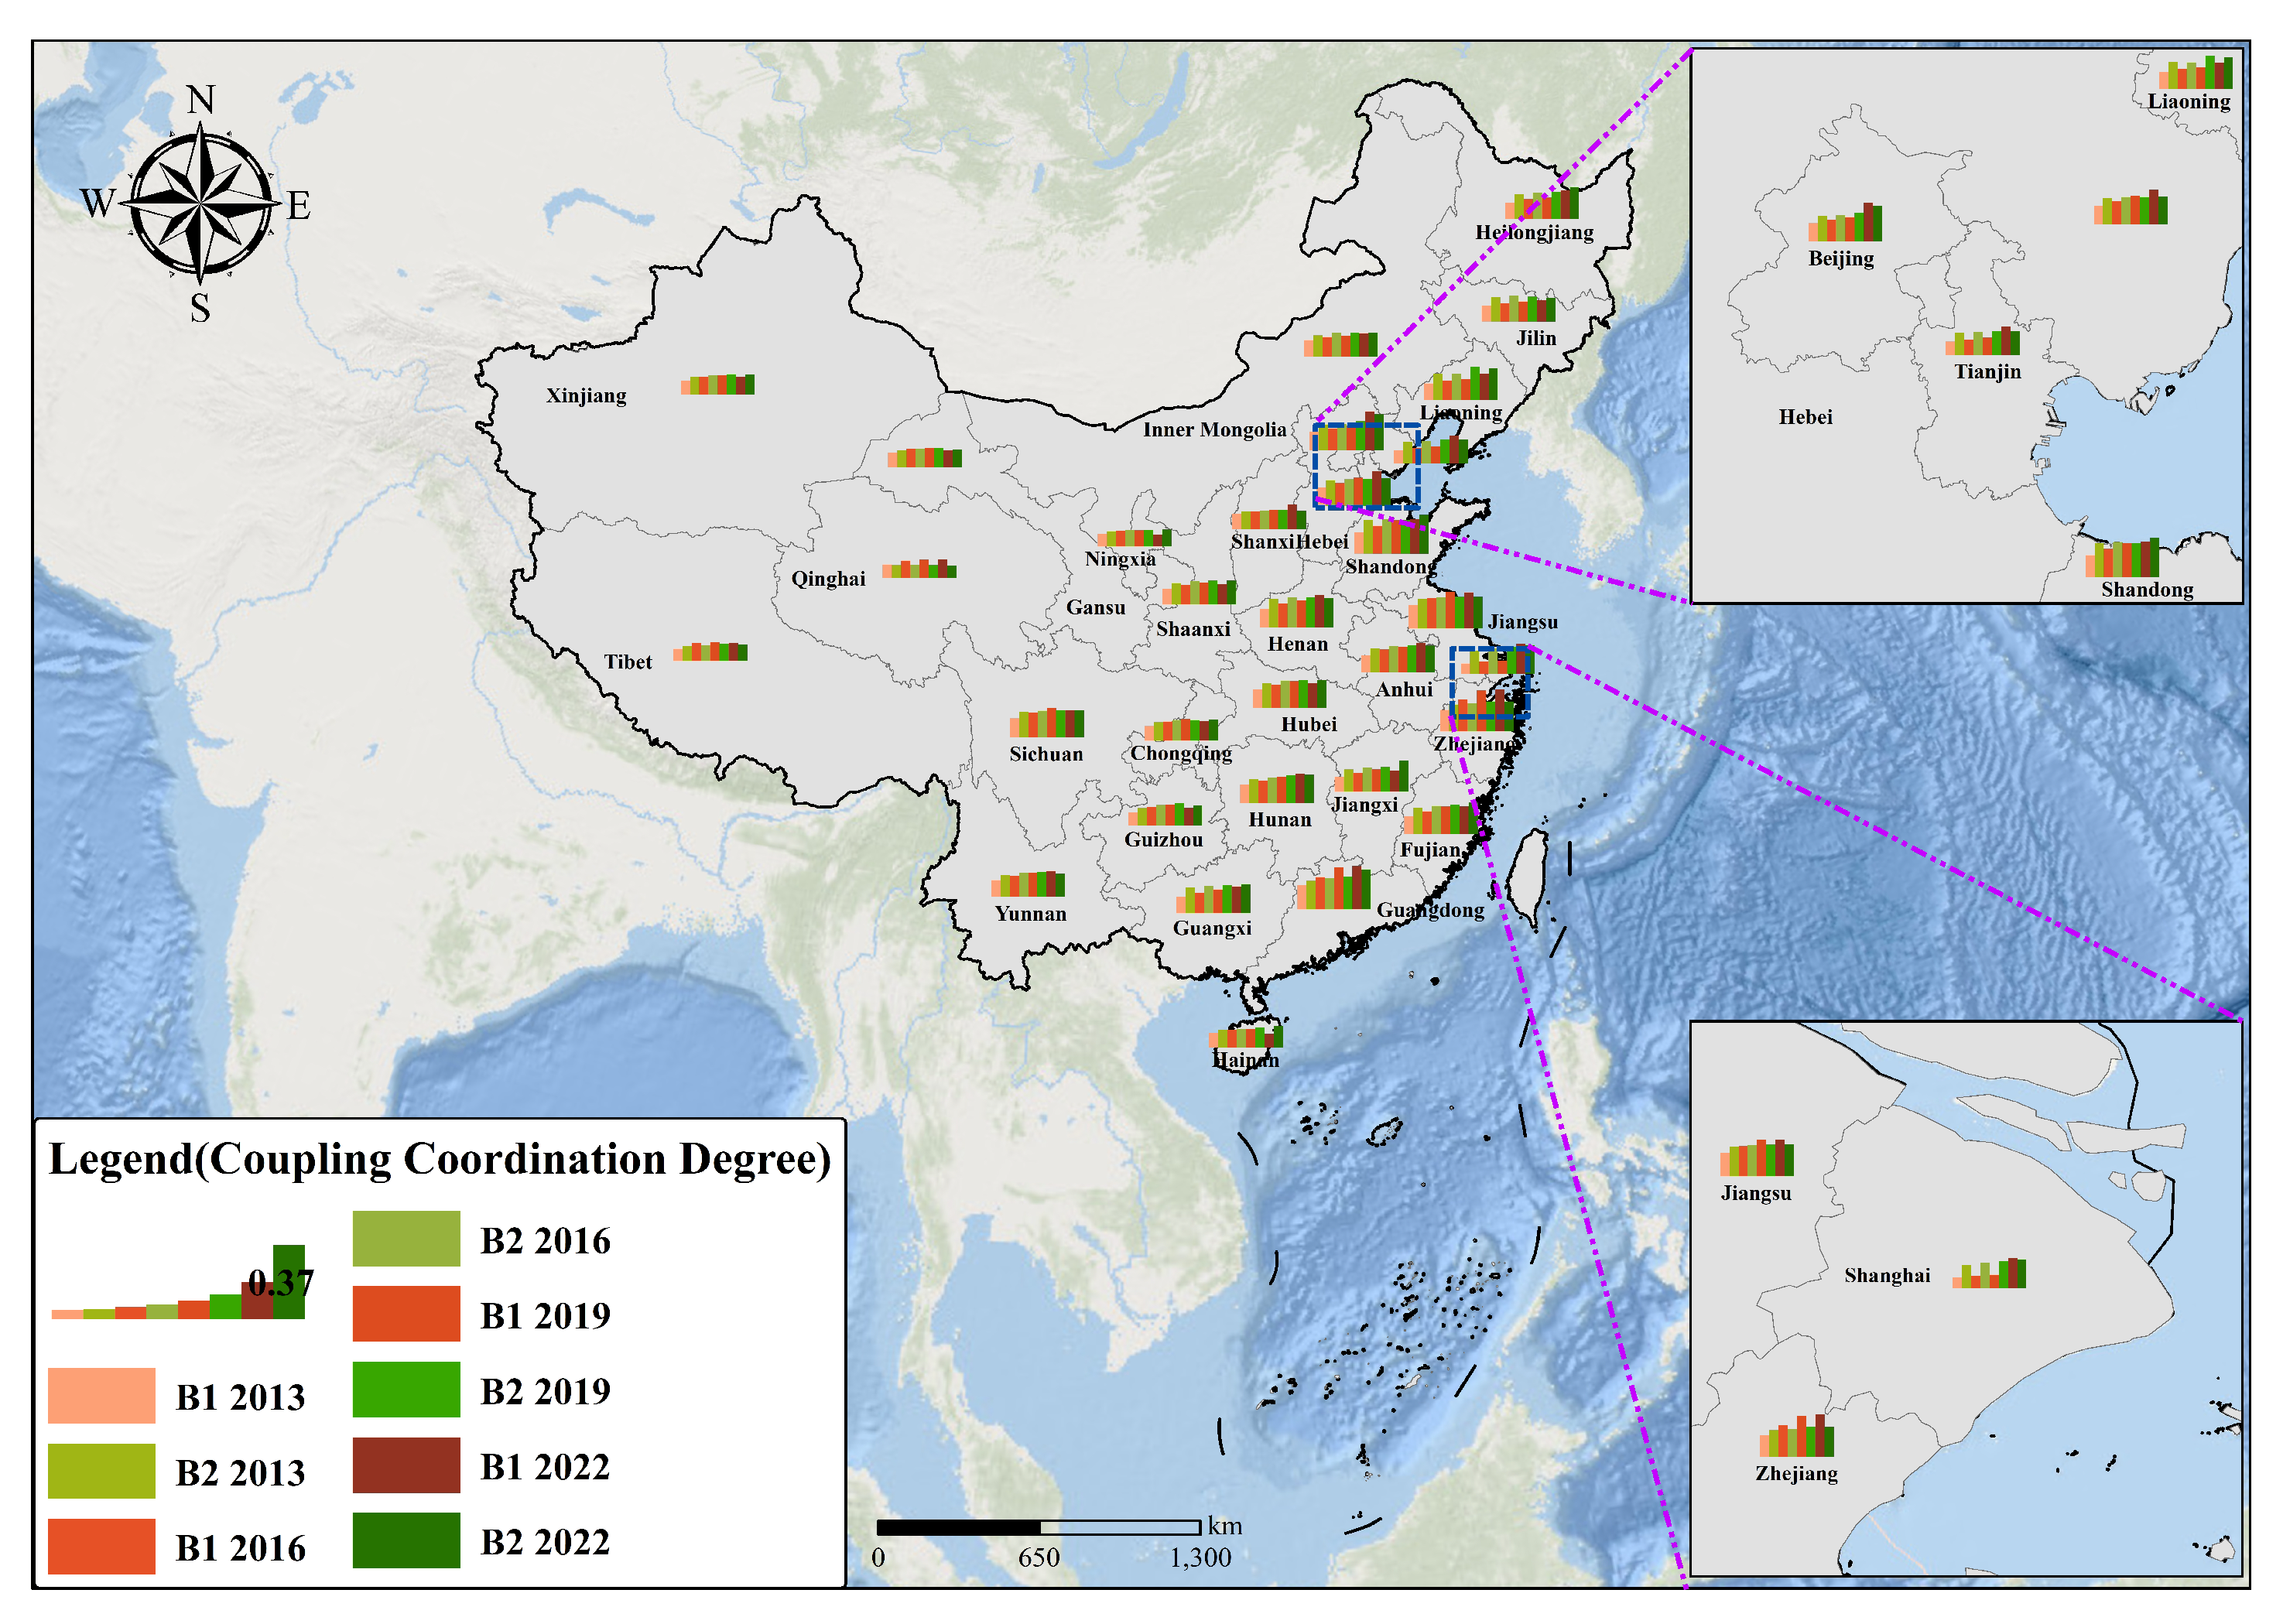
From 2011 to 2022, subsystem B1 (DRC) demonstrated consistently high coupling development, with an average coordination degree of approximately 0.9, rising from 0.817 to 0.851 during this span, relative growth rate of 4.160%. In contrast, subsystem B2 (HAD) displayed a lower average coordination degree ( 0.7), increasing from 0.586 to 0.665 over the decade, indicating steady yet insufficient progress. The figures reveal that subsystems’ coupling performance varied geographically: subsystem B1 showed enhanced development in eastern regions compared to western areas during this period. During 2011–2022, subsystem B1 exhibited particularly high coordination in 2022.
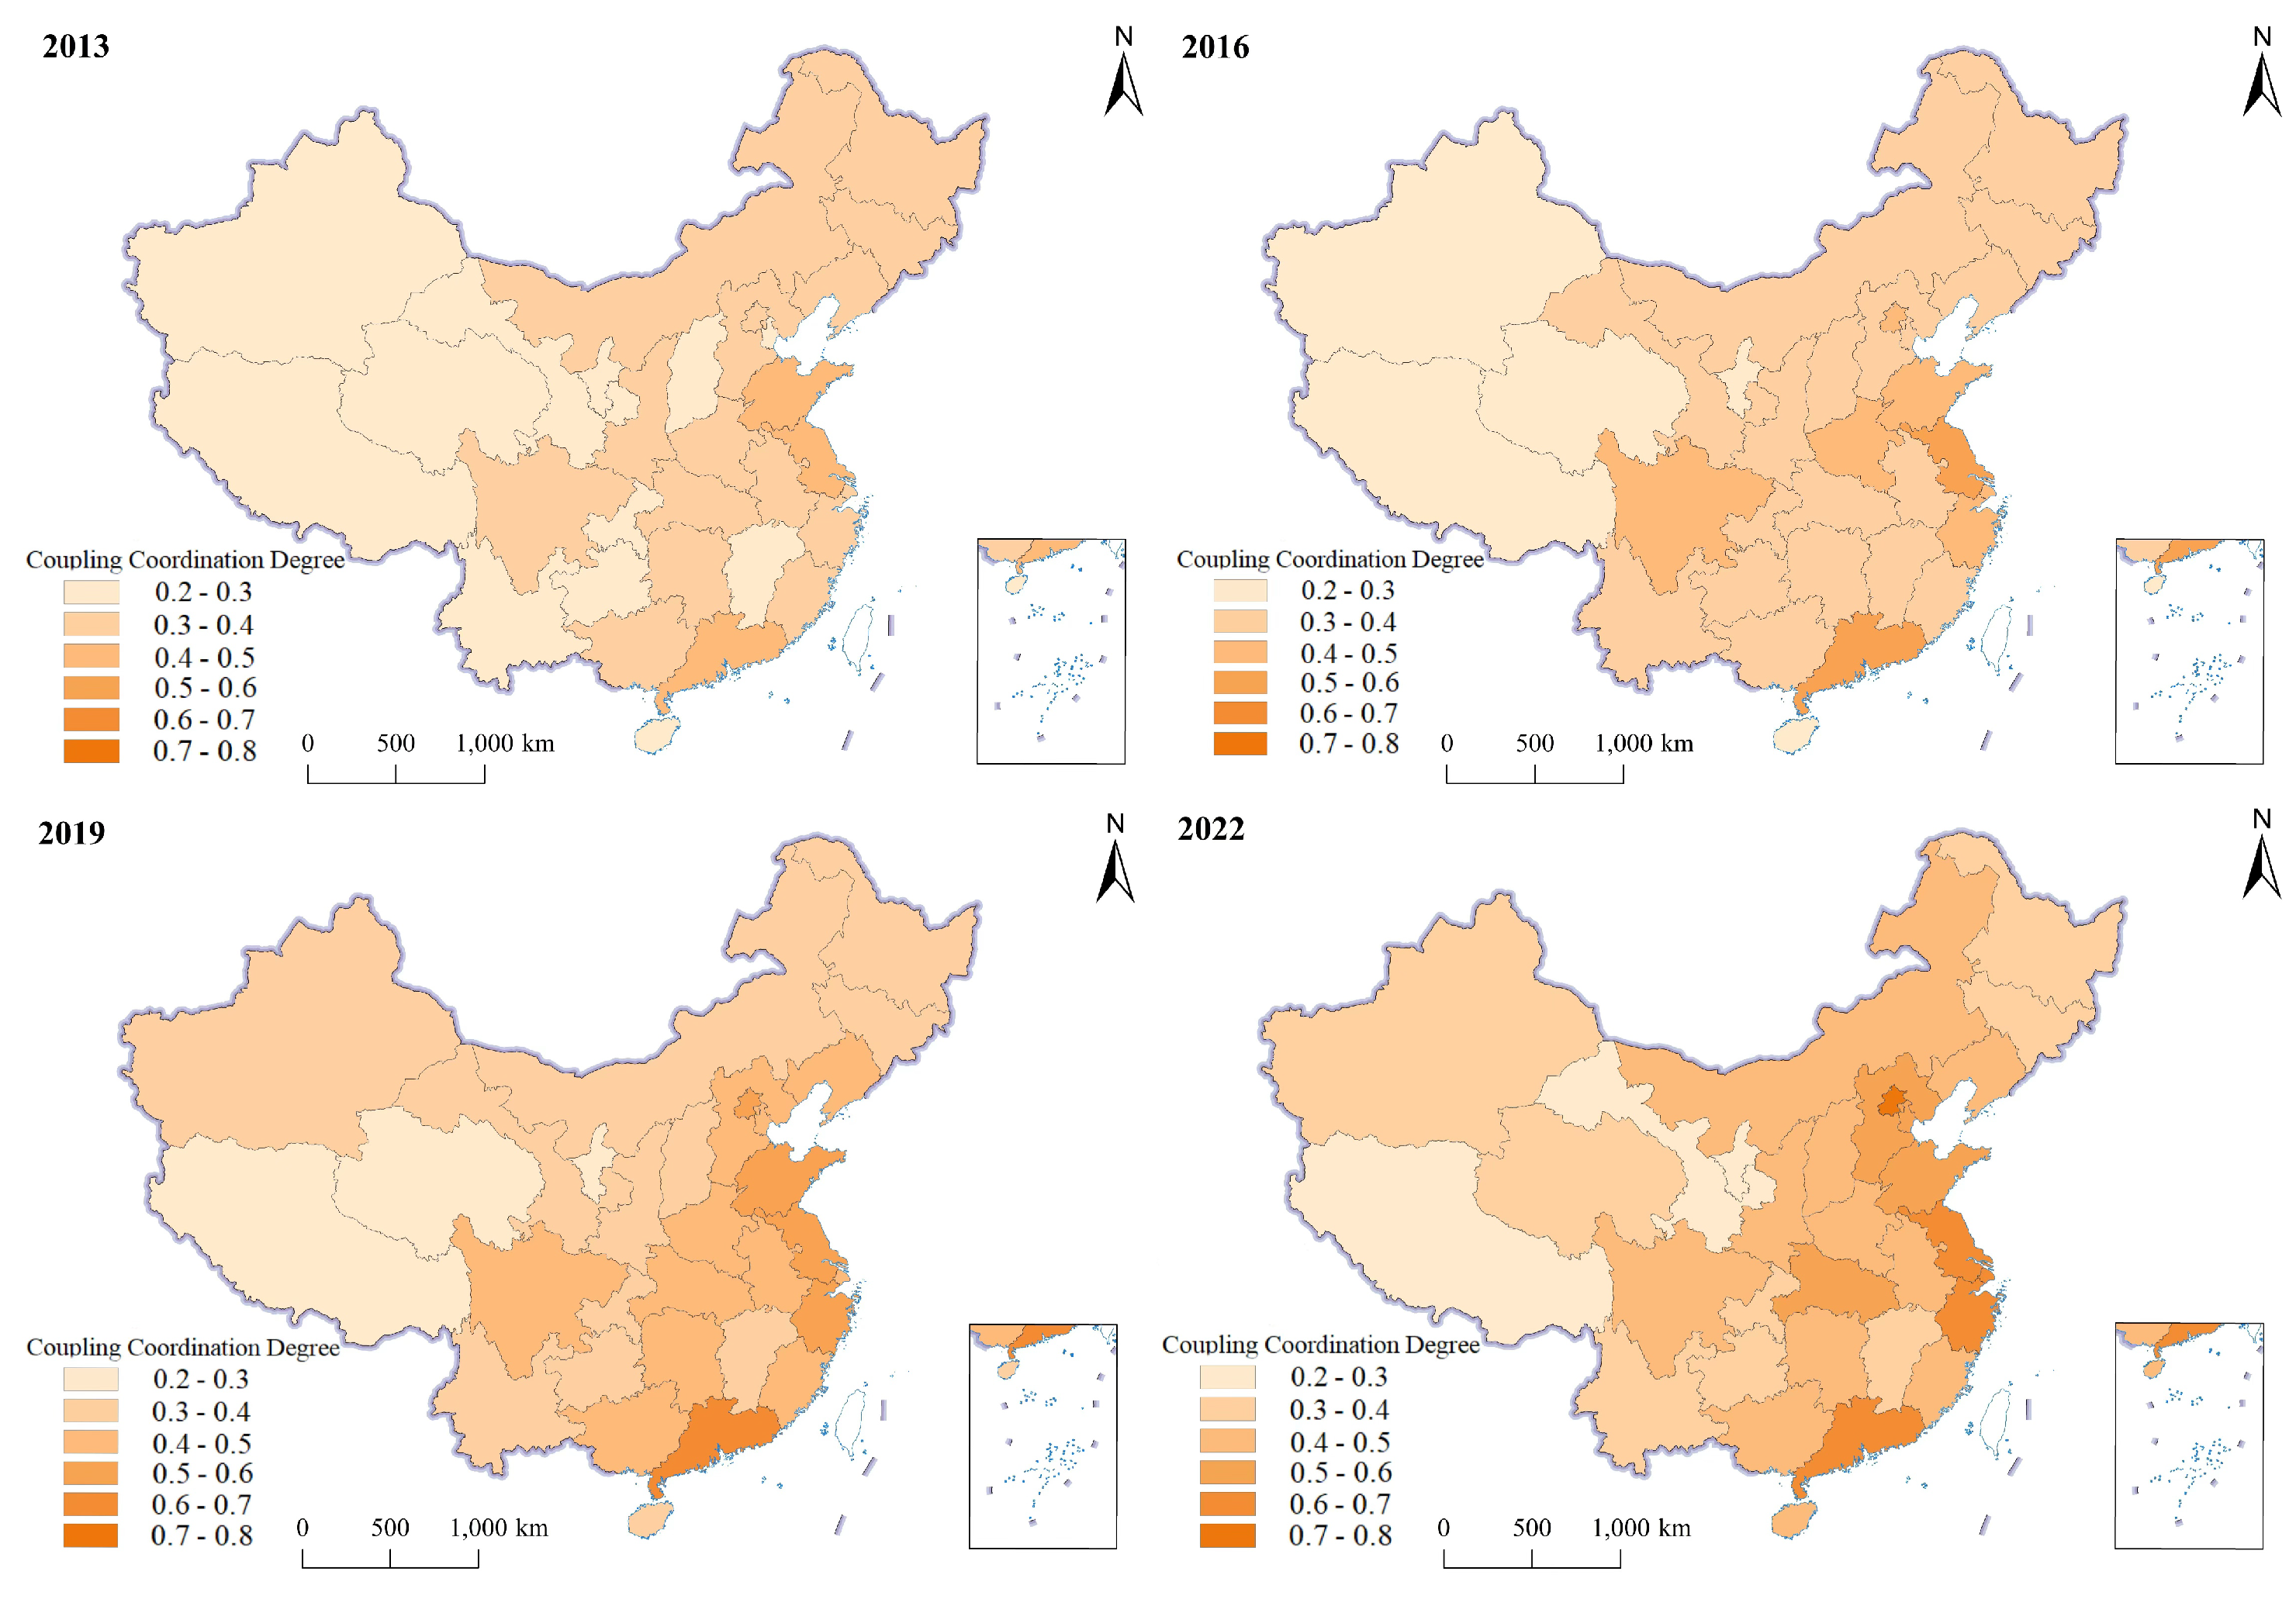
Figure 8 illustrates the spatial evolution patterns of the coupling coordination degree between B1 and B2 across Chinese provinces from 2011 to 2022. Overall, the coupling coordination level exhibits a distinct spatial gradient characterized by “high in the east and low in the west, with coastal areas outperforming inland regions”. From a national perspective, the bar charts for most provinces show a clear trend of increasing height and deepening color over time, indicating that the coordination between B1 and B2 has been steadily improving year by year. Notably, in 2022, the coupling coordination degree in most provinces reached a local peak, reflecting the concentrated policy effects during the 14th Five-Year Plan period. In developed eastern coastal regions, such as Jiangsu, Zhejiang, Shanghai, Guangdong, Beijing, and Shandong, the bars in the chart are consistently high and dark-colored in 2022. This suggests that these regions demonstrate the highest level of coordination, with digital village construction and agricultural system development progressing in a highly synchronized manner, reflecting the leading role of “digital empowerment of modern agriculture”. In contrast, provinces in the central and western regions, as well as border areas—such as Qinghai, Tibet, Ningxia, Xinjiang, Guizhou, and Gansu—still display short and lightly colored bars in 2022. This indicates that these regions face bottlenecks in either digital village construction or high-quality agricultural development, resulting in a relatively lagging level of coupled development. Meanwhile, central provinces such as Hunan, Jiangxi, and Anhui exhibit a clear “catch-up” trend, with a notable increase in their coupling coordination degree in 2022. This suggests that policy interventions and infrastructure improvements during the 14th Five-Year Plan period have yielded significant positive effects.
However, the majority of western provinces fell short (e.g., Gansu achieved a coordination degree of only 0.441), attributed to factors such as pandemic-induced economic downturns affecting financial revenues and investment delays for rural construction. To address these challenges, targeted policy reforms are essential to bolster support in economically disadvantaged regions like Gansu, Qinghai, and Ningxia. Integration of local industries (e.g., agriculture and tourism) with digital transformation strategies could enhance agricultural sustainability. Coastal provinces showed positive trends due to structural reforms (2015 document), promoting supply-side optimization and market alignment. Tibetan regions faced significant challenges: weak economic and agricultural foundations and poor risk management during the pandemic, leading to slower coordination growth (B2 coordination degree at 0.449 in 2022). These challenges were exacerbated by lockdowns, transportation restrictions, labor shortages, and disruptive farming practices. To address these issues, emphasizing support for agricultural innovation through technology investment, farmer training, digital infrastructure development, and multi-sectoral coordination is critical. Regional cooperation should be promoted to share best practices and drive coordinated regional development.
Couplings reveal the relationship between B1 and B2. The coupling degree increased from 0.925 in 2011 to 0.985 in 2022; the relative growth rate was 6.486%, indicating a stronger correlation. From 2011–2022, B1 and B2’s coupling coordination also rose, remaining below the coupling degree itself.
Figure 9 shows low coordination across provinces, reflecting regional disparities. Provinces varied from “moderate disorder” to “intermediate coordination,” with only one reaching full coordination by 2019, some barely coordinated, and many near imbalance. Recent data (2016–2022) show improvements in primary coordination for six provinces, while others remain underdeveloped or face nearly imbalanced conditions. To improve this, investing in digital infrastructure alignment with agricultural needs, leveraging tech like IoT devices and digital platforms, and generating partnerships to ensure effective resource allocation and innovation growth are key steps.
4.5. SD-LSTM Combined Model Prediction
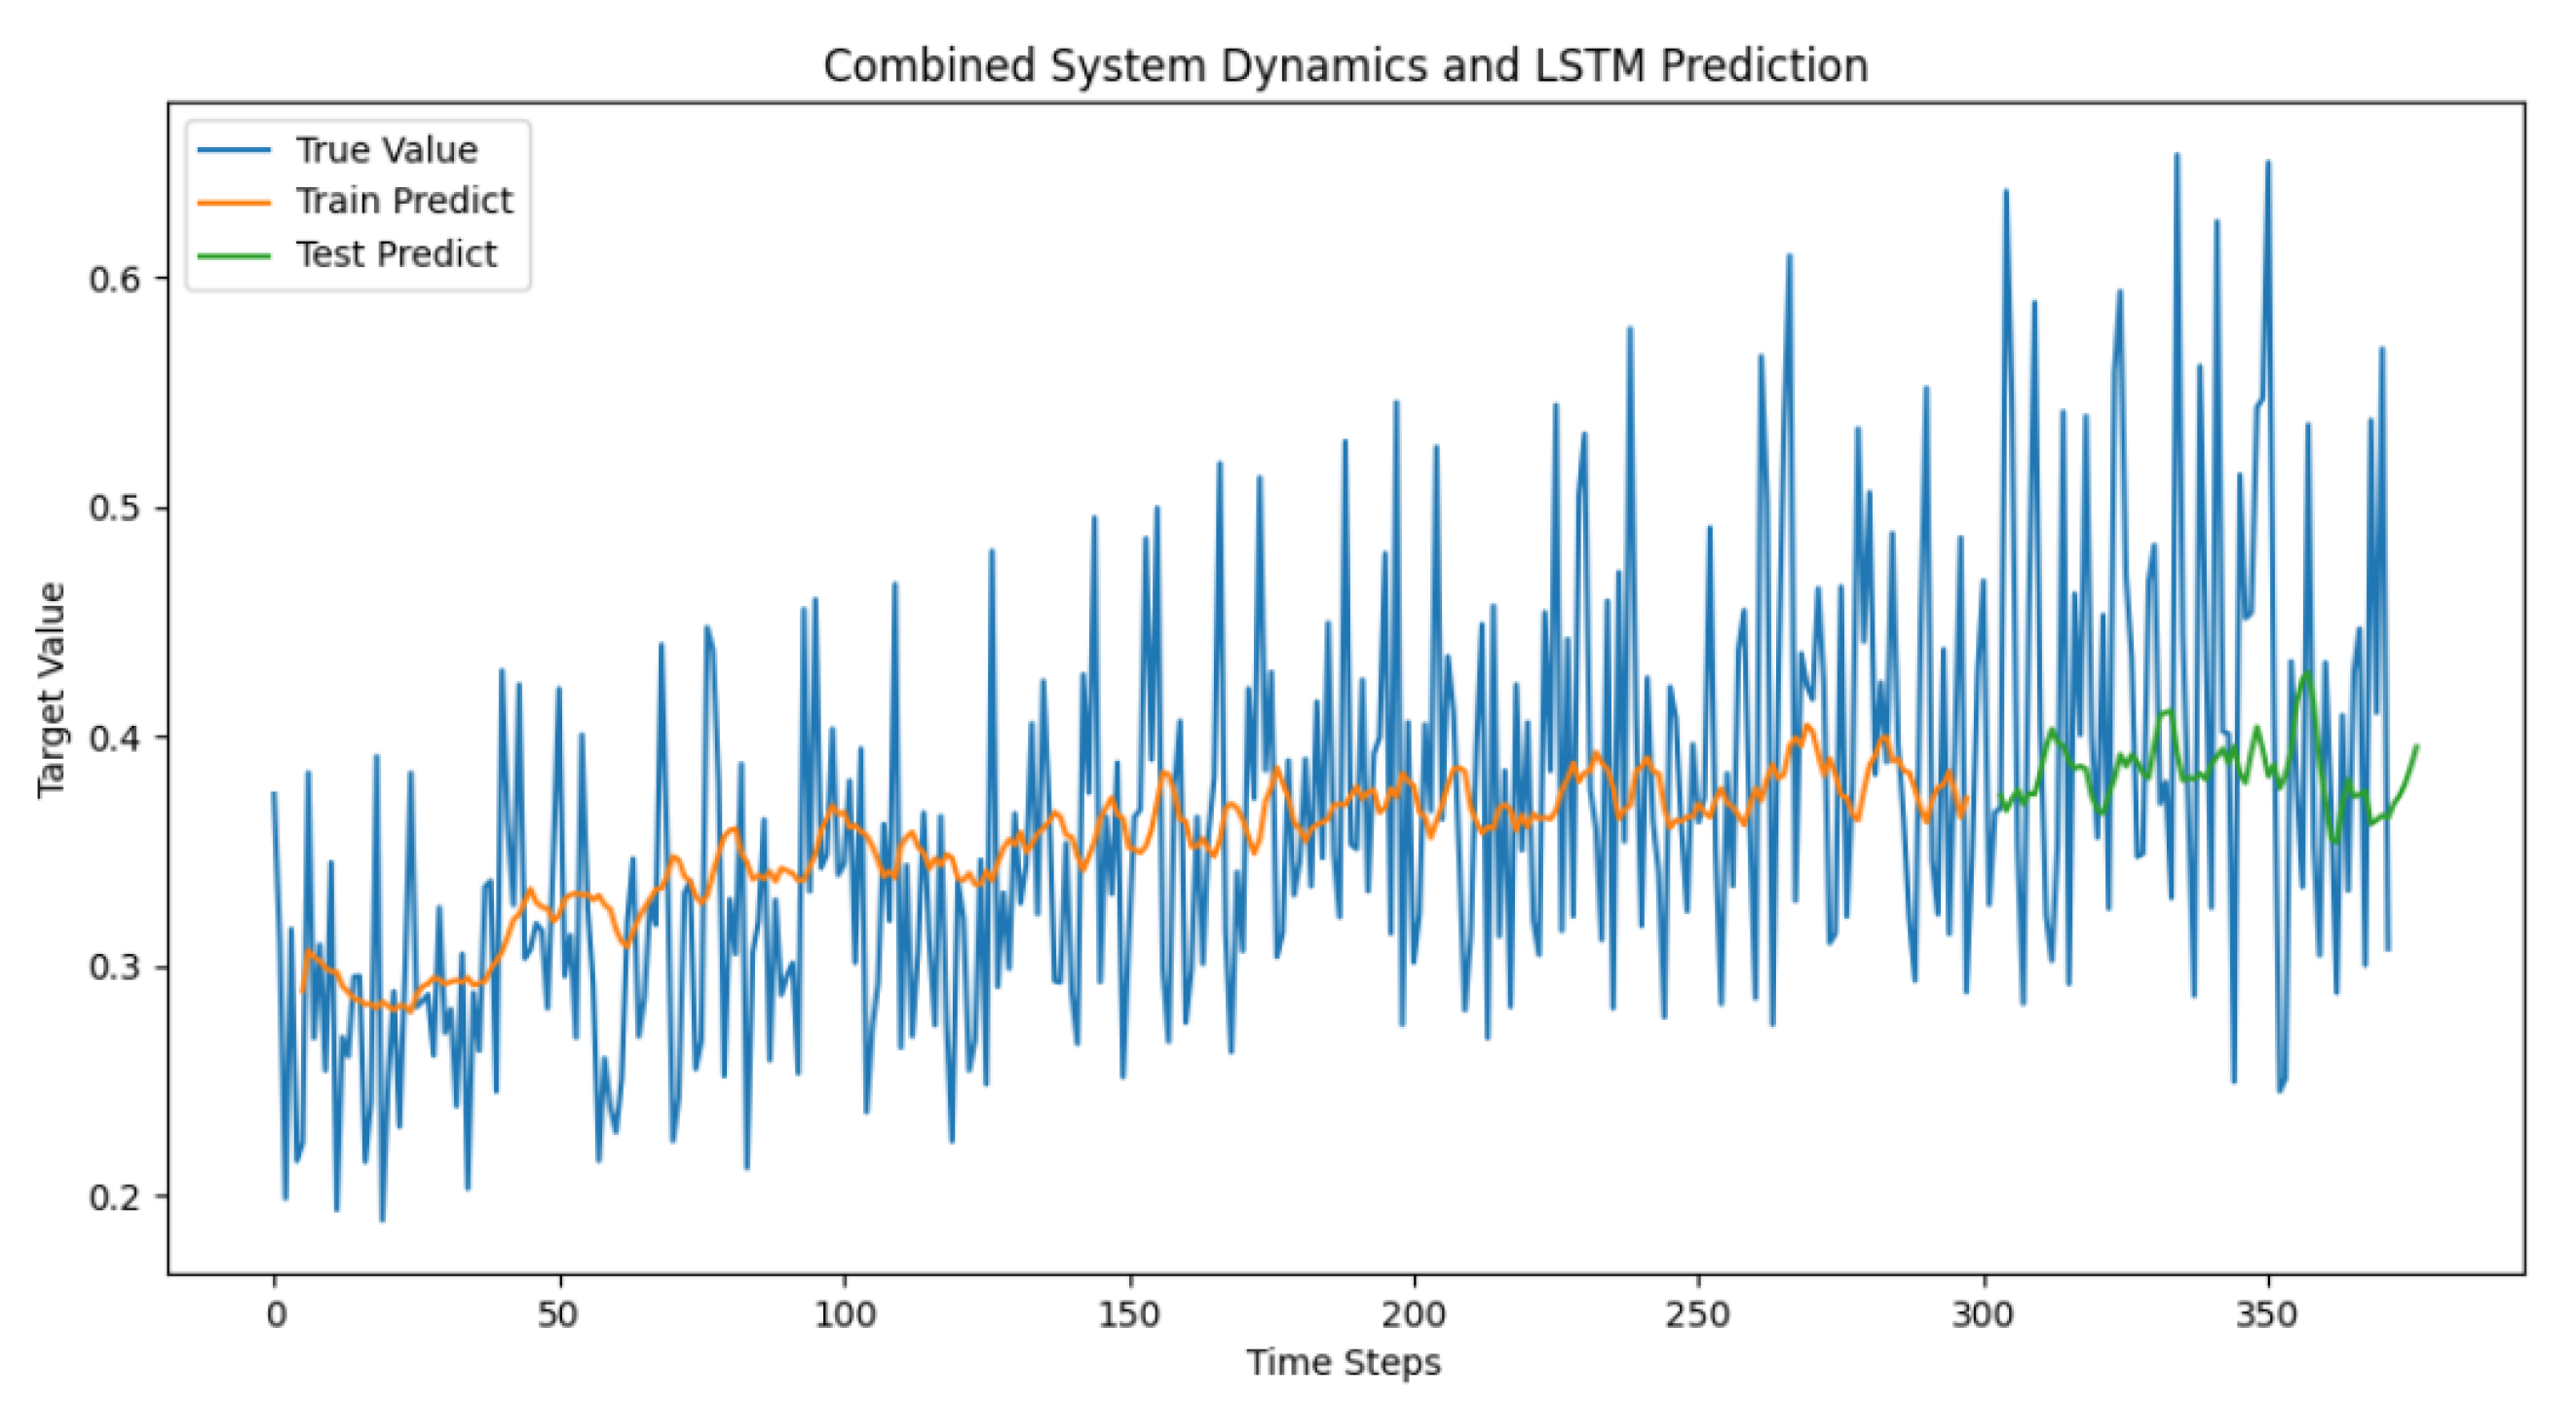
To further assess the trend in coupling coordination between China’s DRC and HAD, we employed an SD-LSTM hybrid model to dynamically forecast coupling coordination degrees from 2023 to 2028. We evaluate and compare the fitting capabilities of an SD model, an LSTM network, and their integration in the SD-LSTM framework as detailed in
Table 4. The predicted evolution is presented in
Table 5, with optimal results achieved by the SD-LSTM model. Figures demonstrate how these coupling degrees have been mapped between 2011-2022, aligning national predictions and actual values (
Figure 10 and
Figure 11).
The performance comparison between the SD-LSTM integrated model and individual models (SD or LSTM) reveals superior predictive accuracy for the former. Specifically, the RMSE value of 0.006 (SD-LSTM), MAE value of 0.000, and MAPE value of 1.032% demonstrate significantly improved prediction precision compared to the SD model (RMSE: 0.039, MAE: 0.036, MAPE: 8.148%) and LSTM model (RMSE: 0.024, MAE: 0.001, MAPE: 4.574%). These metrics collectively confirm that the SD-LSTM integrated model not only captures coupling coordination dynamics more accurately but also offers enhanced stability in both fitting and prediction.
According to the prediction results in
Table 4, from 2023 to 2028, the coupling and coordination between China’s DRC and HAD will maintain the overall evolutionary trend observed from 2011 to 2022, showing a stable and gradual upward trajectory. The coupling coordination will transition from the “primary coordination” stage to the “good coordination” stage. This trend not only reflects the deepening interdependence of the two systems but also highlights the growing significance of their interaction in policy synergy, resource allocation efficiency, and innovation-driven mechanisms. The system’s endogenous evolutionary capacity continues to strengthen, with considerable potential for collaborative growth and optimization.
The predicted results further indicate that 2024 and 2028 will mark key turning points in the evolution of the coupling coordination: (1) 2024 milestone: The coupling coordination degree is expected to surpass the “primary coordination” threshold, entering the “intermediate coordination” phase. This phase marks a breakthrough in digital rural infrastructure development, characterized by substantial improvements in the synergy between agricultural green development and industrial modernization, resulting in a more stable and collaborative development stage. (2) 2028 milestone: As digital integration, institutional reforms, and innovative mechanisms further advance, the coupling coordination degree is projected to leap from “intermediate coordination” to “good coordination.” This shift not only reflects the maturation of the collaborative coupling mechanism but also signals the systematization, intelligence, and platformization of policy support, technological empowerment, and industrial integration.
Based on these insights, it is recommended that policymakers closely monitor the phased characteristics of these critical turning points, especially as the coupling coordination degree transitions from primary to intermediate and from intermediate to good levels. Policymakers should assess the current state of coupling coordination and identify the core elements influencing the improvement of coordination within the system. Preemptive policy guidance and resource allocation mechanisms should be deployed, including enhancing rural data sharing mechanisms, dismantling information barriers, and establishing a unified “rural big data platform” to address the “data silo” issue across agricultural subsystems. Furthermore, collaboration among local governments, enterprises, research institutes, and cooperatives should be encouraged to develop agricultural data standards and classification management frameworks. Strengthening the “ground–air–end” multidimensional data collection system and improving real-time feedback capabilities throughout the agricultural process will enable intelligent analysis and prediction of the entire agricultural value chain—resources, production, circulation, and sales. This, in turn, will enhance decision-making efficacy, contributing to the synergistic advancement of both digital rural construction and high-quality agricultural development. Note: The predictions and their implications are based on the provided content; actual application may require additional context or data from
Table 4.
5. Discussion
5.1. Advancements in Research and Insights
This study makes several key contributions compared to the existing literature [
37,
38]. First, it develops a more comprehensive evaluation index for DRC and HAD, incorporating factors such as agricultural R and D investment, e-commerce participation, digital service levels, and rural network investments. Building on the work of Yupan Zhao [
37], this research highlights DRC and agricultural modernization as critical indicators. The findings show steady progress in China’s DRC and agrarian modernization, with the coupling coordination shifting from imbalance to primary coordination. However, as modernization and digital transformation continue, prioritizing HAD becomes increasingly important. Second, this study employs a novel machine learning approach, combining SD with LSTM, to enhance the accuracy of predicting the coupling coordination of DRC and HAD [
39]. Finally, the paper offers targeted policy recommendations for promoting green and sustainable agricultural development in China, with significant implications for research on the coupling and coordination of DRC and HAD.
5.2. Analysis Results
The comprehensive development index for DRC reveals several key insights from both temporal evolution and distribution dynamics. Temporally, the index (B1) steadily increased from 0.071 in 2011 to 0.247 in 2022; the relative growth rate is 247.887%, indicating consistent progress. From a distribution perspective, key trends emerge: First, the central position of the kernel density distribution curve shifts rightward, reflecting overall improvement in DRC. Second, while the peak value fluctuates and decreases, its width increases slightly, suggesting greater dispersion and widening regional disparities. Third, the distribution becomes right-skewed, signaling a narrowing gap between the highest (Guangdong) and lowest (Ningxia) levels of DRC. Additionally, a multi-peak pattern emerges, indicating gradient differentiation with pronounced multi-polar characteristics. Regional variations are apparent: the eastern region shows multiple peaks with a wider wave crest, indicating increasing internal disparities, while the central and northeastern regions predominantly exhibit unimodal patterns, reflecting a decline in concentration and greater variability. The western region, exhibiting both unimodal and bimodal patterns, signals a shift from multi-polar to bipolar differentiation and reduced internal disparities.
The analysis of the comprehensive index for HAD reveals several key insights. From 2011 to 2022, the agricultural development index (B2) consistently grew from 0.095 to 0.159; the relative growth rate is 67.368%. While growth has been steady, regional development variation has remained minimal. Distribution dynamics indicate a rightward shift in the kernel density curve, signaling progress toward higher agricultural quality. However, the primary peak has decreased in height and widened, suggesting growing dispersion and widening regional disparities. The right-tailed distribution reflects a narrowing gap between high (e.g., Jiangsu) and low (e.g., Xizang) agricultural quality. A multi-peak distribution points to regional differentiation in development. At the regional level, the eastern region has seen significant progress in optimizing agricultural structures, transitioning from a narrow to a broader peak. The central region exhibits a stable double-peak distribution, while the western region shows unimodal and bimodal patterns, signaling increasing internal disparities. Northeast China presents a multi-peak pattern, reflecting polarized development, particularly as Liaoning advances, widening the gap with Heilongjiang.
The coupling coordination degree between DRC and HAD shows a steady increase from 2011 to 2022. The coupling degree for the DRC subsystems averaged 0.9, with the degree between C1C5 rising from 0.817 in 2011 to 0.851 in 2022; the relative growth rate is 4.160%, indicating strong coupling. The coupling degree for the HAD subsystems averaged 0.7, with a notable increase from 0.586 in 2011 to 0.665 in 2022; the relative growth rate is 13.484%. The coupling degree between the two systems increased from 0.925 in 2011 to 0.985 in 2022; the relative growth rate was 6.486%, demonstrating a high and rising interaction. The spatial distribution of coupling exhibits a decrease from east to west, reflecting the trend of “high coupling and low coordination.” Regionally, the narrowing spatial gap suggests positive progress in coordinated development across China’s provinces.
The SD-LSTM hybrid model demonstrates strong predictive performance, achieving an RMSE of 0.006, MAE of 0.000, and MAPE of 1.032%. The coupling coordination between DRC and HAD growth exhibits a steady upward trajectory from 2023 to 2028, transitioning from primary to intermediate coordination. By 2028, the coordination level is projected to surpass the intermediate stage, entering a phase of good coordination.
5.3. Countermeasures and Suggestions
Using the entropy method, kernel density estimation, and models of coupling degree and coupling coordination degree, this study constructs an evaluation index system to assess the coupling between DRC and HAD across 31 Chinese provinces from 2011 to 2022. Integrating SD and LSTM, the coupling coordination trend from 2023 to 2028 is also projected. Results reveal a spatial gradient of diffusion from eastern to central and western regions, with disparities in coordination primarily driven by regional development imbalances. Accordingly, the following policy recommendations are proposed:
Strengthen Digital Foundations and Enhance Drivers of Agricultural Quality.
To address regional disparities, digital infrastructure investment should be optimized. The eastern region should enhance the integration of rural 5G, smart sensors, and big data platforms to consolidate its lead in smart agriculture. The central region should accelerate urban–rural network integration, develop full-chain agricultural traceability systems, and improve market transparency. In the western region, efforts should focus on resolving last-mile connectivity, promoting affordable IoT adoption, and applying satellite remote sensing in agricultural and pastoral zones. Additionally, digital literacy training for farmers should be scaled up. Drawing on Zhejiang’s “Agricultural Technology Cloud” model, regional digital service centers should be established to provide tailored guidance, early warnings, and market intelligence, thereby supporting data-driven agricultural decision-making.
Enhance Technology Transfer Mechanisms and Bridge the Urban–Rural Digital Divide.
A transformation system for agricultural, scientific, and technological achievements should be established, centered on the model of “university–local collaboration, base demonstration, and farmer adoption.” In the central and eastern regions, universities and leading enterprises should form industry–academia–research–application consortia. Training of extension personnel should be intensified, and large-scale deployment of smart machinery, drones, and automated irrigation systems promoted. In the western region, local universities, research institutes, and agri-tech stations should support technology incubation platforms for regional adaptation and demonstration. Adoption barriers for farmers and cooperatives should be lowered through targeted subsidies, loans, and tax incentives. Regular regional agricultural tech expos should also be held to foster interaction between farmers and enterprises, enhancing grassroots understanding and uptake of digital technologies.
Leverage Eastern Leadership to Foster Interregional Integration of Digital Agriculture.
The eastern region should consolidate its policy and practical experience in integrating DRC with HAD, develop a standardized, replicable case base—focusing on smart cultivation, digital traceability, and e-commerce-based agricultural sales—and transfer mature models to central and western regions through mechanisms such as counterpart assistance and pilot policies. Given the western region’s weaker agricultural base and logistical constraints, priority should be placed on developing local agri-industrial clusters through “Internet + specialty agriculture,” promoting branding, standardization, and market access via digital platforms. Emphasis should be placed on characteristic products such as Ningxia goji berries and Qinghai organic beef and lamb, supported by e-commerce and cold-chain logistics. Central and western provinces should align DRC with local resource endowments, focus on key areas like precision irrigation and ecological monitoring, and implement phased roadmaps to enable intelligent agricultural transformation and coordinated regional development.
6. Conclusions
Although this study focuses on the provincial-level coupling between digital rural construction and high-quality agricultural development in China, the proposed SD-LSTM framework possesses strong structural flexibility and methodological adaptability. In many Global South countries, rural–urban disparities, limited digital infrastructure, and challenges in agricultural modernization are also prevalent. Thus, this model holds potential for broader application. For instance, in India, where smallholder farming dominates, the framework could incorporate indicators such as AgriStack platform coverage, rural digital literacy, and mobile-based advisory access to simulate the outcomes of the Digital Agriculture Mission. In Brazil, given its high agricultural output yet stark regional digital divides—especially in the Amazon—the model can be adapted to assess rural broadband access and digital logistics infrastructure under federal smart farming policies. In South Africa, where agricultural development is often constrained by institutional and social inequalities, relevant metrics such as rural e-governance adoption, smart subsidy coverage, and digital access for marginalized farmers can be included to evaluate strategies like the e-Agriculture Plan.
The SD-LSTM model assumes that system dynamics can generate time series features reflecting complex system evolution, when integrated with LSTM, enhancing the prediction of future coordination trends. However, the current model lacks consideration of soft variables (e.g., institutional diversity, cultural factors, and digital acceptance) and exogenous shocks (e.g., pandemics, extreme weather, trade fluctuations), which may influence system interactions. Future work should incorporate institutional and qualitative factors—such as digital governance capacity and rural organizational strength—to improve robustness. Adding external shocks and multi-scenario simulations will enhance model resilience. Furthermore, introducing multi-level coupling structures (e.g., province–city-county) may better capture nested spatial dynamics, supporting more precise and scalable digital agriculture policy recommendations.


