Article

Effects of Legume–Grass Mixture Combinations and Planting Ratios on Forage Productivity and Nutritional Quality in Typical Sand-Fixing Vegetation Areas of the Mu Us Sandy Land

1
Inner Mongolia Academy of Forestry Sciences, Hohhot 010010, China
2
School of Ecology and Environment, Inner Mongolia University, Hohhot 010021, China
3
Inner Mongolia Duolun Hunshandake Sandland Ecosystem Observation and Research Station, Xilingol League 027300, China
4
College of Desert Control Science and Engineering, Inner Mongolia Agricultural University, Hohhot 010018, China
*
Authors to whom correspondence should be addressed.
These authors contributed equally to this work.
Agriculture 2025, 15(14), 1474; https://doi.org/10.3390/agriculture15141474
Submission received: 22 May 2025 / Revised: 7 July 2025 / Accepted: 7 July 2025 / Published: 9 July 2025
(This article belongs to the Section Crop Production)

Abstract

Monoculture and legume–grass mixed cropping are the two most common planting methods, with mixed cropping generally demonstrating higher hay yield and superior nutritional quality compared to monoculture. However, research on legume–grass mixed cropping for establishing cultivated pastures in typical sand-fixing vegetation areas of the Mu Us Sandy Land remains scarce. These knowledge gaps have hindered the synergistic integration of forage production and ecological restoration in the region. This study conducted mixed cropping trials in the sand-fixing vegetation zone of the Mu Us Sandy Land using Dahurian wildrye (Elymus dahuricus), Mongolian wheatgrass (Agropyron mongolicum), and Standing milkvetch (Astragalus adsurgens) to investigate the effects of species combinations and planting ratios on forage productivity and nutritional quality, aiming to determine the optimal planting strategy. Results showed that in the first establishment year, the yield of all mixed cropping systems significantly exceeded that of monocultured Dahurian wildrye and Mongolian wheatgrass. All mixed cropping combinations exhibited land equivalent ratios (LER) and relative yield totals (RYT) below 1, indicating varying degrees of interspecific competition during the first year, with grass species generally demonstrating stronger competitive abilities than legumes. Mixed-cropped forages showed higher crude protein, crude fat, and crude ash content compared to monocultures, alongside lower neutral detergent fiber (NDF) and acid detergent fiber (ADF) levels, suggesting improved relative feed value (RFV). Among the combinations, E5A5 and E6A4 (5:5 and 6:4 ratio of Dahurian wildrye to Standing milkvetch) achieved higher RFV, with RFV gradually declining as the legume proportion decreased. In conclusion, both monoculture and legume–grass mixed cropping are viable in the Mu Us Sandy Land’s sand-fixing vegetation areas and the E5A5 combination (5:5 ratio of Dahurian wildrye to Standing milkvetch) as having the highest overall score, demonstrating that this mixed cropping ratio optimally balances yield and nutritional quality, making it the recommended planting protocol for the region. This mixed cropping system offers a theoretical foundation for efficiently establishing artificial pastures in the Mu Us Sandy Land, supporting regional pastoral industry development and desertification mitigation.

1. Introduction

The Mu Us Sandy Land was historically a lush pastoral region renowned for its thriving animal husbandry. However, excessive anthropogenic disturbances have transformed it into one of China’s most severely desertified areas, characterized by extreme ecological fragility [1]. Since the implementation of aeolian erosion control initiatives, extensive sand-fixing vegetation zones dominated by Mongolian Scots pine (Pinus sylvestris var. mongolica) and Ordos wormwood (Artemisia ordosica) have been established across this region [2,3]. Recent studies confirm substantial improvements in windbreak and sand stabilization efficacy, yet persistent challenges remain: low resource utilization efficiency, progressive xerophytic shrub degradation, and acute shortages of high-quality forage grasses [4,5]. Consequently, the cultivation of artificial pastures emerges as a critical strategy to revitalize local livestock industries, enhance ecological resource productivity, and ensure sustainable fodder supply.
Legume–grass mixed cropping and monoculture are two predominant approaches for establishing artificial pastures. However, monocropping systems often exhibit limitations such as suboptimal yields and compromised sustainability of forage production [6,7]. In contrast, legume–grass mixed cropping has been widely adopted not only to enhance forage yield and nutritional quality but also to improve soil longevity through nitrogen fixation and organic matter accumulation [8,9,10,11]. Moreover, legume–grass mixed cropping systems intensify interspecific competition, with Poaceae species generally demonstrating superior competitive dominance over legumes through earlier resource preemption and higher root biomass allocation [12,13,14]. Nevertheless, region-specific environmental constraints and species-dependent physiological adaptations can lead to divergent agronomic performance across locations, while inappropriate species ratios can significantly reduce yields [15,16]. Consequently, optimizing species combinations and planting ratios represents a critical determinant for successful mixed cropping implementation.
Current research on legume–grass mixed cropping systems in sandy lands remains limited, with existing studies predominantly focused on the Horqin Sandy Land [17,18]. To address this gap, we established mixed cropping trials in the Mu Us Sandy Land using Dahurian wildrye and Standing milkvetch, as well as Mongolian wheatgrass and Standing milkvetch, with three planting ratios (5:5, 6:4, 7:3), and these species are perennial plants with self-seeding capability. Once sown, they continue to produce new seedlings and grow into mature plants for years after the initial planting. Through comprehensive evaluation of forage productivity and nutritional quality, we systematically analyzed interspecific competition dynamics and optimized species configuration strategies for sand-fixing vegetation zones. This study provides actionable guidelines for establishing high-yield, nutrient-dense artificial pastures in ecologically fragile sandy ecosystems.

2. Materials and Methods

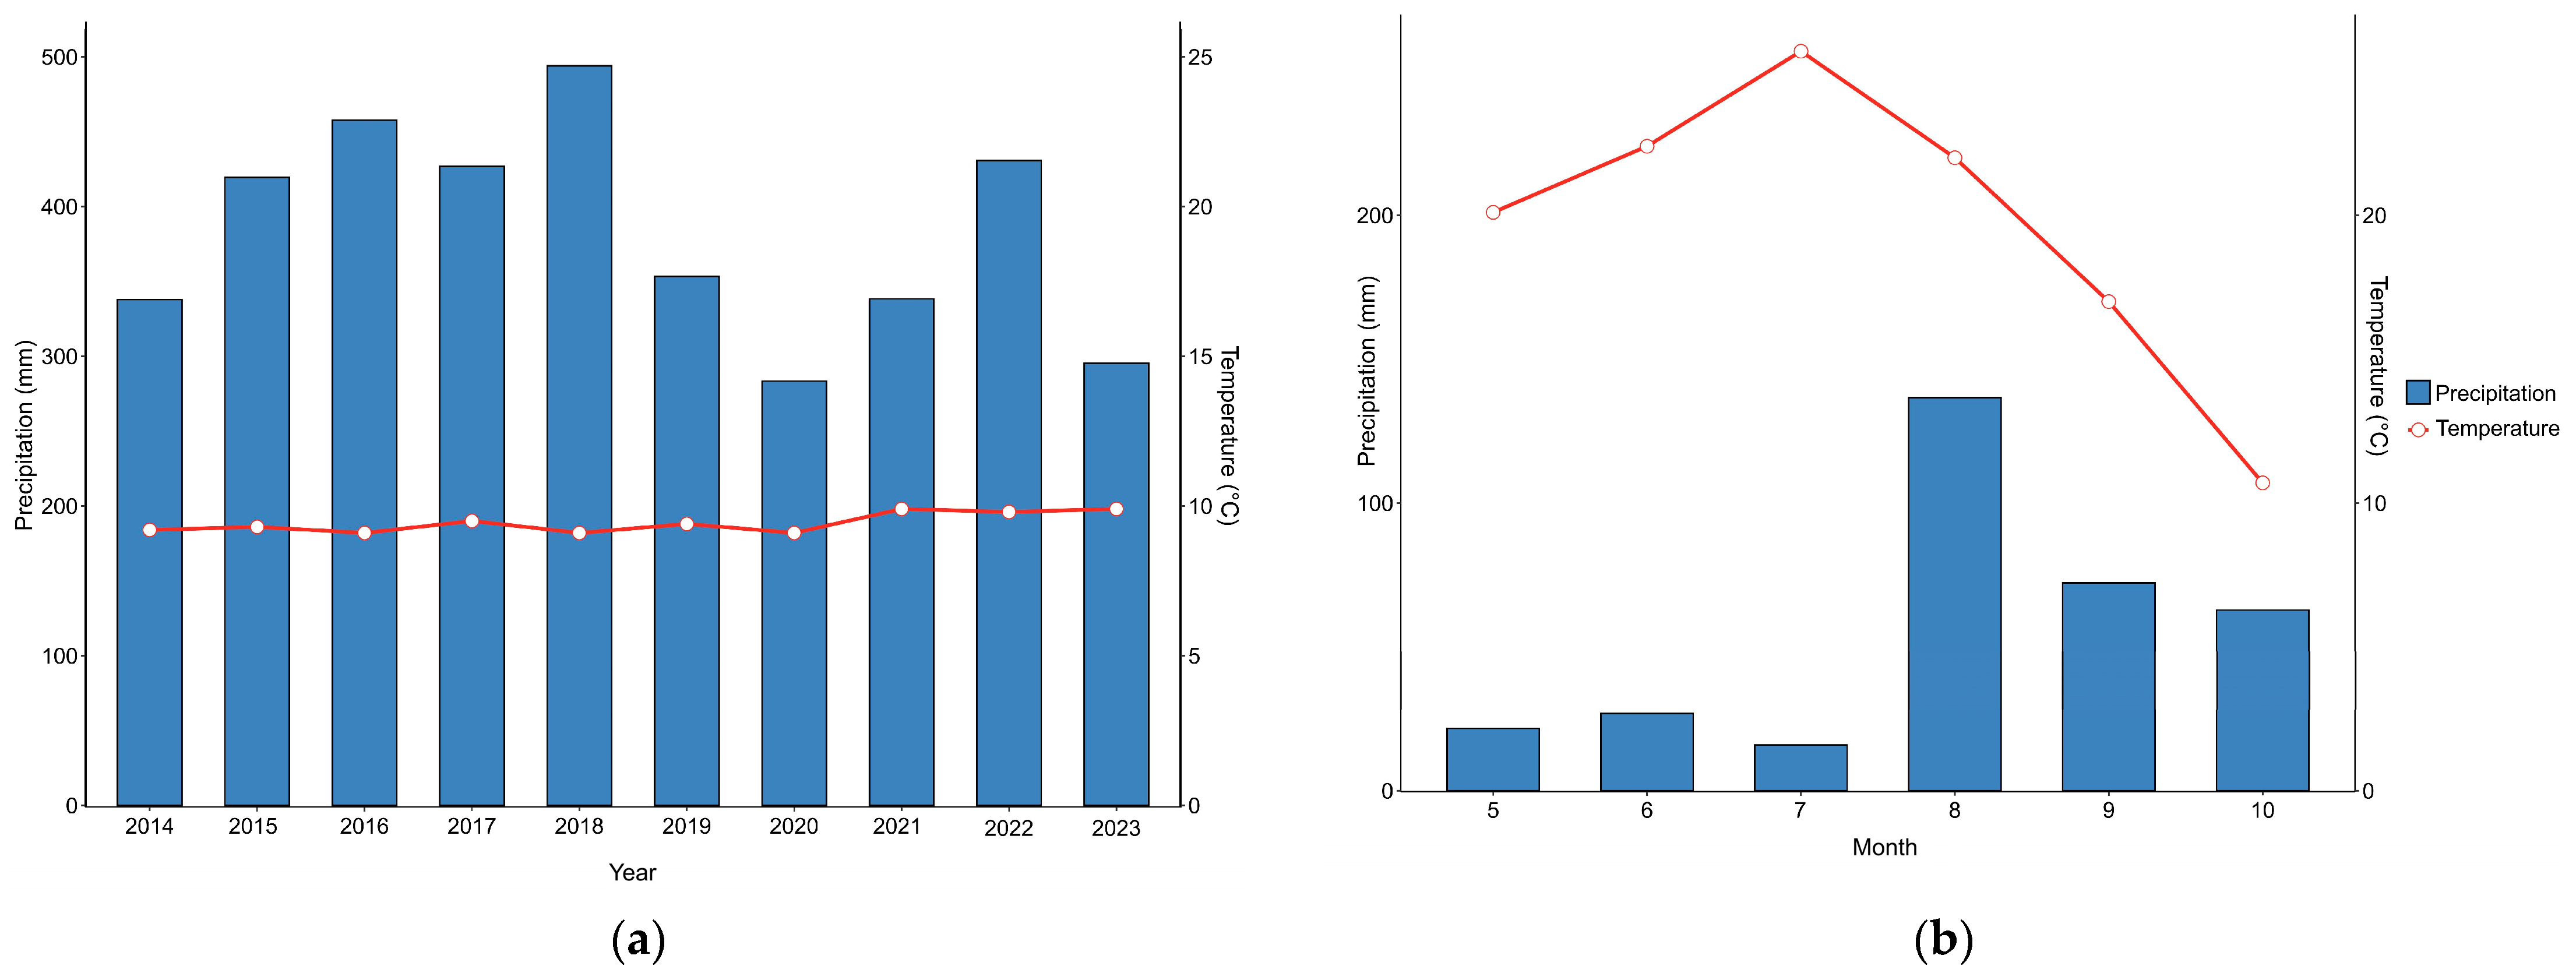
2.1. Overview of the Study Area

The research was conducted in a typical sand-stabilizing vegetation zone dominated by Caragana korshinskii within the Mu Us Sandy Land (39°26′ N, 109°30′ E), characterized by a temperate continental semi-arid monsoon climate with a mean annual temperature of 6.0–9.0 °C, ≥10 °C effective accumulated temperature of 2700–3000 degree-days, frost-free period of 130–160 days, annual average wind velocity of 4.8 m·s−2, and annual precipitation of 250–400 mm. The terrain features alternating mobile dunes, fixed/semi-fixed dunes, and interdune lowlands, with aeolian sandy soil as the predominant soil type. The vegetation community is dominated by C. korshinskii shrubs, accompanied by herbaceous species including Agriophyllum squarrosum, Artemisia scoparia, Heteropappus altaicus, Bassia dasyphylla, and Leymus secalinus [19]. Climatic trends from 2014 to 2023 and monthly temperature–precipitation patterns during the growing season (May–October 2024) are illustrated in Figure 1.

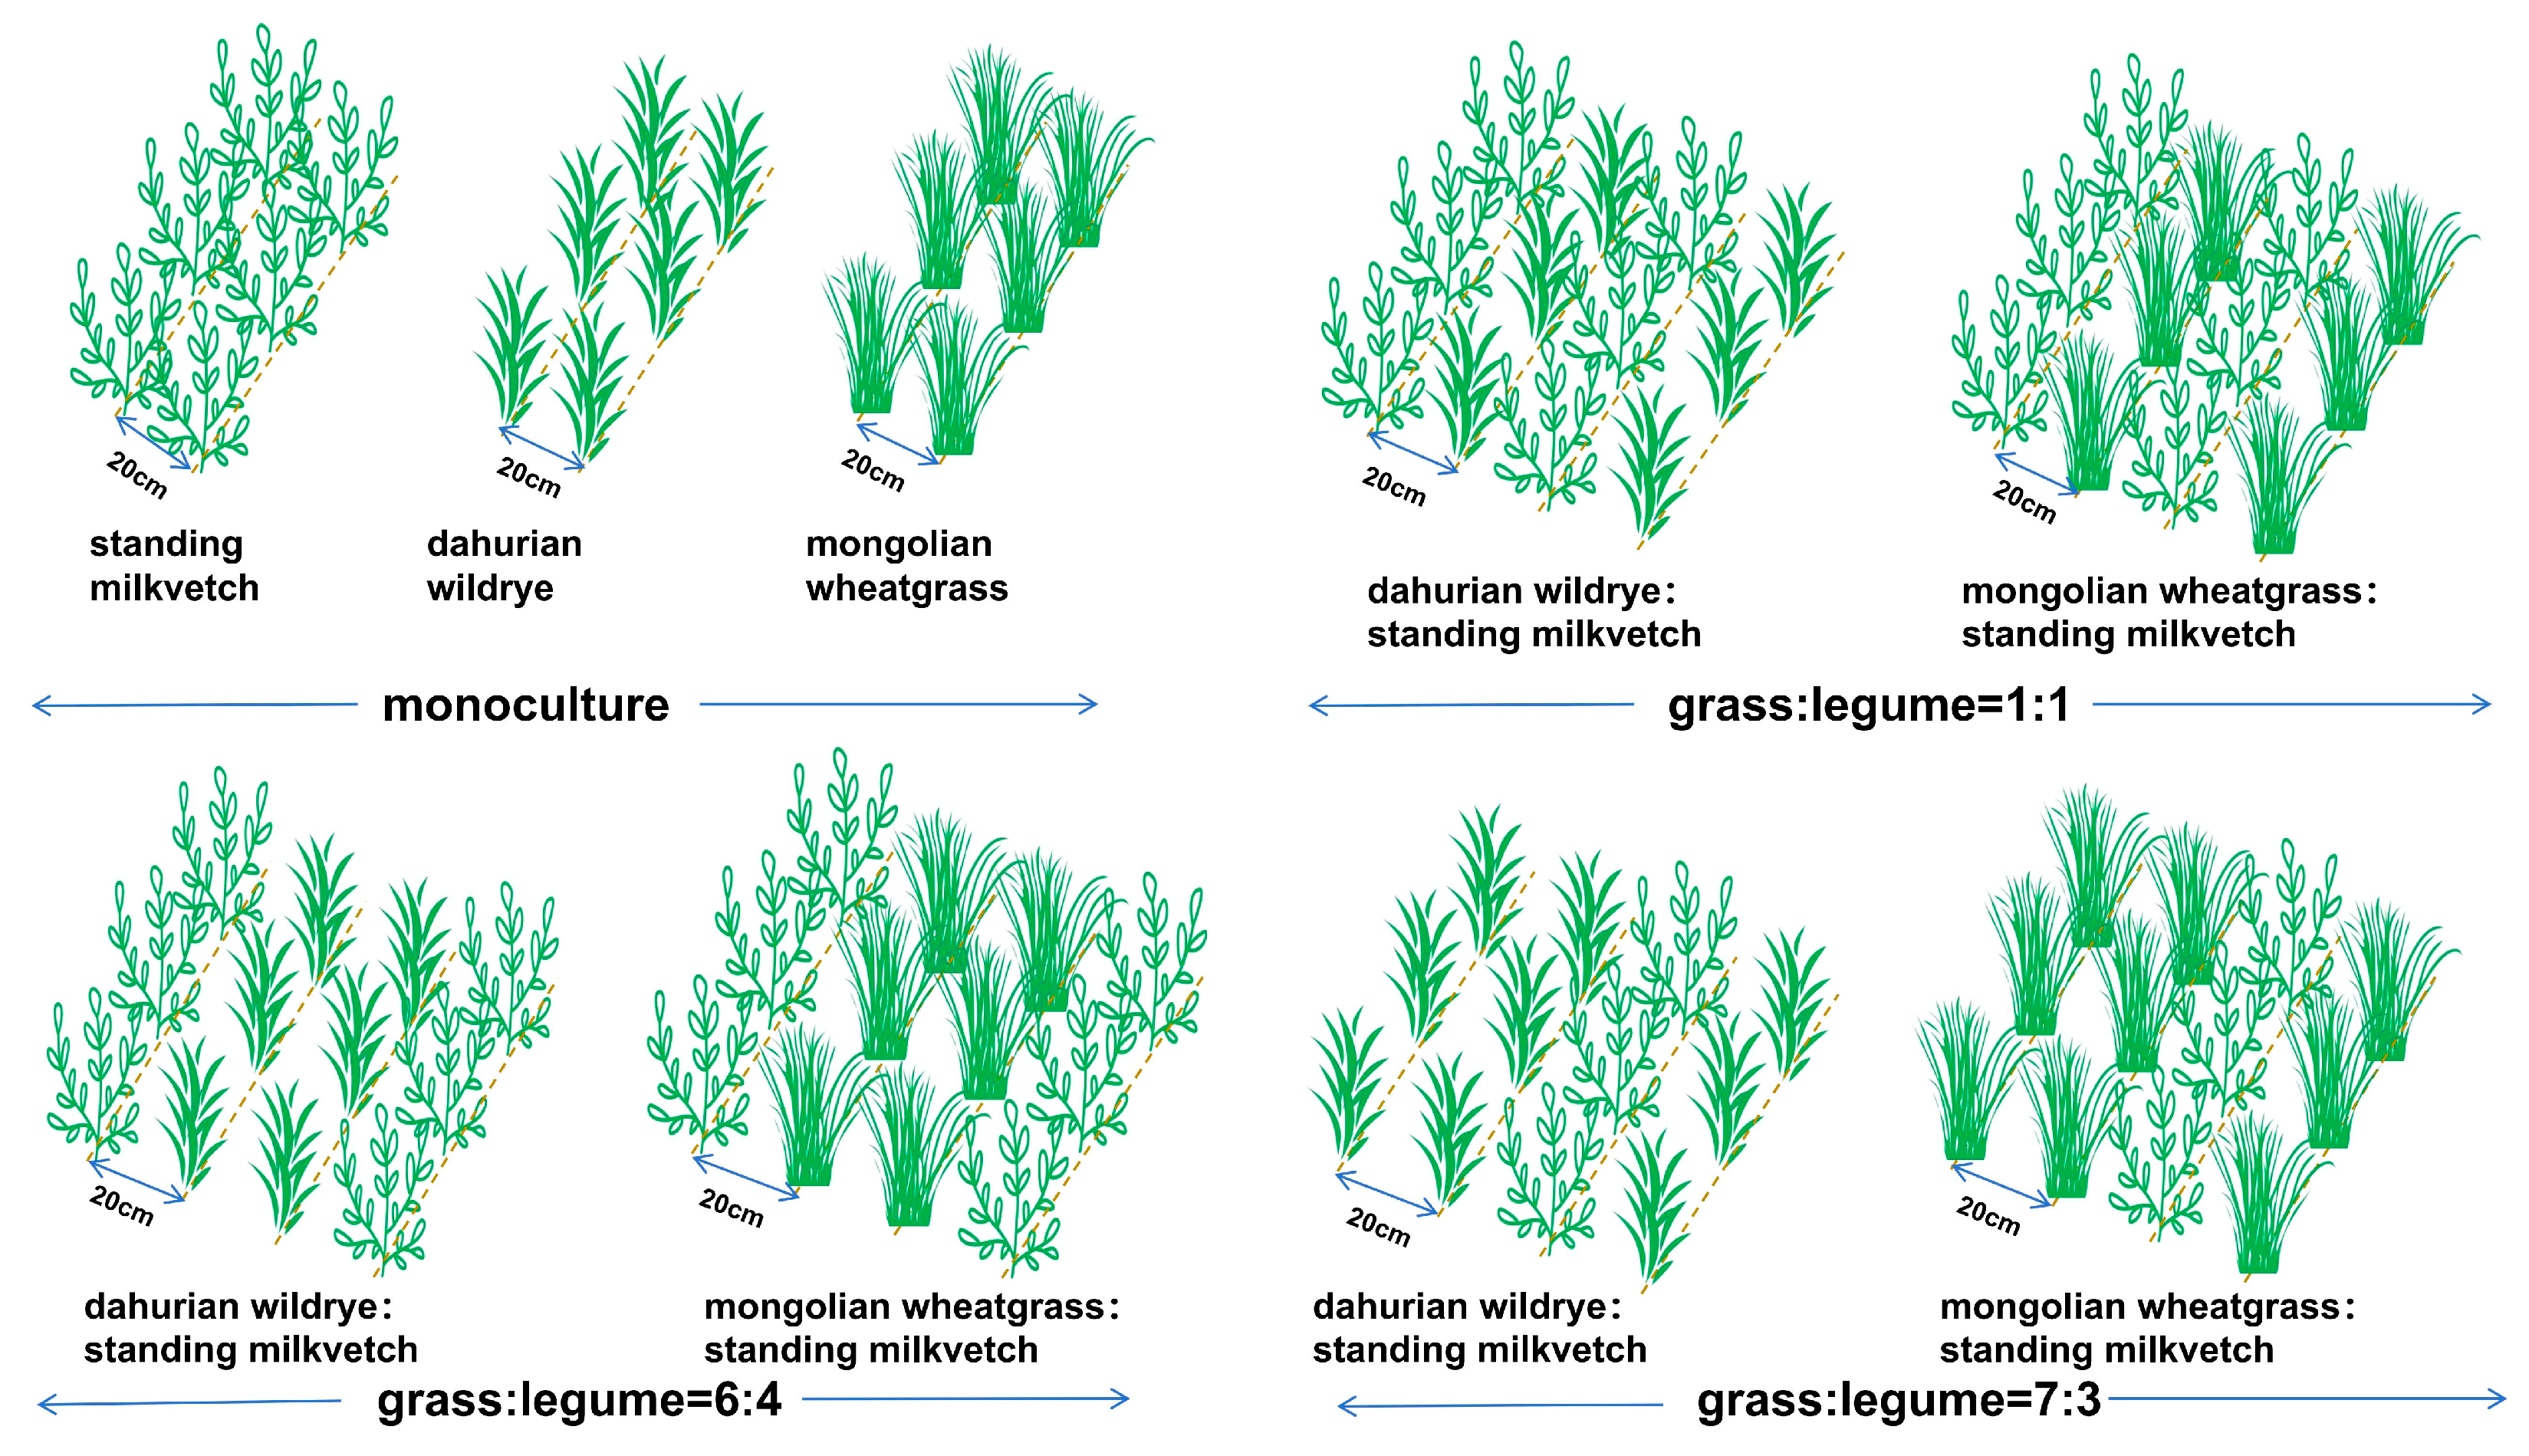
2.2. Experimental Materials and Design

The study utilized two grass species (Dahurian wildrye and Mongolian wheatgrass) and one legume (Standing milkvetch) procured from the Inner Mongolia Academy of Forestry Sciences (Hohhot, China), with seed viability confirmed through germination tests (>80% germination rate, >90% purity). A two-factor completely randomized block design was implemented, with Factor A (two species combinations: A1 [Dahurian wildrye + Standing milkvetch], A2 [Mongolian wheatgrass + Standing milkvetch]), and Factor B (grass:legume sowing ratios: N1 [5:5], N2 [6:4], N3 [7:3]), plus monoculture controls of each of the three species, replicated three times (total 27 plots). Field operations commenced in July 2024 using manual trench sowing. Ratio-controlled sowing was implemented via species-specific row allocation: alternating rows of grass and legume species, with the number of rows per species adjusted to achieve target ratios (e.g., 6 grass rows + 4 legume rows for 6:4 ratio), while maintaining fixed per-row seeding density equivalent to monoculture. Field layout is detailed in Figure 2. Pre-planting site preparation included land leveling and plowing to a depth of 20 cm. Planting consisted of sowing in rows spaced 20 cm apart at a depth of 2−3 cm. Monoculture sowing rates are detailed in Table 1, with mixture configurations in Table 2. Monoculture sowing rates were calculated for each species based on its thousand kernel weight and laboratory germination percentage. Each plot measured 3 × 4 m and was separated from adjacent plots by 1 m buffer ridges. Two supplemental irrigations were applied during the early growth stage.

2.3. Measured Parameters and Analytical Methods

2.3.1. Plant Height

Plant height measurement: On 30 August (peak vegetative growth) and 30 September (reproductive transition), ten representative plants per species group (Poaceae and Fabaceae) were randomly selected per plot. Selection criteria required undamaged, non-edge individuals with comparable developmental stages. Natural height was measured from undisturbed soil surface to the tallest extended leaf apex using a rigid 1 mm graduated tape. Measurements were taken perpendicular to the ground during consistent daylight hours (08:00–10:00). The mean height per species group per plot was calculated from ten plants.

2.3.2. Hay Yield

Sampling quadrats were placed within 50 cm from the plot edge during sample collection and each plot was sampled with three replicates. All plots were harvested using scissors at a 5 cm stubble height to protect basal tiller buds and maintain soil cover, without ground-level cutting. Biomass was sorted by species, weighed fresh (FW), recorded, and samples were oven-dried at 105 °C for 30 min (enzyme inactivation) followed by 72 h at 75 °C to constant weight. Dry matter (DW) was determined using analytical balances (±0.01 g precision). Before chemical analysis, a 500 g composite subsample was ground using a Retsch MM 400 ball mill (Retsch GmbH, Haan, Germany) at 300 rpm for 1 h. The ground sample was then archived for nutritional analysis.

2.3.3. Nutritional Composition

Crude Protein (CP): Determined via automated Kjeldahl nitrogen analyzer (FLASH SMART CHNS/O, Thermo Fisher Scientific, Milan, Italy) following Dumas combustion, calculated as total nitrogen × 6.25. Ether Extract (EE): Soxhlet extraction with petroleum ether (GB/T 6433-2006) [20]. Ash Content: Muffle furnace incineration at 550 °C (GB/T 6438-2007) [21]. Neutral/Acid Detergent Fiber (NDF/ADF): Sequential detergent analysis using ANKOM A2000 (GB/T 20806-2022; NY/T 1459-2022) [22,23]. Nutritive indices were derived as [24]:
D M I ( % ) = 120 / N D F
D D M ( % ) = 88.9 ( 0.779 × A D F )
R F V ( % ) = ( D D M × D M I ) / 1.29

2.3.4. Interspecific Competition

Relative Yield and Relative Yield Total
The relative yield (RY) of a species was calculated as the ratio of its dry weight in mixture to that in monoculture. The relative yield total (RYT) was used to evaluate interspecific competition by summing the RY values of all component species. The equations were defined as follows:
R Y i = Y i j Z i j Y i i
R Y T = Y i j Y i i + Y j i Y j j
The relative yield (RY) of a species was calculated as the ratio of its dry weight in legume–grass mixed cropping to that in monoculture, where Y i j and Y j i represent the yields of species i and j in their mixed cultivation, respectively, while Y i i and Y j j denote their corresponding monoculture yields. Here, Z i j defines the proportional representation of species i in the ij intercrop system. The relative yield total (RYT), calculated as the sum of all component species’ RY values, reflects interspecific competition dynamics: an RYT < 1 indicates stronger interspecific than intraspecific competition, RYT = 1 suggests equivalent competition intensities, and RYT > 1 implies niche differentiation with reduced interspecific competition [25]. These metrics collectively assess competitive interactions between legume–grass mixtures in sand-stabilizing communities.
Land Equivalent Ratio
The Land Equivalent Ratio (LER) is used to assess mixed cropping advantages in legume–grass mixture systems, reflecting the intensity of resource utilization competition among species within the mixture. When LER = 1, the mixed planting yield is equivalent to monoculture yields, indicating equal utilization of limited resources. LER > 1 demonstrates mixed cropping advantages, while LER < 1 indicates mixed cropping disadvantages [26]. The calculation formula is as follows:
L E R = L E R i + L E R j = Y i j Y i i + Y j i Y j j
where L E R i and L E R j represent the partial land equivalent ratios of grass species i and j, respectively, and LER denotes the land equivalent ratio.
Aggressivity
Aggressivity (A): Aggressivity is used to determine the competitive relationship between two species [27].
A i = Y i j Y i i Z i j Y j i Y j j Z j i
In the formula, A i represents the aggressivity of species i, where A i > 0 indicates that species i is competitively dominant, A i = 0 denotes equivalent competitiveness between species i and j, and A i < 0 signifies the dominance of species j.
Competition Ratio
Competition Ratio (CR): An indicator of the strength of plant competition in a mixed system [28].
C R i = L E R i L E R j × Z i j Z j i
where C R i represents the competition ratio of species i and species j, respectively. C R i > 1, indicating that species i is more competitive; if C R i < 1, species j is more competitive.

2.4. Data Statistics and Analysis

Raw data were processed using Microsoft Excel 2019 for entry and preliminary organization, followed by one-way ANOVA and multiple comparisons conducted in IBM SPSS Statistics 22. Graphical representations were generated with R 4.3.0. Data in figures and tables are presented as “Mean ± standard error”. A comprehensive evaluation was performed via the Entropy Weight-TOPSIS method, which integrates entropy weighting (to objectively calculate indicator weights and minimize subjective bias) with TOPSIS (Technique for Order Preference by Similarity to Ideal Solution) for model-based similarity analysis. This approach ranks alternative solutions by their similarity coefficients to determine optimal configurations [29]. The specific calculation process is as follows:
Construct the original evaluation matrix. Suppose there are n evaluation objects, and each n corresponds to m evaluation indicators (measured indicators). The matrix is constructed as follows: X = ( X i j ) n × m , X i j , representing the value of the jth indicator under the ith evaluation object.
The matrix X i j is normalized to form Y i j = y i j n × m ; general indicators can be divided into positive indicators and negative indicators, calculated as follows:
Positive indicators:
y i j = x i j x j m i n x j m a x x j m i n
Negative indicators:
y i j = x j m a x x i j x j m a x x j m i n
Determine the weight w j of each indicator using the entropy weight method:
Calculate the contribution degree of the i-th treatment under the j-th indicator:
p i j = y i j i = 1 n y i j
Calculate the entropy value of the j-th indicator:
g j = 1 ln n i = 1 n p i j ln p i j
Calculating the difference coefficient:
t j = 1 g j
Determine the weights w i j of each evaluation indicator:
w j = t j j = 1 m t j
Weight the standardized indicators in the matrix to form a weighted matrix:
Z i j = y i j × w j
The positive and negative ideal solutions of the interval are determined as follows:
χ + = m a x Z i j   χ = m i n Z i j
Then calculate the Euclidean distance between each scheme and the positive and negative ideal solutions. The formula is as follows:
d i + = j = 1 m ( Z i j χ + ) 2   d i = j = 1 m ( Z i j χ ) 2
In the formula, d i + and d i are the Euclidean distances from the positive and negative ideal solutions, respectively.
Calculate the degree of fit between each scheme and the optimal scheme (with a value range of 0 to 1). The larger the value, the better. The formula is as follows:
C i = d i d i + + d i

3. Results

3.1. Effects of Mixed Cropping of Legumes and Grasses on Forage Plant Height

As shown in Table 3, on 30 August, Standing milkvetch exhibited its maximum plant height (6.48 cm) under the E6A4 treatment, which was significantly higher than that under E7A3 (p < 0.05), but did not show significant differences compared to other treatments. Plant heights of Dahurian wildrye did not differ significantly across legume–grass mixed cropping combinations (p > 0.05), while Mongolian wheatgrass under M7A3 achieved a significantly greater height (10.09 cm) than other treatments (p < 0.05). By 30 September, no significant differences in plant height were observed among treatments for any species (p > 0.05). The maximum heights for Standing milkvetch (24.7 cm) and Mongolian wheatgrass (16.9 cm) occurred under M7A3, while Dahurian wildrye peaked at 21.7 cm under E5A5.

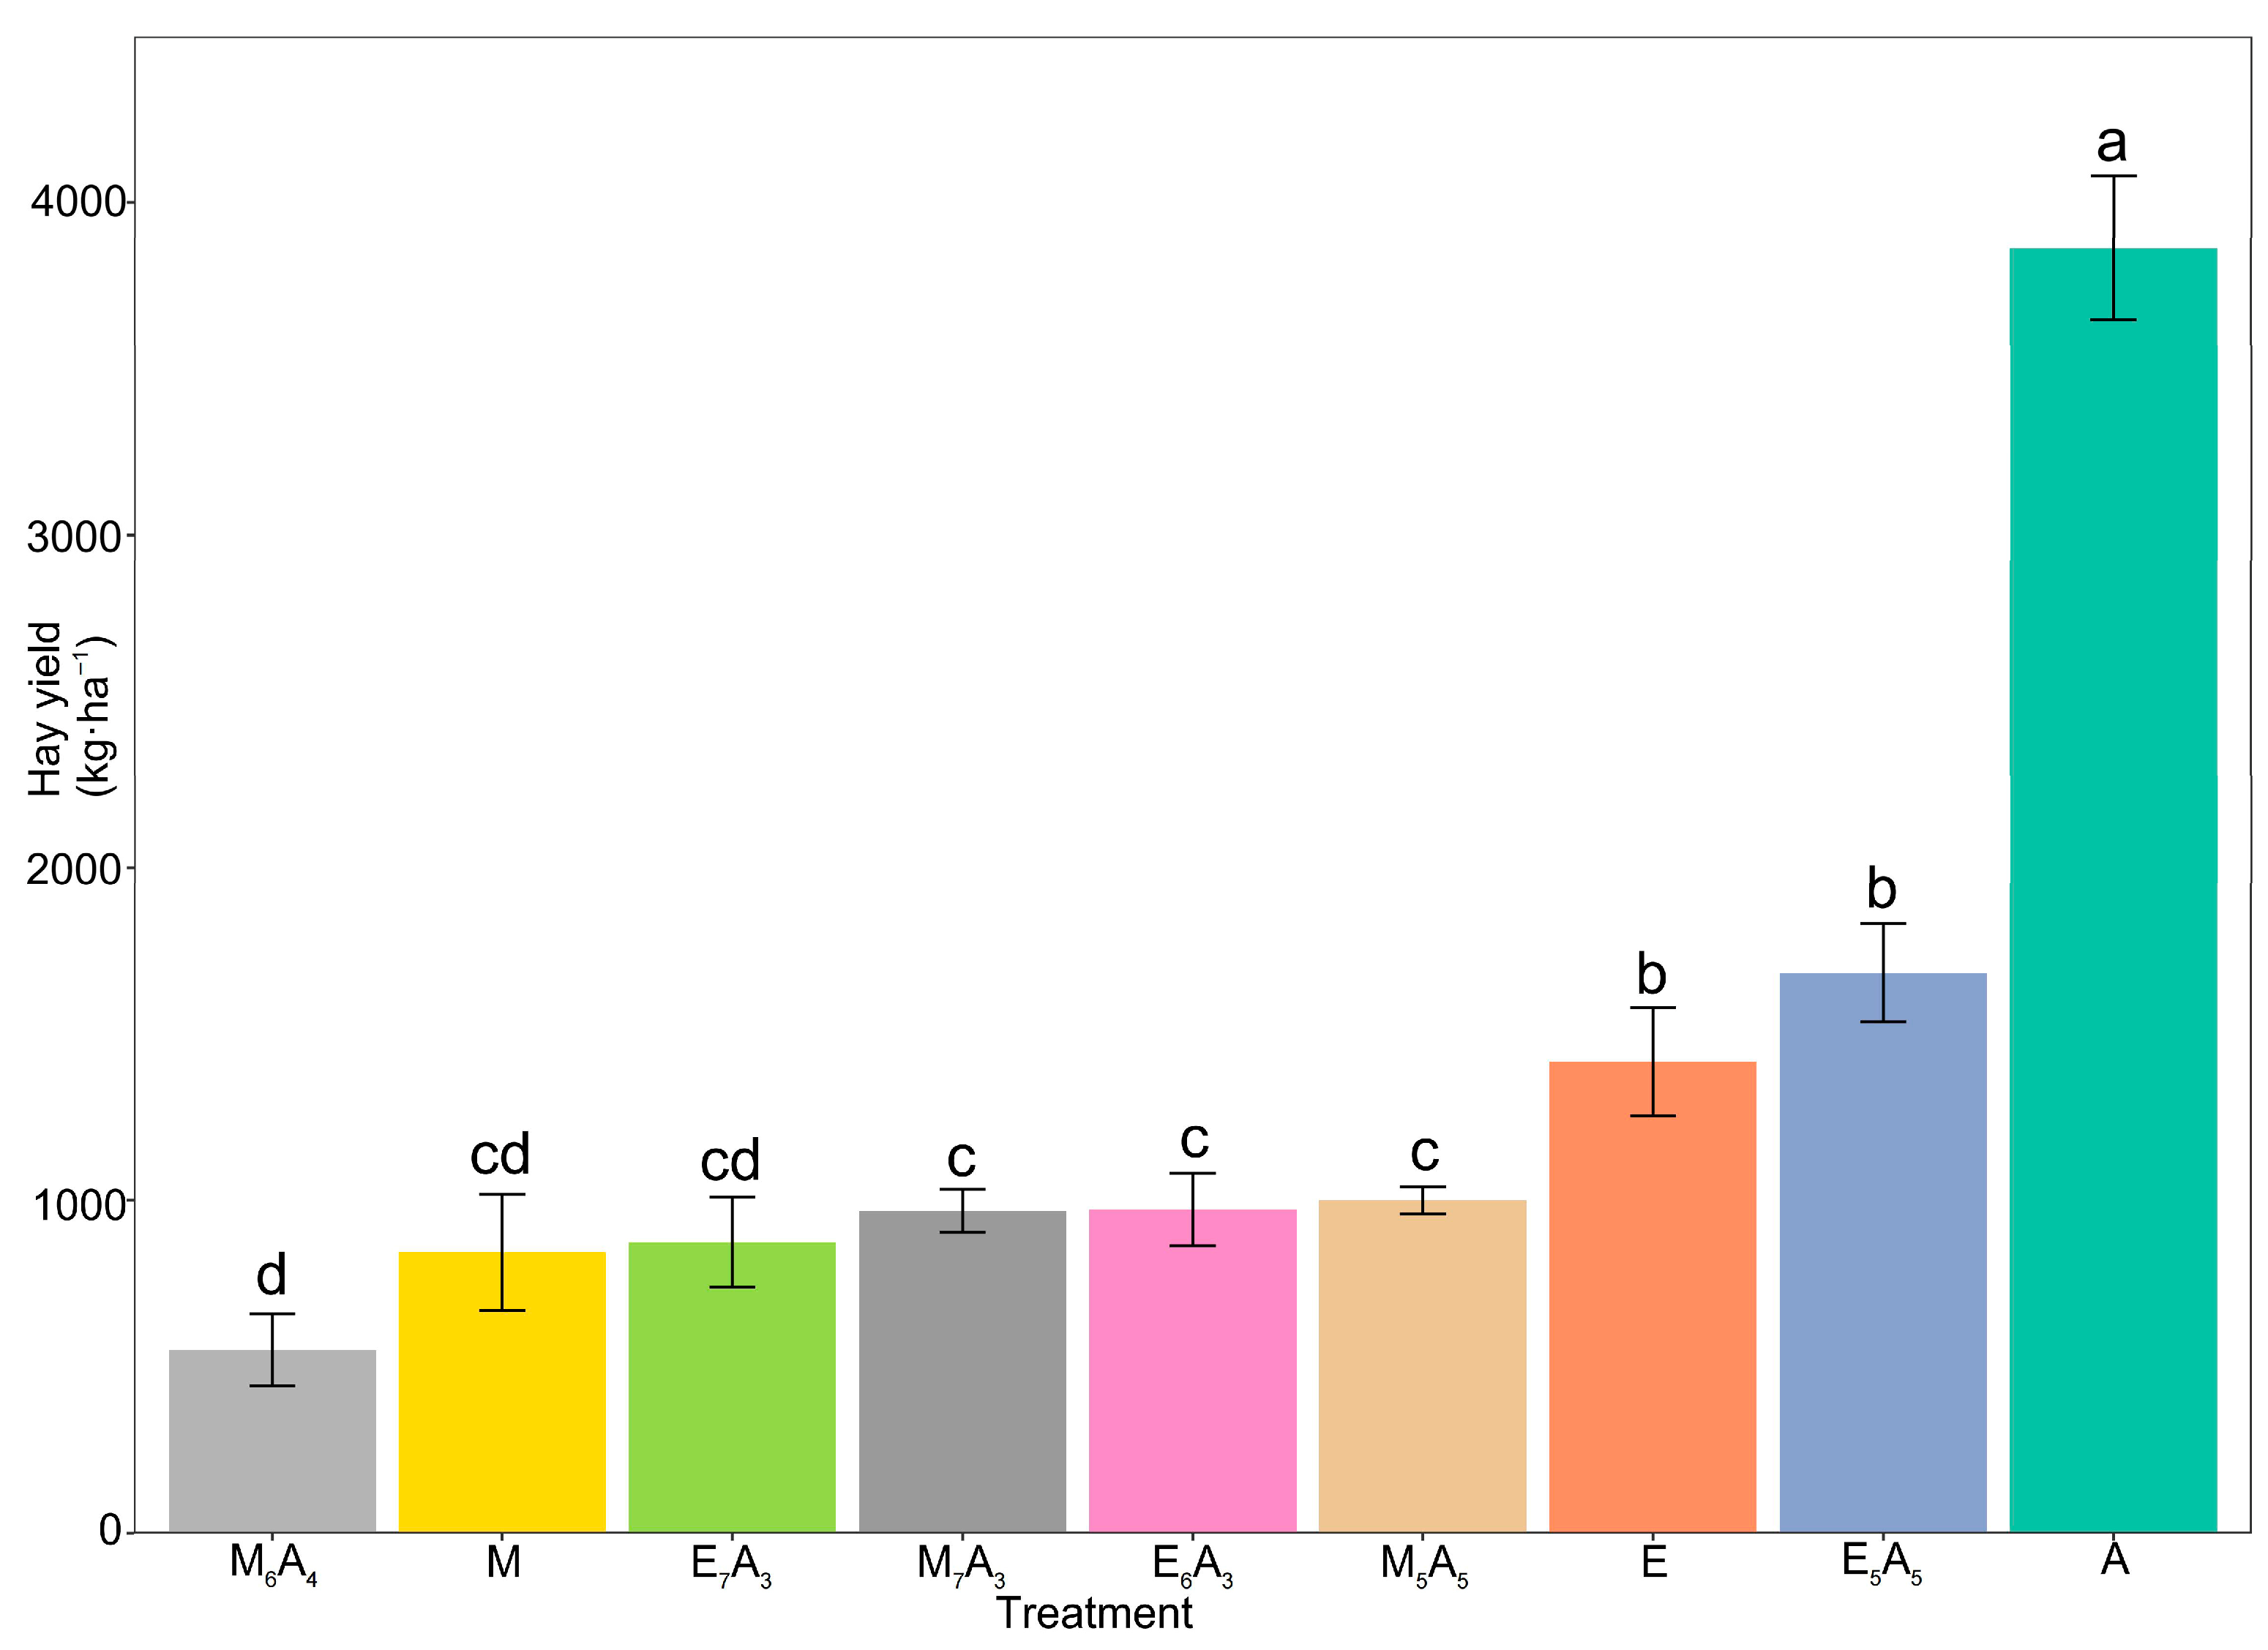
3.2. Effects of Mixed Cropping of Legumes and Grasses on Hay Yield

Compared to monocultures, mixed cropping did not significantly enhance hay yield (Figure 3). Among monoculture treatments, single-species Standing milkvetch exhibited the highest yield (3860 kg·ha−1), followed by Dahurian wildrye monoculture, with Mongolian wheatgrass monoculture showing the lowest yield, all differing significantly (p < 0.05). Legume–grass mixed cropping yields ranged from 550.1 to 1684.2 kg·ha−1, with treatment E5A5 achieving the maximum yield, significantly surpassing other mixed cropping combinations (p < 0.05). Treatments E5A5, M5A5, and M7A3 marginally outperformed grass monocultures (Dahurian wildrye and Mongolian wheatgrass), though these differences were not statistically significant (p > 0.05).

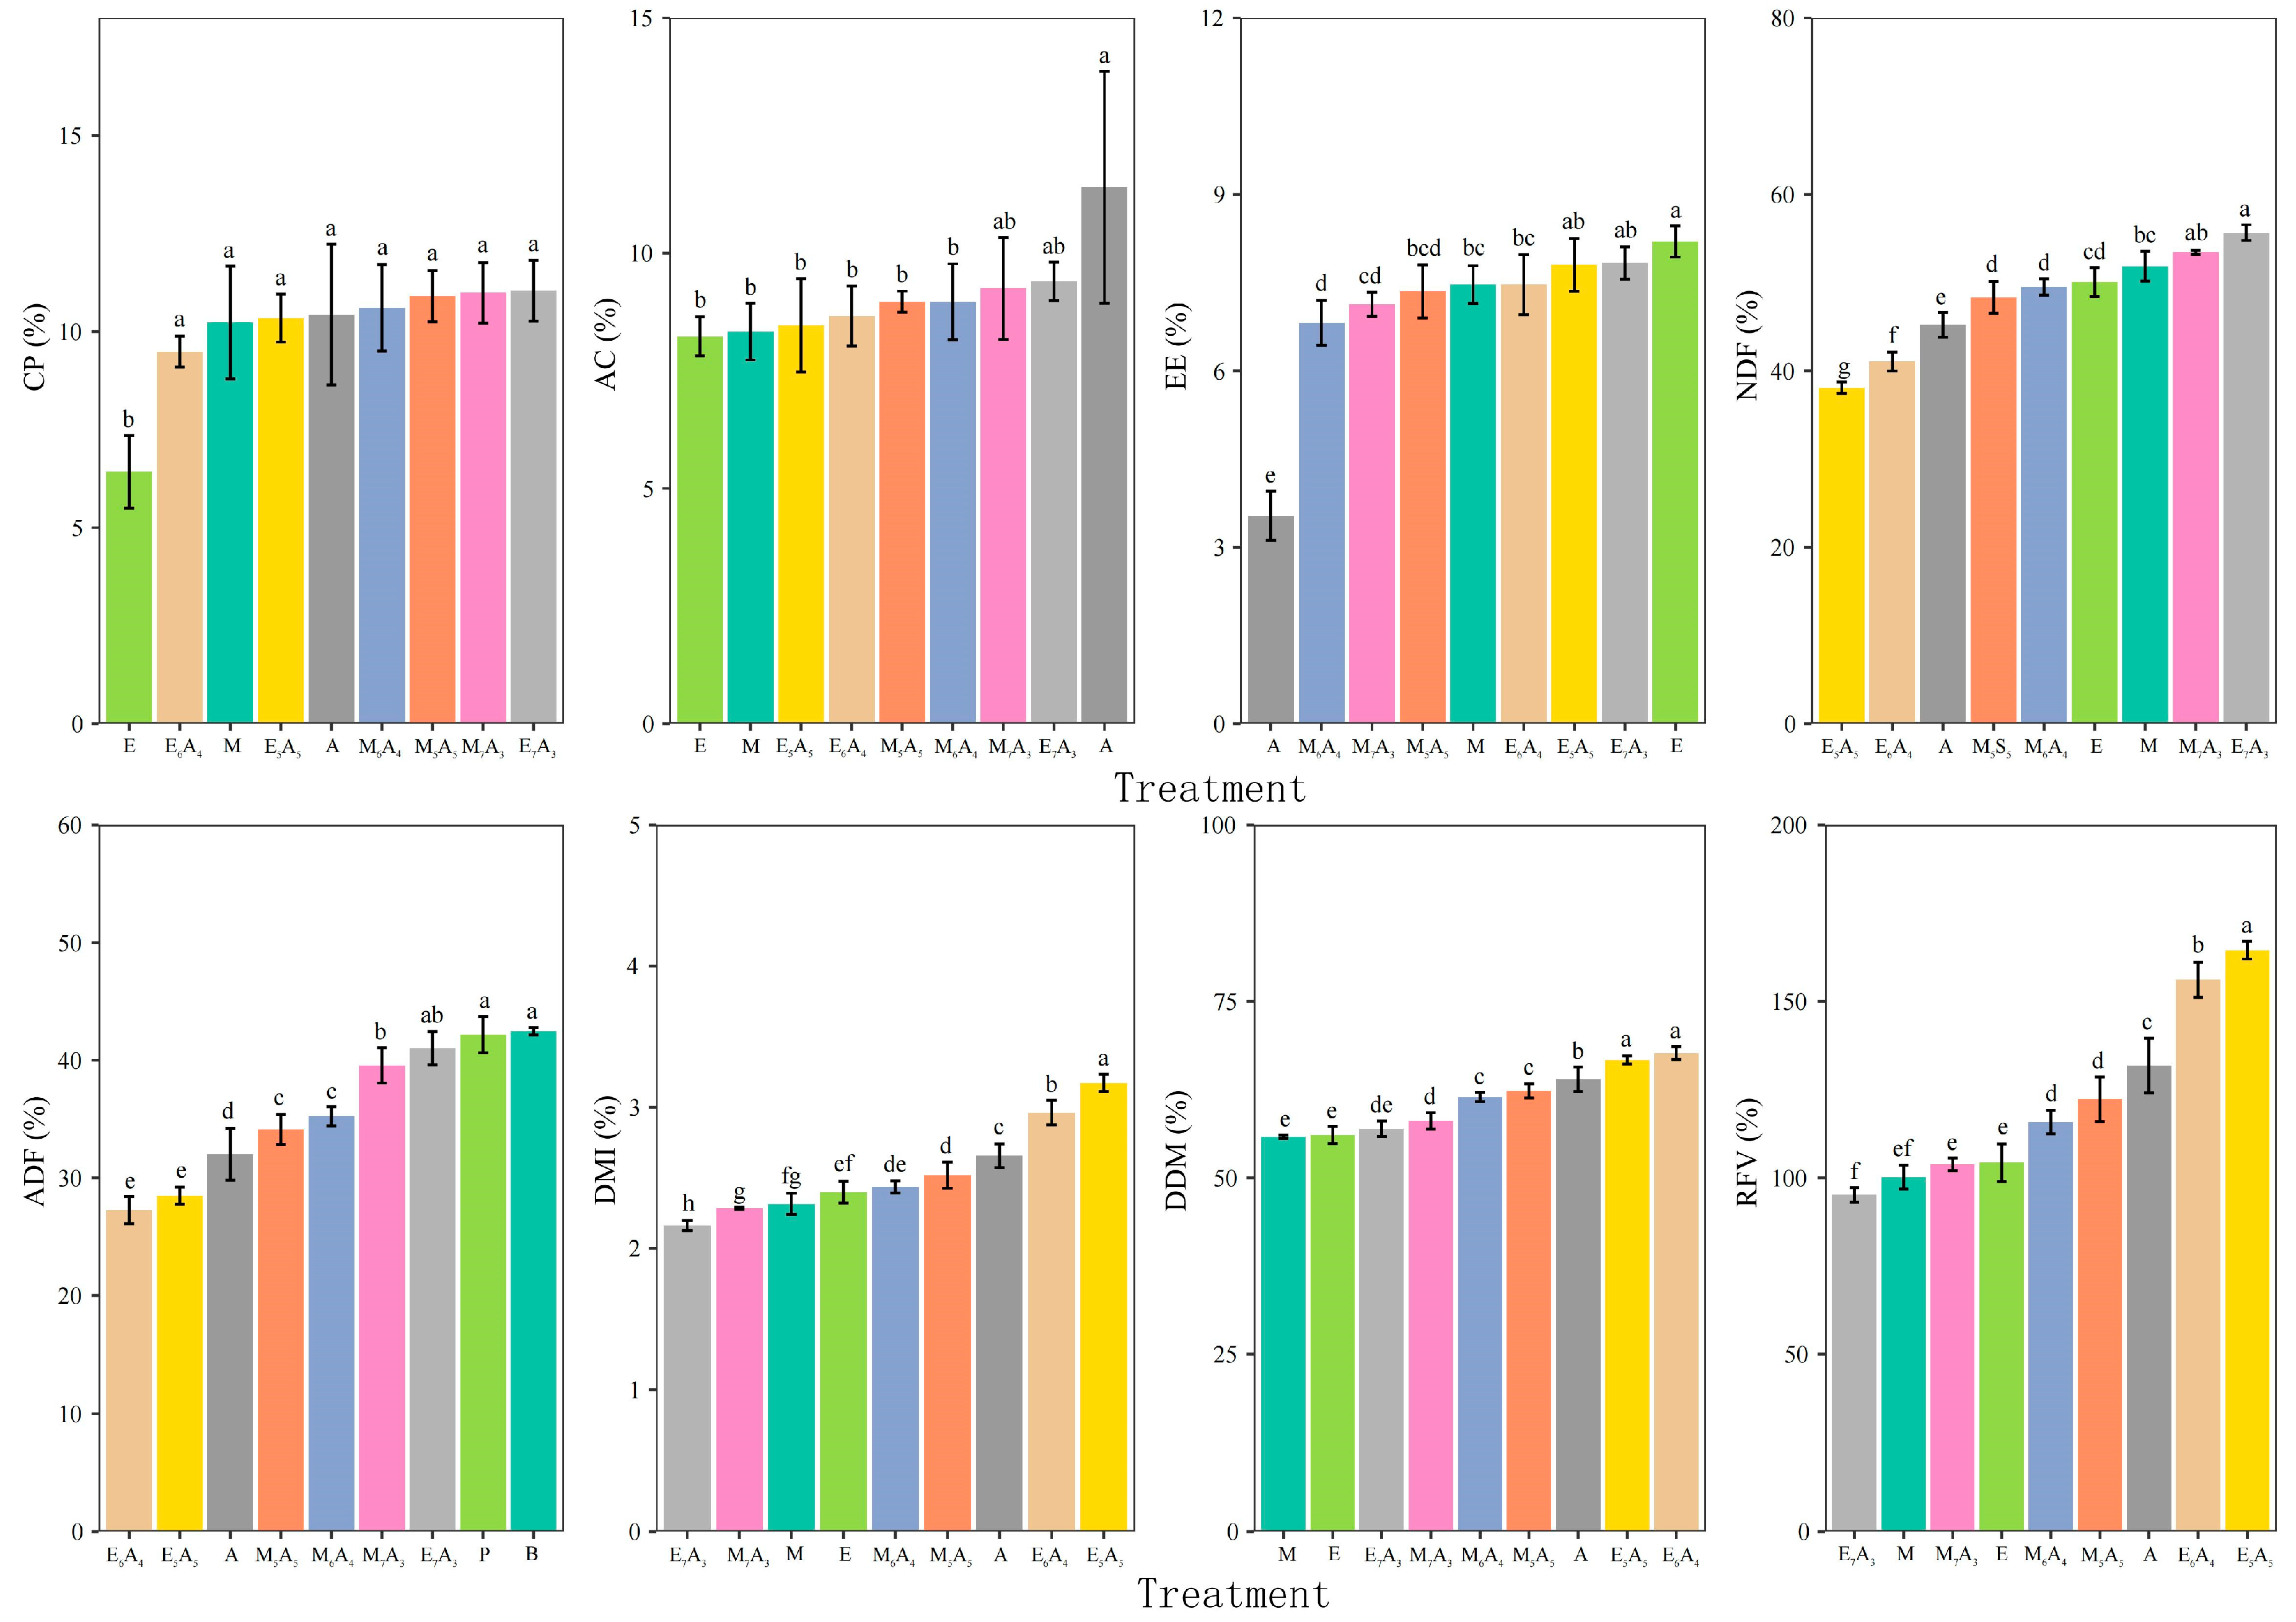
3.3. Legumes and Grasses Mixtures Elevate Forage Nutritional Status

Mixed cropping increased ash, crude protein (CP), and ether extract (EE) content, while decreasing neutral detergent fiber (NDF) and acid detergent fiber (ADF) levels. Consequently, relative feed value (RFV) and digestible dry matter (DDM) were elevated (Figure 4). Compared to Dahurian wildrye monoculture, all mixed cropping combinations significantly increased CP content by 48–72% (p < 0.05). Ash content in mixed cropping treatments was marginally higher than in Dahurian wildrye monoculture and Mongolian wheatgrass monoculture, but not statistically significant (p > 0.05). Mixed cropping significantly elevated EE content by 93–122% relative to Standing milkvetch monoculture (p < 0.05). Treatments E5A5 and E6A4 exhibited significantly lower NDF content than all monocultures (p < 0.05), with reductions of 24% and 18% compared to Dahurian wildrye monoculture, 27% and 21% versus Mongolian wheatgrass monoculture, and 16% and 9% relative to Standing milkvetch monoculture. Similarly, ADF content in E6A4 and E5A5 was 35–32% lower than Dahurian wildrye monoculture, 36–33% lower than Mongolian wheatgrass monoculture, and 15–11% lower than Standing milkvetch monoculture (p < 0.05). These treatments also showed superior dry matter intake (DMI; 23–32% higher than Dahurian wildrye monoculture, 28–37% above Mongolian wheatgrass monoculture, 11–19% exceeding Standing milkvetch monoculture) and DDM (21–19% over Dahurian wildrye monoculture, 21–20% beyond Mongolian wheatgrass monoculture, 6–4% greater than Standing milkvetch monoculture) (p < 0.05). Consequently, RFV in E6A4 and E5A5 surpassed monocultures by 50–58% (vs. Dahurian wildrye monoculture), 56–64% (vs. Mongolian wheatgrass monoculture), and 18–25% (vs. Standing milkvetch monoculture) (p < 0.05).

3.4. Competitive Indices of Legumes and Grasses in Mixed Stands

3.4.1. Land Equivalent Ratio of Legumes and Grasses in Mixed Stands

As shown in Table 4, significant differences in land equivalent ratio (LER) were observed among mixed cropping combinations. The E5A5 treatment exhibited significantly higher LERH (legume LER), LERD (grass LER), and total LER values than other combinations (p < 0.05), indicating its superior performance in resource utilization within the mixtures. Although E5A5 had the highest LER components among mixtures, its total LER remained below 1, suggesting that interspecific competition may still have limited resource use efficiency. Conversely, M6A4 showed the lowest LERH, LERD, and LER values (non-significant, p > 0.05), implying that this combination offered limited resource complementarity. Except for M5A5, LERH values in mixed systems were significantly higher than LERD (p < 0.05), highlighting that Poaceae species (Dahurian wildrye and Mongolian wheatgrass) generally made a greater relative growth contribution than Fabaceae (Standing milkvetch) in most mixtures. Overall, the data reveal that cropping combinations significantly impact LER values, with E5A5 demonstrating the best resource utilization potential despite competition constraints, and M6A4 indicating the least effective resource complementarity.

3.4.2. Relative Yield, Aggressivity, and Competition Ratio of Legumes and Grasses in Mixed Stands

As shown in Table 5, significant differences were observed in the relative yield total (RYT) among mixed cropping treatments, with all values < 1, indicating varying degrees of interspecific competition. The E5A5 treatment exhibited the highest RYT, significantly surpassing other combinations (p < 0.05), while M6A4 showed the lowest RYT, significantly lower than E5A5, E7A3, and M7A3 (p < 0.05). Except for M5A5 and M7A3, aggressivity values of Poaceae species exceeded zero across mixtures (p < 0.05), indicating their relative dominance in resource acquisition under specific planting ratios. Similarly, legumes exhibited lower competition ratios (CR) than grasses (except M5A5), with grass CR increasing with sowing proportion.

3.5. Interrelationships Among Yield, Nutritional Quality, and Interspecific Competition in Mixed Cropping Systems of Legumes and Grasses

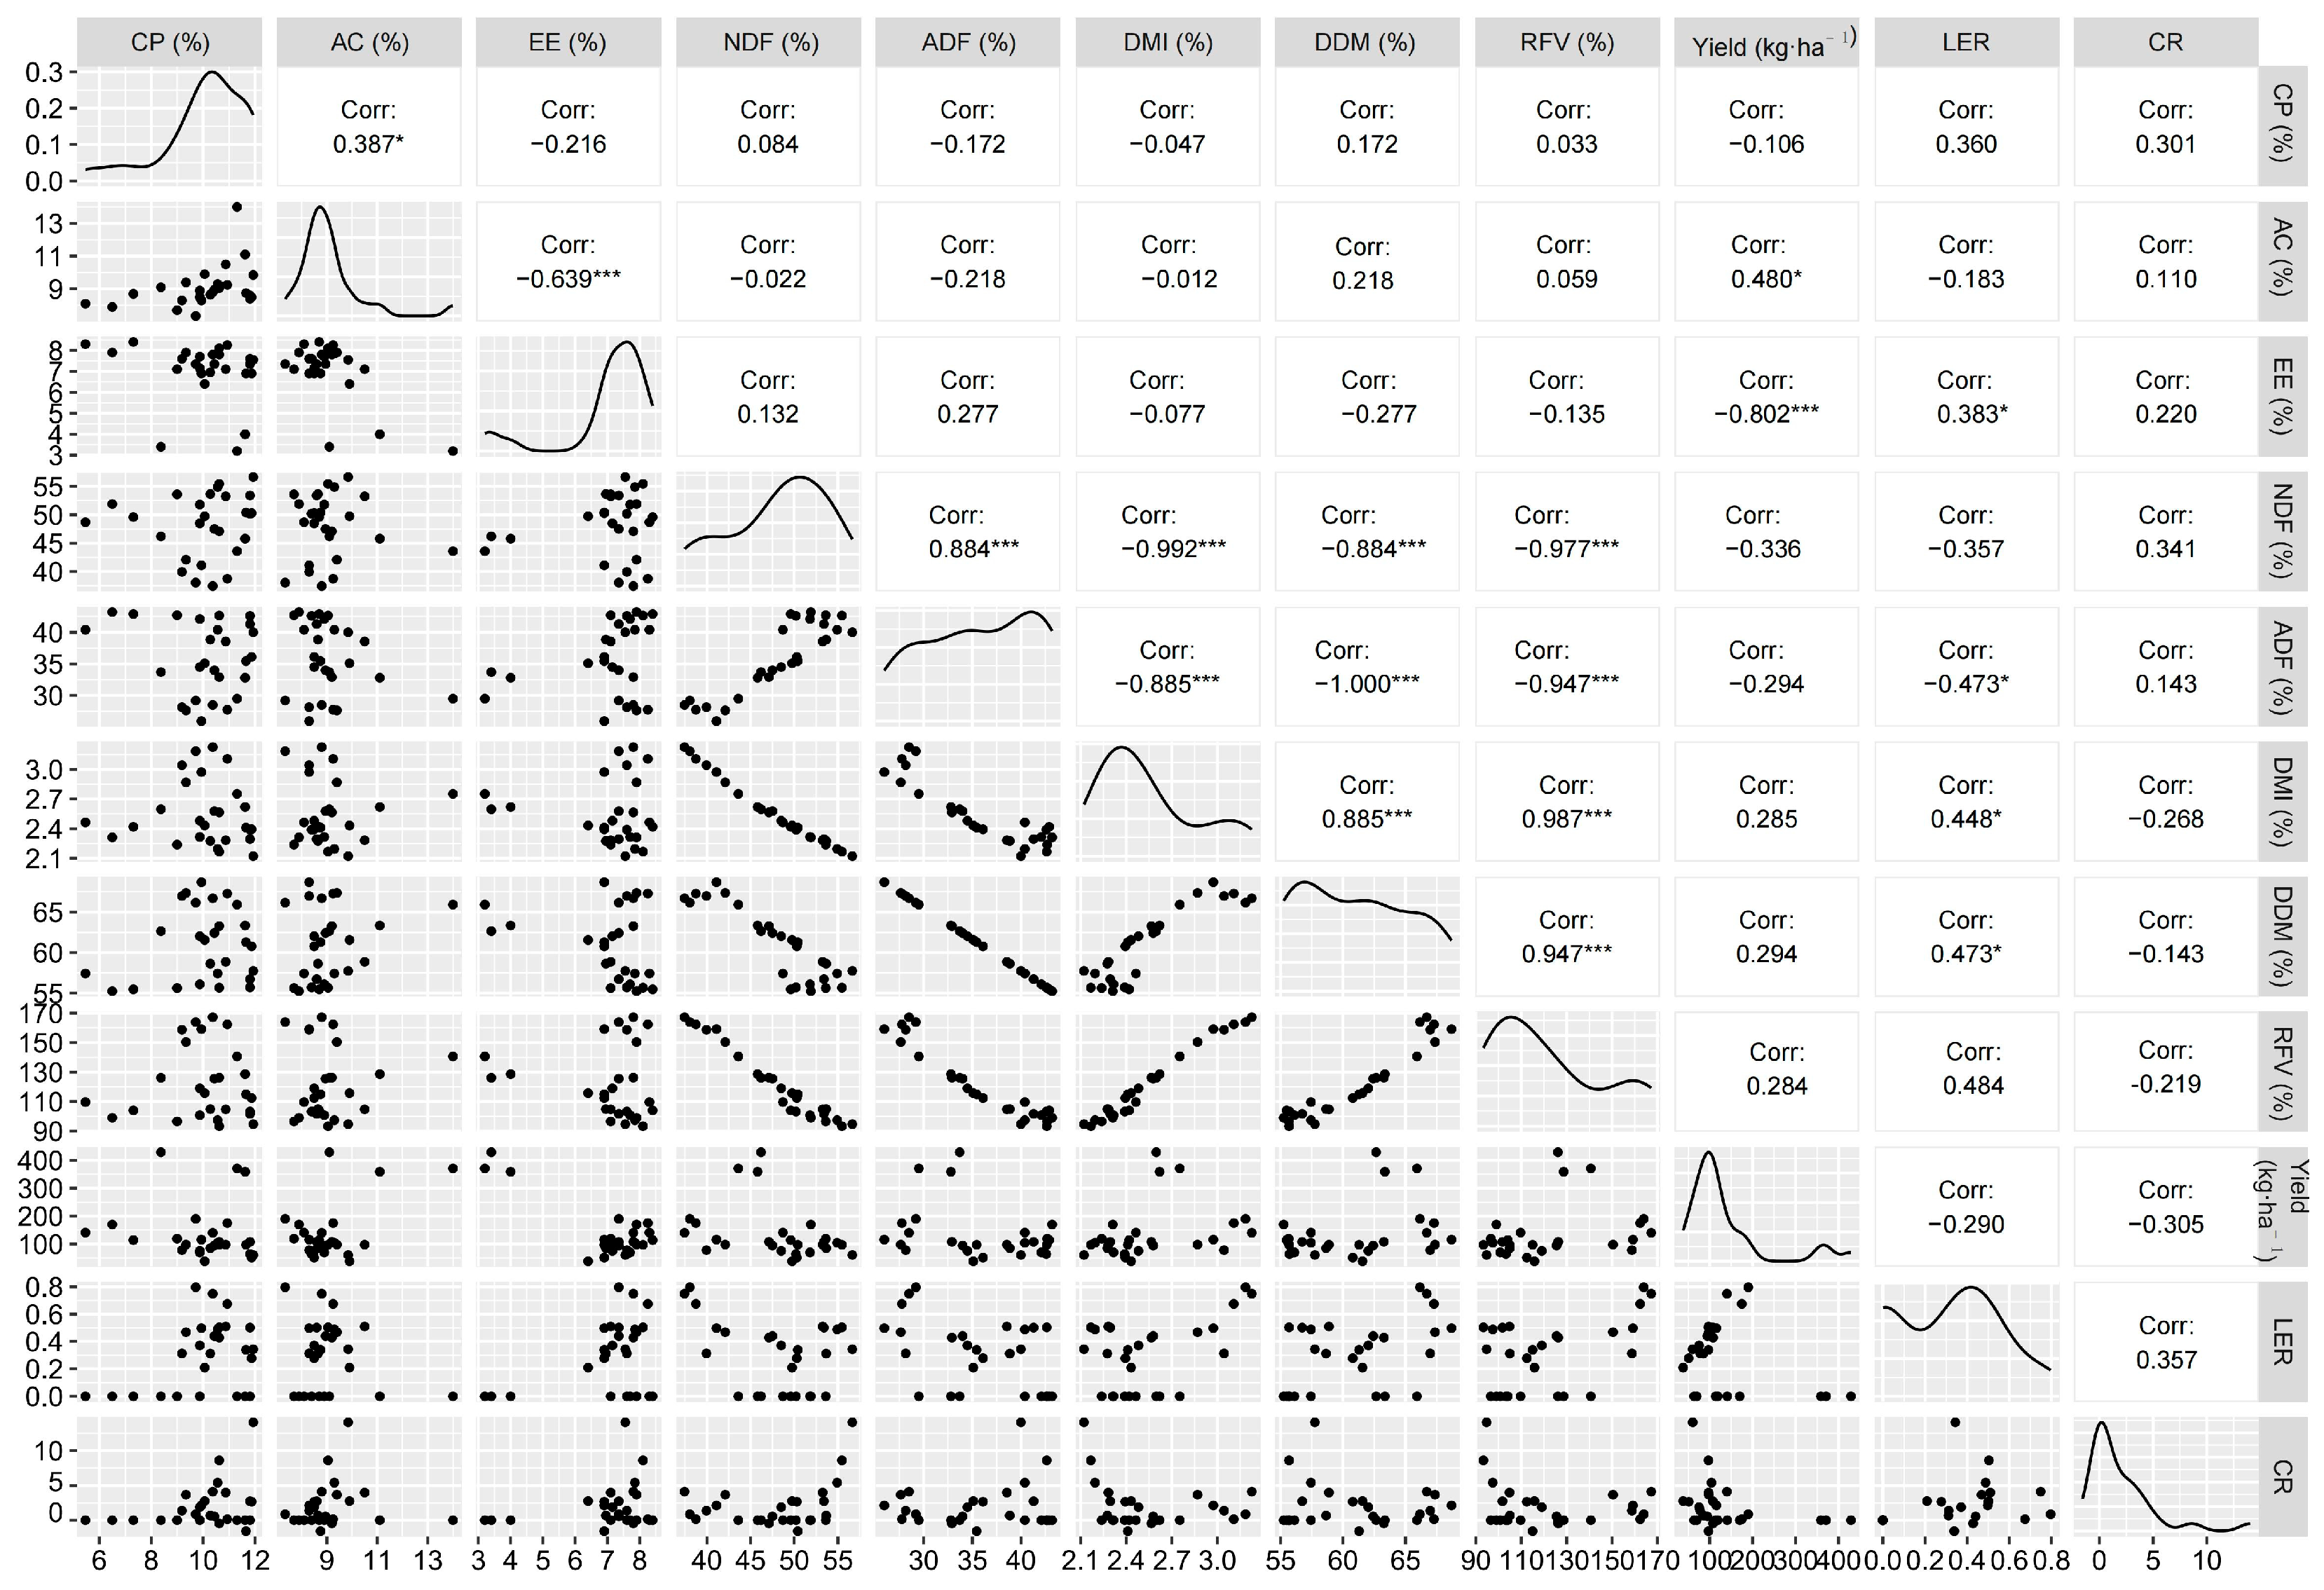
3.5.1. Correlation Analysis of Yield, Nutritional Quality, and Interspecific Competition

As anticipated from forage quality principles, the correlation heatmap (Figure 5) confirmed significant negative associations between neutral detergent fiber (NDF) and acid detergent fiber (ADF) with relative feed value (RFV), dry matter intake (DMI), and digestible dry matter (DDM) (p < 0.05). This aligns with the established understanding that fiber components reduce feed digestibility, as originally demonstrated by Van Soest et al. [30]. Land equivalent ratio (LER) showed significant positive correlations with crude protein (CP), RFV, DMI, and DDM (p < 0.05). Ash content was positively correlated with CP (p < 0.05) but negatively correlated with ether extract (EE) (p < 0.05), while hay yield exhibited a significant negative relationship with EE (p < 0.05).

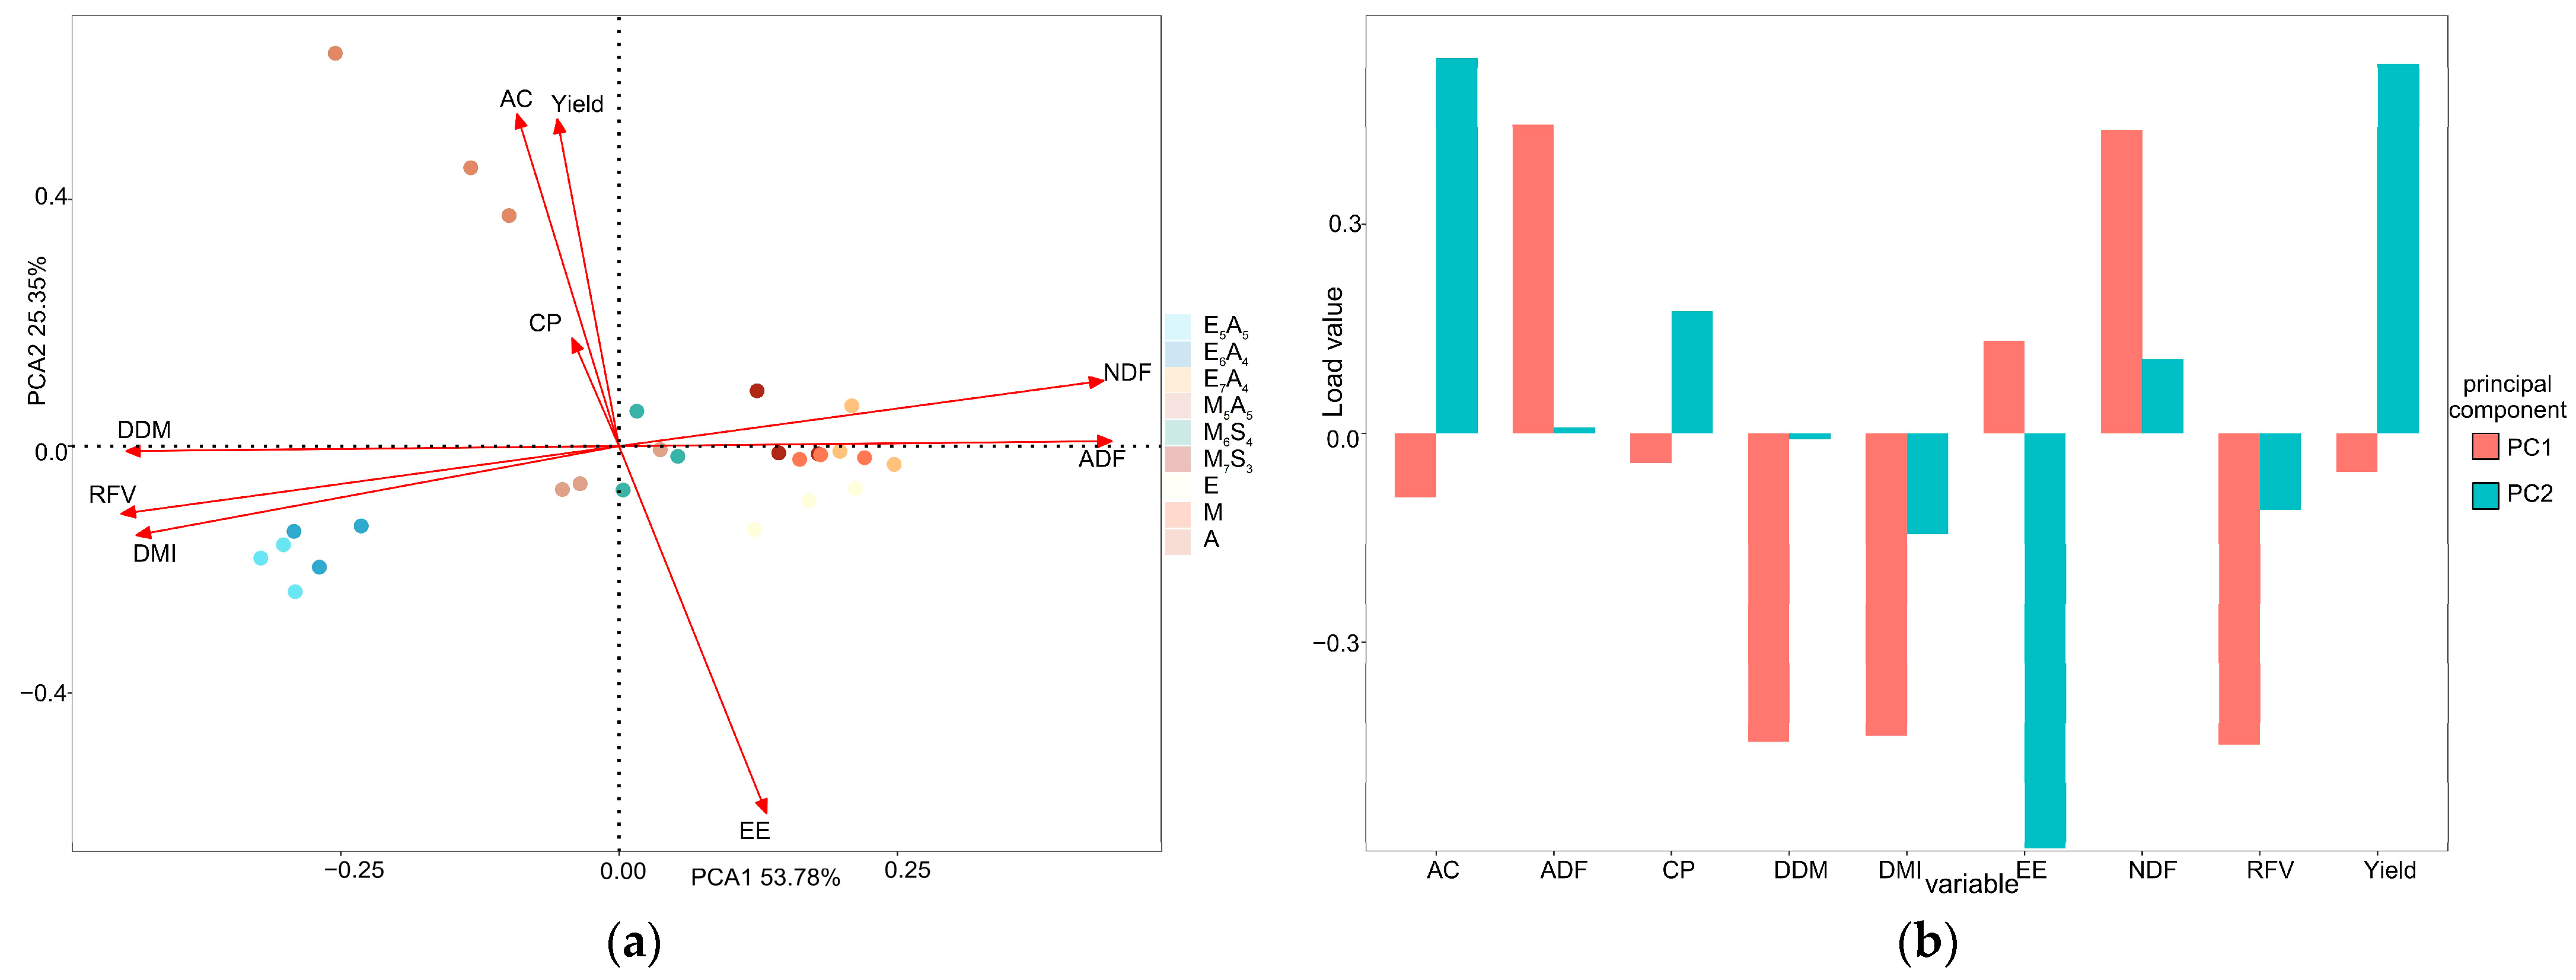
3.5.2. Principal Component Analysis of Yield, Nutritional Quality, and Interspecific Competition

Principal component analysis can combine multiple indicators into a few composite indicators for simplified analysis. For the mixed sowing of different treatments, the analysis covers nine production performance indicators: yield, CP, AC, EE, NDF/ADF, DMI, DDM, RFV. Principal component analysis (PCA) revealed that the first principal component (PCA1) accounted for 53.78% of the total variance, while the second principal component (PCA2) explained 25.35%, with a cumulative contribution rate of 79.13% (Figure 6a). Neutral detergent fiber (NDF) and acid detergent fiber (ADF) exhibited high positive loadings on both PCA1 and PCA2, whereas relative feed value (RFV), dry matter intake (DMI), and dry digestibility matter (DDM) showed high negative loadings on both PCA1 and PCA2 (Figure 6b). The mixed cropping treatment E5A5 demonstrated significant positive correlations with hay yield, LER, and NDF content. Overall, parameters with high loadings on PCA1 (e.g., NDF, ADF, CR, EE, RFV, DMI, and LER) served as primary indicators for evaluating mixed cropping effects in this system.

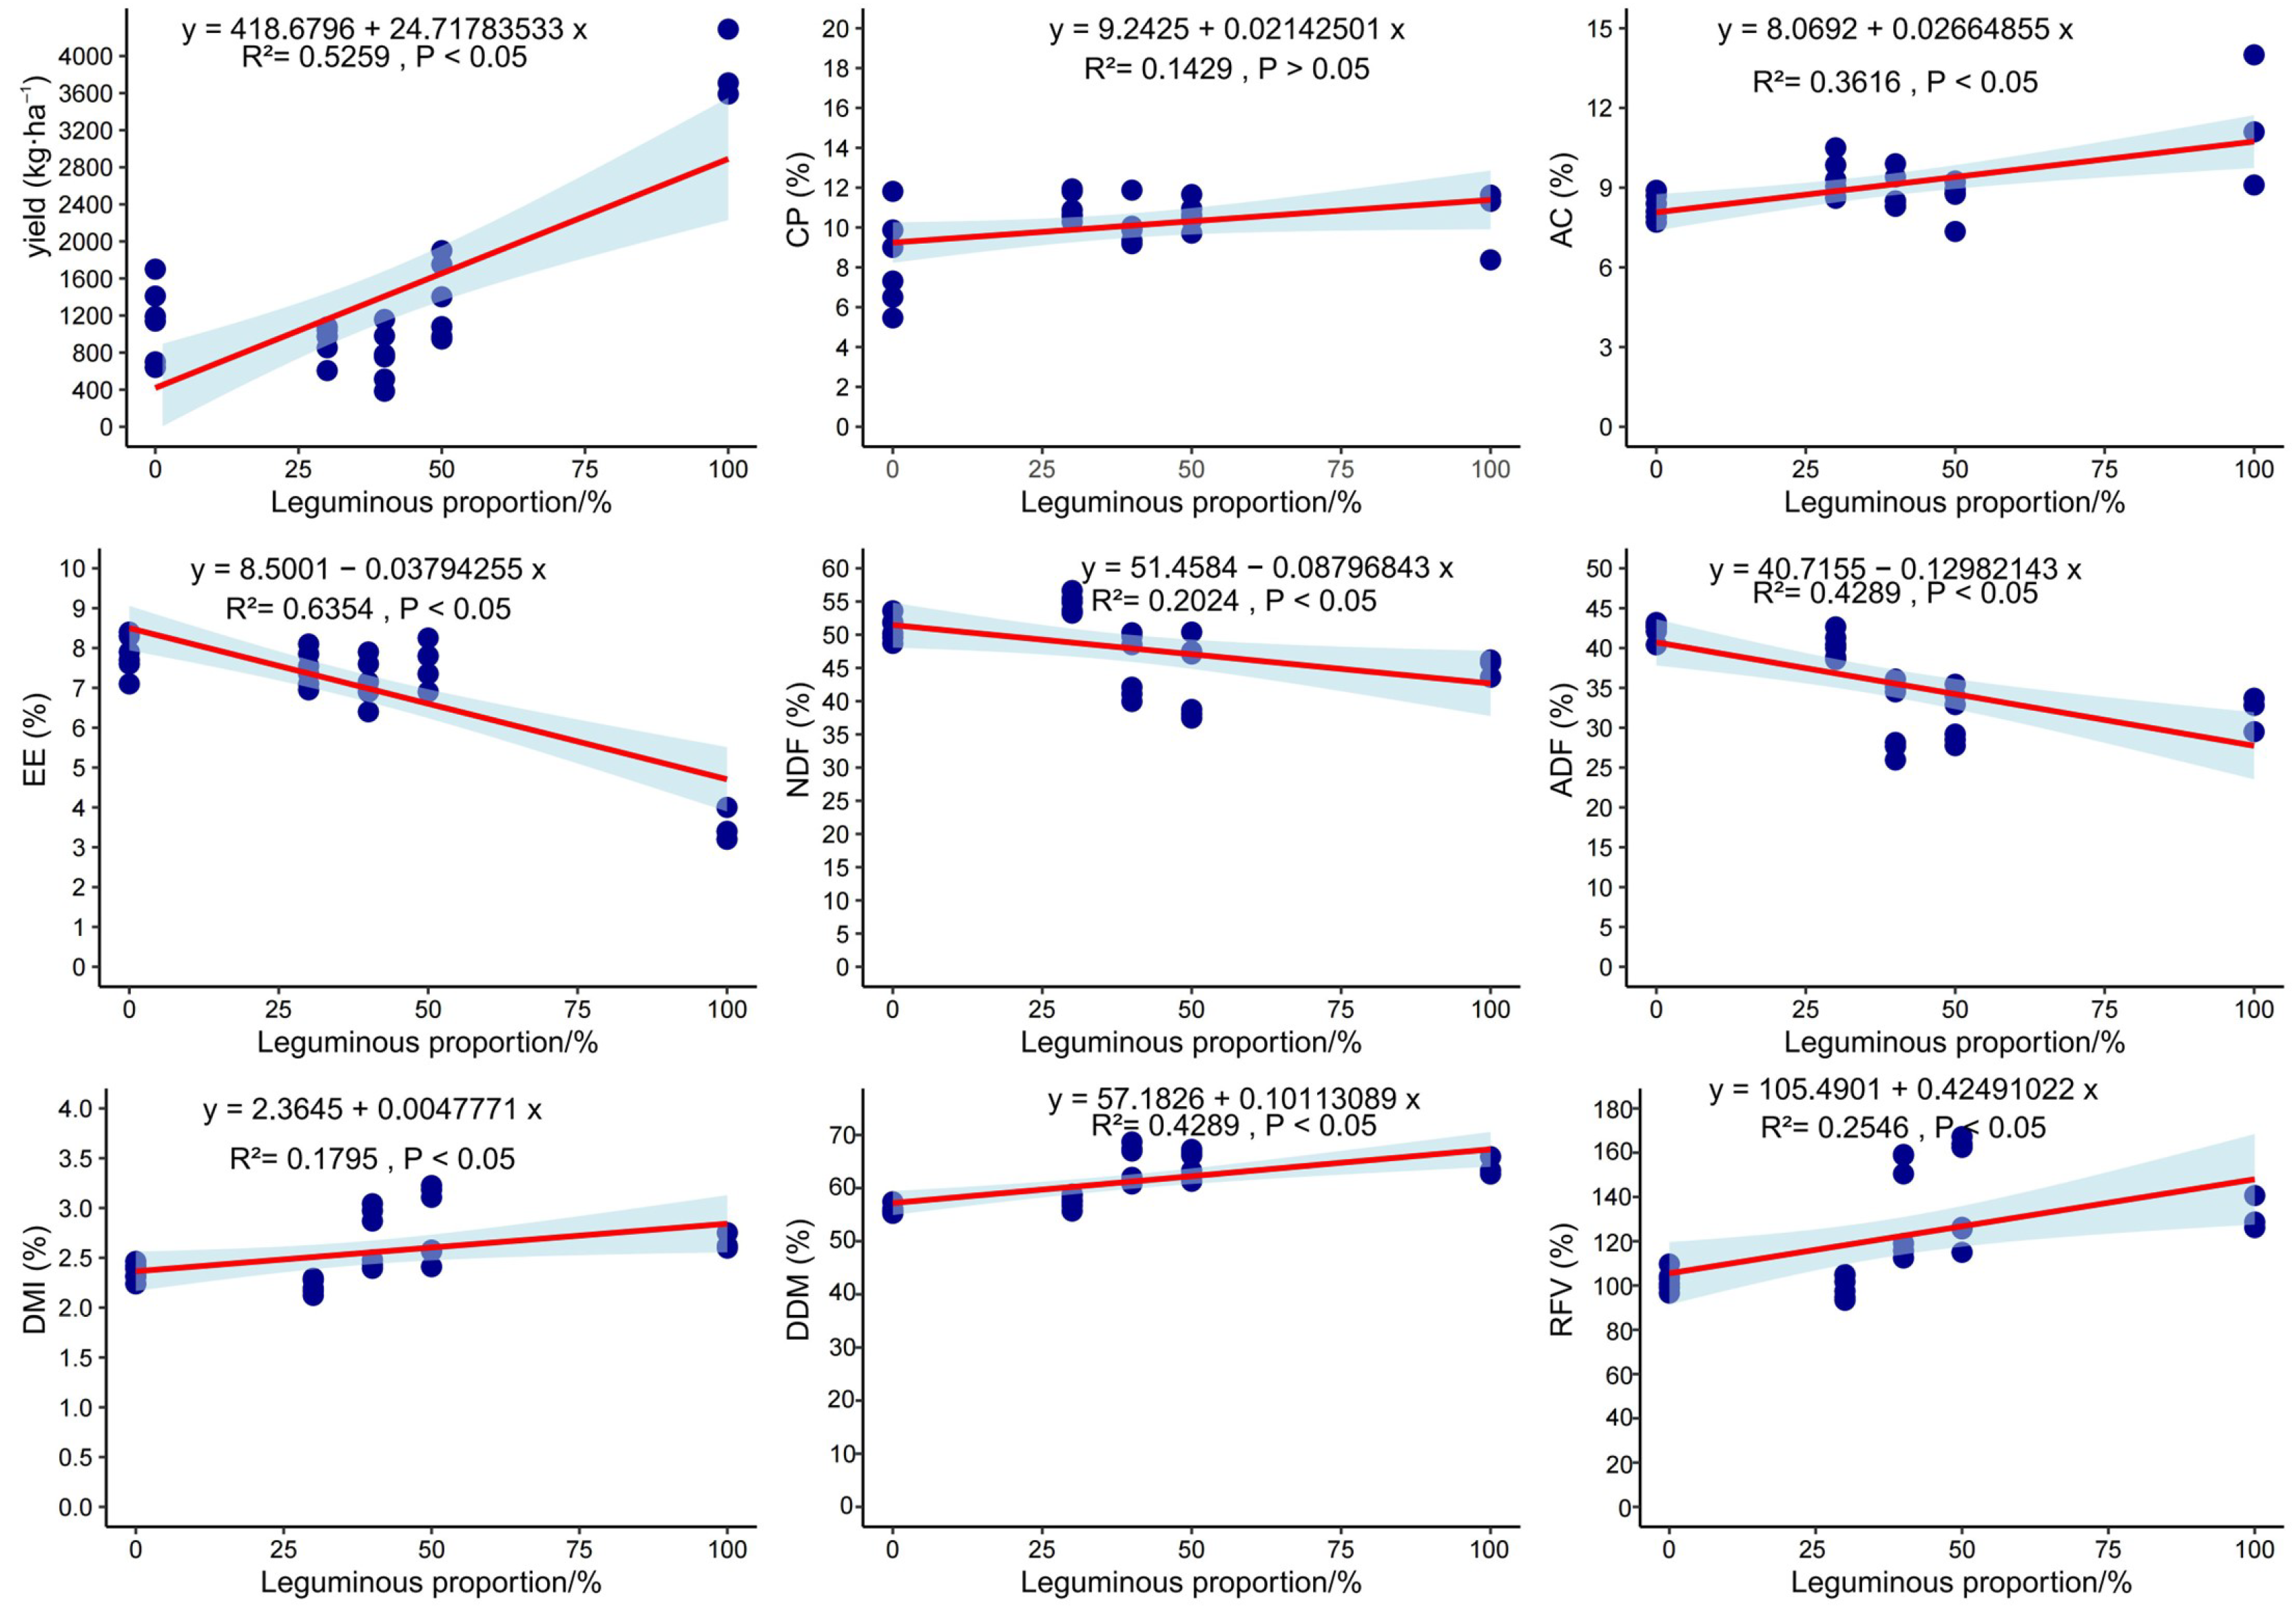
3.5.3. Linear Regression of Legume Proportion with Yield and Nutritional Quality

As shown in Figure 7, legume proportion exhibited significant positive correlations with hay yield, ash content, dry matter intake (DMI), digestible dry matter (DDM), and relative feed value (RFV) (p < 0.05), indicating that higher legume ratios enhance both forage productivity and nutritional quality. The forage yield increased most markedly with legume proportion (linear model: y = 418.68 + 24.72x). Legume proportion positively correlated with crude protein (CP), RFV, and DDM, while showing significant negative relationships with neutral detergent fiber (NDF), acid detergent fiber (ADF), and ether extract (EE) (p < 0.05). These results demonstrate that increasing legume proportion improves forage yield and nutritional value while effectively reducing fiber content (NDF and ADF).

3.6. Comprehensive Evaluation of Forage Production Performance

As shown in Table 6, The Entropy Weight-TOPSIS analysis revealed that treatment E5A5 achieved the highest similarity coefficient (0.558), demonstrating optimal mixed cropping performance in terms of both yield and nutritional quality. This finding highlights the 5:5 ratio of Dahurian wildrye to Standing milkvetch as the preferred planting configuration for sand-fixing vegetation restoration in the study region, effectively balancing productivity enhancement and resource competition mitigation.

4. Discussion

4.1. Effects of Mixed Cropping of Legumes and Grasses on Production Performance

Studies have demonstrated that legume–grass mixed cropping enhances forage yield and quality compared to monocultures, though these effects vary with species combinations and planting ratios [31,32]. In this study, the maximum heights for Standing milkvetch and Mongolian wheatgrass occurred under M7A3. This pattern suggests that the tall growth of Standing milkvetch provides shade for Mongolian wheatgrass seedlings, alleviating light and heat stress, while the dense tillering of Mongolian wheatgrass effectively suppresses weeds, reducing management inputs during Standing milkvetch’s establishment phase. This synergy suggests that M7A3 may enhance the growth of certain species, potentially through improved resource complementarity in mixed planting systems. Consistent with findings by Zhang et al. [33], our study observed superior hay yields in Dahurian wildrye–Standing milkvetch mixtures compared to Mongolian wheatgrass–Standing milkvetch combinations, likely attributable to the inherent yield advantages of Dahurian wildrye in sandy soils. The optimal 5:5 ratio for hay yield aligns with Sun et al. [34], where legume–rhizobial symbiosis for nitrogen fixation provides supplemental nitrogen to grasses [35], while spatiotemporal resource partitioning maximizes resource utilization efficiency [36,37]. However, the overall lower yields in our trial may be attributed to the semi-arid climate of the Mu Us Sandy Land, characterized by limited and uneven precipitation that restricts plant growth [38]. Moreover, drought stress directly impairs legume growth and nitrogen fixation efficiency, which indirectly compromises the performance of associated crops in intercropping systems, ultimately leading to reduced forage productivity [39].

4.2. Effects of Mixed Cropping of Legumes and Grasses on Nutritional Quality

Forage nutritional quality is critical for livestock production, with nutrient composition directly determining feed value [40]. Current studies indicate that mixed cropping systems not only enhance hay yield but also improve comprehensive nutritional profiles compared to monocultures [41]. In this study, mixed cropping treatments exhibited higher crude protein (CP) content than Standing milkvetch and Mongolian wheatgrass monocultures, significantly surpassing Dahurian wildrye monoculture. This aligns with Lithourgidis et al. [24], where legume–grass mixtures showed elevated CP due to nitrogen fixation by legumes and subsequent nitrogen transfer to grasses, coupled with spatiotemporal resource complementarity [42]. However, the absence of a clear CP gradient with increasing legume proportions may stem from the actual legume biomass in mixed stands being lower than theoretical planting ratios. Specifically, on one hand, the plant height of Standing milkvetch in this study was 30–50% lower compared to Dagalgan’s research [17]; in the Horqin Sandy Land, it is impossible to reach the theoretical plant height and biomass in the sand. On the other hand, when compared to monoculture, legume growth in mixed cropping was suppressed (the competitive ratio and relative yield were generally lower than those of grass), resulting in a reduction in biomass, explaining why crude protein (CP) showed non-significant increases despite higher legume sowing proportions. Monoculture Standing milkvetch displayed higher ash content than intercropped treatments, while grass monocultures (Dahurian wildrye and Mongolian wheatgrass) showed the lowest ash levels, likely due to reduced mineral competition in single-species stands enabling efficient nutrient uptake [43]. Notably, Dahurian wildrye–Standing milkvetch mixtures at 6:4 and 5:5 ratios significantly reduced neutral detergent fiber (NDF) and acid detergent fiber (ADF) compared to Standing milkvetch monoculture, consistent with Zhao et al. [44]. The mixed sowing of Dahurian wildrye and Standing milkvetch at a 5:5 ratio achieved the highest relative feeding value (RFV), which aligns with the results reported by ZAMANIAN et al. [45]. It can be seen from correlation analysis and principal component analysis that this phenomenon is primarily driven by the higher digestible dry matter (DDM) and dry matter intake (DMI), or lower acid detergent fiber (ADF) and neutral detergent fiber (NDF) in this treatment, as well as the potentially enhanced utilization of environmental factors (e.g., water, nutrients, and light), collectively contributing to improved relative feeding value (RFV) [46].

4.3. Effects of Mixed Cropping of Legumes and Grasses on Interspecific Competition

In mixed cropping systems, differential competition for environmental resources among crops alters their status and functions within the community, thereby influencing growth characteristics and community structure [47]. The Land Equivalent Ratio (LER), a key metric for evaluating land-use efficiency in mixed cropping systems, is widely used to assess the advantages and disadvantages of forage mixtures [48]. In this study, all mixed cropping combinations exhibited LER and RYT values < 1, indicating net interspecific competition dominated the system. We attribute this outcome primarily to high niche overlap and environmental context, where competitive effects overwhelmed complementarity; it is manifested by a decrease in plant height and biomass. Reasons for this include the fact that the growth peak of grasses coincided with the growth period of legumes when they were planted together—intensifying early-stage competition—while the rapid vertical growth of Dahurian wildrye formed dense canopies, which substantially reduced legume photosynthesis during their growth period. Concurrently, sandy soil conditions amplified water competition, thereby critically limiting legume nodulation [49]. In this study, multiple metrics indicated that grasses generally exhibited stronger competitive strength than legumes. This finding is consistent with the results reported by Wei Kongtao in the Loess Plateau region during the first year of mixed cropping, where grasses showed greater CR, RY, and A values than legumes [12]. Notably, E7A3 achieved the highest grass CR (9.36), likely due to rapid canopy development and light competition through shading (according to the plant height during the growing period, the early grass family was significantly higher than the leguminous family). Grasses typically dominate during early growth stages, suppressing legume growth and reinforcing grass dominance [29]. Second, whether legumes or grasses hold a competitive advantage or disadvantage in mixed cropping systems largely depends on the initial seeding ratio [14]. Therefore, the higher proportion of grasses in these mixtures further contributed to this competitive asymmetry.

4.4. Relationships Among Yield, Nutritional Quality, and Interspecific Competition

The TOPSIS comprehensive evaluation system effectively overcomes the limitations of single-factor assessments and minimizes subjective biases, enhancing the accuracy of multidimensional analyses [50]. Our results demonstrated significant positive correlations between forage yield and LER, while neutral detergent fiber (NDF) and acid detergent fiber (ADF) showed negative relationships with relative feed value (RFV) and digestible dry matter (DDM). Legume proportion emerged as a primary driver of both yield and nutritional quality, underscoring its critical role in optimizing forage production potential [51,52]. The optimal treatment, E5A5, highlights the suitability of balanced legume–grass ratios for vegetation establishment in the Mu Us Sandy Land, promoting forage productivity and nutritional quality.

5. Conclusions

The production performance and nutritional quality of legume–grass mixed cropping systems are differentially influenced by species combinations, planting ratios, and their interactions. During the first year of establishment, all mixed cropping treatments exhibited significantly higher forage yields compared to grass monocultures, though Land Equivalent Ratios (LER) and Relative Yield Totals (RYT) remained below 1, indicating persistent interspecific competition with grasses demonstrating superior competitive abilities over legumes. Intercropped forages showed elevated crude protein (CP), ether extract (EE), and ash content alongside reduced neutral detergent fiber (NDF) and acid detergent fiber (ADF) levels, collectively enhancing relative feed value (RFV). Treatments E5A5 (Dahurian wildrye: Standing milkvetch = 5:5) and E6A4 (6:4 ratio) achieved the highest RFV, with RFV declining as legume proportions decreased. The Entropy Weight-TOPSIS model identified E5A5 as the optimal configuration with the highest comprehensive score (0.558). These findings demonstrate the feasibility of both monoculture and mixed cropping systems in sand-stabilizing vegetation zones within the Mu Us Sandy Land. Specifically, the 5:5 Dahurian wildrye–Standing milkvetch mixed cropping system balances high yield and nutritional quality, making it recommendable for large-scale adoption in arid sandy ecosystems.

Author Contributions

Conceptualization, Y.M., H.X., L.Z. and R.P.; formal analysis, H.X., Y.M. and S.Z.; writing—original draft, Y.M., H.X. and L.Z.; resources, H.X., L.Z. and R.P.; writing—review and editing, H.G., H.W. and C.W.; validation, R.P. and L.Z.; funding acquisition, H.X. and L.Z. All authors have read and agreed to the published version of the manuscript.

Funding

This research was funded by “The Open bidding for selecting the best candidates” project of lnner Mongolia Autonomous Region (2024JBGS0020) and The Inner Mongolia Forestry Science Research Institute’s Research Capacity Enhancement “Unveiling and Leading” project (2024NLTS03).

Institutional Review Board Statement

Not applicable.

Data Availability Statement

Data will be made available upon request.

Conflicts of Interest

The authors declare no conflicts of interest.

References

  1. Xu, Z.N.; Liang, W.; Lei, J.H.; Wu, Y.X.; Wang, Z.G. Monitoring and assessment of desertification reversal in ecologically fragile areas: A case study of the Mu Us Sandy Land. J. Environ. Manag. 2025, 373, 123695. [Google Scholar] [CrossRef]
  2. Yan, F.; Wu, B.; Wang, Y. Estimating aboveground biomass in Mu Us Sandy Land using Landsat spectral derived vegetation indices over the past 30 years. J. Arid Land 2013, 5, 521–530. [Google Scholar]
  3. Fei, B.; Ma, H.; Yin, J.; Zhang, L.; Li, J.; Xiu, X.; Zhou, D.; Pang, Y.; Zhang, Y.; Jia, X.; et al. Landscape Dynamics of the Mu Us Sandy Land Based on Multi-Source Remote Sensing Images. Land 2024, 13, 977. [Google Scholar] [CrossRef]
  4. Huang, L.M.; Wang, Z.W.; Pei, Y.W.; Zhu, X.C.; Jia, X.X.; Shao, M.A. Adaptive water use strategies of artificially revegetated plants in a water-limited desert: A case study from the Mu Us Sandy Land. J. Hydrol. 2024, 644, 132103. [Google Scholar] [CrossRef]
  5. Wang, X.M.; Hua, T.; Ma, W.Y. Responses of aeolian desertification to a range of climate scenarios in China. Solid Earth 2016, 7, 959–964. [Google Scholar]
  6. Tahir, M.; Li, C.; Zeng, T.; Xin, Y.; Chen, C.; Javed, H.H.; Yang, W.; Yan, Y. Mixture Composition Influenced the Biomass Yield and Nutritional Quality of Legume–Grass Pastures. Agronomy 2022, 12, 1449. [Google Scholar] [CrossRef]
  7. Lu, Y.; Mu, L.; Yang, M.; Yang, H. Lucerne Proportion Regulates Competitive Uptake for Nitrogen and Phosphorus in Lucerne and Grass Mixtures on the Loess Plateau of China. Agronomy 2022, 12, 1258. [Google Scholar] [CrossRef]
  8. Darambazar, E.; Larson, K.; Schoenau, J.; Wang, G.; Biligetu, B.; Damiran, D.; Lardner, H.A. Evaluation of Alfalfa and Grass Species in Binary and Complex Mixtures on Performance under Soil Salinity Conditions. Agronomy 2022, 12, 1672. [Google Scholar] [CrossRef]
  9. Raza, M.A.; Gul, H.; Wang, J.; Yasin, H.S.; Qin, R.; Khalid, M.H.B.; Naeem, M.; Feng, L.Y.; Iqbal, N.; Gitari, H.; et al. Land productivity and water use efficiency of maize-soybean strip intercropping systems in semi-arid areas: A case study in Punjab Province, Pakistan. J. Clean. Prod. 2021, 308, 127282. [Google Scholar] [CrossRef]
  10. Soe Htet, M.N.; Wang, H.; Yadav, V.; Sompouviseth, T.; Feng, B. Legume Integration Augments the Forage Productivity and Quality in Maize-Based System in the Loess Plateau Region. Sustainability 2022, 14, 6022. [Google Scholar] [CrossRef]
  11. Kyriazopoulos, A.P.; Abraham, E.M.; Parissi, Z.M.; Koukoura, Z.; Nastis, A.S. Forage production and nutritive value of Dactylis glomerata and Trifolium subterraneum mixtures under different shading treatments. Grass Forage Sci. 2013, 68, 72–82. [Google Scholar]
  12. Wei, K.; Yu, X.; Bai, M.; Ma, K.; Liu, Y.; Zhang, X. Effects of Mixing Ratio on Forage Yield and Quality of Grazing-type Mixed Pastures in Semi-arid Area. Chin. J. Grassl. 2022, 44, 56–65. (In Chinese) [Google Scholar]
  13. Wang, S.; Chen, G.; Yang, Y.; Zeng, Z.; Hu, Y.; Zang, H. Sowing ratio determines forage yields and economic benefits of oat and common vetch intercropping. Agron. J. 2021, 113, 2607–2617. [Google Scholar]
  14. Li, X.; Shi, S.; Huang, Z.; Li, G.; Wu, F.; Zhang, H. Effects of Different Forage Mixed-sowing Patterns on Interspecific Relationships in Loess Hilly Region. Acta Agrestia Sin. 2021, 29, 1318–1326. (In Chinese) [Google Scholar]
  15. Fang, W. Effects of Different Grass-Legume Mixed-sowing Combinations and Ratios on Forage Yield and Quality in Alpine Region. Qinghai Pratac. 2022, 31, 1–8. (In Chinese) [Google Scholar]
  16. Akdeniz, H.; Hosaflioglu, I.; Koç, A.; Hossain, A.; Islam, M.S.; Iqbal, M.A.; Imtiaz, H.; Gharib, H.; El Sabagh, A. Evaluation of Herbage Yield and Nutritive Value of Eight Forage Crop Species. Appl. Ecol. Environ. Res. 2019, 17, 5571–5581. [Google Scholar]
  17. Dabalgan. Evaluation and Screening of Suitable Native Grass Species and Mixed-Sowing Effects in Vegetation Restoration of Horqin Sandy Land. Ph.D. Thesis, Inner Mongolia Agricultural University, Hohhot, China, 2019. (In Chinese).
  18. Ma, X. Vegetation Restoration of Degraded Grasslands in Horqin and Its Response to Grazing. Master’s Thesis, Chinese Academy of Sciences, Beijing, China, 2019. (In Chinese). [Google Scholar]
  19. Zhang, L. Evaluation of Restoration Effects of Different Vegetation Types in Mu Us Sandy Land. Ph.D. Thesis, Beijing Forestry University, Beijing, China, 2024. (In Chinese). [Google Scholar]
  20. GB/T 6433-2006; Determination of Crude Fat in Feeds. National Feed Quality Supervision and Inspection Center, General Administration of Quality Supervision, Inspection and Quarantine of the People’s Republic of China (AQSIQ); Standardization Administration of the People’s Republic of China (SAC): Beijing, China, 2006; p. 12.
  21. GB/T 6438-2007; Determination of Crude Ash in Feeds. National Feed Quality Supervision and Inspection Center, General Administration of Quality Supervision, Inspection and Quarantine of the People’s Republic of China (AQSIQ); Standardization Administration of the People’s Republic of China (SAC): Beijing, China, 2007; p. 12.
  22. NY/T 1459-2007; Determination of Acid Detergent Fiber in Feed. Ministry of Agriculture Feed Quality Supervision and Inspection and Testing Center (Xi’an), Ministry of Agriculture of the People’s Republic of China (Industry Standard-Agriculture): Beijing, China, 2007; 6p.
  23. GB/T 42306-2022; Determination of Neutral Detergent Fiber (NDF) in Feeds. Sichuan Well Testing Technology Co., Ltd., Shandong Provincial Livestock Product Quality Safety Center, Department of Agriculture and Rural Affairs of Qinghai Province, State Administration for Market Regulation (SAMR); Standardization Administration of the People’s Republic of China (SAC): Beijing, China, 2022; p. 16.
  24. Lithourgidis, A.S.; Vasilakoglou, I.B.; Dhima, K.V.; Dordas, C.A.; Yiakoulaki, M.D. Forage yield and quality of common vetch mixtures with oat and triticale in two seeding ratios. Field Crops Res. 2006, 99, 106–113. [Google Scholar]
  25. Williams, A.C.; Mccarthy, B.C. A new index of interspecific competition for replacement and additive designs. Ecol. Res. 2001, 16, 29–40. [Google Scholar]
  26. Zhang, Y.; Sun, Z.; Feng, C.; Du, G.; Feng, L.; Bai, W.; Zhang, Z.; Zhang, D.; Yang, J.; Li, C.; et al. Intercropping maize and peanut under semi-arid conditions is a zero-sum game. Field Crops Res. 2025, 326, 109833. [Google Scholar]
  27. Dhima, K.V.; Lithourgidis, A.S.; Vasilakoglou, I.B.; Dordas, C.A. Competition indices of common vetch and cereal intercrops in two seeding ratio. Field Crops Res. 2006, 100, 249–256. [Google Scholar]
  28. Xu, B.C.; Xu, W.Z.; Huang, J.; Shan, L.; Li, F.-M. Biomass allocation, relative competitive ability and water use efficiency of two dominant species in semiarid Loess Plateau under water stress. Plant Sci. 2011, 181, 644–651. [Google Scholar]
  29. Wei, K.; Xiang, H.; Liu, Y.; Zhang, X.; Yu, X. Mixed cropping of Medicago ruthenica-Bromus inermis exhibits higher yield and quality advantages in the Longxi loess plateau region of Northwest China. Front. Sustain. Food Syst. 2024, 8, 1411687. [Google Scholar]
  30. Van Soest, P.J.; Robertson, J.B.; Lewis, B.A. Methods for dietary fiber, neutral detergent fiber, and nonstarch polysaccharides in relation to animal nutrition. J. Dairy Sci. 1991, 74, 3583–3597. [Google Scholar]
  31. Luo, F.; Liu, W.H.; Mi, W.B.; Ma, X.; Liu, K.Q.; Ju, Z.L.; Li, W. Legume-grass mixtures increase forage yield by improving soil quality in different ecological regions of the Qinghai-Tibet Plateau. Front. Plant Sci. 2023, 14, 1280771. [Google Scholar] [CrossRef]
  32. Favre, J.R.; Castiblanco, T.M.; Combs, D.K.; Wattiaux, M.A.; Picasso, V.D. Forage nutritive value and predicted fiber digestibility of Kernza intermediate wheatgrass in monoculture and in mixture with red clover during the first production year. Anim. Feed Sci. Technol. 2019, 258, 114298. [Google Scholar]
  33. Zhang, H.; Zhu, L.; Xu, X. Effects of Grass-Legume Mixed-sowing under Different Irrigation Amounts in the Semi-arid Zone of Central Ningxia. Pratac. Sci. 2017, 34, 777–787. (In Chinese) [Google Scholar]
  34. Sun, J.; Gong, L.; Lian, L.; Cui, G.; Yin, H.; Zhang, Y.; Fu, J. Effects of Altitude and Mixing Ratio on Forage Yield and Quality of Oat and Vicia sativa. Pratac. Sci. 2018, 35, 2438–2449. (In Chinese) [Google Scholar]
  35. Ojeda, J.J.; Caviglia, O.P.; Agnusdei, M.G.; Errecart, P.M. Forage yield, water- and solar radiation-productivities of perennial pastures and annual crops sequences in the south-eastern Pampas of Argentina. Field Crops Res. 2018, 221, 19–31. [Google Scholar]
  36. Luo, C.; Zhao, L.; Zhao, X.; Xu, S.; He, F.; Xu, Q.; Chen, X. Screening of the Optimal Mixing Ratio of Oat and Vicia sativa in Qinghai Lake Area. Grassl. Turf 2019, 39, 95–99. (In Chinese) [Google Scholar]
  37. Jamal, N.; Munir, A.; Harun, G.; Li, T.; Yuan, C.; Bo, Z.X. Maize/soybean intercropping increases nutrient uptake, crop yield and modifies soil physio-chemical characteristics and enzymatic activities in the subtropical humid region based in Southwest China. BMC Plant Biol. 2024, 24, 434. [Google Scholar]
  38. Yuan, H.; Zhang, Q.; Zhu, Y.; Xia, B.; Wang, W. Multi-scale Analysis of Groundwater Drought in Mu Us Sandy Land Based on GGSI. Acta Ecol. Sin. 2025, 8, 1–17. (In Chinese) [Google Scholar]
  39. Iqbal, N.; Sadras, V.; Denison, R.F.; Zhou, Y.; Denton, M. Clade-dependent effects of drought on nitrogen fixation and its components-Number, size, and activity of nodules in legumes. Field Crops Res. 2022, 284, 108586. [Google Scholar] [CrossRef]
  40. Ashoori, N.; Abdi, M.; Golzardi, F.; Ajalli, J.; Ilkaee, M.N. Forage potential of sorghum-clover intercropping systems in semi-arid conditions. Bragantia 2021, 80, 1–11. [Google Scholar]
  41. Mu, L.; Su, K.; Zhou, T.; Yang, H. Yield performance, land and water use, economic profit of irrigated spring wheat/alfalfa intercropping in the inland arid area of northwestern China. Field Crops Res. 2023, 303, 109116. [Google Scholar] [CrossRef]
  42. Bo, P.T.; Bai, Y.; Dong, Y.; Shi, H.; Soe Htet, M.N.; Samoon, H.A.; Zhang, R.; Tanveer, S.K.; Hai, J. Influence of Different Harvesting Stages and Cereals–Legume Mixture on Forage Biomass Yield, Nutritional Compositions, and Quality under Loess Plateau Region. Plants 2022, 11, 2801. [Google Scholar] [CrossRef] [PubMed]
  43. Li, C.; Zhang, C.; Yu, Y.; Liu, Y.; Yang, Z.; Feng, B.; Zhang, X.; Zhang, X.; Yang, X.; Dong, Q. Comprehensive Benefit Evaluation of Different Forage Monocultures and Mixed-sowing in Alpine Region. Pratac. Sci. 2023, 40, 1875–1887. (In Chinese) [Google Scholar]
  44. Zhao, B.; Zhan, Y.; Fang, J.; Zhou, Q.; Wang, H. Effects of Mixing Ratio on Production Performance of Oat and Vicia sativa. Chin. J. Grassl. 2024, 46, 81–90. (In Chinese) [Google Scholar]
  45. Zamanian, M.; Golzardi, F.; Gitari, H.; Nungula, E.; Salehi, F.; Heydarzadeh, S. Enhancing forage nutritional value in Persian clover (Trifolium resupinatum) and crimson clover (Trifolium incarnatum) through intercropping and optimized seeding rate. Cogent Food Agric. 2024, 10, 2410459. [Google Scholar] [CrossRef]
  46. Chiyaneh, S.F.; Rezaei-Chiyaneh, E.; Amirnia, R.; Afshar, R.K.; Siddique, K.H.M. Intercropping medicinal plants is a new idea for forage production: A case study with ajowan and fenugreek. Food Energy Secur. 2024, 13, 14. [Google Scholar] [CrossRef]
  47. Wang, X.; Cao, W.; Wang, S.; Li, X.; Li, W.; Liu, Y.; Wang, X. Effects of Perennial Legume-Grass Mixed-sowing on Forage Yield and Quality in Hexi Corridor. Pratac. Sci. 2021, 38, 1339–1350. (In Chinese) [Google Scholar]
  48. Adam, A.M.; Giller, K.E.; Rusinamhodzi, L.; Rasche, F.; Koomson, E.; Marohn, C.; Cadisch, G. Enhancing the resilience of intercropping systems to changing moisture conditions in Africa through the integration of grain legumes: A meta-analysis. Field Crops Res. 2025, 321, 109663. [Google Scholar] [CrossRef]
  49. Li, S.; Wang, N.; Zheng, W.; Zhu, Y.; Wang, X.; Ma, J.; Zhu, J. Comparison of Over-yielding and Diversity Effects between Annual and Perennial Legume-Grass Mixed Pastures. Chin. J. Plant Ecol. 2021, 45, 23–37. (In Chinese) [Google Scholar]
  50. Zheng, W.; Zhu, J.; Jianarguli; Li, H.; Zhang, J. Effects of Different Mixed-sowing Methods on Production Performance of Legume-Grass Mixed Pastures. Chin. J. Grassl. 2011, 33, 45–52. (In Chinese) [Google Scholar]
  51. Bacchi, M.; Monti, M.; Calvi, A.; Lo Presti, E.; Pellicanò, A.; Preiti, G. Forage Potential of Cereal/Legume Intercrops: Agronomic Performances, Yield, Quality Forage and LER in Two Harvesting Times in a Mediterranean Environment. Agronomy 2021, 11, 121. [Google Scholar] [CrossRef]
  52. Wang, T.; Wang, B.; Xiao, A.; Lan, J. Optimizing Seeding Ratio for Legume Forage to Maximize System Productivity and Resource Use Efficiency in Mixed Cropping Systems. Agriculture 2024, 14, 1249. [Google Scholar] [CrossRef]
Figure 1. Average temperature and precipitation from 2014 to 2023 and temperature (a) and precipitation from May to October 2024 (b).
Agriculture 15 01474 g001
Figure 2. Schematic diagram of plant planting patterns.
Agriculture 15 01474 g002
Figure 3. Effect of cropping of legumes and grasses blending on hay yield. Note: different lowercase letters indicate significant differences between treatments for the same species and sampling date (p < 0.05).
Agriculture 15 01474 g003
Figure 4. Effect of cropping of legumes and grasses on nutritional quality. Note: CP: Crude Protein, AC: Ash Content, EE: Ether Extract, NDF/ADF: Neutral/Acid Detergent Fiber, DMI: Dry Matter Intake, DDM: Dry Digestibility Matter, RFV: Relative Feed Value. Different lowercase letters indicate significant differences between treatments for the same species and sampling date (p < 0.05).
Agriculture 15 01474 g004
Figure 5. Correlation analysis of yield, nutritional quality, and interspecific competition. Note: ns, p > 0.05; *, p < 0.05, **, p < 0.01, ***, p < 0.001; CP: Crude Protein, AC: Ash Content, EE: Ether Extract, NDF/ADF: Neutral/Acid Detergent Fiber, DMI: Dry Matter Intake, DDM: Dry Digestibility Matter, RFV: Relative Feed Value., LER: Land Equivalent Ratio. CR: Competition Ratio. The line graphs on the diagonal are the distribution density graphs of the data of each parameter itself.
Agriculture 15 01474 g005
Figure 6. (a) Description of principal component analysis of yield, nutritional quality and interspecific competition; (b) description of bar plot of PCA loadings: contribution of variables to PC1 and PC2. Note: CP: Crude Protein, AC: Ash Content, EE: Ether Extract, NDF/ADF: Neutral/Acid Detergent Fiber, DMI: Dry Matter Intake, DDM: Dry Digestibility Matter, RFV: Relative Feed Value.
Agriculture 15 01474 g006
Figure 7. Linear fitting of leguminous proportion, yield, and nutritional quality. Note: CP: Crude Protein, AC: Ash Content, EE: Ether Extract, NDF/ADF: Neutral/Acid Detergent Fiber, DMI: Dry Matter Intake, DDM: Dry Digestibility Matter, RFV: Relative Feed Value.
Agriculture 15 01474 g007
Table 1. Seeding rate in the monoculture of legumes and grasses (kg·ha−1).
Trial MaterialNumberSeeding Rate (kg·ha−1)Pure Live Seeds (Seeds·kg−1)Lab Germination (%)1000-Seed Weight (g)
Dahurian wildryeE26.5300,00090%3
Mongolian wheatgrassM14.14575,00092%1.6
Standing milkvetchA10.6741,66789%1.2
Note: E stands for Dahurian wildrye, M stands for Mongolian wheatgrass, and A stands for Standing milkvetch, the same as below.
Table 2. Mixed combination, mixed ratio, and seeding rate of legume–grasses mixture (kg·ha−1).
Mixed CombinationNumberMixedSeeding Rate (kg·ha−1) Mixed Ratio (%)
D:H 5:5D:H 4:6D:H 3:7
MixtureEaAbDahurian wildrye13.2515.918.55
Standing milkvetch5.34.243.18
MaAbMongolian wheatgrass7.078.489.90
Standing milkvetch5.34.243.18
Note: D represents Legumes, H represents Grasses, a represents the proportion of grasses and b represents the proportion of legumes, E stands for Dahurian wildrye, M stands for Mongolian wheatgrass, and A stands for Standing milkvetch, the same as below.
Table 3. Effect of mixed cropping of legumes and grasses on forage plant height.
TreatmentDahurian Wildrye Plant Height (cm)Mongolian Wheatgrass Plant Height (cm)Standing milkvetch Plant Height (cm)
30 August 202430 September 202430 August 202430 September 202430 August 202430 September 2024
E5A510.39 ± 0.68 a21.7 ± 0.97 a5.69 ± 0.13 ab22.1 ± 0.61 a
E6A410.74 ± 0.24 a16.4 ± 1.75 a6.48 ± 0.69 a17.7 ± 2.24 a
E7A310.89 ± 0.64 a16.4 ± 0.91 a5.01 ± 0.20 b16.1 ± 2.18 a
M5A59.29 ± 0.22 b14.0 ± 1.10 a5.68 ± 0.29 ab18.4 ± 1.51 a
M6A48.67 ± 0.14 b12.6 ± 1.76 a5.68 ± 0.46 ab16.2 ± 2.93 a
M7A310.09 ± 0.17 a16.9 ± 0.09 a6.09 ± 0.23 ab24.7 ± 0.71 a
E10.81 ± 0.45 a19.5 ± 2.11 a
M9.33 ± 0.31 b13.9 ± 1.95 a
A5.22 ± 0.22 ab20.8 ± 4.39 a
Note: different lowercase letters indicate significant differences between different treatments for the same species and sampling date (p < 0.05). “—” means no data (as the treatment did not involve the corresponding forage species). The same below.
Table 4. Effect of cropping of legumes and grasses on land equivalent ratio.
TreatmentLERHLERDLER
E5A50.48 ± 0.07 Aa0.26 ± 0.06 Ba0.74 ± 0.04 a
E6A40.28 ± 0.05 Ab0.15 ± 0.02 Bbc0.43 ± 0.06 bc
E7A30.35 ± 0.03 Aab0.10 ± 0.03 Bc0.44 ± 0.05 b
M5A50.18 ± 0.04 Ab0.22 ± 0.01 Bab0.40 ± 0.03 bc
M6A40.18 ± 0.02 Ab0.10 ± 0.02 Bc0.29 ± 0.05 c
M7A30.24 ± 0.06 Ab0.20 ± 0.01 Babc0.44 ± 0.06 b
Note: LERH: Land Equivalent Ratio for Grasses, LERD: Land Equivalent Ratio for Legumes, LER: Land Equivalent Ratio. Different capital letters within the same column indicate significant differences (p < 0.05) between grass and legume treatments for partial land equivalent ratios. Different lowercase letters within the same row indicate significant differences (p < 0.05) among different treatments for the same index.
Table 5. Effect of cropping of legumes and grasses on interspecific competition.
TreatmentRelative YieldAggressivityCompetition Ratio
RYHRYDRYTAHADCRHCRDCR
E5A50.96 ± 0.15 a0.52 ± 0.12 ab0.74 ± 0.04 a0.44 ± 0.26 a−0.44 ± 0.26 c2.32 ± 1.03 b0.61 ± 0.20 b1.71 ± 1.22 b
E6A40.46 ± 0.08 b0.38 ± 0.04 bc0.43 ± 0.06 bc0.08 ± 0.09 abc−0.08 ± 0.09 abc2.78 ± 0.60 b0.39 ± 0.08 b2.39 ± 0.68 b
E7A30.49 ± 0.04 b0.33 ± 0.09 bc0.44 ± 0.05 b0.16 ± 0.08 ab−0.16 ± 0.08 bc9.48 ± 2.50 a0.12 ± 0.03 b9.36 ± 2.53 a
M5A50.37 ± 0.08 b0.44 ± 0.03 abc0.40 ± 0.03 bc−0.07 ± 0.10 bc0.07 ± 0.10 ab0.86 ± 0.24 b1.36 ± 0.38 a−0.50 ± 0.61 b
M6A40.31 ± 0.04 b0.26 ± 0.06 c0.29 ± 0.05 c0.05 ± 0.02 abc−0.05 ± 0.02 abc2.80 ± 0.24 b0.36 ± 0.03 b2.44 ± 0.28 b
M7A30.35 ± 0.09 b0.66 ± 0.03 a0.44 ± 0.06 b−0.31 ± 0.10 c0.31 ± 0.10 a2.89 ± 0.82 b0.43 ± 0.15 b2.46 ± 0.97 b
Note: RYH: Relative Yield for Grasses; RYD: Relative Yield for Legumes. RYT: Relative Yield Total. AH: Aggressivity for Grasses; AD: Aggressivity for Legumes. CRH: Competition Ratio for Grasses; CRD: Competition Ratio for Legumes. CR: Competition Ratio. Different lowercase letters within the same row indicate significant differences (p < 0.05) among different treatments for the same index.
Table 6. Comprehensive evaluation of forage production performance.
GroupD*D0ScoreRank
E5A50.2860.3600.5581
E6A40.3470.2630.4313
E7A30.3880.2190.3606
M5A50.3310.1880.3615
M6A40.3660.2400.3954
M7A30.4050.1860.3157
E0.4160.1410.2549
M0.4100.1610.2818
A0.3090.3260.5132
Note: D*: Positive ideal solution distance, measuring the proximity of each group to the best-case (ideal) scenario across evaluated indicators. D0: Negative ideal solution distance, measuring the proximity to the worst-case (anti-ideal) scenario. Score: representing the relative closeness of a group to the ideal solution (ranges from 0 to 1; higher values indicate better performance). Rank: Ordinal ranking of groups based on the “score” (1 = highest performance).
Disclaimer/Publisher’s Note: The statements, opinions and data contained in all publications are solely those of the individual author(s) and contributor(s) and not of MDPI and/or the editor(s). MDPI and/or the editor(s) disclaim responsibility for any injury to people or property resulting from any ideas, methods, instructions or products referred to in the content.

