1. Introduction
Buckwheat is an important minor grain crop in China, and it is also a typical medicinal and edible crop. With rich health benefits, it can reduce blood pressure, control diabetes, and improve digestion and cholesterol levels [
1,
2]. It is suitable for planting as a minor crop in Shanxi, Hebei, Gansu, and other regions of China with a cold and dry climate. In the process of planting, the planting mode of oat and buckwheat intercropping can make full use of land resources, improve crop diversity, and reduce the risk of pests and diseases. In addition, this planting mode can effectively adjust the planting structure and improve the ecological environment [
3]. Oats are usually planted in early March, and buckwheat is sown after the oats are harvested, from June to July. The mutual promotion of the two crops can not only increase yield but also increase farmers’ incomes. However, the disadvantage of the planting mode is that a large number of oat weeds will emerge during the growth of buckwheat. Weeds compete with crops for water, nutrients, and sunlight, seriously threatening crop yields and agricultural sustainability. Currently, the main weeding methods include manual, mechanical, and chemical. Manual weeding is time-consuming and laborious, and cannot be applied to large-scale scenes; although mechanical weeding is efficient and labor-saving, the input and maintenance costs are high, and it is prone to damage crops; meanwhile, improper use of chemical herbicides will destroy the soil structure and ecological balance [
4]. Therefore, precise spraying can effectively inhibit the growth of weeds and improve the utilization rate of herbicides. Furthermore, with the rapid development of UAVs, remote sensing technology can be used to monitor crop growth, and it also provides new ideas for precise pesticide spraying.
Accurate and reliable weed identification is the key to intelligent weeding [
5]. The application of deep learning technology in precision agriculture is becoming increasingly widespread. It can handle segmentation problems of complex background and large field of view, thereby effectively improving the accuracy of weed identification [
6]. But there are complex spatial dependencies and remote context information in remote sensing images, and traditional deep learning image semantic segmentation models are no longer able to achieve accurate segmentation. Due to its rich spatial, radiometric, spectral, and temporal information, multispectral or hyper-spectral data in UAVs has been widely used in crop growth monitoring [
7], pest and disease detection [
8,
9], environmental quality monitoring [
10], and other fields. Faced with complex situations such as different lighting conditions, shadows between crops, and similarities in appearance between weeds and crops, the recognition results in RGB data are mostly unsatisfactory. The spectral information provided by RGB three-band data is limited, making it difficult to better distinguish crops and weeds through spectra. Meanwhile, multispectral data can provide high-quality data for complex farmland environments. Furthermore, the REdge and NIR bands are sensitive to the chlorophyll content and cell structure of crops, ensuring efficient weed identification [
11]. A single invisible light band cannot provide sufficient information to comprehensively assess crop health and environmental changes. Environmental factors such as soil type, topography, and lighting conditions will affect the measurements of REdge and NIR bands [
12]. The effective fusion of visible and invisible bands in multispectral and hyperspectral data can reduce environmental interference and improve the accuracy and reliability of identification results. Multispectral data is an important component of the multimodal data system. Multispectral-based weed recognition research can provide key semantic information and the spatial distribution of weeds and is a high-quality data source for subsequent weed infestation rate prediction [
13]. Therefore, integrating deep learning semantic segmentation technology with multispectral technology can better achieve weed recognition in buckwheat fields.
Researchers have applied multispectral UAV data to weed identification in corn, sugar vegetables, rice, and other crops. Yan et al. [
14] explored the feasibility of barnyard grass identification using UAV hyperspectral data in complex rice field environments and drew spatial distribution and density maps of barnyard grass. Zhao et al. [
15] took corn and weeds in UAV multispectral remote sensing images as research objects and extracted the vegetation index, texture, and reflectivity to realize semantic segmentation of corn and weeds. However, most of the above studies use machine learning algorithms for manual feature selection and extraction to achieve pixel-level image segmentation; they rely too much on expert experience, which leads to limited generalization ability and difficulty in modeling nonlinear data. Xu et al. [
16] proposed an improved path aggregation network (PANet) semantic segmentation model for weed segmentation in UAV multispectral images and respectively constructed datasets of near-infrared, red, and normalized difference vegetation index (NDVI) for model training; the experimental results showed that the model trained with three channels (near-infrared + red + NDVI) had the highest F1 value of 0.872. Although several studies have demonstrated notable success in combining multispectral images with segmentation models, limitations remain regarding the number of inputs and negative inputs. Deep-learning-based segmentation models can only deal with RGB (red, green, and blue) three-channel color images, and most studies focus on improving the backbone and feature fusion networks. However, there are relatively few studies on the optimization of model input. The three-channel band input cannot directly process the original multispectral data. Researchers usually use artificial methods to synthesize vegetation indices, color features, etc., and realize model input. In summary, in order to fully utilize the advantages of high-resolution and deep learning semantic segmentation models of UAV multispectral remote sensing data and fill the research gap in the application of minor grain crops, this study took a buckwheat experimental field in Taigu District, Jinzhong City, Shanxi Province, China, as the research area and carried out buckwheat weed recognition. The main contributions are as follows:
(1) The spectral information of red, blue, green, red edge, and near-infrared bands were obtained, and the performance of single-band and multi-band combination inputs for buckwheat weed identification were explored.
(2) The U-Net semantic segmentation model was improved to realize multi-band adaptive inputs, so as to obtain the optimal band for buckwheat weed identification under the multispectral remote sensing UAV platform.
(3) The distribution of weeds in the buckwheat field was obtained, which provided reference for the path and dosage planning of weeding by UAV crop protection.
The remainder of this study is organized as follows. The proposed methods are introduced in detail in
Section 2. Then,
Section 3 describes experiments conducted with the proposed method on single-band, multi-band, and other segmentation models and presents large-scene field maps of weeds in order to verify the effectiveness of our method.
Section 4 discusses the performance of our method. Conclusions are presented in
Section 5.
2. Materials and Methods
2.1. General Situation of Research Area
The research area was located in the buckwheat research experimental field of Shanxi Agricultural University in Shenfeng Village, Taigu District, Jinzhong City, Shanxi Province, China (37°26′2.4″~37°26′06″ N,112°35′34.8″~112°35′42.0″ E), with a total area of 80 acres. It has a temperate continental monsoon climate, with an average annual temperature and precipitation of 10.5 °C and 434.9 mm. The rainy season lasted from July to September, accounting for about 60% of the total precipitation. The average annual sunshine hours was 2407, with four distinct seasons and sufficient sunshine, and it was suitable for the cultivation of minor grain crops such as buckwheat and oats. The sowing time of buckwheat in this area was from June to July 2023, and the harvesting time was from September to October. The planting variety of buckwheat was “Jinqiao No.1” (Shanxi, China). Since the research object of this paper was the identification of weeds, we did not interfere with the growth of weeds. Data collection was conducted in August, when weeds were more obvious, which can provide reference for the last weeding before buckwheat ridge sealing.
Figure 1 shows the geographical location of the research area and the buckwheat experimental field.
2.2. UAV Image Acquisition
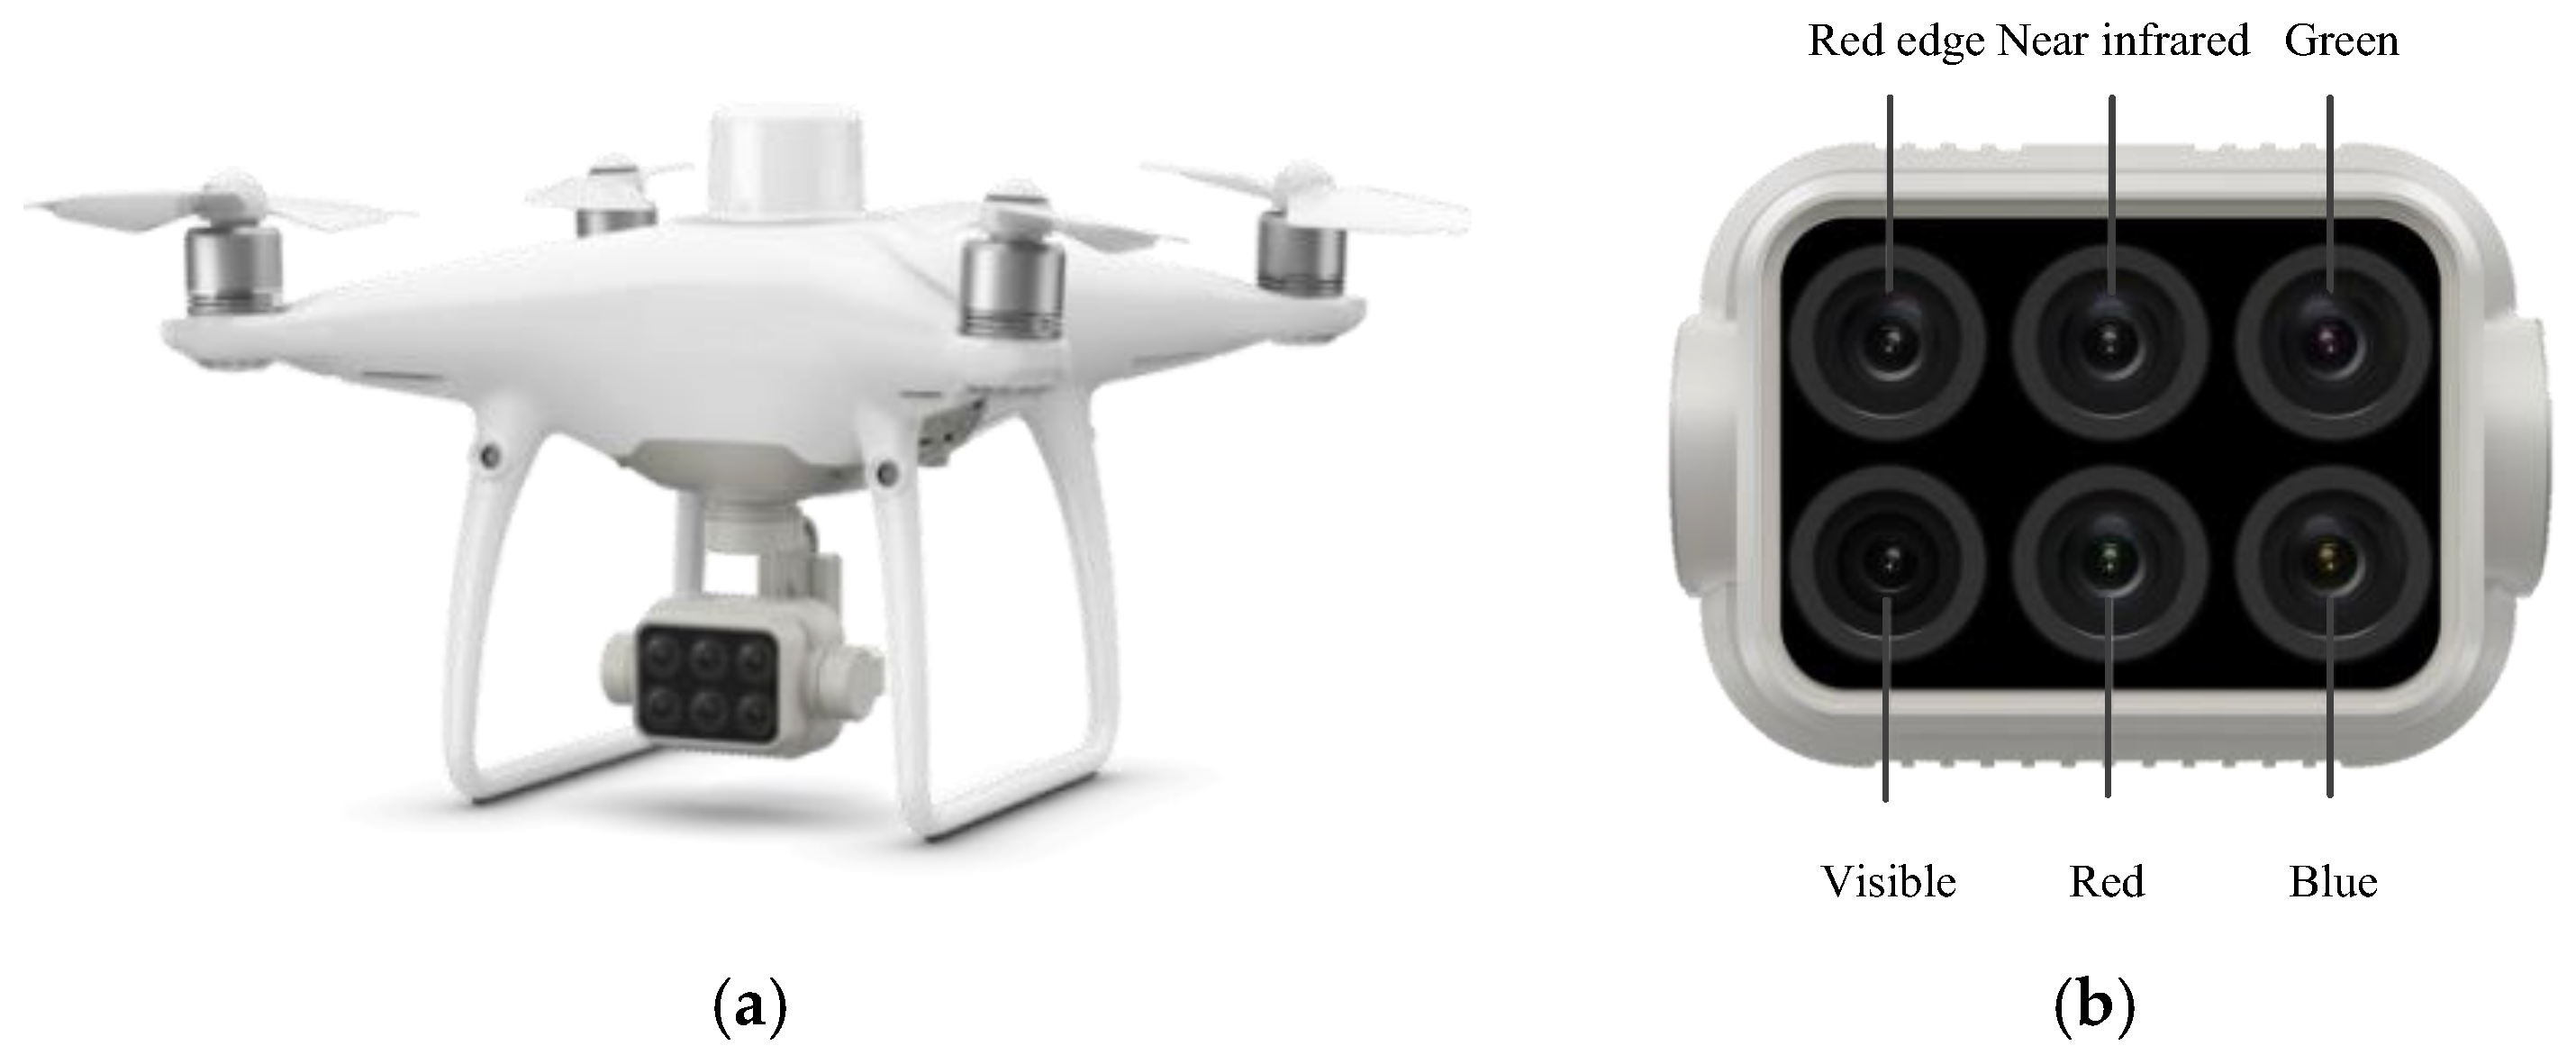
The aerial image acquisition equipment was the DJI PHANTOM 4 (Shenzhen, China) multispectral version UAV (
Figure 2), which integrated a visible light camera and five multispectral cameras (red, green, blue, near-infrared, and red edge spectra). It can achieve visible light and multispectral imaging. The image size was 1600 pixels × 1300 pixels, and the image format was TIFF. Each camera had a resolution of 2 million pixels and was equipped with a three-axis gimbal for stable and clear imaging. The parameters of the multispectral cameras are shown in
Table 1.
In this study, the UAV adopted a TimeSync time synchronization system, which synchronized the flight control, camera, and real-time kinematic (RTK) clock system to achieve millisecond-level errors in camera imaging time. The real-time compensation module combines the center position of each camera lens, the center position of the antenna, and the device posture information to obtain more accurate position information in the image. In data collection, the professional edition of GS Pro (Ground Station Pro) was used for route planning, task execution, and flight speed management. The date of data collection was 5 August 2023. Aerial parameter settings: the flight height was 30 m; the flight speed was 2.6 m/s; the ground sample distance (GSD) was 0.82 cm/pixel; the heading overlap rate was 80%; the lateral overlap rate was 70%.
In order to achieve visualization of multispectral UAV data, the PIX4Dmapper 4.5.6 data processing software (Lausanne, Switzerland) was used to generate orthophoto maps. After image stitching, calibration, and slicing operations, visualized images of each band can be obtained.
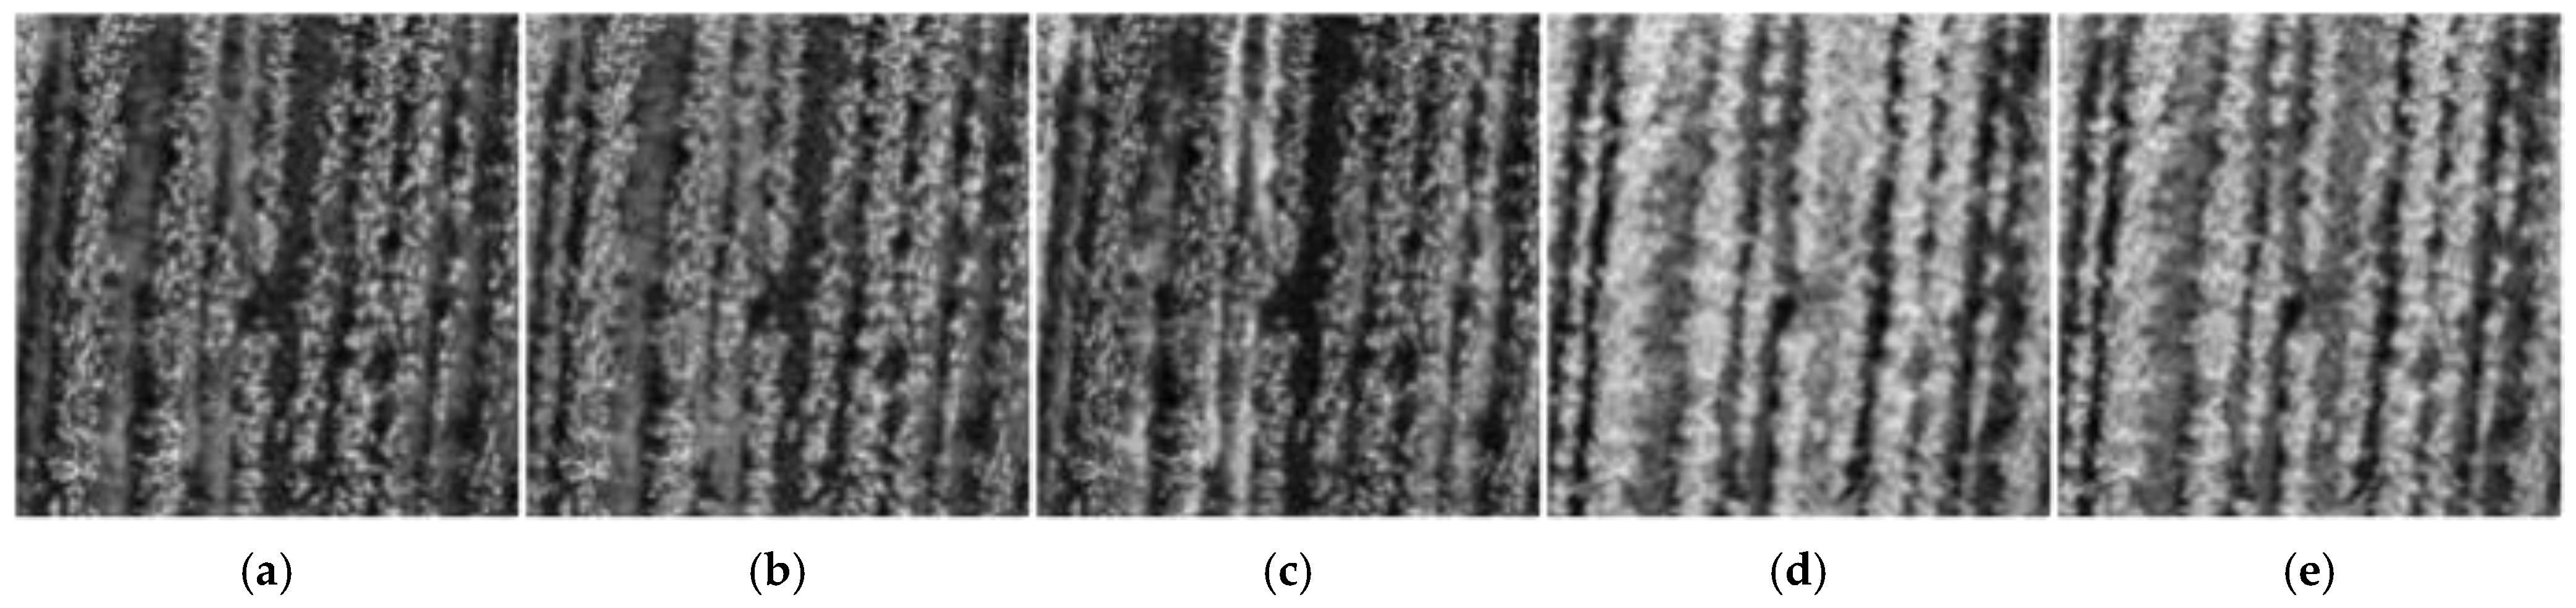
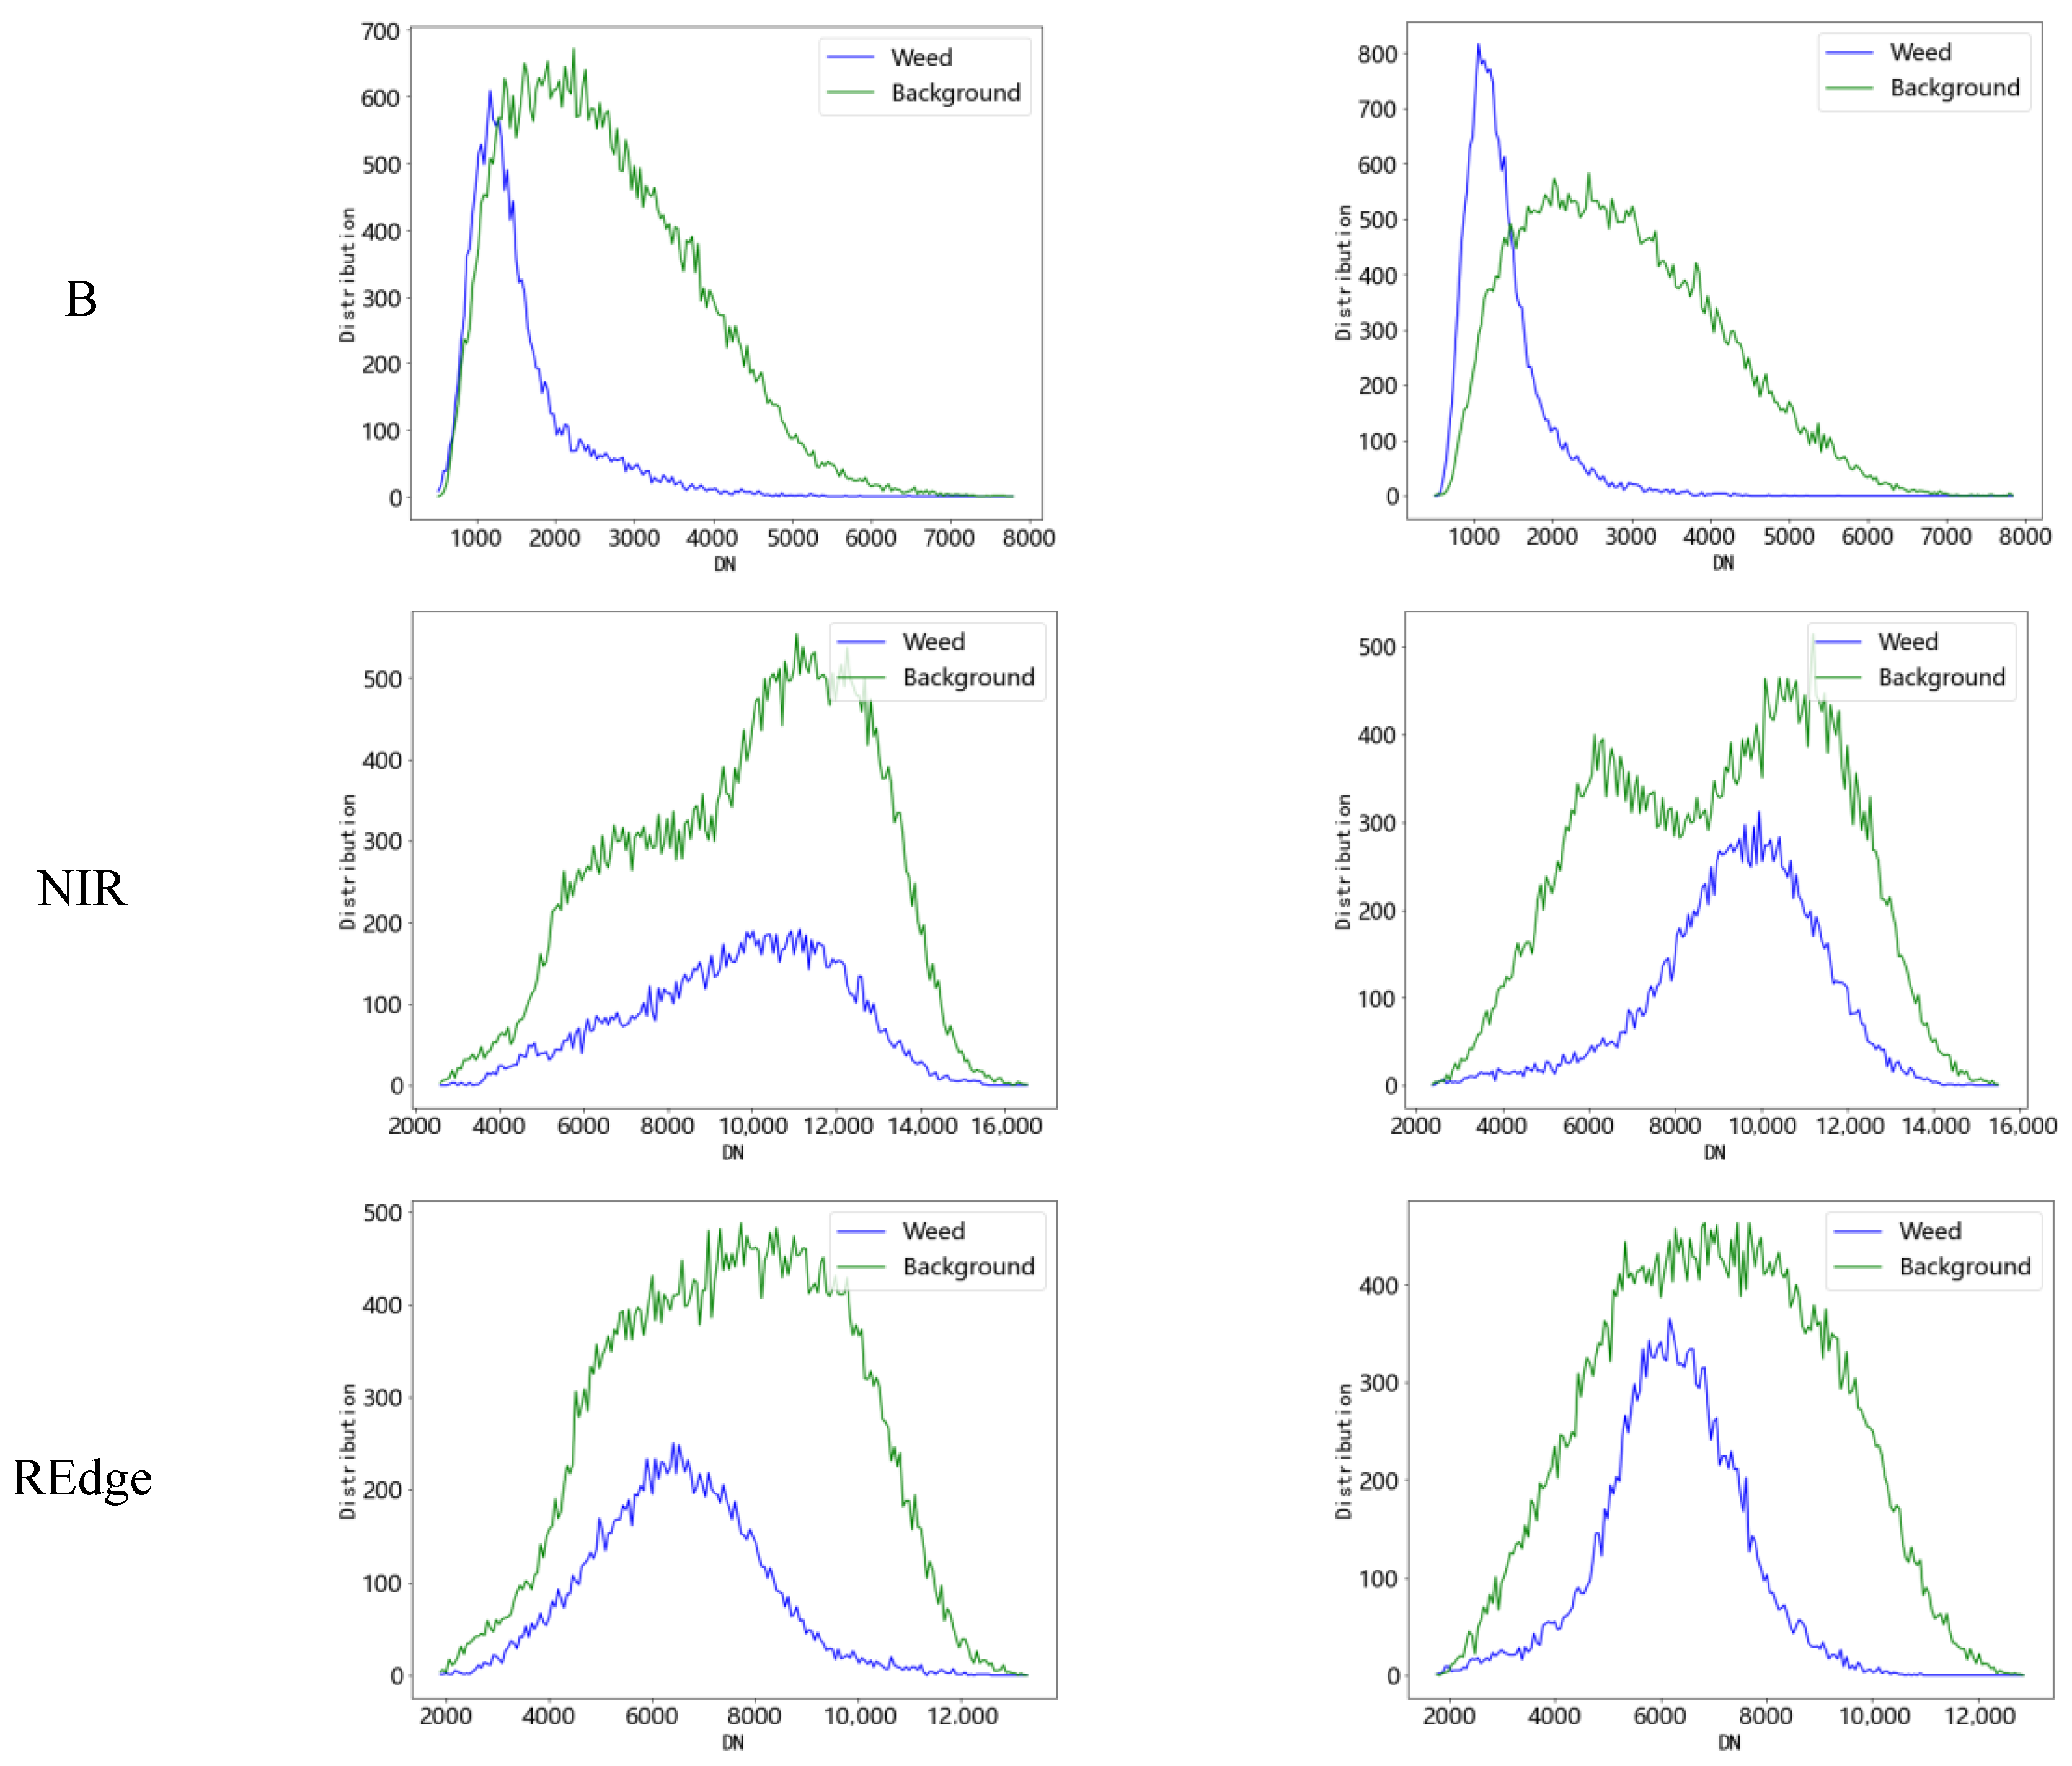
Figure 3 shows the multispectral sample images obtained from the same plot;
Figure 3a–e are grayscale images of the R, G, B, NIR, and REdge bands, respectively. As can be seen from
Figure 3, compared with red, green, and blue band images, the difference between crops and weeds in near-infrared and red band images is more significant, which will be further discussed in the subsequent data analysis process.
2.3. Multispectral Image Annotation
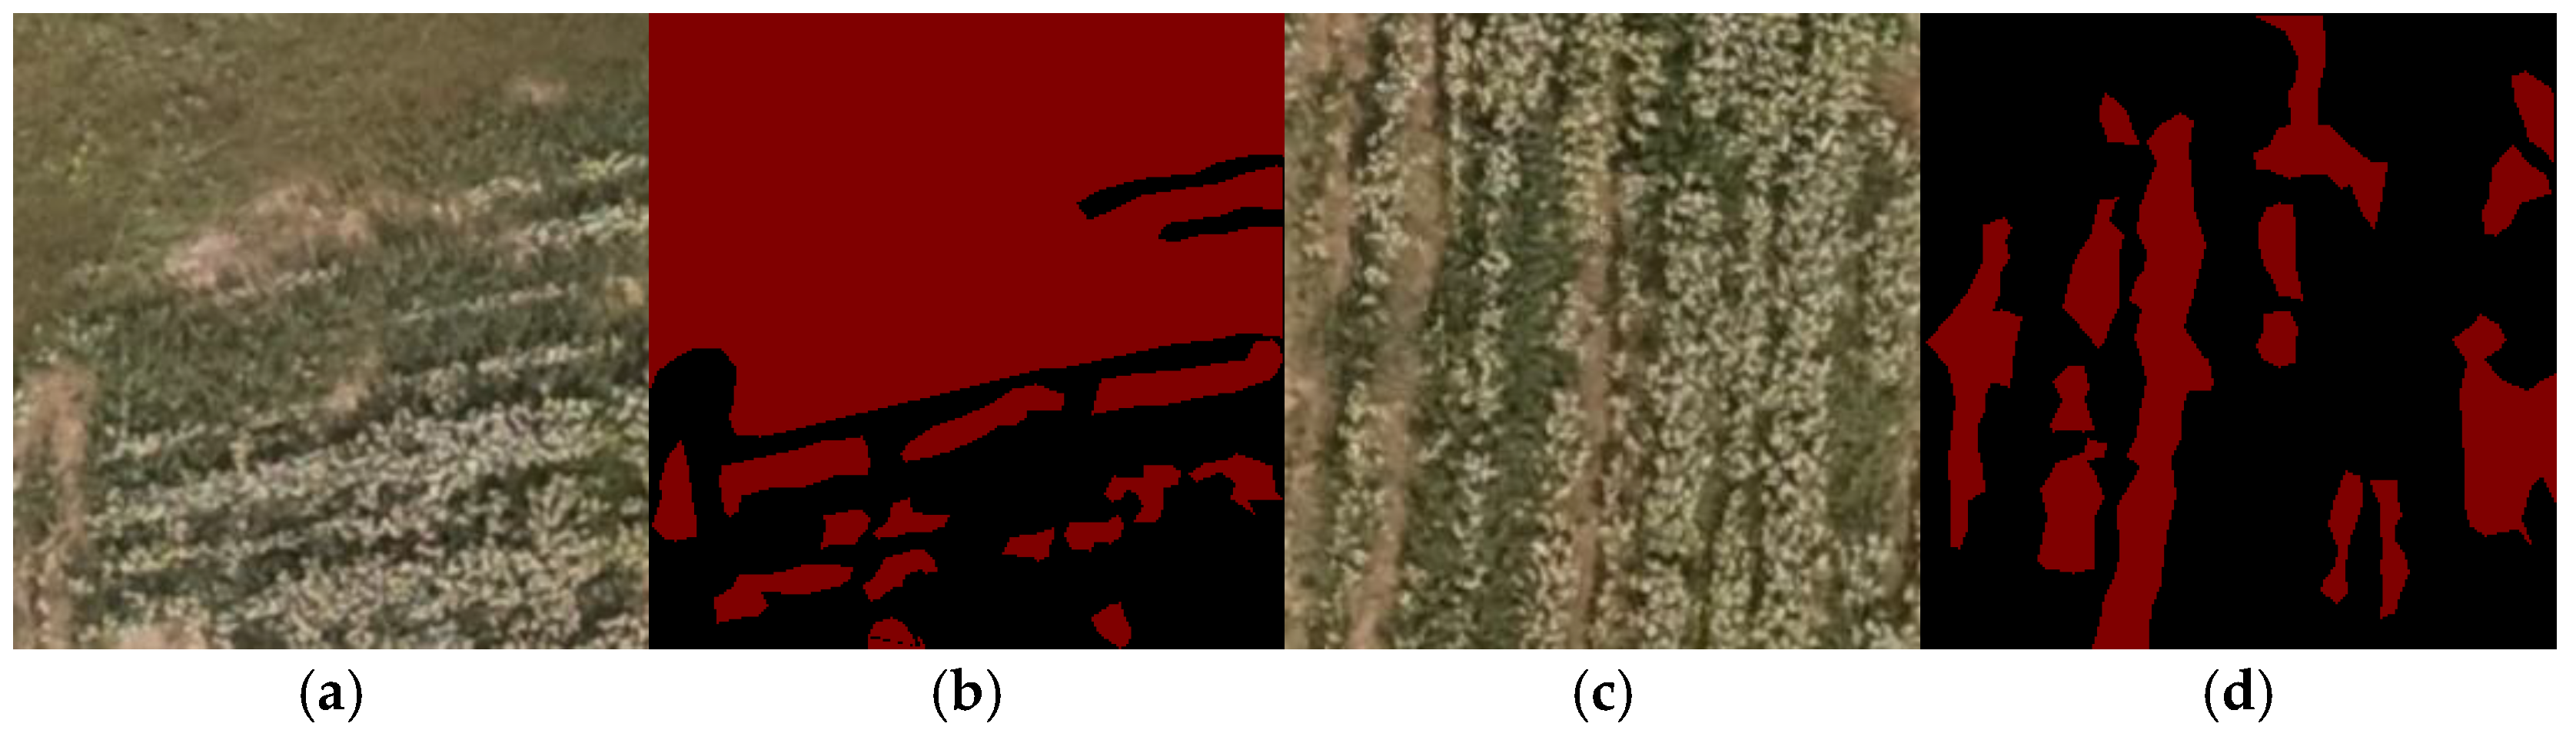
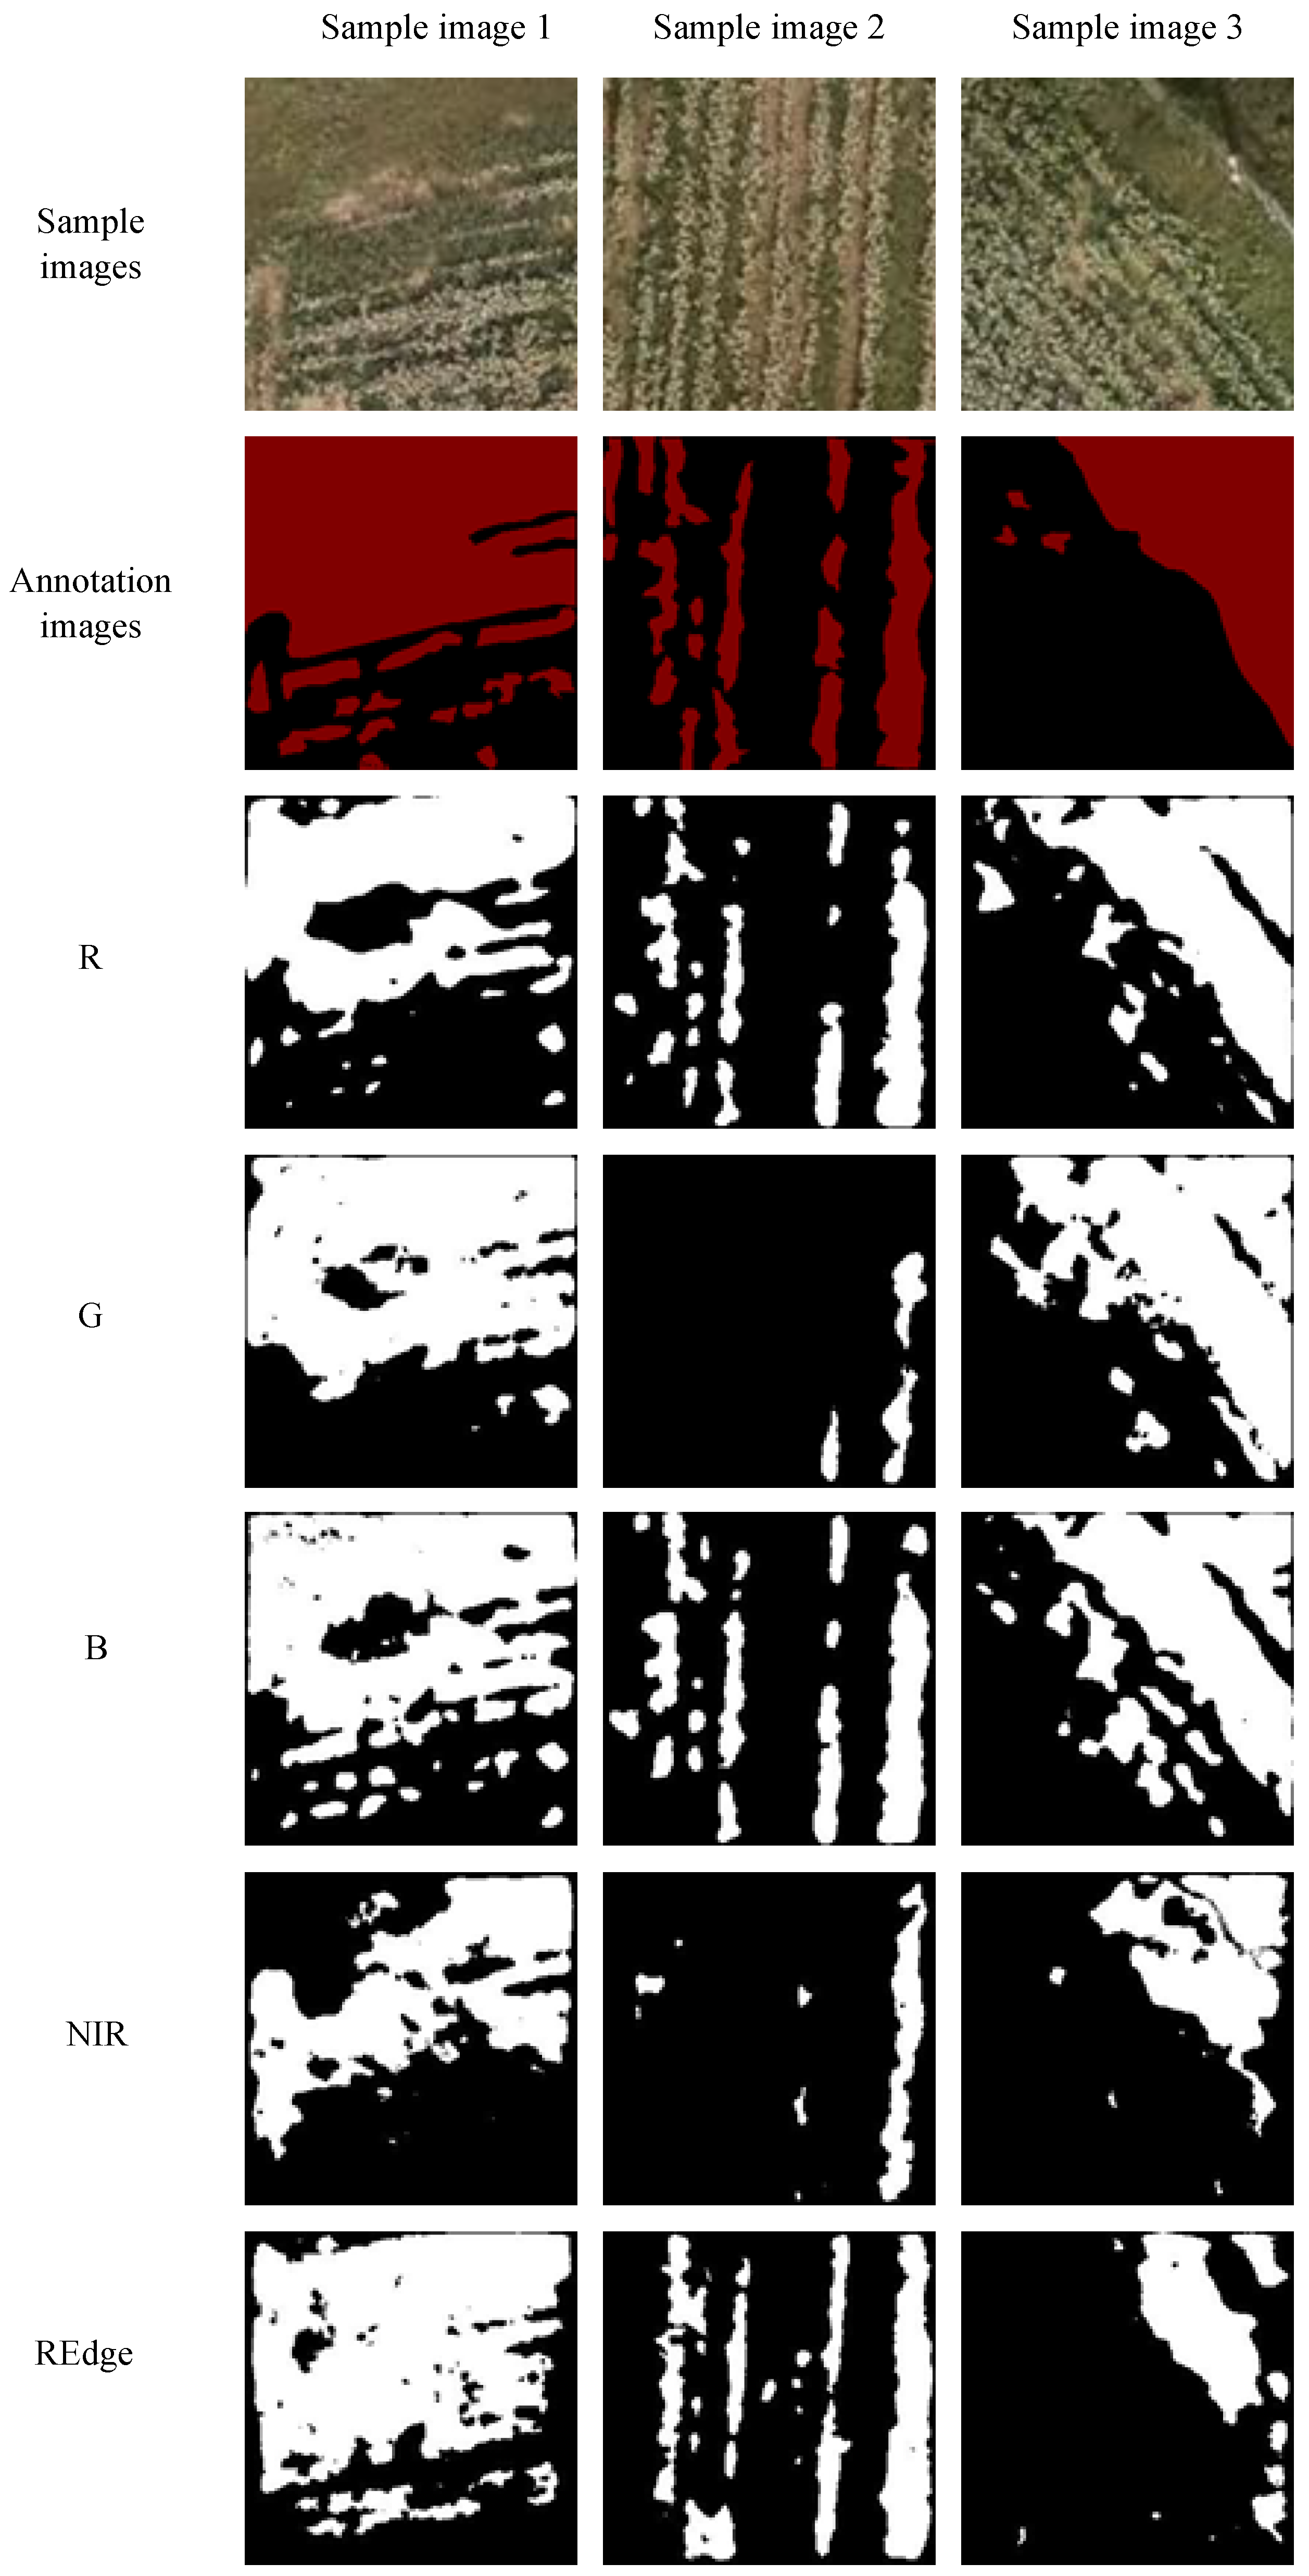
Before the closure of buckwheat ridges, weeds and buckwheat are dense and continuous, and it is difficult to distinguish individual weeds from a canopy perspective. Under such intricate circumstances, weed recognition requires pixel-accurate classification, effectively turning it into an image segmentation task. The annotation of multispectral images is basically similar to traditional RGB images. This study used Labelme 5.5.0 (Massachusetts, USA) to annotate the obtained images. Since Labelme cannot directly read multispectral data, RGB images obtained by visible light sensors on the same plot were annotated. Partial RGB sample images and their corresponding annotated images are shown in
Figure 4. In
Figure 4, there were two representative plots;
Figure 4a shows an irregular edge plot image, while
Figure 4c shows a more regular one. In
Figure 4a, the seeder cannot work normally, and there were varieties of weeds, making weed information relatively complicated. In
Figure 4c, as the planting mode was oats intercropping buckwheat, the weeds were usually the fallen oats, and the weed information was relatively simple. As the flight height was 30 m, it was impossible to accurately distinguish weed types at this height. Therefore, all types of weeds were uniformly labeled as one category, which was represented in red, and the buckwheat was labeled in black. The annotation file format was JSON, and the file was subsequently converted to PNG.
2.4. Multispectral Image Preprocessing
The range of the three channels in RGB images is from 0 to 255, while there is no clear pattern in the values of each band in multispectral data, and the maximum value of each band is also different. The multispectral data needed to be standardized, and the calculation formula is shown in Equation (1).
where
is the original data of a certain band,
is the mean value of the band,
is the standard deviation of the band, and
is the standardized data of the band. Through Equation (1), the original data was transformed into a standard normal distribution, which helps to eliminate the influence between different characteristic dimensions.
The multispectral UAV data usually consists of a small dataset, and it cannot meet the requirements of commonly used deep learning semantic segmentation models. Data augmentation was needed to improve the generalization ability of the model. At present, common data augmentation methods are based on RGB images, which cannot be directly applied to multispectral images in TIFF format. Therefore, the data augmentation method was improved in this study. Firstly, a five-dimensional dataset was generated by merging the five single-band datasets. Then, common methods such as horizontal flipping, vertical flipping, random rotation, gaussian blur, etc., were used for data augmentation. Due to the particularity of multispectral data, data augmentation methods such as brightness and contrast cannot be used. Finally, the augmented data was written into the multispectral TIFF data. In this paper, eleven methods including sharpen, gaussian noise, horizontal flip, vertical flip, rotation, gaussian blur, and five sets of affine transformations were used for data augmentation. In order to improve the diversity of the samples, five methods of the above eleven were randomly selected for each multispectral sample to achieve data augmentation.
2.5. Construction of a Buckwheat Weed Recognition Model Based on UAV Multispectral Images
The identification of buckwheat weeds based on UAV images can evaluate the distribution of weeds throughout the entire field. Quantifying the distribution of weeds can provide a foundation for precise spraying of herbicides and path planning of intelligent weeding machines, thus achieving automatic, efficient, and accurate weed identification. The images collected by UAV usually have high resolution, and the weeds are densely distributed, making it impossible to detect individual weed plants. Therefore, this study adopted image segmentation methods to achieve buckwheat weed recognition in UAV multispectral images, optimizing existing image segmentation techniques to make them applicable to multimodal input.
At present, the commonly used deep learning image segmentation models are mostly applied to RGB images, which cannot be directly applied to multispectral images. Therefore, it is necessary to optimize and improve the input and activation functions of the model. The U-Net model is a common image semantic segmentation model proposed by Ronneberger et al. [
17] in 2015. With simple structure and strong expansibility, it has been widely used in fields such as medical imaging, remote sensing imaging, and intelligent driving [
18,
19]. Compared with other semantic segmentation models, the biggest advantage of U-Net is that it does not rely on large datasets, but it can still achieve an ideal effect by training with small sample datasets [
20]. Therefore, the main improvement strategy of MSU-Net involved modifying the input module of the U-Net semantic segmentation network and improving the activation functions. The modified input module enabled it to directly read multispectral data and adaptively adjust the model input based on the number of channels. The improved MSU-Net model can combine multispectral data with semantic segmentation models to fully utilize the multispectral information, ultimately achieving high-precision identification of weeds in buckwheat fields.
2.5.1. U-Net Image Semantic Segmentation Model
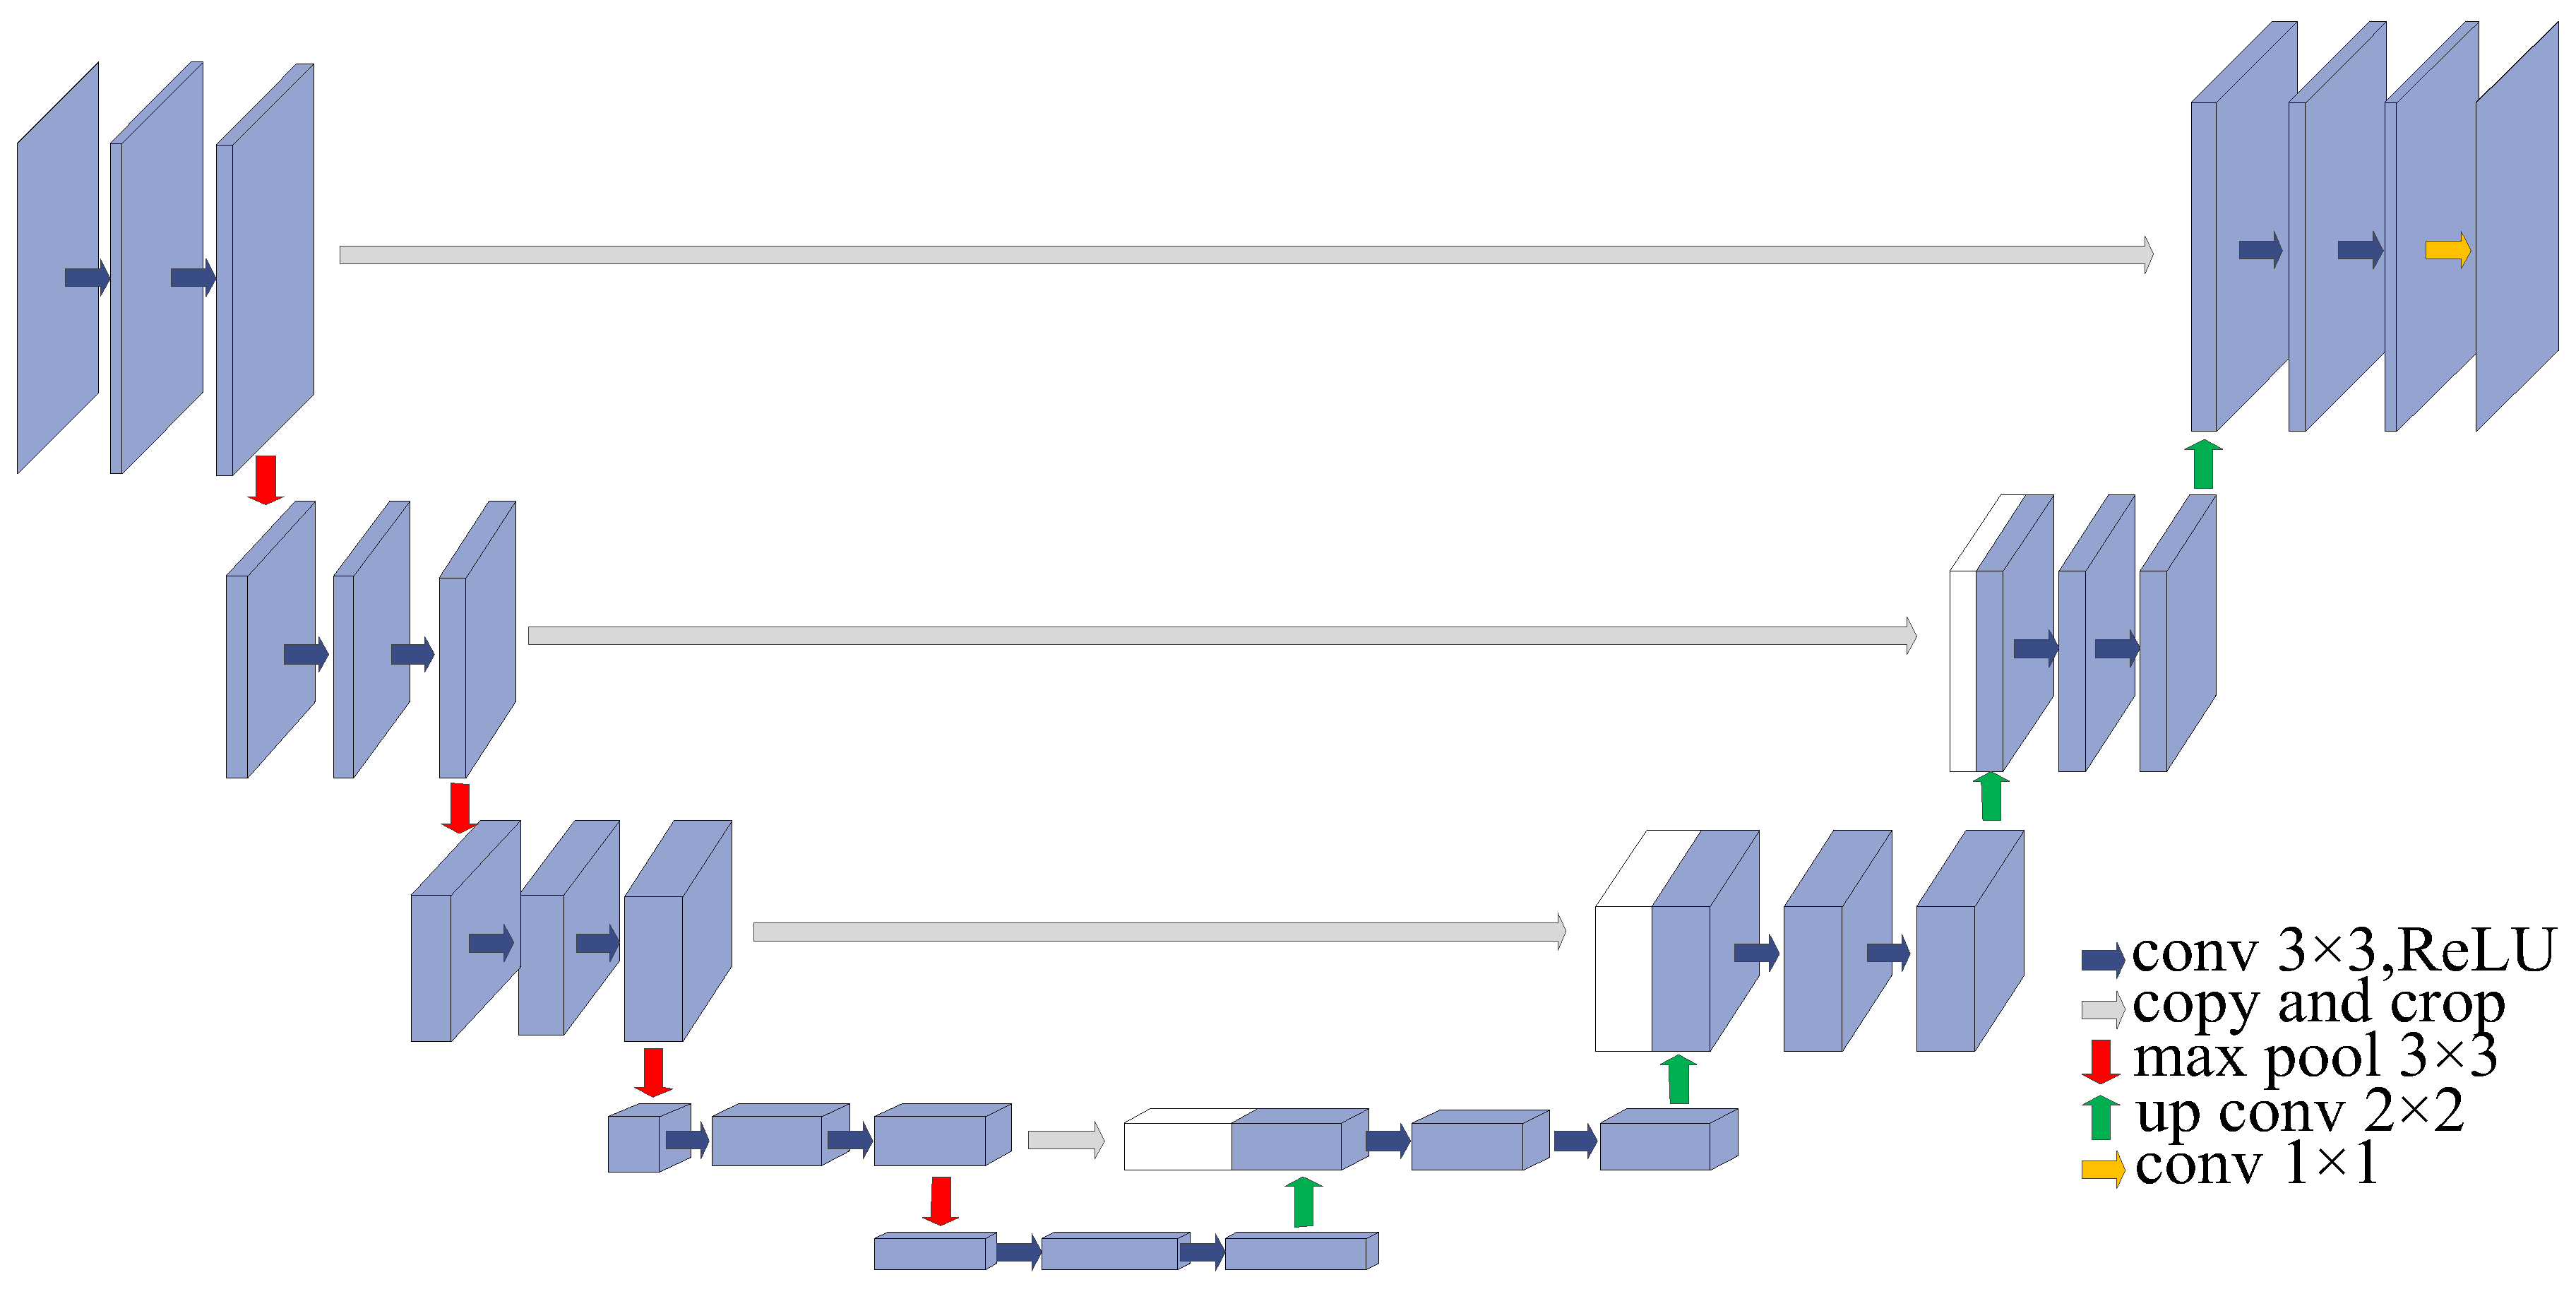
The U-Net model usually consists of three parts: encoder, decoder, and skip connections.
(1) The encoder employs a down-sampling process where each stage consists of two consecutive 3 × 3 convolutional layers with ReLU activations and a max pooling operation.
This part utilizes pooling layers to reduce spatial resolution while maintaining the number of channels, ultimately reducing information complexity and achieving image feature extraction [
21,
22].
(2) The decoder performs up-sampling through a structure typically symmetrical to the encoder. Each up-sampling operation consists of two 3 × 3 de-convolution layers, which are concatenated to improve the resolution of the feature map and ultimately achieve the same resolution output as the input image.
(3) The skip connections concatenate encoder and decoder feature maps of corresponding scales, effectively combining multi-level feature information to preserve spatial details and enhance segmentation accuracy.
The network structure of U-Net is shown in
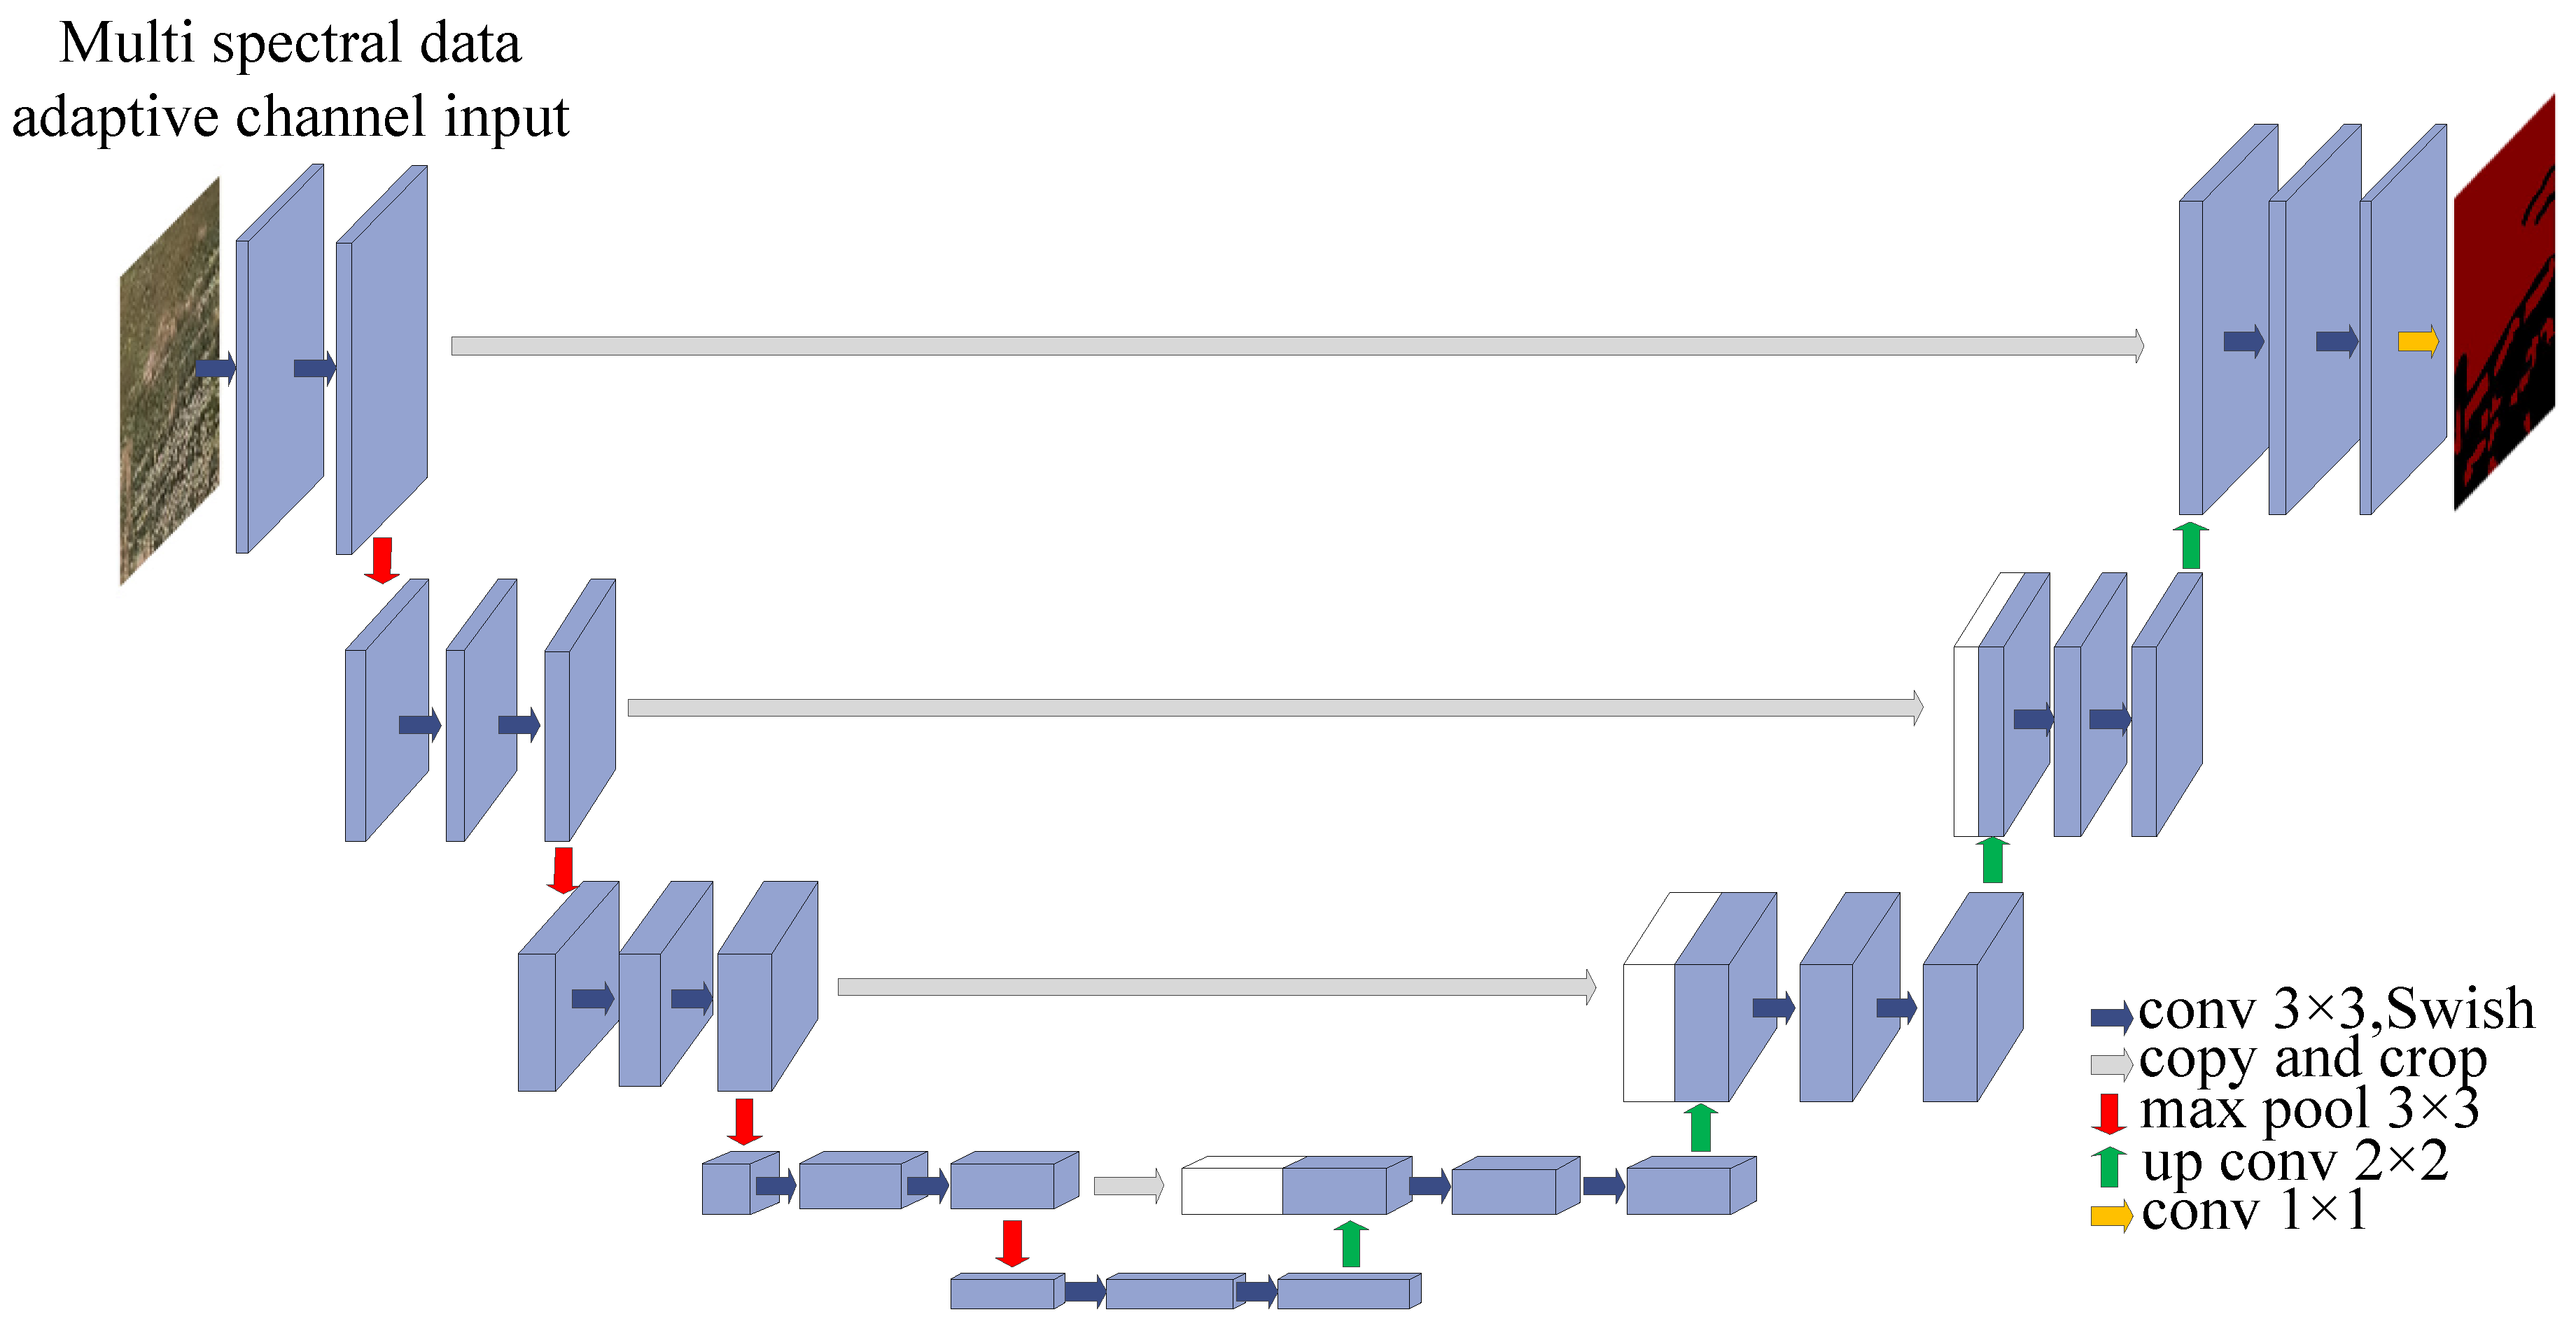
Figure 5, where the blue arrows represent the convolutional block, the gray arrows are the copy and crop blocks, the red arrows represent the down-sampling block, the green arrows represent the up-sampling block, the yellow arrows represent the convolutional layer, Conv 3 × 3 represents a convolution operation with a kernel size of 3 × 3, copy and crop represent cropping in the channel dimension, max pool 3 × 3 represents the maximum pooling down-sampling with a convolution kernel size of 3 × 3, up conv 2 × 2 represents up-sampling with a convolution kernel size of 2 × 2, and conv 1 × 1 represents a convolution operation with a kernel size of 1 × 1.
2.5.2. MSU-Net Image Semantic Segmentation Model
The improvement of U-Net mainly includes the input module and activation function. The network structure of the improved MSU-Net weed image segmentation model is shown in
Figure 6. Multi-channel input can accept multi-source data and complete deep feature extraction during the encoding stage, which fully utilizes the spectral information of multispectral remote sensing images. In the encoding and decoding process, the Swish activation function was adopted instead of the original ReLU function. In classification and segmentation tasks, Swish performs better than ReLU and is more adaptable and efficient for complex inputs. As multispectral cameras cannot construct large-scale datasets, a skip connection in MSU-Net was used to connect the feature maps in the encoding and the decoding stage. The incorporation of skip connections facilitates the effective utilization of multi-level feature information and helps maintain the efficiency of feature extraction. Due to its unique U-shaped network structure, skip connections, efficient feature extraction, and fusion capabilities, MSU-Net still has good segmentation performance in small sample situations.
(1) Improvement of the multispectral input module. The multispectral data collected by UAV includes five bands: R, G, B, REdge, and NIR. Specifically, R, G, and B are common visible bands, while REdge and NIR are invisible ones. R, G, and B bands can form digital images, which can be used for extracting color features, texture features, shape features, etc. REdge and NIR can be used for extracting spectral features such as NDVI and normalized difference water index (NDWI). The traditional U-Net model is mainly designed for processing commonly used RGB images, and it cannot directly process multispectral data. At present, there is relatively little research on image segmentation networks for multispectral data. The most common method is to read TIFF format multispectral data and manually select bands to construct model inputs. However, the above methods are limited and can only verify the combination inputs involving three channels. Therefore, this paper proposed an MSU-Net model to be well-suited for handling multispectral data inputs. The pseudocode of the improved multispectral input module is shown in Algorithm 1.
| Algorithm 1: Adaptive multispectral band input module of MSU-Net |
Input: multispectral data Xin = {x1, x2, x3, …, xi, …, xn},
xi = {xR, xG, xB, xREdge, xNIR},
multispectral selection input Bands = {BR, BG, BB, BREdge, BNIR}
Output: multispectral output data Xout = {x1, x2, x3, ……, xn}
1: for i ∈{1, 2, ……, n} do
2: if file suffix = “tiff” then
3: obtain Bands
4: read the selected multispectral data Xout according to the Bands
5: for j ∈ {0, 1, ……, nBands−1} do
6: if Band[j] = True then
7: read the selected multispectral data to Xout
8: end if
9: end for
10: Calculate the number_channels according Bands
11: else
12: process the data in the regular image format (“png”, “jpg”, etc.)
13: number_channels = 3
14: end if
15: end for
16: Set the number of input channels of the U-Net network to number_channels. |
The specific improvement methods were as follows:
(a) A multispectral selection function was integrated into the input module of the original U-Net architecture.
(b) The default three-channel input was replaced with a variable parameter, number_channels. This allowed for dynamic configuration of input channels and supported the development of an adaptive module for multispectral band selection.
The improved MSU-Net can directly read multispectral data and achieve the combination of different multispectral bands, overcoming the previous limitation of three channels. At the same time, it can adaptively adjust the input channel according to the number of extracted bands.
(2) Improvement of loss function. Multispectral data contains rich spectral information and can be used to extract features such as color, shape, texture, and vegetation indices. However, it is prone to problems such as information redundancy and model convergence. In the encoding stage, the correlation between multiple channels should be reasonably utilized to extract classification features with significant differences between weeds and crops. In U-Net, ReLU activation function is usually used to introduce nonlinear factors so as to improve the expressive ability of the model, but this function sets all negative outputs to 0. When there is a negative input, it will lead to the loss of information and incorrect recognition. Therefore, in this study, ReLU was replaced by the Swish activation function. Even if the input is negative, Swish can produce non-zero gradient, thus avoiding the problem of neuron death of ReLU [
23].
2.6. Model Operating Environment and Evaluation Parameters
2.6.1. Model Operating Environment and Parameters
The MSU-Net semantic segmentation model ran on Windows 10 with an Intel (R) Core (TM) CPU model i7-12700F@2.10 GHz. The GPU was an NVIDIA GeForce RTX 3080, with 32 GB of RAM and 1 TB of mechanical hard disk. The programming language was Python 3.9. The deep learning framework was Pytorch 1.13.0. The GPU acceleration libraries were CUDA11.7 and CUDNN8.4.1. The input image resolution was 256 pixels × 256 pixels. The learning rate was 1 × 10⁻⁵. The weight attenuation index was 1 × 10⁻⁸, and the training epoch was 200.
2.6.2. Model Evaluation Indicators
To evaluate the performance of the segmentation model, mPA [
24], mIoU [
25], Dice coefficient [
26], and F1 score were selected as evaluation indicators. Among them, mPA refers to the average pixel accuracy of all categories, and pixel accuracy (PA) is defined as the ratio of correctly classified pixels to the total number of pixels, which can reflect the overall performance of the model on all categories. MIoU is the average intersection over union (IoU) of all categories, which is used to measure the degree between the predicted and the actual segmentation results. The Dice coefficient is a set similarity measure, which is used to measure the similarity between the predicted and actual results, and the higher the value, the better the predicted results. The F1 score is the harmonic mean of precision and recall, which is used to measure the accuracy and completeness of the model. The calculation formulas are shown in Equations (2)–(7).
where
is the number of pixels,
represents the total number of pixels belonging to class
i and predicted as class
i (
),
represents the total number of pixels actually belonging to class
j and predicted as class
j (
),
represents the total number of pixels originally belonging to class
i but predicted as class
j (
),
represents the total number of pixels belonging to class
j but predicted as class
i (
),
P is precision, and
R is recall.
4. Discussion
This paper proposed a buckwheat weed recognition model named MSU-Net based on multispectral remote sensing data, and the self-built buckwheat weed multispectral data was verified and tested by experiments. Researchers have applied multispectral UAV data to citrus tree crown segmentation [
33] and weed mapping [
34], with optimal band combinations of R+B+NIR and R+G+NIR, respectively. Although the experimental results were satisfactory, they were unable to overcome the limitation of three-channel input. However, our method can adapt the number of input bands and performs well in prediction accuracy and inference speed.
In order to verify the performance of single–band data in buckwheat weed identification, this paper compared and analyzed the effects of five bands—R, B, G, NIR, and REdge—on the segmentation results. The recognition result of the B band was the best, with the highest mPA, mIoU, Dice, and F1 values of 0.75, 0.61, 0.87, and 0.80, respectively, which were higher than others.
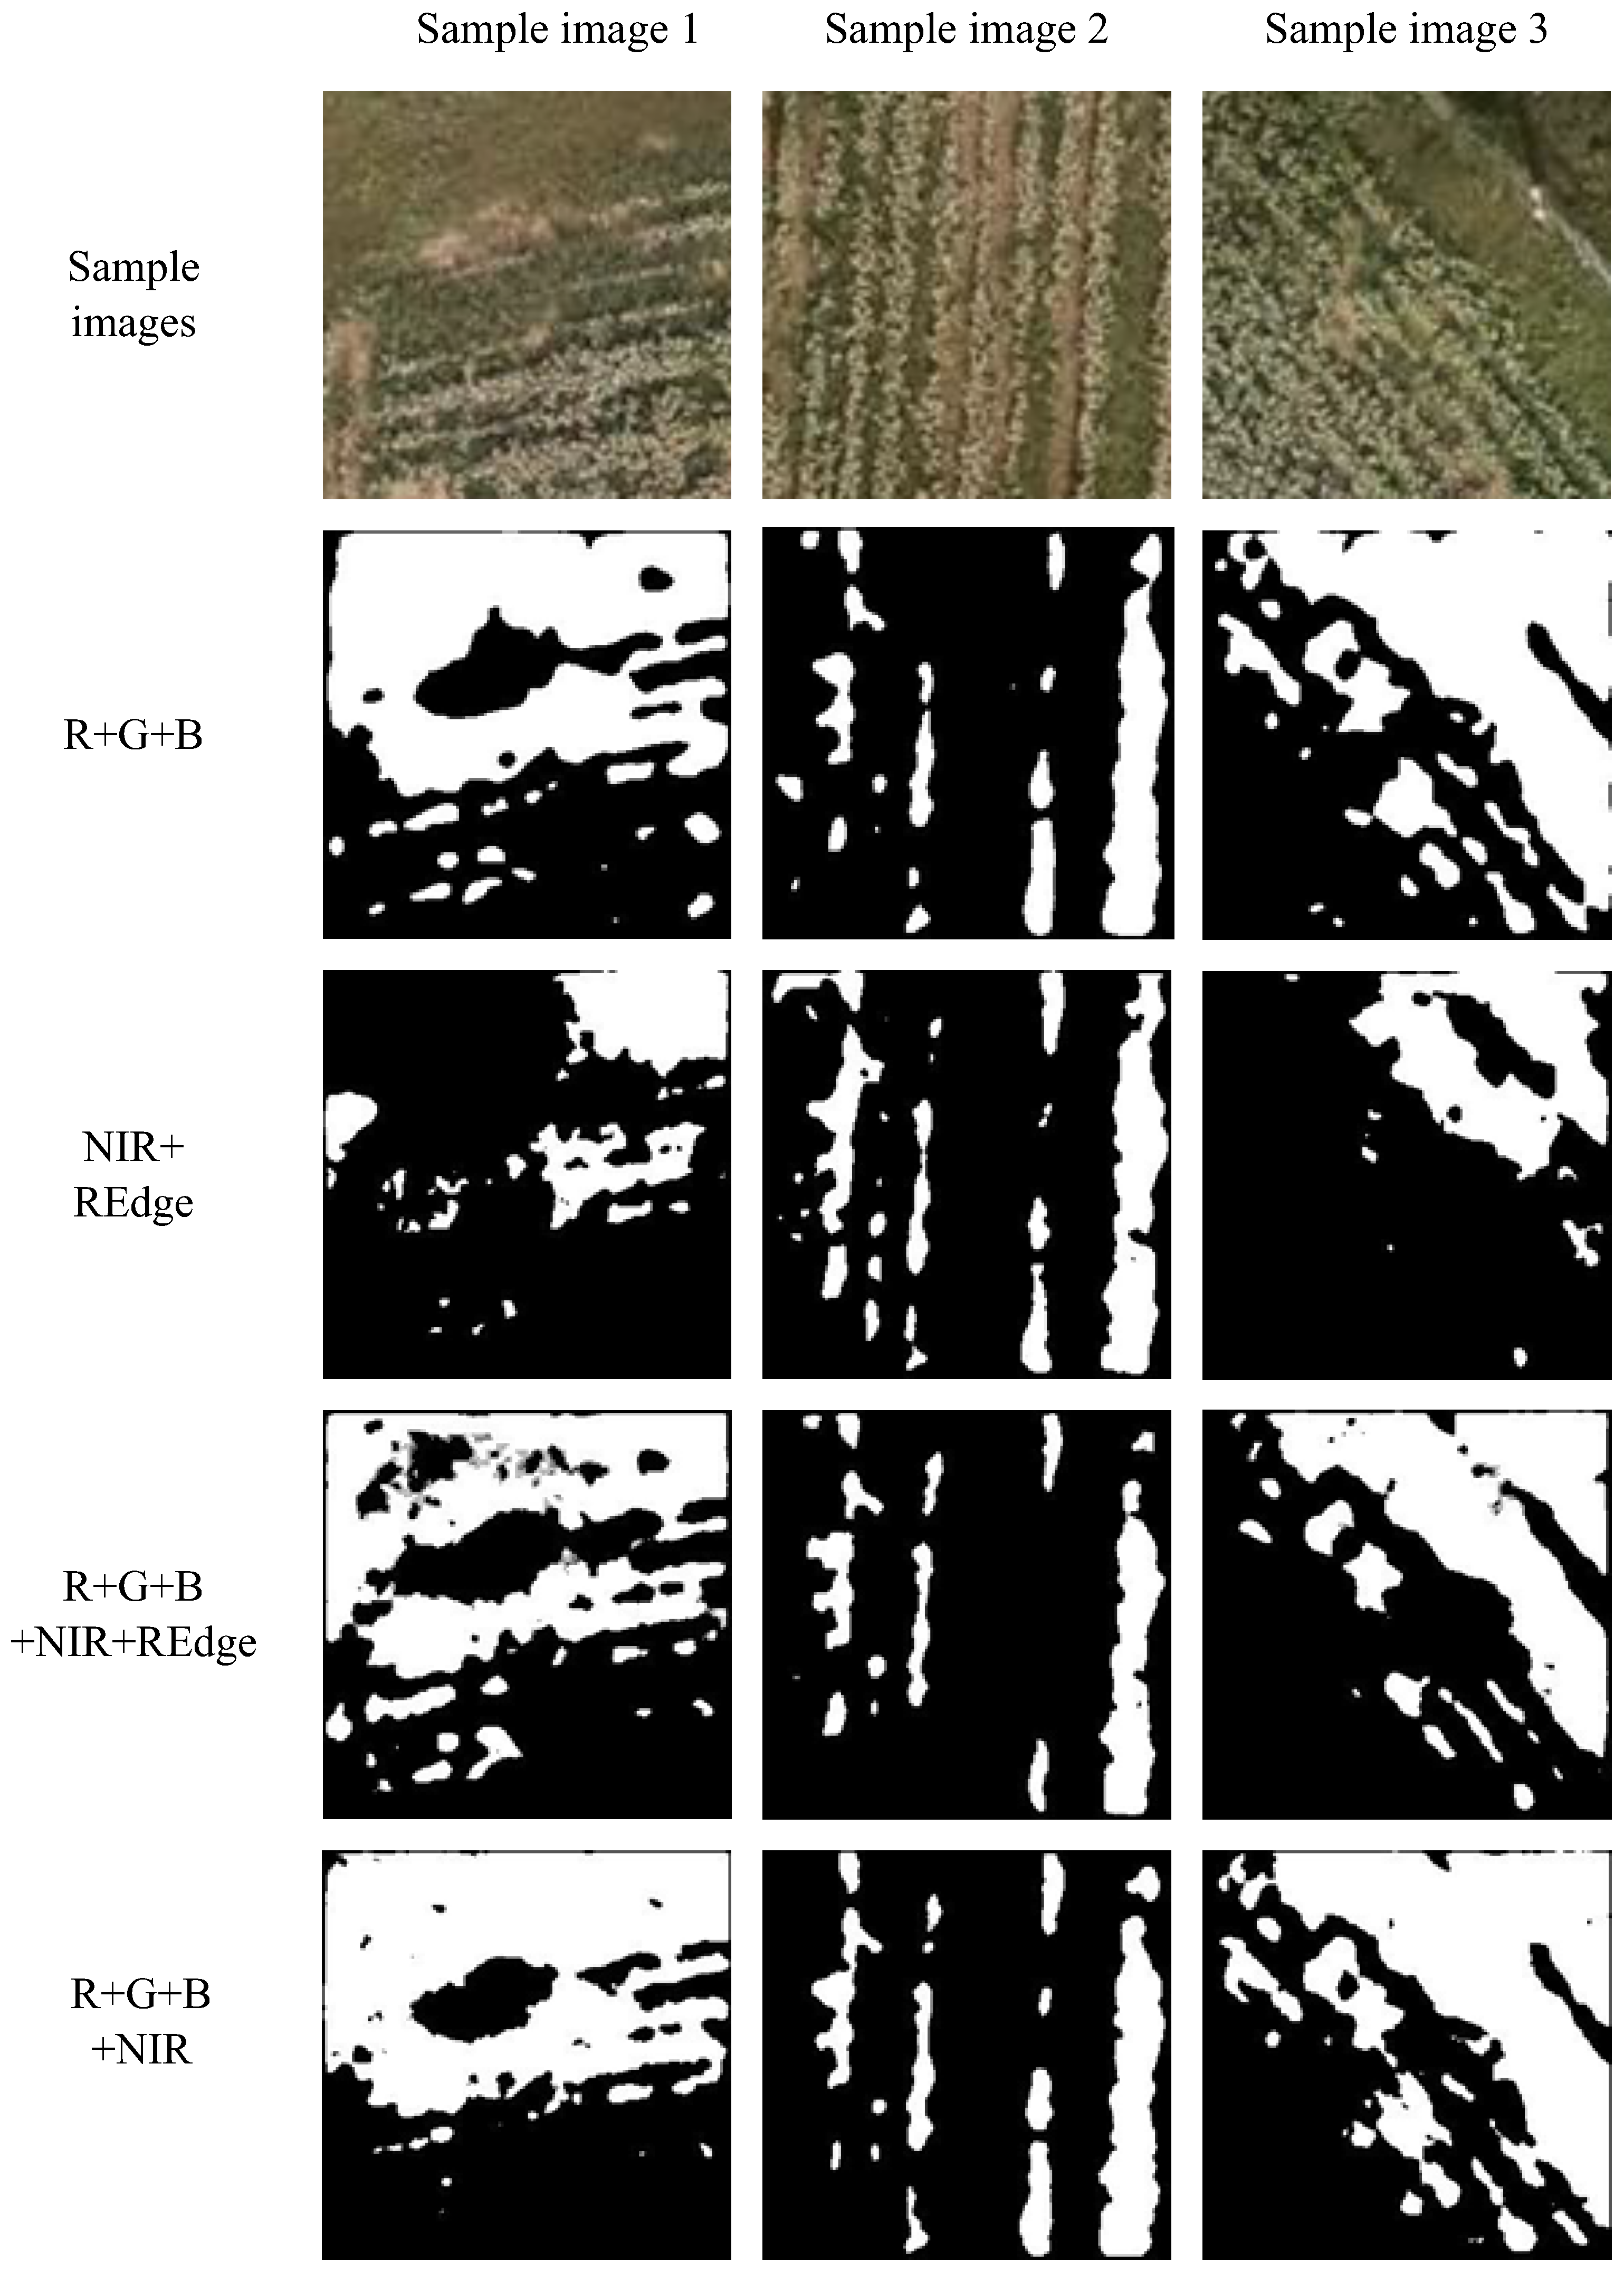
In order to fully utilize the band information of multispectral remote sensing images, a comparative analysis was conducted on the nine multispectral combinations of R+G+B, NIR+REdge, R+G+B+NIR+REdge, R+G+B+REdge, R+G+B+NIR, B+NIR, B+REdge, and R+B+REdge. The segmentation performance of the R+G+B+NIR band combination was the best, with mPA, mIoU, Dice, and F1 values of 0.76, 0.65, 0.85, and 0.78, respectively. This indicated that using a multi-band combination can better achieve weed recognition.
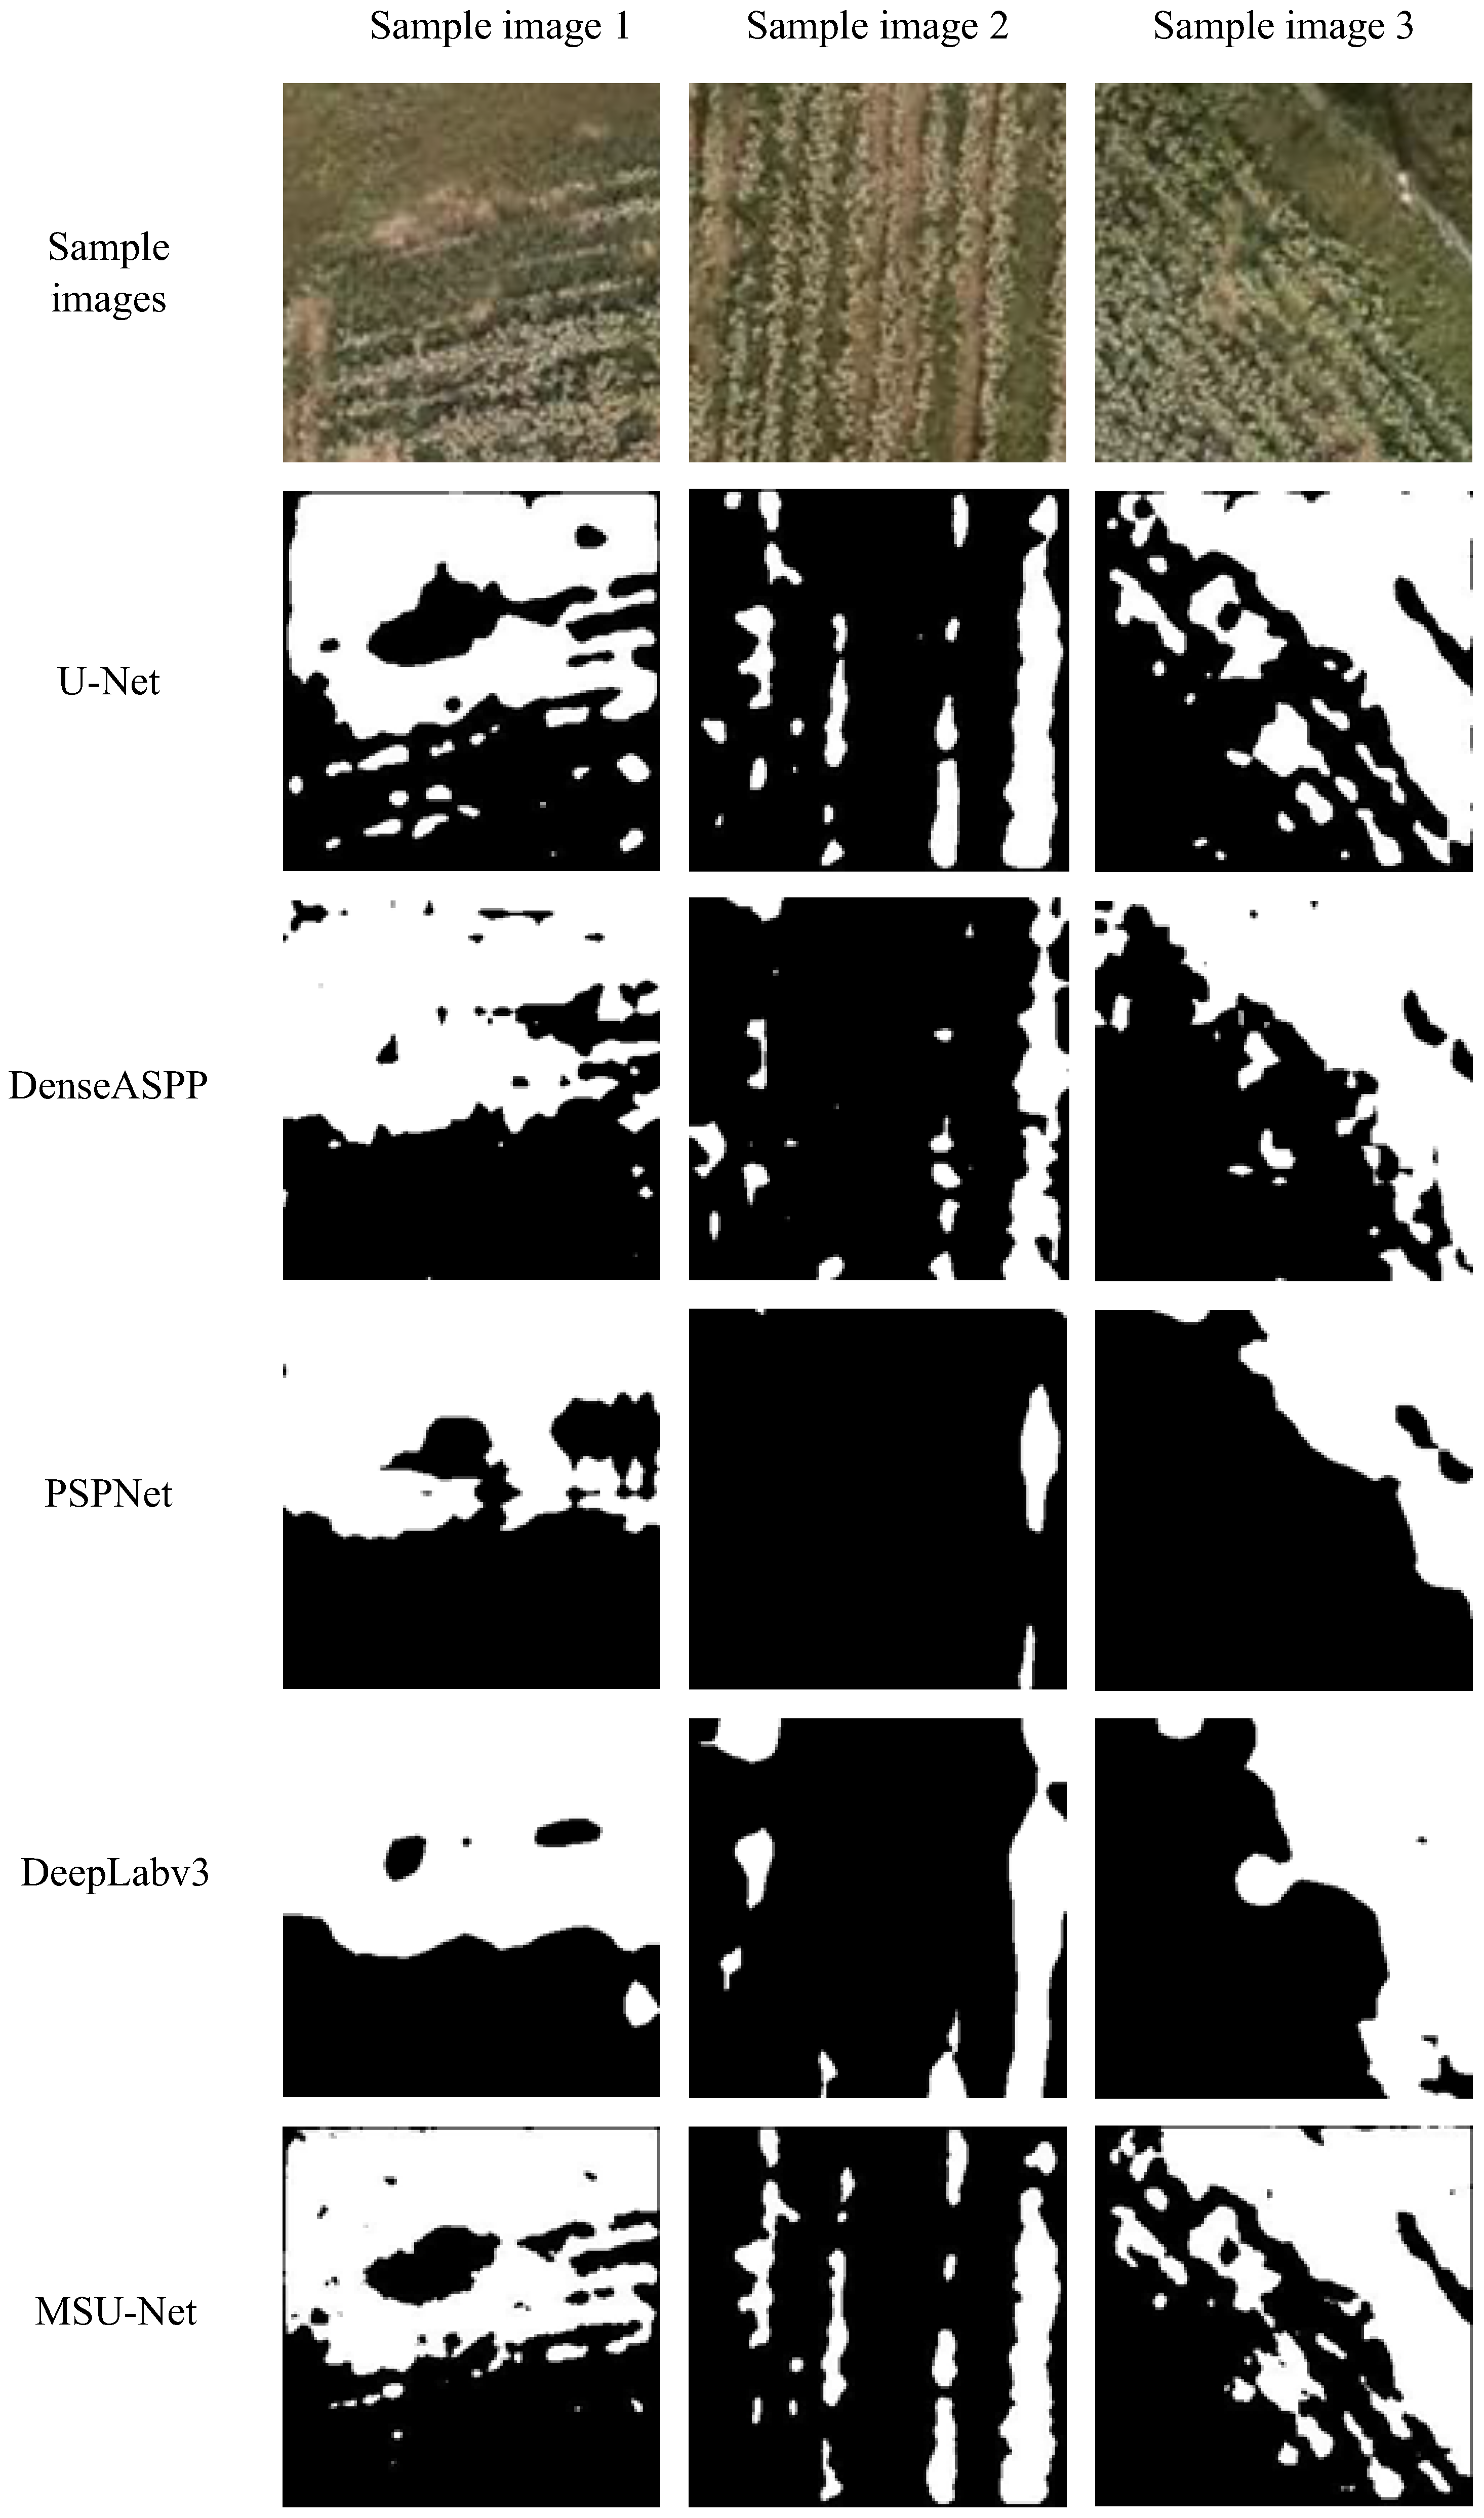
To further validate the advantages of the proposed algorithm, a comparative analysis was conducted based on U-Net, DenseASPP, PSPNet, and DeepLabv3. Considering all evaluation indicators comprehensively, the MSU-Net model in this paper achieved a preferable balance between model accuracy and resource consumption.
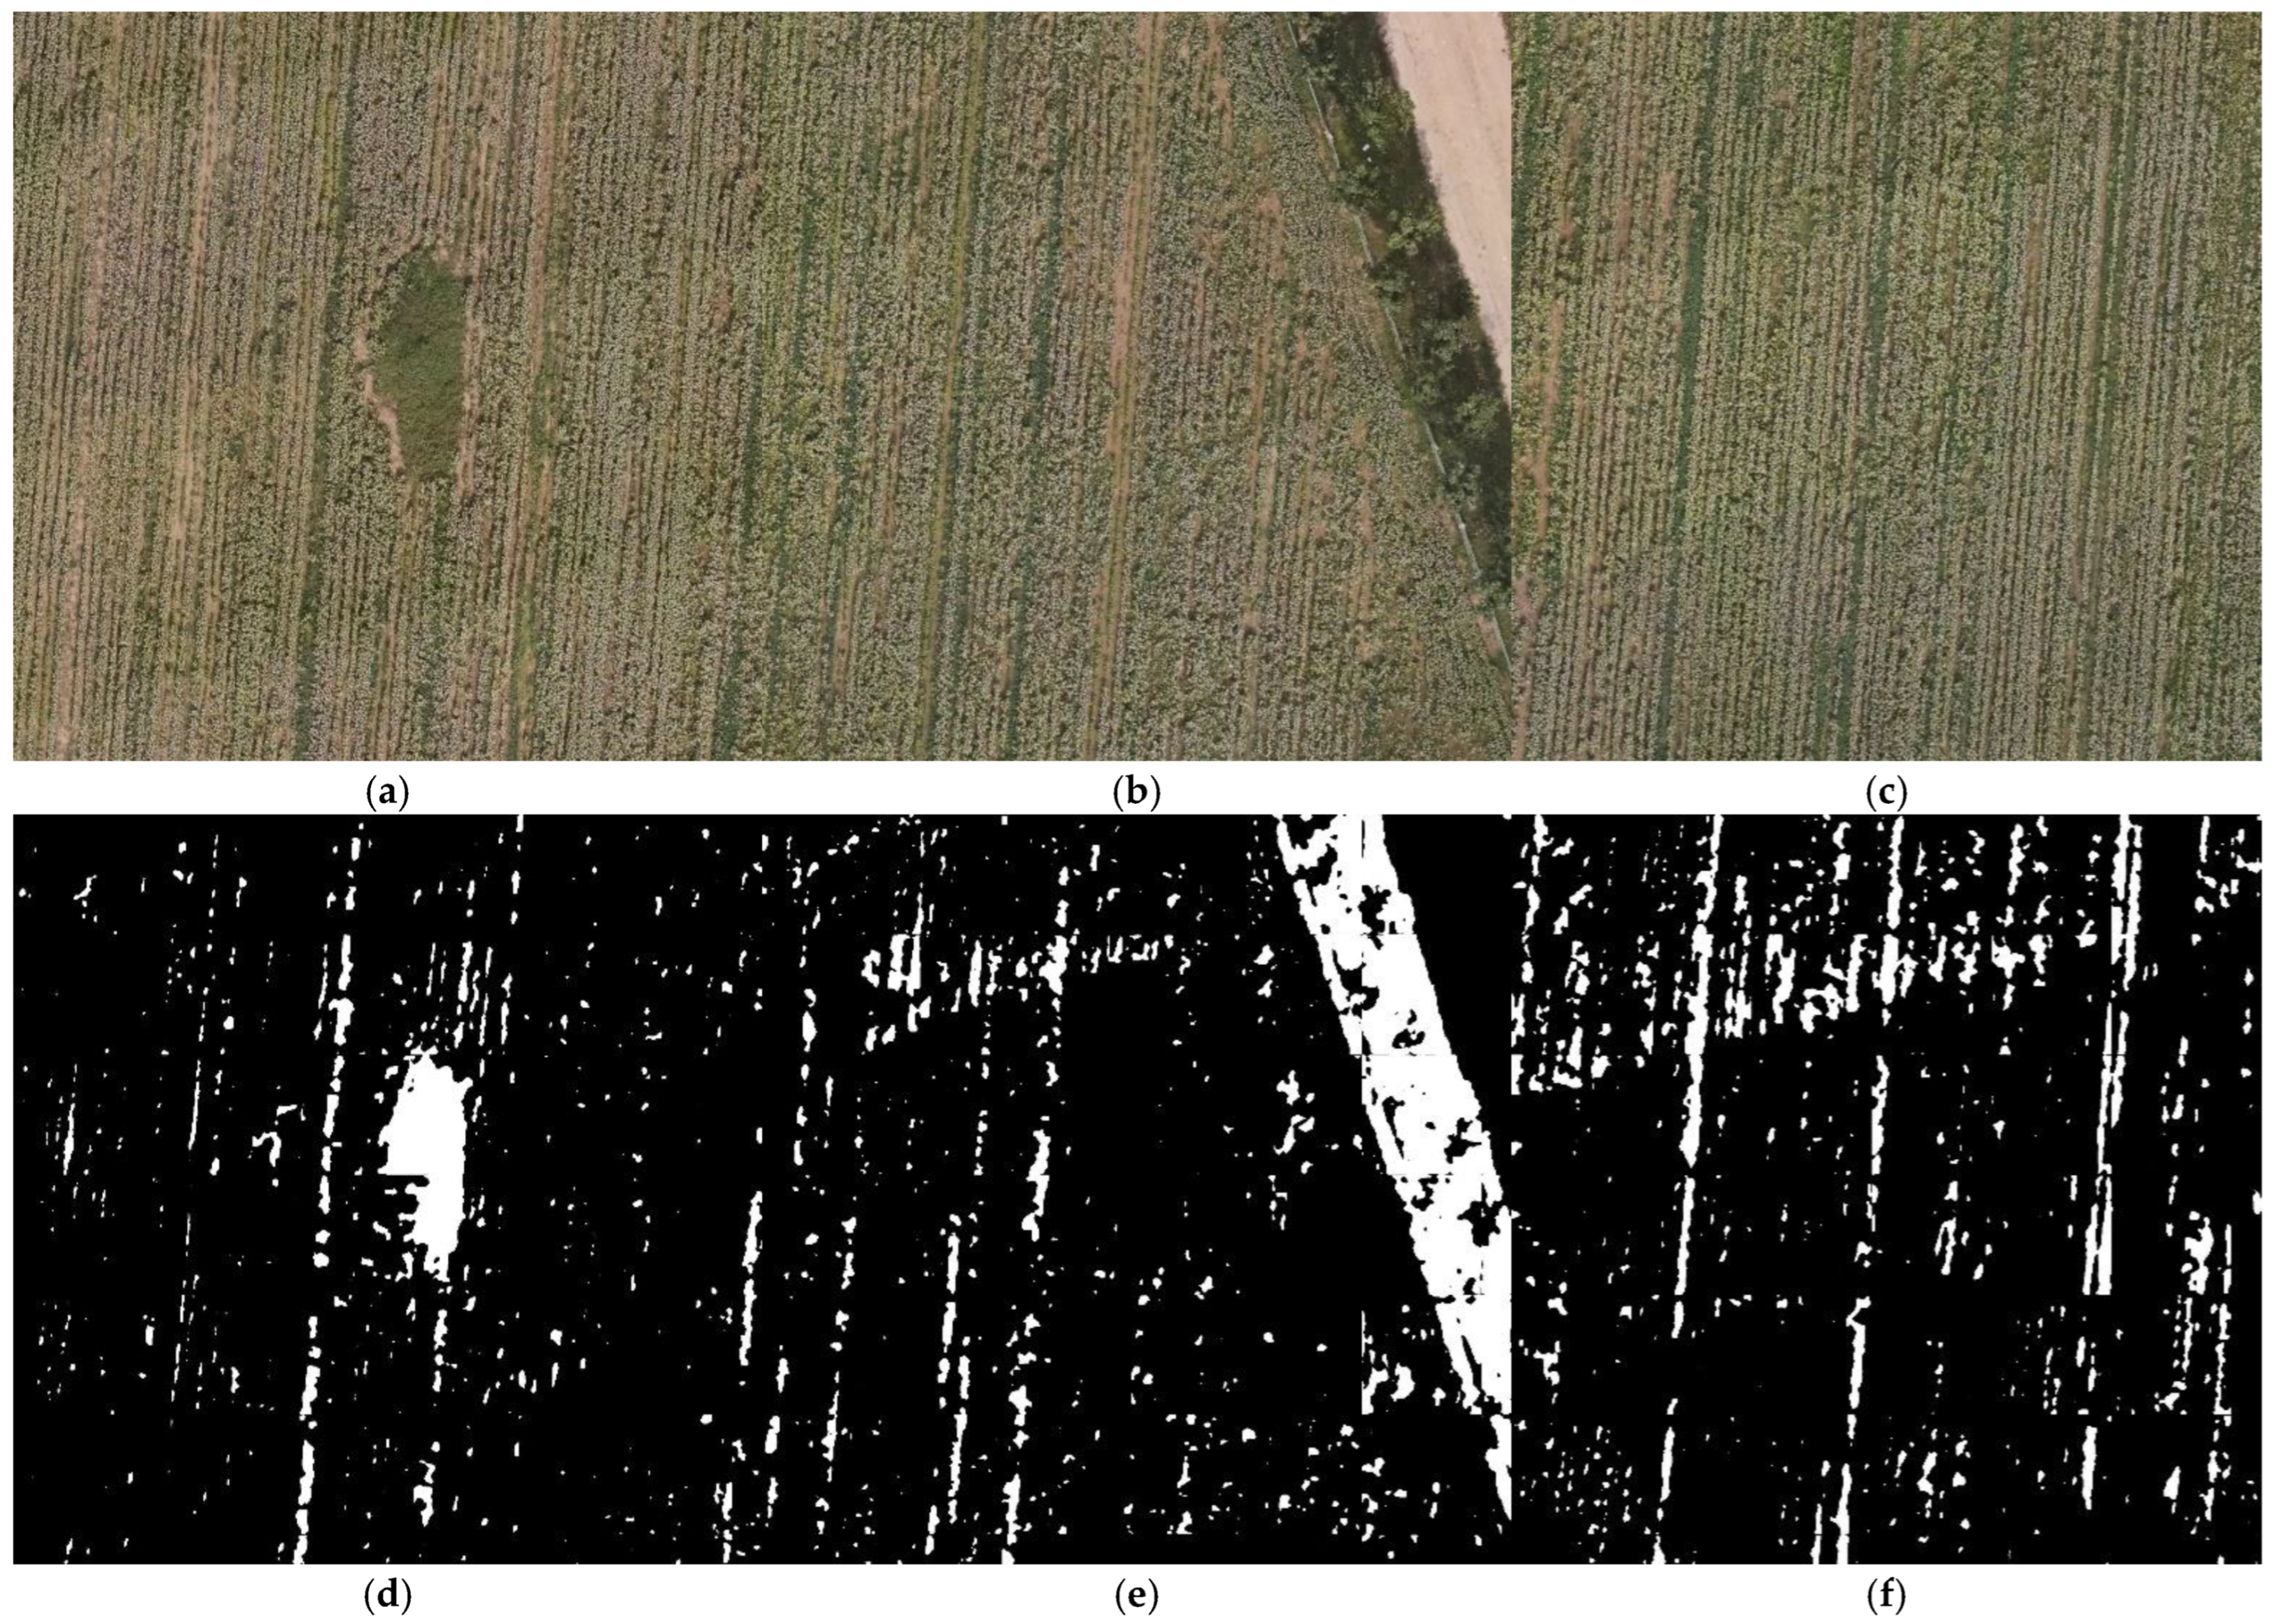
Large-scene UAV weed maps were constructed to improve agricultural management efficiency and promote the development of agriculture towards sustainability and intelligence. The algorithm in this paper can effectively identify weed areas in three situations of weed concentration, edge field, and common field. Weed maps combined with biological control or mechanical weeding technology can reduce the pollution of chemical agents to the environment and agricultural products.


