
Evaluating the Technical Efficiency of Dairy Farms Under Technological Heterogeneity: Evidence from Lithuania


Abstract
1. Introduction
2. Literature Review
3. Materials and Methods
- Utilized agricultural area (UAA, X1) comprises both owned and rented area measured in hectares.
- Labor (X2), measured in hours worked by annual work units (AWU), includes both family labor and hired labor.
- Herd size (X3) measured in livestock units (LU).
- Intermediate consumption (X4) includes specific costs for agricultural production (seeds, fertilizers, crop protection products, crop insurance for crops, purchased concentrates, purchased coarse fodder, farm use of non-fodder crops, specific forage costs, milk herd renewal costs, the milk levy and other specific livestock costs (veterinary, etc.)) + non-specific costs: upkeep of machinery and buildings, power (fuel and electricity), contract work, taxes and other dues (excluding the milk levy), taxes on land and buildings, insurance for farm buildings and other direct costs.
- Capital assets (X5)—the value of machinery and buildings at the beginning of the year. The capital assets do not include the value of agricultural land and the value of livestock to avoid double counting.
4. Results and Discussions
4.1. The Dairy Sector in Lithuania
4.2. Technical Efficiency of Lithuanian Dairy Farms
5. Conclusions
Author Contributions
Funding
Institutional Review Board Statement
Data Availability Statement
Conflicts of Interest
References
- European, Commission. EU Farm to Fork Strategy for a Fair, Healthy and Environmentally-Friendly Food System. 2020. Available online: https://food.ec.europa.eu/horizontal-topics/farm-fork-strategy_en (accessed on 12 November 2024).
- European Commission. EU Biodiversity Strategy for 2030. Bringing Nature Back Into Our Lives. 2020. Available online: https://eur-lex.europa.eu/summary/SR/4459196 (accessed on 12 November 2024).
- Alvarez, A.; Arias, C. Effects of switching between production systems in dairy farming. Bio-Based Appl. Econ. 2015, 4, 1–16. [Google Scholar]
- Augere-Granier, M.-L. The EU Dairy Sector. Main Features, Challenges and Prospects; European Parliamentary Research Service: Luxemburg, 2018. [Google Scholar]
- Guth, M. Determinants of milk production diversity in the macroregions of the European Union. Acta Sci. Pol. Oeconomia 2017, 16, 33–42. [Google Scholar]
- Jongeneel, R.; Gonzalez-Martinez, A.; Donnellan, T.; Thorne, F.; Dillon, E.; Loughrey, J. Research for AGRI Committee—Development of Milk Production in the EU After the End of Milk Quotas. 2023. Available online: https://www.europarl.europa.eu/RegData/etudes/STUD/2023/747268/IPOL_STU(2023)747268_EN.pdf (accessed on 20 February 2024).
- Läpple, D.; Carter, C.A.; Buckley, C. EU milk quota abolition, dairy expansion, and greenhouse gas emissions. Agric. Econ. 2022, 53, 125–142. [Google Scholar]
- European Commission. Agridata/Dairy Production. 2024. Available online: https://agridata.ec.europa.eu/extensions/DashboardDairy/DairyProduction.html (accessed on 27 March 2025).
- European Commission. Agridata/EU Milk Specialised Farms. 2024. Available online: https://agridata.ec.europa.eu/extensions/DairyReport/DairyReport.html (accessed on 26 March 2025).
- Latruffe, L.; Desjeux, Y. Common Agricultural Policy support, technical efficiency and productivity change in French agriculture. Rev. Agric. Food Environ. Stud. 2016, 97, 15–28. [Google Scholar]
- Blank, S.C. The Profit Problem of American Agriculture: What We Have Learned with the Perspective of Time. Choices 2018, 33, 1–7. [Google Scholar]
- Kulawik, J.; Wieliczko, B.; Płonka, R. Changes in the income situation of agricultural holdings in the light of the Polish FADN observations from 2004–2018. Probl. Agric. Econ. 2020, 365, 108–134. [Google Scholar]
- Poczta, W.; Średzińska, J.; Chenczke, M. Economic situation of dairy farms in identified clusters of european union countries. Agriculture 2020, 10, 92. [Google Scholar] [CrossRef]
- Requena-i-Mora, M.; Barbeta-Viñas, M. The agrarian question in dairy farms: An analysis of dairy farms in the European Union countries. Agric. Hum. Values 2023, 41, 459–474. [Google Scholar]
- Wiggins, S.; Kirsten, J.; Llambí, L. The Future of Small Farms. World Dev. 2010, 38, 1341–1348. [Google Scholar]
- Koutouzidou, G.; Ragkos, A.; Melfou, K. Evolution of the Structure and Economic Management of the Dairy Cow Sector. Sustainability 2022, 14, 11602. [Google Scholar] [CrossRef]
- O’Donnell, C.J.; Rao, D.S.P.; Battese, G.E. Metafrontier frameworks for the study of firm-level efficiencies and technology ratios. Empir. Econ. 2008, 34, 231–255. [Google Scholar]
- Farrell, M.J. The measurement of productive efficiency. J. R. Stat. Soc. Ser. A 1957, 120, 253–290. [Google Scholar]
- Alem, H.; Lien, G.; Hardaker, J.B.; Guttormsen, A. Regional differences in technical efficiency and technological gap of the Norwegian dairy farms: A stochastic meta-frontier model. Appl. Econ. 2019, 51, 409–421. [Google Scholar]
- Latruffe, L.; Niedermayr, A.; Desjeux, Y.; Dakpo, K.H.; Ayouba, K.; Schaller, L.; Kantelhardt, J.; Jin, Y.; Kilcline, K.; Ryan, M.; et al. Identifying and assessing intensive and extensive technologies in European dairy farming. Eur. Rev. Agric. Econ. 2023, 50, 1482–1519. [Google Scholar]
- Dakpo, K.H.; Latruffe, L.; Desjeux, Y.; Jeanneaux, P. Modeling heterogeneous technologies in the presence of sample selection: The case of dairy farms and the adoption of agri-environmental schemes in France. Agric. Econ. 2022, 53, 422–438. [Google Scholar]
- Battese, G.E.; Prasada Rao, D.S.; O’Donnell, C.J. A metafrontier production function for estimation of technical efficiencies and technology gaps for firms operating under different technologies. J. Product. Anal. 2004, 21, 91–103. [Google Scholar]
- Baležentis, T.; Karagiannis, G. Aggregate Efficiency Dynamics in Lithuanian Dairy Farms. Ger. J. Agric. Econ. 2021, 70, 251–264. [Google Scholar]
- Baležentis, T.; Sun, K. Measurement of technical inefficiency and total factor productivity growth: A semiparametric stochastic input distance frontier approach and the case of Lithuanian dairy farms. Eur. J. Oper. Res. 2020, 285, 1174–1188. [Google Scholar]
- Kelly, E.; Shalloo, L.; Geary, U.; Kinsella, A.; Thorne, F.; Wallace, M. An analysis of the factors associated with technical and scale efficiency of Irish dairy farms. Int. J. Agric. Manag. 2013, 2, 149–159. [Google Scholar]
- Skevas, I. Accounting for technology heterogeneity in the measurement of persistent and transient inefficiency. Econ. Model. 2024, 137, 106776. [Google Scholar]
- Ahikiriza, E.; Van Meensel, J.; Gellynck, X.; Lauwers, L. Heterogeneity in frontier analysis: Does it matter for benchmarking farms? J. Product. Anal. 2021, 56, 69–84. [Google Scholar]
- Adenuga, A.H.; Davis, J.; Hutchinson, G.; Donnellan, T.; Patton, M. Modelling regional environmental efficiency differentials of dairy farms on the island of Ireland. Ecol. Indic. 2018, 95, 851–861. [Google Scholar]
- Cele, L.P.; Hennessy, T.; Thorne, F. Regional technical efficiency rankings and their determinants in the Irish dairy industry: A stochastic meta-frontier analysis. Agribusiness 2022, 39, 727–743. [Google Scholar]
- Latruffe, L.; Bravo-Ureta, B.E.; Carpentier, A.; Desjeux, Y.; Moreira, V.H. Subsidies and technical efficiency in agriculture: Evidence from European dairy farms. Am. J. Agric. Econ. 2017, 99, 783–799. [Google Scholar]
- Madau, F.A.; Furesi, R.; Pulina, P. Technical efficiency and total factor productivity changes in European dairy farm sectors. Agric. Food Econ. 2017, 5, 17. [Google Scholar]
- Kumbhakar, S.C.; Tsionas, E.G.; Sipiläinen, T. Joint estimation of technology choice and technical efficiency: An application to organic and conventional dairy farming. J. Product. Anal. 2009, 31, 151–161. [Google Scholar]
- Alvarez, A.; Del Corral, J.; Solís, D.; Pérez, J.A. Does intensification improve the economic efficiency of dairy farms? J. Dairy Sci. 2008, 91, 3693–3698. [Google Scholar]
- Alvarez, A.; Arias, C. Technical efficiency and farm size: A conditional analysis. Agric. Econ. 2004, 30, 241–250. [Google Scholar]
- Alvarez, A.; Del Corral, J. Identifying different technologies using a latent class model: Extensive versus intensive dairy farms. Eur. Rev. Agric. Econ. 2010, 37, 231–250. [Google Scholar]
- Ojo, O.M.; Adenuga, A.H.; Lauwers, L.; Van Meensel, J. Unraveling the impact of variable external input use on the cost efficiency of dairy farms in Europe. Environ. Sustain. Indic. 2020, 8, 100076. [Google Scholar]
- Dakpo, K.H.; Latruffe, L.; Desjeux, Y.; Jeanneaux, P. Latent Class Modelling for a Robust Assessment of Productivity: Application to French Grazing Livestock Farms. J. Agric. Econ. 2021, 72, 760–781. [Google Scholar]
- Garcia-Covarrubias, L.; Läpple, D.; Dillon, E.; Thorne, F. Automation and efficiency: A latent class analysis of Irish dairy farms. Q Open 2023, 3, qoad015. [Google Scholar]
- Sauer, J. The Empirical Identification of Heterogenous Technologies and Technical Change. Appl. Econ. 2011, 45, 1461–1479. [Google Scholar]
- Gonzalez-Mejia, A.; Styles, D.; Wilson, P.; Gibbons, J. Metrics and methods for characterizing dairy farm intensification using farm survey data. PLoS ONE 2018, 13, e0195286. [Google Scholar]
- Guth, M. Diversity of FADN milk farms in the regions of the European Union in 2011. Roczniki 2011, 2015, 119–124. [Google Scholar]
- Náglová, Z.; Rudinskaya, T. Factors influencing technical efficiency in the EU dairy farms. Agriculture 2021, 11, 1114. [Google Scholar] [CrossRef]
- Stetter, C.; Wimmer, S.; Sauer, J. Are Intensive Farms More Emission Efficient? Evidence from German Dairy Farms. J. Agric. Resour. Econ. 2023, 48, 136–157. [Google Scholar]
- Renner, S.; Sauer, J.; El Benni, N. Why considering technological heterogeneity is important for evaluating farm performance? Eur. Rev. Agric. Econ. 2021, 48, 415–445. [Google Scholar]
- European Commission. The European Green Deal. 2019. Available online: https://eur-lex.europa.eu/legal-content/EN/TXT/?qid=1588580774040&uri=CELEX%3A52019DC0640 (accessed on 12 March 2025).
- European Commission. A New Circular Economy Action Plan. For a Cleaner and More Competitive Europe. 2020. Available online: https://eur-lex.europa.eu/resource.html?uri=cellar:9903b325-6388-11ea-b735-01aa75ed71a1.0017.02/DOC_1&format=PDF (accessed on 19 November 2024).
- European Commission. Regulation of the European Parliament and of the Council on Nature Restoration and Amending Regulation (EU) 2022/869. 2024. Available online: https://eur-lex.europa.eu/eli/reg/2024/1991/oj/eng (accessed on 19 November 2024).
- Bravo-Ureta, B.E.; Solís, D.; Moreira López, V.H.; Maripani, J.F.; Thiam, A.; Rivas, T. Technical efficiency in farming: A meta-regression analysis. J. Product. Anal. 2007, 27, 57–72. [Google Scholar]
- Gadanakis, Y.; Bennett, R.; Park, J.; Areal, F.J. Evaluating the Sustainable Intensification of arable farms. J. Environ. Manag. 2015, 150, 288–298. [Google Scholar]
- Gadanakis, Y.; Areal, F.J. Accounting for rainfall and the length of growing season in technical efficiency analysis. Oper. Res. 2020, 20, 2583–2608. [Google Scholar]
- Kelly, E.; Shalloo, L.; Geary, U.; Kinsella, A.; Wallace, M. Application of data envelopment analysis to measure technical efficiency on a sample of Irish dairy farms. Ir. J. Agric. Food Res. 2012, 51, 63–77. [Google Scholar]
- Mohsenirad, S.; Triantis, K. Testing for heterogeneity in data envelopment analysis. Ann. Oper. Res. 2025. [Google Scholar] [CrossRef]
- Wilczyński, A.; Kołoszycz, E.; Świtłyk, M. Technical Efficiency of Dairy Farms: An Empirical Study of Producers in Poland. Eur. Res. Stud. J. 2020, 23, 117–127. [Google Scholar]
- Pavanello, C.; Franchini, M.; Bovolenta, S.; Marraccini, E.; Corazzin, M. Sustainability Indicators for Dairy Cattle Farms in European Union Countries: A Systematic Literature Review. Sustainability 2024, 16, 4214. [Google Scholar] [CrossRef]
- Robling, H.; Abu Hatab, A.; Säll, S.; Hansson, H. Measuring sustainability at farm level—A critical view on data and indicators. Environ. Sustain. Indic. 2023, 18, 100258. [Google Scholar]
- Karlsson, J.O.; Robling, H.; Cederberg, C.; Spörndly, R.; Lindberg, M.; Martiin, C.; Ardfors, E.; Tidåker, P. What can we learn from the past? Tracking sustainability indicators for the Swedish dairy sector over 30 years. Agric. Syst. 2023, 212, 103779. [Google Scholar]
- Entrena-Barbero, E.; Tarpani, R.R.Z.; Fernández, M.; Moreira, M.T.; Gallego-Schmid, A. Integrating circularity as an essential pillar of dairy farm sustainability. J. Clean. Prod. 2024, 458, 142508. [Google Scholar]
- Statistcs Lithuania. State Data Agency. Žemės Ūkio Statistika. 2024. Available online: https://osp.stat.gov.lt/zemes-ukis (accessed on 2 April 2025).

| Indicator | Method | Author |
|---|---|---|
| Cows per hectare of land, purchased feed (purchased concentrate) per cow | Latent class model | (Alvarez & Arias, 2015 [3]; Alvarez & Del Corral, 2010 [35]) |
| Milk per cow, milk per hectare, feed per cow, and cows per hectare | Cluster analysis | (Alvarez et al., 2008 [33]) |
| Livestock density (stocking rate, no. total livestock unit (LU) per hectare of forage area); the ratio of fodder area to UAA; the share of the rented area to UAA | Latent class model | (Latruffe et al., 2023 [20]) |
| Stocking rate (no. dairy cows per ha); feeding intensity (purchased feed per cow) | Latent class model | (Stetter et al., 2023 [43]) |
| Stocking rate (no. LU per ha of UAA); share of permanent grassland in the UAA | Latent class model | (Dakpo et al., 2022 [21]) |
| Intensive/extensive nature of production: stocking rate (no. dairy cows per ha), fodder quantity per cow; Organic/conventional systems: share of organic milk revenue in total revenue or chemicals per hectare; The input intensity of production: labor per cow, capital per cow; Specialization dairy: Share of milk revenue in total revenue. | Latent class model | (Sauer, 2011 [39]) |
| Milk production specifically (no. of dairy cows, milk yield, concentrate feed per LU, fodder per LU, milk premium); Intensity and specialization of livestock production (dairy stocking density, livestock density, dairy fraction (share of dairy cows in LU), labor intensity (annual worked hours per farm area), and fodder per LU); Grazing prevalence (fodder area/grass area, maize area/grass area); Farm structure for animals (non-cash crop area/UAA, grass area/UAA); Production area (UAA/Farm Area); Tenure (owner occupied area/UAA); Replacement rate (heifers/dairy cows). | Cluster analysis | (Gonzalez-Mejia et al., 2018 [40]) |
| Livestock density (LU per hectare); location in the mountainous region; indicator whether a tie-up barn or free-stall housing system is used; indicator about silage-free production. | Latent class model | (Renner et al., 2021 [44]) |
| Labor intensity (labor hours per LU); farm stocking rate (LU per UAA); specialization dairy (share of dairy gross output in the farm gross output). | Latent class model | (Garcia-Covarrubias et al., 2023 [38]) |
| Input intensity—external input costs per grazing livestock unit or per dairy cows. Farms with high input costs and those with low input costs, corresponding to high and low input technologies, respectively. | Mathematical partitioning | (Ahikiriza et al., 2021 [27]; Ojo et al., 2020 [36]) |
| Farm intensity: stocking rate (no. of livestock units per ha of UAA); share of permanent grassland in UAA; capital intensity (the ratio of fixed assets per labor unit); Environmental practices (the amount of CAP agri-environmental subsidies per hectare of UAA); Weather conditions (average daily effective rainfall (in mm) and temperature (in degrees Celsius). External factors (farm location in LFA). | Latent class model | (Dakpo et al., 2021 [37]) |
| Farms | Cows | Milk Production | Milk Yield Per Cow | |||||
|---|---|---|---|---|---|---|---|---|
| Number (Thous.) | Rate (%) | Number (Thous.) | Rate (%) | Thous. t | Rate (%) | kg | Rate (%) | |
| 2004 | 195.2 | 467.4 | 1848.7 | 4176 | ||||
| 2005 | 181.3 | −7.2% | 462.9 | −1.0% | 1861.6 | 0.7% | 4312 | 3.3% |
| 2006 | 164.6 | −9.2% | 438.1 | −5.4% | 1891.3 | 1.6% | 4484 | 4.0% |
| 2007 | 142.3 | −13.5% | 420.6 | −4.0% | 1936.6 | 2.4% | 4708 | 5.0% |
| 2008 | 121.0 | −15.0% | 395.9 | −5.9% | 1883.8 | −2.7% | 4778 | 1.5% |
| 2009 | 107.8 | −10.9% | 380.2 | −4.0% | 1791.0 | −4.9% | 4811 | 0.7% |
| 2010 | 99.5 | −7.7% | 357.1 | −6.1% | 1736.5 | −3.0% | 4901 | 1.9% |
| 2011 | 91.1 | −8.4% | 345.3 | −3.3% | 1786.4 | 2.9% | 5026 | 2.6% |
| 2012 | 77.6 | −14.8% | 328.4 | −4.9% | 1778.1 | −0.5% | 5227 | 4.0% |
| 2013 | 70.6 | −9.0% | 316.4 | −3.6% | 1722.3 | −3.1% | 5315 | 1.7% |
| 2014 | 64.4 | −8.8% | 310.4 | −1.9% | 1795.1 | 4.2% | 5665 | 6.6% |
| 2015 | 60.1 | −6.7% | 313.5 | 1.0% | 1738.5 | −3.2% | 5636 | −0.5% |
| 2016 | 53.7 | −10.6% | 300.6 | −4.1% | 1627.7 | −6.4% | 5536 | −1.8% |
| 2017 | 47.1 | −12.4% | 285.4 | −5.1% | 1570.7 | −3.5% | 5601 | 1.2% |
| 2018 | 41.4 | −12.2% | 272.1 | −4.7% | 1571.8 | 0.1% | 5934 | 5.9% |
| 2019 | 36.0 | −12.9% | 256.7 | −5.7% | 1551.1 | −1.3% | 6225 | 4.9% |
| 2020 | 30.9 | −14.4% | 241.8 | −5.8% | 1491.7 | −3.8% | 6258 | 0.5% |
| 2021 | 27.5 | −11.0% | 234.3 | −3.1% | 1476.9 | −1.0% | 6425 | 2.7% |
| 2022 | 23.9 | −12.9% | 226.0 | −3.5% | 1521.9 | 3.1% | 6751 | 5.1% |
| 2023 | 21.5 | −10.1% | 223.0 | −1.4% | 1473.0 | −3.2% | 6724 | −0.4% |
| 20-year period | −173.7 | −89.0% | −244.4 | −52.3% | −375.7 | −20.3% | 2548 | 61.0% |
| Average annual rate | −10.9% | −3.8% | −1.1% | 2.6% | ||||
| All Farms | Cluster1-Extensive Farms | Cluster2-Intensive Farms | ||||
|---|---|---|---|---|---|---|
| Mean | Std. Dev. | Mean | Std. Dev. | Mean | Std. Dev. | |
| Farms, number | 176 | 117 | 60 | |||
| Total farm output (EUR) y | 153,262 | 299,152 | 73,222 | 84,589 | 308,007 | 463,193 |
| UAA (ha) X1 | 107 | 115 | 79 | 75 | 161 | 155 |
| Total farm labor (h) X2 | 6318 | 6091 | 4761 | 2484 | 9327 | 9167 |
| Herd size (LU) X3 | 78.1 | 102.7 | 43.5 | 42.8 | 145.1 | 144.3 |
| Intermediate consumption (EUR) X4 | 96,277 | 194,857 | 46,041 | 53,183 | 193,400 | 304,226 |
| Capital (excluding herd and land) (EUR) X5 | 156,452 | 261,412 | 82,798 | 130,278 | 298,850 | 371,920 |
| Livestock density (LU/UAA) | 0.66 | 0.30 | 0.53 | 0.20 | 0.92 | 0.29 |
| Share of home-grown feed | 0.75 | 0.17 | 0.85 | 0.10 | 0.57 | 0.12 |
| UAA productivity (milk/ha), t | 2.49 | 1.47 | 1.81 | 0.88 | 3.81 | 1.48 |
| Milk yield (kg per dairy cow) | 5487 | 1553 | 5092 | 1363 | 6250 | 1624 |
| Average cows per farm | 52 | 72 | 28 | 28 | 97 | 104 |
| Standard Production (EUR) | 117,469 | 169,734 | 68,169 | 70,159 | 212,782 | 248,677 |
| Total farm output per hectare (EUR) | 1118 | 629 | 838 | 376 | 1659 | 669 |
| Total farm output per LU (EUR) | 1691 | 546 | 1627 | 536 | 1813 | 549 |
| Total farm output per AWU (EUR) | 39,531 | 33,059 | 28,814 | 21,452 | 60,251 | 41,015 |
| Ratio of dairy output to total farm output | 0.59 | 0.12 | 0.55 | 0.12 | 0.67 | 0.08 |
| Operational subsidies, EUR | 28,625 | 28,267 | 20,732 | 18,037 | 43,885 | 37,101 |
| Operational subsidies per UAA, EUR | 284 | 69 | 277 | 73 | 299 | 59 |
| Operational subsidies per LU, EUR | 532 | 331 | 629 | 367 | 344 | 90 |
| Interm. consumption per LU (EUR) | 1108 | 340 | 1090 | 342 | 1141 | 337 |
| Interm. consumption as share of total output | 0.67 | 67 | 0.69 | 0.18 | 0.64 | 0.09 |
| Share of hired labor in total labor | 0.28 | 0.16 | 0.18 | 0.27 | 0.49 | 0.34 |
| Milk price (EUR/t) | 269 | 52 | 257 | 53 | 293 | 40 |
| Net value added (EUR) | 55,030 | 89,686 | 30,700 | 35,503 | 102,067 | 134,118 |
| Net value added per AWU (EUR) | 15,060 | 12,767 | 11,900 | 11,328 | 21,170 | 13,256 |
| Mean | SD | Min | Max | |
|---|---|---|---|---|
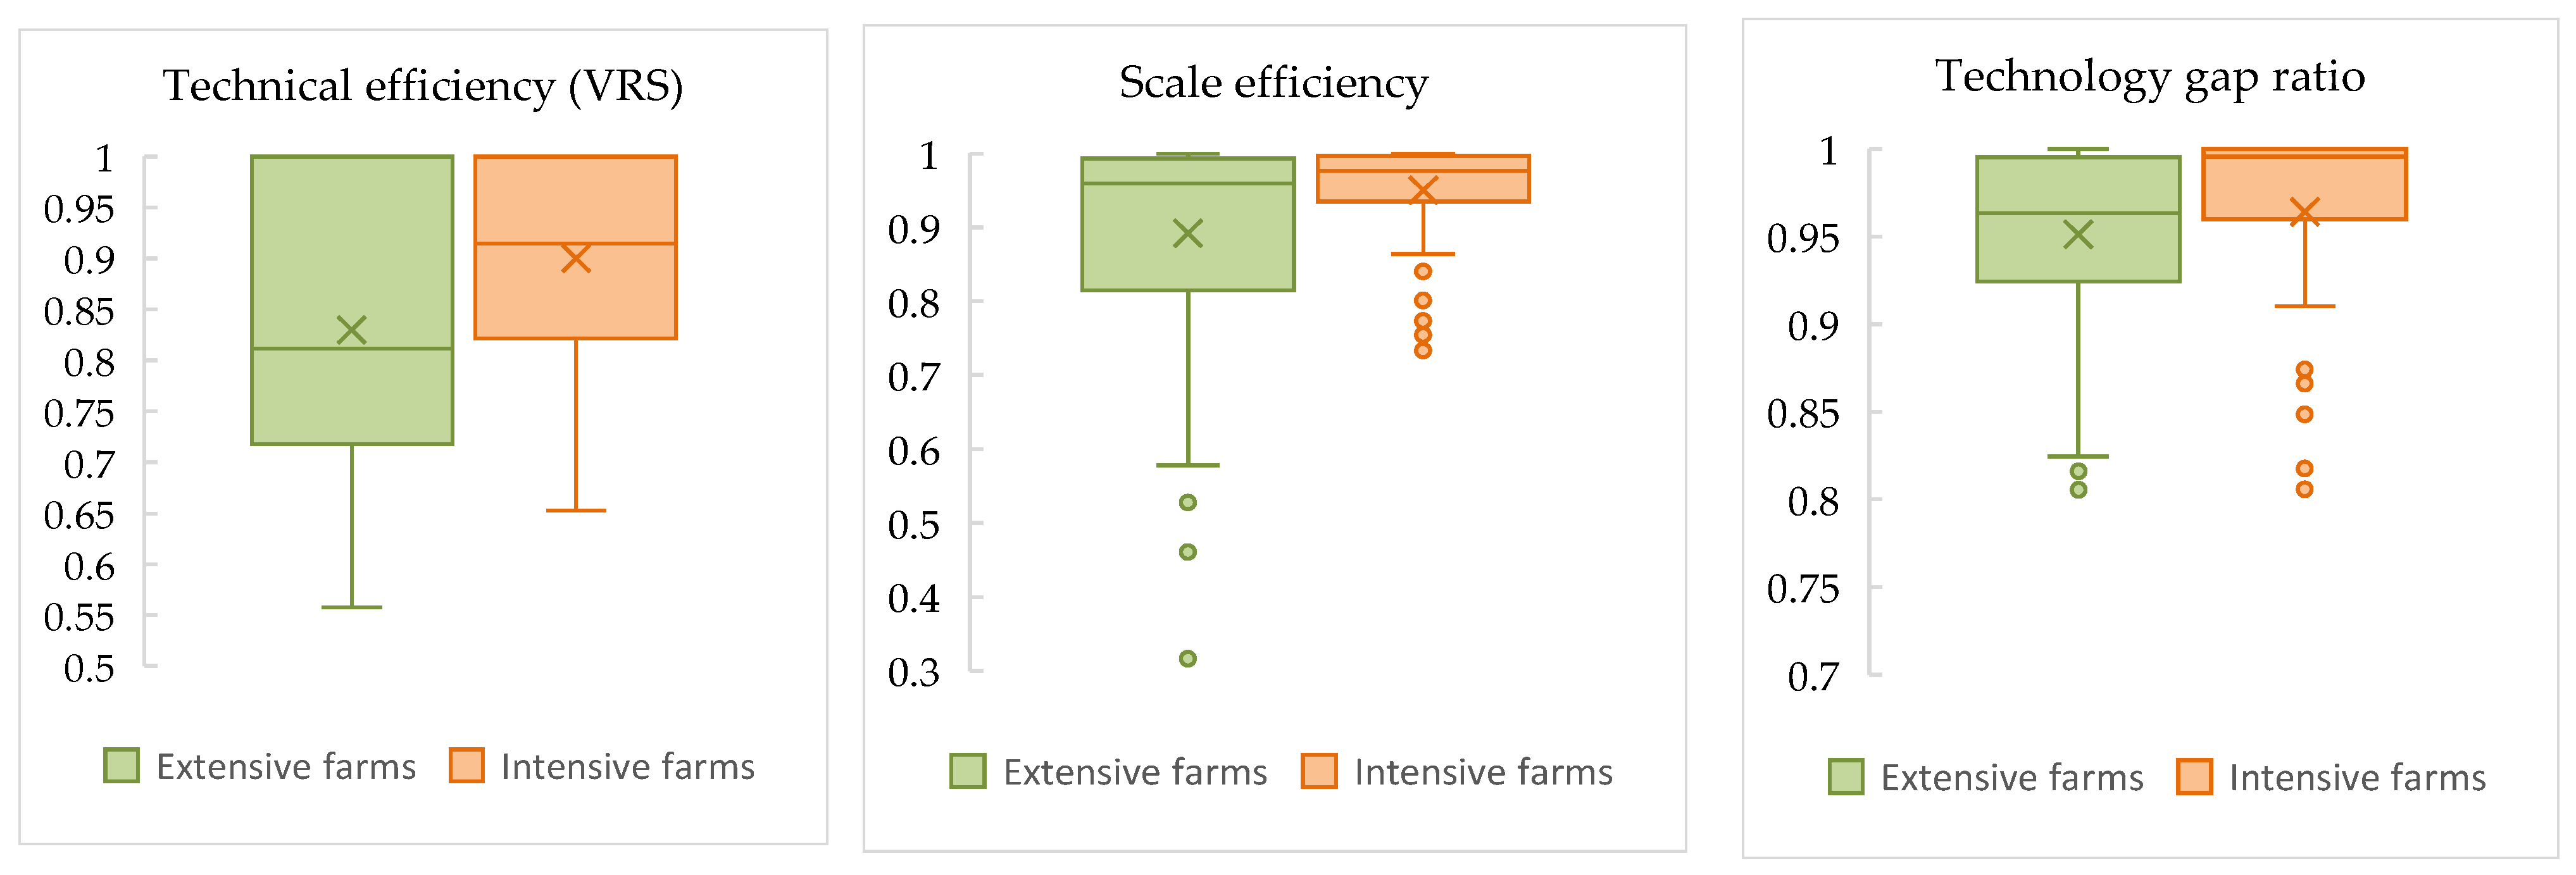
| TE_VRS group frontier | ||||
| Extensive | 0.818 | 0.140 | 0.557 | 1.000 |
| Intensive | 0.894 | 0.101 | 0.653 | 1.000 |
| TE_CRS group frontier | ||||
| Extensive | 0.718 | 0.184 | 0.316 | 1.000 |
| Intensive | 0.847 | 0.117 | 0.614 | 1.000 |
| SE_group | ||||
| Extensive | 0.892 | 0.139 | 0.316 | 1.000 |
| Intensive | 0.950 | 0.069 | 0.734 | 1.000 |
| TE_VRS meta-frontier | ||||
| Extensive | 0.777 | 0.135 | 0.519 | 1.000 |
| Intensive | 0.860 | 0.116 | 0.624 | 1.000 |
| TGR | ||||
| Extensive | 0.950 | 0.049 | 0.806 | 1.000 |
| Intensive | 0.962 | 0.066 | 0.650 | 1.000 |
| Efficient (TE (VRS) ≥ 0.9) | Inefficient (TE (VRS) < 0.9) | Significance 1 | |||
|---|---|---|---|---|---|
| Mean | S.E. 2 | Mean | S.E. 2 | ||
| Technical efficiency (TE (VRS) | 0.985 | 0.00 | 0.738 | 0.01 | *** |
| Scale efficiency (SE) | 0.930 | 0.02 | 0.870 | 0.02 | * |
| UAA (ha) | 103.6 | 15.7 | 65.24 | 5.48 | * |
| Average cows per farm | 41 | 5.62 | 21 | 2.08 | ** |
| Milk yield (kg per dairy cow) | 5730 | 0.20 | 4716 | 0.14 | *** |
| UAA productivity (milk t/ha) | 2.35 | 0.15 | 1.49 | 0.08 | *** |
| Livestock density (LU/UAA) | 0.58 | 0.03 | 0.50 | 0.02 | * |
| Share of home-grown feed | 0.84 | 0.01 | 0.85 | 0.01 | ns |
| Share of dairy cows in total LU | 0.72 | 0.02 | 0.67 | 0.02 | * |
| Capital Assets per UAA (EUR) | 2420 | 211.8 | 1753 | 107.3 | ** |
| Number of LU per AWU | 22.1 | 2.11 | 15.2 | 1.08 | ** |
| Share of hired labor in total labor | 0.21 | 0.04 | 0.16 | 0.03 | ns |
| Interm. consumption per LU (EUR) | 1162 | 46.8 | 1047 | 41.7 | ns |
| Ratio of dairy output to total farm output | 0.61 | 0.01 | 0.51 | 0.01 | *** |
| Efficient (TE (VRS) ≥ 0.9) | Inefficient (TE (VRS) < 0.9) | Significance | |||
|---|---|---|---|---|---|
| Mean | S.E. | Mean | S.E. | ||
| Technical efficiency (TE (VRS) | 0.9775 | 0.01 | 0.8049 | 0.01 | *** |
| Scale efficiency (SE) | 0.9538 | 0.01 | 0.9462 | 0.01 | ns |
| UAA (ha) | 171.6 | 28.0 | 148.08 | 13.4 | ns |
| Average cows per farm | 111.2 | 19.7 | 80.49 | 7.0 | ns |
| Milk yield (kg per dairy cow) | 6733 | 0.28 | 5660 | 0.13 | ** |
| UAA productivity (milk t/ha) | 4.25 | 0.24 | 3.27 | 0.14 | ** |
| Livestock density (LU/UAA) | 0.93 | 0.04 | 0.92 | 0.04 | ns |
| Share of home-grown feed | 0.55 | 0.02 | 0.60 | 0.01 | ns |
| Share of dairy cows in total LU | 0.69 | 0.01 | 0.64 | 0.01 | * |
| Capital Assets per UAA (EUR) | 2692 | 235 | 2730 | 145 | ns |
| Number of LU per AWU | 33.2 | 3.42 | 32.1 | 1.84 | ns |
| Share of hired labor in total labor | 0.47 | 0.05 | 0.50 | 0.04 | ns |
| Interm. consumption per LU (EUR) | 1192 | 57.9 | 1080 | 31.6 | ns |
| Ratio of dairy output to total farm output | 0.70 | 0.01 | 0.65 | 0.01 | * |
Disclaimer/Publisher’s Note: The statements, opinions and data contained in all publications are solely those of the individual author(s) and contributor(s) and not of MDPI and/or the editor(s). MDPI and/or the editor(s) disclaim responsibility for any injury to people or property resulting from any ideas, methods, instructions or products referred to in the content. |
© 2025 by the authors. Licensee MDPI, Basel, Switzerland. This article is an open access article distributed under the terms and conditions of the Creative Commons Attribution (CC BY) license (https://creativecommons.org/licenses/by/4.0/).
Share and Cite
Savickienė, R.; Namiotko, V.; Galnaitytė, A. Evaluating the Technical Efficiency of Dairy Farms Under Technological Heterogeneity: Evidence from Lithuania. Agriculture 2025, 15, 1469. https://doi.org/10.3390/agriculture15141469
Savickienė R, Namiotko V, Galnaitytė A. Evaluating the Technical Efficiency of Dairy Farms Under Technological Heterogeneity: Evidence from Lithuania. Agriculture. 2025; 15(14):1469. https://doi.org/10.3390/agriculture15141469
Chicago/Turabian StyleSavickienė, Rūta, Virginia Namiotko, and Aistė Galnaitytė. 2025. "Evaluating the Technical Efficiency of Dairy Farms Under Technological Heterogeneity: Evidence from Lithuania" Agriculture 15, no. 14: 1469. https://doi.org/10.3390/agriculture15141469
APA StyleSavickienė, R., Namiotko, V., & Galnaitytė, A. (2025). Evaluating the Technical Efficiency of Dairy Farms Under Technological Heterogeneity: Evidence from Lithuania. Agriculture, 15(14), 1469. https://doi.org/10.3390/agriculture15141469