Article

Does the Improvement of Farmers’ Digital Literacy Restrain Their Opportunistic Behavior When They Choose Pest Control Methods in Certified Agro-Products?

1
College of Economics and Management, Northwest A&F University, Yangling 712100, China
2
College of Finance and Economics, Gansu Agricultural University, Lanzhou 730070, China
*
Author to whom correspondence should be addressed.
Agriculture 2025, 15(14), 1466; https://doi.org/10.3390/agriculture15141466
Submission received: 26 May 2025 / Revised: 1 July 2025 / Accepted: 4 July 2025 / Published: 8 July 2025
(This article belongs to the Section Agricultural Economics, Policies and Rural Management)

Abstract

Information asymmetry leads to farmers’ opportunistic behavior of disobeying pest control regulations in certified vegetable areas, but the improvement of farmers’ digital literacy has become an important means to break through the constrained dilemma of pest control information and change farmers’ pest control behaviors. Based on survey data from certified vegetable areas of Shaanxi, Gansu, and Ningxia provinces in China, this study used Heckman two-stage model to analyze the impact of the improvement of farmers’ digital literacy on opportunistic behavior in pest control. The results are as follows. Firstly, the improvement of farmers’ digital literacy can restrain their opportunistic behavior in pest control. Secondly, the improvement of farmers’ digital literacy restrain their opportunistic behavior through three paths, namely, enhancing the awareness of obeying pest control regulations for certified vegetables, reducing the cost and risk of pest control in obeying the certification standards. Thirdly, the traceable certification label plays a positive moderating role in the process of improving digital literacy to restrain farmers’ opportunistic behavior. Accordingly, this study suggests strengthening the training of farmers’ digital literacy, promoting the digitalized traceability system for certified vegetables, establishing examination mechanisms for online pesticide purchases and logistics distribution, and imposing severe penalties for opportunistic behaviors.

1. Introduction

Ensuring the quality and safety of agricultural products and managing pesticide residues have become a global issue, especially in developing countries where the “Large Nation with Small-Scale Farmers” pattern prevails. In such contexts, promoting the standardized use of pesticides and managing farmers’ pest control behavior remain critical challenges. China is the world’ s largest vegetable producer, accounting for 55.17% of global production. Currently, there are four types of certified vegetables in China: organic-certified, green-certified, geographical-indication-certified and qualified products. Different types of certified vegetables are subject to distinct pest control standards. As the first person who is responsible for ensuring the quality and safety of vegetables, do farmers actually regulate the use of pesticides according to the corresponding certification standards in the pest control in certified vegetable areas? The answer is not quite satisfactory. For instance, in the 2018 “Mystery of Organic Vegetables” incident exposed by CCTV’s Focus Interview, vegetables labeled with “organic marks” in supermarkets were found to contain residues of multiple banned pesticides. Similarly, in 2020, the Market Supervision Administration of Dongguan, Guangdong, detected residues of banned pesticides such as chlorpyrifos, omethoate, and carbofuran in four batches of vegetables labeled as qualified during sampling inspections. Furthermore, the Bulletin on Food Safety Sampling Inspections during the 2025 Spring Festival (Issue 4) released by the Shaanxi Provincial Market Supervision Administration showed that several retail stores selling green vegetables through Meituan online platforms were found to have excessive residues of abamectin, acetamiprid, and clothianidin. According to statistics, the overall exceedance rate of pesticide residues in major agricultural products in China is 2%, while the exceedance rate of pesticide residues for vegetable is 5.09%, which is much higher than that in other crops [1,2,3]. Due to information asymmetry, inadequate quality control and traceability systems, in order to pursue short-term profit maximization, farmers have opportunistic behaviors such as using banned pesticides, overapplying pesticides, and disobeying pesticide safety intervals [4,5]. These opportunistic behaviors have led to a series of problems, including frequent agricultural product quality and safety incidents, agricultural non-point source pollution, and prominent contradiction between supply and demand of high-quality agricultural products [6,7,8]. However, ‘The No.1 Central Document’ issued by the Chinese government in 2025 continues to emphasize strengthening the governance of the quality and pesticide residues of agricultural products. Therefore, it is of great practical significance to explore how to restrain farmers’ opportunistic behavior in pest control in certified vegetable production areas in China, which is important for improving the quality and safety of vegetables, reducing agricultural pollution, and promoting consumers’ health level.
In the rural area in China, where information is relatively occluded, farmers face the dual constraints of information access and resource utilization in the process of making decisions on pest control [9,10]. Since it is more difficult for farmers to understand and acquire new technologies of pest control timely, the information-constrained dilemma of pest control may lead to opportunistic behavior. However, with the popularization of the Internet in rural China, the improvement of farmers’ digital literacy can break through the dilemma of information asymmetry in pest control [11], helping farmers to use digital tools to obtain pest control methods conveniently. This can improve farmers’ knowledge of pest control standards for certified vegetables. Therefore, this study explored whether the improvement of digital literacy can restrain farmers’ opportunistic behavior of disobeying pest control regulations in certified vegetable production areas, which is of great significance in enhancing the quality of certified vegetables and contributing to the high-quality development of agriculture.
Currently, the research on farmers’ opportunistic behavior mainly includes the following two aspects: on the one hand, it is about the generating motivation of opportunistic behavior. The problem of agricultural product quality and safety is rooted in the speculative behavior of farmers triggered by information asymmetry [12], while the difference in market prices and the limited supply and demand of high-quality products provide room for speculation [13]. At the same time, factors such as imperfect regulatory mechanism, high cost of testing, and unstable market environment exacerbate opportunistic behavior [14,15]. On the other hand, it is about the governance of opportunistic behavior. Studies have shown that embedding traceable labels, increasing the supervision efforts and enhancing consumers’ awareness of safeguarding rights can reduce the opportunistic behavior [16]. Producer membership, production standardization, unified marketing, and the lower cost of random sampling inspection of residues can regulate the opportunistic behavior of producers of green-certified and geographical-indication-certified products [17,18,19]. In addition, adding informal rules (e.g., trust reciprocity, reputation incentives, psychological contracts, organizational commitment) in the ‘farmer-supermarket co-operative’ model can restrain farmers’ opportunistic behavior [20]. Adopting measures such as supervision of operators, ex-post rewards and penalties, and pricing mechanism can constrain opportunistic behaviors of cooperatives members [21]. A transparent and safe digital traceability system can prevent ‘the free-rider problem’ in the construction of regional public brands for agricultural products [22]. However, a review of the literature reveals that existing research on farmers’ opportunistic behavior has primarily focused on: (1) the regulation of opportunistic behavior in geographical-indication-agricultural products or genetically modified agricultural products [13,16]; (2) the governance of farmers’ opportunistic behavior under the ‘farmer-supermarket co-operative’ model [14]; (3) the governance of opportunistic behavior among members of specialized farmer cooperatives [19,21]; and (4) the governance of ‘the free-rider problem’ in the construction of regional public brands for agricultural products [22]. But research on the governance of farmers’ opportunistic behavior in pest control in certified vegetable production areas remains scarce. In addition, with the rapid development of China’s rural digital economy in recent years, some scholars have explored the relationship between ‘digital’ and ‘green production by farmers’. Studies have shown that the use of the Internet can help farmers to adopt the technology of straw returning to the field [23]. New media such as short video apps can enhance the probability of adopting pest control technologies for farmers [24]. And the promotion of digital technology can reduce the use of fertilizers [25]. However, the application of digital technology requires farmers to have a certain level of digital literacy. The higher the level of digital literacy, the stronger their ability to use digital technology [26,27]. Studies have shown that increased digital literacy can promote the use of organic fertilizer and reduce the use of chemical pesticides by farmers [28,29]. In contrast, current research on the governance of opportunistic behaviors of farmers mainly focuses on reducing regulatory and detection costs, increasing penalties, employing intermediary organizations to perform delegated tasks, and embedding informal rules (e.g., trust reciprocity, reputation incentives, and psychological contracts) [11,15], but there is a lack of ‘digital literacy’ perspective to explore how to inhibit farmers’ opportunistic behavior in pest control. Therefore, this study investigates the effect of digital literacy on farmers’ opportunistic behavior in pest control in certified vegetable areas. This not only fills the current research gap on farmers’ opportunistic behavior in pest control but also provides new research perspectives for governing farmers’ opportunistic behavior in pest control in certified vegetable areas. It is also worth noting that most current studies on the indicators of the evaluation index system of digital literacy regarding the production behavior of farmers have defects such as broad settings and lack of targeting. This has resulted in the evaluation index system failing to assess the research object scientifically and objectively.
Therefore, this study used the survey data from 644 farmers in certified vegetable production areas of Shaanxi, Gansu, and Ningxia provinces, constructed a comprehensive evaluation index system of farmers’ digital literacy from four dimensions: digital technology utilization literacy, digital information acquisition literacy, digital social communication literacy and digital resource utilization literacy. Next, it assesses the influence about the improvement of farmers’ digital literacy on opportunistic behavior in pest control in certified vegetable production areas. Compared with the previous studies, the marginal contributions of this study are as follows.
First, in terms of the research contents, this study explores the problem of opportunistic behavior in pest control among farmers in certified vegetable areas. This not only complements the inadequacies of the research on opportunistic behavior of farmers’ disobeying pest control regulations but also provides a decision-making references for the governance of opportunistic behavior.
Second, in terms of the research perspectives, in the context of the global digital economy, the perspective of ‘digital literacy’ explores how to restrain farmers’ opportunistic behavior of disobeying pest control regulations. It can provide a new perspective for reducing opportunistic behavior in pest control of farmers in certified vegetable areas.
Third, in the construction of the indicator system, based on the Global Digital Literacy Framework issued by UNESCO, this study takes the reality of the development of China’s rural areas into account to construct an evaluation index system of farmers’ digital literacy regarding pest control. This not only makes up for the defects about the digital literacy evaluation index system mentioned above in most studies but also helps to broaden the existing research ideas in the field of the assessment of farmers’ digital literacy.
The rest of this article is structured as follows. Section 2 presents the concept definition and analysis of the theoretical mechanisms. Section 3 elaborates upon the data samples, the variable selection and the econometric models. Section 4 conducts the empirical testing. Section 5 conducts the discussion. Finally, Section 6 summarizes the conclusions and puts forward policy recommendations.

2. Concept Definition and Analysis of the Theoretical Mechanisms

2.1. Concept Definition

2.1.1. Digital Literacy

The concept of digital literacy was first proposed by Israeli scholar Yoram Eshet-Alkalai. UNESCO considers digital literacy as the ability to acquire, understand, integrate, manage, communicate, evaluate, and create information appropriately through digital technologies [30,31]. In this study, farmers’ digital literacy in pest control is defined as a comprehensive ability to access, learn, communicate, and use information related to certified vegetables—such as scientific pesticide application methods, green pest control technologies, market dynamics of certified vegetables, and quality regulation policies—using digital devices (e.g., smartphones, computers) during pest control.

2.1.2. Farmers’ Opportunistic Behavior in Pest Control

Due to information asymmetry and unsound quality control-traceability mechanisms, farmers in certified vegetable production areas are still engaged in opportunistic behavior in pest control. Despite being aware of relevant certification standards, they pursue short-term profit maximization by using banned pesticides under certification standards, using pesticides in a single dose that exceeds the permitted amount for the corresponding type of certified vegetables, and failing to observe the safety intervals for pesticides specified for the corresponding type of certified vegetables [4,5].

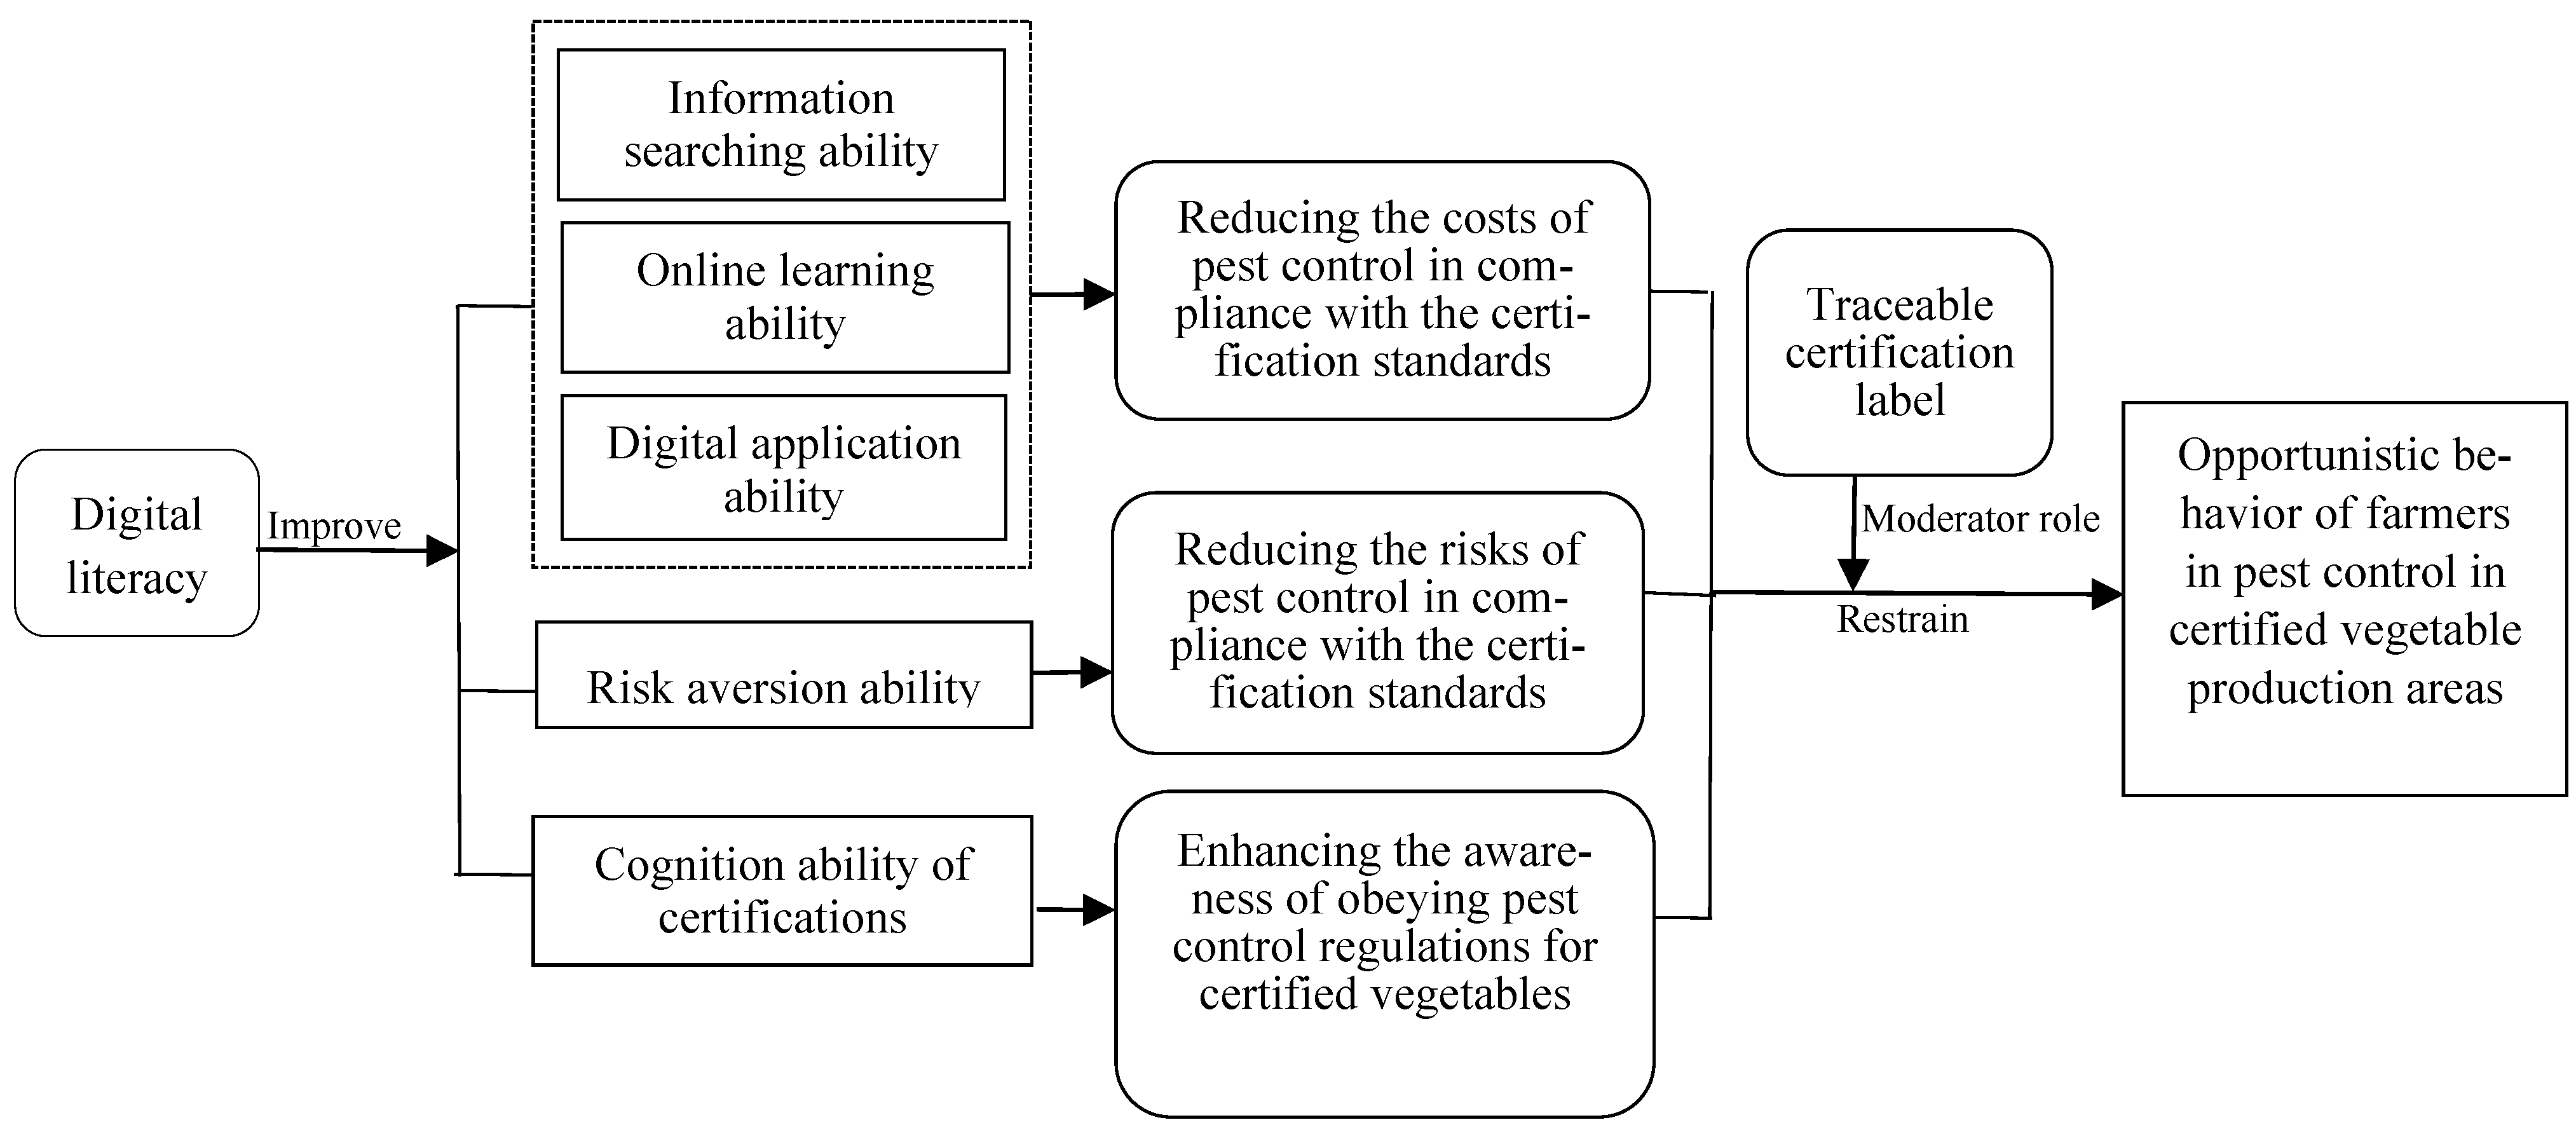
2.2. Analysis of the Theoretical Mechanisms

According to the information searching theory and the theory of farmers’ behavior, farmers’ decision in pest control in certified vegetable production areas is mainly constrained by the factors like their own control ability, the costs of pest control and the certification regulatory penalties [32]. In recent years, with the development of China’s rural digital economy, farmers with a certain level of digital literacy can use digital tools to obtain pest control methods and advice that meet the certified standards conveniently in a low-cost and efficient manner. On the one hand, this breaks through the constrained dilemma of pest control information, which can improve farmers’ knowledge of pest control for certified vegetables and help to obey the certification standards, thus reducing their opportunistic behaviors of blindly and excessively apply pesticides caused by information asymmetry. On the other hand, due to limited rationality and risk aversion of farmers, whether it is possible to reduce the costs and risks of pest control plays a key role in adjusting behavioral decisions [33]. Farmers use the digital tools to search and learn new pest control technologies, which reduces the searching costs and the risks of using new technologies due to asymmetric information [34]. This helps to reduce opportunistic behavior in pest control. Therefore, the improvement of farmers’ digital literacy can break the information asymmetry in pest control and improve their pest control ability, which promotes obeying pest control regulations among farmers in certified vegetable production areas. Based on the above discussion, this study proposes the following hypotheses.
H1. 
Increased digital literacy helps to restrain opportunistic behavior of farmers in pest control in certified vegetable production areas.
Based on the above analysis, the influence mechanism of digital literacy restraining opportunistic behavior in pest control of farmers in certified-vegetable areas is described in the following aspects.
(1)
The pest control costs aspect of obeying the certification standards
Firstly, farmers can search for pest control information about certified-vegetable through digital tools conveniently [35], which can reduce the cost of searching and obtaining pest control information for farmers. Secondly, with the help of visual applications such as short video APPs or vegetable planting promotion APPs, farmers can learn new pest control technologies in an effective way that complies with their certified vegetable areas. This can reduce the costs of learning pest control techniques for farmers to obey the certification standards. Thirdly, the short video APP can be used to repeatedly push out information related to pest control standards, regulatory system for certified vegetables, and premium for quality agricultural products. This can guide farmers to comply with the certification standards, so that farmers can obtain the normal income from vegetable sales and at the same time reduce opportunistic costs such as fines imposed by the regulatory authorities, rejection of vegetables, and damage to their own reputation due to substandard sampling of vegetables. Therefore, increased digital literacy of farmers reduces the pest control costs for farmers to comply with the certification standards, which helps to restrain their opportunistic behavior in pest control in certified vegetable areas. Based on the above discussion, this study proposes the following hypotheses.
H1-a. 
Improved digital literacy restrain opportunistic behavior in pest control of farmers by reducing the cost of pest control in obeying the certification standards.
(2)
The pest control risk aspects of obeying the certification standards
Under the circumstance of asymmetric information, farmers who blindly adopt new pest control technologies or change the amount of pesticides used may be exposed to the risk of uncertain net income and the risk of improper technology application, which may lead to fluctuations of output and revenue or cause excessive pesticide residues [34]. However, applications such as short video apps or vegetable planting promotion APPs have the advantages of high degree of visualization and simple operation. These applications can demonstrate the new pest control technology or scientific pesticides process in more detail and specify methods through network entity or live broadcasting, making it easier for farmers to receive, remember and understand the new pest control technology. Thus, improving the level of digital literacy of farmers helps to break down the information barrier, reduces the risk of adopting new pest control technologies and avoid the risk of the uncertainty of farmers’ income. This can encourage farmers to apply new pest control technologies or the amount of pesticide used precisely, thus suppressing farmers’ opportunistic behavior in pest control in certified vegetable areas. Based on the above discussion, this study proposes the following hypotheses.
H1-b. 
Improved digital literacy restrain opportunistic behavior in pest control of farmers by reducing the risk of pest control in obeying the certification standards.
(3)
The awareness of obeying pest control regulations for certified vegetables
Firstly, the Chinese government uses digital platforms such as WeChat, short video APPs or vegetable planting promotion APPs to push out the pest control standards for different types of certified vegetables and information of scientific pest control to farmers in a high-frequency and multi-dimensional manner, so that farmers can subconsciously carry out the pest control in accordance with the certification standards [36]. Secondly, the digital platforms can reversely track farmers’ needs and repeatedly popularize the pest control information about their certified-vegetable types. This can deepen farmers’ familiarity with pest control standards and methods for certified vegetables [37]. Therefore, the improvement of farmers’ digital literacy helps to enhance the awareness of farmers of obeying the regulations, which can guide them to comply with the standards for the use of pesticides. Ultimately, opportunistic behavior in pest control can be reduced. Based on the above discussion, this study proposes the following hypotheses.
H1-c. 
Improved digital literacy restrain opportunistic behavior in pest control of farmers by enhancing their awareness of obeying pest control regulations in certified vegetables.
In addition, although the improvement of farmers’ digital literacy can help to restrain opportunistic behavior of farmers in pest control in certified vegetable areas, it can only induce ethical farmers to obey pest control regulations of certification standards. However, unethical farmers may still choose opportunistic behaviors in this process. Thus, it is also necessary to employ market supervision, use the traceable certification label technology to enhance the level of digital supervision, to achieve the quality of certified-vegetable can be traced [38], in order to increase the risk cost and penalty cost of irregular use pesticide by farmers who do not comply with certification standards [39], which can force farmers to rationally choose pest control behaviors that comply with certification standards. Therefore, in the digital literacy improvement to restrain the opportunistic behavior in pest control of farmers in certified-vegetable areas, it is also necessary to embed traceable certification labels to achieve the traceability of the quality of certified vegetables, which can completely restrain the farmers’ opportunistic behavior in pest control from the root. Based on the above discussion, this study proposes the following hypotheses.
H2. 
Traceable certification label plays a positive moderator role in the process of improving digital literacy to restrain the farmers’ opportunistic behavior in pest control in certified vegetable areas.
In summary, the logical framework of improved digital literacy to restrain farmers’ opportunistic behavior in pest control in certified vegetable areas is shown in Figure 1.

3. Materials and Methods

3.1. Data Sources

The data used in this study were obtained from a questionnaire survey conducted by the research team from June to July 2024 among growers of certified vegetable production areas in Gansu, Shaanxi, and Ningxia provinces in China. The survey regions is shown in Figure 2. The reasons for the selection of the survey regions are based on the following considerations. Firstly, Shaanxi, Gansu and Ningxia provinces are representative advantageous production areas for vegetable cultivation in China’s arid zones. There are many certified vegetable bases in these areas, and the types of certifications are diverse. However, the rates of excessive pesticide residues in vegetables in this three provinces are higher than the overall rate nationwide [40]. Secondly, the 2023 Research Report on the Digital Development of Rural Areas in China shows that compared with the eastern and central regions, the western region lags relatively behind in the development of digital villages, where should be the main focus of future digital village construction. Therefore, this study selects the farmers of certified vegetable areas in these three provinces as the survey subjects, which holds important research value.
In order to ensure the accuracy and scientificity of the questionnaire design, the research team looked for information on the vegetable cultivation area in Shaanxi, Gansu and Ningxia provinces, the types of vegetable certifications, the pest control standards for each type of certified vegetables (e.g., the list of banned pesticides for different types of certified vegetables, the pesticide dosage permitted for different types of certified vegetables for a single dosage, and the safety intervals for different types of certified vegetables, etc.) for the design of the survey questionnaire. After the survey questionnaire design was completed, the research team invited six vegetable cultivation experts to check the survey questionnaire content and suggest modifications. After improving the questionnaire based on expert opinions, the research team selected 32 farmer households from two typical certified vegetable areas in Shaanxi Province for field pre-survey in January 2024. The survey questionnaire was revised and refined according to the pre-survey results, leading to the final version.
In the formal survey, a multi-stage process was employed to select sample groups for investigation. In the initial stage, the survey sample areas in the three provinces of Shaanxi, Gansu, and Ningxia in China were chosen based on the following three criteria: First, the scale of the survey areas in each province was determined according to the ratio of certified vegetable planting area in Gansu, Shaanxi, and Ningxia. Second, the specific survey areas selected in the three provinces belonged to the national “Green Pest Control Demonstration Counties,” “Unified Prevention and Control Pilot Counties,” or typical certified vegetable production bases in each province. Third, certified vegetable production was the main cash crop for local farmers, with income from certified vegetable planting accounting for more than 80% of households’ total income. Based on these three criteria, 62 counties met the requirements for inclusion in the survey area. It uses systematic sampling. Firstly, according to the ratio of certified vegetable planting area in Gansu, Shaanxi, and Ningxia (1:0.78:0.31), a total of 5 cities were selected: 2 cities in Gansu (Tianshui and Lanzhou), 2 cities in Shaanxi (Baoji and Xianyang), and 1 city in Ningxia (Guyuan). Secondly, counties under the jurisdiction of 5 cities were selected from the 62 counties, and counties under the jurisdiction of 5 cities were ranked and re-screened according to the area of certified vegetable cultivation and types of certified vegetables. Finally, 6 counties were chosen: 3 counties in Gansu (Gangu, Wushan, and Yuzhong), 2 counties in Shaanxi (Jingyang and Taibai), and 1 county in Ningxia (Guyuan). During the second stage of sample group selection, sample size was determined as the number of secondary units (farmer) in the ith primary unit (county) by the following criteria:
n i j = [ u α v 1 A ] 2
In Equation (1), u α represents a critical value that corresponds to a 95% confidence level; ν represents the estimated coefficient of variation, which did not exceed 0.4; and A represents the range of estimated error, which did not exceed 10%. This determination yielded a minimum acceptable sample size of 62 secondary units (farmer) in each primary unit (county). When we increased the confidence level to 99%, the minimum number of secondary units (farmer) in each primary unit (county) was 106.
n = 1.96 × 0.4 0.1 2 62 , n = 2.58 × 0.4 0.1 2 106
Assuming that 5% of the sample data will be missing, it determined a final sample size of 112 secondary units (farmer) in each primary unit (county), with a total sample size of 672. It used the combination of multi-stage sampling and random sampling in the field research. Two townships were randomly selected from each county, and two sample villages within certified vegetable area were randomly selected from each township. Then, 28 certified vegetable growers were randomly selected from each sample village in the certified vegetable production area, and one-on-one and face-to-face questionnaires were conducted. A total of 672 questionnaires were distributed in this survey. After removing questionnaires with missing or abnormal data, 644 valid questionnaires were obtained, yielding a response rate of 95.83%.

3.2. Descriptive Statistics

In the field study involving 644 farmer samples, 344 households (53.42%) used pesticides prohibited by certification standards in their certified area (organic-certified, green-certified, qualified and geographical-indication-certified products). Additionally, 250 households (38.82%) applied pesticide dosages exceeding the recommended single-use amount specified on the product label. Furthermore, 201 households (31.21%) did not comply with the safe use intervals during the pesticide application, 182 households (28.26%) applied pesticides more frequently than permitted under safe-use regulations. Only 147 households (22.83%) complied with the pesticide use standards in certified vegetable area. Further analysis revealed that 8.70% of farmers (56 households) exhibited all four types of opportunistic behaviors; 16.46% (106 households) and 15.99% (103 households) displayed 2 or 3 types, respectively; and 36.02% (232 households) exhibited one type. However, only 22.83% of farmers (147 households) demonstrated no opportunistic behavior in the pest control process. These findings indicate that the majority of farmers in certified vegetable areas exhibit varying degrees of opportunistic behavior in the process of pest control (as shown in Table 1).

3.3. Variables

3.3.1. Dependent Variable: Opportunistic Behavior in Pest Control

Based on the field survey, the opportunistic behavior of farmers’ disobeying pest control regulations in certified vegetable production areas was measured from four dimensions: a. Whether farmers used banned pesticides by certified standards in their certified areas; b. Whether the single application dosage of pesticides exceeded the recommended amount by certified standards in their certified areas; c. Whether pesticide applications failed to comply with the safety intervals specified in the certification standards; d. Whether the frequency of pesticide applications exceeded the safe-use limits set by certification standards in their certified areas. Each of these four types of opportunistic behaviors was coded as a binary variable (0 for no opportunistic behavior and 1 for opportunistic behavior). A farmer was considered to exhibit opportunistic behavior if they engaged in any one of the above actions. The degree of such opportunistic behavior was quantified by summing up the number of different types of opportunistic behavior that farmers displayed during pest control. In other words, it refers to the sum of the types of the above-mentioned four opportunistic behaviors actually committed by farmers during pest control, which is an ordered discrete variable taking values of 0, 1, 2, 3, or 4.
To identify the four types of farmers’ opportunistic behaviors in pest control in certified vegetable areas, the research team adopted the following methods:
(1)
Method for identifying Whether farmers used banned pesticides by certified standards in their certified areas: In the questionnaire, all pesticide names permitted and prohibited for different certified product types were listed without explicit notes indicating “permitted” or “prohibited”. During the survey, respondents were asked to circle or verbally report the pesticides they had used in the previous year. After the survey, researchers cross-checked each respondent’s answers against the specific certification standards of their area to determine whether prohibited pesticides were used.
(2)
Method for identifying whether the single application dosage of pesticides exceeded the recommended amount by certified standards in their certified areas: In the questionnaire, a question was set up: “For each pesticide you circled, what proportion of the dilution concentration specified in the pesticide instruction manual do you typically use?”. The options were as follows: 1—Within 10% below the standard; 2—Within 20% below the standard; 3—30% or more below the standard; 4—Strictly according to the manual; 5—Within 10% above the standard; 6—Within 20% above the standard; 7—30% above the standard. The researcher identified whether the single dosage of each pesticide exceeded the standard dosage for the corresponding type of certified vegetables as specified in the pesticide instructions, based on the presence of the three options ‘5, 6, and 7’ in the choices selected by the interviewed farmers.
(3)
Method for identifying whether pesticide applications failed to comply with the safety intervals specified in the certification standards: Two questions were included in the questionnaire: a. “For each pesticide you circled, what is the usual interval (in days) between pesticide applications?”; b. “How many days before vegetable harvesting was the last pesticide application?”. At the end of the study the researcher looked at the safety intervals specified in the instructions for each pesticide for the corresponding type of certified vegetables and the number of days before harvest when application was prohibited to identify whether the pesticide applications of the interviewed farmers did not comply with the safety intervals specified in the certification standards.
(4)
Method for identifying whether the frequency of pesticide applications exceeded the safe-use limits set by certification standards in their certified areas: In the questionnaire, a question was set up: “For each pesticide you circled, how many times was it applied per crop cycle for the vegetables?”. At the end of the study, the researcher identified whether the number of pesticide applications by the interviewed farmers exceeded the number of safe use limitations in the certification standards according to the number of times each pesticide specification was limited to each crop of the corresponding type of certified vegetables.

3.3.2. Core Explanatory Variable: Digital Literacy

In order to scientifically measure this core explanatory variable, based on the Global Digital Literacy Framework issued by UNESCO, this study took the realities of development in rural China into account to scientifically measure this core explanatory variable and drawing on the experiences [27,29,41], a comprehensive evaluation index system of digital literacy containing four dimensions was constructed.
(1)
Digital technology utilization literacy: reflects farmers’ basic capabilities to operate digital devices.
(2)
Digital information acquisition literacy: reflects farmers’ ability to proactively search for and discover pest control information using digital tools.
(3)
Digital social communication literacy: reflects farmers’ ability to exchange and share pest control knowledge and experiences through digital tools.
(4)
Digital resource utilization literacy: reflects farmers’ ability to obtain or purchase pest control related materials and services through digital platforms.
The initial design included a total of 12 measurement items. To ensure the scientific validity and applicability of the survey questionnaire, the research team conducted a field pre-survey in January 2024 among 32 farmer households from two typical certified vegetable production areas in Shaanxi Province. Based on feedback from the pre-survey (some farmers reported difficulties in understanding items or low operability), the team improved the questionnaire by removing items with ambiguous wording or practical implementation issues, ultimately retaining 8 representative and operable core items (as shown in Table 2). All these items were measured using a Likert Scale for scoring.
To construct a comprehensive digital literacy index, this study employed Exploratory Factor Analysis (EFA) to analyze the above-mentioned 8 items. The main reason for choosing EFA lies in its suitability for exploring the latent structure behind observed variables. The analysis process followed these steps:
(1)
Principal Axis Factoring (PAF) was used to extract common factors, as it focuses on explaining the shared variance among variables.
(2)
The number of factors was determined based on eigenvalues greater than 1 (Kaiser-Guttman criterion), resulting in the extraction of 4 common factors, which aligned closely with the four predefined dimensions of the study.
(3)
Factor rotation was performed using the maximum variance method (Varimax) to make the factor loading structure clearer and easier to interpret.
(4)
The cumulative variance contribution ratio reached 72.72%, indicating that the four extracted factors were able to explain most of the variance in the original variables (>60% is usually considered to have a good explanatory power), thus meeting the requirements. The scores of each factor were calculated, and the weight of the variance contribution ratio of each factor to the cumulative variance contribution ratio (72.72%) was used as weights, which were weighted to obtain an index of the composite level of digital literacy of each farmer.
The validity tests of the Exploratory Factor Analysis (EFA) results in this study indicate the following:
(1)
KMO was 0.806 (>0.7), suggesting strong inter-item correlations and suitability for factor analysis.
(2)
Bartlett’s Test of Sphericity was significant at the 1% level (p < 0.001), rejecting the null hypothesis of variable independence and confirming the applicability of factor analysis.
(3)
Reliability Test: The overall Cronbach’s α coefficient for the scale was 0.809 (>0.8), and all sub-dimensions exceeded 0.800 (see Table 2), indicating good internal consistency and measurement reliability.
(4)
Convergent validity test: the standardized factor loadings of all measurement items on the factors to which they belonged were greater than 0.6 (see Table 2 for the specific loadings), indicating that the items could effectively reflect their corresponding underlying dimensions, and the convergent validity of the scale was good. The four factors extracted by the EFA were highly compatible with the four dimensions presented by the study.
To further validate the four-dimensional factor structure derived from theoretical assumptions and EFA results, this study employed Confirmatory Factor Analysis (CFA). The CFA specified a four-factor model with each item constrained to its theoretically predefined dimension. Results indicated excellent model fit: χ2/df = 2.15 (<3), CFI = 0.948 (>0.90), TLI = 0.932 (>0.90), RMSEA = 0.049 (<0.08), SRMR = 0.037 (<0.08). The standardized loadings of all question items on their corresponding factors were significant (p < 0.001) and greater than 0.6 (range: 0.61 to 0.89). The CFA results fully support the validity of the four-dimensional structure of digital literacy, confirming the theoretical presuppositions and the robustness of the EFA results.
Based on the factor structure validated by CFA, this study weighted the four factor scores using the proportion of each factor’s variance contribution rate to the cumulative variance contribution rate (72.72%) as the weight and finally calculated the “Composite Digital Literacy Index” for each farmer.
In summary, the comprehensive evaluation index system and composite index of digital literacy constructed in this study meet scientific requirements in terms of theoretical foundation, content coverage, measurement methods (joint validation by EFA and CFA), and statistical verification, and can effectively measure farmers’ digital literacy level in pest control.

3.3.3. Control Variables

To prevent interference from other potential confounding factors in the regression results, this study drew on existing research [25], and selected the following variables as control variables from four dimensions: farmers’ individual characteristics (age, education level, and participation in cooperatives), farmers’ household characteristics (the number of agricultural laborers, the ratio of agricultural income to total household income), cultivation characteristics (the scale of certified-vegetable cultivation, the number of cultivation years, and the severity of pest infestations in vegetable plots), external environmental characteristics (the number of village-established WeChat groups, the number of village logistics outlets, internet coverage rate, and subsidies for green pest control and pesticide residue sampling frequency).

3.3.4. Mechanism Variables

To examine the influence mechanism by which digital literacy affects farmers’ opportunistic behavior in pest control in certified vegetable production areas, this study selected three mechanism variables. They are ‘reducing the cost of pest control in obeying the certification standards’, ‘reducing the risk of pest control in obeying the certification standards’, and ‘enhancing the awareness of obeying pest control regulations for certified vegetables’. In addition, it selected ‘Traceable certification label’ as a moderator variable to characterize the level of digital supervision of the quality of certified products.
The definitions, assignments and descriptive statistics of the various variables mentioned above are shown in Table 3.

3.4. Empirical Model Construction

3.4.1. Heckman Two-Stage Model

Farmers’ opportunistic behavior in pest control in certified vegetable areas can be divided into two stages: Whether there is opportunistic behavior of farmers’ disobeying pest control regulation (i.e., behavior decision) and the degree of their opportunistic behavior in pest control (i.e., degree of behavior). Additionally, considering the potential issue of self-selection bias in farmers’ opportunistic behavior decisions, the Heckman Two-Stage Model was used to estimate the effect of digital literacy on farmers’ opportunistic behavior and its degree in pest control. The advantage of adopting this model lies in correcting the selection bias by introducing the Inverse Mills Ratio (IMR), thereby obtaining a consistent estimator. The first stage involves the selection equation, which addresses whether farmers exhibit opportunistic behavior in pest control in certified vegetable areas. Given that the dependent variable is a binary variable (0 for no opportunistic behavior and 1 for opportunistic behavior), we apply the Probit model for estimation:
p r o b j ( c h o i c e = 1 ) = ϕ β 0 + i = 1 n β i χ i j
In Equation (2), choice = 1 represents the presence of farmers’ opportunistic behavior in the pest control. Choice = 0 represents that there is no opportunistic behavior in the pest control. X i j represents the specific influencing factor of farmers’ digital literacy in the control variables. ϕ is the cumulative normal distribution function. i represents the independent variable. j represents the farmer.
After calculating the probability of opportunistic behavior during pest control for each sampled farmer through the Probit model, a correction factor was subsequently constructed.
λ = φ β 0 + i = 1 n β i χ i j / 1 ϕ β 0 + i = 1 n β i χ i j
In Equation (3), ϕ is the inverse Mills ratio, where φ and ϕ denote the probability density function and cumulative distribution function of the standard normal distribution, respectively.
The second stage is the outcome equation, focusing on the degree of farmers’ opportunistic behavior in pest control in certified vegetable areas. The inverse Mills Lambda (λ) ratio estimated in the first stage was incorporated into the second-stage regression equation as an additional explanatory variable. The equation is specified as follows:
y = α 0 + i = 2 n α i χ i j + ω λ + ε j
In Equation (4), y represents the degree of opportunistic behavior in pest control. λ is the Inverse Mills Ratio. X i j represents the specific influencing factor. α 0 is the regression constant term. α i and w are parameters to be estimated. ε j is the random error term.
Identification strategy: To satisfy model identifiability, at least one variable must affect only the selection equation (whether opportunistic behavior exists) without directly influencing the outcome equation (the degree of opportunistic behavior). Therefore, this study selects “Wi-Fi installation status” as the exclusion restriction variable. Installing Wi-Fi in farmers’ homes may reduce the cost of accessing pest control information for farmers, thereby decreasing opportunistic behavior choices caused by information asymmetry, but it does not directly alter farmers’ decisions on the degree of opportunistic behavior.

3.4.2. Mechanism Validation Model

To further clarify the mechanism through which digital literacy influences the farmers’ opportunistic behavior in pest control in certified vegetable production areas, this study used a mediation effect model to test the mediating mechanisms. The model is specified as follows:
Y = c X + e 1
M = a X + e 2
Y = c X + b M + e 3
In Equations (5)–(7), M in obeying the certification standards’, ‘reducing the risk of pest control in obeying the certification standards’ and ‘enhancing the awareness of obeying pest control regulations for certified vegetables’. c represents the total effect of digital literacy on the opportunistic behavior of farmers in pest control. a represents the effect of digital literacy on M . After controlling for the effect of digital literacy, b characterizes the effect of M on framers’ opportunistic behavior in pest control. c characterizes the direct effect of digital literacy on farmers’ opportunistic behavior in pest control after controlling for the effect of M . e 1 , e 2 , and e 3 are random error terms.

4. Results

4.1. Benchmark Regression Results Analysis

To empirically test the effect of digital literacy on farmers’ opportunistic behavior in pest control in certified vegetable areas, regression analyses were conducted using the Heckman two-stage model. The benchmark regression results presented in column (1) of Table 4 show that the inverse Mills lambda (λ) is significant at the 1% level. This finding indicates the presence of sample selectivity bias, thereby validating the necessity of employing the Heckman two-stage model for analysis. The Wald chi2 statistic is significant at the 1% level, indicating good overall model fit and validating the applicability of the Heckman two-stage model.
The benchmark regression results indicate that digital literacy has a statistically significant and negative effect at the 1% level on both farmers’ opportunistic behavior and its degree in pest control in certified vegetable areas. This indicates that farmers with higher digital literacy are better able to accurately acquire pest control methods and recommendations through digital tools. This can improve farmers’ knowledge and skills of pest control, thus promoting compliance with certification standards to obey pest control. In addition, the digital platforms can reversely track farmers’ needs and repeatedly popularize the pest control standards and methods for certified vegetables, which can guide farmers to comply with certification standards, regulate pesticide use, and thereby help restrain opportunistic behavior and its degree in pest control among farmers in certified vegetable production areas. Therefore, hypothesis H1 is validated. This finding strongly supports the predictions of information search theory and the theory of farmers’ behavior [32]. Improving digital literacy essentially empowers farmers to break through the barriers of information asymmetry. Through digital platforms such as WeChat, short video APPs or vegetable planting promotion APPs, farmers can access scientific pest control methods, green pest control technology information, and the latest regulatory policies that comply with the certification standards more conveniently and at lower costs. This not only directly reduces the cost of searching for and obtaining compliant pest control information, but also the visual and user-friendly digital learning methods (such as video demonstrations) significantly lower the threshold and perceived risks for farmers to try and apply new control technologies. More importantly, it improves farmers’ cognitive level and in-depth understanding of certification standards, making them more aware of the risks of opportunistic behavior and the value of compliant operations during the pest control process. Thus, the core of how digital literacy improvement inhibits farmers’ opportunistic behavior in pest control lies in its systematic mitigation of information asymmetry—the fundamental cause. This enables farmers to engage in low-cost, low-risk, and efficient learning of scientific pest control methods that comply with the certification standards, thereby prompting them to shift from opportunistic behavior to standardized pest control behavior.
The estimation results for the other variables are reported below.
(1)
In terms of farmers’ individual characteristics, farmers’ age has a statistically significant and positives effect on both opportunistic behavior and its degree in pest control. However, both education level and participation in cooperatives show statistically significant and negative effect on these outcomes. The survey found that 18.48% of the farmers never read the pesticide instructions or the label information on pesticide packages during application due to their age and illiteracy and they just usually apply pesticides based on their personal experience. The aging and low education level of the farmers further aggravated the opportunistic behavior and its degree. Conversely, the more educated a farmer is, the more careful he is in the purchasing, proportioning and applying of pesticides, and the lower the likelihood and degree of his opportunistic behavior. In addition, cooperatives can encourage farmers who have joined them to use pesticides in compliance with certification standards by formulating unified pest control standards, purchasing pest control materials, providing pest control technique training and publicity, and imposing penalties for non-compliance. These measures can restrain the occurrence and degree of farmers’ opportunistic behavior.
(2)
In terms of farmers’ household characteristics, both the number of agricultural laborers and the ratio of agricultural income to total household income have a statistically significant and negative effect on farmers’ opportunistic behavior and its degree. The reason for this is that the greater the number of agricultural laborers in the household, the more adequate the personnel used for pest control, and the greater the probability that the farmer will adopt green control technologies, thus leading to less frequent use of pesticides. In addition, the higher the ratio of agricultural income to total household income, the more dependent the household is on agricultural production. Farmers are more inclined to comply with certification standards for the use of pesticides, aiming to avoid or reduce the production risks to obtain stable agricultural income.
(3)
In terms of cultivation characteristics, the scale of certified-vegetable cultivation has a statistically significant and negative effect on farmers’ opportunistic behavior and its degree. The reason for this is that the larger the area of certified vegetable cultivation, the greater the farmers’ awareness of risk prevention. Meanwhile, they have a greater need to uphold their favorable reputation in the market. At this time, farmers will be more cautious when making decisions in purchasing and applying pesticides. They will be more inclined to adopt scientific and standard green control measures in pest control to ensure the quality of vegetables, which will help to reduce the farmers’ opportunistic behavior and its degree. However, the severity of pest infestations in vegetable plots has a statistically significant and positive effect on farmers’ opportunistic behavior and its degree. The reason for this is that when vegetable pests become severe, farmers strive to mitigate yield losses caused by pest infestations. In a rush to address the issue, farmers may excessively use pesticides, apply pesticides prohibited by certification standards, or adopt other control measures. Such severe pest pressure weakens their awareness of obeying pest control regulation in certified vegetables and intensifies the opportunistic behavior and its degree.
(4)
In terms of external environmental characteristics, the internet coverage rate, subsidies for green pest control, and pesticide residue sampling frequency all have a statistically significant and negative effect on farmers’ opportunistic behavior and its degree. Possible reasons for this are as follows: Firstly, with the expansion of Internet coverage in rural China, farmers have been able to easily acquire information on pest control and improve their ability to use pesticides scientifically, which effectively reduces opportunistic behavior and its degree. Secondly, the government distributes green pest control materials, such as sticky boards and biological pesticides, free of charge to farmers through subsidies. This measure can reduce both the quantity of chemical pesticides used and the frequency of application, thereby reducing the farmers’ opportunistic behavior and its degree. Finally, pesticide residue sampling of vegetables by the government or cooperatives increases the risk cost of farmers’ non-compliant use of pesticides. This measure can compel farmers to comply with the vegetable certification standards, thereby reducing farmers’ opportunistic behavior and its degree. However, the number of logistics outlets in a village has a significantly positive effect on farmers’ opportunistic behavior and its degree in pest control. The current widespread presence of rural logistics outlets has complicated and difficulted the regulation of the pesticide market. The convenience of online shopping and the lack of regulation of logistics and delivery have resulted in the fact that some farmers can easily access to restricted pesticides in different types of certified vegetables, which has provided room for speculative behavior by farmers. The study found that 82.63% of the restricted pesticides used by farmers were purchased online. In addition, as an identification variable, Wi-Fi installation status significantly has a negative impact on the dependent variable in the choice equation. This suggests that when farmers have Wi-Fi installed at home, they can more easily acquire pest control information, which helps to reduce farmers’ opportunistic behavior in pest control.

4.2. Endogeneity Test

In the previous analysis, although the Heckman two-stage model solved the problem of selection bias due to sample self-selection, potential endogeneity problems may still persist. One is the problem of reverse causality. Farmers who exhibit no or minimal opportunistic behavior in pest control may be exposed to more digital information in pest control and have higher digital literacy, thereby creating an endogeneity problem caused by reverse causality. Second is the problem of omitted variables. Since it is difficult for the model to control all the factors affecting the farmers’ opportunistic behavior in pest control, the model may be prone to endogeneity problems arising from omitted variables. For these reasons, ‘The amount of your family average per year spent on communications’ was selected as an instrumental variable, and the instrumental variable method was further employed to address the endogeneity issue in the econometric model.
In this study, the benchmark model underwent Endogeneity test using the IV-Probit model and the IV Ordered Probit model, respectively. The test results are shown in Table 5. The results of the first stage regression showed that ‘The amount of your family average per year spent on communications’ had a significant and positive effect on ‘Digital literacy’ at the 1% level, and the F-value exceeded 10. This indicates that there is no problem with a weak instrumental variable. The results of the second stage regression of the IV-Probit Model (with opportunistic behavior in pest control as the dependent variable) and the IV Ordered Probit Model (with degree of opportunistic behavior in pest control as the dependent variable) showed that both the signs of the coefficients for digital literacy and their significance level of were consistent with those of the baseline regression. This implies that after addressing the endogeneity issue through the instrumental variable method, digital literacy still exerts a statistically significant negative impact on farmers’ opportunistic behavior and its degree in pest control, further validating Hypothesis H1.

4.3. Robustness Test

4.3.1. Sample Robustness Test

Compared with their younger counterparts, older farmers generally have relatively weaker capabilities in using digital tools and also lack the subjective motivation to accept digital information. Therefore, the pest control behavior of older farmers has a weak association with digital literacy. According to the World Health Organization (WHO) definition of older adults, younger elderly individuals aged 60–74 are still considered to have some learning and activity capabilities. Thus, farmer samples aged 74 and above were excluded, and the empirical test was conducted again. The regression results in column (2) of Table 4 indicate that digital literacy has a statistically significant and negative effect on farmers’ opportunistic behavior and its degree in pest control. Thus, the benchmark regression results are robust.

4.3.2. Replacement of Core Explanatory Variable

In order to avoid bias in the selection of core explanatory variables, ‘Digital literacy’ was measured by ‘The importance of Internet use for farmers to learn the knowledge of pest control’ to test the robustness of the baseline regression results. The estimation results in column (3) of Table 4 show that the importance of Internet use for farmers to learn the knowledge of pest control has a significantly negative effect on both farmers’ opportunistic behavior and its degree in pest control. Thus, the robustness of the benchmark regression results can be further confirmed.

4.3.3. Replacement of Estimated Model

Given that farmers’ opportunistic behavior and its degree in pest control are dichotomous and ordered discrete variables, respectively, the robustness of the estimation results of the Heckman two-stage model was further validated using the Logit model and the ordered Logit model. The regression results in column (4) of Table 4 show that the signs and significance levels of the coefficients from the Logit model and the ordered Logit model are largely consistent with those of the Heckman two-stage model. This further confirms the reliability of the benchmark regression results.

4.4. Mechanism Test

Based on the results of the previous empirical analyses, this study further explores the mechanisms through which improved digital literacy influences farmers’ opportunistic behavior and its degree in pest control in certified vegetable production areas. Therefore, this study applied the mediation effect model to test the mediating roles through three pathways: reducing the cost of pest control in obeying the certification standards; reducing the risk of pest control in obeying the certification standards; enhancing the awareness of obeying pest control regulations for certified vegetables. The results are shown in Table 6. In addition, in order to test the robustness of the results obtained from the mediation effect model, this study draw on existing research [42], it further applied the Bootstrap method (with 1000 resampling iterations) and the Sobel test to validate the mediation effects. The results are still shown in Table 6.
The estimation results indicate that digital literacy restrains farmers’ opportunistic behavior and its degree in pest control in certified vegetable production areas through three pathways: reducing the cost of pest control in obeying the certification standards, reducing the risk of pest control in obeying the certification standards, and enhancing the awareness of obeying pest control regulations for certified vegetables.
(1)
In terms of reducing the cost of pest control in obeying the certification standards. Improved digital literacy helps farmers use digital tools to search for pest control methods or technologies that are in obeying the pest control standards in their certified areas. This reduces the costs of searching for and learning pest control methods, promotes farmers’ compliance with the certification standards, and thereby reduces their opportunistic behavior and its degree in pest control. The mediation effect results were all significant at the 1% level, thus validating hypothesis H1-a.
(2)
In terms of reducing the risk of pest control in obeying the certification standards. Improved digital literacy makes it easier for farmers to understand and master new pest control technologies or scientifically applied pesticides methods promoted online. This can reduce the risks of adopting pest control technologies and the uncertainty of income, thus reducing farmers’ opportunistic behavior and its degree in pest control. The mediation effect results were all significant at the 1% level, thus validating hypothesis H1-b.
(3)
In terms of enhancing the awareness of obeying pest control regulations for certified vegetables. When farmers use digital tools to access pest control information, increased digital literacy helps them better recognize the ecological harms of opportunistic behavior, and the benefits of complying with the certification standards. This can improve farmers’ awareness of obeying pest control regulations for certified vegetables, thereby reducing their opportunistic behavior and its degree. The mediation effect results were all significant at the 1% level, thus validating hypothesis H1-c.
Thus, the core of the inhibitory effect of digital literacy improvement on farmers’ opportunistic behavior in pest control lies in its systematic mitigation of information asymmetry—the fundamental cause—and it reshapes farmers’ decision-making environment and behavioral motivation through three interrelated pathways: enhancing the awareness of obeying pest control regulations for certified vegetables, reducing the cost and risk of pest control in obeying the certification standards. Although the mechanism test results clearly reveal the micro-level pathways through which digital literacy exerts its influence, these three pathways are not entirely independent but rather interrelated and mutually reinforcing. First, the enhancement of awareness (H1-c) serves as the foundation. Farmers’ clearer understanding of certification standards, consequences of non-compliance (such as rejection and fines for excessive pesticide residues), and the advantages of scientific pest control methods acts as the starting point driving them to consider behavioral change. The precision and repetition of digital information push effectively reinforce this cognition. Second, cost reduction (H1-a) provides feasibility. Convenient information access and learning methods significantly reduce the material and time costs of searching for compliant pest control information and learning new prevention technologies, making it easier to implement pest control in accordance with certification standards. Finally, risk reduction (H1-b) enhances confidence. Online learning and sharing of successful online cases effectively alleviate farmers’ anxiety about potential yield losses or uncertain returns from adopting new technologies, lowering the psychological threshold and practical failure risks of trying new methods. This strengthens farmers’ willingness to translate cognition into action. Taken together, digital literacy “points the direction” (Why) by enhancing awareness and “paves the way” (How) by reducing costs and risks, collectively contributing to the transformation of farmers’ pest control behaviors.

4.5. Moderating Effects Test

The estimation results are presented in Table 7. The estimation results in columns (1) and (2) show that the interaction term ‘Digital literacy × Traceable certification label’ is significantly negative at the 5% and 1% significance levels, respectively. This suggests that traceable certification label plays a positive moderating role in the effect of digital literacy in restraining farmers’ opportunistic behavior and its degree in pest control. In other words, when the quality traceability for certified vegetables is implemented through traceable certification label technology, digital literacy becomes more effective in reducing farmers’ opportunistic behavior and its degree. The reason for this is that increased digital literacy among farmers mitigates information asymmetry in pest control. This can reduce the costs and risks of pest control for obeying the certification standards and enhance the awareness of green pest control, which will motivate ethical farmers to adopt green control practices. Meanwhile, traceable certification labels increase the risk costs and penalty costs for unethical farmers engaging in irregular use pesticide. Therefore, to improve farmers’ digital literacy in restraining their opportunistic behavior in pest control in certified vegetable areas, it is also necessary to embed traceable certification labels to achieve quality traceability of certified vegetables. This would strengthen the digital supervision of certified vegetable quality, thereby effectively restraining the root causes of farmers’ opportunistic behavior in pest control, thus validating hypothesis H2.
The underlying reason behind this finding is the positive moderating effect of traceable certification labels, which profoundly reveals the importance of the synergistic effect between digital supervision and the improvement of farmers’ digital literacy. The improvement of digital literacy alone mainly operates at the level of “self-discipline,” guiding “virtuous” farmers to regulate their behaviors through internal motivation. However, for “non-virtuous” farmers, internal motivation may be insufficient. The embedding of traceable labels can significantly strengthen the “external constraints” on farmers’ opportunistic behavior. This places farmers’ production processes under digital supervision, greatly increasing the likelihood and cost of non-compliant behaviors being detected, traced, and punished. This significant increase in external risks (punishment risks) complements the reduction in internal risks (technology adoption risks) brought about by improved digital literacy. More importantly, enhanced digital literacy enables farmers to better understand and perceive the external risks posed by the traceability system. They can use digital channels to learn about the operation of the traceability system, the stringency of random inspections, and penalty cases (which is directly linked to the pathway in H1-c). Thus, the moderating effect can be understood as: digital literacy amplifies the reception efficiency and depth of understanding of the deterrence signals represented by traceable labels, making the “teeth” of external supervision sharper and more effective. This is not merely simply about “stricter supervision,” but rather that farmers, due to improved digital literacy, more acutely perceive and attach importance to regulatory risks.

5. Discussion

The existing literature primarily focuses on the regulation of opportunistic behavior among producers of geographical indication agricultural products or suppliers of genetically modified agricultural products [13,16], the governance of opportunistic behavior among farmers under the ‘Direct Farm–to-Supermarket Supply’ model [14], the mitigation of ‘free-riding behavior’ among cooperative members [19,21], and the management of ‘free-rider problem’ in the development of regional public brands for agricultural products [22]. However, little attention has been paid to the governance of opportunistic behavior in pest control among farmers within certified production bases. This study addresses this gap by examining farmers in certified vegetable areas and uncovering the role of digital literacy in shaping their decision-making regarding pest control practices.
Previous studies have shown that improvements in farmers’ digital literacy can promote the reduction in chemical pesticide use and increase both the willingness and extent of organic fertilizer adoption [11,28]. Consistent with these findings, this study finds that enhanced digital literacy also contributes to restraining opportunistic behavior in pest control among vegetable farmers in certified vegetable areas. Moreover, this study reveals the underlying mechanism through which improved digital literacy suppresses opportunistic behavior. Specifically, it systematically alleviates the fundamental cause—information asymmetry—and reshapes farmers’ decision-making environment and behavioral motivations through three interrelated pathways: enhancing the awareness of obeying pest control regulations for certified vegetables, reducing the cost and risk of pest control in obeying the certification standards. The practical significance of this mechanism is evident in real-world cases observed during fieldwork. For example, some farmers used digital tools (e.g., Baidu search engines, short video apps, or vegetable cultivation promotion apps) to access lists of approved and prohibited pesticides for certified vegetables, thereby avoiding misuse of banned pesticides due to information gaps. Others learned green pest control techniques (e.g., the use of sticky traps and insect lures) through short video platforms, significantly reducing both the quantity and frequency of chemical pesticide application. Additionally, some farmers utilized e-commerce platforms like Taobao and Kuaishou to purchase compliant pest control inputs, including biopesticides and sticky boards, thereby lowering the threshold for accessing compliant pest control inputs. These practices vividly illustrate how digital literacy empowers farmers to overcome information constraints in pest control, guiding their behavior toward greater compliance and sustainability.
It is worth noting that the improving farmers’ digital literacy also needs to be alerted to potential challenges. On one hand, the digital divide may exacerbate behavioral disparities among farmers. This study observes that older and less-educated farmers have significantly lower digital literacy scores than those of younger counterparts (42.72% lower on average), and their incidence of opportunistic behavior in pest control is 31.55% higher. If policies focus solely on providing digital tools without corresponding efforts to build farmers’ digital capacities, they may inadvertently marginalize vulnerable groups. On the other hand, concerns about overreliance and information risk also arise. The fragmented nature and uneven quality of digital information present new challenges. For instance, if farmers become overly dependent on unverified online sources (e.g., unverified pest control ‘remedies’ from informal online sources), they may experience control failures, which could ironically lead to excessive chemical pesticide use or the spread of misinformation. These findings highlight the need to enhance the credibility of official digital platforms and to establish robust mechanisms for information verification and quality control.
The governance of opportunistic behavior in pest control among farmers in certified vegetable areas is not only a matter of regulatory compliance but is also closely tied to farmers’ long-term economic interests. Farmers with higher levels of digital literacy who adhere to standardized pest control practices are more likely to meet stringent market access requirements and benefit from the price premiums associated with certified products. Moreover, reducing the overuse of chemical pesticides contributes to soil health and improves the quality of agricultural produce, thereby enhancing farmers’ long-term sustainability and profitability. Therefore, improving digital literacy should be regarded not merely as a behavioral intervention, but also as a critical strategy for strengthening the resilience and market competitiveness of smallholder farming systems.
Based on the Chinese context, this study finds that improvements in farmers’ digital literacy can effectively restrain opportunistic behavior in pest control among in certified vegetable areas. This finding offers important reference value not only for the governance of such behaviors in China but also for the promotion of regulated pesticide use and pest management among smallholder farmers in developing countries characterized by the ‘large country, smallholder’ structure. However, the applicability of these findings must be carefully considered in light of cross-country differences. China has benefited from a high level of rural internet coverage (99.2%), which provides a strong foundation for digital literacy interventions. In contrast, rural areas in many developing countries such as Southeast Asia and Africa face significantly weaker digital infrastructure (the global average internet coverage in rural areas at approximately 35%), making the digital divide even more pronounced. In these regions, policy priorities may need to shift toward the promotion of low-threshold tools such as SMS-based agricultural reminder, radio broadcasts, and lectures as transitional strategies to bridge the digital gap and gradually improve farmers’ digital literacy.

6. Conclusions and Policy Recommendations

This study investigates the impact of improved digital literacy on farmers’ opportunistic behavior in pest control in certified vegetable production areas, based on survey data from 644 farmers in the provinces of Shaanxi, Gansu, and Ningxia, China. The main conclusions are as follows.
Firstly, the improvement of farmers’ digital literacy helps to restrain their opportunistic behavior in pest control in certified vegetable area, and it has a statistically significant and negative correlation with the degree of farmers’ opportunistic behavior. Meanwhile, the aging of farmers, low educational level, random online purchase of pesticides, and lack of supervision in logistics and distribution exacerbate farmers’ opportunistic behavior and its degree in pest control. However, farmers’ participation in cooperatives, access to green pest control subsidies, and increased frequency of pesticide residue sampling can reduce farmers’ opportunistic behavior and its degree.
Secondly, the improvement of farmers’ digital literacy restrain their opportunistic behavior and its degree in pest control through three paths: reducing the cost of pest control in obeying the certification standards, reducing the risk of pest control in obeying the certification standards, and enhancing the awareness of obeying pest control regulations for certified vegetables.
Thirdly, the traceable certification label plays a moderating role in the process of digital literacy restraining farmers’ opportunistic behavior and its degree in pest control in certified vegetable areas. In other words, when increasing digital literacy to restrain farmers’ opportunistic behavior in pest control, it is also necessary to embed traceable certification labels to achieve the traceability of the quality of certified vegetables, thereby completely restraining opportunistic behavior in pest control at its root.
Based on the above conclusions, this study yields several policy recommendations:
First, recognizing that improving farmers’ digital literacy helps restrain farmers’ opportunistic behavior in pest control in certified vegetable areas. Therefore, the Chinese government needs to adopt a two-pronged approach: improving agricultural digital infrastructure and expanding Internet coverage, while also strengthening farmers’ basic education level and digital literacy training. Particular emphasis should be placed on improving the digital literacy of older, less educated farmers. In addition, to tackle the “pain points” and “bottlenecks” in pest control, digital tools such as short video apps can be utilized to encourage agricultural technicians and pesticide sellers to promote and publicize pest control regulations, standards, methods, and their benefits in certified vegetable production areas through live streaming and other means. It is also essential to establish a dedicated channel for farmers to ask questions and seek solutions, thereby breaking down information barriers. This approach can enable farmers to master green pest control technologies at low cost and high efficiency, thereby reducing the risks of pest control and guiding them to obey certification standards and standardize pesticide use.
Secondly, the study reveals that traceable certification label plays a moderating role in the process by which digital literacy restrains farmers’ opportunistic behavior and its degree in pest control in certified vegetable production areas. Therefore, it is necessary to promote the implementation of a digital traceability system for certified vegetables and continuously improve the traceable certification label system. Meanwhile, this study found that increasing the frequency of pesticide residue sampling can reduce farmers’ opportunistic behavior and its degree. Thus, the government should increase the frequency of pesticide residue sampling and impose severe penalties on farmers engaging in opportunistic behavior during pest control. Additionally, the study found that 82.63% of the restricted pesticides used by farmers were purchased online. The convenience of online shopping and the lack of regulation in logistics and delivery have enabled some farmers to easily acquire restricted pesticides for various certified vegetable types, thereby creating opportunities for farmers’ speculative behavior. Therefore, the Chinese government should improve the online pesticide audit and tracking system, strictly supervise online pesticide purchases and logistics distribution, and severely penalize the illegal sale or purchase of banned pesticides, thereby restraining opportunistic behavior in pest control in certified vegetable production areas.
Thirdly, the study found that farmers’ participation in cooperatives and access to green pest control subsidies can reduce farmers’ opportunistic behavior and its degree in pest control in certified vegetable areas. Therefore, the Chinese government should increase subsidies for green pest control materials such as sticky boards and biological pesticides in order to reduce the costs of green pest control for farmers. At the same time, the farmers should be encouraged to actively participate in cooperatives. Meanwhile, cooperatives should formulate unified pest control standards based on the type of certified vegetables, provide members with unified pest control services, strengthen supervision over members’ production processes, and thereby enforce farmers’ compliance with the pest control certification standards.
This study has certain limitations. Firstly, it exclusively selected the arid-zone vegetable production regions of Shaanxi, Gansu, and Ningxia—the most representative areas in China—as the survey sites. Although these regions possess a certain degree of representativeness, the generalizability of the research findings across the entire country still requires further verification through more extensive sampling. Therefore, future research will expand the survey area nationwide to enhance the generalizability of the conclusions. Secondly, key variables in this study (e.g., farmers’ opportunistic behavior in pest control and digital literacy) are primarily based on farmers’ self-reports and enumerators’ identification derived from farmer responses. These may be subject to social desirability bias or recall bias, leading to potential measurement error. To address this limitation, future research will incorporate field observations or utilize objective data sources such as rapid pesticide residue testing devices, to enable cross-validation and improve data accuracy. Thirdly, although the research design attempts to control for confounding factors, the use of cross-sectional data remains a limitation in rigorously establishing a causal relationship between digital literacy and opportunistic behavior. To strengthen causal inference, future studies will consider adopting longitudinal tracking surveys or quasi-experimental designs. Finally, this study does not explore in depth the relationship between digital traceability systems for certified vegetables and farmers’ opportunistic behavior in pest control. Future research will aim to investigate this relationship to better understand the role of traceability technologies in shaping farmer behavior.

Author Contributions

Conceptualization, methodology, software, formal analysis, investigation, resources, and data curation, writing—original draft preparation, X.C.; methodology, software, funding acquisition, J.Y.; investigation, Z.F.; writing—review and editing, visualization, supervision, Y.W. All authors have read and agreed to the published version of the manuscript.

Funding

This research was funded by the Soft Science Special Project of Gansu Basic Research Plan under Grant (Grant No.24JRZA116), the Gansu Provincial Department of Education College Teachers’ Innovation Fund Project (Grant No.2024B-074), and the Shaanxi Province Social Science Special Project (Grant No.2025YB0371).

Institutional Review Board Statement

Not applicable.

Informed Consent Statement

Informed consent was obtained from all subjects involved in the study.

Data Availability Statement

Data will be made available on request.

Conflicts of Interest

The authors declare no conflicts of interest.

References

  1. Zeng, J.; Qiao, X.W. A brief analysis of pesticide residues exceeding maximum residue limits in vegetables and fruits in China. Chin. J. Pestic. Sci. 2023, 25, 1206–1221. [Google Scholar]
  2. Wang, Y.; Wang, Y.; Zhu, Y. What could encourage farmers to choose non-chemical pest management? Evidence from apple growers on the Loess Plateau of China. Crop Prot. 2018, 114, 53–59. [Google Scholar] [CrossRef]
  3. Zhu, W.F.; Li, T.P. Study on the status of vegetable pesticide residues in China based on literature data. Econ. Probl. 2018, 11, 92–98. [Google Scholar]
  4. Jiang, J. The Research on the Occurrence and Prevention of Pesticide-Use Moral Hazard: Based on the Survey of Vegetable Farmers. Ph.D. Thesis, Shenyang Agricultural University, Shenyang, China, 2020. [Google Scholar]
  5. Yang, M.; Zhao, X.; Meng, T. What are the driving factors of pesticide overuse in vegetable production? Evidence from Chinese farmers. China Agric. Econ. Rev. 2019, 11, 672–687. [Google Scholar] [CrossRef]
  6. Garming, H.; Waibel, H. Pesticides and farmer health in Nicaragua: A willingness-to-pay approach to evaluation. Eur. J. Health Econ. 2009, 10, 125–133. [Google Scholar] [CrossRef]
  7. Mahmood, I.; Imadi, S.R.; Shazadi, K.; Gul, A.; Hakeem, K.R. Effects of pesticides on environment. In Plant, Soil and Microbes; Springer: Berlin/Heidelberg, Germany, 2016; Volume 10, pp. 253–269. [Google Scholar]
  8. Han, H.; Zou, K.; Yuan, Z. Impact of specialized agricultural services on climate-smart agricultural practices: Evidence from biopesticide application in Jiangsu Province, China. Environ. Impact Assess. Rev. 2024, 105, 107430. [Google Scholar] [CrossRef]
  9. Bai, Q.; Chen, H.; Zhou, J.; Li, G.; Zang, D.; Sow, Y.; Shen, Q. Digital literacy and farmers’ entrepreneurial behavior—Empirical analysis based on CHFS2019 micro data. PLoS ONE 2023, 18, e0288245. [Google Scholar] [CrossRef]
  10. Mao, H.; Liu, S.W.; Peng, P.; Yang, Z.Y. Digital extension and farmers’ fertilizer reduction: An empirical analysis of China’s major apple producing areas in Shaanxi Province. Chin. Rural Econ. 2023, 2, 66–84. [Google Scholar]
  11. Zhang, P.; Li, X.H.; Wu, Y. Impact of farmers’ digital literacy on pesticide reduction and their mechanism. China Soft Sci. 2024, 2, 64–73. [Google Scholar]
  12. Van der Merwe, M.; Kirsten, J.F.; Trienekens, J.H. Information sharing as a safeguard against the opportunistic behavior of South African Karoo Lamb farmers. Agric. Econ. 2017, 48, 101–111. [Google Scholar] [CrossRef]
  13. Hang, B.K.; Geng, X.H. A study on the governance of opportunistic behavior of geographical indications agricultural producers: Based on the perspective of collective action. Econ. Manag. 2022, 36, 19–26. [Google Scholar]
  14. Chen, J.B.; Zhang, J.; Xia, P.; Zhang, Y.Y.; Sun, Q.Q. Study on farmer’s psychological contract, organizational commitment and opportunistic behavior under the ‘farmer-supermarket direct-purchase’ model. Issues Agric. Econ. 2018, 12, 128–139. [Google Scholar]
  15. Zantsi, S.; Mulanda, S.; Hlakanyane, L. Small-scale agriculture, land reform, and government support in South Africa: Identifying moral hazard, opportunistic behaviour, and adverse selection. Int. J. Afr. Renaiss. Stud.-Multi-Inter-Transdiscipl. 2021, 16, 119–144. [Google Scholar] [CrossRef]
  16. Zhao, L. Genetically Modified Agricultural Products Suppliers’ Opportunism Behaviors Regulation: Based on Labeling Policy, Pricing Strategy and Credit Decision. Ph.D. Thesis, Shanghai Jiao Tong University, Shanghai, China, 2020. [Google Scholar]
  17. Zhou, R.H.; Zhang, M.L. Analysis of opportunistic management of farmers in green food production. Rural Econ. 2013, 1, 119–122. [Google Scholar]
  18. Priyanath, H.M.S.; Jayasinghe, D.J.S.; Premaratne, S.P. Effects of relational norms on mitigating opportunism: A case of smallholding vegetable farmers in Sri Lanka. Int. J. Bus. Manag. Invent. 2016, 5, 8–18. [Google Scholar]
  19. Hernández-Espallardo, M.; Arcas-Lario, N.; Sánchez-Navarro, J.L.; Marcos-Matás, G. Curbing members’ opportunism in first-tier and federated agricultural marketing cooperatives. Agribusiness 2022, 38, 195–219. [Google Scholar] [CrossRef]
  20. Romero Granja, C.; Wollni, M. Opportunistic behaviour and trust: Experimental results from broccoli farmers in Ecuador. J. Agric. Econ. 2019, 70, 62–80. [Google Scholar] [CrossRef]
  21. Wang, J. Study on the constraint mechanism of farmer specialized cooperative member’s opportunistic behaviorin China. China Rural Surv. 2011, 5, 25–32+95. [Google Scholar]
  22. Dong, Y.G.; Qian, W.W. The free-rider problem in the construction of region public brands of agricultural products: An analysis based on governance study of digital traceability, transparency and assurances systems. China Rural Surv. 2022, 6, 142–162. [Google Scholar]
  23. Li, S.; Sun, S.; Zhang, C. Internet-Based Information Acquisition, Technical Knowledge and Farmers’ Pesticide Use: Evidence from Rice Production in China. Agriculture 2024, 14, 1447. [Google Scholar] [CrossRef]
  24. Yu, X.; Sheng, G.; Sun, D.; He, R. Effect of digital multimedia on the adoption of agricultural green production technology among farmers in Liaoning Province, China. Sci. Rep. 2024, 14, 13092. [Google Scholar] [CrossRef]
  25. Zhang, J.; Xie, S.; Li, X.; Xia, X. Adoption of green production technologies by farmers through traditional and digital agro-technology promotion–An example of physical versus biological control technologies. J. Environ. Manag. 2024, 370, 122813. [Google Scholar] [CrossRef]
  26. Liu, T.; Liao, L. Can farmers’ digital literacy improve income? Empirical evidence from China. PLoS ONE 2024, 19, e0314804. [Google Scholar] [CrossRef] [PubMed]
  27. Bohara, A.; Gurung, Y.B. Digital literacy of rural farmers in western hills of nepal: A case of rishing rural municipality. Asian J. Popul. Sci. 2025, 4, 45–59. [Google Scholar] [CrossRef]
  28. Ma, R.H.; Li, L.P. Study on the impact of digital literacy on the adoption of multi-stage commerclal organic fertiliser by teat farmers. Chin. J. Agric. Resour. Reg. Plan. 2024, 45, 22–36. [Google Scholar]
  29. Chen, W.; Liu, C.; Ma, Z. Impact of digital capabilities on farmers’ pesticide application intensity Analysis based on CRRS microscopic survey data. Chin. J. Eco-Agric. 2025, 32, 1843–1856. [Google Scholar]
  30. Law, N.W.Y.; Woo, D.J.; De la Torre, J.; Wong, K.W.G. A Global Framework of Reference on Digital Literacy Skills for Indicator 4.4.2; UNESCO Institute for Statistics: Montreal, QC, Canada, 2018. [Google Scholar]
  31. Reddy, P.; Sharma, B.; Chaudhary, K. Digital literacy: A review of literature. Int. J. Technoethics 2020, 11, 65–94. [Google Scholar] [CrossRef]
  32. Manski, C.F. Economic analysis of social interactions. J. Econ. Perspect. 2000, 14, 115–136. [Google Scholar] [CrossRef]
  33. Wu, H.; Li, J. Risk preference, interlinked credit and insurance contract and agricultural innovative technology adoption. J. Innov. Knowl. 2023, 8, 100282. [Google Scholar] [CrossRef]
  34. Liu, H.; Chen, Z.; Wen, S.; Zhang, J.; Xian, L.X. Impact of Digital Literacy on Farmers’ Adoption Behaviors of Green Production Technologies. Agriculture 2025, 15, 303. [Google Scholar] [CrossRef]
  35. Mokhtar, W.N.H.W.; Izhar, T.A.T.; Zaini, M.K.; Hussin, N. The importance of digital literacy skills among farmers for sustainable food security. Int. J. Acad. Res. Bus. Soc. Sci. 2022, 12, 235–246. [Google Scholar] [CrossRef] [PubMed]
  36. Lu, S.; Sun, Z.; Huang, M. The impact of digital literacy on farmers’ pro-environmental behavior: An analysis with the Theory of Planned Behavior. Front. Sustain. Food Syst. 2024, 8, 1432184. [Google Scholar] [CrossRef]
  37. Gong, S.; Sun, Z.; Wang, B.; Yu, Z. Could digital literacy contribute to the improvement of green production efficiency in agriculture? Sage Open 2024, 14, 21582440241232789. [Google Scholar] [CrossRef]
  38. Takhar, S.S.; Liyanage, K. Transforming product labels using digital technologies to enable enhanced traceability and management of hazardous chemicals. Int. J. Supply Chain Oper. Resil. 2021, 5, 27–59. [Google Scholar] [CrossRef]
  39. Vinogradova, A.; Kotomenkova, O.; Kotomenkov, D.; Bagryantseva, E.; Snytkova, N. Product traceability as a mechanism for ensuring quality and safety in digital economy. In IOP Conference Series: Materials Science and Engineering; IOP Publishing: Bristol, UK, 2020; Volume 940, p. 012079. [Google Scholar]
  40. Lu, Z.P.; Tian, Y. Current situation and removal methods of pesticide residues in vegetables and fruits in China. Chin. Agric. Sci. Bull. 2022, 38, 131–137. [Google Scholar]
  41. Wang, H.J. Digital literacy and rural household income: The formation of digital inequality. Chin. Rural Econ. 2024, 3, 86–106. [Google Scholar]
  42. Ren, T.C.; Zhang, H.Z.; Yang, X.H.; Yang, R.H. Agricultural insurance security level and farmers’ production investment: Evidence from the survey data of Hubei, Jiangxi, Sichuan and Yunnan Provinces. China Rural Surv. 2021, 5, 128–144. [Google Scholar]
Figure 1. Theoretical mechanism analysis.
Agriculture 15 01466 g001
Figure 2. Map of survey regions.
Agriculture 15 01466 g002
Table 1. The statistics on opportunistic behavior and its degree in pest control among sampled farmers.
Opportunistic Behavior of Farmers’ Disobeying Pest Control RegulationsUsing Banned Pesticides in Certified VegetablesExceeding the Standard Dosage in Single-Time Pesticide ProportioningFailure to Comply with Safety Intervals for Pesticide ApplicationsExceeding the Limit Number of Safe Pesticide Applications
1234123412341234
Province
(Autonomous region)
Shaanxi422080419168317061213359
Gansu108913110812823787211101059
Ningxia024056060400602403012
Total145492671433131906308157132613130
Total (proportion)344 (53.42%)250 (38.82%)201 (31.21%)182 (28.26%)
The degree of opportunistic behavior of farmers’ disobeying pest control regulations01234Total
Province
(Autonomous region)
Shaanxi5866325019225 households
Gansu63115553927299 households
Ningxia2651191410120 households
Total14723210610356644 households
Total (proportion)22.83%36.02%16.46%15.99%8.70%100%
Note: ‘1, 2, 3, 4’ in the table indicate different types of certified vegetable (1 = organic certified, 2 = green certified, 3 = geographical indication certified, 4 = qualified products).
Table 2. Digital literacy indicator system and reliability and validity test.
DimensionMeasurement Items and AssignmentsFactor Loadingα Coefficient
Digital technology utilization literacyWhat is the number of smartphones or computers with Internet access in your household?
(1 = 0; 2 = 1~2; 3 = 3~4; 4 = 5~6; 5 = 7 and above)
0.8430.874
Do you have difficulty in independently using your mobile phone or computer to download applications such as WeChat, Taobao, etc.? (1 = Not at all; 2 = need help; 3 = Basically independent;
4 = Proficient in operation; 5 = Master the operation)
0.640
Digital information acquisition literacyHow many times per year do you search online for pest control standards or methods about certified vegetables?
(1 = 0; 2 = 1~5; 3 = 6~10; 4 = 11~20; 5 = 21 and above)
0.9760.998
How many certified vegetable planting promotion APPs do you usually use? (1 = 0; 2 = 1~3; 3 = 4~6; 4 = 7~9; 5 = 10 and above)0.971
Digital social communication literacyHow many times per year do you usually communicate and share pest control methods about certified vegetables with others online? (1 = 0; 2 = 1~5; 3 = 6~10; 4 = 11~20; 5 = 21 and above)0.8960.800
How many times per year do you usually use APPs such as WeChat and TikTok to take photos, produce videos and post them for sharing? (1 = 0; 2 = 1~3; 3 = 4~6; 4 = 7~9; 5 = 10 and above)0.855
Digital resource utilization literacyHow much per year do you spend in total on pest control supplies (e.g., pesticides, sticky boards, etc.) from the Internet?
(1 = 0; 2 = 1~300; 3 = 301~600; 4 = 601~1000; 5 = 1001 and above)
0.8660.885
How many times per year do you pay for pest control supplies online? (1 = 0; 2 = 1~300; 3 = 301~600; 4 = 601~1000; 5 = 1001 and above)0.611
Table 3. Variable definitions and descriptive statistics.
VariablesDefinition and AssignmentMeanS.D
Opportunistic behavior in pest controlWhether there are opportunistic behavior of farmers’ disobeying pest control regulation in certified vegetable production area: 0 = no, 1 = yes0.7720.420
The degree of opportunistic behavior in pest controlThe sum of the number of types of opportunistic behaviors in pest control: 0, 1, 2, 3, 41.5171.245
Digital literacyFactor analysis0.4850.629
AgeThe age of household production and operation decision makers (year)54.0739.043
Education levelThe education level of household production and operation decision makers: 1 = illiteracy, 2 = primary school, 3 = junior high school, 4 = high school or secondary school, 5 = college and above2.5561.038
Participation in cooperativesWhether the household production and operation decision makers join the cooperatives: 0 = no, 1 = yes0.4910.500
The number of agricultural laborersThe total number of household agricultural laborers (person)2.4411.145
The ratio of agricultural income to total household incomeAgricultural income/total household income (%)0.6040.322
The scale of certified-vegetable cultivationThe cultivated area for certified vegetable (acre)5.8106.998
The number of cultivation yearsThe years of certified vegetable cultivation of household production and operation decision makers (year)20.31711.303
The severity of pest infestations in vegetable plotsThe severity of pest infestations in your vegetable plots: 1 = almost none, 2 = a little, 3 = average, 4 = severe, 5 = very severe3.3341.240
The number of village-established WeChat groupsHow many WeChat groups have been established in your village? (number)1.6380.910
The number of village logistics outletsHow many logistics outlets are there in your village? (number)1.8771.011
Internet coverage rateWhat is the Internet coverage rate in your village? (%)0.9920.024
Subsidies for green pest controlDid your family receive a subsidy for green pest control last year? 0 = no, 1 = yes0.5250.500
Pesticide residue sampling frequencyHow many times in total did the government departments conduct pesticide residue sampling tests on certified vegetables at your base last year? (times/year)1.4131.933
Reducing the cost of pest control in obeying the certification standardsWhether online learning of new green pest control technologies for controlling vegetable pests can reduce the costs? 0 = no, 1 = yes0.6400.480
Reducing the risk of pest control in obeying the certification standardsWhether online learning of new green pest control technologies for controlling vegetable pests can reduce the risks? 0 = no, 1 = yes0.6490.478
Enhancing the awareness of obeying pest control regulations for certified vegetablesWhether online learning of new green pest control technologies for controlling vegetable pests can raise your awareness? 0 = no, 1 = yes0.6750.469
Traceable certification labelCan the certification label trace the information of certified vegetables? 0 = no, 1 = yes0.4360.496
Wi-Fi installation statusHave you installed Wi-Fi in your home? 0 = no, 1 = yes0.7450.436
Table 4. Estimated results of digital literacy affecting farmers’ opportunistic behavior in pest control.
VariablesBenchmark Regression ResultsRobustness Test Results
Heckman Two-Stage Model (1)Sample Robustness Test (2)Replacement of Core Explanatory Variable (3)Replacement of Estimated Model (4)
Opportunistic BehaviorThe Degree of Opportunistic BehaviorOpportunistic BehaviorThe Degree of Opportunistic BehaviorOpportunistic BehaviorThe Degree of Opportunistic BehaviorOpportunistic BehaviorThe Degree of Opportunistic Behavior
Digital literacy−0.570 *** (0.168)0418 *** (0.112)−0.571 *** (0.168)−0.407 *** (0.113)−1.123 *** (0.341)−1.259 *** (0.241)
The importance of Internet use for farmers to learn the knowledge of pest control−0.297 ***
(0.081)
−0.113 ***
(0.026)
Age0.034 *** (0.013)0.008 * (0.004)0.034 *** (0.013)0.009 * (0.005)0.034 *** (0.013)0.007 * (0.004)0.064 *** (0.024)0.025 ** (0.010)
Education level−0.263 ** (0.117)−0.1481 *** (0.040)−0.263 ** (0.117)−0.147 *** (0.040)−0.358 *** (0.122)−0.160 *** (0.039)−0.454 ** (0.219)−0.410 *** (0.096)
Participation in cooperatives−0.707 *** (0.268)−0.497 *** (0.090)−0.707 *** (0.268)−0.496 *** (0.091)−0.609 ** (0.272)−0.465 *** (0.090)−1.214 ** (0.490)−1.333 *** (0.234)
The number of agricultural laborers−0.165 * (0.095)−0.205 *** (0.035)−0.165 * (0.095)−0.202 *** (0.036)−0.163 * (0.097)−0.189 *** (0.035)−0.385 ** (0.182)−0.566 *** (0.091)
The ratio of agricultural income to total household income−1.859 *** (0.440)−0.227 * (0.125)−1.858 *** (0.440)−0.216 * (0.126)−2.132 *** (0.448)−0.240 ** (0.123)−3.290 *** (0.812)−0.760 ** (0.299)
The scale of certified-vegetable cultivation−0.046 *** (0.018)−0.070 *** (0.013)−0.046 *** (0.018)−0.069 *** (0.013)−0.050 *** (0.018)−0.069 *** (0.013)−0.086 *** (0.033)−0.165 *** (0.029)
The number of cultivation years−0.016 (0.010)−0.002 (0.003)−0.016 (0.010)−0.002 (0.003)−0.019 (0.020)−0.002 (0.003)−0.022 (0.019)−0.012 (0.008)
The severity of pest infestations in vegetable plots0.286 *** (0.086)0.146 *** (0.036)0.286 *** (0.086)0.150 *** (0.036)0.323 *** (0.087)0.140 *** (0.036)0.543 *** (0.162)0.418 *** (0.082)
The number of village-established WeChat groups0.142 (0.115)0.024 (0.042)0.142 (0.115)0.024 (0.043)0.109 (0.117)0.015 (0.042)0.287 (0.211)−0.208 (0.199)
The number of village logistics outlets0.668 *** (0.229)0.106 *** (0.037)0.669 *** (0.229)0.104 *** (0.037)0.676 *** (0.234)0.091 ** (0.036)1.267 *** (0.430)0.286 *** (0.089)
Internet coverage rate−20.734 *** (6.778)−7.950 *** (1.401)−20.733 *** (6.778)−7.994 *** (1.405)−18.929 *** (6.860)−7.323 *** (1.392)−39.533 *** (13.173)−25.738 *** (4.908)
Subsidies for green pest control−0.513 ** (0.250)−0.224 *** (0.083)−0.513 ** (0.250)−0.220 *** (0.083)−0.521 ** (0.253)−0.229 *** (0.082)−0.974 ** (0.466)−0.584 *** (0.205)
Pesticide residue sampling frequency−0.166 *** (0.062)−0.074 ** (0.031)−0.166 *** (0.062)−0.074 ** (0.031)−0.199 *** (0.065)−0.076 ** (0.030)−0.325 *** (0.117)−0.289 *** (0.078)
Wi-Fi installation status−0.881 * (0.515)−0.880 * (0.515)−0.899 * (0.482)−1.420 * (0.863)
_cons23.099 *** (6.828)10.205 *** (1.407)23.099 *** (6.827)10.264 *** (1.414)22.552 *** (6.890)10.033 *** (1.383)43.330 *** (13.343)
Mills lambda (λ)0.718 ***0.699 ***0.610 ***
LR/Wald chi2328.87 ***319.17 ***351.45 ***490.70 ***797.78 ***
Notes: *, **, and *** indicate significant at the 10%, 5%, and 1% significance levels, respectively. Standard errors are in parentheses.
Table 5. IV-Probit model and IV Ordered Probit model estimation results.
VariablesThe First StageThe Second Stage
TOpportunistic Behavior in Pest ControlThe Degree of Opportunistic Behavior in Pest Control
Digital literacy−1.774 *** (0.651)−2.256 *** (0.728)
The amount of your family average per year spent on communications0.000 *** (0.000)
Control variableControlControlControl
Sample size644644644
The first stage F-value25.97
Notes: *** indicate significant at the 1% significance levels. Standard errors are in parentheses.
Table 6. Mechanism test results.
Influence
Mechanism
Path ICoefficientPath IICoefficientMediation Effectp Value
Reducing the cost of pest control in obeying the certification standardsDigital literacy → Reducing the cost of pest control in obeying the certification standards−0.250 *** (0.029)Reducing the cost of pest control in obeying the certification standards → Opportunistic behavior in pest control−0.163 *** (0.031)0.040 ***0.002
0.002
Reducing the cost of pest control in obeying the certification standards → The degree of opportunistic behavior in pest control−1.362 *** (0.086)0.341 ***0.000
0.000
Reducing the risk of pest control in obeying the certification standardsDigital literacy → Reducing the risk of pest control in obeying the certification standards−0.174 *** (0.030)Reducing the risk of pest control in obeying the certification standards → Opportunistic behavior in pest control−0.240 *** (0.029)0.042 ***0.000
0.000
Reducing the risk of pest control in obeying the certification standards → The degree of opportunistic behavior in pest control−0.759 *** (0.094)0.132 ***0.000
0.000
Enhancing the awareness of obeying pest control regulations for certified vegetablesDigital literacy → Enhancing the awareness of obeying pest control regulations for certified vegetables0.142 *** (0.030)Enhancing the awareness of obeying pest control regulations for certified vegetables → Opportunistic behavior in pest control−0.214 *** (0.030)0.030 ***0.006
0.002
Enhancing the awareness of obeying pest control regulations for certified vegetables → The degree of opportunistic behavior in pest control−0.801 *** (0.095)0.114 ***0.007
0.007
Notes: ① *** indicate significance at the 1% level. ② Standard errors are in parentheses. ③ The upper and lower two p-values are the results of the tests based on the Bootstrap Method and the Sobel Method, respectively; ④ The control variables are the same as those in Table 3. Due to space constraints, only the regression results of the main variables are reported.
Table 7. Estimated results of moderating effects.
Variables(1)(2)
Opportunistic Behavior in Pest ControlThe Degree of Opportunistic Behavior in Pest Control
Digital literacy−0.092 ** (0.043)−0.573 *** (0.122)
Digital literacy × Traceable certification label−0.099 ** (0.046)−0.532 *** (0.132)
Control variable ControlControl
Sample size 644644
R20.6210.649
Notes: ** and *** indicate significant at the 5% and 1% significance levels, respectively. Standard errors are in parentheses.
Disclaimer/Publisher’s Note: The statements, opinions and data contained in all publications are solely those of the individual author(s) and contributor(s) and not of MDPI and/or the editor(s). MDPI and/or the editor(s) disclaim responsibility for any injury to people or property resulting from any ideas, methods, instructions or products referred to in the content.

