
Modeling the Profitability of Milk Production—A Simulation Approach


Abstract
1. Introduction
2. Materials and Methods
2.1. Assumptions of the Simulation Model
2.2. Simulation Model for the Milk Market
- identity equations, i.e., fixed (time-invariant) mathematical relationships and formulas that allow for the derivation of the values of certain variables based on the values of others. These equations are grounded in definitional identities and structural interdependencies and were implemented in Microsoft Excel for step-by-step simulation of variable values.
- econometric equations, i.e., mathematical expressions designed to forecast the variables of interest based on estimated historical statistical relationships. These forecasts were generated using ARIMA econometric models and causal models, estimated in RStudio 4.1.2, and calibrated with expert adjustments and scenario assumptions. All data used in the model were sourced from Polish datasets (FADN, Statistics Poland, and national market reports). The Wyt and Wxt indices were estimated using the average level of financial support received by Polish dairy farms, such as direct payments and market interventions. In the baseline scenario, these indices were held constant, reflecting an assumption of unchanged policy during the forecast period.
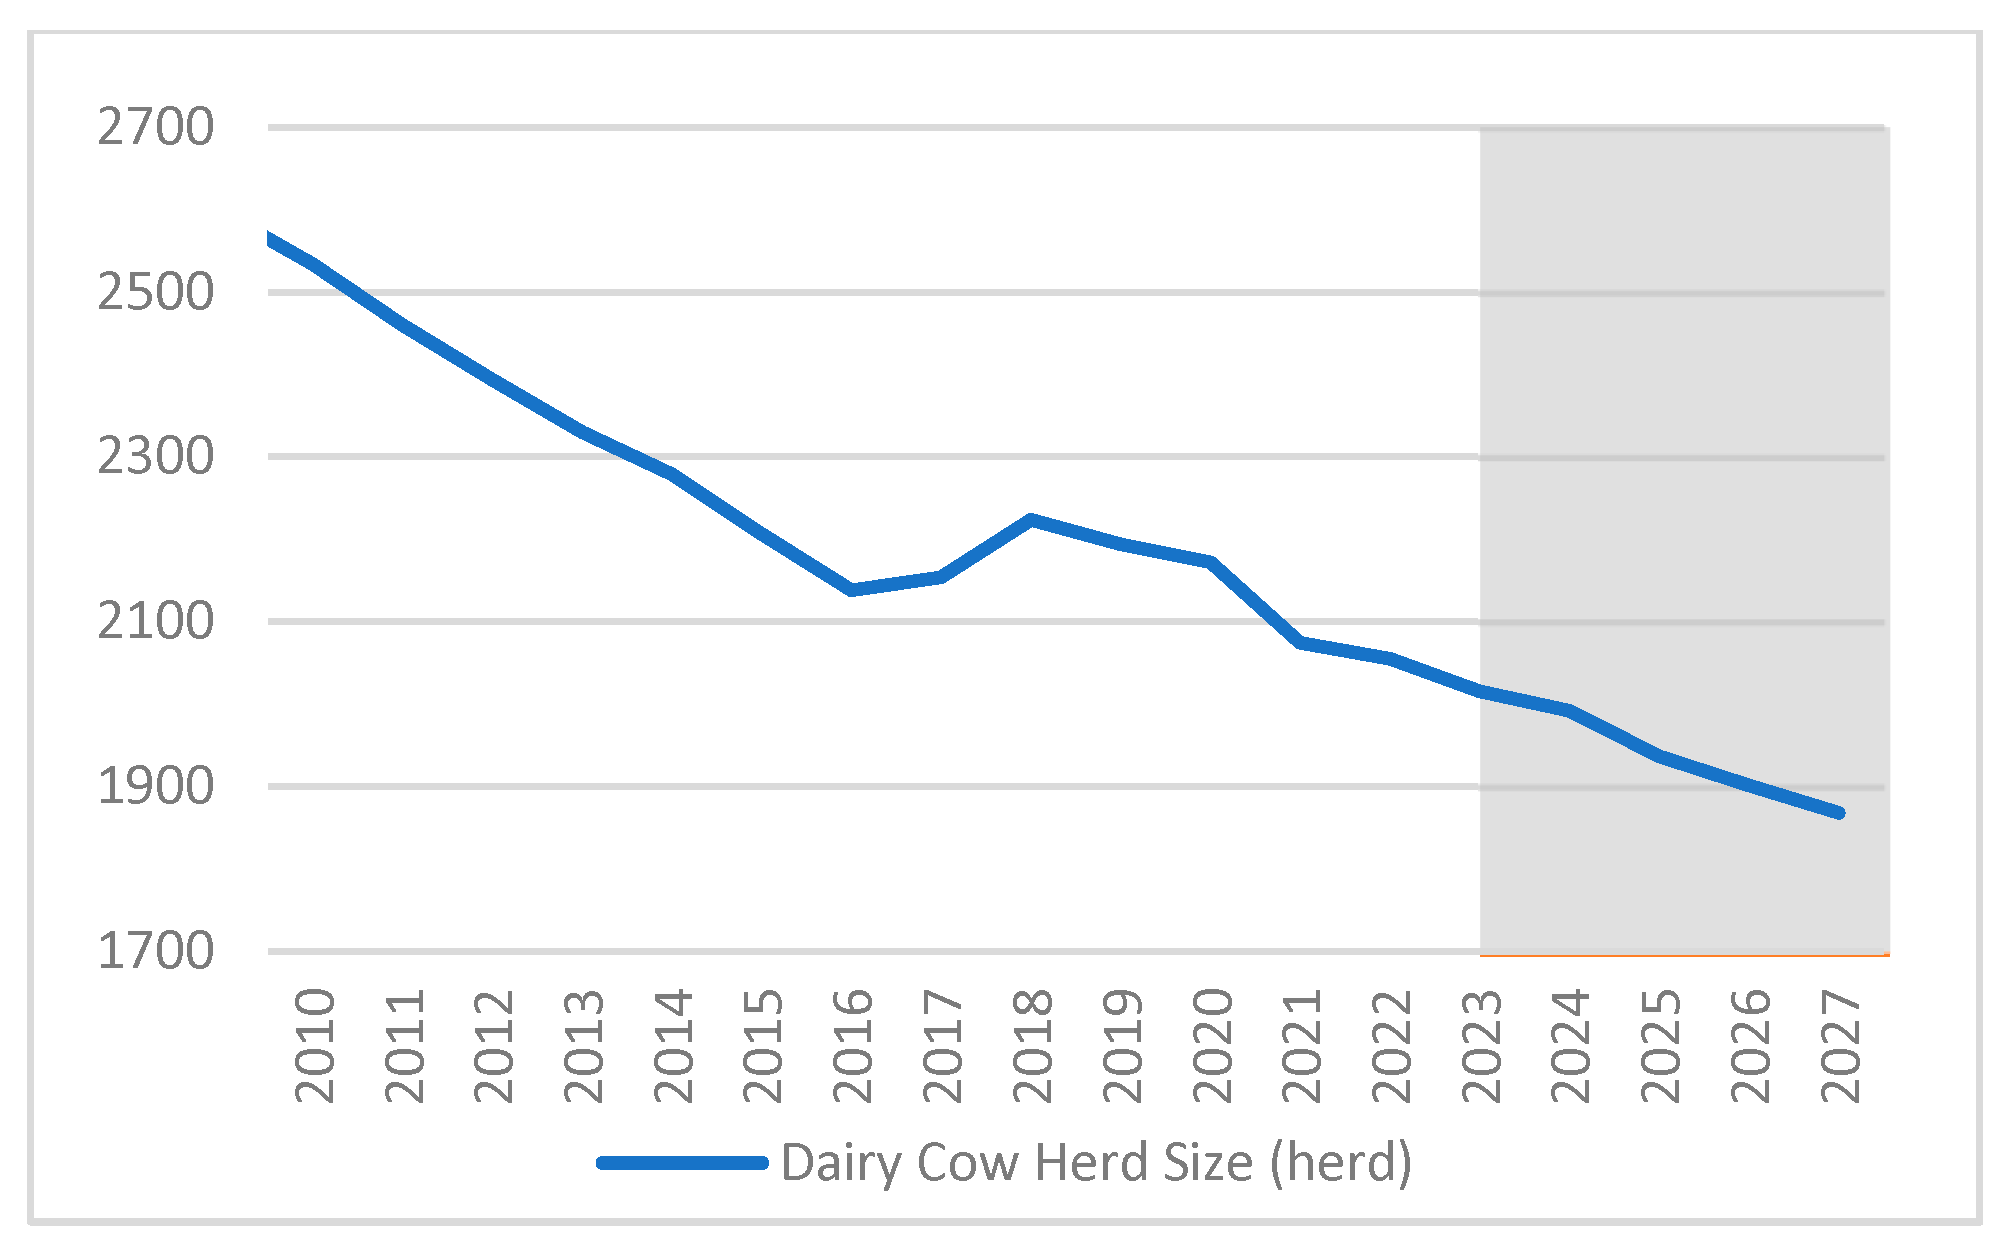
- The equation describing the size of the dairy herd is . Here, the change in the dairy herd is modeled as a function of the change in milk production profitability observed two years prior. According to the estimated equation, an improvement in profitability leads, with a two-year lag, to an increase in the size of the dairy herd. This lag structure is consistent with the biological cycle of the dairy sector, in which a farmer’s decision to expand production and purchase heifers in response to improved profitability materializes in herd growth after approximately two years.
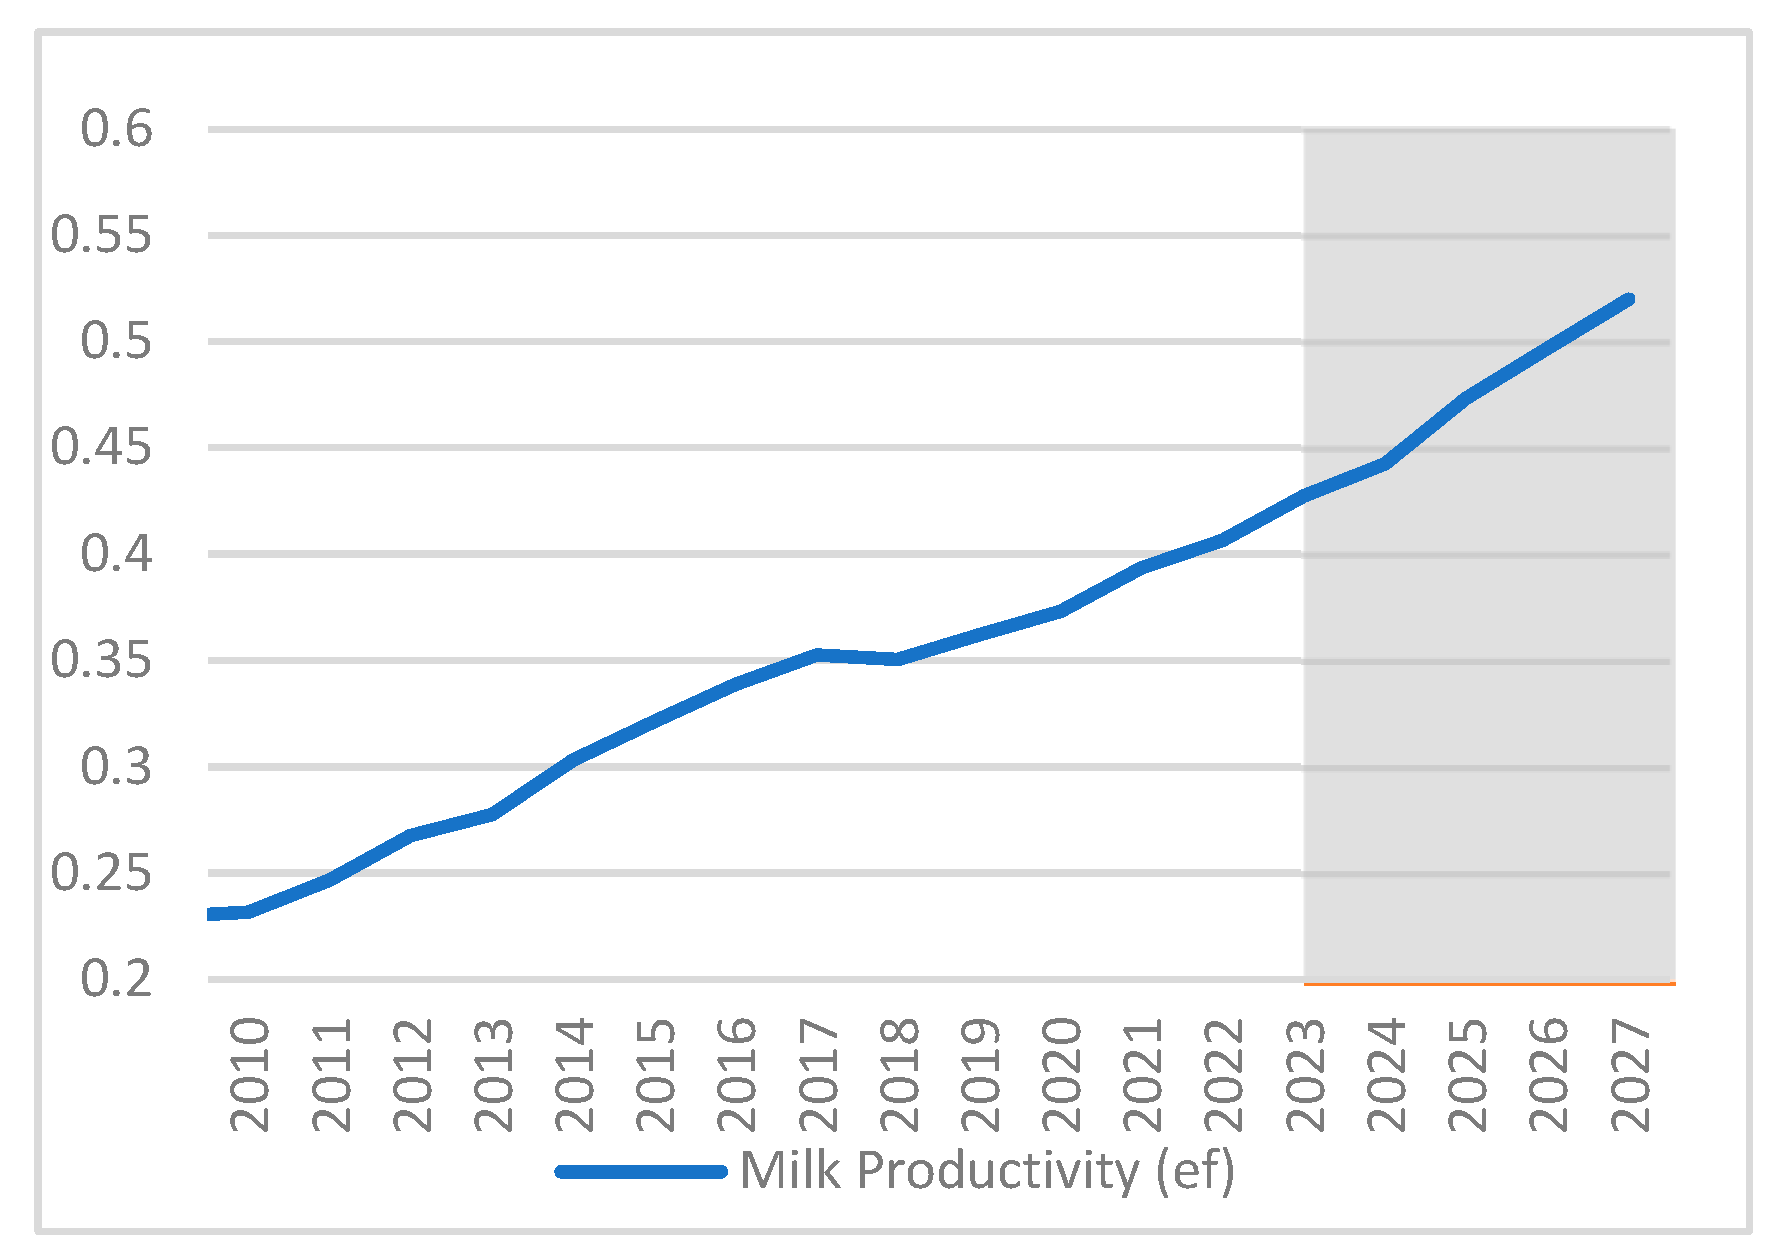
- The equation describing milk yield (productivity) is . The estimated relationship indicates that an increase in milk production profitability discourages farmers from pursuing higher productivity, whereas a decline in profitability incentivizes them to seek ways to increase revenues, including through improvements in milk yield.
3. Results
3.1. Simulation Using the Model
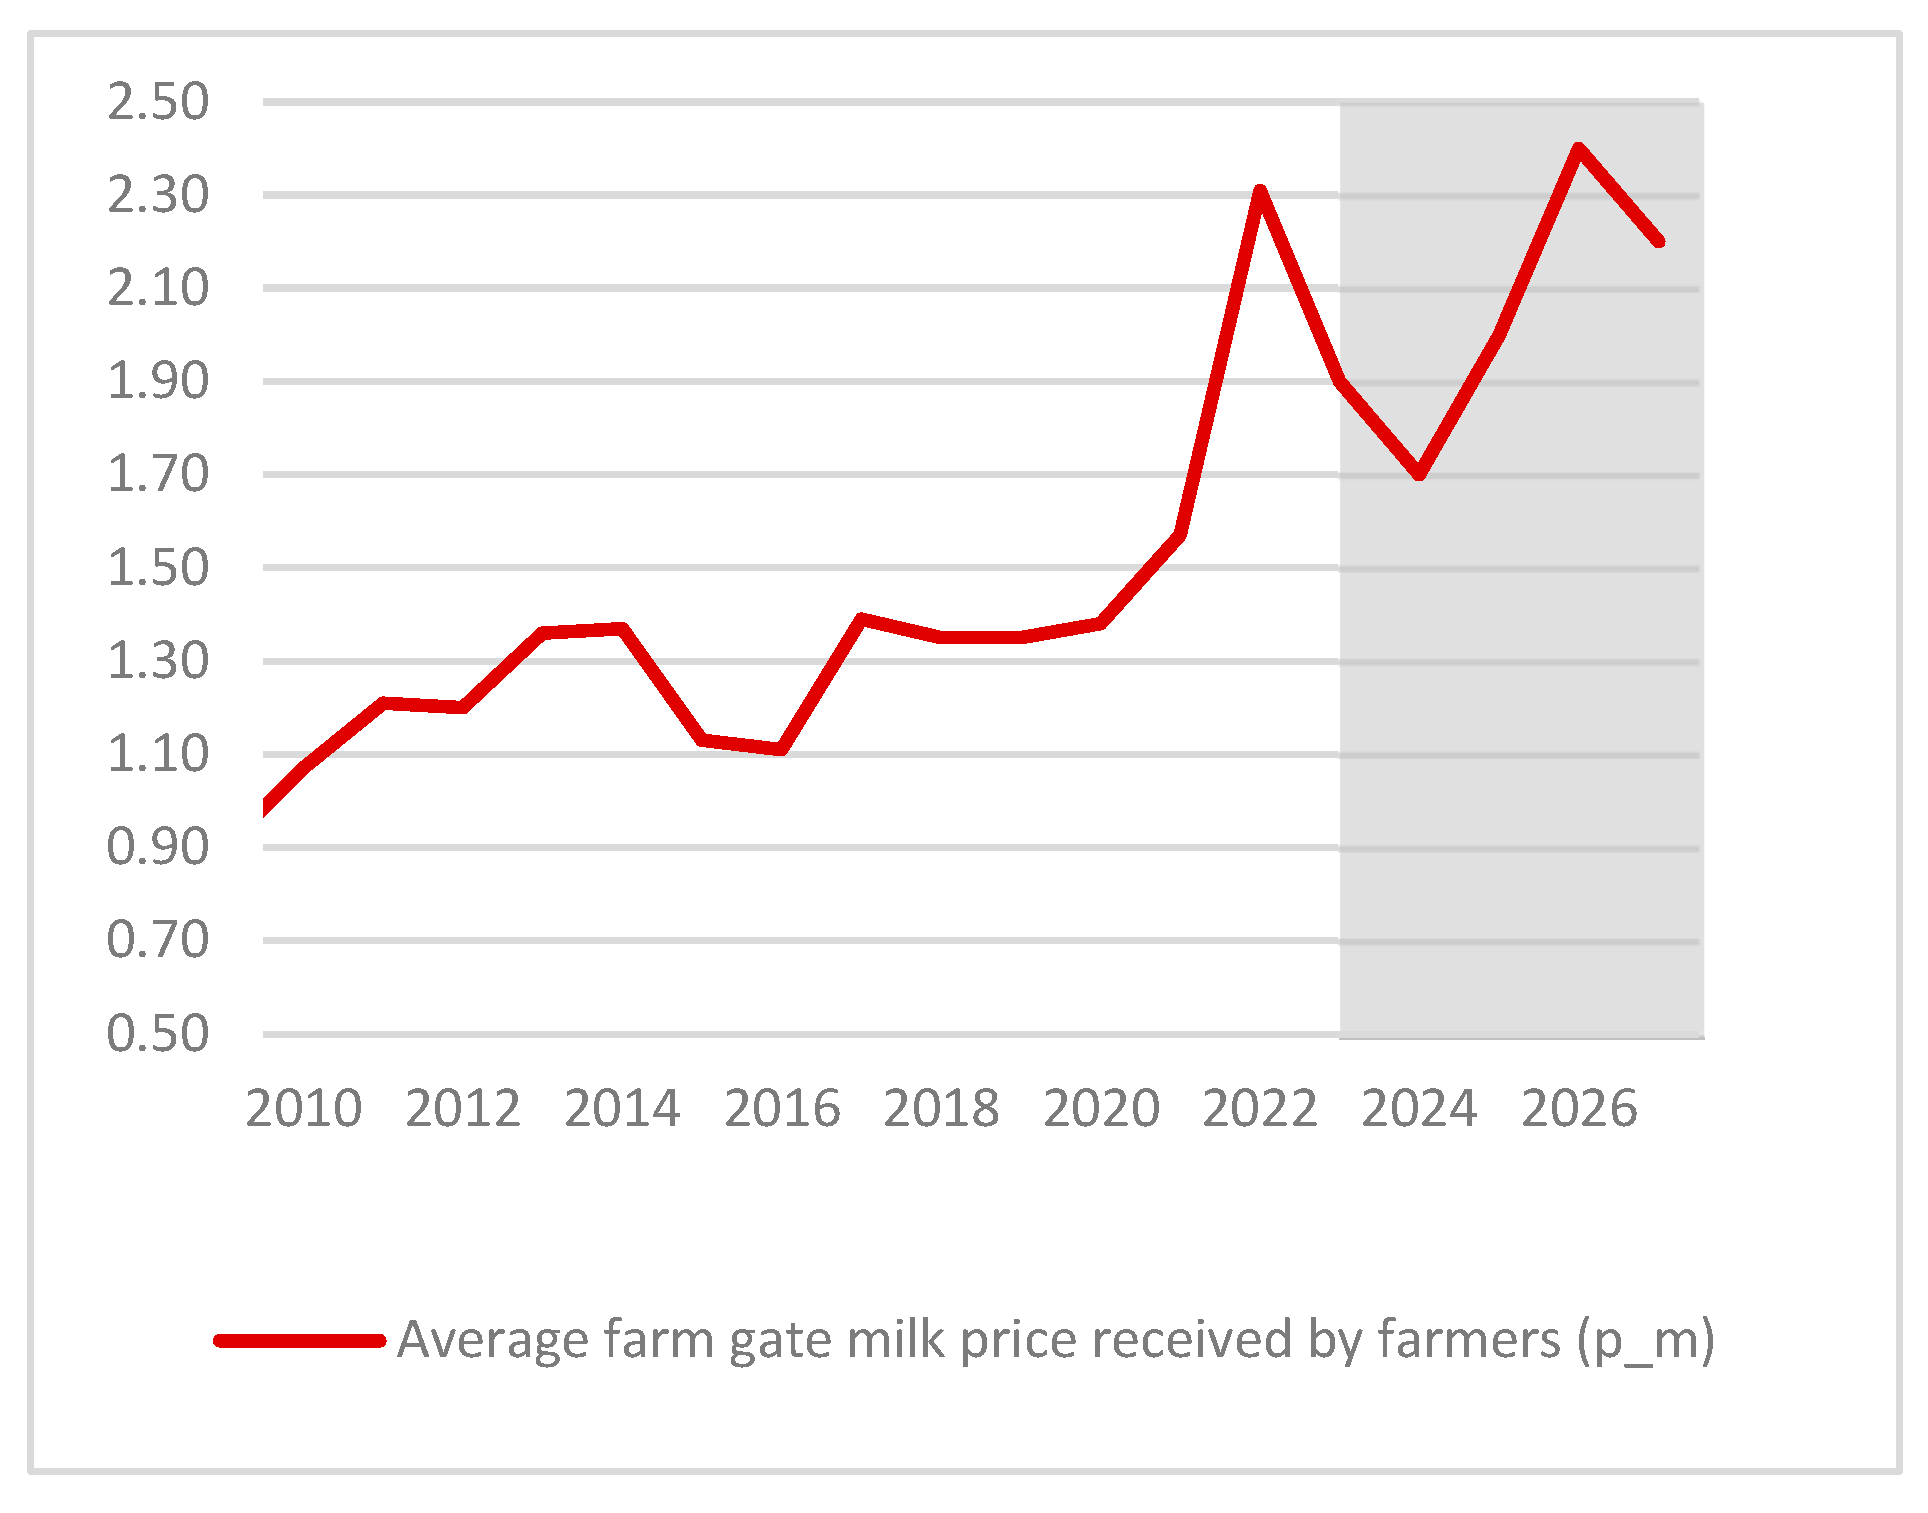
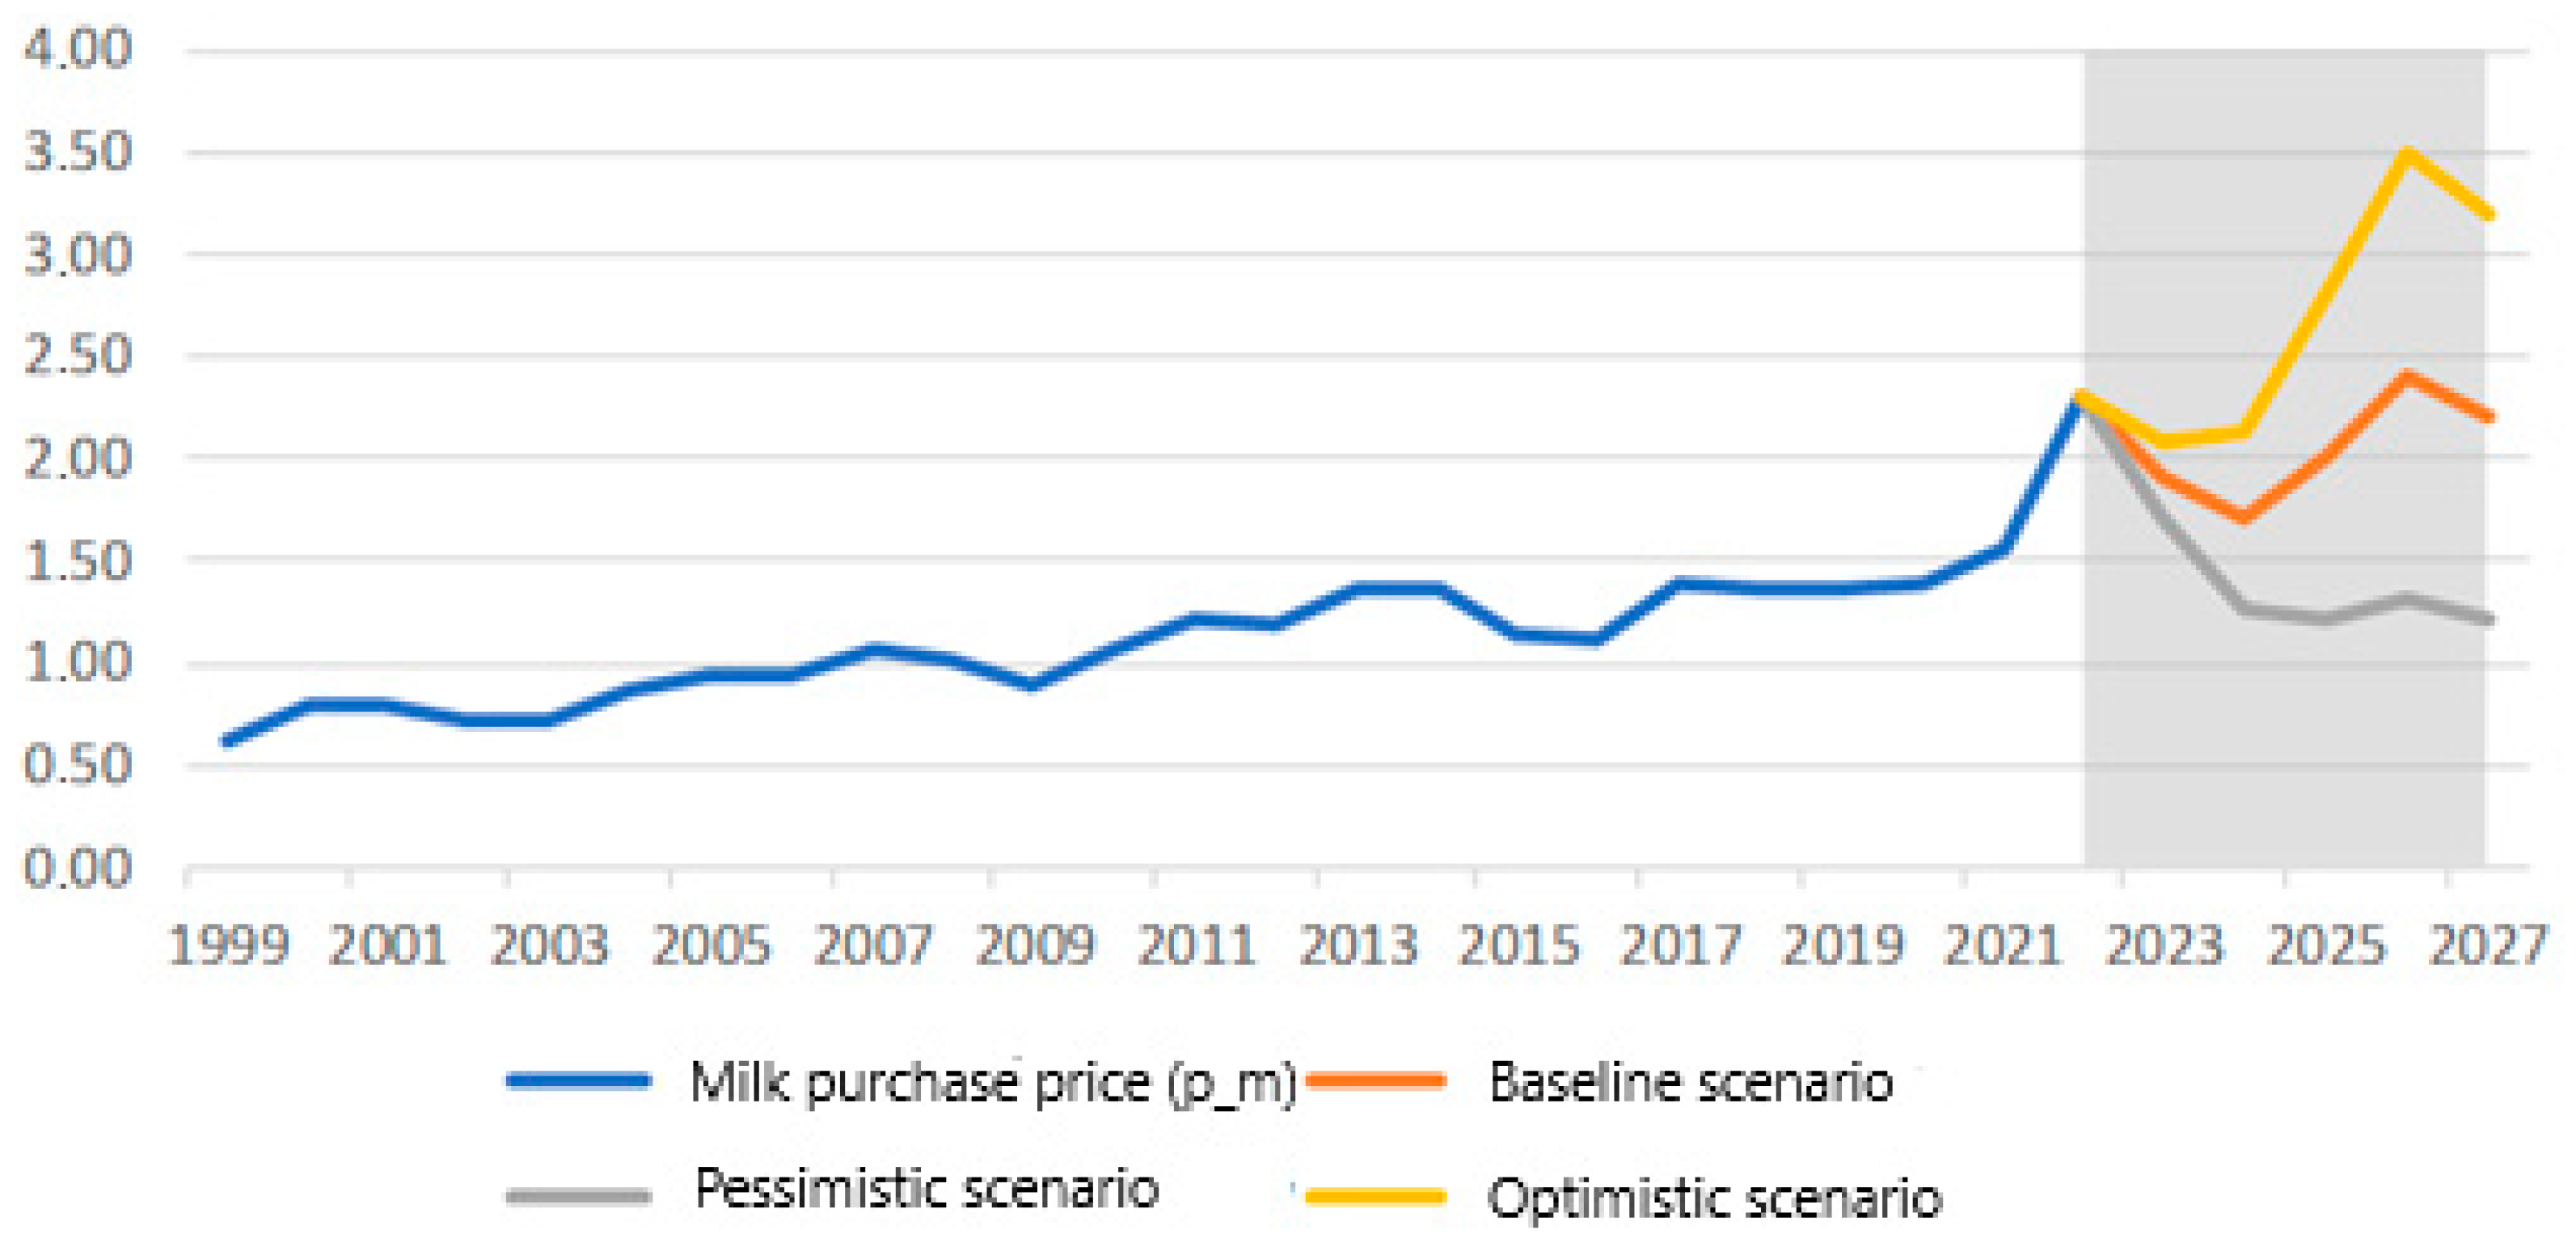
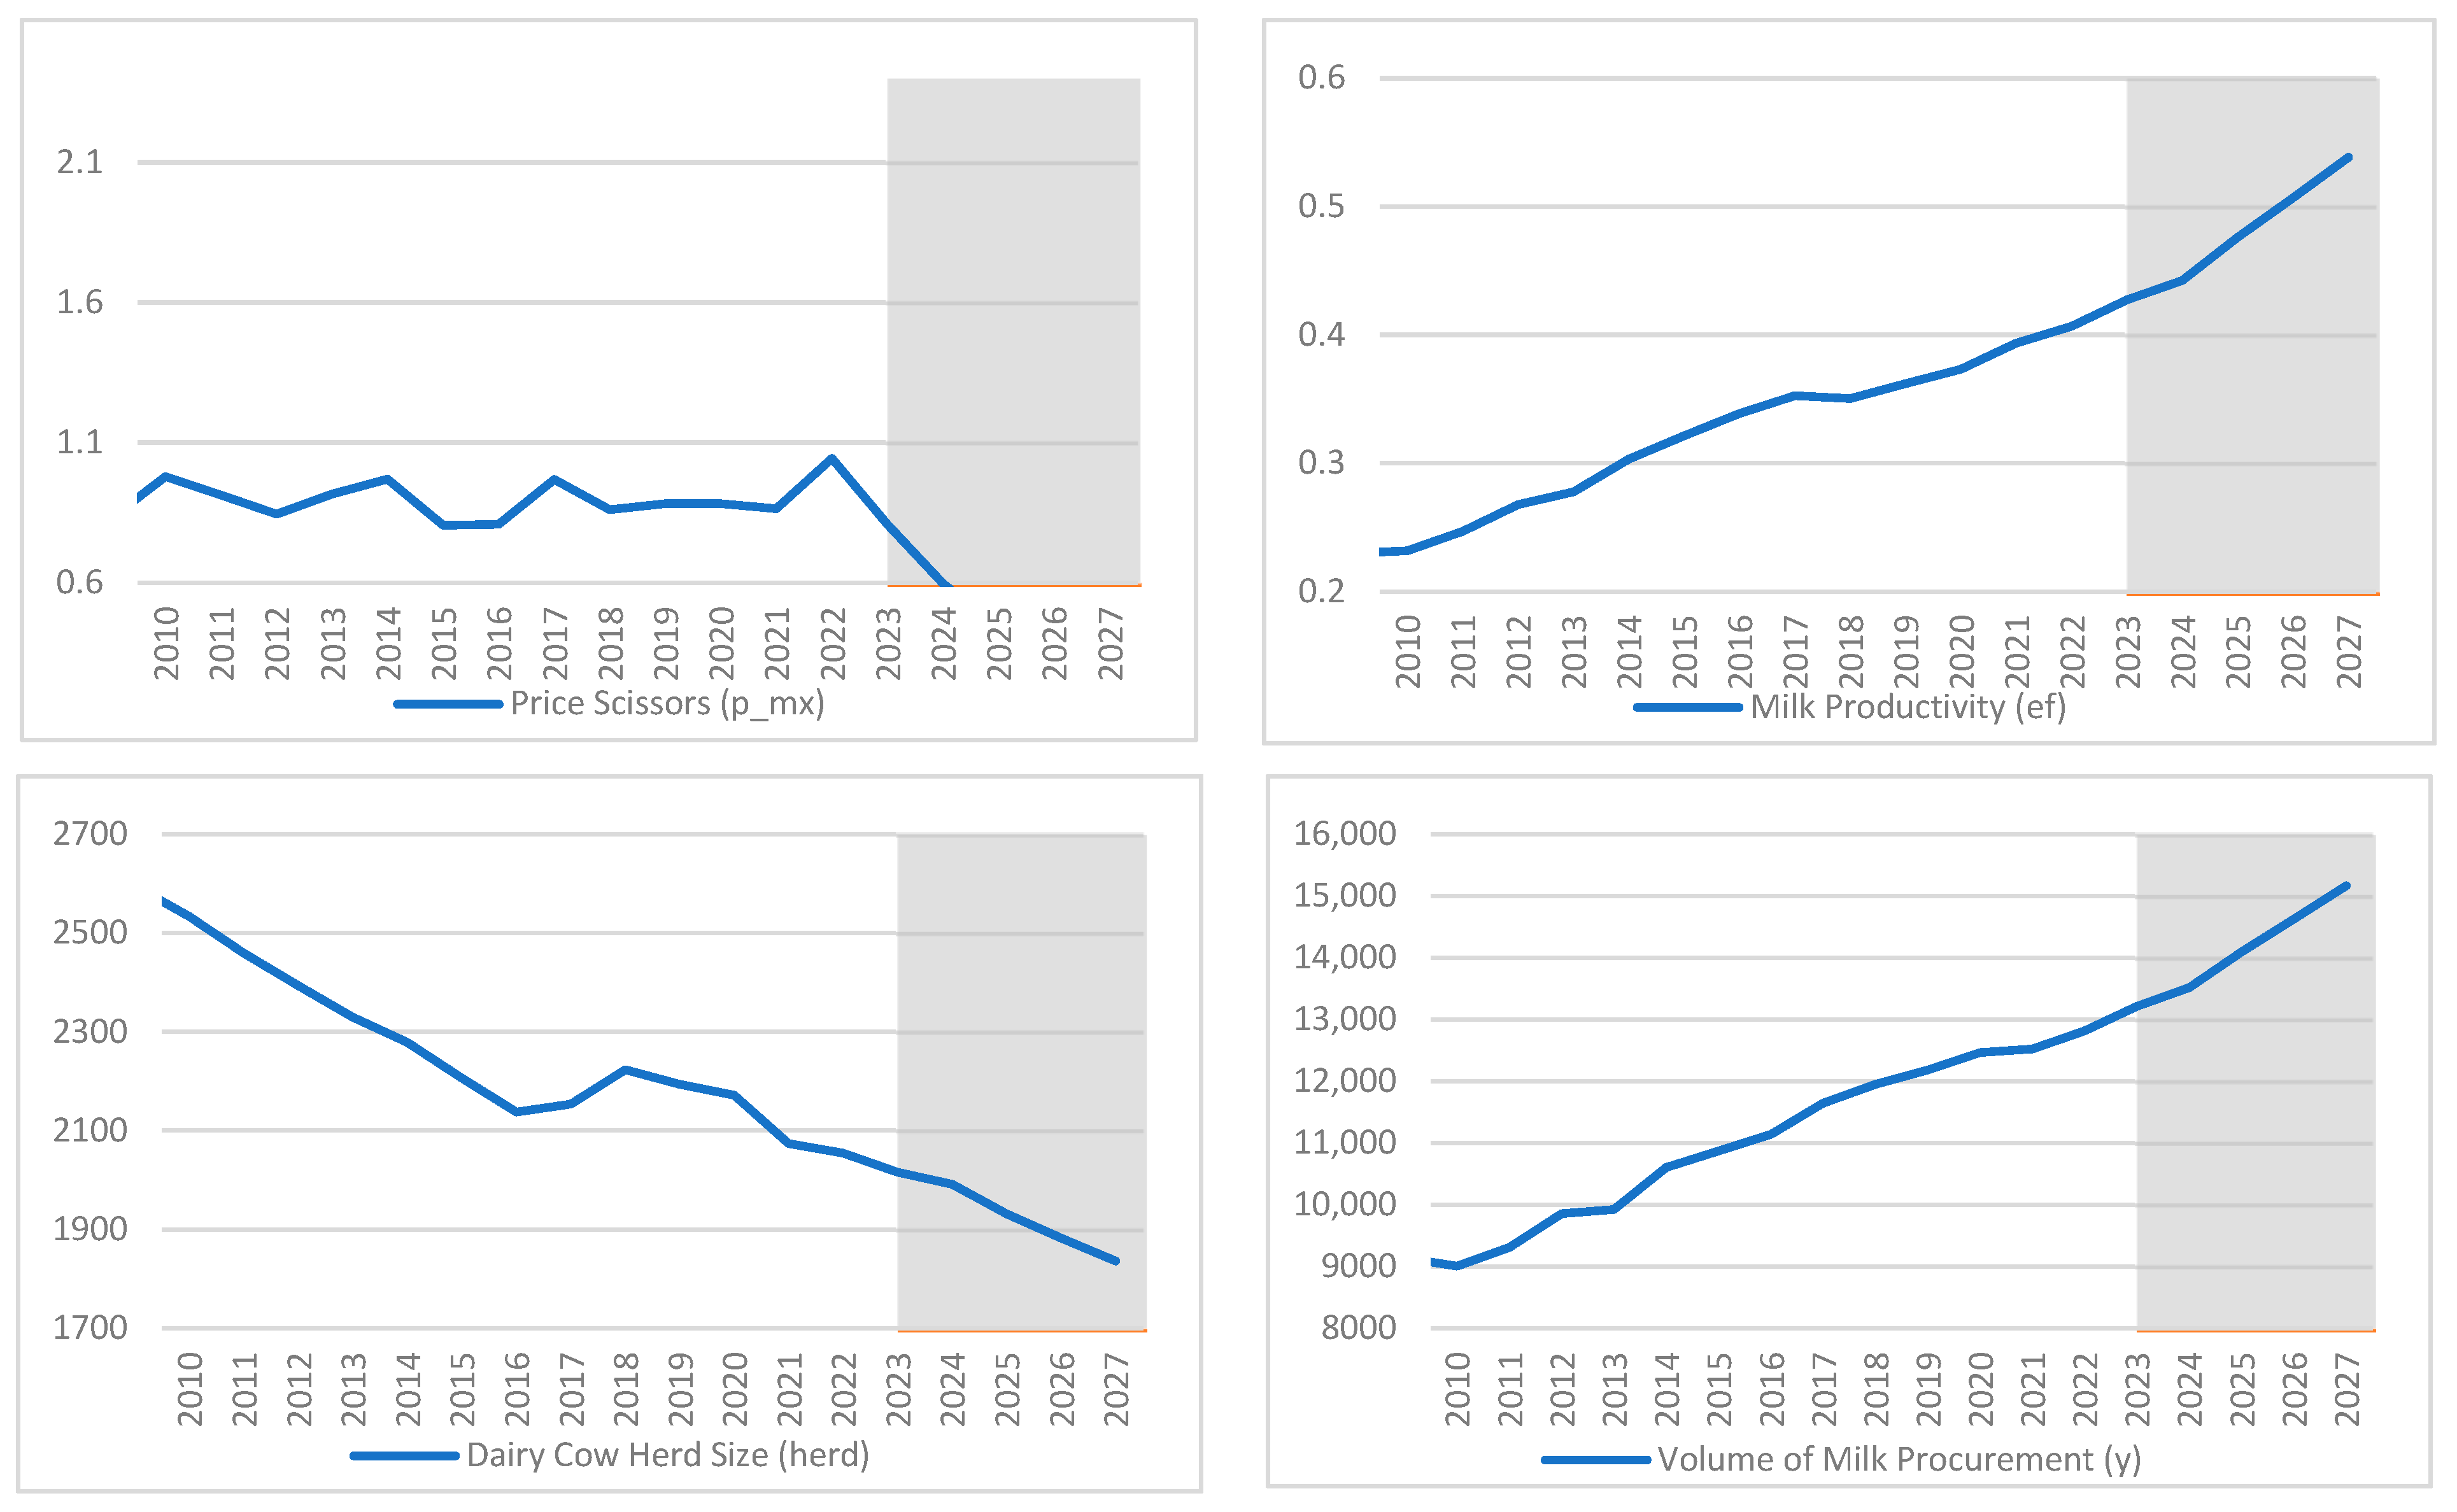
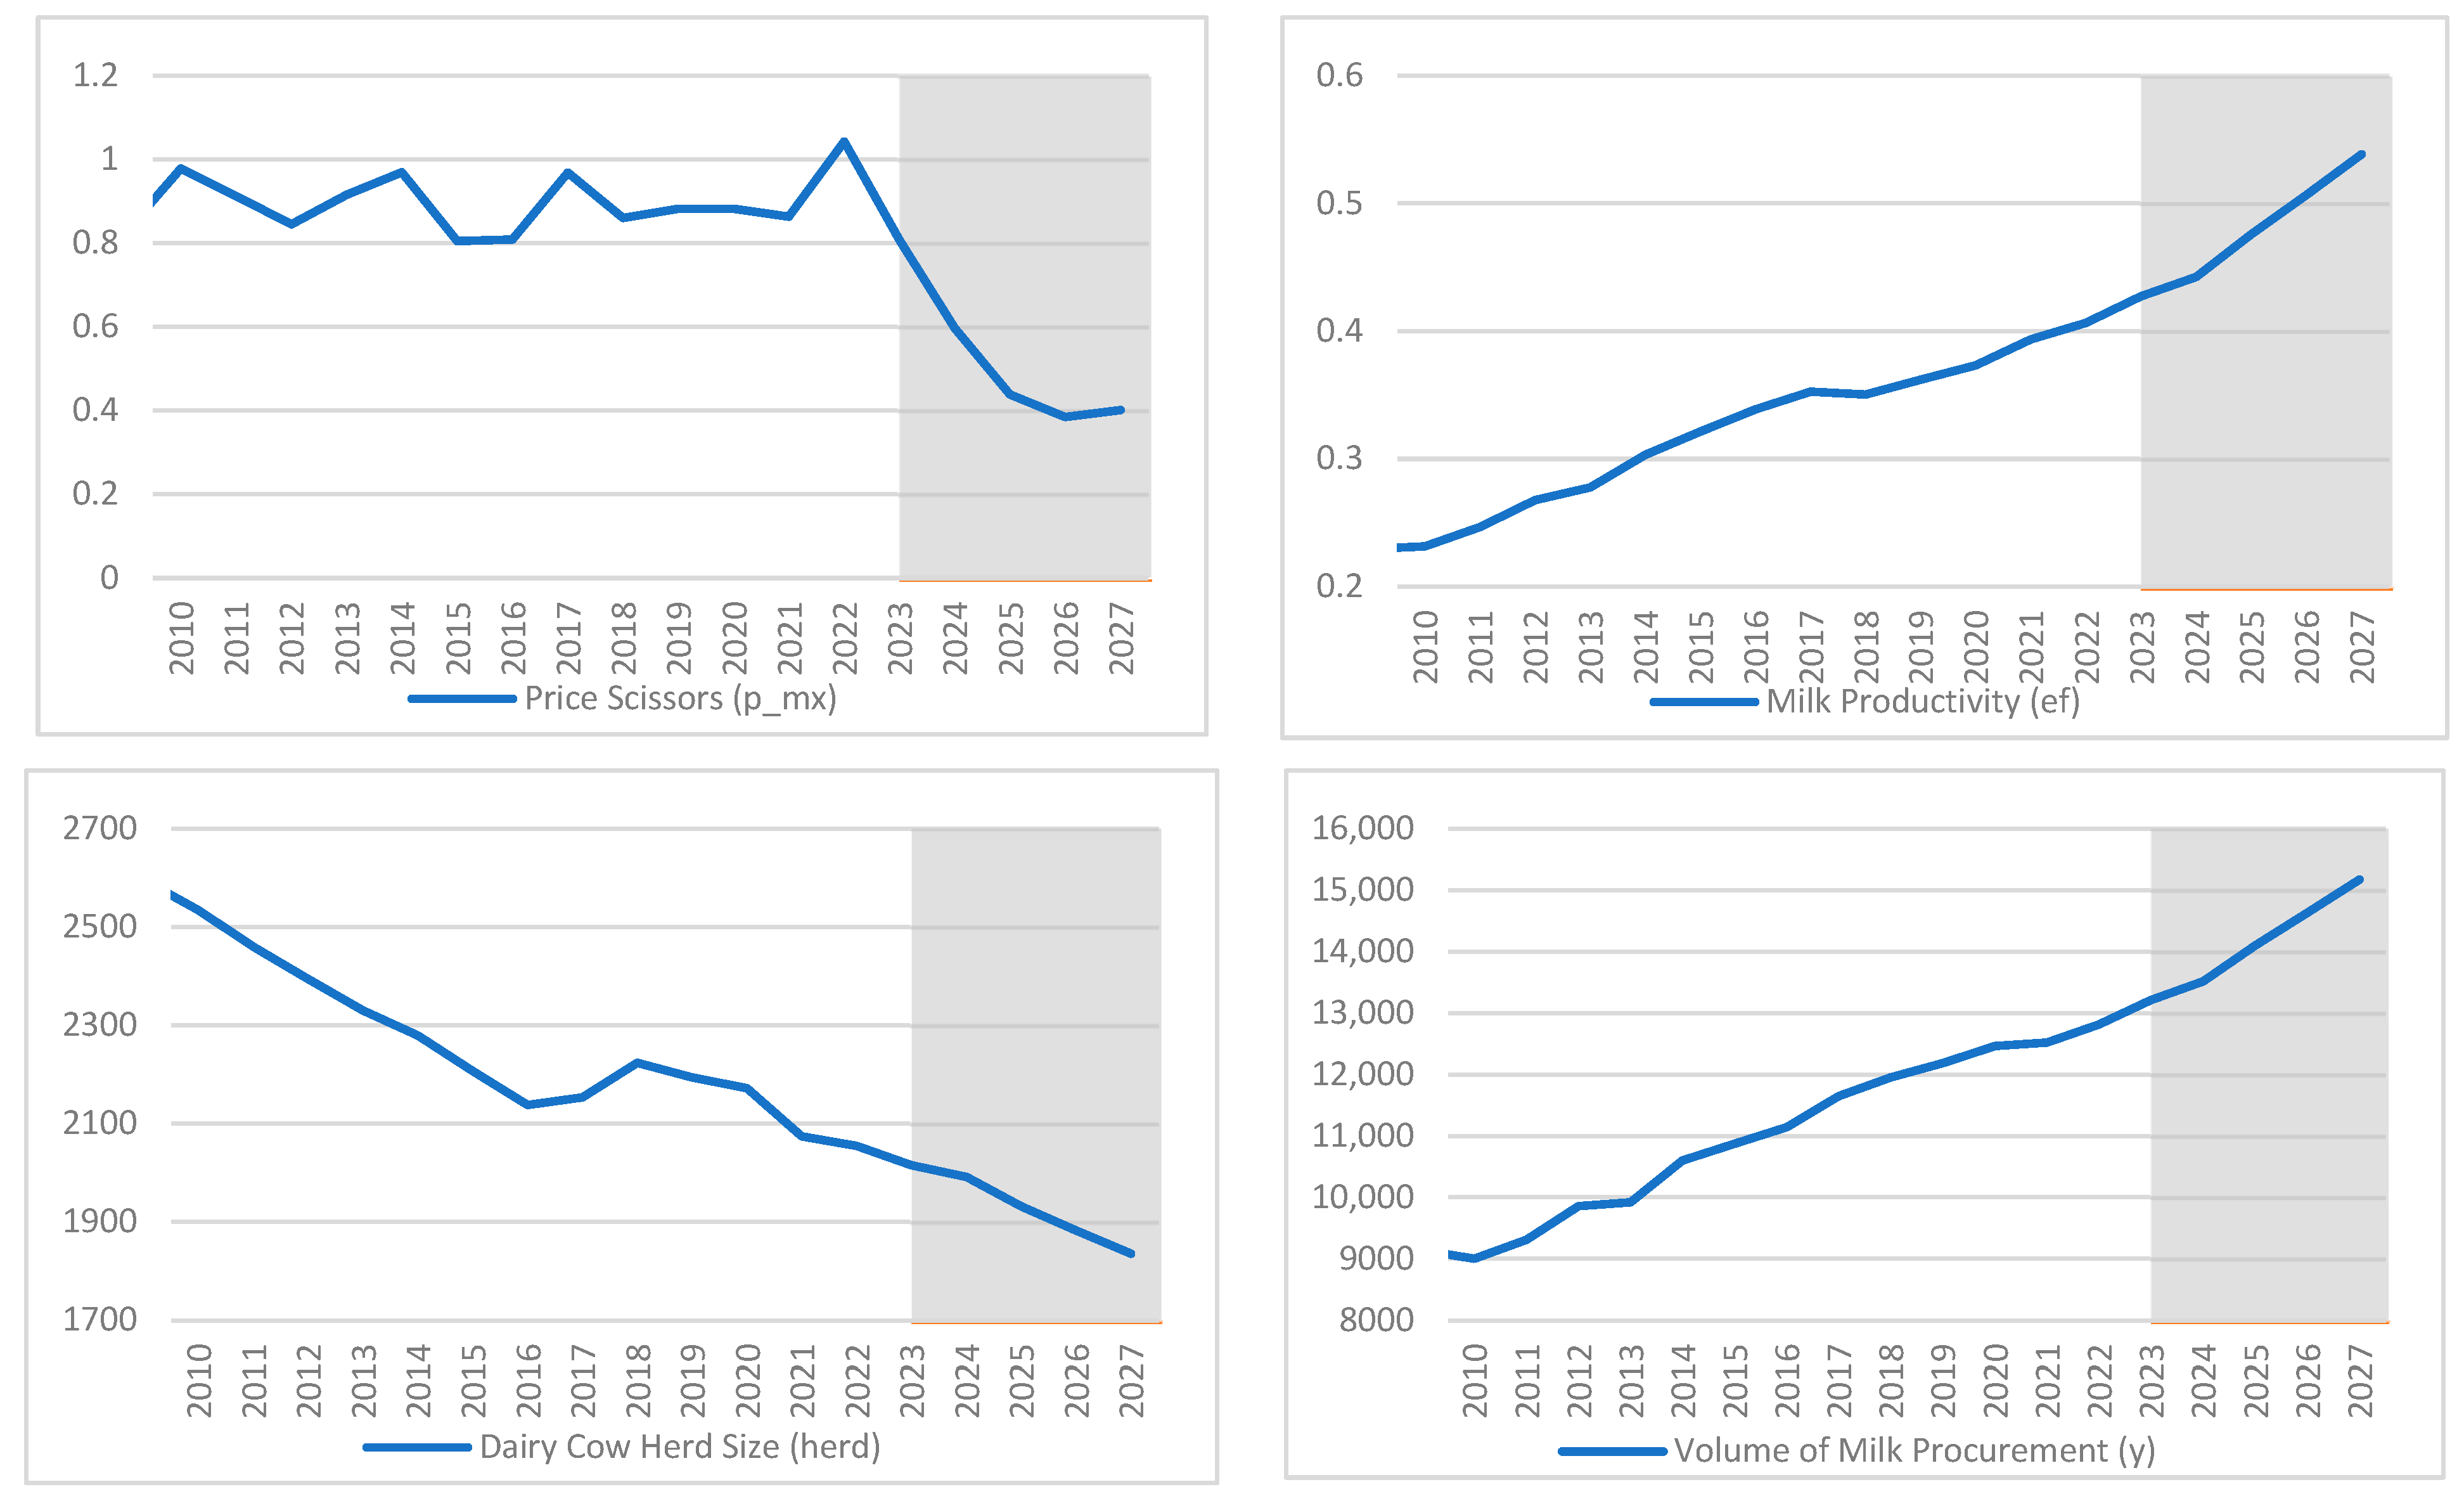
- In the baseline scenario, it was assumed that the global dairy market would enter an upward phase of the cycle in 2024, lasting until 2026, after which farm-gate milk prices were expected to decline again. The projected milk price trajectory is presented in Figure 2.
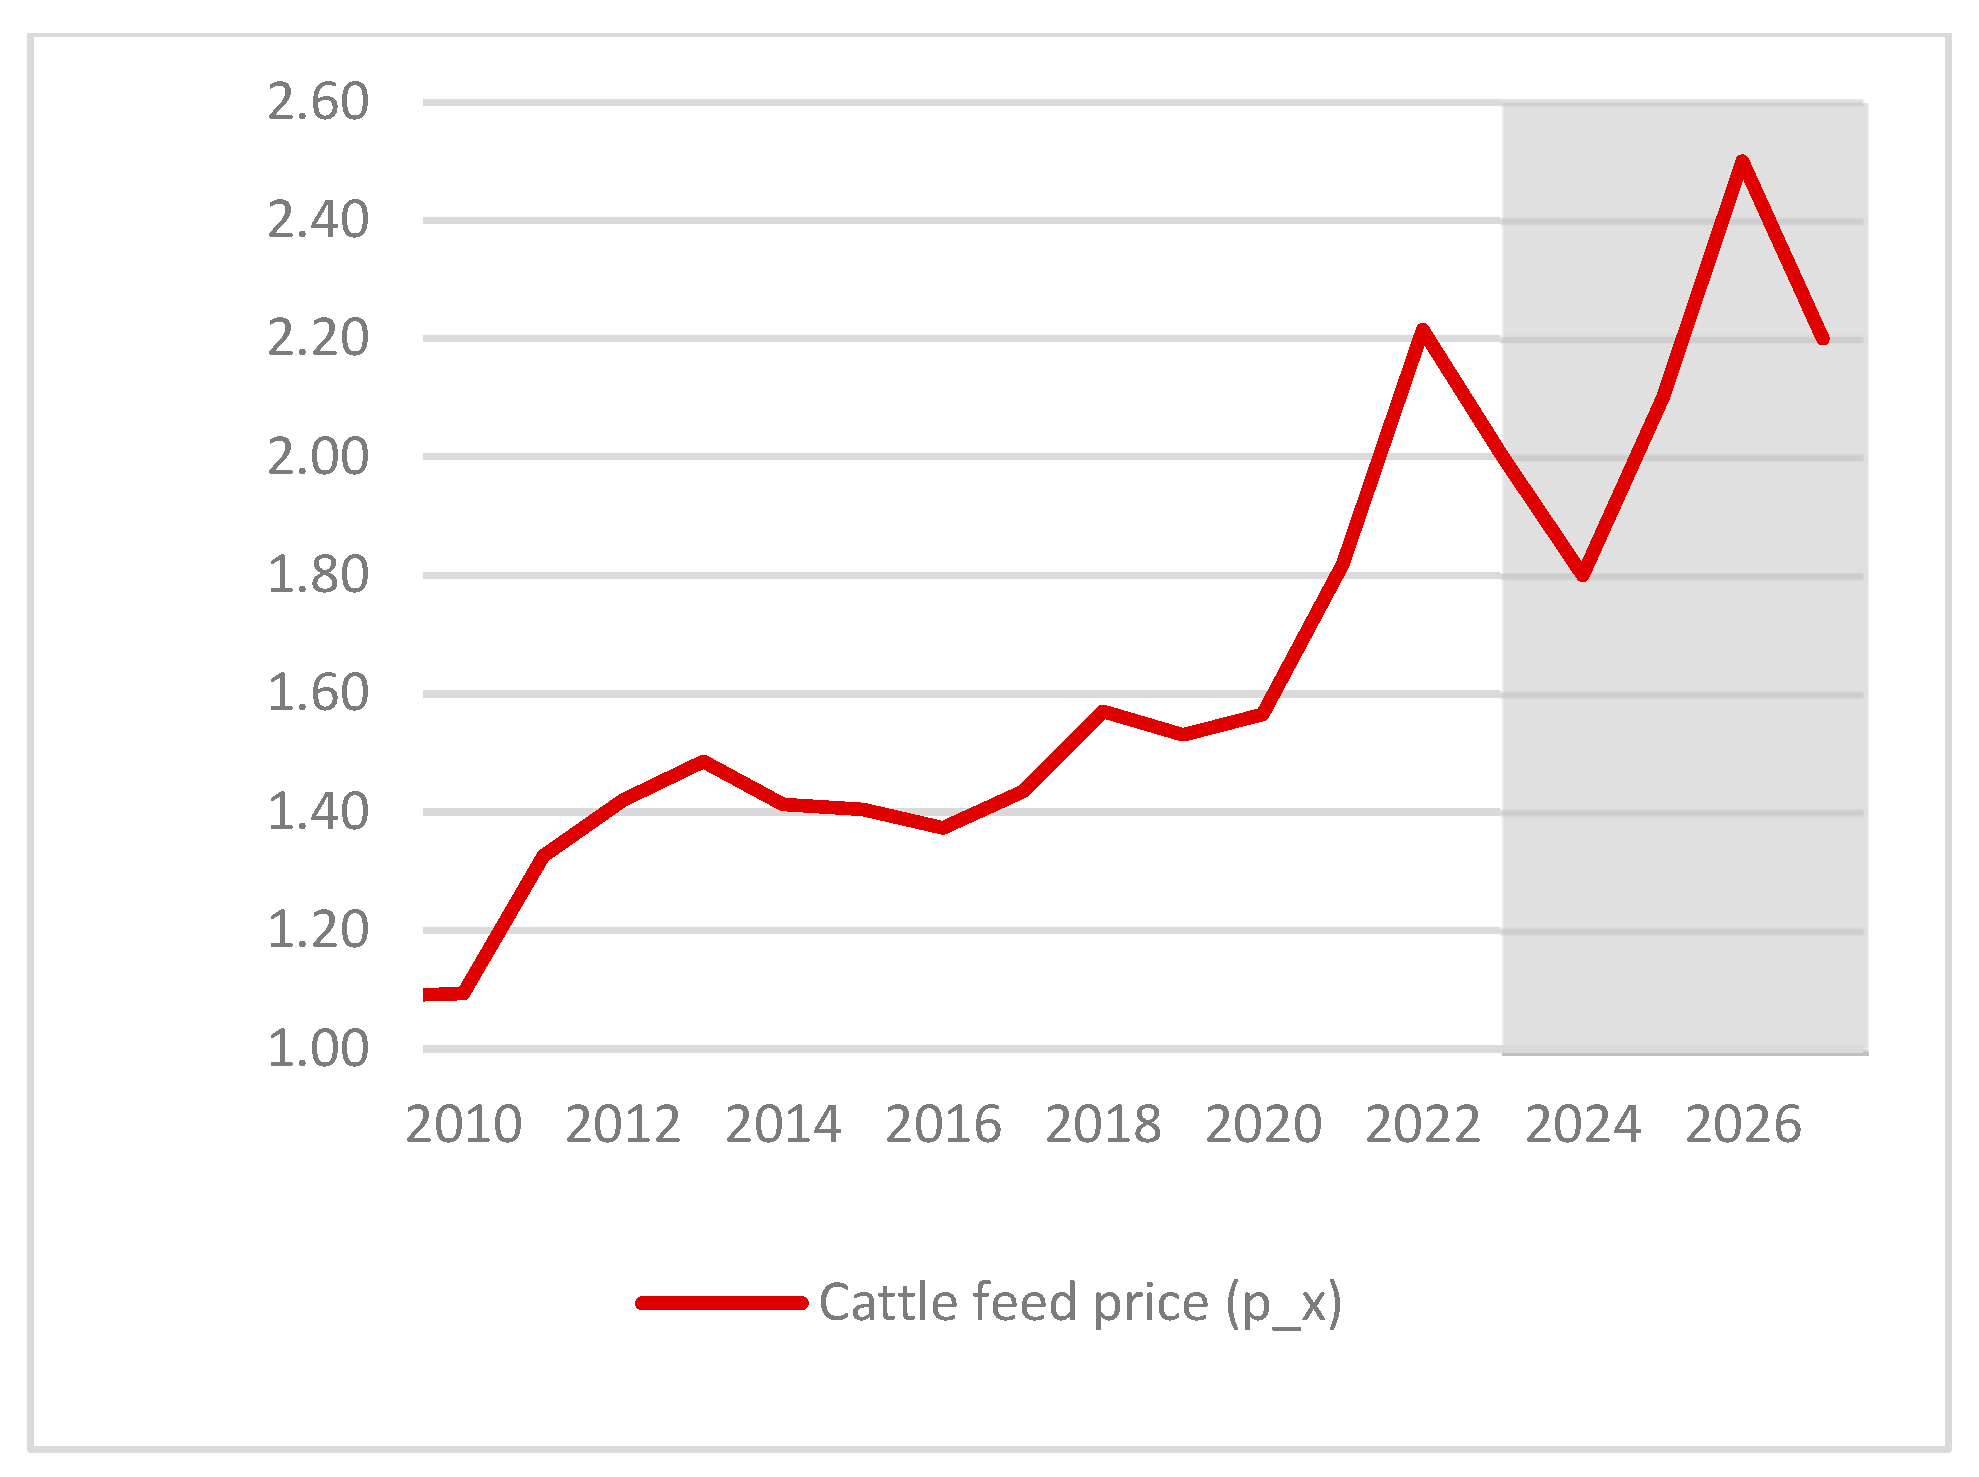
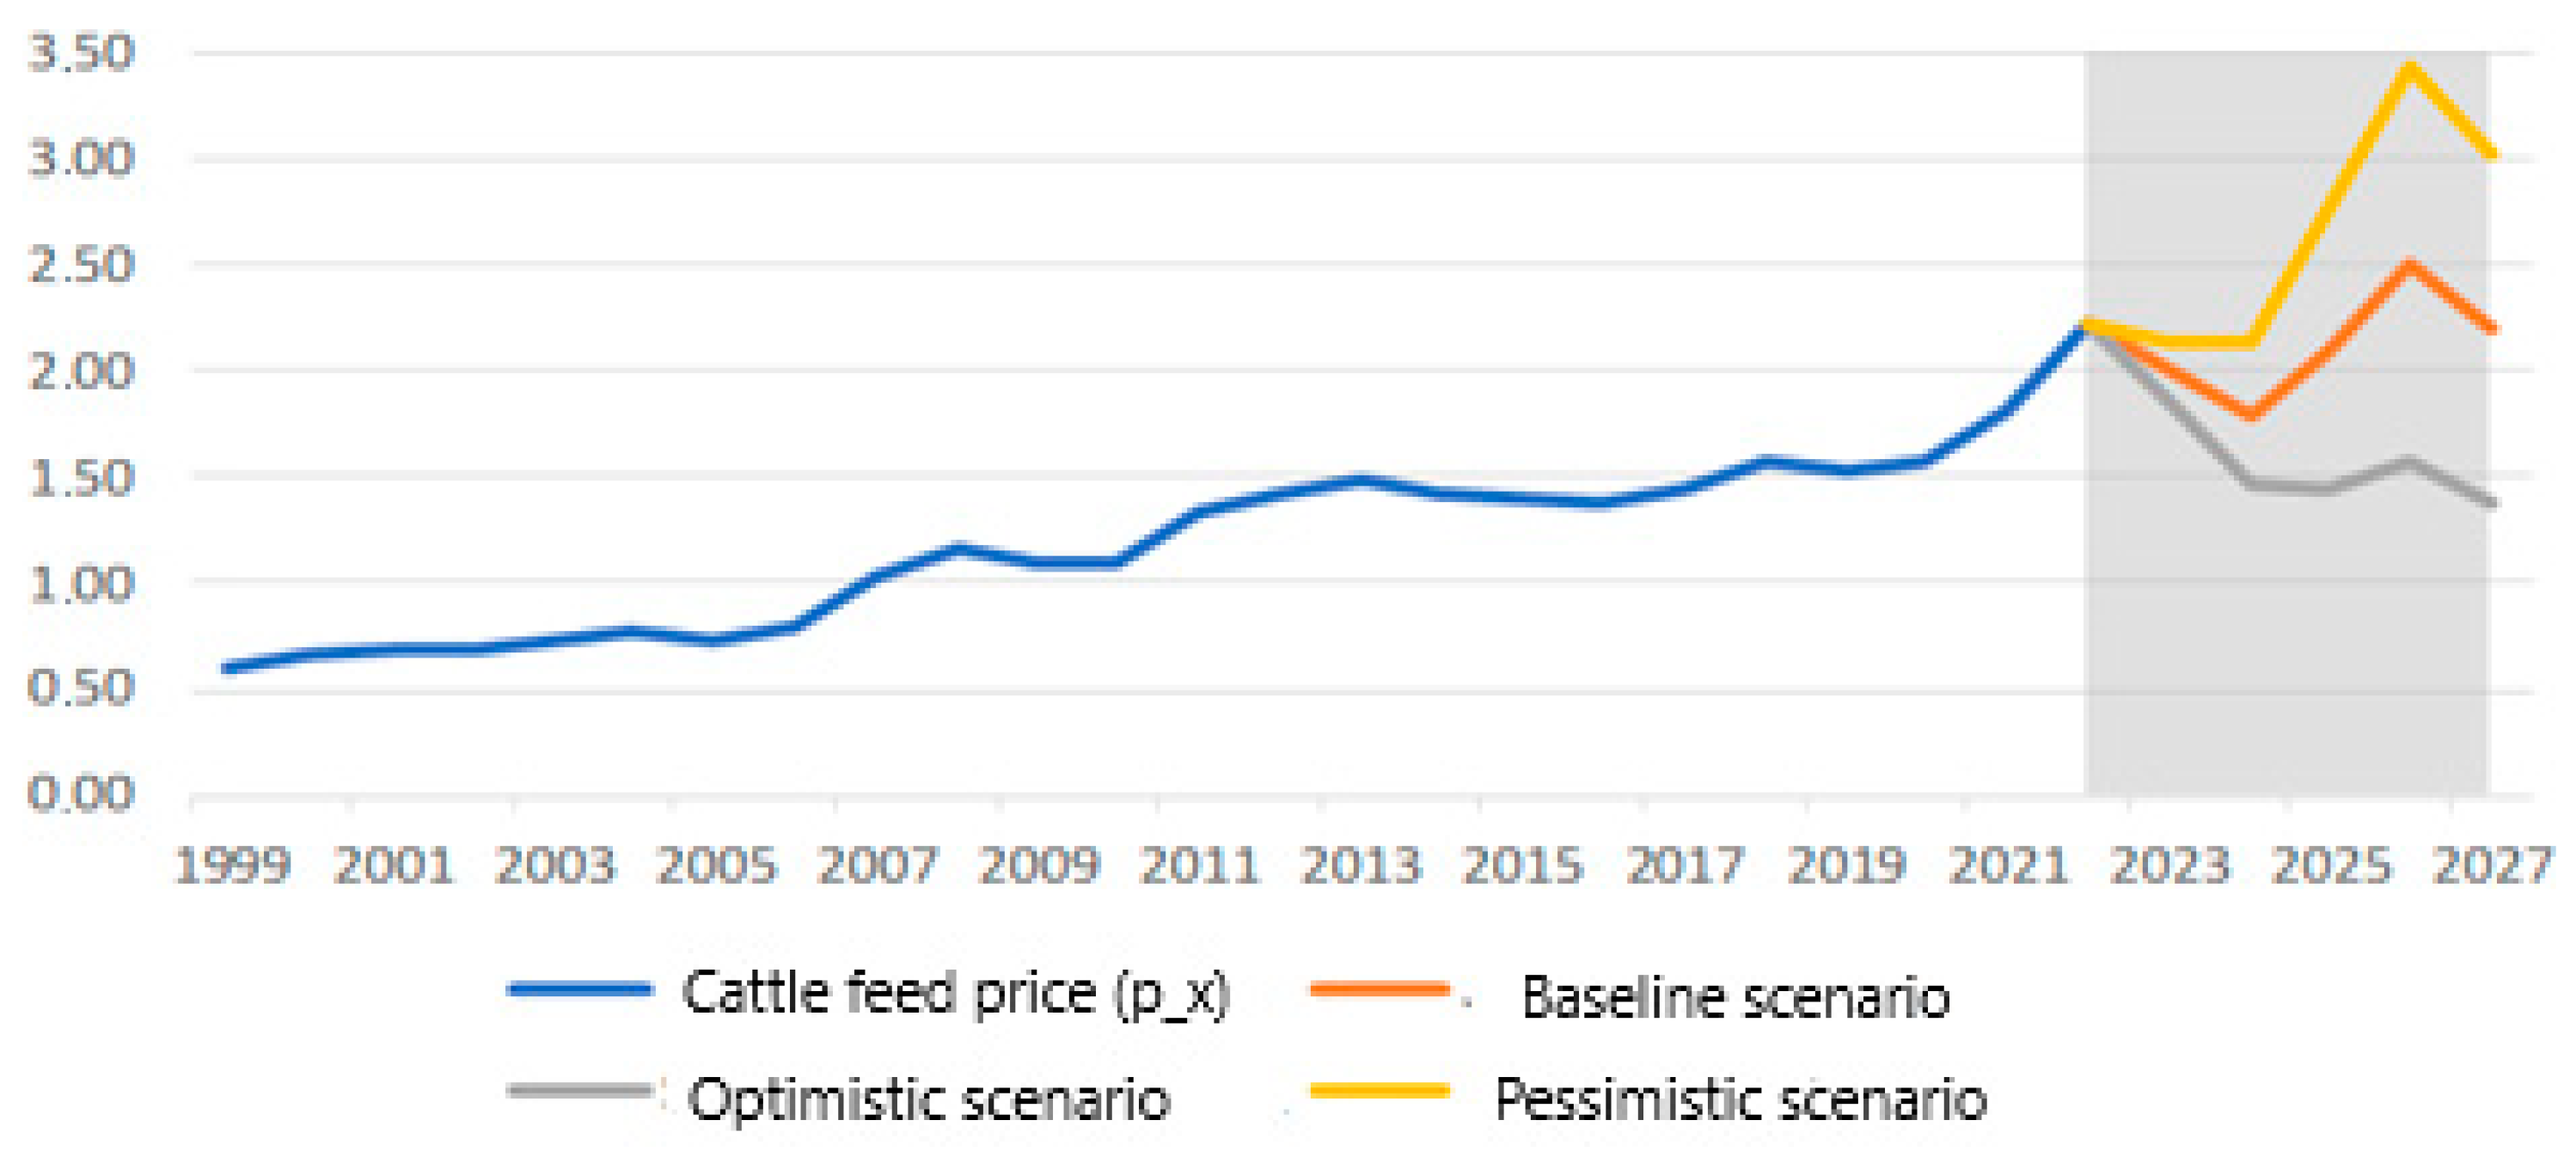
- In the baseline scenario, it was also assumed that feed prices would decline in 2023 and 2024, reflecting adjustments in global grain and oilseed supply following the outbreak of the war in Ukraine in 2022. The anticipated decline in the profitability of grain and oilseed production was expected to reduce supply, exerting upward pressure on prices from 2025 onward. This trend was expected to affect domestic cattle feed markets as well. The projected feed price trajectory is shown in Figure 3.
3.2. Scenario Analysis
3.3. Optimistic Scenario
3.4. Pessimistic Scenario
4. Discussion and Conclusions
Author Contributions
Funding
Data Availability Statement
Acknowledgments
Conflicts of Interest
References
- Widiati, R.; Adiarto, A.; Hertanto, B.S. Profitability of Smallholder Dairy Farms Based on the Performance of Lactating Cows and Fresh-Milk Market Prices at Lowland Areas of Yogyakarta. J. Indones. Trop. Anim. Agric. 2012, 37, 132–138. [Google Scholar] [CrossRef]
- Muminović, S.; Pavlović, V. Profitability of Dairy Industry in Slovenia, Croatia and Serbia. Mljekarstvo 2012, 62, 96–110. [Google Scholar]
- Wilson, P. Decomposing Variation in Dairy Profitability: The Impact of Output, Inputs, Prices, Labour and Management. J. Agric. Sci. 2011, 149, 507–517. [Google Scholar] [CrossRef] [PubMed]
- Nicholson, C.F.; Stephenson, M.W. Financial Performance of Value-Added Dairy Operations in New York, Vermont and Wisconsin. In Proceedings of the American Agricultural Economics Association Annual Meeting, Portland, OR, USA, 29 July–1 August 2007. [Google Scholar]
- Olipra, J. Cycles in the Global Milk Market. J. Agribus. Rural Dev. 2019, 52, 165–172. [Google Scholar] [CrossRef]
- European Commission. Dairy Market Support Instruments and Safety-Net Measures. In Common Market Organisation for Agricultural Products, 2nd ed.; European Commission, Directorate-General for Agriculture and Rural Development: Brussels, Belgium, 2023; pp. 45–62. [Google Scholar]
- Olipra, J. Change in Seasonality Pattern of EU Farm-Gate Milk Price. Probl. World Agric. 2019, 19, 75–84. [Google Scholar]
- Olipra, J. Destabilising Intervention in EU Dairy Markets. J. Agribus. Rural Dev. 2020, 55, 73–83. [Google Scholar] [CrossRef]
- European Commission. Regulation (EU) No 1308/2013 of the European Parliament and of the Council of 17 December 2013 Establishing a Common Organisation of the Markets in Agricultural Products. Off. J. Eur. Union 2013, L 347, 671–854. [Google Scholar]
- European Commission. Commission Delegated Regulation (EU) 2016/1612 of 8 September 2016 Providing Aid for Milk-Production Reduction. Off. J. Eur. Union 2016, L 242, 1–7. Available online: https://eur-lex.europa.eu/legal-content/EN/TXT/?uri=CELEX%3A32016R1612 (accessed on 1 June 2025).
- European Commission. Commission Implementing Regulation (EU) 2023/739 of 4 April 2023 Providing for an Emergency Support Measure for the Cereal and Oilseed Sectors in Bulgaria, Poland and Romania. Off. J. Eur. Union 2023, L 96, 1–5. Available online: https://eur-lex.europa.eu/eli/reg_impl/2023/739/oj (accessed on 1 June 2025).
- Chantreuil, F.; Donnellan, T.; van Leeuwen, M.; Salamon, P.; Tabeau, A.; Bartova, L. EU Dairy Quota Reform—AGMEMOD Scenario Analysis. In Proceedings of the EAAE International Congress, Ghent, Belgium, 26–29 August 2008. [Google Scholar]
- Hamulczuk, M.; Hertel, K. Implications of the Abolition of the Milk-Quota System for Polish Agriculture—Simulation Results Based on the AGMEMOD Model. Contemp. Econ. 2009, 3, 88–98. [Google Scholar]
- van Berkum, S.; Jongeneel, R.A.; Vrolijk, H.C.J.; van Leeuwen, M.G.A.; Jager, J.H. Implications of a UK Exit from the EU for British Agriculture; LEI Wageningen UR: The Hague, The Netherlands, 2016. [Google Scholar]
- Bremmer, J.; Gonzalez-Martinez, A.; Jongeneel, R.; Huiting, H.; Stokkers, R.; Ruijs, M. Impact Assessment of EC 2030 Green Deal Targets for Sustainable Crop Production; Wageningen Economic Research: Wageningen, The Netherlands, 2021; pp. 2021–2150. [Google Scholar]
- Salamon, P.; Banse, M.; Donnellan, T.; Haß, M.; Jongeneel, R.; Laquai, V.; van Leeuwen, M.; Reziti, I.; Salputra, G.; Zirngibl, M.-E. AGMEMOD Outlook for Agricultural and Food Markets in EU Member States 2018–2030; Thünen Working Paper 114; Thünen Institute: Braunschweig, Germany, 2019. [Google Scholar]
- Kiryluk-Dryjska, E.; Baer-Nawrocka, A. The International Competitiveness of Polish Dairy Products under Milk-Market Liberalisation. Pol. J. Econ. 2013, 262, 101–118. [Google Scholar]
- Weiss, F.; Leip, A. Greenhouse-Gas Emissions from the EU Livestock Sector: A Life-Cycle Assessment Carried Out with the CAPRI Model. Agric. Ecosyst. Environ. 2012, 149, 124–134. [Google Scholar] [CrossRef]
- Hubbard, C.; Davis, J.; Feng, S.; Harvey, D.; Liddon, A.; Moxey, A.; Ojo, M.; Patton, M.; Philippidis, G.; Scott, C. Brexit: How Will UK Agriculture Fare? EuroChoices 2018, 17, 19–26. [Google Scholar] [CrossRef]
- Binfield, J.; Donnellan, T.; Hanrahan, K. An Examination of Milk-Quota Expansion at EU Member-State Level with Specific Emphasis on Ireland. In Modelling Agricultural and Rural Development Policies—Selected Papers from the 107th Seminar of the European Association of Agricultural Economists; Bartova, L., M’barek, R., Ratinger, T., Eds.; Publications Office: Luxembourg, 2008. [Google Scholar]
- OECD; FAO. The AGLINK-COSIMO Model: A Partial-Equilibrium Model of World Agricultural Markets; OECD Publishing: Paris, France, 2022. [Google Scholar]
- Kavallari, A.; Fellmann, T.; Gay, S.H. Shocks in Economic Growth—Shocking Effects for Food Security? Food Secur. 2014, 6, 567–583. [Google Scholar] [CrossRef]
- Jensen, H.G.; Fellmann, T.; Perez-Dominguez, I.; Charlebois, P.; Philippidis, G. Economic Impacts on Agriculture of a Low-Carbon Economy by 2030: An Analysis with the Aglink-Cosimo Model. In Proceedings of the 21st Annual GTAP Conference, Cartagena, Colombia, 13–15 June 2018. [Google Scholar]


| Equation | Number | Description |
|---|---|---|
| see Equation (1) | (1) | The equation describes a simplified measure of milk production profitability in year t (it does not account for certain aspects of activity, such as the production and sale of livestock). The numerator reflects the aggregated revenues of milk producers in year t, while the denominator captures the aggregated costs related to feed consumption in the same year. |
| see Equation (2) | (2) | The transformation of Equation (1) enables the decomposition of milk production profitability into two components: one attributable to milk yield (productivity), and the other resulting from the price scissors effect. |
| see Equation (3) | (3) | Equation (3) represents an extension of Equation (1) by incorporating the effects of economic policy interventions in year t. These intervention effects are accounted for separately on the revenue and cost sides. |
| see Equation (4) | (4) | Equation (4) is the logarithmic transformation of Equation (3), allowing for the transition from levels to growth rates (dynamics). |
| see Equation (5) | (5) | Equation (5) is the time-differentiated version of Equation (4), which enables the representation of changes in milk production profitability in a dynamic framework. |
| see Equation (6) | (6) | Equation (6) is a modification of Equation (5), in which the ratios of variable increments over time to their initial levels are, for simplicity, expressed in terms of growth rates (dynamics). |
| see Equation (7) | (7) | Equation (7) is a rearranged form of Equation (6), aimed at isolating the following components of the dynamics of milk production profitability in year t: the dynamics of production efficiency in year t, the dynamics of the price scissors in year t, and the dynamics of the support index for production profitability in year t. |
| see Equation (8) | (8) | Equation (8) is derived by dividing both sides of Equation (7) by the growth rate of milk production profitability in year t. In this way, it reflects the relative contributions of the individual components to the overall dynamics of profitability: the dynamics of production efficiency in year t, the dynamics of the price scissors in year t, and the dynamics of the support index for milk production profitability in year t. |
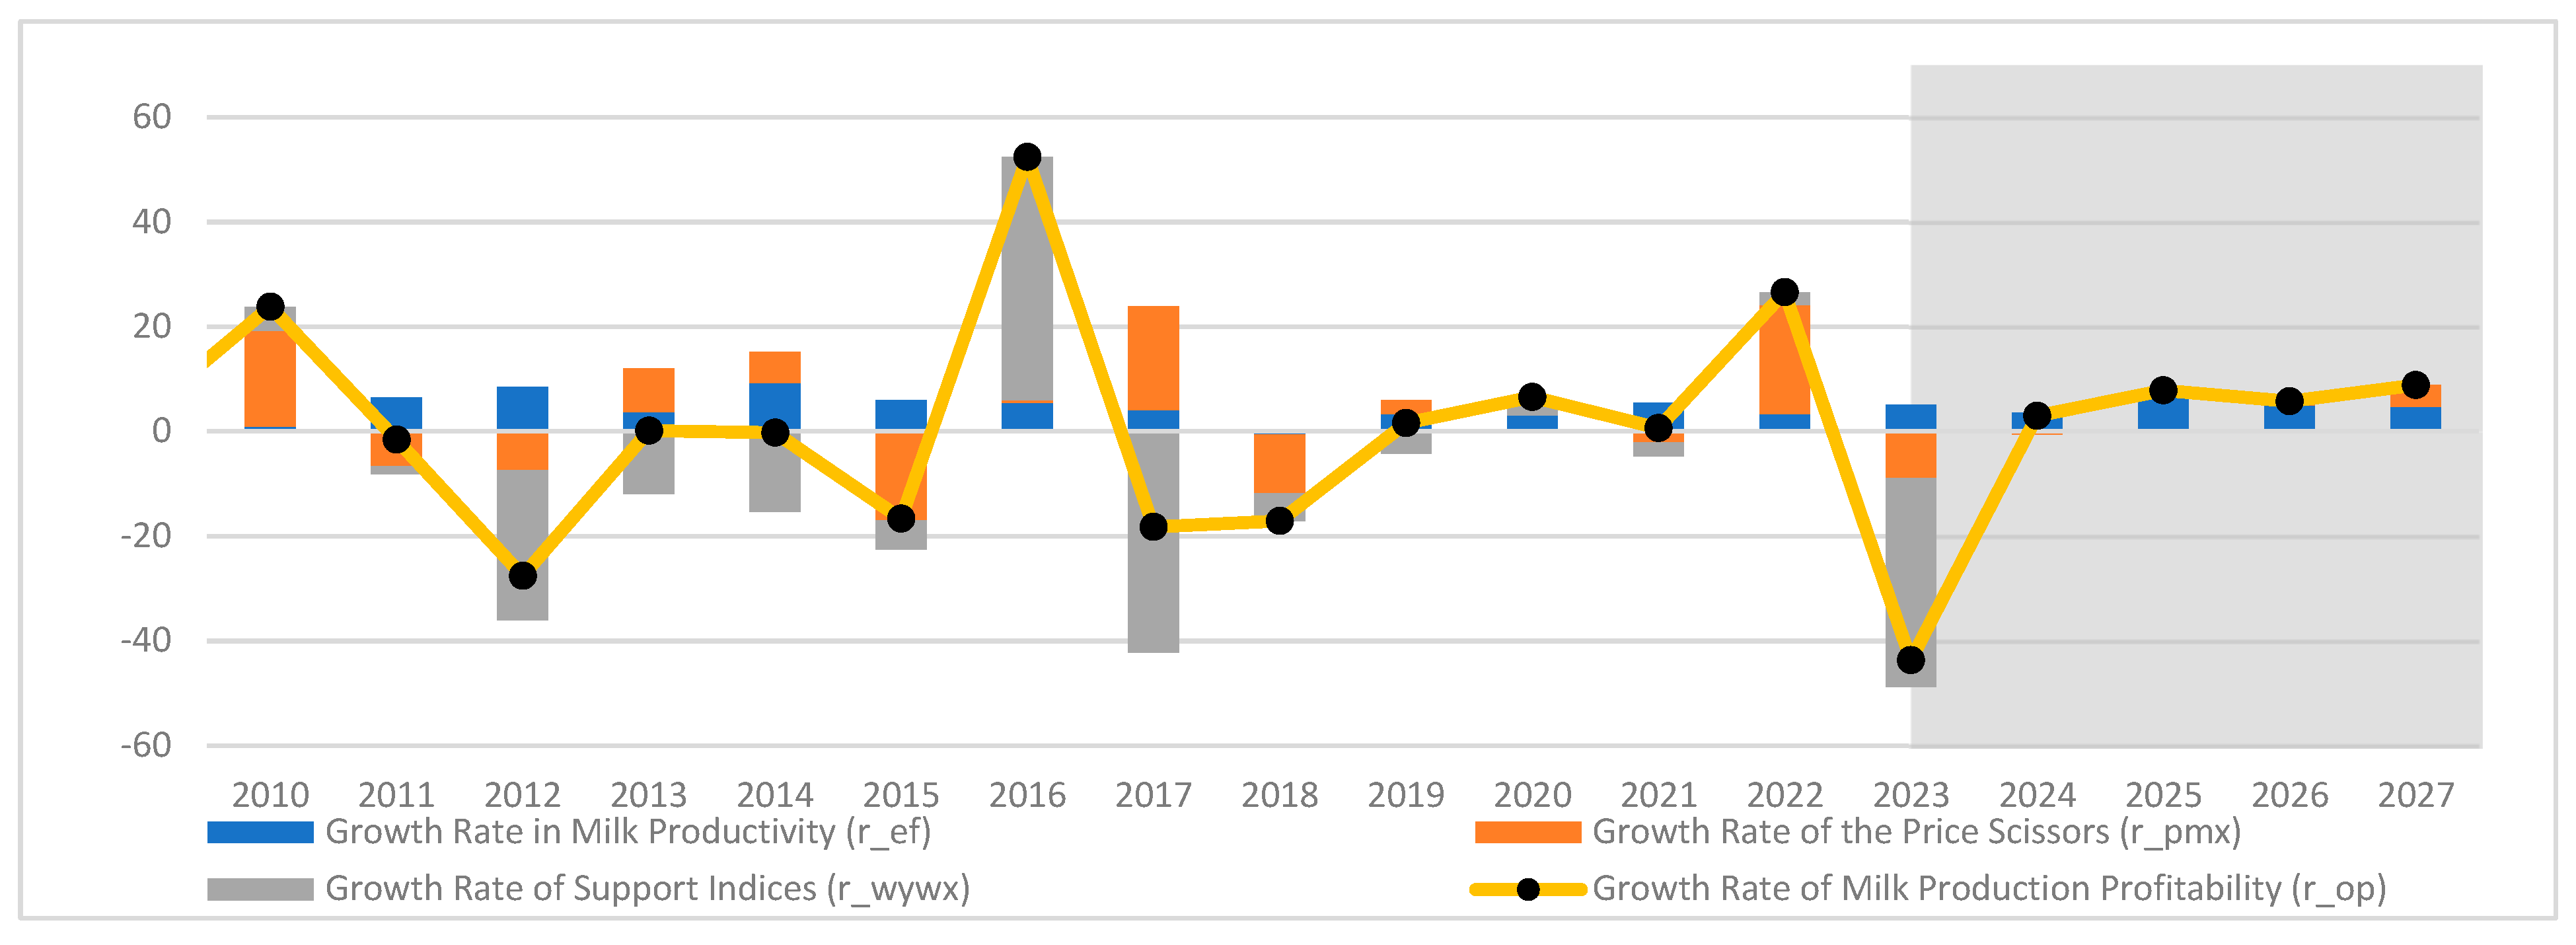
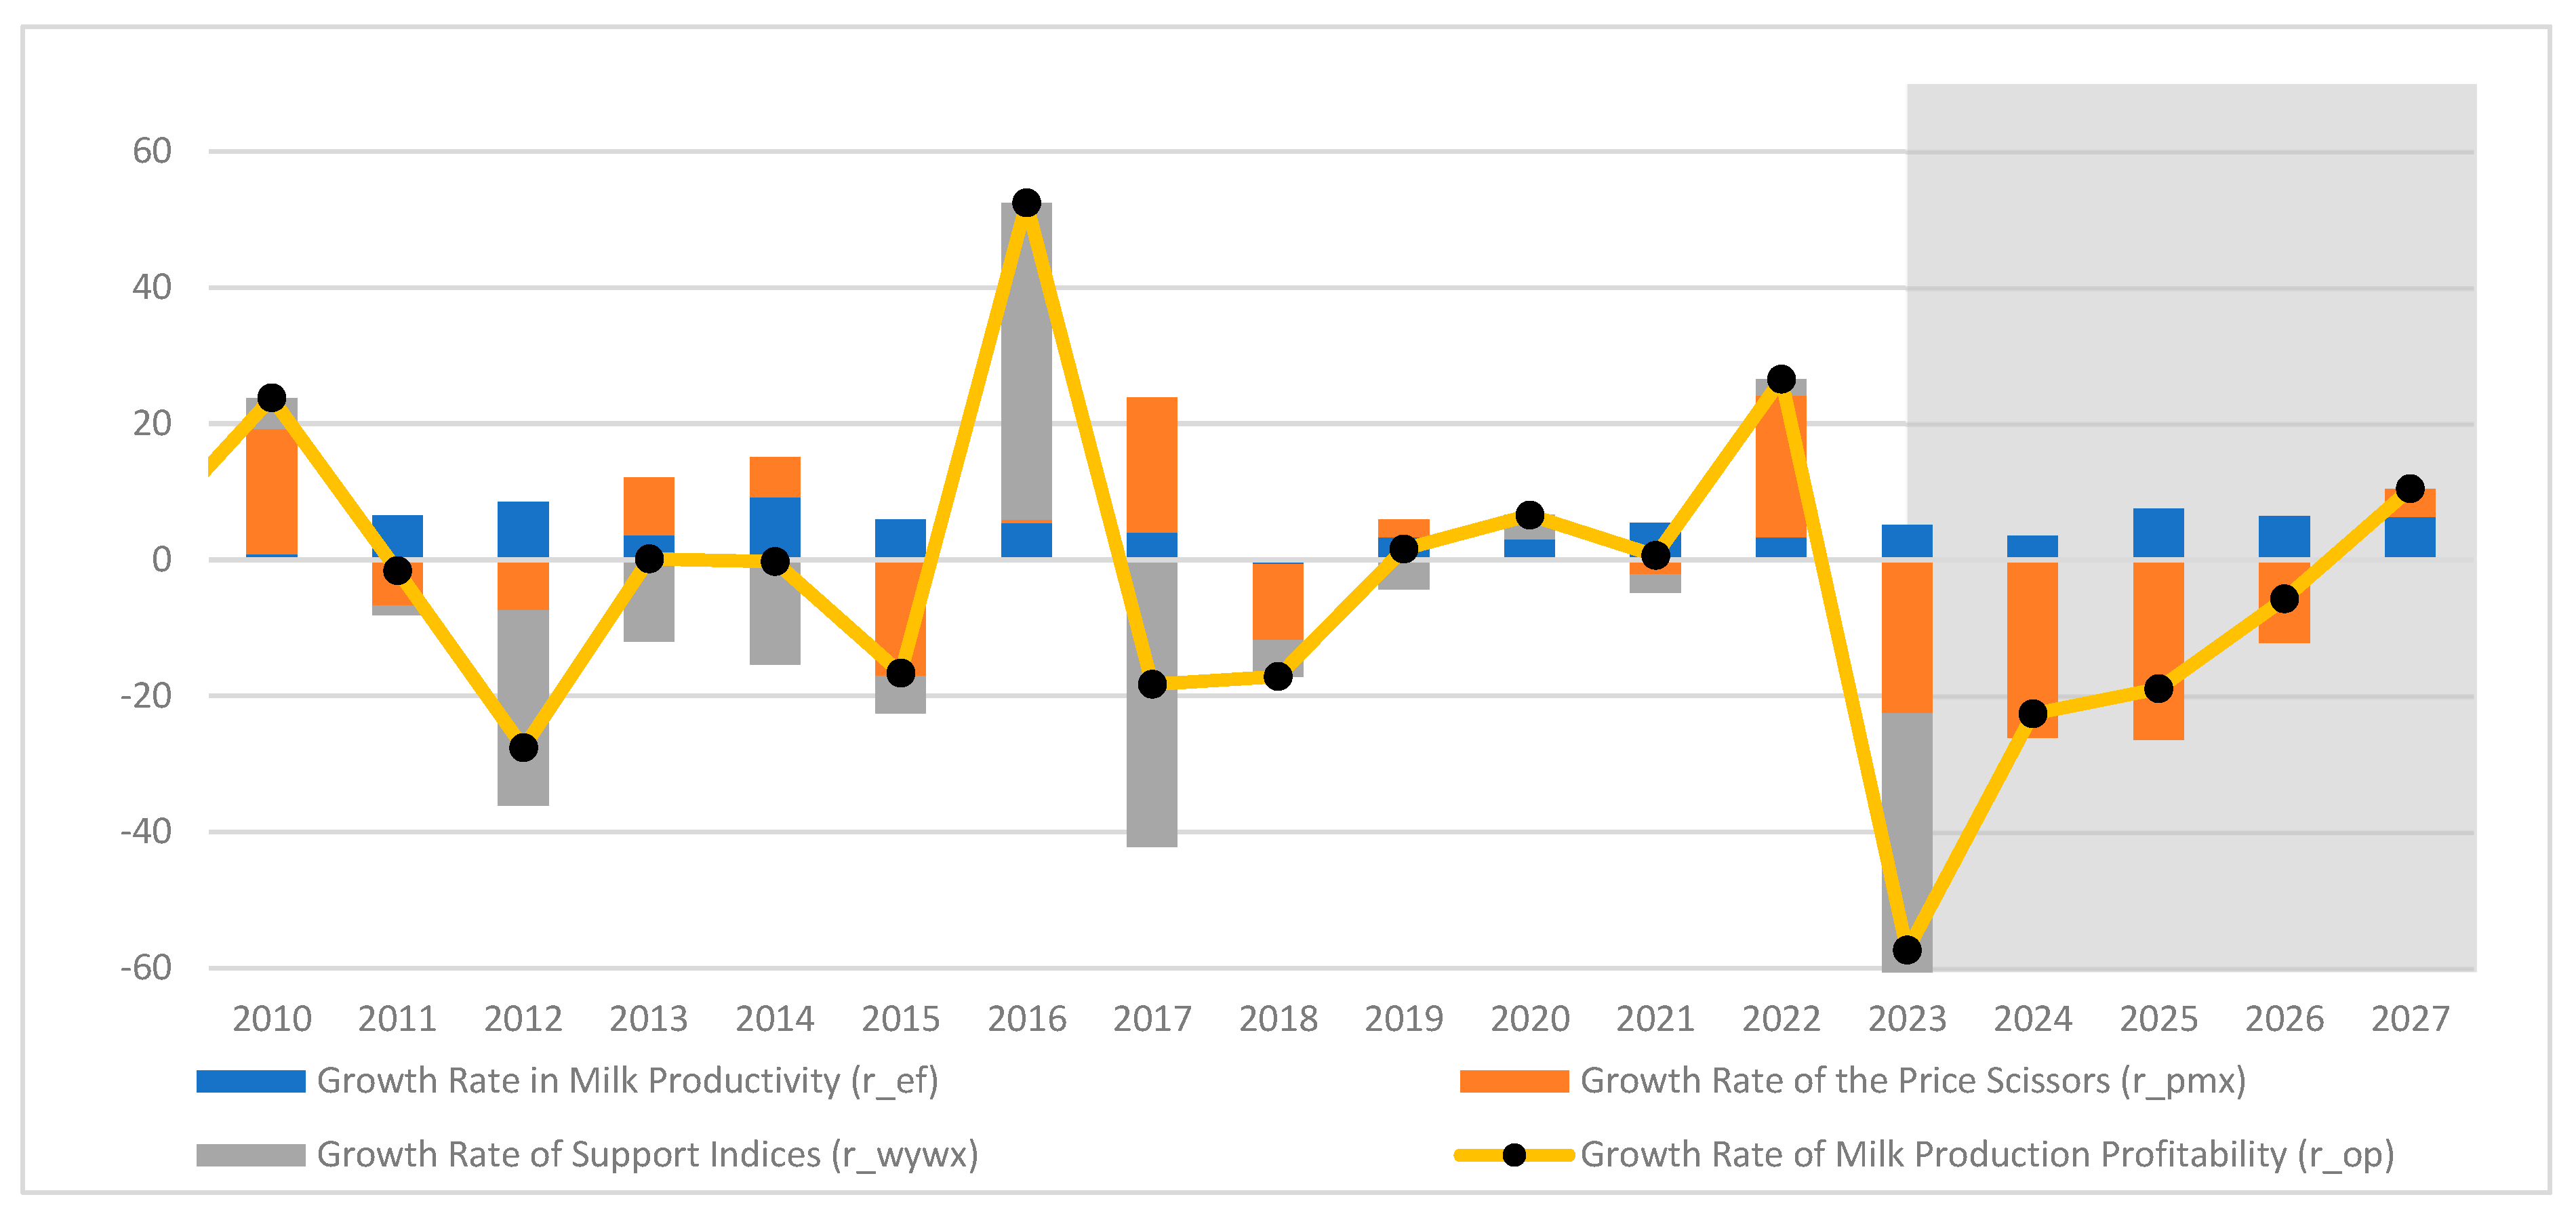
| see Equation (9) | (9) | Equation (9) is a simplified version of Equation (7), which shows that the dynamics of milk production profitability consist of the dynamics of milk yield efficiency (ef), the dynamics of the price scissors (p_mx), and the dynamics of the ratio of support indices (wywx). |
| (10) | The econometric equation reflects the relationship between milk production profitability in year t–2 and the size of the dairy herd in year t. The lag structure stems from the rigidity of milk supply—approximately two years are required for changes in profitability to be reflected in herd size. This equation introduces a recursive structure into the model, capturing the delayed supply-side adjustment characteristic of the dairy sector. | |
| (11) | The econometric equation reflects the relationship between milk production profitability in year t–2 and milk yield in year t. It can be expected that high profitability reduces the incentive for milk producers to improve productivity given the existing production apparatus. Together, Equations (10) and (11) enable the forecasting of milk supply volumes within the model framework. |
| Average Farm Gate Milk Price Received by Farmers (PLN/liter) | Cattle Feed Price (PLN/kg) | Aggregate Effect of Income Support Interventions | Aggregate Effect of Cost-Reduction Interventions | |
|---|---|---|---|---|
| p_m | p_x | w_y | w_x | |
| 2023 | 2.08 | 1.87 | 1 | 1 |
| 2024 | 2.13 | 1.47 | 1 | 1 |
| 2025 | 2.79 | 1.44 | 1 | 1 |
| 2026 | 3.48 | 1.57 | 1 | 1 |
| 2027 | 3.19 | 1.38 | 1 | 1 |
| Average Farm Gate Milk Price Received by Farmers (PLN/liter) | Cattle Feed Price (PLN/kg) | Aggregate Effect of Income Support Interventions | Aggregate Effect of Cost-Reduction Interventions | |
|---|---|---|---|---|
| p_m | p_x | w_y | w_x | |
| 2023 | 1.72 | 2.13 | 1 | 1 |
| 2024 | 1.27 | 2.13 | 1 | 1 |
| 2025 | 1.21 | 2.76 | 1 | 1 |
| 2026 | 1.32 | 3.43 | 1 | 1 |
| 2027 | 1.21 | 3.02 | 1 | 1 |
Disclaimer/Publisher’s Note: The statements, opinions and data contained in all publications are solely those of the individual author(s) and contributor(s) and not of MDPI and/or the editor(s). MDPI and/or the editor(s) disclaim responsibility for any injury to people or property resulting from any ideas, methods, instructions or products referred to in the content. |
© 2025 by the authors. Licensee MDPI, Basel, Switzerland. This article is an open access article distributed under the terms and conditions of the Creative Commons Attribution (CC BY) license (https://creativecommons.org/licenses/by/4.0/).
Share and Cite
Bezat-Jarzębowska, A.; Rembisz, W. Modeling the Profitability of Milk Production—A Simulation Approach. Agriculture 2025, 15, 1409. https://doi.org/10.3390/agriculture15131409
Bezat-Jarzębowska A, Rembisz W. Modeling the Profitability of Milk Production—A Simulation Approach. Agriculture. 2025; 15(13):1409. https://doi.org/10.3390/agriculture15131409
Chicago/Turabian StyleBezat-Jarzębowska, Agnieszka, and Włodzimierz Rembisz. 2025. "Modeling the Profitability of Milk Production—A Simulation Approach" Agriculture 15, no. 13: 1409. https://doi.org/10.3390/agriculture15131409
APA StyleBezat-Jarzębowska, A., & Rembisz, W. (2025). Modeling the Profitability of Milk Production—A Simulation Approach. Agriculture, 15(13), 1409. https://doi.org/10.3390/agriculture15131409