1. Introduction
Strawberry production in warm-temperate climates has become very important. In Italy, production areas with such a type of climate contribute to 65% of the national strawberry production, approximately 4100 hectares. Strawberry production is increasing steadily in southern Italy, where the Basilicata and Campania regions contribute to 52% of total Italian production [
1].
Strawberry growth is influenced by various environmental and physiological factors, such as, for example, light intensity and quality, photoperiod, temperature, and soil moisture. Such factors have a direct impact on overall yield, growth and fruit quality [
2,
3]. However, the response of different genotypes can differ significantly, depending on specific conditions and the growth environment [
4,
5,
6,
7]. The temperature is a critical factor that triggers important physiological processes such as flowering [
7]. The optimal temperature for strawberry growth ranges between 10 and 26 °C. This finding is supported by research conducted by Ledesma et al. [
8], which is aligned with the results obtained by Verheul et al. [
9] that suggest 18 and 12 °C as optimal daytime and nighttime temperatures, respectively.
The critical temperatures (base temperature) at which strawberry plants stop growing have been widely studied and reported [
10]. The base temperature for canopy growth and development in a strawberry crop is 10 °C [
11], while for leaves and crown development, it is 7 °C [
12,
13,
14].
Recent studies indicate that many phenomena deriving from climate change, such as increasing average temperatures, variations in precipitation regime, and rising atmospheric CO
2 concentrations, can alter the strawberry crop cycle, affecting both the quantity and quality of production [
15]. Therefore, developing resistant and adaptable cultivars is essential to mitigate the negative effects of climate change and support long-term agricultural productivity [
3,
16].
The plasticity of the plant allows the cultivation of strawberries in all growing environments, from cold-temperate to subtropical climates, and enables it to adapt to different cultivation systems (open field, protected, soilless), but for each specific condition, it is important to identify new varieties with greater adaptability, guaranteeing the best productive and qualitative results [
17]. The main distinction between strawberry cultivars concerns their adaptability to different climatic conditions, particularly the adaptability of the short-day cultivars, still the most widespread, to cold, warm-temperate, or subtropical climates, a characteristic mainly associated with their chilling requirement.
Strawberry cultivars that have adapted to specific climatic conditions are now challenged by climate change, necessitating the adaptation of existing cultivars or the development of new varieties suited to these changing conditions [
15].
In protected cultivation, microclimate control and monitoring relative air humidity, temperature, and vapor pressure deficit are important for optimizing strawberry cultivation, especially in the southern Italy area. Humidity can affect plant transpiration and gas exchange by affecting stomatal opening [
18,
19].
Monitoring the organoleptic characteristics of strawberries, such as taste, texture, and aroma, is also crucial in evaluating the response of different cultivars to varying environmental conditions. These characteristics are significant for consumer acceptance and marketability [
20]. In addition to these sensory attributes, it is essential to also assess other strawberry quality attributes, such as color, texture and sugar content, for monitoring and ensuring a consistent and satisfying quality [
15].
Due to the economic importance of strawberry production in Italy, it is advantageous to select new cultivars offering greater resistance to adverse climatic conditions in the Mediterranean area while ensuring high fruit quality and a stable production [
15]. Moreover, the integration of sensor technology and rigorous monitoring of fruit quality characteristics can lead to the development of strawberry cultivars that are both resilient and highly marketable. These advancements are essential for maintaining sustainable strawberry production amidst climate change, securing economic viability, and satisfying consumer demand.
Therefore, the aim of our study was to evaluate the quanti-qualitative response of three advanced strawberry breeding selections, derived from intraspecific crosses, against five commercial cultivars adapted to temperate Mediterranean-warm climates and grown under protected organic cultivation.
2. Materials and Methods
2.1. Growing Location
This research was carried out from October 2022 to July 2023 at Montella Bio (Frignano-Caserta, Italy) organic farm, in a cold greenhouse at a latitude of 41°1′10.93 N–14°10′41.44 E, at 60 m a.s.l. The area is characterized by a Mediterranean, hot summer climate (Köppen classification: Csa). The greenhouse of 720 m2 (8 m wide and 90 m long, 3.50 m high at the eaves and 6.50 m high at the top of the ridge) consisted of a metal structure covered with a diffusive plastic. It was equipped with manual openings at the side and at the eaves.
Soil was analyzed for texture, organic matter and total nitrogen, pH, electrical conductivity (EC), and cation exchange capacity (CEC) on 25 November 2023, according to the Italian Society of Soil Science (SISS) [
21]. Soil hydraulic properties, such as saturation water capacity (WS), soil moisture at field capacity (FC), wilting point (WP), available water holding content (AWHC) and saturated hydraulic conductivity (SHC), were estimated based on texture and organic matter content using pedotransfer functions according to Saxton and Rawls [
22].
Table 1 shows chemical, physical and hydraulic characteristics of the soil used to grow the plants used in the experiment. Soil texture was classified as silty-sandy and resulted in slightly alkaline and non-saline. Although the carbon and nitrogen contents as well as the CEC were relatively low, they were adequate for growing the selected strawberry cultivars. The C/N ratio indicated a predominance of mineralization processes, favoring the release of nutrients such as nitrogen (N), phosphorus (P), and sulfur (S).
The soil showed good hydraulic properties with a satisfying SHC of 17 mm h−1, due to an abundant and effective macroporosity resulted from the high sand content. While the sand component limited the water retention, leading to a field capacity of only 24%, the soil organic matter compensated for this aspect, contributing to a slight enhancement of this value.
2.2. Environmental Monitoring
Environmental conditions were monitored inside and outside the greenhouse. An FL NODE (Rossi Instruments s.r.l.s., Scandicci-Florence, Italy) was equipped with sensors to detect climatic parameters, such as a thermo-hygrometer with shielding slats, a pluviometer, a solarimeter, and a weathervane anemometer powered by a solar panel that was placed outside the greenhouse. To measure the temperature and humidity gradient inside the greenhouse, three thermo-hygrometers (FL SENS, Rossi instruments s.r.l.s., Scandicci-Florence, Italy) were installed in the central part of the greenhouse, at plant height and at 1.5 and 3.1 m from the bed. Sensors were installed on 18 November 2023 and were connected by a multi-channel data logger. Climatic data (average hourly temperature) were monitored to obtain growing degree hours (GDH 10 °C–32 °C). A linear modification of the model initially proposed by Richardson et al. [
23] for peach was used, since weighted models are not widely applied for strawberries [
24]. The model was adapted to strawberry using a base temperature of 10 °C and an upper limit of 32 °C. One GDH was defined as 1 h at a temperature 1 °C above the base temperature. All temperatures above 32 °C and below 10 °C were assumed equal to 0 °C.
Thus, GDH was calculated according to the following Equation (1) and accumulated from planting at the peak and end.
where the Tmdh was the hour average temperature (10 °C ≤ Tmdh ≤ 32 °C).
2.3. Plant Material and Experimental Design
Three new advanced strawberry breeding selections, AN15,07,53, AN16,53,54 and AN12,44,60 derived from the public breeding program carried out at the Marche Polytechnic University (UNIVPM), and five commercial cultivars, Dina, Arwen, Melissa, Marimbella, and Elide, were evaluated in the study. Strawberry bare-root plants of Dina, Melissa, Elide, AN15,07,53, AN16,53,54 and AN12,44,60 were obtained from a Spanish nursery, while Arwen and Marimbella from a Polish nursery.
The experimental design featured a randomized block design, four repetitions of 60 strawberry plants per cultivar (4 repetitions per 60 plants per cultivar) totaled 240 plants planted on 20 October 2023, in a double-row configuration. A total of 4 beds (48 m long, 0.25 m high, and 1.70 m wide). The space between rows was 35 cm, and the space between plants in each row was 20 cm (10 plants m
−2). The beds were covered with a single black plastic sheet to prevent weeds from growing and to reduce heat dissipation and water evaporation. Fertilization and irrigation regimes were the same for all beds throughout the experimental period. Fertilization consisted of root distribution of LYSOFERT
® (Biogard Division, Grassobbio-Bergamo, Italy) and MAX ORGANIC (Agrinova Science, Almería, Spain) fertilizers, both organic nitrogen fertilizers but of animal and plant origin, respectively. These were applied alternately about every 10 days starting after 15 days of transplanting. LYSOFERT
® was applied at a dosage of 4 kg/ha and MAX ORGANIC at 70 L/ha. At the transplanting stage, mycorrhizal fungi were distributed, containing microflora composed mainly of
Trichoderma spp. Irrigation, corresponding to daily restitution of crop evapotranspiration (ETc), was provided by a drip system with two lines per bed placed under plastic at a flow rate of 1 L/h. ETc was calculated according to Penman-Monteith method [
25], using a basal crop coefficient for the initial, mid, and end of season periods of 0.30, 0.80, and 0.70 [
25], respectively.
Disease management followed an organic protocol based on the use of natural antagonists by means of releases of the predators Orius laevigatus to control thrips of the genus Frankliniella spp., Phytoseiulus persimilis against the red spider mite Tetranychus urticae, and Chrysoperla carnea.
2.4. Leaf Stomatal Conductance and Chlorophyll Content
Physiological parameters were taken on fully expanded and well-exposed leaves. Stomatal conductance was measured on 3 plants × 2 leaves × 3 repetitions from 12 am to 2 pm (13 and 25 January, 8 and 20 February, 29 March, 26 April, and 12 June) using a portable automatic diffusion porometer (Delta-T AP4, Delta-T Devices, Cambridge, UK). The time interval was chosen because stomatal conductance is an extremely sensitive parameter to environmental changes [
26].
Chlorophyll content was measured between 12 and 2 pm on the leaves of 3 plants × 2 leaves × 3 replications after 86, 97, and 111 days after planting (14 and 25 January and 8 February), using an SPAD-502 (Soil Plant Analysis Division, Konica Minolta, Tokyo, Japan) chlorophyll meter.
2.5. Yield
Harvesting started 111 days after planting (dap) and ended 258 dap. The entire production was harvested for a total of 18 harvests (18 harvests × 8 cultivars x 60 plants × 4 repetitions).
For each harvest, the total amount of fruit was weighed using a precision balance (0.000 g), recording the total fresh weight. From the total fresh weight, fruits showing rot or insect damage and undersized were detected and weighed, identifying the discard, and by difference, from the total fresh weight, the commercial yield was obtained.
On three harvests (out of 18 harvests total), 5 randomly selected fruits per cultivar were used to calculate mean fruit weight (3 harvests per 5 fruits per 4 repetitions).
2.6. Fruit Quality
Fruit surface color, firmness, soluble solids content (SSC), titratable acidity (TA), and total anthocyanin content (ANT) of healthy fruits were measured on fruit harvested at optimal ripening level. Fruit surface color, firmness, and SSC were measured on 5 randomly selected fruits (3 harvests per 8 cultivars per 5 fruits per 4 repetitions), while TA and ANT were measured on 3 randomly fruits selected. Measurements were carried out from February to April 2023.
Fruit surface color was measured using a colorimeter (Chroma Meter CR-200; Minolta, Milan, Italy) and expressed according to the CIELab 1976 color scale coordinates, where L* = lightness (dark to light), a* = redness/greenness [green (−) to red (+)], and b* = yellowness/blueness [blue (−) to yellow (+)]. Chromatic colors (a* and b*) are described using the two axes in the horizontal plane. Fruit firmness was measured using a penetrometer (T.R. Turoni srl, Forli, Italy) equipped with a 6 mm “star” plunger specifically designed for strawberries (model 53207, Turoni, Forlì, Italy). SSC was measured using a handled refractometer (Rondi company s.r.l., Como, Italy). TA was measured by titrating strawberry extracts with an alkaline solution; samples were combined, shacked, and homogenized to obtain a juice that was then filtered under vacuum (Whatman 41 cellulose acetate filters with 20 μm pores). The filtrate (2 mL) was diluted with 98 mL of deionized water and added with 5 drops of phenolphthalein, serving as a pH indicator. The titration was carried out with a 0.025 M NaOH solution under magnetic stirring; three replicates were analyzed for each cv. The results were expressed as citric acid equivalents (g/L).
ANT was measured using the method described by Qaderi et al. [
27] and Taghavi et al. [
28]. For each cultivar, 20 g of fresh material were sampled from 3 different replicates, pooled together, and mixed in a blender until the complete crushing of the material. Subsequently, 5 g of strawberry puree was extracted with 10 mL of a methanol/water/HCl (15:10:0.15
v/
v) solution. Immediately after the addition of the extraction solution, the suspension was sonicated with an ultrasonic sonicator (DU-32 Digital; Argo Lab, Carpi, MO, Italy) for 5 min at 30 °C. Then, the extraction was conducted on a magnetic plate for 24 h at a temperature of 4 °C and in the absence of light. The supernatant was isolated by centrifugation for 10 min at a speed of 6000 rpm. Finally, 0.5 mL of extract was analyzed through a VIS spectrophotometer (Genesys™ 10S UV-VIS, Waltham, MA, USA) at 530 nm. The results were quantified against a calibration curve for cyanidin 3-O-arabinoside, acting as a model anthocyaninin (R
2 = 0.99). The results were expressed in mg of cyanidin equivalents per 100 g of dry weight (d.w.).
2.7. Statistical Analysis
The experimental data were analyzed by R Studio software version 1.4.1103.0 (PBC, Boston, MA, USA). Homogeneity of variance and normality were tested by the Bartlett and Shapiro tests, respectively (p = 0.05). Where the hypothesis of normality/homogeneity was rejected, the Kruskal-Wallis non-parametric test was used to assess the significance of differences (p = 0.05). For all other variables, one-way ANOVA (p = 0.05) was performed, followed by Tukey’s post hoc test to find significant differences between genotypes (p = 0.05). Principal Component Analysis was performed by JMP® software, version 18.1.1, using as variables genotypes, fruit quality parameters, and yield, with the data standardization option, to highlight similarities in terms of yield and quality parameters among the tested genotypes.
3. Results
3.1. Environmental Conditions
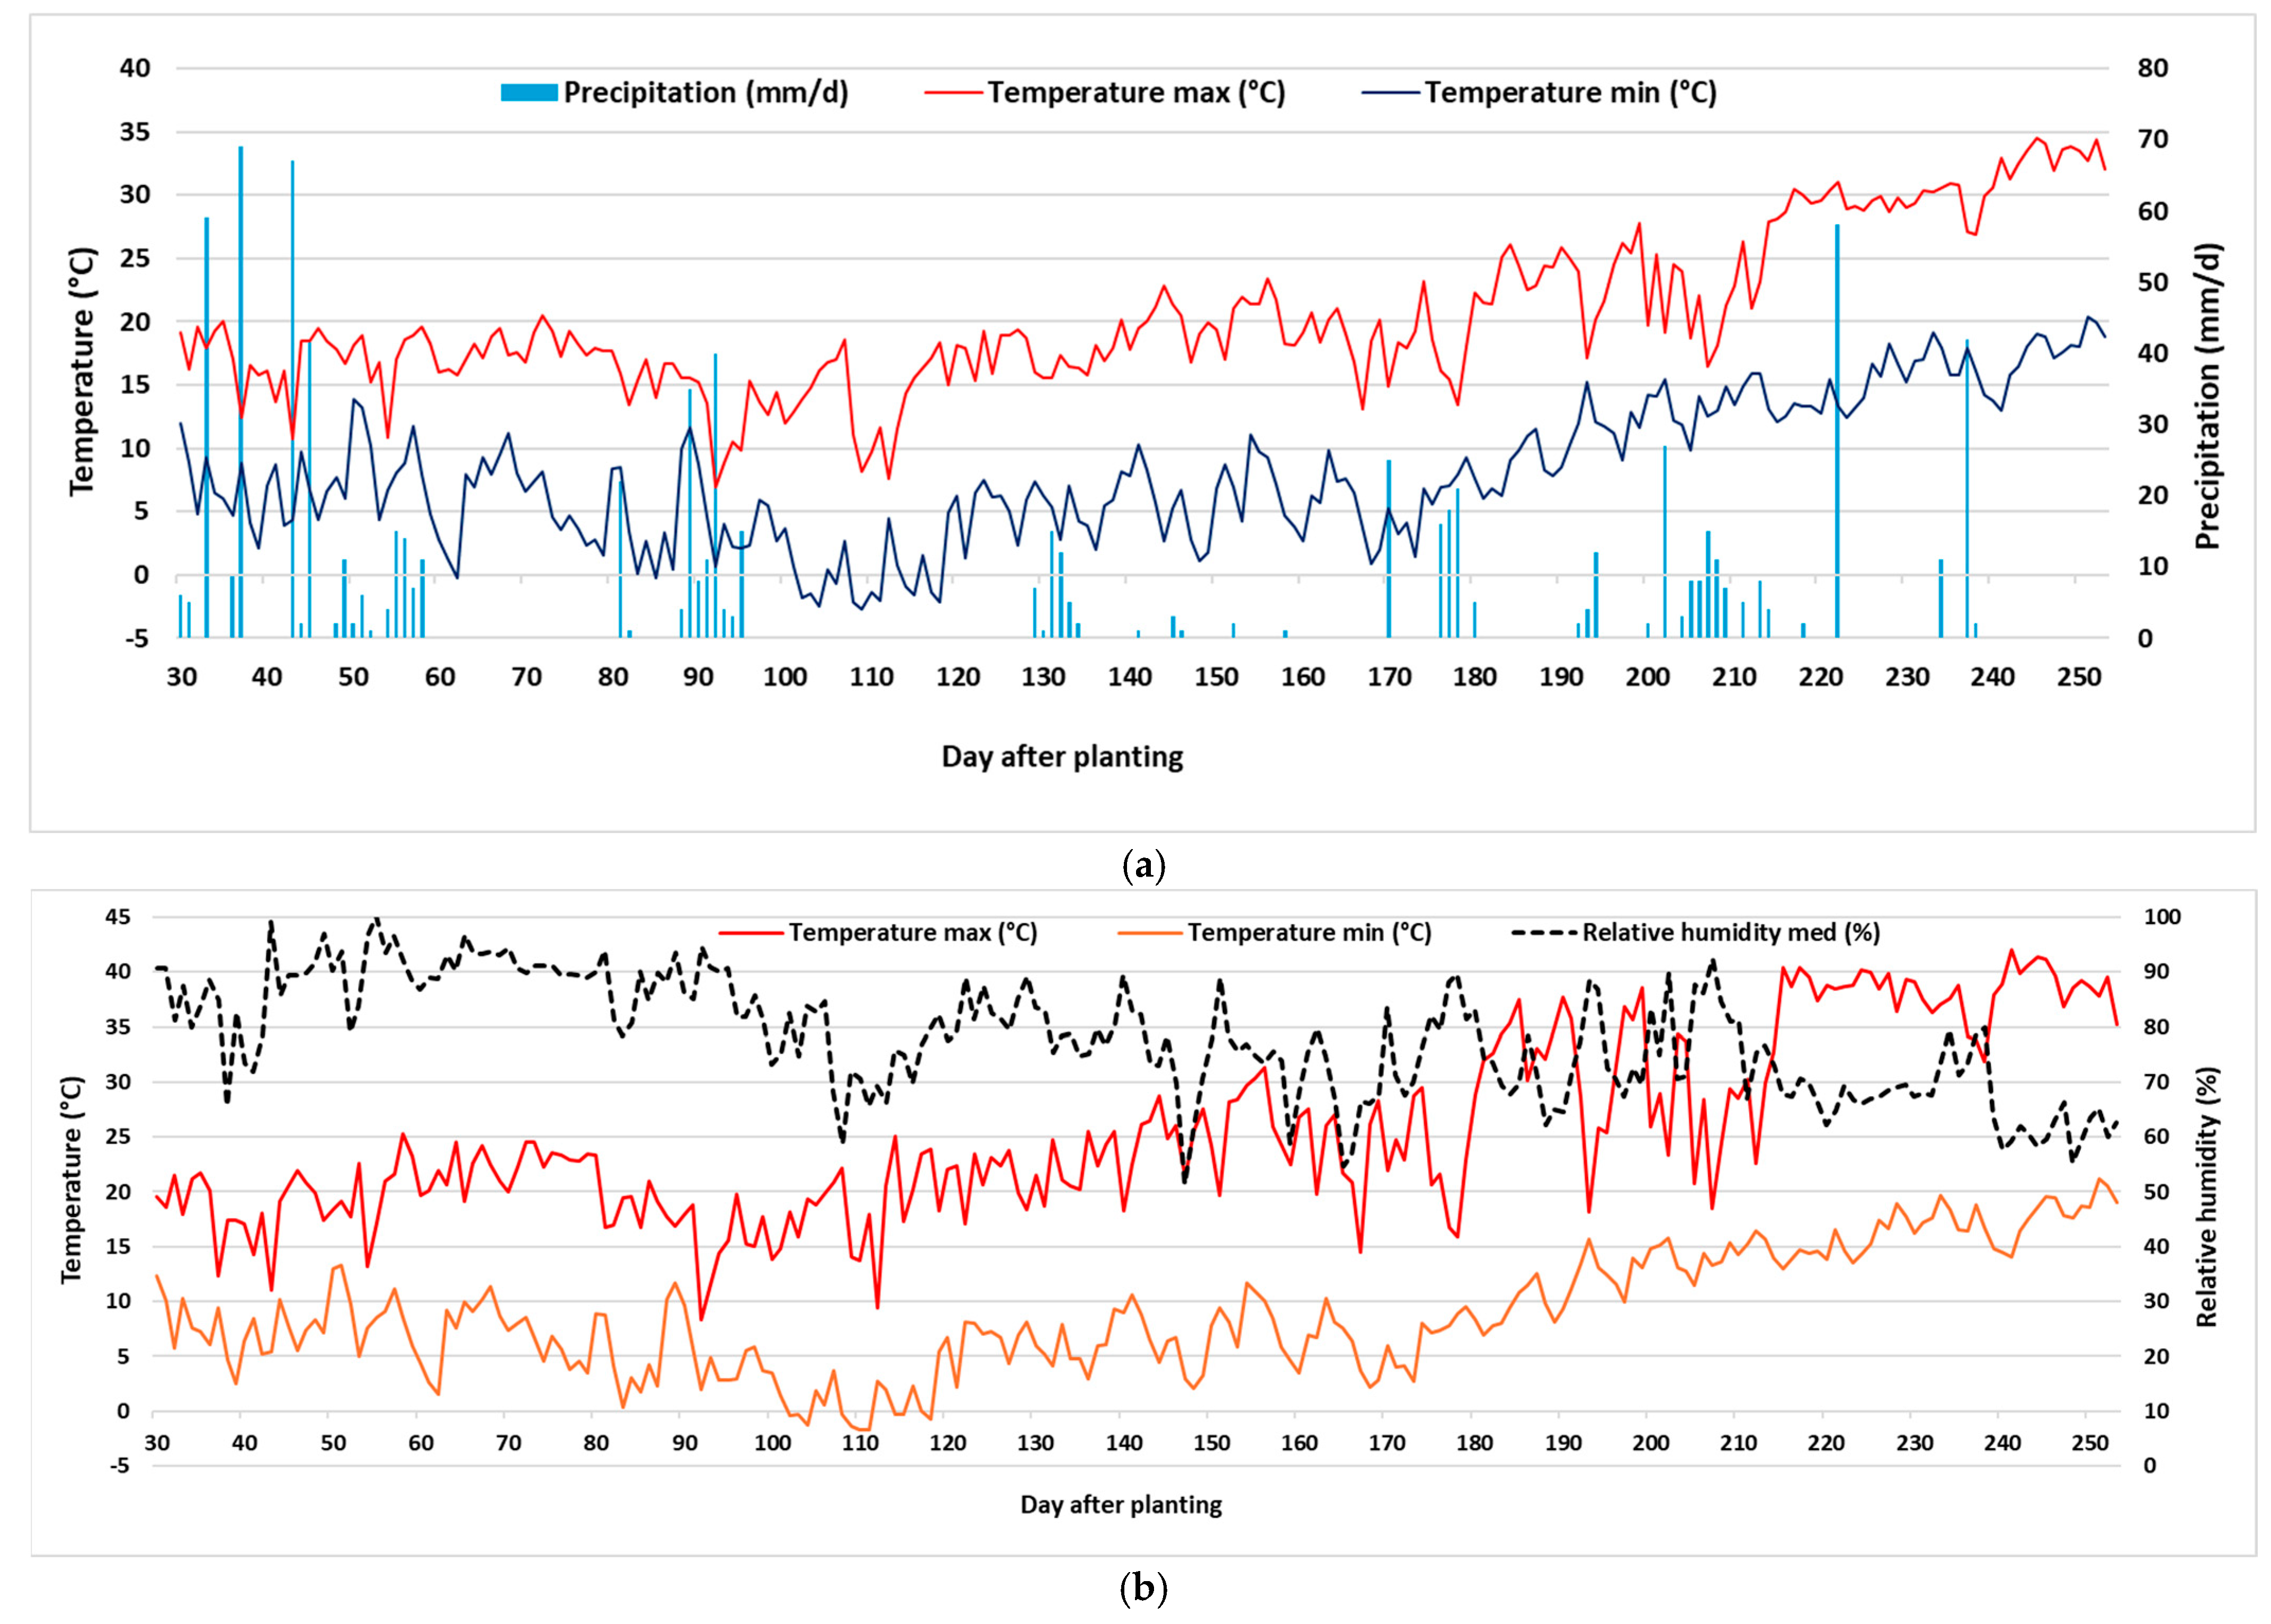
Figure 1a shows the temperature and precipitation from November 2022 to June 2023 outside the greenhouse during the strawberry cultivation season. The precipitation recorded during the period was 841 mm, with over half of the precipitation occurring from November to January (475 mm). Mean temperature over the period was 13.7 °C. The lowest temperatures were recorded between January and February (minimum of −2.7 °C), and the maximum was in June (34.6 °C).
Greenhouse microclimatic conditions (
Figure 1b) were characterized by high relative humidity throughout the strawberry season (75%), which contributed to the insurgence of fruit rot.
3.2. Growing Degree Hours
Cultivars started producing fruit with a warm requirement of 1850 Growing Degree Hours (GDH). Fruit production of commercial cultivars Arwen, Melissa, Marimbella, Elide, and the selection AN16,53,54 peaked with 4791 GDH value, before all the others, for which fruit production peaked at 5978 GDH while, all reached the end of production with 11,214 GDH.
3.3. Leaf Stomatal Conductance and Chlorophyll Content
Measurements of leaf stomatal conductance were only significantly different between some strawberry selections and cultivars from 123 dap (
Table 2). On 123 dap, Marimbella and Melissa showed the highest and lowest values of leaf stomatal conductance, respectively. On 160 dap, Dina, AN16,53,54, AN12,44,60 and Elide showed the highest mean values (0.301 to 0.324 mol H
2O m
−2 s
−1), while the lowest values were obtained for Arwen and Marimbella (0.214 to 0.216 H
2O m
−2 s
−1). On 188 dap, AN16,53,54 and Marimbella showed the highest mean values, and Elide showed the lowest. On 235 dap, Dina showed the highest values (0.596 mol H
2O m
−2 s
−1), whereas the lowest values were obtained for AN15,07,53, Arwen, Marimbella, and Elide values (0.142 to 0.222 H
2O m
−2 s
−1).
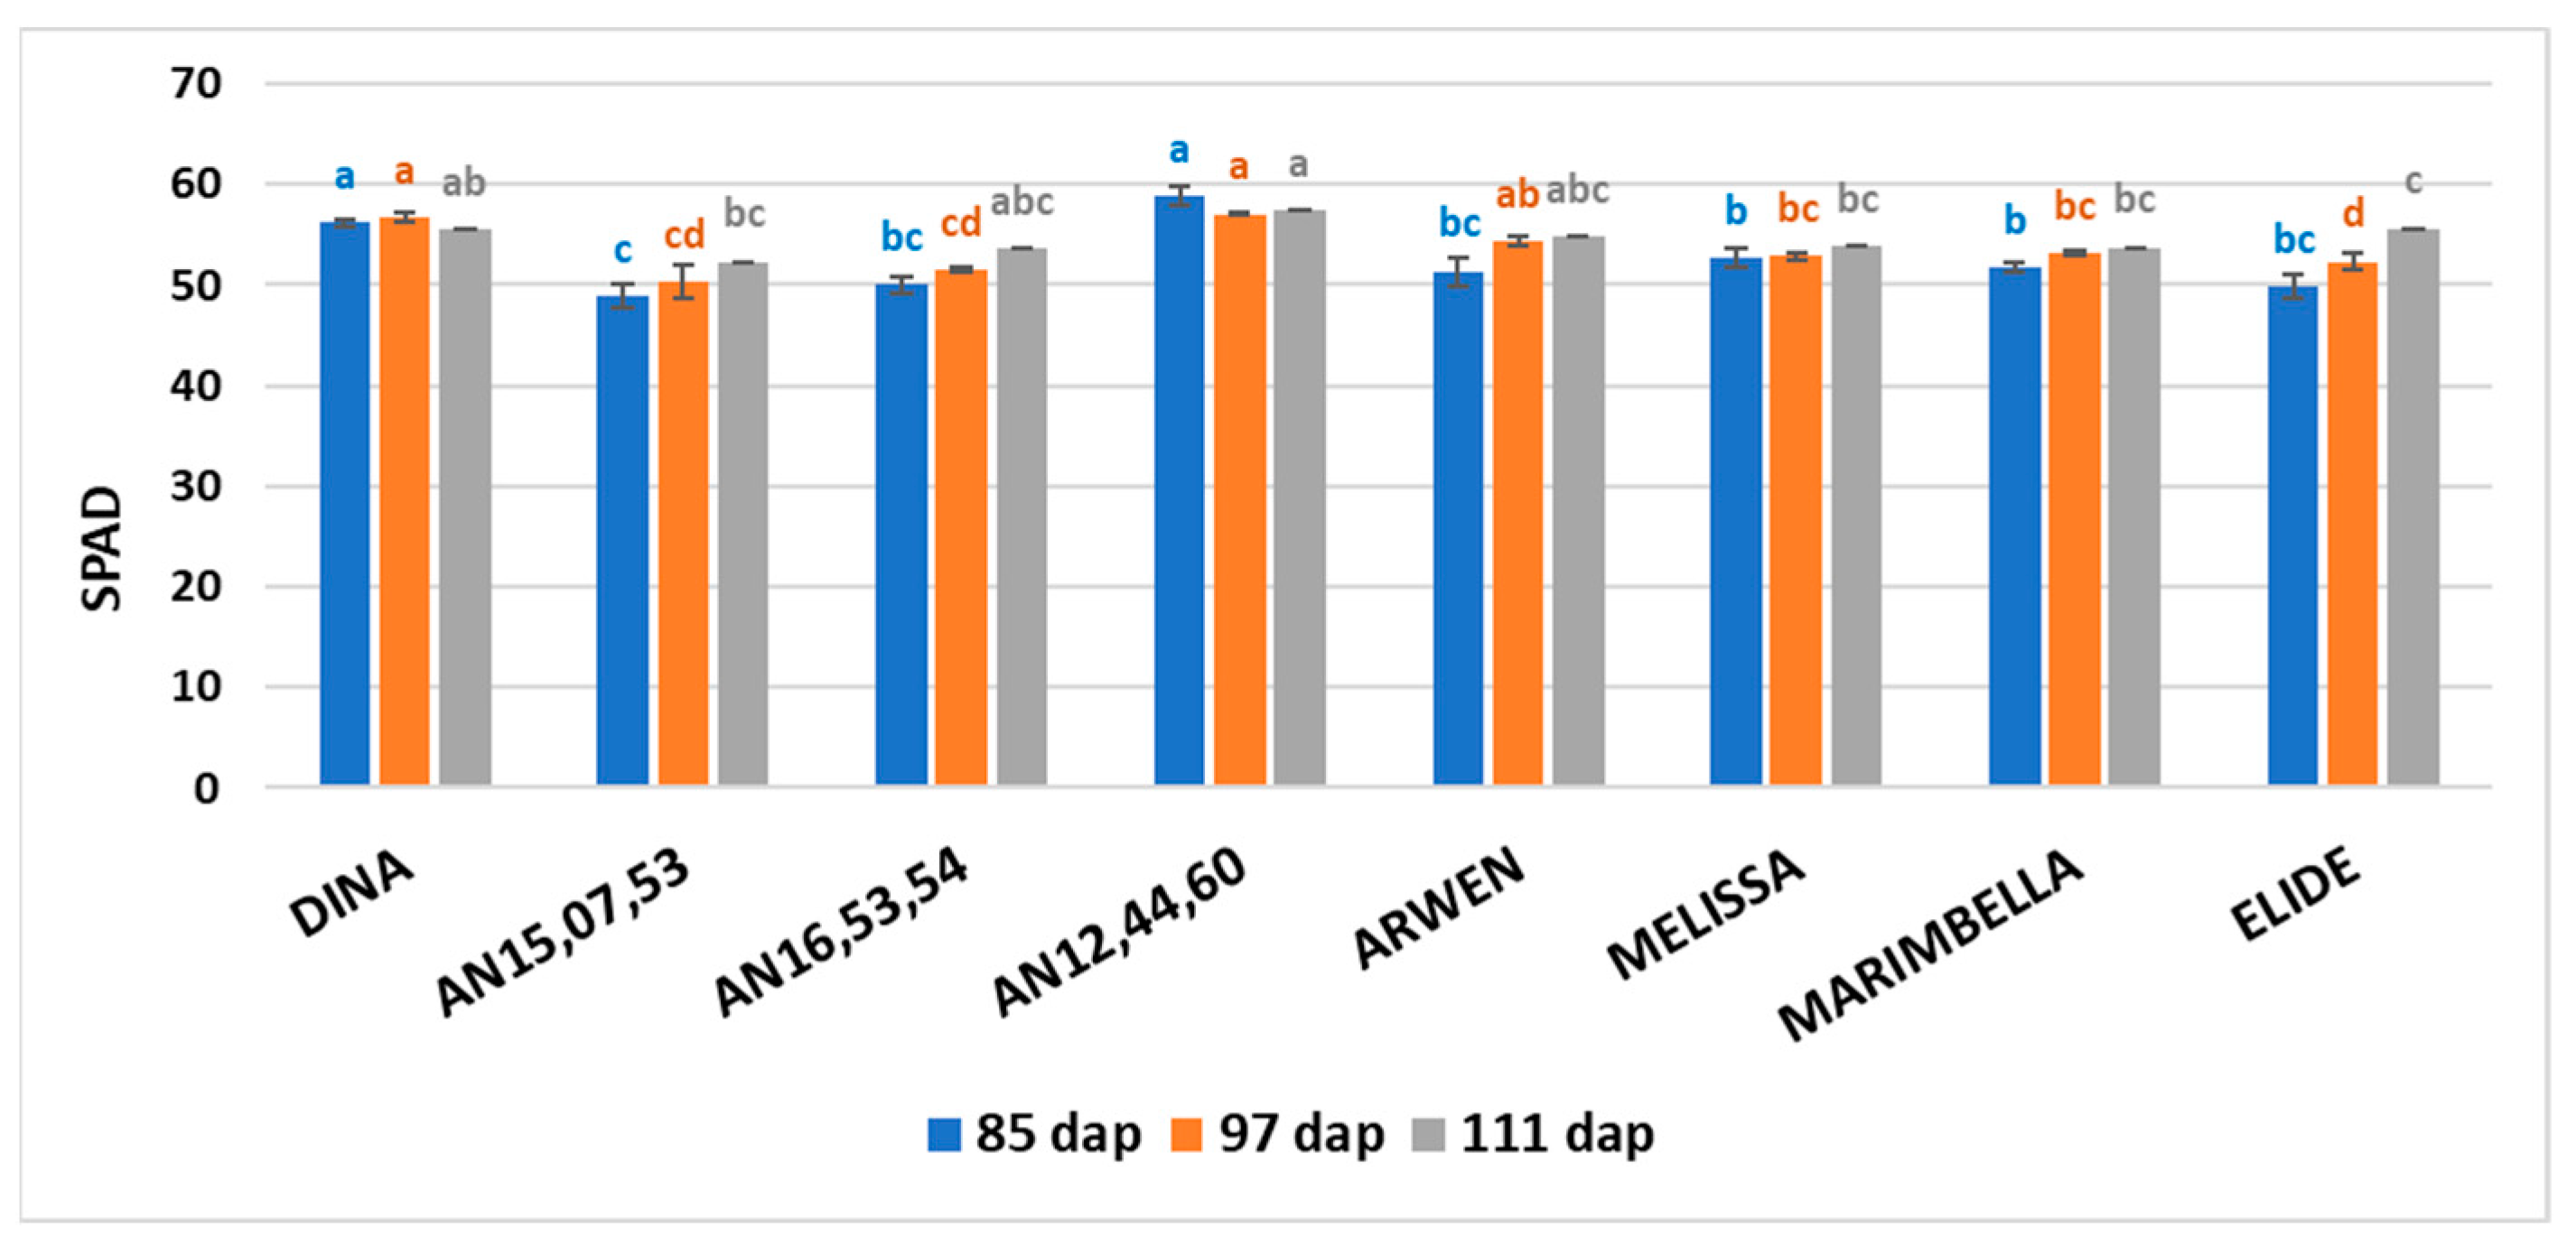
The SPAD mean values on 85, 97, and 111 dap are shown in
Figure 2. On 85 dap, Dina and AN12,44,60 showed the highest mean values (56.15 and 58.88, respectively), statistically different from other genotypes. Also on 97 dap, Dina and AN12,44,60 showed the highest mean values (56.73 and 57.07, respectively), statistically different from other genotypes except for Arwen. On 111 dap, AN12,44,60 only showed the highest mean value (57.36), statistically different from AN15,07,53, Melissa, Marimbella, and Elide.
3.4. Yield
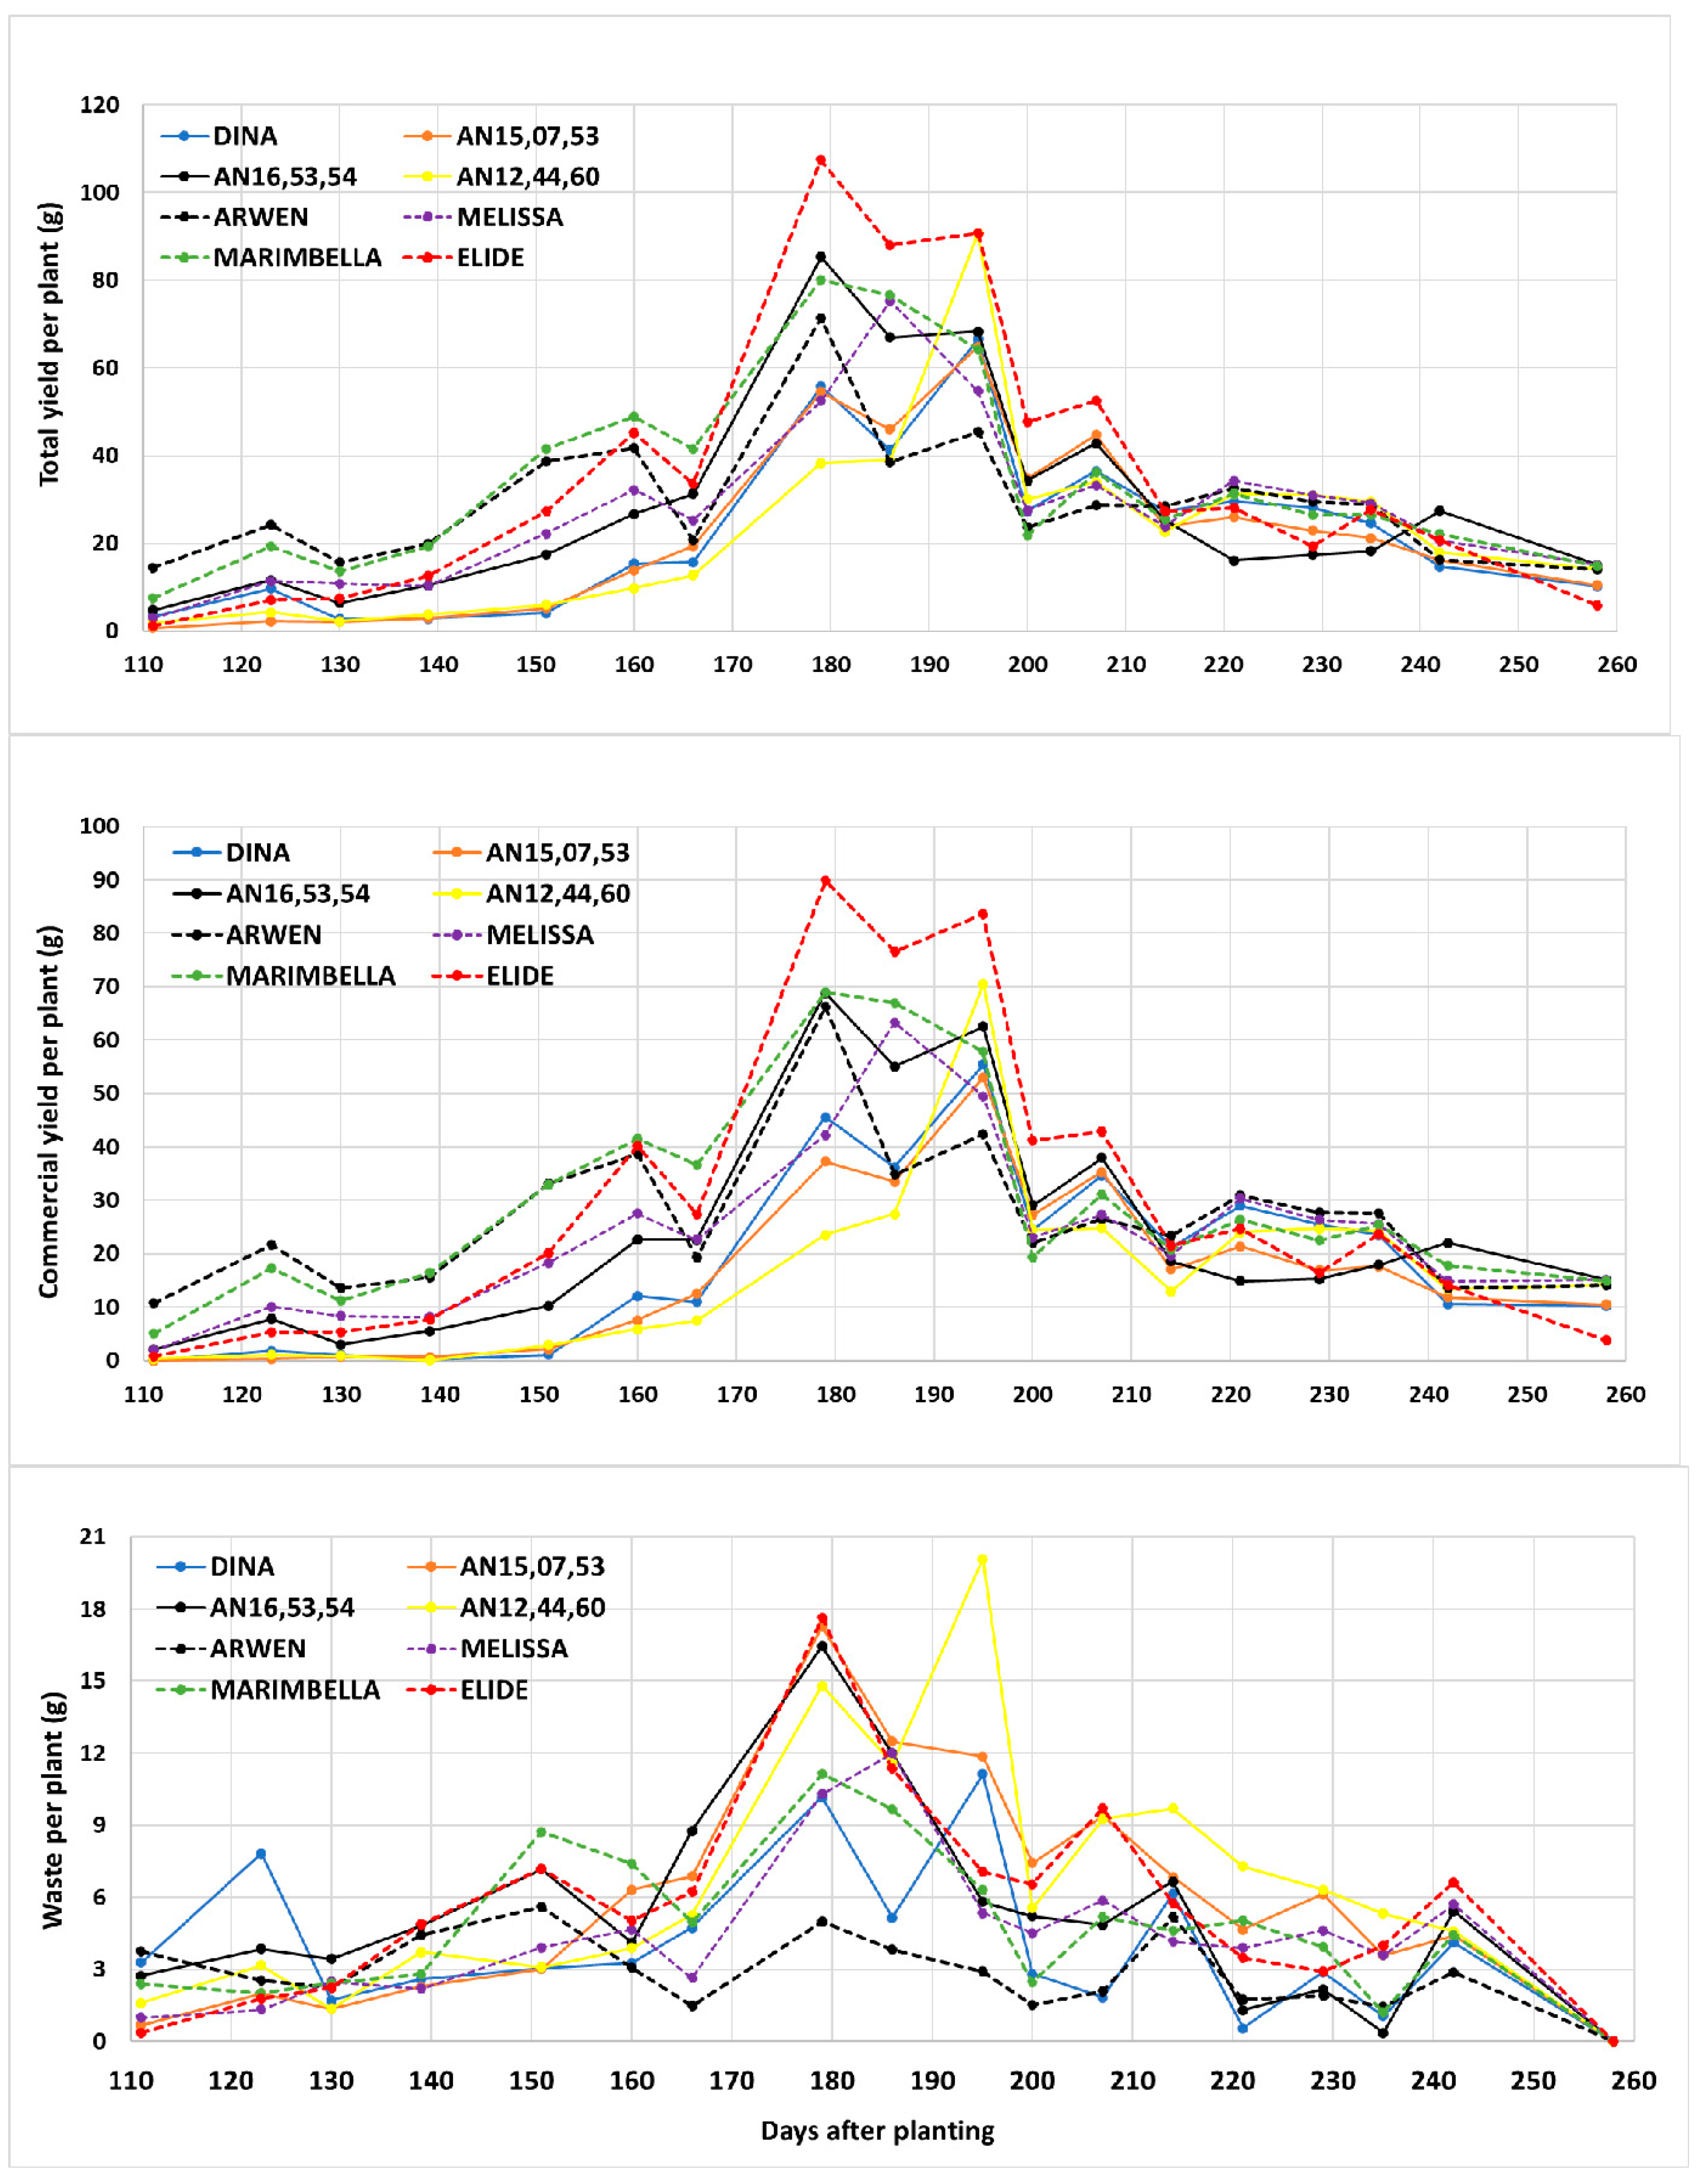
Figure 3 shows total and commercial yield and discarded fruit per plant during the period from 111 dap to 258 dap, for a total of 18 harvests, while
Table 3 shows the mean values per plant of total and commercial yield, discarded fruit, and fruit weight.
From 139 dap, production peaked in mid-April (around 180 dap), followed by a decline on 200 dap (first decade of May). The total and commercial production peak was achieved at 179 dap by all cultivars except for Melissa and AN12,44,60, which peaked on 186 and 195, respectively. Cultivars that reached higher peaks in production were mainly Elide, Arwen, Marimbella, Melissa, and AN12,44,60 (solid yellow line), while Dina, AN15,07,53 and AN16,53,54 in the same period showed lower peaks.
Elide had the highest mean values for total yield (631.9 g plant−1), while Dina (414.9 g plant−1), AN15,07,53 (412 g plant−1) and AN12,44,60 (419.4 g plant−1) recorded the lowest mean values. Highest mean values of commercial yield were recorded for Elide (531 g plant−1), Marimbella (514.2 g plant−1) and Arwen (467.2 g plant−1) and the lowest for Dina (343.4 g plant−1), AN15,07,53 (305.5 g plant−1) and AN12,44,60 (303.2 g plant−1).
Arwen showed the lowest percentage value of discarded fruits compared to total production (10%), followed by Marimbella (14.5%), Melissa (15.2%), Elide (16.0%), Dina (17.2%), and AN16,53,54 (18.1%), while AN15,07,53 and AN12,44,60 showed the highest percentages of discarded fruits, 25.8% and 27.7%, respectively. Melissa was the strawberry cultivar with the highest mean fruit weight (24.5 g), while Dina, AN15,07,53, and AN16,53,54 showed the lowest mean values (20.0 g) (
Table 3).
3.5. Fruit Quality
Fruit surface color, firmness, and soluble solids content. In general, riper strawberries have lower brightness values (lower L* values), indicating that the riper the fruit, the darker it will appear. The a* value of strawberries increases as strawberries ripen, becoming redder. The bright red color of strawberries comes from their anthocyanin content [
29,
30,
31]. Genotype AN12,44,60 showed the highest mean value of a* (25.6) and AN12,44,60 showed the lowest mean value (20.9). Melissa cultivar had the brightest (42.2), followed by Marimbella (41.9) and AN16,53,54 (40.6). Fruits of other cultivars showed lower L* values, while there was no significant difference between b* values of the different genotypes (
Table 4).
Firmness of strawberry genotypes ranged from 0.6 kg cm
−2 to 1.2 kg cm
−2 (
Table 4). Dina, AN16,53,54, Arwen, Melissa, Marimbella and Elide were significantly firmer than genotypes AN15,07,53 and AN,12,44,60.
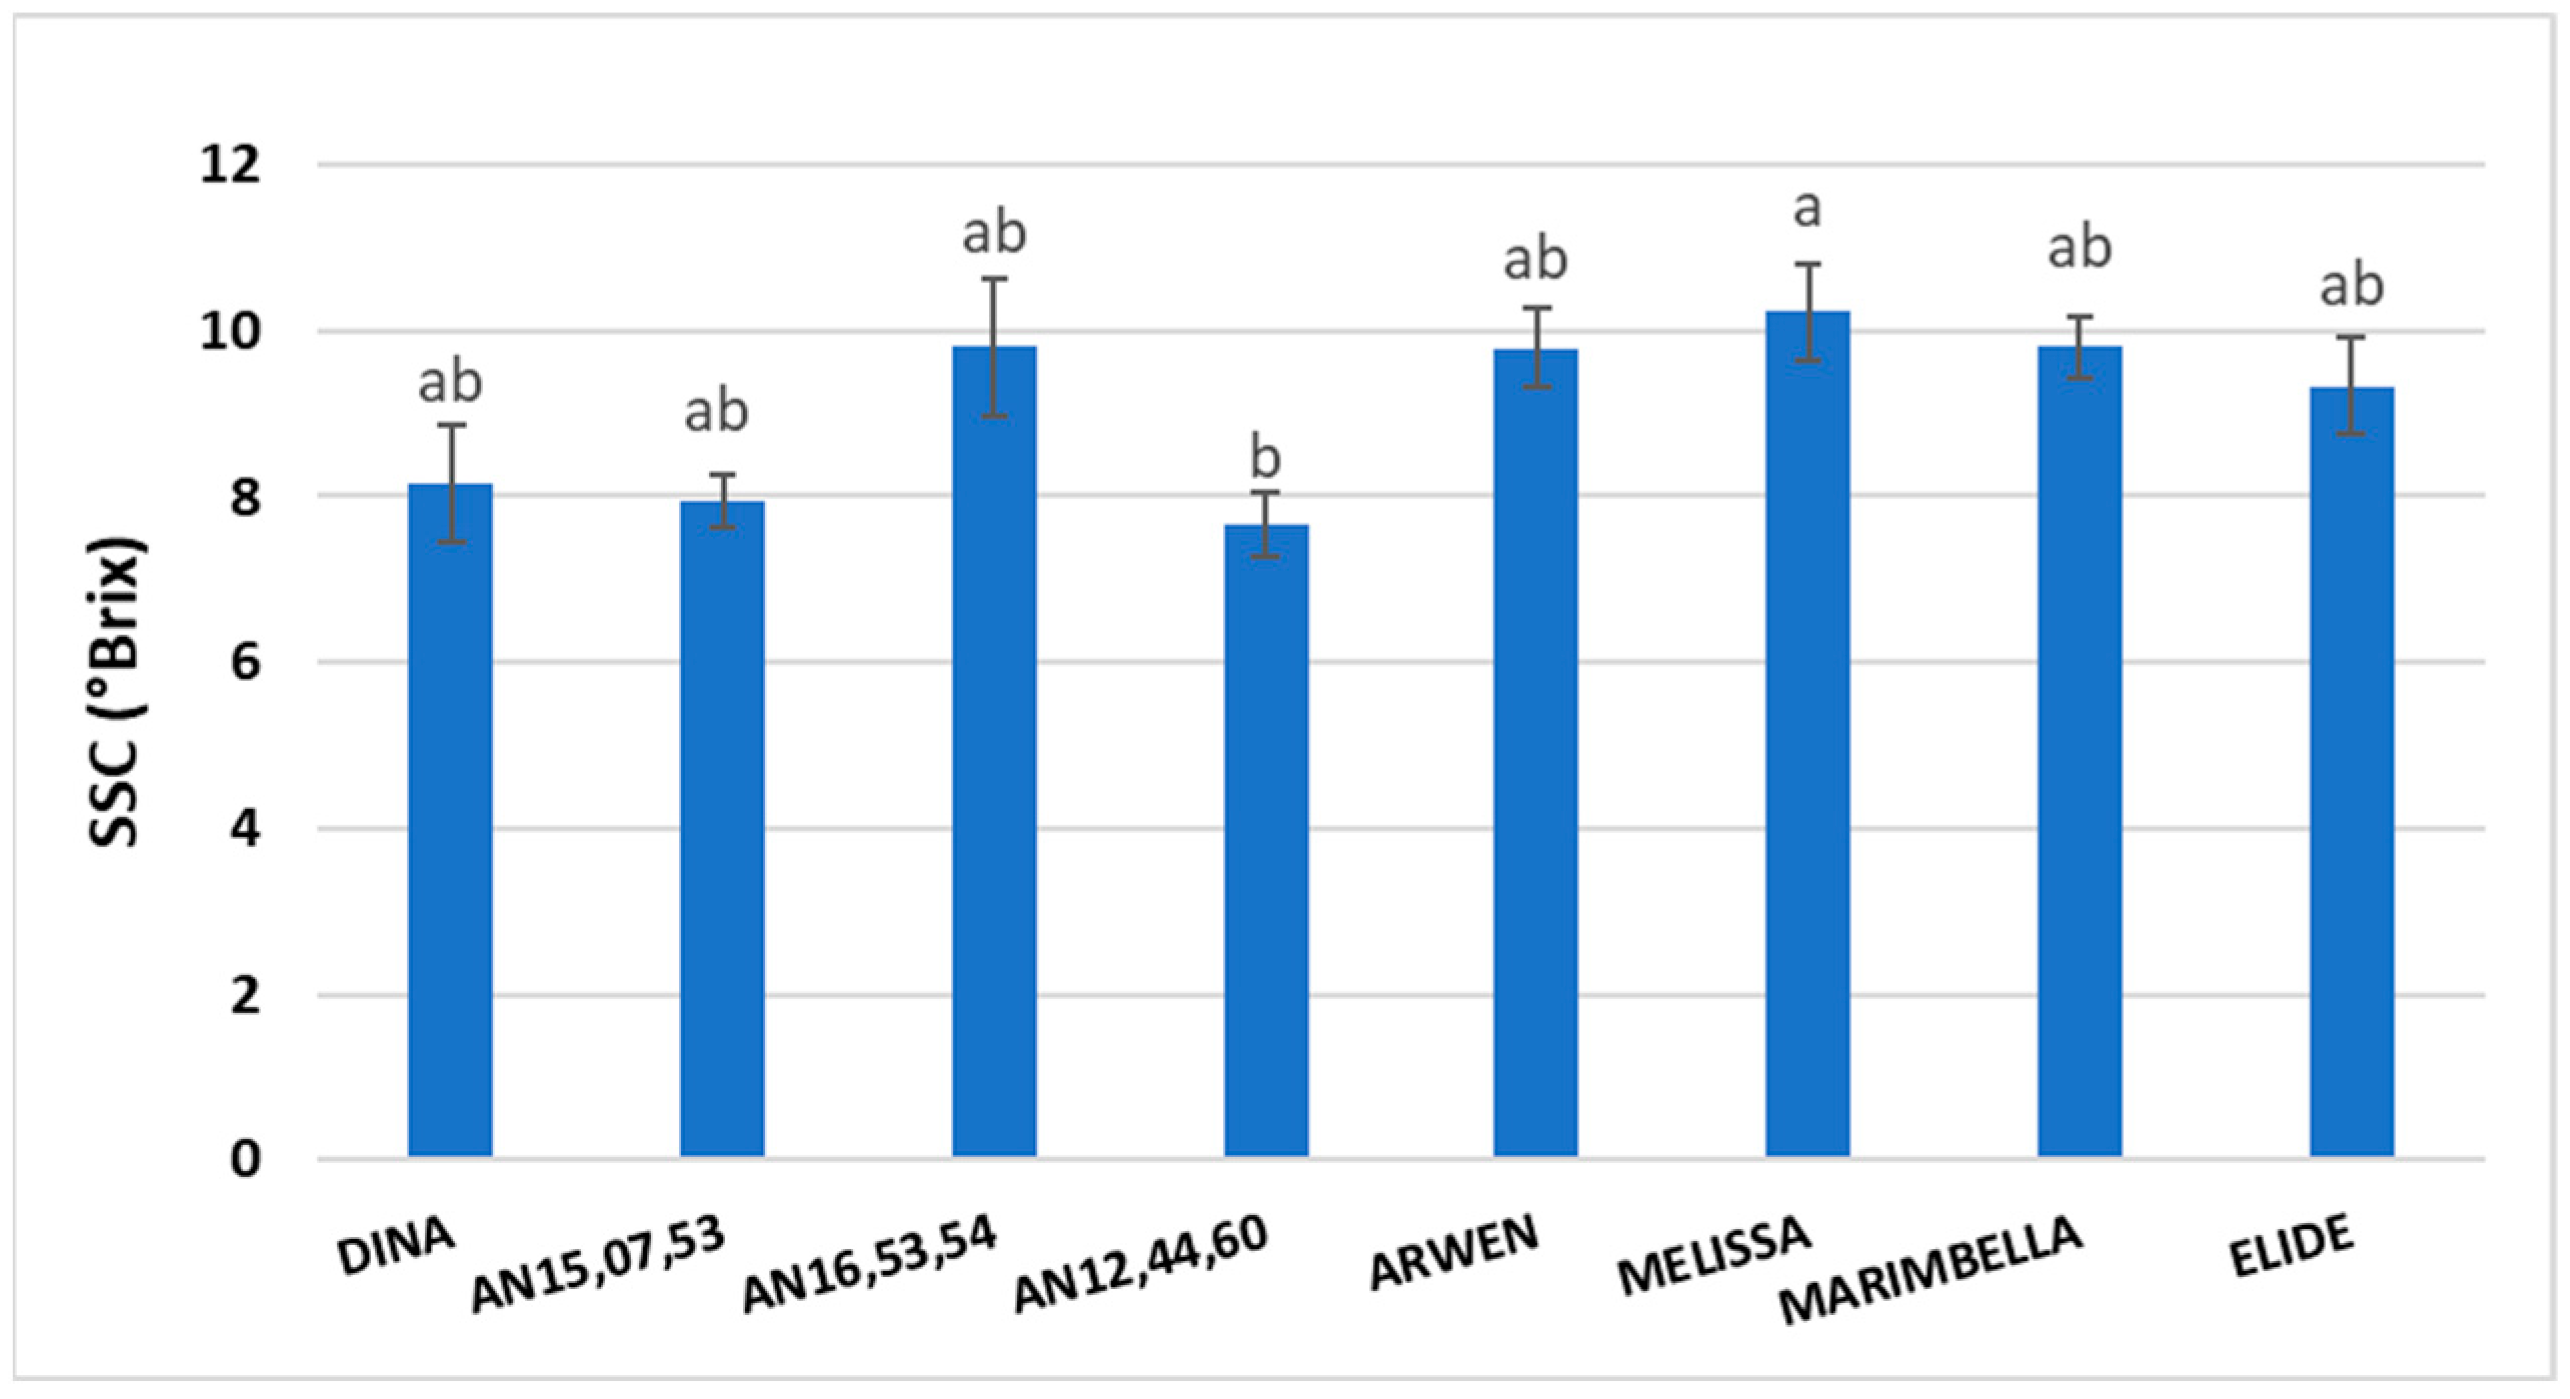
SSC was not significantly different between most of the genotypes, however ‘Melissa’ strawberries had the highest value (10.2 °Brix) and AN12,44,60 had the lowest value (7.7 °Brix) (
Figure 4).
3.6. Titratable Acidity and Total Anthocyanin Content
Table 5(a,b) show the values recorded for TA and ANT. The analysis of the TA (
Table 5(a)) showed that values ranged within 3.3 and 8.43 g/L of citric acid equivalents. In general, the highest acidity levels were recorded for AN16,53,54, Melissa and Marimbella, followed by relatively high values at the second harvest of AN15,07,53 (8.045 g/L) and at the third harvest of Elide (7.698 g/L).
ANT was expressed as mg of cyanidin equivalent per 100 g of d.w. (
Table 5(b)). ANT total ranged between 82.2–379.5 mg, with Dina showing the highest average concentrations of 363.1 mg/100 g fruit fresh weight, followed by fruits of the advanced selections AN16,53,54 and AN15,07,53 with relatively high average values of 288.7 and 258.4 mg/100 g fruit fresh weight, respectively. The lowest values were recorded during the first collection. Marimbella and Elide showed a significant decrease from the first to the second collection, while Arwen and Melissa exhibited the lowest ANT content.
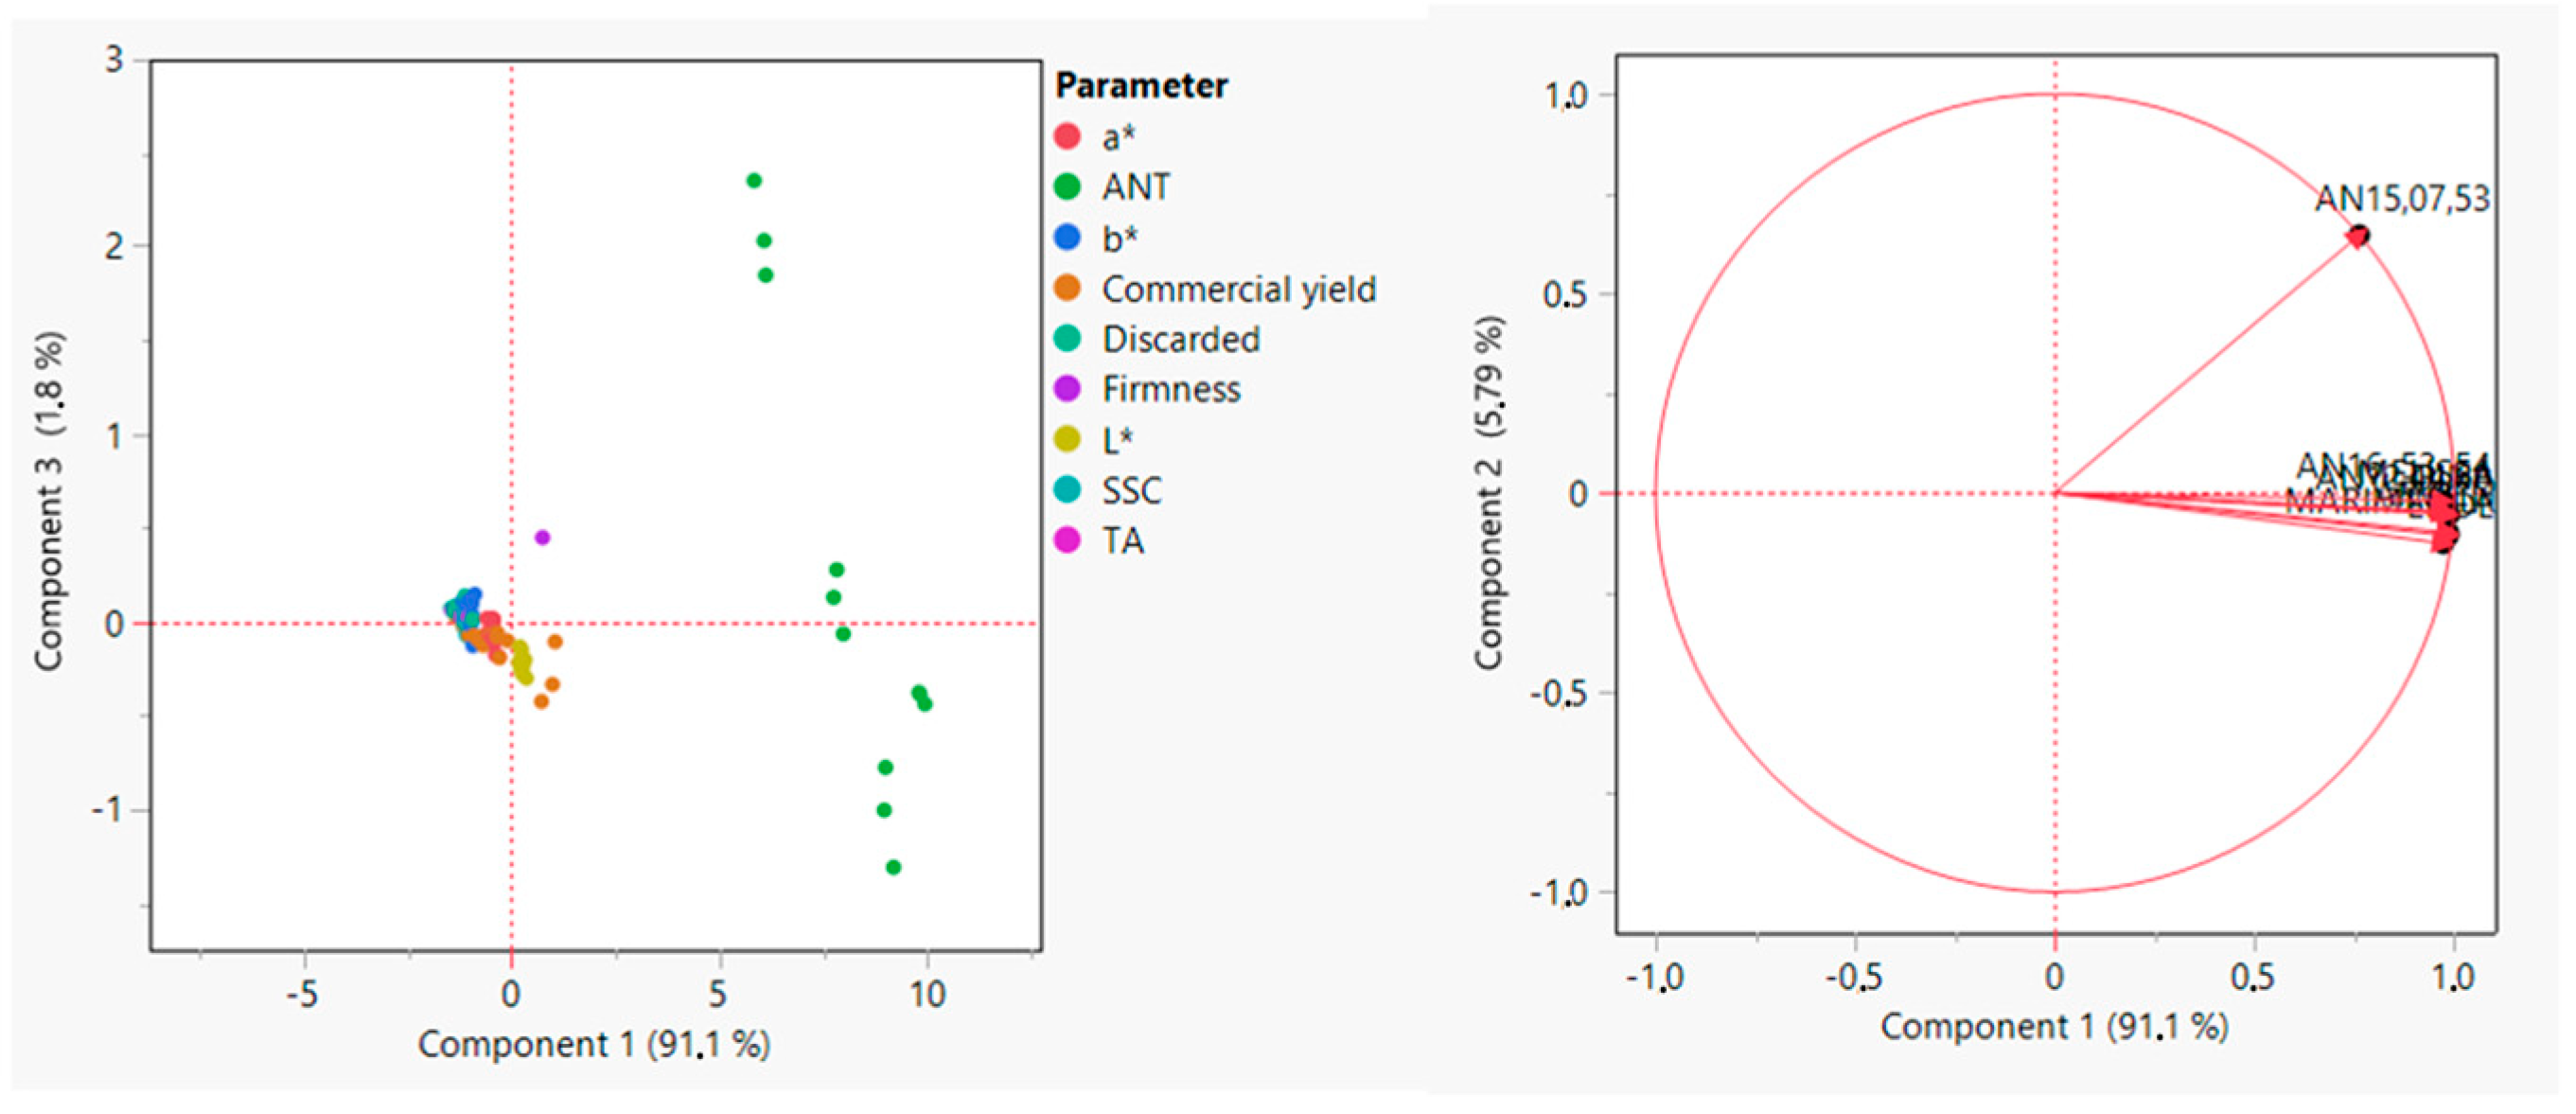
3.7. Principal Component Analysis
To explore how different genotypes grouped together based on qualitative characteristics such as L*, a*, b*, firmness, SSC, TA, and ANT and productive characteristics such as commercial yield and discarded fruit, a PCA was carried out (
Figure 5). The analysis showed that Dina, AN16,53,54, AN12,44,60, Arwen, Melissa, Marimbella, and Elide were strongly clustered and therefore very similar in terms of both yield and quality, while the genotype AN15,07,53 showed a different behavior by separating themselves from the other genotypes.
4. Discussion
This study highlighted differences in physiological, productive, and qualitative responses of the different genotypes evaluated under specific growing conditions (protected organic cultivation in a warm temperate environment).
AN16,53,54 was the only selection that, along with the commercial cultivars (Arwen, Melissa, Marimbella, and Elide), had the peak production with lower heat-hour requirements (4791 thermal units), resulting in earlier production than Dina, AN15,07,53 and AN12,44,60 (5978 heat units), which, instead, needed higher heat-hour requirements.
Genotypes AN16,53,54, AN12,44,60 and Dina displayed higher values of stomatal conductance and SPAD on most measurement days. In stomatal conductance, difference occurred from dap 123 (20 February) to dap 235 (12 June), paralleling the start of production, while there were no significant differences between genotypes before production started. Therefore, Lema-Rumińska et al. [
32] showed that stomatal conductance increases during the flowering phase and decreases during the fruit ripening phase. Variability in stomatal conductance among cultivars could be related to the alternating phases of vegetative renewal, flowering, and production. Indeed, Keutgen et al. [
33] showed that leaf transpiration was influenced by the age of the leaves. In general, in our study, genotypes that recorded higher production values (for example, Elide) were those with lower values of stomatal conductance.
Although no SPAD values for the genotypes used in our study were previously reported in the literature, the values were higher than those reported for other cultivars from organic strawberry cultivation [
34], suggesting higher photosynthetic activity and nitrogen availability. Dina and AN12,44,60 were the two genotypes with the highest SPAD values but also the lowest values of total yield per plant. Palencia et al. [
34] and Pestana et al. [
35] suggested that SPAD values varied differently during the crop cycle.
The increase in total anthocyanins and total phenolics may be due to higher SPAD values. Pestana et al. [
35] suggested that lower SPAD values significantly reduce the anthocyanins and total phenolics of strawberry fruits. In fact, Dina had the higher SPAD value and also the highest anthocyanin levels compared to the remaining commercial cultivars. Overall, Arwen, Melissa, and Marimbella showed lower SPAD values and low anthocyanin content, compared to new selections.
Part of phytochemical compounds contained in the strawberries have a bioactive nature and may confer nutraceutical properties. Anthocyanins are the most abundant and most bioactive phenolic compounds in strawberries Giampieri et al., 2012 [
36]. To date, more than 25 different types of anthocyanins from numerous varieties and selections of strawberries have been described Mazzoni et al., 2013 [
37]. Generally, ANT in fresh fruit varies from 15 to 60 mg/100 g of fresh weight, with values that may reach up to 80 mg/100 g Mazzoni et al., 2013 [
37]. Our study showed that Dina had the highest ANT concentrations, followed by AN15,07,53 and AN16,53,54. Among new selections, AN16,53,54 and AN15,07,53 showed higher values of TA, followed by Melissa and Marimbella and Elide. It is noteworthy to underline that, as a function of the collection moment, there was a pronounced decrease in TA, especially for MELISSA and MARIMBELLA, while an opposite trend was registered for ELIDE and AN12,44,60. TA in strawberries not only may vary according to the specific cultivar but also throughout the production period. Regarding SSC values, Melissa showed the highest content, while among the new selections, AN16,53,54 was the one with the highest values.
In terms of yield, Elide showed the highest total yield however, when evaluating commercial yield, Marimbella and Arwen also demonstrated good production with the lowest percentages of discarded fruit. Among the new selections, AN16,53,54 was the closest to commercial cultivars, both in terms of total and commercial yield, with a moderate percentage of discarded fruits. While, among commercial cultivars, Arwen stood out with the lowest percentage of discarded fruit, showing a good compromise between yield and fruit weight.
Color is an important quality attribute for strawberries. The different shades of red can be attributed to several factors, such as fruit maturity, genotype, and cultivar Wang and Camp, 2000 [
38]. Values of a*, indicating red color, differed only between genotypes AN12,44,60 and Marimbella, with higher (redder) and lower (less red) values, respectively. Wang and Camp [
38] reported similar values for organically grown strawberries. While the highest value of brightness (higher L*) was recorded for AN16,53,54 and Marimbella. Furthermore, among the new selections, AN16,53,54 is the genotype that is closest to the commercial cultivars in terms of firmness.
As the PCA analysis showed, the cultivars clustered strongly for the analyzed parameters, indicating that they could be considered for the cultivation program. AN15,07,53, instead, differs from all other genotypes, probably because it is a selection derived from two parentals with high and low chilling requirements and thus might be better adapted to different climatic conditions.
5. Conclusions
The research analyzed the physiological, qualitative, and quantitative responses of new strawberry cultivars for protected cultivation systems, typical for the temperate-warm climatic conditions of the Mediterranean area, adopting organic management techniques.
Two genotypes, AN16,53,54 and AN15,07,53 are susceptible to further evaluation. In particular, AN16,53,54 shows appropriate features for organic systems management. An important feature is related to the environmental conditions of the Mediterranean area is the precocity of production. In addition, AN16,53,54 showed good nutraceutical characteristics due to its anthocyanin content combined with good acidity and soluble solids content. The genotype AN15,07,53 derived from two parents with high and low chilling requirements, would need to be evaluated for its performance under very different climatic conditions.
In the future, these assessments will be integrated with information from metabolome analysis of different cultivars, useful to (i) understand how the plant metabolism responds to specific microclimatic conditions and climatic changes, (ii) find a correlation with nutraceutical aspects, and (iii) serve as a molecular fingerprint to recognize and differentiate new cultivars before being introduced into the Mediterranean strawberry market. In addition, it would be useful to test the experiment using plants from rooted tops instead of bare roots as nursery material and to move the trial to small tunnels to evaluate the plants’ responses to more temperature-stressful microclimatic conditions.


 ,
, 


