Article

Earthworm (Eisenia fetida) Mediated Macropore Network Formation in Black Soil: Decay Straw as a Trigger for Sustainable Tillage

1
College of Biological and Agricultural Engineering, Jilin University, Changchun 130025, China
2
College of Engineering and Technology, Jilin Agricultural University, Changchun 130118, China
3
Heilongjiang Academy of Agricultural Sciences, Harbin 150086, China
*
Author to whom correspondence should be addressed.
Agriculture 2025, 15(13), 1397; https://doi.org/10.3390/agriculture15131397
Submission received: 8 April 2025 / Revised: 24 June 2025 / Accepted: 27 June 2025 / Published: 29 June 2025
(This article belongs to the Section Agricultural Soils)

Abstract

In this study, a method for creating networked macropores through tillage using Eisenia fetida attracted by food sources derived from decomposing straw was proposed. The effects of Eisenia fetida activity and corn stalk addition, as well as the synergistic effects of Bacillus subtilis, on macropore formation were systematically studied. A 3D visualization technique was used to render the pore network model. When compared with undisturbed soil, the results demonstrate that cultivation using earthworms attracted by food sources from decomposing straw creates a soil pore structure with the most significant effect. The 3D porosity of the soil increased 6.90-fold, its average pore volume increased 5.49-fold, and its equivalent diameter increased 4.88-fold. Cylindrical pores, which accounted for the largest proportion (4.38%), had a channel radius of 1–5 mm and comprised approximately 86.7% of all macropores. The channel length increased by 28.5%, the average roundness decreased by 2.5%, and the average coordination number increased by 33.3%. The macroporous network structure formed by these earthworm-generated pores was more beneficial for improving the structure of phaeozem, offering technical support for the field application of earthworm farming.

1. Introduction

Phaeozem is widely recognized for its characteristic dark color and high organic carbon content. According to statistics, globally, phaeozem covers an area of 725 million hectares [1]. One of the three most significant phaeozem regions in the world, the Northeast Plain of China, features a deep and fertile phaeozem layer due to its unique climate, hydrological conditions, and abundant vegetation [2]. The total area of phaeozem in Northeast China is approximately 1.244 million square kilometers [3]. However, this area is undergoing serious degradation caused by multiple factors, including unreasonable tillage practices, mechanical compaction, insufficient organic fertilizer application, and a low rate of straw return [4]. According to reports [5], it takes up to 300 million years to form a one-meter-thick phaeozem layer; the current degradation rate has reached one centimeter per year. The annual loss of phaeozem amounts to 200 million cubic meters, containing significant amounts of nitrogen, phosphorus, potassium, and other nutrients, equivalent to nearly 10 million tons of chemical fertilizer [6]. The degradation of phaeozem leads to a reduction in soil organic matter, transforming high-quality, high-yield areas into medium- or low-yield areas. This degradation also contributes to desertification and salinization in some regions. As a result, this process causes economic losses of at least billions of RMB (Renminbi, currency code: CNY) per year in Northeast China, directly impacting the stability of grain production [7].
Several approaches have been proposed to address soil structure degradation in phaeozem, including mechanical, chemical, and biological methods [8]. Among these strategies, reconstructing macropores through mechanical and biological means represents an effective approach to prevent structural degradation [9]. Mechanical tillage techniques such as subsoiling and deep turning can create large pore structures in the soil. However, these mechanical disturbances may generate large cracks, and the connectivity of the resulting pores remains uncertain. Notable differences exist when comparing these mechanically formed pores to those created through biological activities [10]. Biological macropores, compared with those formed by mechanical methods, typically exhibit significantly greater pore numbers and porosity, along with larger volumes and equivalent diameters. Typical soil organisms responsible for creating biological macropores include ants, termites, and earthworms [11]. Among these organisms, earthworms, recognized as “ecosystem engineers”, play a crucial role in field soils [12]. The biological pores formed by earthworms predominantly exhibit a cylindrical shape, which significantly increases both the length and diameter of pore channels. This structure effectively reduces fluid flow resistance, while the complex pore network created by earthworms greatly improves soil connectivity, thereby optimizing oxygen and water transmission efficiency [13].
Earthworms exert a significant influence on soil pore structure, pore size distribution, and connectivity [14]. Studies have reported that earthworms can greatly improve soil moisture permeability and water storage capacity, effectively mitigating soil degradation. Further research has demonstrated that the water permeability of earthworm burrows is governed by a complex interaction between soil’s physical and chemical properties and earthworm populations [15]. Specifically, the diameter, curvature, and connectivity of these burrows play pivotal roles in facilitating water movement. Additionally, earthworm burrowing activities exhibit considerable variability, often in response to environmental conditions such as organic matter content [16], soil compaction [11], and seasonal changes [17]. Numerous studies have established a close relationship between earthworm activity and soil pores and water flow [18]. However, limited research has focused on the movement behavior of earthworms attracted by food sources and the resulting morphology of soil macropores [19]. Moreover, research on the systematic investigation into earthworm placement in large fields and their role in creating macroporous structures remains scarce.
This research gap may stem from the fact that the primary organic matter source in large fields, i.e., straw, decomposes slowly, potentially leading to earthworm mortality due to insufficient food sources [20]. This issue can potentially be mitigated through the introduction of micro-organisms, though the coupling effects among earthworms, micro-organisms, and straw have not been systematically studied. Specifically, earthworm activity creates an optimal environment for microbial proliferation, while microbial growth further enhances the transformation of soil organic matter, thereby improving earthworm living conditions [21]. While straw returns to the field provides an adequate energy source for earthworms while accelerating its decomposition through earthworm consumption, the relationship between micro-organisms and straw resembles that between earthworms and straw. Straw provides essential material support for microbial proliferation, while micro-organisms accelerate straw degradation. The synergy among earthworms, straw, and micro-organisms enhances soil pore structure. However, the coupling relationship between these three factors—particularly the influence of earthworms, attracted by food in the form of decaying straw, on soil pore properties in the presence of micro-organisms—remains insufficiently explored. This process can effectively improve the field soil macroporous structure. Currently, the biological tillage mechanism of earthworms remains poorly understood, and key driving factors in arable land soils are not well characterized, limiting their practical application in field environments. Furthermore, the alignment between earthworm food sources in the field and straw decomposition rates represents a critical factor affecting field application efficacy.
In this context, this study integrated an earthworm food attraction experiment with computed tomography (CT) imaging technology [22] to elucidate the mechanism through which earthworms create biological macropores in phaeozem under the influence of decaying straw. The CT technology enables the non-invasive acquisition of three-dimensional images of soil, facilitating the visualization of pore spatial distribution and morphological characteristics via 3D reconstruction [9]. This investigation employed typical phaeozem as the study substrate, applying combined straw and Bacillus subtilis amendments under straw return conditions to examine the influence of earthworm activity on soil pore structure. Utilizing the software AVIZO 9.2, changes in pore characteristics, channel architecture, and connectivity induced by decaying straw were systematically quantified. Based on the pore dataset of phaeozem under earthworm food attraction obtained from AVIZO, the effects of earthworms on the macropore properties of phaeozem under straw return conditions were rigorously evaluated. The tillage mechanism was further examined to optimize soil environmental conditions. This study provides novel perspectives for understanding the networked macroporous structures formed by earthworms through decaying straw food attraction, while offering advanced analytical methodologies for future research on earthworm-based agricultural farming systems.

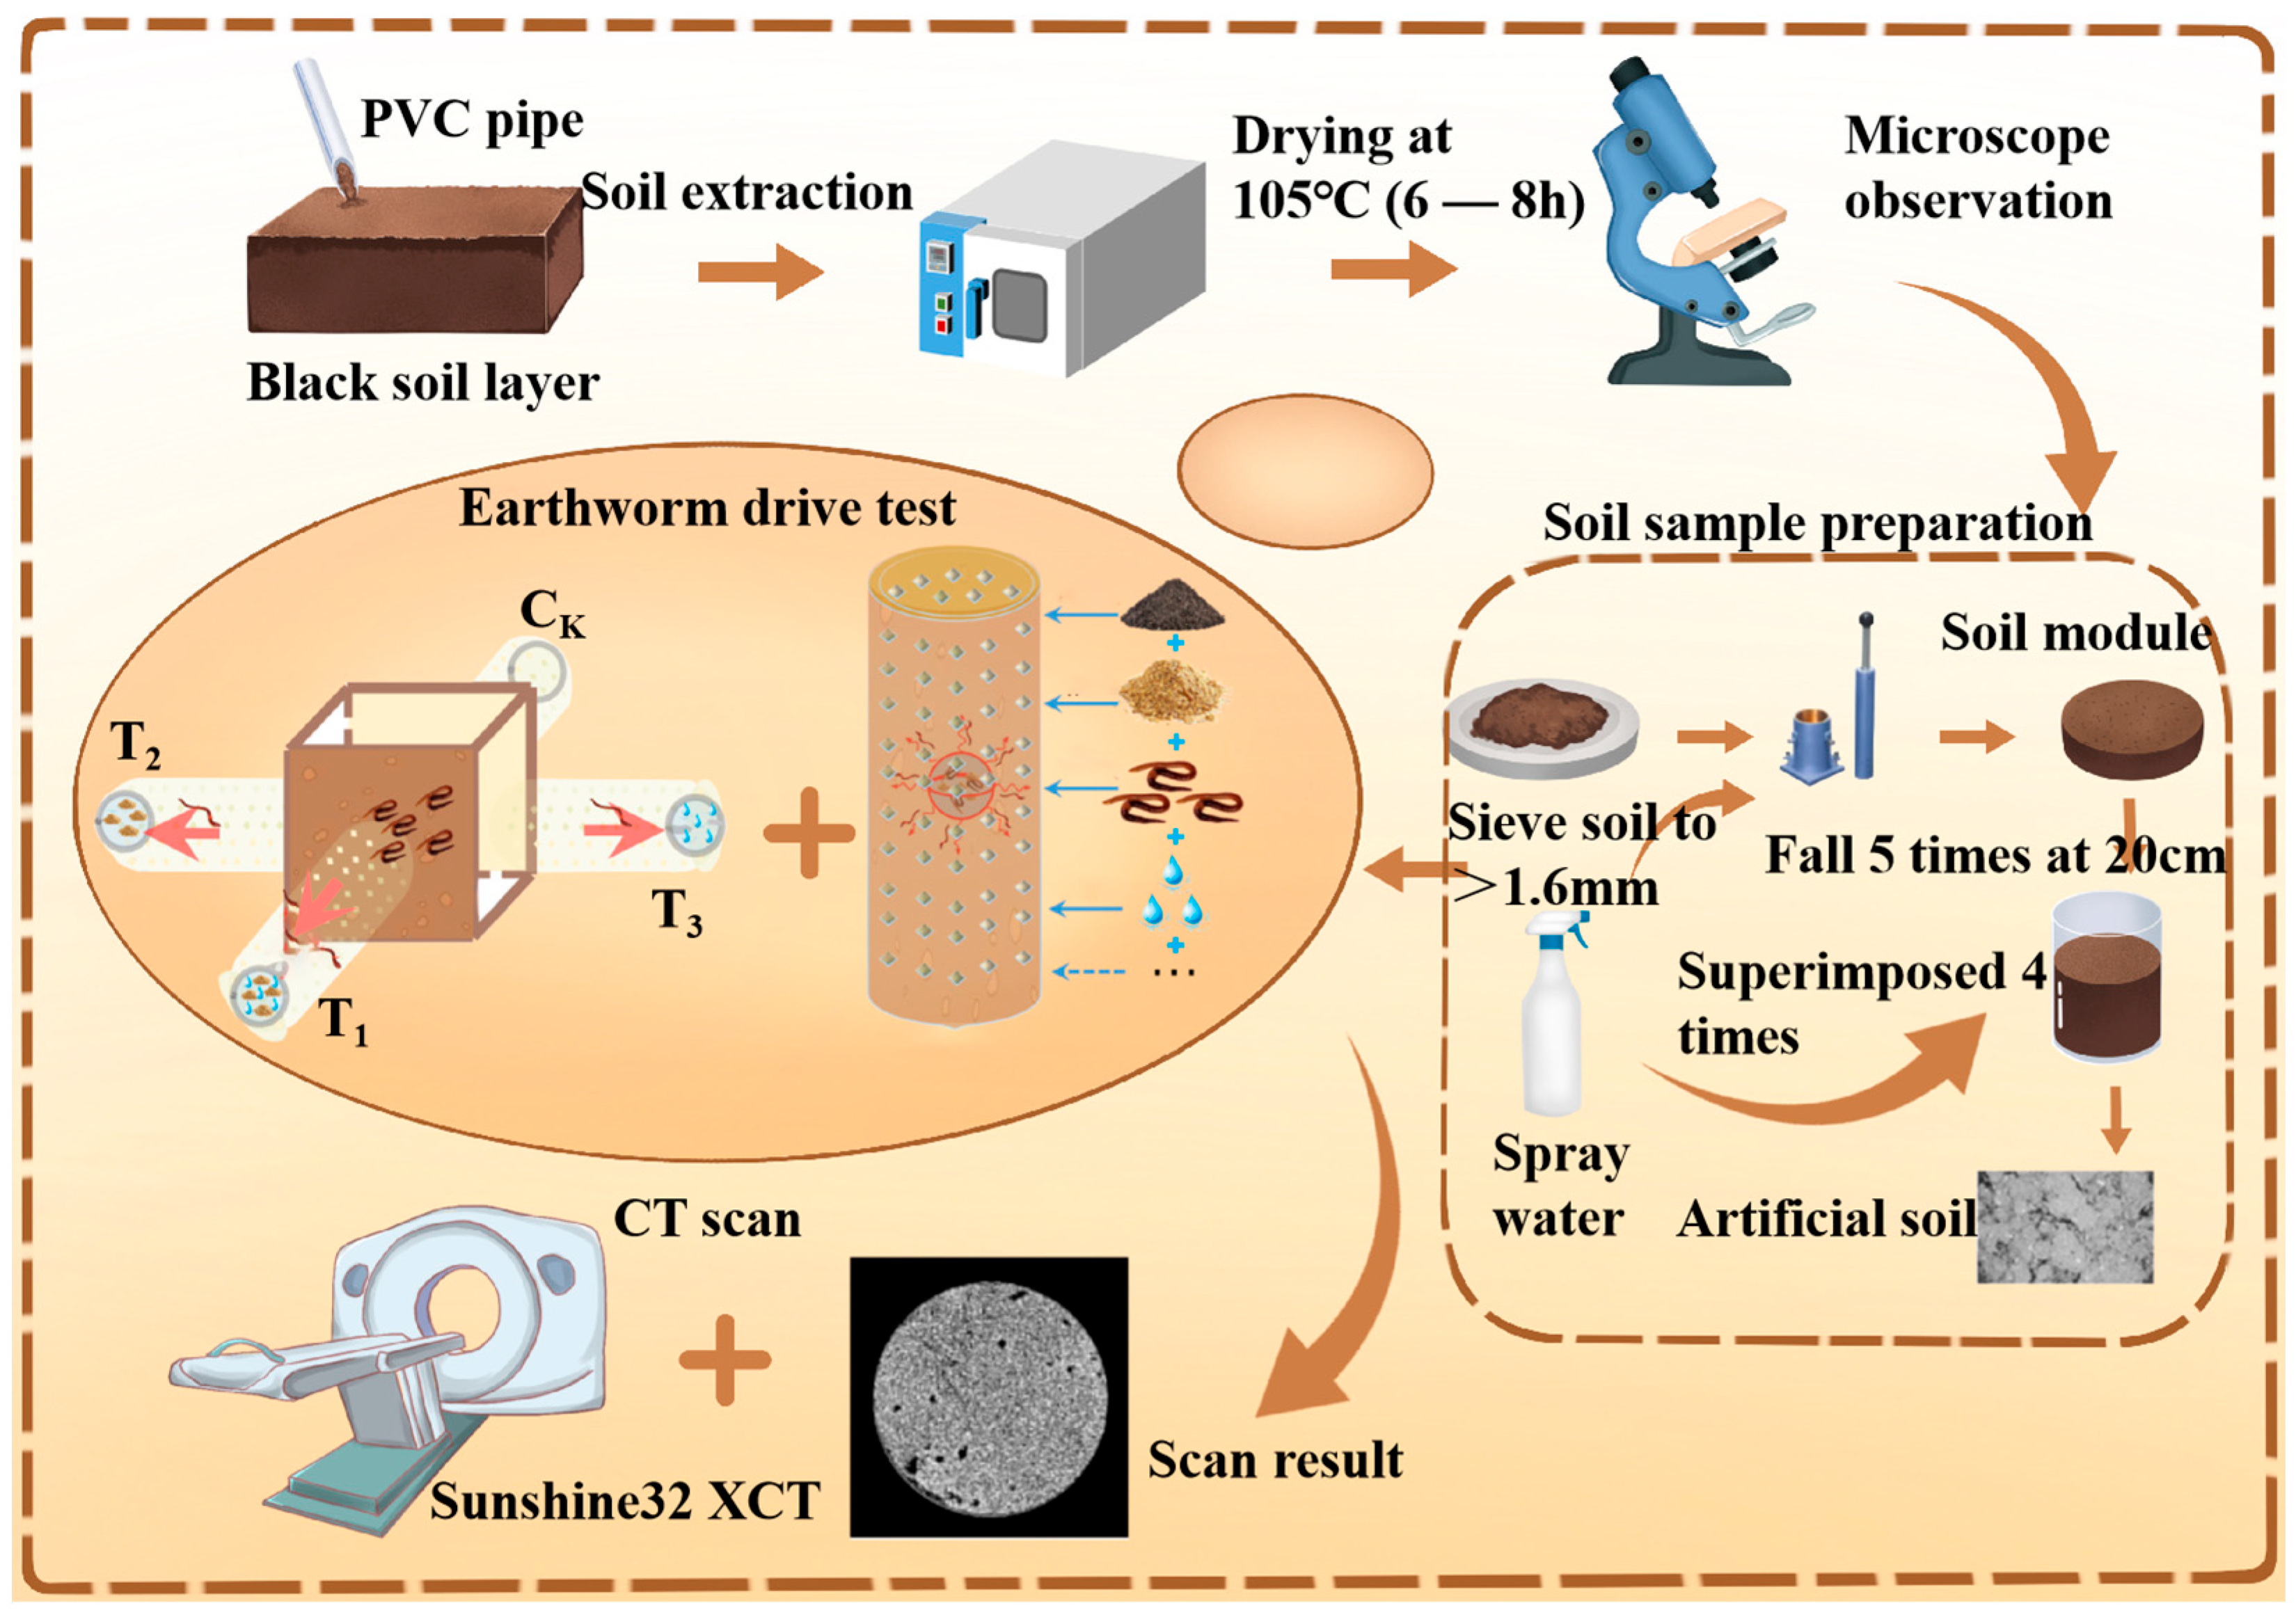
2. Materials and Methods

Many parameters were involved in the calculation process. For convenience, the meanings of these parameters presented in the following formulas are shown in Table 1.
The experimental protocol encompasses four principal stages: the collection and morphological examination of soil specimens, sample processing and preparation, earthworm food attraction assays, and a comprehensive analysis of the internal soil architecture through computed tomography (CT) imaging, as illustrated in Figure 1.

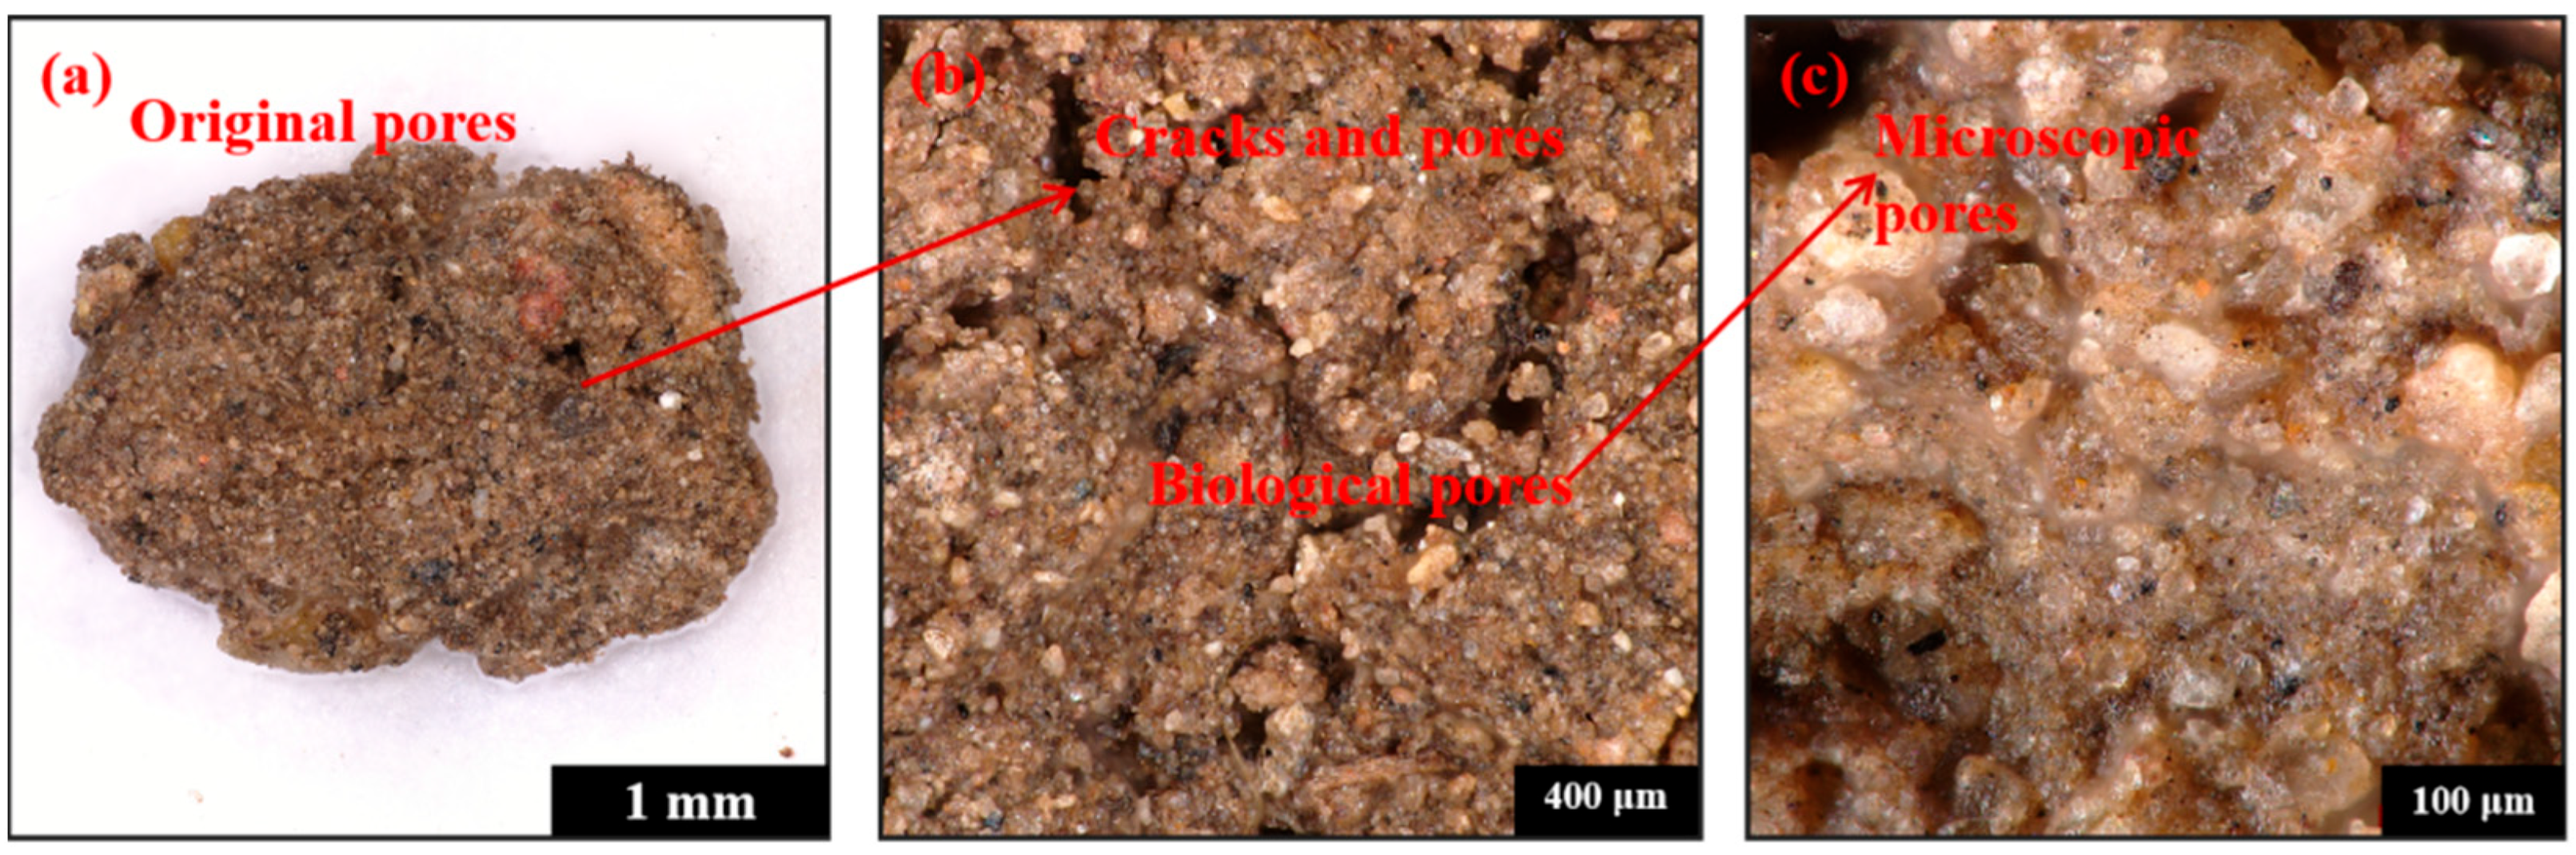
2.1. Measurement of Soil Properties in Tests

Soil samples were collected from the Agricultural Test Base of Jilin University, located in Changchun City, Jilin Province, China (125°14′52.83″ E, 43°56′45.43″ N). In May, the average temperature in this region is 23.2 °C, with approximately 14 h and 4 min of sunshine, and the precipitation is 49.9 mm. Earthworm collection was conducted in May, as this period coincides with the peak activity of earthworms, making it the optimal time to excavate earthworm burrows [23]. The earthworms were purchased (from Shaanxi Junlong Ecological Technology Co., Ltd., Xi’an, China). of China, belonging to epibenthic species for a single species (Taiping No. 2). The body length is 35–130 mm, generally shorter than 70 mm. The width is 3–5 mm; the number of somites is 80–110, and its activity is mainly concentrated in the humus layer [24]. Eisenia fetida is a variety with a high reproduction rate and strong stress resistance, most commonly found in the 20 cm of organic soil.
According to particle distribution analysis using the BT-9300ST instrument (Dandong Bettersize Instruments Ltd., Dandong, China), the soil was classified as sandy loam. In the study area, a random sampling point was selected. Intact soil samples were collected at a depth of 0 to 200 mm using PVC ring knives with an inner diameter of 100 mm and a height of 200 mm. This depth is ideal for the survival of earthworms. The soil properties are presented in Table 2.
A super-depth field microscope (DS1000X, Olympus, Tokyo, Japan) was employed for the preliminary examination and comparative analysis of the original and biological soil pores at magnifications of 1 mm, 400 µm, and 100 µm, as illustrated in Figure 2a–c.

2.2. Earthworm Food Attraction Test

In this study, 50 Eisenia fetida earthworms with body lengths of 6–10 cm and high biological activity were assessed. The main reason for selecting Eisenia fetida is that they use organic matter as food and thus can use fermented straw [25]. Eisenia fetida might form soil macropores and improve soil structure when searching for food. This species may improve the physical properties of the soil. Bacillus subtilis was used to ferment straw. Bacillus subtilis can accelerate the decomposition of straw, is compatible with earthworms, and is widely used in the field [26]. This study was tested using a specially designed cross-shaped food attraction measure. The instrument was constructed from plexiglass, with an inner chamber measuring 200 × 200 mm, and a glass cylinder (100 mm diameter, 200 mm height) was designed to accommodate both CT scanning and the movement distance of earthworms. Four glass cylinders were connected in the four directions of the inner chamber, and different test groups were placed. The earthworms were placed in the central inner chamber at a distance of 10 cm from the bottom of the column, and the vermiculation position of the earthworm was observed in real time through transparent glass. After the test, the glass cylinder was removed for CT scanning. The earthworms were attracted by the straw, and they wriggled and created soil pores. After sampling, the soil samples were naturally air-dried indoors in a shaded area and then sieved to a particle size of 1.6 mm to facilitate CT scan observation and prepare for the earthworm food attraction test.
In the test, the sieved soil particles were placed into a soil core, and a 2.5 kg Proctor hammer was dropped five times from a height of 20 cm to achieve a BD of 0.88–1.26 g/cm3. Subsequently, the compacted soil was sprayed with 50 mL of water to form an artificial soil sample, which was prepared as a soil module. The module was placed in the plexiglass chamber, and the soil column was filled layer by layer with 5 cm thick soil modules to ensure uniformity. A total of four layers were filled [27]. Water was sprayed between each layer to maintain soil WS in the range of 19.6–21.4%. To study the response of earthworms to food attraction, four different experimental variables were set at the top of the soil column. A total of 50 earthworms were placed 10 cm from the bottom of the central inner chamber at each time. The peristaltic position of earthworms was observed in real time, and the experiment lasted for 36 h. Data on the soil macropore structure created by the earthworms in the glass cylinder were obtained using CT scanning. The total amounts of added straw and fermented straw for each treatment were assessed. The different test groups are summarized in Table 3. The earthworms’ food attraction test was repeated three times.

2.3. Image Acquisition and Processing of CT Equipment

The pore structure of the soil column samples was obtained using a CT scanner (Dachang, Sunshine32 XCT, Shenyang, China). The samples were placed horizontally on the scanning board and scanned with a 180-degree rotation. The scanning time was 1.50 s, with the CT collimation set to 8 × 0.55, peak voltage to 140 kV, and X-ray tube current to 140 mA. The scanning resolution was 0.55 mm, with a voxel resolution of 512 × 512 × 261 μm3 and the field of view covering an area of 512 × 512 mm2. The three-dimensional reconstruction and analysis of the image data were performed using the software AVIZO developed by VSG. During image processing, a multi-threshold segmentation method was employed to accurately extract pore characteristics. This method overcomes the issue of unclear boundary division when using a single threshold. The pore network modeling was achieved using the maximum sphere algorithm, where the large spheres represent the pore bodies and the smaller spheres represent the pore channels [28]. Key parameters, such as V′, φ, V, R, S, R0, L0, V0, τ, and CN, for the four model sets were determined, and the geometric characteristics of the pore structure and the connectivity of the pore channels were analyzed [29].

2.4. Calculation Formula

The Formulas (1)–(6) have been widely applied in the field of soil CT scanning [30]. Porosity (V′), face rate (φ), pore volume (V), form factor (S), equivalent radius of the pore channel (R0), and roundness (τ) are key parameters in porous media analysis. These parameters are interrelated and collectively describe the pore structure and functional characteristics of the medium. A comprehensive analysis of these parameters provides a detailed reflection of the physical properties and fluid flow behavior in the porous medium.
V = V V c V × 100 %
V′ is a key parameter that measures the ratio of the volume of voids within a soil or other porous medium to the total volume, and it is used to evaluate its structural characteristics.
φ = A P A
φ represents the ratio of the total cross-sectional area of the pores in each slice to the total cross-sectional area of the slice. This ratio is useful for evaluating the uniformity of pore distribution.
R = 3 V 4 π 3
V is calculated by counting the voxels in each pore, and the equivalent radius based on the pore volume is used to describe the dimensional characteristics of the pore.
S = A 3 36 π V 2
S is a parameter that characterizes the geometry of the pores in comparison to an ideal sphere, helping to determine whether the pores are elongated or flat.
R 0 = V π L
R0 is a critical factor that influences the permeability characteristics of porous materials, directly affecting fluid flow through the medium.
τ = L T L 0 = 1 K 1 ( n ) X K X I 2 + Y K Y I 2 + Z K Z I 2
τ describes the degree of bending within the pore channel, with its minimum value being 1, reflecting the complexity of the pore structure.

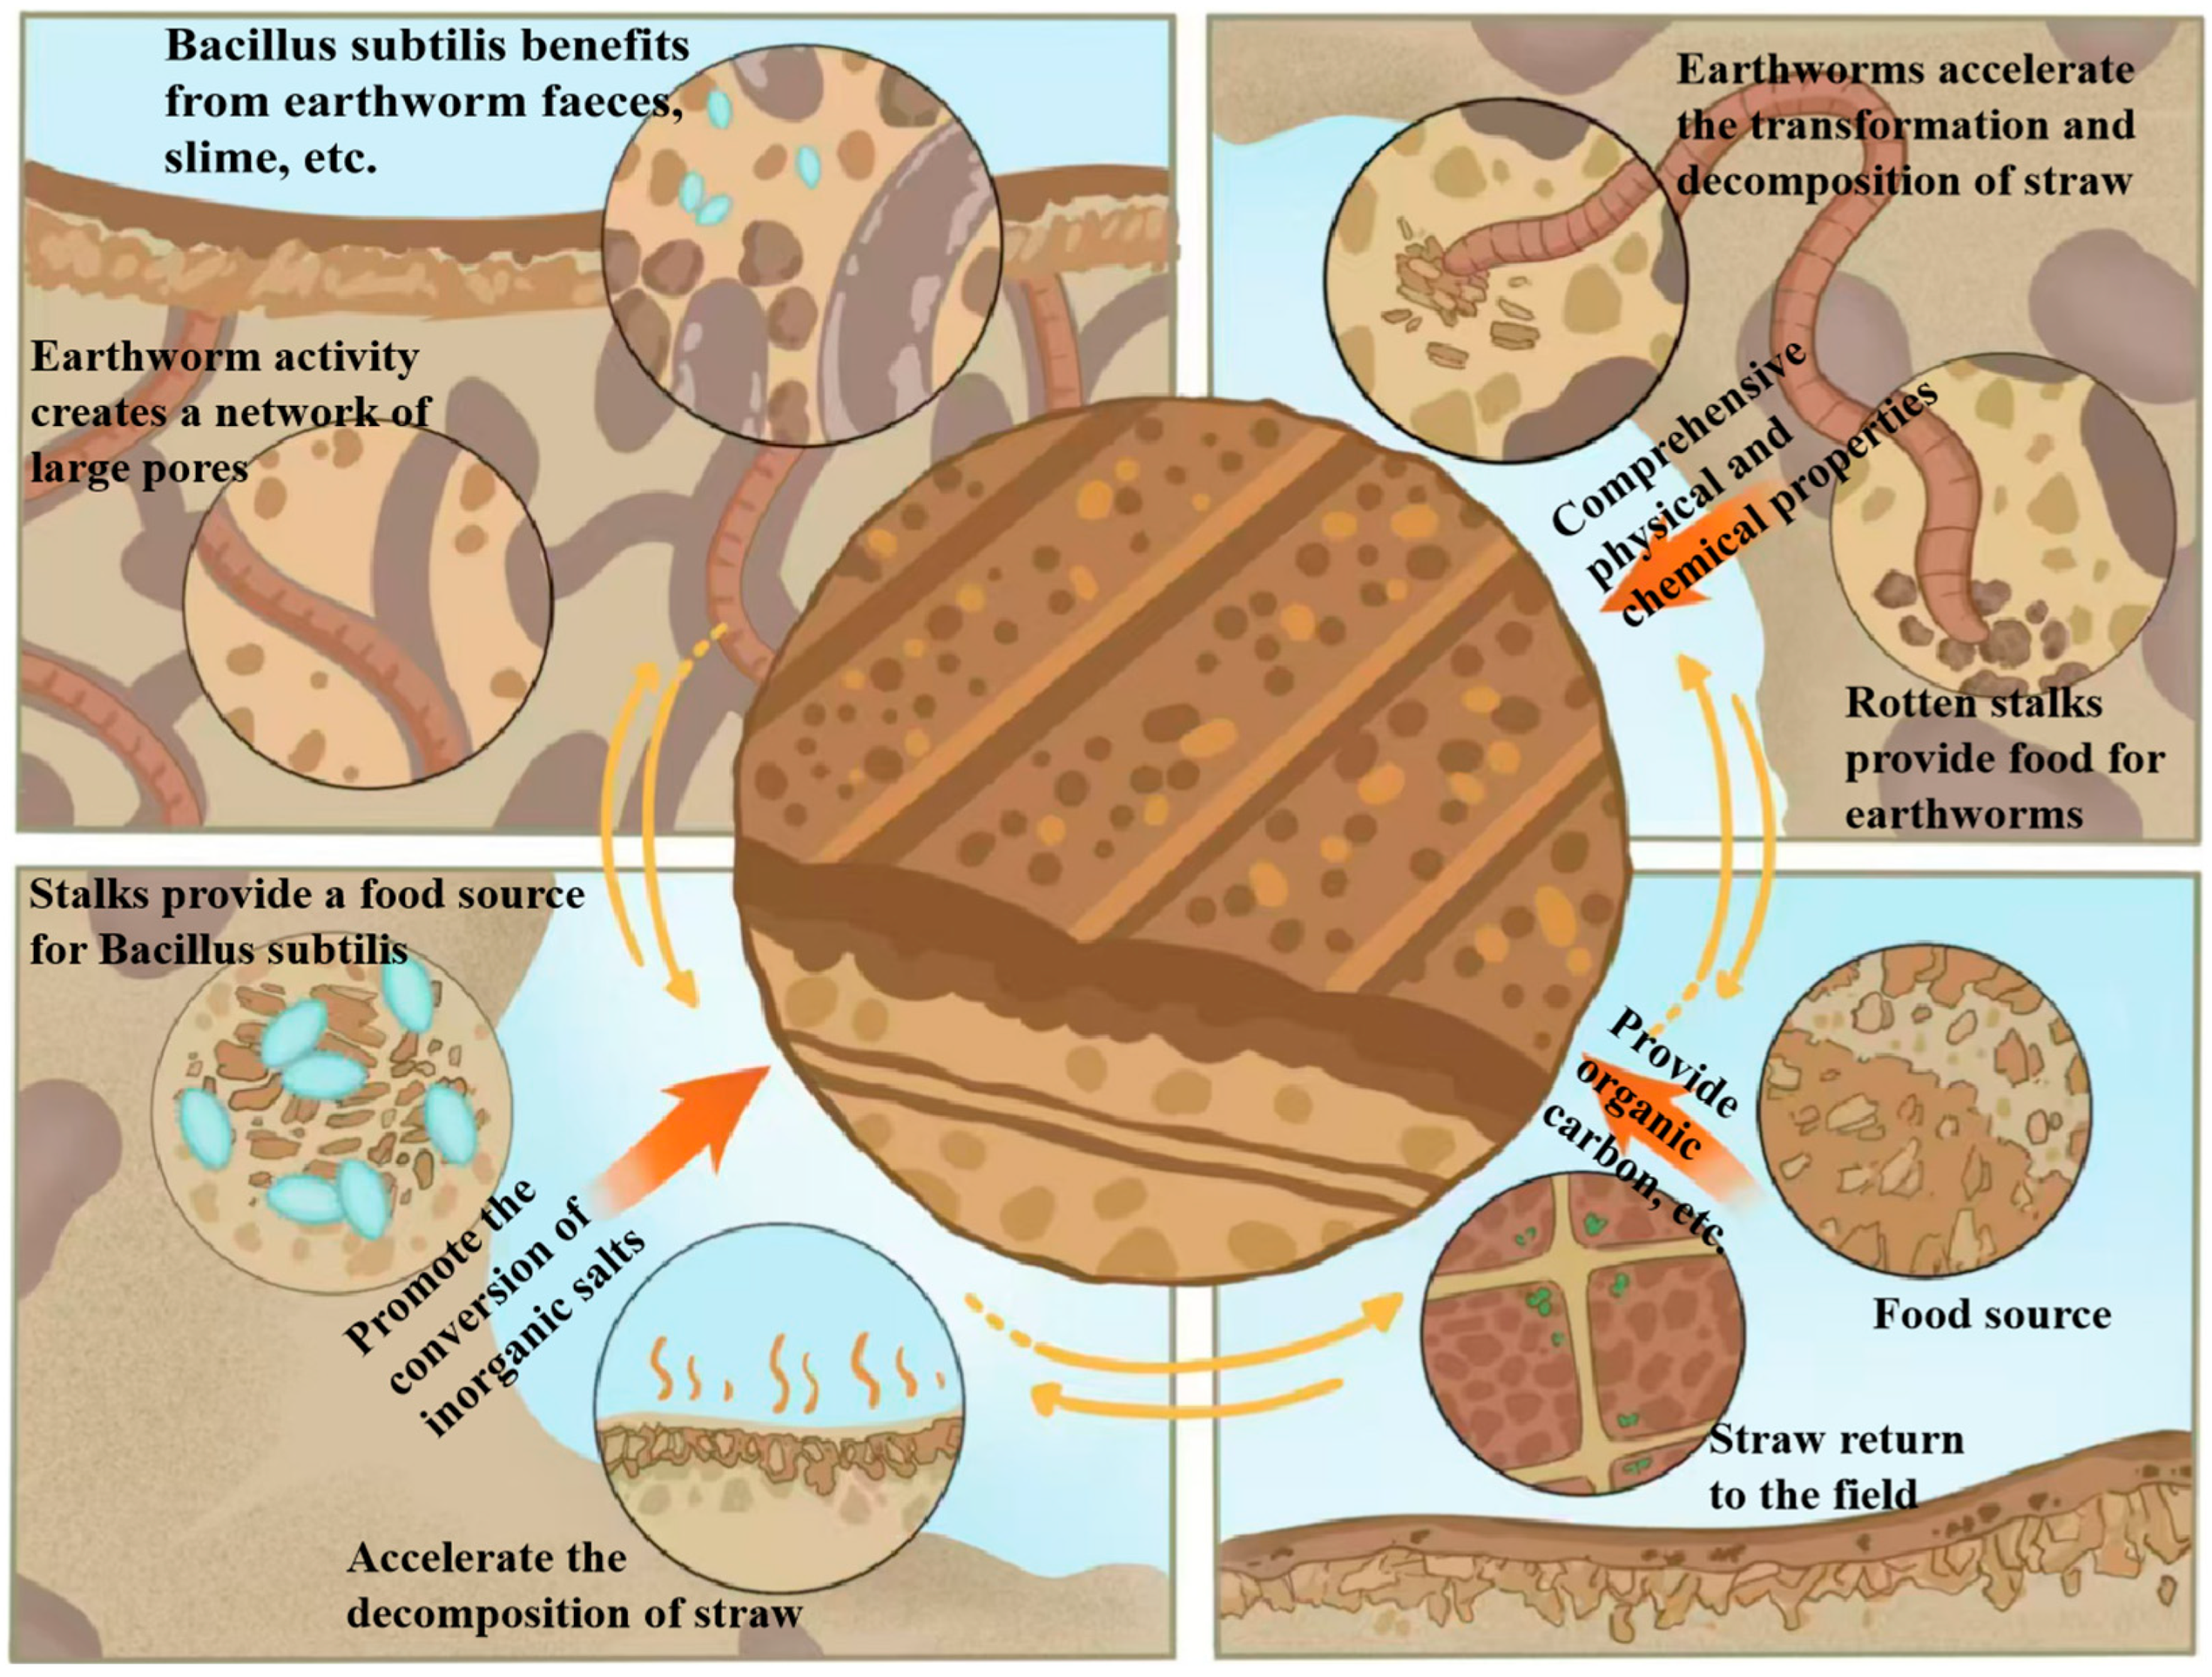
3. Results and Discussion

As a result of their activities, earthworms provide an excellent living environment for the proliferation of micro-organisms, and the proliferating micro-organisms further promote the transformation of soil organic matter, thereby improving the living conditions of earthworms. In addition, returning the straw to the field also provides an adequate source of energy for earthworms, and at the same time, the decomposition of straw is accelerated by its consumption by earthworms. The relationship between micro-organisms and straw is similar to the relationship between earthworms and straw, and straw provides the necessary material basis for the proliferation of micro-organisms, while micro-organisms accelerate the degradation of straw. The synergy between earthworms, stalks, and micro-organisms improves the pore structure of the soil; this relationship is shown in Figure 3.

3.1. Earthworm Food Attraction Effect

The earthworm driving distance index was presented with the analysis of variance in Table 4. The influence of different straw and microbial driving conditions on earthworm activity was analyzed. The glass tubes used in this study were removable. The soil column of the glass tube was removed for CT scanning, and the scanned soil was removed in layers to derive the number of earthworms, as well as the creep distance of the earthworms. The results for the four driving conditions are as follows: Group T1, the mixture of straw and micro-organisms attracted an average of 17.66 earthworms with a maximum average moving distance of 15.43 cm. Group T2, which used only straw, attracted an average of 9 earthworms, with a maximum average moving distance of 12.13 cm. Group T3, where food attraction was only driven by micro-organisms, attracted an average of 7 earthworms, with a maximum average moving distance of 10.03 cm. The control group (CK), with no food attraction, attracted an average of only 1.33 earthworms, with the farthest average moving distance of 1.7 cm. Among the remaining 18 earthworms, 11 died. The standard deviation is shown in Table 4. The earthworms left in the middle area that did not move might be because of their low activity; or these earthworms were not attracted to any food; or these earthworms did not catch the odor of the food. The death of earthworms was not considered, as earthworms are required to produce macroporous structures. Furthermore, seven earthworms remained in the center of the measuring instrument. This might be due to the soil in the inner chamber being conducive to survival, or the earthworm activity decreasing after 36 h, causing them to stop moving. These results indicate that, under the same environmental conditions, earthworms responded differently to various food attraction conditions, with the T1 group showing the most pronounced effect. This suggested that the combination of straw and micro-organisms resulted in a strong attraction for earthworms and promoted the formation of complex soil pore structures.

3.2. Pore Structure After Earthworm Food Attraction (Porosity, Pore Network Model)

Porosity represents the proportion of voids within a material, indicating the ratio of pore volume to total volume. The pore network model (PNM) reflects the distribution and connectivity of pores within the material, which in turn affects its macroscopic properties [31]. The porosity of the earthworm food attraction pore structures is shown in Table 5 and Figure 4. In these figures, black areas represent the earthworm-generated pores, which are distributed in various regions of the sample as tubular and conical structures, while the small white pores, representing the soil, appear irregular in shape. The results demonstrate that, compared to the control group (CK), the porosity in the T1 group increased nearly 6.90-fold following the addition of food factors to the topsoil.
The analysis of the two-dimensional porosity, as shown in Figure 4, revealed that the T1 group exhibited peak porosity values in the 76th and 178th CT images at distinct spatial positions, demonstrating that earthworms successfully created a large number of macropores through food attraction. The maximum porosity value reached 0.18, while the minimum value was 0.01, indicating that straw stimulation significantly increased both the variability and size of the pores. The φ distribution in the T1 group displayed a concave pattern, with higher porosity observed at both ends of the sample and lower porosity in the middle. This phenomenon might be related to the nocturnal activity of earthworms, which have been previously reported to exhibit more frequent lateral peristalsis or remain stationary during the night [32]. In contrast, the porosity distribution of the T2, T3, and CK groups appeared relatively uniform, reflecting a less pronounced driving effect. The porosity curve of the CK group exhibited fluctuations around the 100th image, potentially related to issues of soil compaction or formation. Overall, the porosity changes in the T2, T3, and CK groups were small and evenly distributed, suggesting that earthworm activity had a weaker influence on porosity in these groups. Although earthworm-generated biological pores constitute a small portion of the total soil volume [33], they play a crucial role in promoting the incorporation of plant litter. Previous studies have demonstrated that the porosity of biological pores created by earthworms is significantly higher than the overall soil porosity [34], primarily due to the increased permeability of biological pores formed during earthworm burrowing activities. These findings suggest that the biological activities of earthworms, particularly those attracted by straw food sources, significantly improve soil porosity.
The equivalent pore network model (PNM) is widely utilized to accurately characterize pore structures, providing detailed information on pore dimensions and their spatial distribution. This information is critical for understanding the impact of earthworm activity on soil pores [35]. The PNM effectively captures key characteristics, such as connectivity and water conductivity. At the macroscopic level, significant differences in pore structure are observed under various driving conditions. In the T1 sample group, where straw food was used to attract earthworms, the pore system developed into more interconnected and staggered arrangements, markedly increasing soil porosity. After processing the pore space, four distinct pore network models were generated, as shown in Figure 5. These models include the following: (1) the overall pore network, presented in Figure 5a,e,i,m; (2) the earthworm food attraction-modified pore network (with soil pore noise removed), shown in Figure 5b,f,j,n; (3) the stick model, which reflects pore dimensions, shown in Figure 5c,g,k,o, where red represents larger pores, blue denotes smaller soil pores, and channel colors correspond to their respective pore sizes; and (4) the pore skeleton diagram, depicting channel dimensions, as illustrated in Figure 5d,h,l,p. The color gradient represents pore channel width, with red indicating larger channels and blue signifying smaller ones. Statistical analyses reveal that the number of earthworm food attraction-modified channels increased by approximately tenfold compared to the control group, demonstrating that earthworm activity significantly enhances soil pore connectivity. Additionally, the reconstructed macropores were predominantly cylindrical, consistent with typical earthworm burrow characteristics [36]. Compared to CK group, the macropore volume in the earthworm food attraction models increased substantially, clearly illustrating the modifications in pore structure.

3.3. Quantitative Parameters of Pore Size Distribution (PSD)

The quantitative parameters of PSD play a critical role in earthworm farming systems and significantly impact soil structure improvement and plant growth [37]. Earthworms alter the soil pore structure through their burrowing activities. This modification not only improves soil aeration and drainage but also influences water retention and nutrient supply. The key PSD quantitative parameters, such as V, R, and pore morphology, provide detailed insights into the changes in soil pores. The analysis results are as follows.

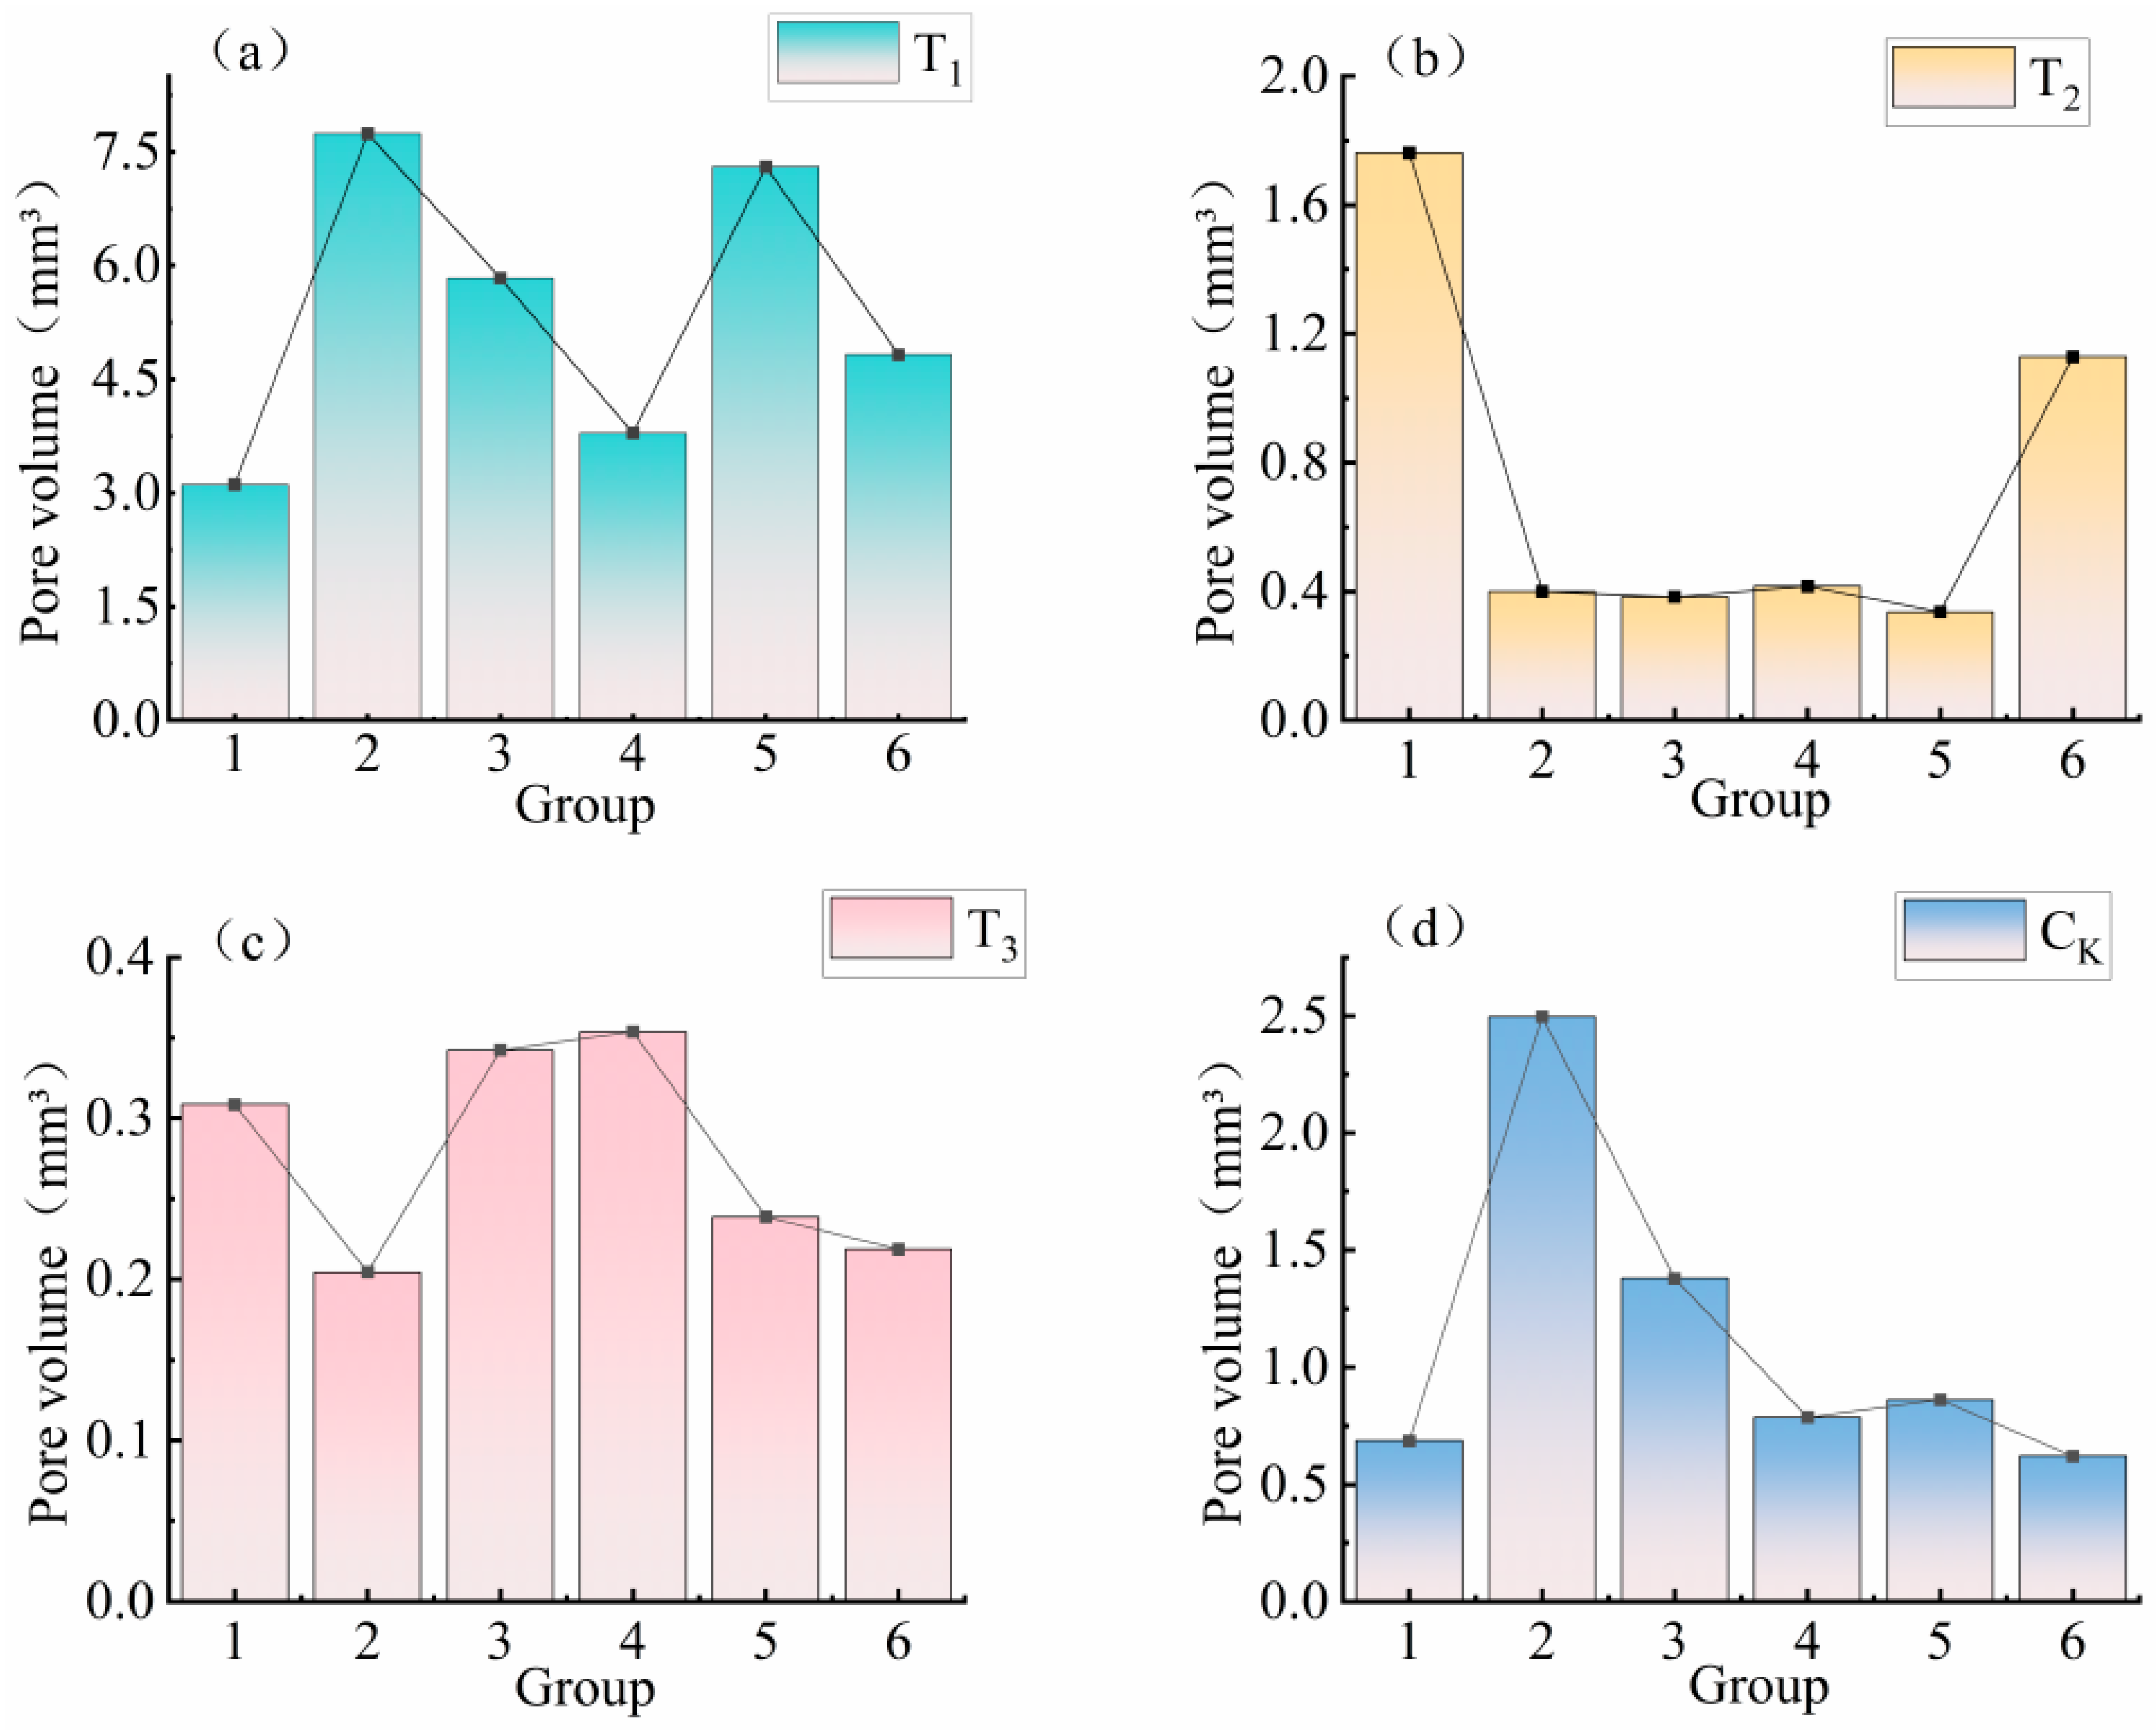
3.3.1. Pore Volume Analysis of Earthworm Food Attraction Formation

In this study, the total volume (Vi) of soil particles was calculated through image analysis, using the method of accumulating the pixel volume of the particles. Given the significant differences in pore sizes among the four test groups, V was divided into six categories. Due to the large amount of data, V was divided into six parts, and the average value of each part was taken. A pore volume line chart was generated, as shown in Figure 6a. The first group (V) reached 3.11 mm3, which was significantly higher than the other groups, while the volume in the second group decreased significantly. This reduction might be related to the accumulation of earthworms at the bottom of the tube. As shown in Figure 6a–d, the control group data indicated that the pore volume changes in the T2, T3, and CK groups were relatively stable, while the average volume in the T1 group was 5.49 times higher than that in the undisturbed CK group. Studies have shown that the effects of earthworm activity on soil vary across different soil types [34]. The V distribution in the T2 and T3 groups was relatively smooth, similar to observations in sandy soils. Although the pore distribution in the T2, T3, and CK groups was similar, there were significant differences in their volume distribution characteristics. Specifically, the T2 and T3 groups exhibited a relatively uniform volume distribution trend, while the T1 group showed significant changes in the initial layer and maintained a high, uniform distribution in the other layers. The results of this test indicated that the macropores formed by earthworm activity after food attraction had larger volumes. Such macropores are known to increase the aeration and permeability of the soil [38].

3.3.2. Pore Equivalent Diameter Analysis

The measurement of the equivalent diameter provides a quantitative description of pore structure, allowing the changes in activity due to food attraction of earthworms to be clearly observed and offering an effective means to evaluate how large networks of pores improve soil structure [39]. In this study, the equivalent R was used to categorize pores, as shown in Figure 7. Pores were divided into MP, PH, MH, and MPS categories, where pores with R < 0.5 mm were classified as MP, 0.5 mm ≤ R < 0.7 mm as PH, 0.7 mm ≤ R < 1 mm as MH, and R ≥ 1 mm as MPS. The number of MPS pores detected in the T1 group was 8981, while T2 had 2401, T3 had 1940, and CK had 1842. The equivalent diameter in the T1 group was significantly larger, with MPS pores being 4.88 times more prevalent than in the undisturbed CK group. For the MH level, the soil screened at 1.6 mm was uniformly improved in the CK group under earthworm activity, but the significant increase in the T1 group indicated that earthworm activity, along with the straw driving factors, played a crucial role in improving pore structure. In contrast, the number of mesopores in the T2 group increased significantly, while the pore distribution in the CK group remained relatively consistent. The analysis results indicated that the equivalent diameter of the networked macropores formed by decaying stalks and earthworms was much higher than that of the undisturbed soil, which had a beneficial effect on soil moisture transport.

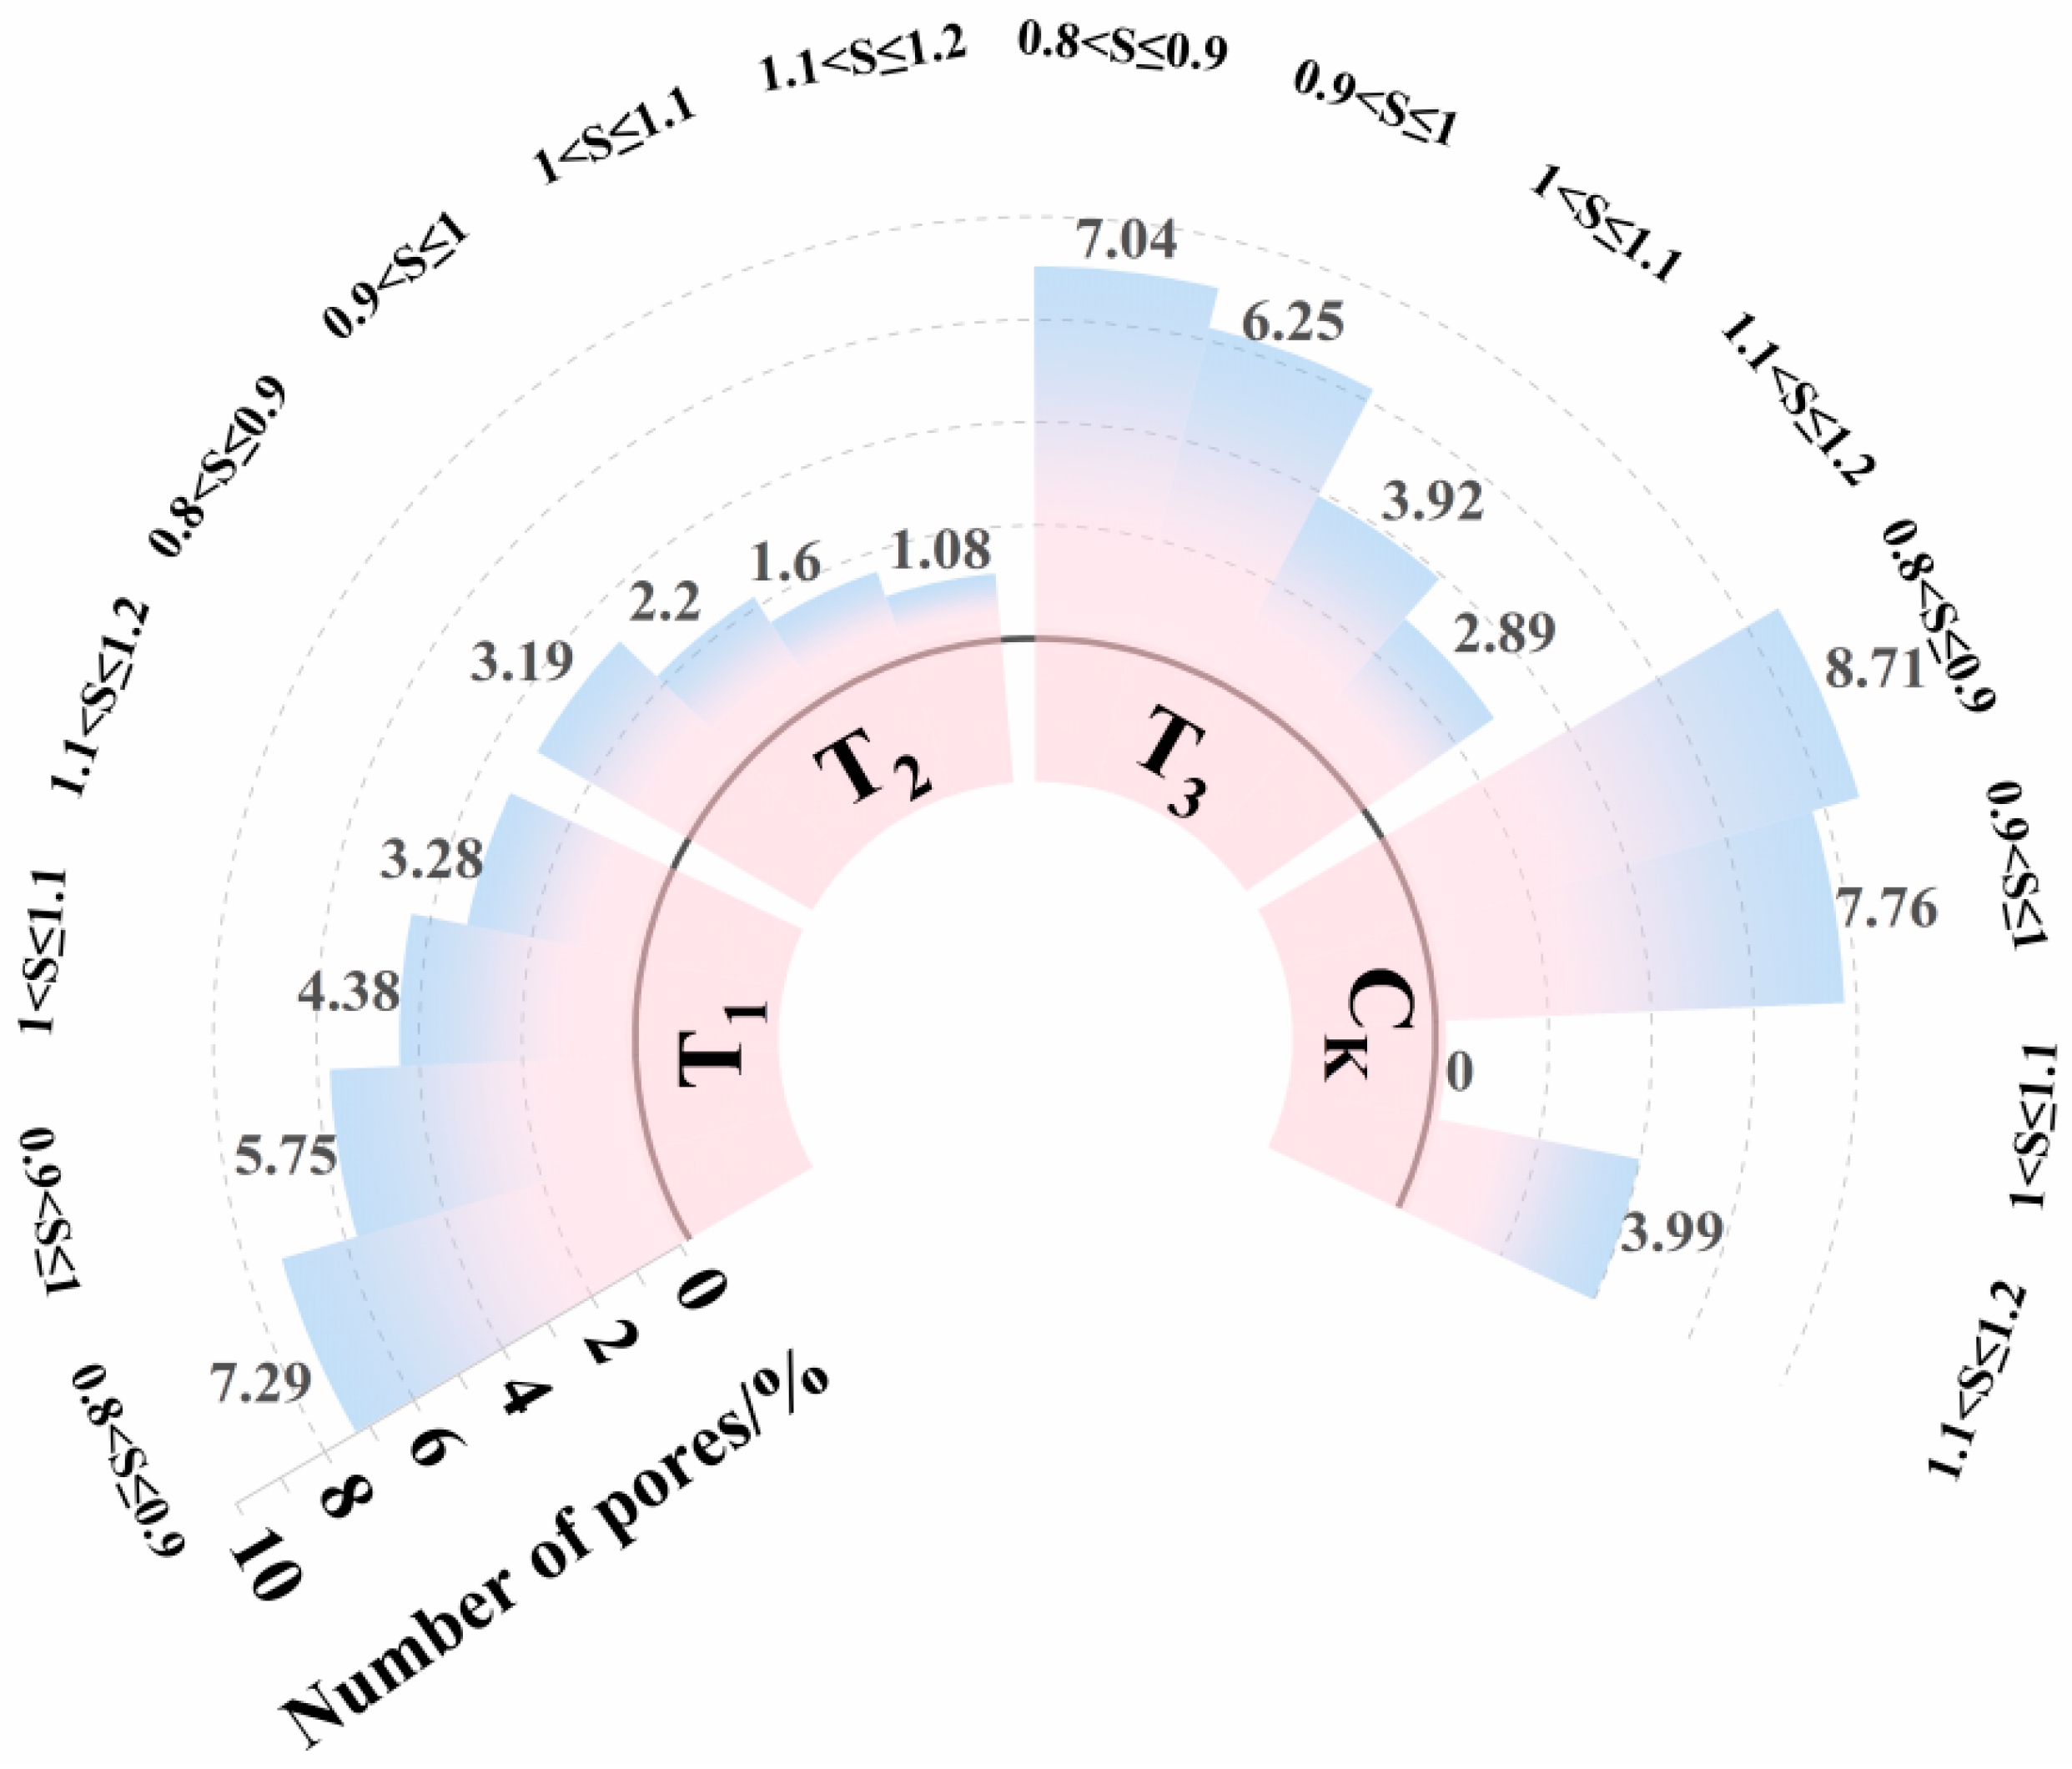
3.3.3. Pore Shape Factor

The shape of pores plays a crucial role in determining the flow, diffusion, and transmission characteristics of fluids. Form factors are used to quantitatively describe the impact of pore shape [40]. As shown in Figure 8, there were significant differences in the volume ratio of S under the four test conditions, including connecting pores, open pores, and isolated pores. To analyze these differences, the pores were classified as follows: pores with a form factor of 0.8 < S ≤ 0.9 were considered SH, 0.9 < S ≤ 1 were considered OH, 1 < S ≤ 1.1 were classified as CH, and pores with a form factor of 1.1 < S ≤ 1.2 were identified as BH. Pores with a form factor below 0.8 or above 1.2 were excluded. The proportion of SH pores in the T1 group was 7.29%, in the T2 group was 3.19%, in the T3 group was 7.04%, and in the CK group was 8.71%. The T1 group had a higher proportion of SH pores compared to the T2 and T3 groups, while the CK group had the highest proportion at 8.71%, likely due to the smaller number of earthworms, which resulted in fewer pore types and predominantly SH pores. For CH pores, the proportion in the T1 group was 4.38%, in the T2 group, it was 2.2%, in the T3 group, it was 3.92%, and no CH pores were detected in the CK group, likely due to the absence of driving factors, leaving SH as the dominant pore type. In the T1 group, the pore volume ratio followed the order of SH > OH > CH > BH, indicating that earthworm food attraction activity significantly promoted the formation of CH pores. Additionally, the number of CH pores in the T1 group was notably higher than in the other groups. In contrast, the CK group exhibited a pore volume ratio of SH > OH > BH. In the T1, T2, and T3 groups, the volume and number distribution of connecting pores were similar, with the T1 group having 4.38% more cylindrical pores than the CK group. These findings suggested that earthworm food attraction CH pores significantly improved soil permeability, drainage, and structural stability, positively influencing plant root growth and agricultural productivity.

3.4. Characteristics of Pore Channel Parameters

As shown in Figure 9a–d, channel length was classified into four levels: MD, SA, MA, and LA. Pores with L0 < 1 mm were categorized as MD, those with 1 mm ≤ L0 < 3 mm as SA, those with 3 mm ≤ L0 < 5 mm as MA, and those with L0 ≥ 5 mm as LA. Analyzing the LA group in Figure 9d, the T1 group had 1740 LA pores, while T2 had 349, T3 had 199, and CK had 122. These results show that, in the T1 group, after the introduction of decaying straw, the number of LA pores increased 14.26-fold compared to the CK group. In the T1 group, channels with an equivalent radius of less than 3 mm made up 59.6% of the total number of channels, while channels less than 5 mm accounted for 86.7%, indicating that the majority of channels in the T1 group were concentrated below 5 mm. Compared to the CK group, the number of channels across all size categories in the T1 group increased by 4.1- to 14.26-fold. The data also reveal that the channel lengths in the T1 group were primarily concentrated in the 1–5 mm range. Noteworthy, the other three groups had very few microporous channels, while the T1 group exhibited significant increases across all four channel size categories. These results demonstrate that earthworms create larger pores through their biological activities, significantly improving soil permeability and water retention capacity. This highlighted the critical role of earthworms in transforming soil structure.
According to the data in Figure 10a–d, the volume and number of pore channels in the four driving test tubes exhibited a decreasing trend. As the pore channel radius increased, the ratio of volume to radius gradually decreased. The analysis indicates that the number of particles with a pore channel radius less than 0.2 mm is high, but their volume is small, while the number of particles with a pore channel radius greater than 0.2 mm is significantly decreased. Earthworm activity had a significant impact on soil pore structure. Earthworms improve soil aeration and structural stability through physical disturbance, which directly alters the distribution and volume of pore channels [41]. Specifically, the volume and number of pore channels in the range of 0.2–0.8 mm were significantly higher in the T1 group compared to the T2, T3, and CK groups. The pore channel volume in the T1 group was 1.73 mm3, while it was 0.24 mm3 in the T2 group and 0.15 mm3 in the T3 group. The maximum pore channel volume in the T1 group reached 1.73 mm3, which was substantially greater than that in the other groups. This demonstrated that earthworm activity significantly increased both the volume and number of pore channels within this size range. Earthworm activity not only expanded the total volume of soil pores but also improved pore connectivity and uniformity, resulting in a more uniform and greater distribution of pore channels in the 0–0.4 mm range. Although there was no significant difference in the volume distribution density of pore channels in the 0–0.2 mm range across test tubes with different compaction levels, particles with pore channel radii greater than 0.4 mm showed almost no pore channel volume, except in the T1 group. In the T2, T3, and CK groups, the pore channel volume for radii greater than 0.65 mm was nearly zero. These findings suggested that earthworm activity significantly increased the overall volume of soil pore channels, particularly within the larger pore channel radius range. Therefore, it could be inferred that earthworms effectively improved the soil pore structure through their biological activity, resulting in a more optimized and regular distribution of pore channels. This improvement not only improved soil aeration but might also improve water retention and nutrient availability.

3.4.1. Analysis of Channel Tortuosity

Due to the complex geometry of capillaries, fluid flow in porous media typically follows a tortuous path rather than a straight trajectory [42]. Tortuosity quantifies the degree of bending in this flow path. Table 6 presents the tortuosity τ data for the four test groups. The results indicate that the maximum tortuosity (Max-τ) in the T1 group was significantly lower than that in the CK group, with values of 5.16 for T1 and 15.50 for CK. The average tortuosity (Avg-τ) values for the four groups were 1.18, 1.25, 1.20, and 1.21, respectively, demonstrating a decreasing trend of T1 < T2 < T3 < CK. As a result of earthworm activity-induced food attraction and associated food factors, the pore channels in the T1 group exhibited reduced tortuosity, which decreased water flow resistance through these channels.

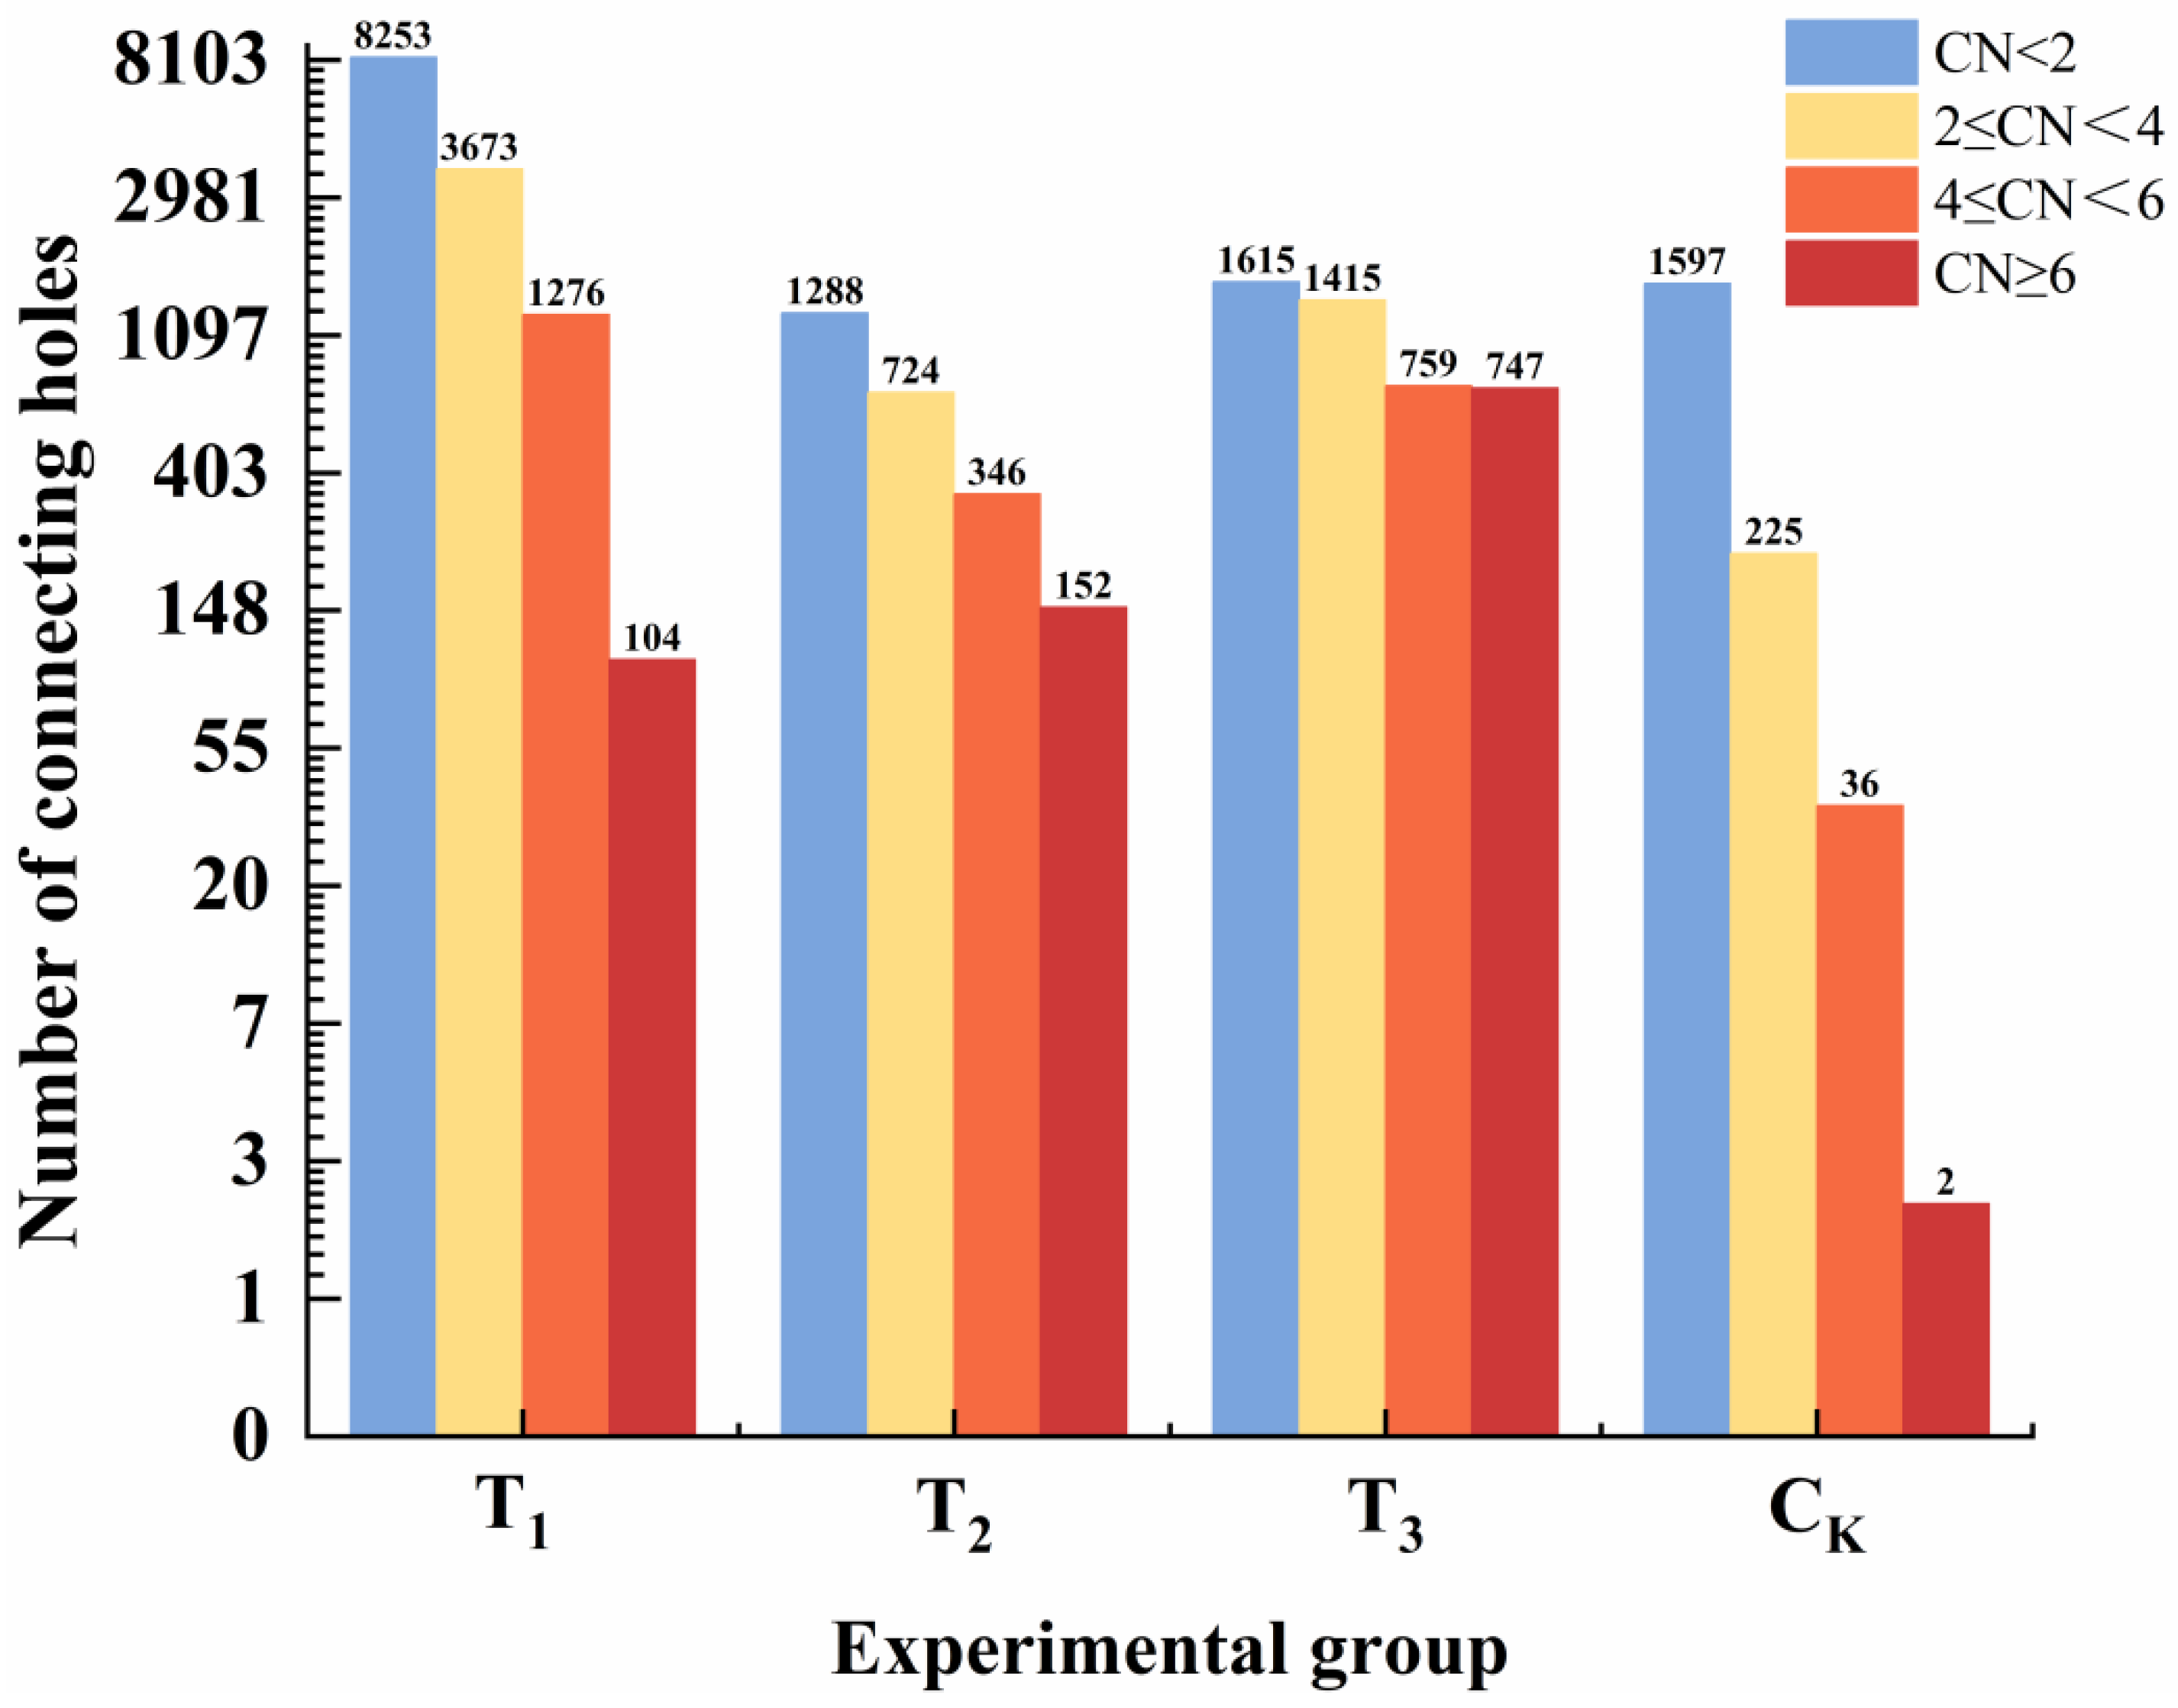
3.4.2. Coordination Number Analysis

The pore coordination number (CN) is a critical parameter for assessing pore connectivity, defined as the number of connections a pore has through pore channels [43]. As shown in Figure 11, a CN of 0 indicates completely isolated pores with no interconnections via pore channels. Higher CN values typically signify better pore network connectivity and more complex pore structures. Since isolated pores (CN = 0) do not adequately reflect changes in complex pore architectures, this study focused exclusively on the CN distribution of connected pores. As illustrated in Figure 11, pores with a CN of < 2 accounted for 62.02% of total pores in the T1 group, 51.3% in T2, 35.6% in T3, and 85.8% in the CK group. Compared to the CK group (1597 connected pores), the T1 group exhibited significantly more connected pores, i.e., 8253, while the T2 and T3 groups had 1288 and 1615 connected pores, respectively. Overall, the T1 group had a total of 13,306 connected pores, markedly higher than the 2510 in T2, 4536 in T3, and 1860 in CK. The increased number of connected pores, formed through earthworm activity-induced food attraction by decomposed straw, reduced fluid flow resistance while improving soil aeration and drainage capacity. Further analysis revealed that pores with CN between 4 and 6 numbered 1276 in the T1 group, compared to 346, 759, and 36 in the T2, T3, and CK groups, respectively. This indicates that the T1 group formed significantly more interconnected and complex pore networks, likely due to the larger pore structures created by earthworm activity, enhanced through food attraction of decomposed straw, which improved the overall pore connectivity. Additionally, the average CN in the T1 group (1.95) was significantly higher than that in the T2 (1.50), T3 (1.20), and CK (1.30) groups, demonstrating enhanced pore connectivity in T1. These findings underscore the critical role of earthworm activity in shaping soil pore structure. The elevated CN in the T1 group highlights how earthworm activity promotes macropore formation and connectivity, ultimately improving soil aeration and drainage capacity.

4. Conclusions

This study examined the effects of straw and micro-organisms on the formation of networked macropores by earthworms and compared the macropores created under the driving conditions of decomposed straw. Through the food attraction test using earthworms, various parameters such as pore structure, pore channel structure, and connectivity were analyzed. The main conclusions drawn from this study are as follows:
Decomposed straw significantly stimulated earthworm activity, promoting the formation of macropores. The number of earthworms attracted by decomposed straw reached 17, with a driving distance of 15.9 cm, which was notably higher than that observed in other treatment groups. This confirms that decomposed straw is more effective in attracting earthworms, and suggests that combining straw with Bacillus subtilis creates a viable food source for earthworms.
The complexity and interconnectivity of the pore structure in the T1 group were significantly higher than those in other groups. The porosity of the T1 group was 6.9%, T2 was 1.9%, and T3 was 1.5%, which was 6.9, 1.9, and 1.5 times greater, respectively, than that of the control group (CK). The T1 group had 8981 pores, four times more pores than the other groups, and included more cylindrical pores (4.38%), reflecting a more intricate pore structure. The combined influence of straw and micro-organisms optimized soil pore structure and improved air and water movement.
In the T1 group, the pore channel lengths created by earthworms were mainly concentrated between 1 and 5 mm, and the equivalent pore radius was primarily distributed between 1 and 9 mm. The equivalent radius in other groups did not exceed 4 mm. Compared to the CK group, the pores in the T1 group were longer and exhibited better fluidity. The average tortuosity of pores in the T1 group was 1.18, which is lower than that in other groups, indicating a more regular structure with better channel connectivity. Additionally, 98.2% of the pores in the T1 group had a coordination number of less than 6, further confirming its superior pore structure and its potential for improving soil quality.
Future research directions include further field validation to assess the long-term effects of crop performance and soil properties of this biological tillage method and to consider other earthworm substances, as earthworms of different ecological categories may participate in soil pore formation, which will help to obtain more comprehensive results. The application of this work to field situations may be limited due to the use of Eisenia fetida, that, in natural situations, is restricted to the organic layer on the surface of soils.

Author Contributions

Conceptualization, Z.Y. and B.W.; methodology, Y.L. (Yuping Liu); software, P.C.; validation, B.W., S.X. and P.C.; formal analysis, Y.L. (Yuping Liu); investigation, S.X.; resources, B.B.; data curation, Q.W.; writing-original draft preparation, P.C.; writing-review and editing, J.Z.; visualization, D.Z.; supervision, Y.L. (Yuxin Liu); project administration, B.W.; funding acquisition, B.W. and S.X. All authors have read and agreed to the published version of the manuscript.

Funding

This work was supported by the National Natural Science Foundation of China Youth Science Fund Project (B.W.; grant number 3220152034), Science and Technology Project of the Education Department of Jilin Province (S.X.; grant number JJKH20220334KJ), Jilin Provincial Department of Human Resources and Social Security’s “Postdoctoral Talent Support in Jilin Province” Project (B.W.; grant number 820231342418), and National Key R&D Program Projects for the 14th Five Year Plan (B.W.; grant number 2022YFD1500006 and 2023YFD1500045).

Data Availability Statement

Data will be made available on request. “Black land conservation background: Research on rotting straw driving earthworm (Eisenia fetida) tillage to create mesh macropores (data)” Mendeley Data, V2; https://data.mendeley.com/preview/wmnzpw7d34?a=0cabaeb0-ce00-4acf-95b4-15c3fe268b5a (accessed on 30 December 2024).

Acknowledgments

Our thanks to all the authors cited in this paper and the anonymous referees for their helpful comments and suggestions. All authors have read and agreed to the published version of the manuscript.

Conflicts of Interest

The authors declare that they have no conflicts of interest.

References

  1. FAO. Global Map of Black Soil; FAO: Rome, Italy, 2022. [Google Scholar] [CrossRef]
  2. Qu, Y.; Pan, C.; Guo, H. Factors Affecting the Promotion of Conservation Tillage in Black Soil—The Case of Northeast China. Sustainability 2021, 13, 9563. [Google Scholar] [CrossRef]
  3. Xu, X.Z.; Xu, Y.; Chen, S.C.; Xu, S.G.; Zhang, H.W. Soil loss and conservation in the black soil region of Northeast China: A retrospective study. Environ. Sci. Policy 2010, 13, 793–800. [Google Scholar] [CrossRef]
  4. Al-Mayahi, A.K.; Al-Ismaily, S.S.; Breitenstein, D.; Al-Busaidi, H.S.; Al-Maktoumi, A.K.; Lehmann, P.; Or, D.; Kacimov, A.R.; Fahrni, S.; Al-Shukaili, A.H. Soil water distribution and dynamics across prescribed capillary barriers under evaporating surfaces. Biosyst. Eng. 2023, 226, 55–70. [Google Scholar] [CrossRef]
  5. Mai, J.; Wang, Z.; Hu, F.; Huang, J.; Zhao, S.W. Study on soil hydraulic properties of slope farmlands with different degrees of erosion degradation in a typical black soil region. PeerJ 2023, 11, e15930. [Google Scholar] [CrossRef]
  6. Yan, B.; Zhang, Y.; Zang, S.; Chen, Q.; Sun, L. Distributions of Particle Sizes in Black Soil and Their Environmental Significance in Northeast China. Sustainability 2021, 13, 3706. [Google Scholar] [CrossRef]
  7. Niu, C.; Wang, Q.; Zhang, W.; Wang, K.; Guo, Z. Evaluation and Classification of Black Soil Structure Degradation in Jilin by Factor Analysis & Dynamic Clustering Analysis. In Proceedings of the 2nd International Conference on Advanced Measurement and Test (AMT 2011), Nanchang, China, 24–26 June 2011. [Google Scholar]
  8. Bonachela, S.; Lopez, J.C.; Granados, M.R.; Magan, J.J.; Hernandez, J.; Baille, A. Effects of gravel mulch on surface energy balance and soil thermal regime in an unheated plastic greenhouse. Biosyst. Eng. 2020, 192, 1–13. [Google Scholar] [CrossRef]
  9. Budhathoki, S.; Lamba, J.; Srivastava, P.; Williams, C.; Arriaga, F.; Karthikeyan, K.G. Impact of land use and tillage practice on soil macropore characteristics inferred from X-ray computed tomography. CATENA 2022, 210, 105886. [Google Scholar] [CrossRef]
  10. Léonard, J.; Perrier, E.; Rajot, J.L. Biological macropores effect on runoff and infiltration: A combined experimental and modelling approach. Agric. Ecosyst. Environ. 2004, 104, 277–285. [Google Scholar] [CrossRef]
  11. Ma, L.; Shao, M.A.; Fan, J.; Wang, J.; Li, Y. Effects of earthworm (Metaphire guillelmi) density on soil macropore and soil water content in typical Anthrosol soil. Agric. Ecosyst. Environ. 2021, 311, 107338. [Google Scholar] [CrossRef]
  12. Barron, C.; Clunes, J.; Pinochet, D.; Santelices, M. Does earthworm density change the quality of degraded volcanic soil? Appl. Soil Ecol. 2024, 193, 105154. [Google Scholar] [CrossRef]
  13. Hallam, J.; Berdeni, D.; Grayson, R.; Guest, E.; Holden, J.; Lappage, M.G.; Prendergast-Miller, M.; Robinson, D.A.; Turner, A.; Leake, J.R.; et al. Effect of earthworms on soil physico-hydraulic and chemical properties, herbage production, and wheat growth on arable land converted to ley. Sci. Total Environ. 2020, 713, 136491. [Google Scholar] [CrossRef]
  14. Chan, K.Y. An overview of some tillage impacts on earthworm population abundance and diversity-Implications for functioning in soils. Soil Tillage Res. 2001, 57, 179–191. [Google Scholar] [CrossRef]
  15. Bottinelli, N.; Hallaire, V.; Menasseri-Aubry, S.; Le Guillou, C.; Cluzeau, D. Abundance and stability of belowground earthworm casts influenced by tillage intensity and depth. Soil Tillage Res. 2010, 106, 263–267. [Google Scholar] [CrossRef]
  16. Scullion, J.; Malik, A. Earthworm activity affecting organic matter, aggregation and microbial activity in soils restored after opencast mining for coal. Soil Biol. Biochem. 2000, 32, 119–126. [Google Scholar] [CrossRef]
  17. Biradar, P.M.; Biradar, V.A. Influence of organic wastes on the biology of epigeic earthworm, Perionyx excavates during different seasons. J. Environ. Biol. 2015, 36, 1095–1100. [Google Scholar] [PubMed]
  18. Banfield, C.C.; Dippold, M.A.; Pausch, J.; Hoang, D.T.T.; Kuzyakov, Y. Biopore history determines the microbial community composition in subsoil hotspots. Biol. Fertil. Soils 2017, 53, 573–588. [Google Scholar] [CrossRef]
  19. Pham, Q.V.; Dang, H.X.; Nguyen, A.D.; Capowiez, Y.; Joquet, P.; Tran, T.M.; Rumpel, C.; Bottinelli, N. Interaction Between Anecic and Polyhumic Endogeic Earthworms Can Lead to Synergistic Effects on Soil Functioning. Appl Soil Ecol 2024, 200, 105438. [Google Scholar] [CrossRef]
  20. Song, K.; Sun, L.; Lv, W.; Zheng, X.; Sun, Y.; Terzaghi, W.; Qin, Q.; Xue, Y. Earthworms accelerate rice straw decomposition and maintenance of soil organic carbon dynamics in rice agroecosystems. PeerJ 2020, 8, e9870. [Google Scholar] [CrossRef]
  21. Liu, Y.; Zhao, S.; Zhu, Q.; Ding, W. Image grey value analysis for estimating the effect of microorganism inoculants on straws decomposition. Comput. Electron. Agric. 2016, 128, 120–126. [Google Scholar] [CrossRef]
  22. Turunen, M.; Hyväluoma, J.; Keskinen, R.; Kaseva, J.; Nikama, J.; Reunamo, A.; Rasa, K. Pore structure of wastewater sludge chars and their water retention impacts in different soils. Biosyst. Eng. 2021, 206, 6–18. [Google Scholar] [CrossRef]
  23. Whalen, J.K. Spatial and temporal distribution of earthworm patches in corn field, hayfield and forest systems of southwestern Quebec, Canada. Appl. Soil Ecol. 2004, 27, 143–151. [Google Scholar] [CrossRef]
  24. Niu, X.L.; Cheng, Y.F.; Feng, X.P.; Zhao, W.; Zhang, X.; Du, M.J.; Gu, Y.F. The effects of Eisenia fetida and metaphire guillelmi on the soil micro-food web in a microcosm experiment. PLoS ONE 2023, 18, e0290282. [Google Scholar] [CrossRef] [PubMed]
  25. Bertrand, M.; Barot, S.; Blouin, M.; Whalen, J.; Oliveira, T.; Roger-Estrade, J. Earthworm services for cropping systems. A review. Agron. Sustain. Dev. 2015, 35, 553–567. [Google Scholar] [CrossRef]
  26. Liu, Z.; Huang, Y.; Li, Q.; Zhang, L.; Liu, Z.; Zhang, Z.; Chen, Y. The improved remediation effect of the combined use of earthworms with bacillus subtilis -loaded biochar in ameliorating soda saline–alkali soil. Microorganisms 2025, 13, 1243. [Google Scholar] [CrossRef] [PubMed]
  27. Giuliani, L.M.; Hallett, P.D.; Loades, K.W. Effects of soil structure complexity on root growth of plants with contrasting root architecture. Soil Tillage Res. 2024, 238, 106023. [Google Scholar] [CrossRef]
  28. Torre, I.G.; Losada, J.C.; Tarquis, A.M. Multiscaling properties of soil images. Biosyst. Eng. 2018, 168, 133–141. [Google Scholar] [CrossRef]
  29. Pierret, A.; Capowiez, Y.; Belzunces, L.; Moran, C.J. 3D reconstruction and quantification of macropores using X-ray computed tomography and image analysis. Geoderma 2002, 106, 247–271. [Google Scholar] [CrossRef]
  30. Ning, W.; Zhou, S.; Long, K.; Xie, B.; Ai, C.; Yan, C. Investigation of key morphological parameters of pores in different grades of asphalt mixture based on CT scanning technology. Constr. Build. Mater. 2024, 434, 136770. [Google Scholar] [CrossRef]
  31. Liu, C.; Tong, F.; Yan, L.; Zhou, H.; Hao, S. Effect of Porosity on Soil-Water Retention Curves: Theoretical and Experimental Aspects. Geofluids 2020, 2020, 6679. [Google Scholar] [CrossRef]
  32. Doolittle, J.H. The effect of thigmotaxis on negative phototaxis in the earthworm. Psychon. Sci. 1971, 22, 311–312. [Google Scholar] [CrossRef]
  33. Van Schaik, L.; Palm, J.; Klaus, J.; Zehe, E.; Schroeder, B. Linking spatial earthworm distribution to macropore numbers and hydrological effectiveness. Ecohydrology 2014, 7, 401–408. [Google Scholar] [CrossRef]
  34. Frazão, J.; de Goedé, R.G.M.; Capowiez, Y.; Pulleman, M.M. Soil structure formation and organic matter distribution as affected by earthworm species interactions and crop residue placement. Geoderma 2019, 338, 453–463. [Google Scholar] [CrossRef]
  35. Jarvis, N.J. A review of non-equilibrium water flow and solute transport in soil macropores: Principles, controlling factors and consequences for water quality. Eur. J. Soil Sci. 2020, 71, 279–302. [Google Scholar] [CrossRef]
  36. Capowiez, Y.; Cadoux, S.; Bouchand, P.; Roger-Estrade, J.; Richard, G.; Boizard, H. Experimental evidence for the role of earthworms in compacted soil regeneration based on field observations and results from a semi-field experiment. Soil Biol. Biochem. 2009, 41, 711–717. [Google Scholar] [CrossRef]
  37. Sharifzadeh, M.; Mitani, Y.; Esaki, T.; Urakawa, F. An investigation of joint aperture distribution using precise surface asperities measurement and GIS data processing. In Proceedings of the ISRM International Symposium/3rd Asian Rock Mechanics Symposium (ARMS), Kyoto, Japan, 30 November–2 December 2004. [Google Scholar]
  38. Hallam, J.; Holden, J.; Robinson, D.A.; Hodson, M.E. Effects of winter wheat and endogeic earthworms on soil physical and hydraulic properties. Geoderma 2021, 400, 115126. [Google Scholar] [CrossRef]
  39. Deks, L.K.; Williams, A.G.; Dowd, J.F.; Scholefield, D. Quantification of pore size distribution and the movement of solutes through isolated soil blocks. Geoderma 1999, 90, 65–86. [Google Scholar] [CrossRef]
  40. Glab, T. Application of image analysis for soil macropore characterization according to pore diameter. Int. Agrophys. 2007, 21, 61–66. [Google Scholar]
  41. Mele, G.; Buscemi, G.; Gargiulo, L.; Terribile, F. Soil burrow characterization by 3D image analysis: Prediction of macroinvertebrate groups from biopore size distribution parameters. Geoderma 2021, 404, 115292. [Google Scholar] [CrossRef]
  42. Ghanbarian, B.; Lin, Q.; Pires, L.F. Scale Dependence of Tortuosity in Soils under Contrasting Cultivation Conditions. Soil Tillage Res. 2023, 233, 105788. [Google Scholar] [CrossRef]
  43. Li, G.Y.; Dai, S.; Zhan, L.T.; Chen, Y.M. A pore-scale numerical investigation of the effect of pore characteristics on flow properties in soils. J. Zhejiang Univ. 2019, 20, 961–978. [Google Scholar] [CrossRef]
Figure 1. Test schematic, soil extraction, pretreatment, microscopic observation of soil cracks, soil preparation, earthworm food attraction test, and CT scan treatment.
Agriculture 15 01397 g001
Figure 2. The purpose of the original characterization of pores using a microscope is to observe the normal pore cracks and biological pores on the surface and compare them with the internal pores visualized by CT scanning. Microscopic original pores: (a) 1 mm soil pore map; (b) 400 µm soil pore map; and (c) 100 µm soil pore map.
Agriculture 15 01397 g002
Figure 3. The synergistic effect of earthworms, micro-organisms, and straw. The upper left diagram shows that Bacillus subtilis provides a value-added environment in the mucus and feces of earthworms, and earthworms form a large number of soil macropores. The lower left diagram shows that straw provides a food source for Bacillus subtilis, promotes the generation of nutrients and inorganic salts, and accelerates the maturity of straw. The upper right image shows that earthworms accelerate the decomposition and transformation of straw, while decomposed straw provides food sources for earthworms, and both provide organic carbon to the soil. The figure in the right corner shows that the decomposed straw can provide soil nutrients for straw returning to the field and can comprehensively regulate the soil microbial community.
Agriculture 15 01397 g003
Figure 4. Two-dimensional porosity diagram φ, the colors represent the processing groups, and the picture on the right is the original CT image with a smaller gap.
Agriculture 15 01397 g004
Figure 5. A network model. Color is used to distinguish earthworm pores from conventional pores. In the stick model, red indicates that the pore is larger, and blue indicates that the pore is smaller, and the color of the connected pipe is the same as that of the pipe. In the skeleton model, red indicates that the pore throat pipe is larger, and purple indicates that it is smaller. (a) The pore network model of group T1; (b) the pore network model for food attraction by earthworms after removing soil pore noise in group T1; (c) the bat model of group T1; (d) the pore skeleton diagram of group T1; (e) the pore network model of group T2; (f) the earthworm food attraction pore network model of the T2 group after removing the noise of soil pores; (g) the stick model of the T2 group; (h) the pore skeleton diagram of the T2 group; (i) the pore network model of group T3; (j) the earthworm food attraction pore network model of the T3 group after removing the noise of soil pores; (k) the stick model of the T3 group; (l) the pore skeleton diagram of the T3 group; (m) the pore network model of the CK group; (n) the earthworm food attraction pore network model of the CK group after removing the noise of soil pores; (o) the stick model of the CK group; (p) the pore skeleton diagram of the CK group.
Agriculture 15 01397 g005
Figure 6. Pore volume. (a) The average pore volume of the six layers of component T1; (b) the average pore volume of the six layers of component T2; (c) the average pore volume of the six layers of component T3; (d) the average pore volume of the six layers of component CK. The six categories were divided into six parts because of the large amount of data, and the average value of each part was calculated for drawing.
Agriculture 15 01397 g006
Figure 7. Pore equivalent diameter.
Agriculture 15 01397 g007
Figure 8. Shape factor volume ratio.
Agriculture 15 01397 g008
Figure 9. Channel length. (a) The comparison of the number of pores in the T1, T2, T3, and CK groups at the MD level. (b) The comparison of the number of pores in the T1, T2, T3, and CK groups at the SA level. (c) The comparison of the number of pores in the T1, T2, T3, and CK groups at the MA level. (d) The comparison of the number of pores in the T1, T2, T3, and CK groups in the LA grade.
Agriculture 15 01397 g009
Figure 10. The relationship between pore channel radius and pore channel volume. (a) The scatter distribution of pore channel volume based on channel radius in the T1 group; (b) the scatter distribution of pore channel volume based on channel radius in the T2 group; (c) the scatter distribution of pore channel volume based on channel radius in the T3 group; (d) the scatter distribution of pore channel volume based on channel radius in the CK group.
Agriculture 15 01397 g010
Figure 11. Coordination number; grouping refers to the color of the note in the picture.
Agriculture 15 01397 g011
Table 1. Symbols and meanings of symbols used in formulas.
SymbolsMeanings
BDVolume weight of soil
WSSoil moisture content
TTemperature
PHSoil pH
earthwormEisenia foetida
CTComputed Tomography
strawCorn stalk powder (1 mm)
Micro-organismsBacillus subtilis
T1Fermented corn stover powder after 7 days of mixed fermentation of Bacillus subtilis and water
T2Corn stalk
T3Bacillus subtilis mixed with water
CKControl group
ECEarthworm count (strip)
EDDEarthworm food attraction distance (cm)
VTheoretical volume
VCActual volume
AP, AThey are the pore area on each slice and the total area of the slice.
A0Represents the three-dimensional pore surface area
LThe length of a pore throat.
LTThe actual path length of the throat.
(xi, yi, zi) and (xk, yk, zk)Represents the starting point and end Point of the three-dimensional Coordinates of the hole section
PNMEquivalent pore-network model
PSDPore size distribution
V′Three-dimensional porosity
φSurface porosity
VPore volume
REquivalent diameter
SShape factor
R0Throat radius
L0Throat length
V0Throat volume
τTortuosity
CNCoordination number
MPMicropore
PHEyelet
MHMiddle hole
MPSMacropore
SHSpherical cavity
OHOval hole
CHCylindrical hole
BHBranch hole
MDMicroporous diameter
SASmall aperture
MAMedium aperture
LALarge aperture
Table 2. Soil properties in experiment.
BD (g/cm3)WS (%)T (°C)pHClay
(g/kg)
Sand
(g/kg)
Silt
(g/kg)
0.88–1.2619.6–21.423.2–24.76.8–7.9107.1 ± 3823 ± 769.9 ± 6
Table 3. Comparison of earthworm food attraction, and four groups of difference.
Comparative Test GroupT1T2T3CK
Micro-organisms (g)300300
Straw (g)353500
Table 4. The number of earthworms in tubes and the farthest food attraction distance.
Comparison of the Experimental Group
EC (Strip)T1T2T3CKP
17.66 ± 1.159 ± 17 ± 0.581.33 ± 0.58>0.001
EDD (cm)15.43 ± 0.5012.13 ± 0.5510.03 ± 0.601.7 ± 0.40>0.001
Table 5. Three-dimensional porosity.
DisposeVolume FractionLabel Volume (nm3)Mask Volume (nm3)Label Voxel CountMask Voxel Count
T10.0697.2 × 10221.0 × 10241.41 × 1062.02 × 107
T20.0191.7 × 10228.8 × 10232.56 × 1051.31 × 107
T30.0151.6 × 10221.0 × 10246.21 × 1053.92 × 107
CK0.0106.7 × 10216.6 × 10232.30 × 1052.29 × 107
Table 6. Tortuosity.
T1T2T3CK
Max-τ5.163.7110.4915.50
Avg-τ1.181.251.201.21
Disclaimer/Publisher’s Note: The statements, opinions and data contained in all publications are solely those of the individual author(s) and contributor(s) and not of MDPI and/or the editor(s). MDPI and/or the editor(s) disclaim responsibility for any injury to people or property resulting from any ideas, methods, instructions or products referred to in the content.

