Article

Stomatal–Hydraulic Coordination Mechanisms of Wheat in Response to Atmospheric–Soil Drought and Rewatering

1
State Key Laboratory of Water Cycle and Water Security in River Basin, China Institute of Water Resources and Hydropower Research, Beijing 100038, China
2
Department of Irrigation and Drainage, China Institute of Water Resources and Hydropower Research, Beijing 100038, China
*
Author to whom correspondence should be addressed.
Agriculture 2025, 15(13), 1375; https://doi.org/10.3390/agriculture15131375 (registering DOI)
Submission received: 16 May 2025 / Revised: 25 June 2025 / Accepted: 26 June 2025 / Published: 27 June 2025
(This article belongs to the Section Agricultural Water Management)

Abstract

Drought stress severely limits agricultural productivity, with atmospheric and soil water deficits often occurring simultaneously in field conditions. While plant responses to individual drought factors are well-documented, recovery mechanisms following combined atmospheric–soil drought remain poorly understood, hindering drought resistance strategies and irrigation optimization. We set up two VPD treatments (low and high vapor pressure deficit) and two soil moisture treatments (CK: control soil moisture with sufficient irrigation, 85–95% field capacity; drought: soil moisture with deficit irrigation, 50–60% field capacity) in the pot experiment. We investigated wheat’s hydraulic transport (leaf hydraulic conductance, Kleaf) and gas exchange (stomatal conductance, gs; photosynthetic rate, An) responses to combined drought stress from atmospheric and soil conditions at the heading stage, as well as rewatering 55 days after treatment initiation. The results revealed that: (1) high VPD and soil drought significantly reduced leaf hydraulic conductance (Kleaf), with a high VPD decreasing Kleaf by 31.6% and soil drought reducing Kleaf by 33.2%; The high VPD decreased stomatal conductance (gs) by 43.6% but the photosynthetic rate (An) by only 12.3%; (2) After rewatering, gs and An of atmospheric and soil drought recovered relatively rapidly, while Kleaf did not; (3) Atmospheric and soil drought stress led to adaptive changes in wheat’s stomatal regulation strategies, with an increasing severity of drought stress characterized by a shift from non-conservative to conservative water regulation behavior. These findings elucidate wheat’s hydraulic–stomatal coordination mechanisms under drought stress and their differential recovery patterns, providing theoretical foundation for improved irrigation management practices.

1. Introduction

Climate change has intensified the frequency and severity of drought events, posing significant threats to agricultural productivity [1]. Crops increasingly experience compound drought stress combining soil moisture deficit and atmospheric aridity (driven by vapor pressure deficit, VPD) during growth cycles [2]. Concurrent atmospheric and soil drought events occur more frequently than isolated drought in natural environments [3], causing disproportionately severe impacts on crop development [4]. The asynchronous recovery patterns between soil moisture (replenishable through irrigation) and atmospheric dryness (relatively stable) necessitate the systematic investigation of crop responses to combined drought stress and rewatering.
The impact mechanism of drought stress on the physiological processes of crops has always been a focal point of research for scientists. Plants regulate water balance through hydraulic adjustments and stomatal control under drought, although these adaptations may compromise functional recovery post-rewatering [5]. Both atmospheric and soil drought substantially inhibit key physiological processes in crops. Soil drought reduces midday leaf water potential (ΨMD) in wheat [6] and rice [7] and decreases stomatal conductance (gs) in wheat [8], subsequently limiting the photosynthetic rate (An) through restricted CO2 uptake [9]. Reduced leaf hydraulic conductivity (Kleaf) under soil drought directly impacts stomatal function and photosynthesis in rice [7], with leaf vein density, thickness [10], and aquaporin activity [11] significantly influencing Kleaf regulation. The Kleaf reductions correlate strongly with impaired gas exchange [12], while recent evidence suggests that C3 plants optimize water use efficiency through reduced Kleaf/An ratios during drought, minimizing hydraulic demand per photosynthetic unit [13]. Elevated VPD reduces gs and An in maize [14], potentially through leaf water potential mediation [15]. High VPD significantly reduces plant hydraulic conductance [16], but research on the effects of high VPD on crop Kleaf is limited.
Stomatal regulation strategies diverge into isohydric (strict water potential control) and anisohydric (tolerant water potential variation) modes based on hydraulic sensitivity [17,18]. Isohydric species prioritize hydraulic safety through rapid stomatal closure, maintaining stable water potential and embolism resistance at the cost of carbon assimilation [19], while anisohydric plants sustain stomatal opening and photosynthesis under declining water potential [20]. Winter wheat exhibits anisohydric regulation under soil drought [21], contrasting with maize’s isohydric strategy [22]. To quantitatively evaluate plant isohydric versus anisohydric water regulation strategies, previous studies have established several methodological approaches. Skelton et al. [23] fitted the relationship curve between gs and leaf water potential (Ψx). When maximum stomatal conductance declines by 50%, the intersection of its tangent with the water potential axis was defined as the stomatal closure point, representing a loss of 88% of maximum gs, with the corresponding water potential value defined as Ψgs88. The difference between Ψgs88 and P50 (leaf water potential at which a 50% loss of Kleaf occurs) is called the stomatal safety margin (SSM50) [24]. A positive value indicates that stomatal closure occurs before hydraulic conductance declines, representing the isohydric regulatory behavior; a negative value indicates that stomatal closure occurs after hydraulic conductance declines, representing the anisohydric regulatory behavior. Furthermore, higher SSM50 values indicate the stronger coordination ability of the plant.
Previous studies have conducted a series of research on recovery mechanisms following rewatering after drought. The gas exchange recovery degree of plants after drought rewatering depends on the severity of drought experienced [25], and recent research has found that any damage occurring in the terminal portions of plant water transport pathways can lead to decreased leaf function [26]. The main cause of plant hydraulic system damage under drought is the formation of air bubbles in xylem vessels that block water transport, forming embolisms [27]. After embolism formation, plants can recover through the growth of new xylem vessels and the dissolution of bubbles into surrounding liquid water [28]. Existing research on plant hydraulic transport limitations under soil drought and recovery after rewatering has mainly focused on woody plants. For example, in Eucalyptus viminalis, the recovery of An after drought rewatering is related to the occurrence of embolism in the leaf water transport system; when 35% of the leaf vein area of a single leaf has embolism, leaf An may recover slightly but will quickly die [29]. When leaves have not experienced hydraulic system damage [30], gas exchange in evergreen coniferous tree species can rapidly recover after experiencing mild drought stress [31], while some other tree species experience only partial recovery of gas exchange after longer drought periods due to hydraulic system damage [32]. Research on crops indicates that the recovery of gas exchange after rewatering depends on the restoration of hydraulic function, possibly involving the active repair of leaf embolism [33]. After experiencing soil drought and subsequent rewatering, maize compensates for drought-induced damage by accelerating growth and enhancing photosynthesis [34]. However, in wheat, leaf vein embolism experienced after soil drought prevents leaf function from recovering after rewatering [35].
These research findings suggest that our understanding of crop hydraulic transport, stomatal behavior, and gas exchange recovery mechanisms under combined drought stress and after soil drought alleviation remains limited. Based on existing research progress and gaps, this study proposes the following hypotheses: (1) combined atmospheric and soil drought significantly reduce leaf hydraulic transport and gas exchange capacity; (2) gas exchange recovery and hydraulic characteristic recovery occur at different rates and are not independent of each other, with leaf physiological characteristics recovering faster under low VPD compared to high VPD after rewatering; (3) the coordination between stomata and hydraulics differs after drought and rewatering, causing wheat to adopt different stomatal strategies.
Through potted experiments, this study explores the physiological recovery process of wheat after experiencing combined drought stress (combination of atmospheric and soil drought) and soil rewatering, aiming to elucidate the synergistic mechanism between the hydraulic system and stomatal regulation during drought and rewatering, providing a scientific basis for optimizing irrigation strategies and improving crop drought resistance.

2. Materials and Methods

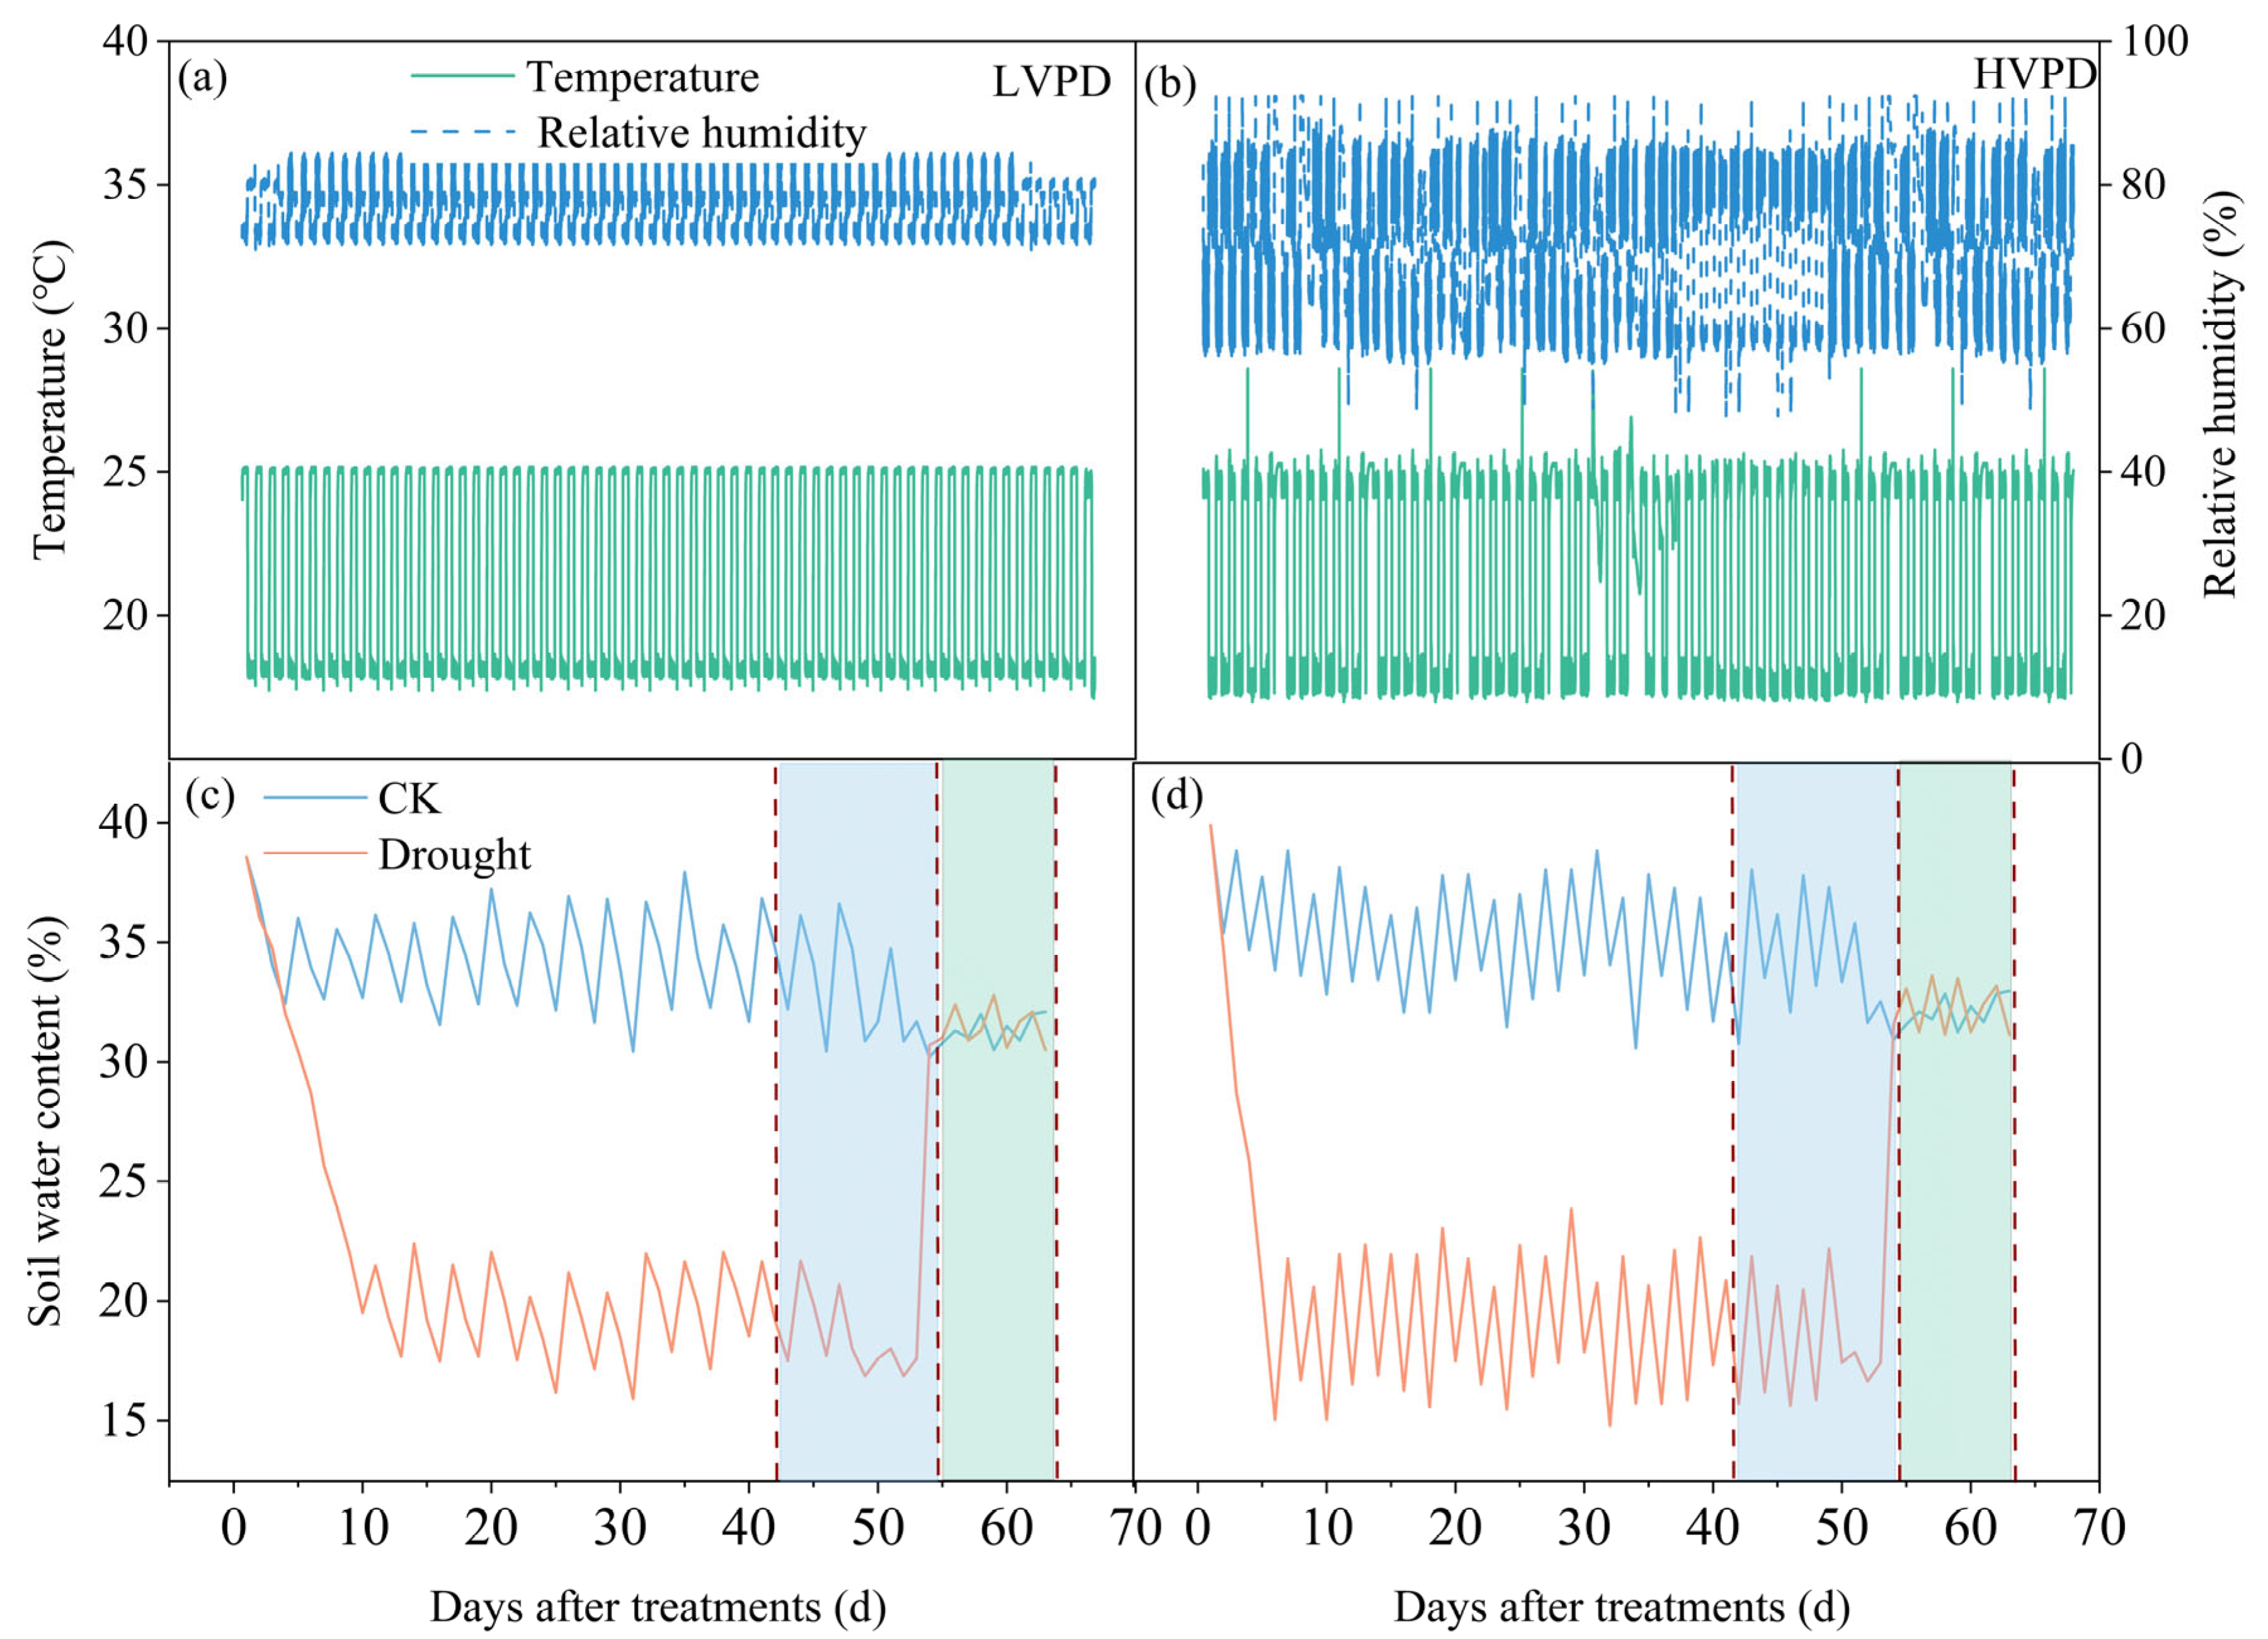
2.1. Experimental Design

The experiment was conducted in a controlled environment chamber at the Daxing Experimental Research Base of China Institute of Water Resources and Hydropower Research (39°37.25′ N, 116°25.51′ E). The chamber featured programmable temperature and humidity controls with automated real-time monitoring. We measured wheat leaf hydraulic parameters, gas exchange, and stomatal characteristics to investigate the coordination between stomatal behavior and hydraulic transport in response to combined drought stress and soil rewatering treatments. The sowing date was 20 August 2023. The measurement period for the drought treatment was from 30 September 2023 to 10 October 2023. The measurement period following rewatering was from 11 October 2023 to 20 October 2023. The study used potted wheat (“Jimai 22, moderate drought resistance”) grown in uniform plastic pots (5.6 L volume; 24 cm top diameter, 20 cm bottom diameter, 25 cm depth). Each pot contained 2.3 kg of soil with a bulk density of 1.4 g cm−3 and field capacity (FC) of 38% volumetric water content. Twenty-five seeds were sown per pot at 2–3 cm depth and thinned to ten uniform seedlings after emergence ten days after sowing. To prevent nutrient deficiency, pots were irrigated to FC with Hoagland nutrient solution (5 mM KNO3, 5 mM Ca(NO3)2·4H2O, 1 mM KH2PO4, pH 6.0) one day after sowing. Prior to treatment initiation (four days after thinning), all pots were maintained at FC by daily gravimetric watering.
Based on previous research [36], we established two daytime VPD levels: regular low VPD (LVPD, 0.79 kPa, maintained at 25 °C with 75% relative humidity) and high VPD stress (HVPD, 1.43 kPa, maintained at 25 °C with 55% relative humidity). For both VPDs, nighttime temperature and humidity were set at 18 °C and 80%, respectively. We established two soil moisture treatments: CK (control with sufficient irrigation.) and drought treatments by controlling irrigation through periodic withholding of water to maintain different soil moisture levels. The soil volumetric water content was maintained between 85 and 95% of field capacity (FC) for CK and between 50 and 60% FC for drought treatment following previous research [37]. The treatments began two weeks after sowing. Soil moisture levels were controlled by weighing the pots and withholding water as needed. Tap water was used for irrigation, with mineral ion concentrations considered negligible for experimental purposes. No water leakage occurred during the experimental period.
Temperature and humidity fluctuations in the climate chamber were continuously monitored using automated detection equipment. The soil water content for each treatment was measured daily at 8:00 a.m. using the gravimetric method. Changes in temperature, humidity, and soil volumetric water content throughout the experimental period are presented in Figure 1. Measurements of physiological parameters began at the heading stage (42 days after treatment initiation). Throughout the measurement period, soil moisture levels in all treatments were maintained within predetermined irrigation thresholds, while VPD was kept at set levels. Approximately 55 days after treatment initiation, previously drought-stressed plants were rewatered to restore the soil moisture content to levels equivalent to the CK.

2.2. Measurement Method

2.2.1. Leaf Gas Exchange Parameters

Gas exchange measurements were conducted between 10:00 and 14:00 using the Li-COR6800 photosynthesis system (LI-COR Inc., Lincoln, NE, USA). For each treatment, 5 pots were randomly selected from the 9 pot replicates. One plant per pot was then randomly chosen, and its flag leaf was cut. Ultimately, 5 flag leaves were obtained per treatment for measurement. The leaf chamber was maintained at an ambient temperature and humidity level matching the treatment. Photosynthetically active radiation was set to 1200 μmol m−2 s−1 with a controlled CO2 concentration of 400 ppm. Measured parameters included An and gs. For each treatment, 5 pots were randomly selected from the 9 pot replicates. One plant per pot was then randomly chosen, and its flag leaf was cut. Ultimately, 5 flag leaves were obtained per treatment for measurement.

2.2.2. Midday Leaf Water Potential

Leaf water potential was measured with a pressure chamber (PMS Instrument Company, Albany, OR, USA). For each treatment, 5 pots were randomly selected from the 9 pot replicates. One plant per pot was then randomly chosen, and its flag leaf was cut. Ultimately, 5 flag leaves were obtained per treatment for measurement. Flag leaf samples for midday leaf water potential (ΨMD) were collected at midday (between 11:30 am and 1:30 pm). The flag leaves of heading stage were cut and immediately sealed in plastic bags containing a moist towel and kept in a cooler until balancing pressures were determined in the laboratory. The leaf was immediately transferred into a portable plant water potential pressure chamber with the leaf cutout protruding at the gas chamber cover. Once the air chamber was tightened, the chamber was slowly pressurized, and the area of the cut was examined under a magnifying glass. As soon as water drops emerged, the pressure was immediately stopped and the water potential (-MPa) was recorded [38].
We calculated the water potential recovery rate: Recovery rate (%) = (ΨMD after rewatering − ΨMD during drought)/(ΨMD during drought) × 100.

2.2.3. Leaf Hydraulic Conductance

Kleaf was measured via the evaporative flux method (EFM) [39]. For each treatment, 5 pots were randomly selected from the 9 pot replicates. One plant per pot was then randomly chosen, and its flag leaf was cut. Ultimately, 5 flag leaves were obtained per treatment for measurement. Flag leaves with 5 cm sheaths, which had completed the gas exchange measurements as described in the subsequent Section 2.2.1, were cut under distilled water before the lamps were turned on. The sheathes of flag leaves were connected to the water pipe using a hose tape. A hose tape and a cork were used to achieve seamless connection between leaf sheathes and the tube. One end of a low-resistance transparent tube with an inner diameter of 2 mm (Oupli company, Shanghai, China) filled with water was connected to the graduated cylinder containing water on a balance of HR-150AZ (AND, Shenzhen, China). The surface of the measured leaf was wiped with tissue paper, then placed on a transparent fishing line net, and irradiated by a lamp of 600 W (Samsung Company, Guangdong, China). Leaves were lifted higher than the water surface of the cylinder to determine whether bubbles occurred in the connection. Wet paper towels were placed in the balance chamber to minimize water loss except for leaf transpiration and to eliminate bubbles from the tube. At the same time, the water weight in the graduated cylinder and the slope between weight and time were recorded every 10 s by RsWeight software, which was connected to the balance. The water loss rate into the leaves was recorded until it was stable for a period of time (>15 min). The leaves were subsequently placed in dark plastic bags with wet paper towels inside to balance for at least 10 min; then, the leaf area (LA). The LA was calculated using ImageJ (Version 1.53t; NIH, USA) based on full-leaf photographs. The final leaf water potential (Ψfinal) was measured. Kleaf was calculated according to Equation (1) [40]:
K l e a f = F L A × Ψ f i n a l
where ∆Ψ = ΨwaterΨfinal, Ψwater = 0.

2.2.4. Leaf Hydraulic Vulnerability Curves and Stomatal Closure Thresholds

Twenty plants with a flag leaf and at least two fully expanded leaves were selected from the 9 replicates (9 pots, with 10 plants growing in each pot) of each treatment. Due to the complexity of the measurement process, a complete vulnerability curve was measured for each treatment in this experiment. These plants were recut, retaining two fully expanded leaves below the flag leaf under distilled water before the climate-controlled growth chamber lamps turned on. Then, the plants were placed in a dark environment for rewatering. Owing to the time consuming EFM for Kleaf measurement described above, we recut the stems of plant to eliminate air bubbles and utilized the Li-COR 6800 photosynthetic assay system (LI-COR, Inc., Lincoln, NE, USA) to measure E for calculating Kleaf. After the stomata of the flag leaf of the plant were opened via an irradiation lamp with a PPFD of 1350 μmol m−2 s−1 (Qixiang, Shenzhen, China) for approximately 10 min, E of the flag leaf was measured. Then, Ψleaf of the flag leaf was measured. The leaf water potential of the other two leaves were measured, and the absolute difference of two leaf water potentials (Ψ0) should be less than 0.1 MPa. For plants under severe drought, this value may be less than 0.3 MPa. If this criterion was not satisfied, the data for that plant was disregarded [39]. If this criterion was not satisfied, the data for that plant was disregarded (the corresponding samples that had been measured were also discarded). The maximum hydraulic conductance of the leaf (Kmax) was calculated according to Equation (2) [41]:
K m a x = E 0 Ψ l e a f
Here, we used natural dehydration to different water states on the laboratory table to achieve different leaf water potentials for hydraulic conductivity measurements [39]. The remaining plants were wrapped in black plastic bags and placed on the laboratory table for various time intervals (based on experience, the time intervals varied from 3 to 60 min) to simulate treatments with different degrees of dehydration, which were represented by different Ψleaf values. The hydraulic conductance K of different degrees of dehydration was measured according to the steps described above. The percentage loss of hydraulic conductance (PLC) was calculated according to Equation (3) [42]:
P L C = 100 1 K K max
Vulnerability curves for each treatment were fitted via the least squares method based on empirical functions to determine the Ψleaf corresponding to a 50% loss of Kmax (P50) and the slope (S) of the vulnerability curve at that point according to Equation (4) [43]:
P L C = a / 1 + e x p S Ψ l e a f c
where Ψleaf is the leaf water potential, which corresponds to K, a is the maximum PLC, and c is P50. S is the slope of the vulnerability curve at P50, which indicates the sensitivity of embolism spread in the leaves, a higher S value means that the embolism spreads more quickly. Due to the destructive nature of this testing procedure on the plant leaves, we measured only one vulnerability curve for each treatment. In the experiment, each treatment had 9 pots × 10 plants per pot = 90 plants. The detailed sampling information for the measured indicators is shown in Table 1.

2.3. Data Analysis

We conducted the Kolmogorov–Smirnov test for normality and the Levene test for homogeneity of variance, followed by analysis of variance by the F-test (p < 0.05); then, the two-way ANOVA was performed to test the main and interaction effects of VPD and SM treatments on the variables using R 4.4.2 (https://cran.r-project.org, accessed on 1 December 2022). If the interaction effect was statistically significant, single effect analyses were performed to examine the mean differences at specific levels of the interacting factors. Otherwise, if the interaction effect was not statistically significant, only the main effects were interpreted. Such analyses were done for variables, including water parameters (ΨMD and Kleaf) and gas exchange parameters (An, gs and Kleaf:An). Tukey’s HSD was employed to compare means between different VPD treatments at consistent soil moisture (SM) levels and between different SM treatments at consistent VPD levels.
Leaf hydraulic vulnerability curves were fitted and plotted using the Weibull function through the “fitplc” package in R 4.4.2 (https://cran.r-project.org, accessed on 1 December 2022) [44]. The relationship between stomatal conductance and leaf water potential during curve determination was modeled using a three-parameter sigmoidal curve. The dynamic pattern of stomatal conductance changes relative to leaf water potential was analyzed through this curve fitting approach.

3. Results

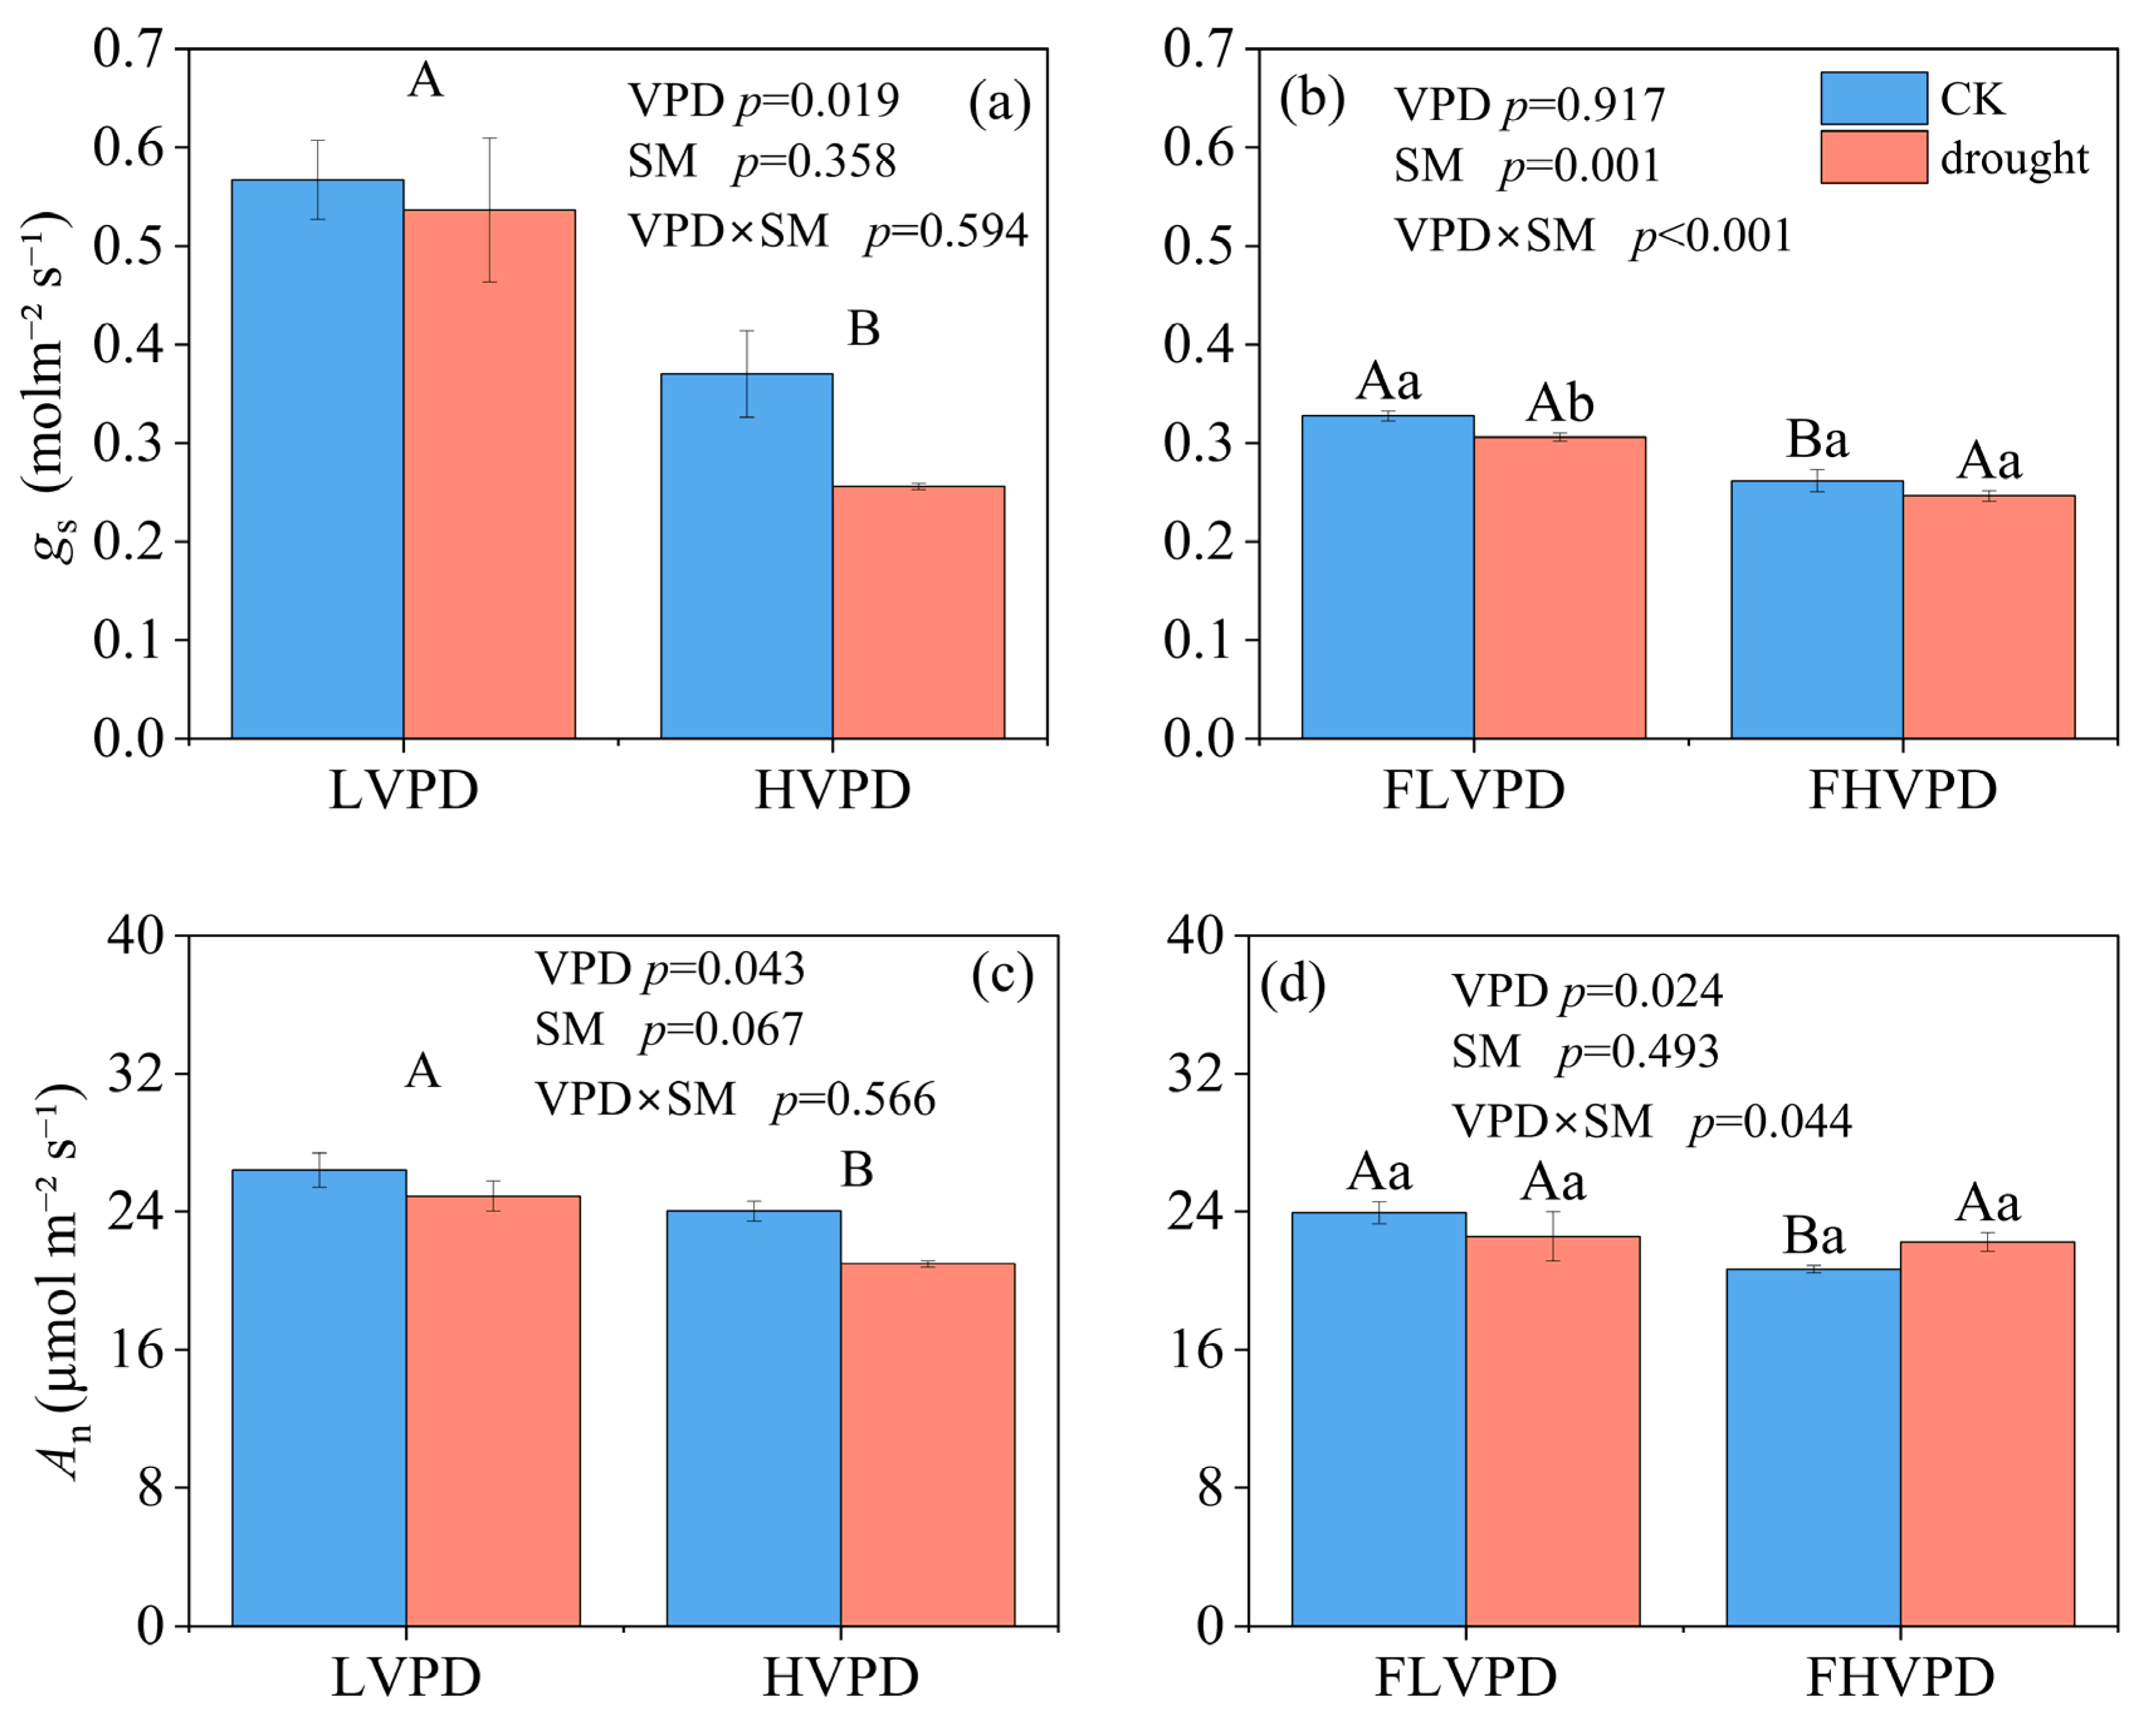
3.1. Leaf Gas Exchange

During the stress period, two-way ANOVA revealed that VPD had a significant main effect on gs, while the SM main effect and VPD × SM interaction were not significant. Across both soil moisture conditions, HVPD reduced gs by 43.6% compared to LVPD (Figure 2a). After rewatering, the SM main effect was significant, and the VPD main effect was not significant, but the VPD × SM interaction was highly significant. Due to the significant interaction, simple effect analysis showed that under FLVPD, drought treatment significantly reduced gs by 6.6% compared to CK; under FHVPD, there was no significant difference between drought and CK treatments. Regarding VPD effects, under CK, FHVPD significantly reduced gs by 20.0% compared to FLVPD; under drought, there was no significant difference between FHVPD and FLVPD (Figure 2b).
During the stress period, two-way ANOVA revealed that VPD had a significant main effect on An, while the SM main effect and VPD × SM interaction were not significant. Analysis of the VPD main effect showed that across both soil moisture conditions, HVPD reduced An by 12.3% compared to LVPD (Figure 2c). After rewatering, the VPD main effect was significant, and the SM main effect was not significant, but the VPD × SM interaction was significant. Due to the significant interaction, simple effect analysis showed that regarding VPD effects under CK, FHVPD significantly reduced An by 13.7% compared to FLVPD; under drought, there was no significant difference between FHVPD and FLVPD (Figure 2d).

3.2. Midday Leaf Water Potential, Leaf Hydraulic Conductance, and Water Transport Efficiency per Unit Photosynthetic Rate

During the stress period, two-way ANOVA revealed that SM had a significant main effect on midday leaf water potential (ΨMD), while the main effect of VPD and the VPD × SM interaction were not significant. The ain effect of SM analysis showed that across both low vapor pressure deficit (LVPD) and high vapor pressure deficit (HVPD), drought treatment significantly reduced ΨMD by 34.5% compared to CK (Table 2).
After rewatering, neither the main effects of VPD nor SM were significant. The VPD × SM interaction was not significant (Table 2). The drought treatment groups showed significant improvement in ΨMD: FLVPD-drought recovered from −1.83 MPa to −1.22 MPa, with a recovery rate of 33.6%; FHVPD-drought recovered from −1.90 MPa to −1.30 MPa, with a recovery rate of 31.5%. In contrast, FHVPD-CK changed from −1.42 MPa to −1.10 MPa, with a recovery rate of 22.5%.
During the stress period, both VPD and SM had significant main effects on Kleaf, while the VPD × SM interaction was not significant. Main effect analysis showed that across both VPD levels (LVPD and HVPD), drought treatment reduced Kleaf by 33.2% compared to CK; across both soil moisture conditions (CK and drought), HVPD reduced Kleaf by 47.0% compared to LVPD (Table 2).
While drought effects diminished after rewatering, residual impacts remained evident, the main effects of VPD and SM remained significant. Main effect analysis showed that across both VPD levels, drought treatment reduced Kleaf by 17.9% compared to CK; across both soil moisture conditions, FHVPD reduced Kleaf by 42.2% compared to FLVPD (Table 2).
During the stress period, both VPD and SM had significant main effects on Kleaf:An, while the VPD × SM interaction was not significant. Since the interaction was not significant, main effect analysis showed that: across both VPD levels, drought treatment reduced Kleaf:An by 32.0% compared to CK; across both soil moisture conditions, HVPD reduced Kleaf:An by 26.5% compared to LVPD (Table 2).
After rewatering, the VPD main effect was highly significant, the SM main effect was significant, and the VPD × SM interaction was not significant. Since the interaction was not significant, main effect analysis showed that across both VPD levels, drought treatment reduced Kleaf:An by 20% compared to CK; across both soil moisture conditions, FHVPD reduced Kleaf:An by 34.9% compared to FLVPD (Table 2).

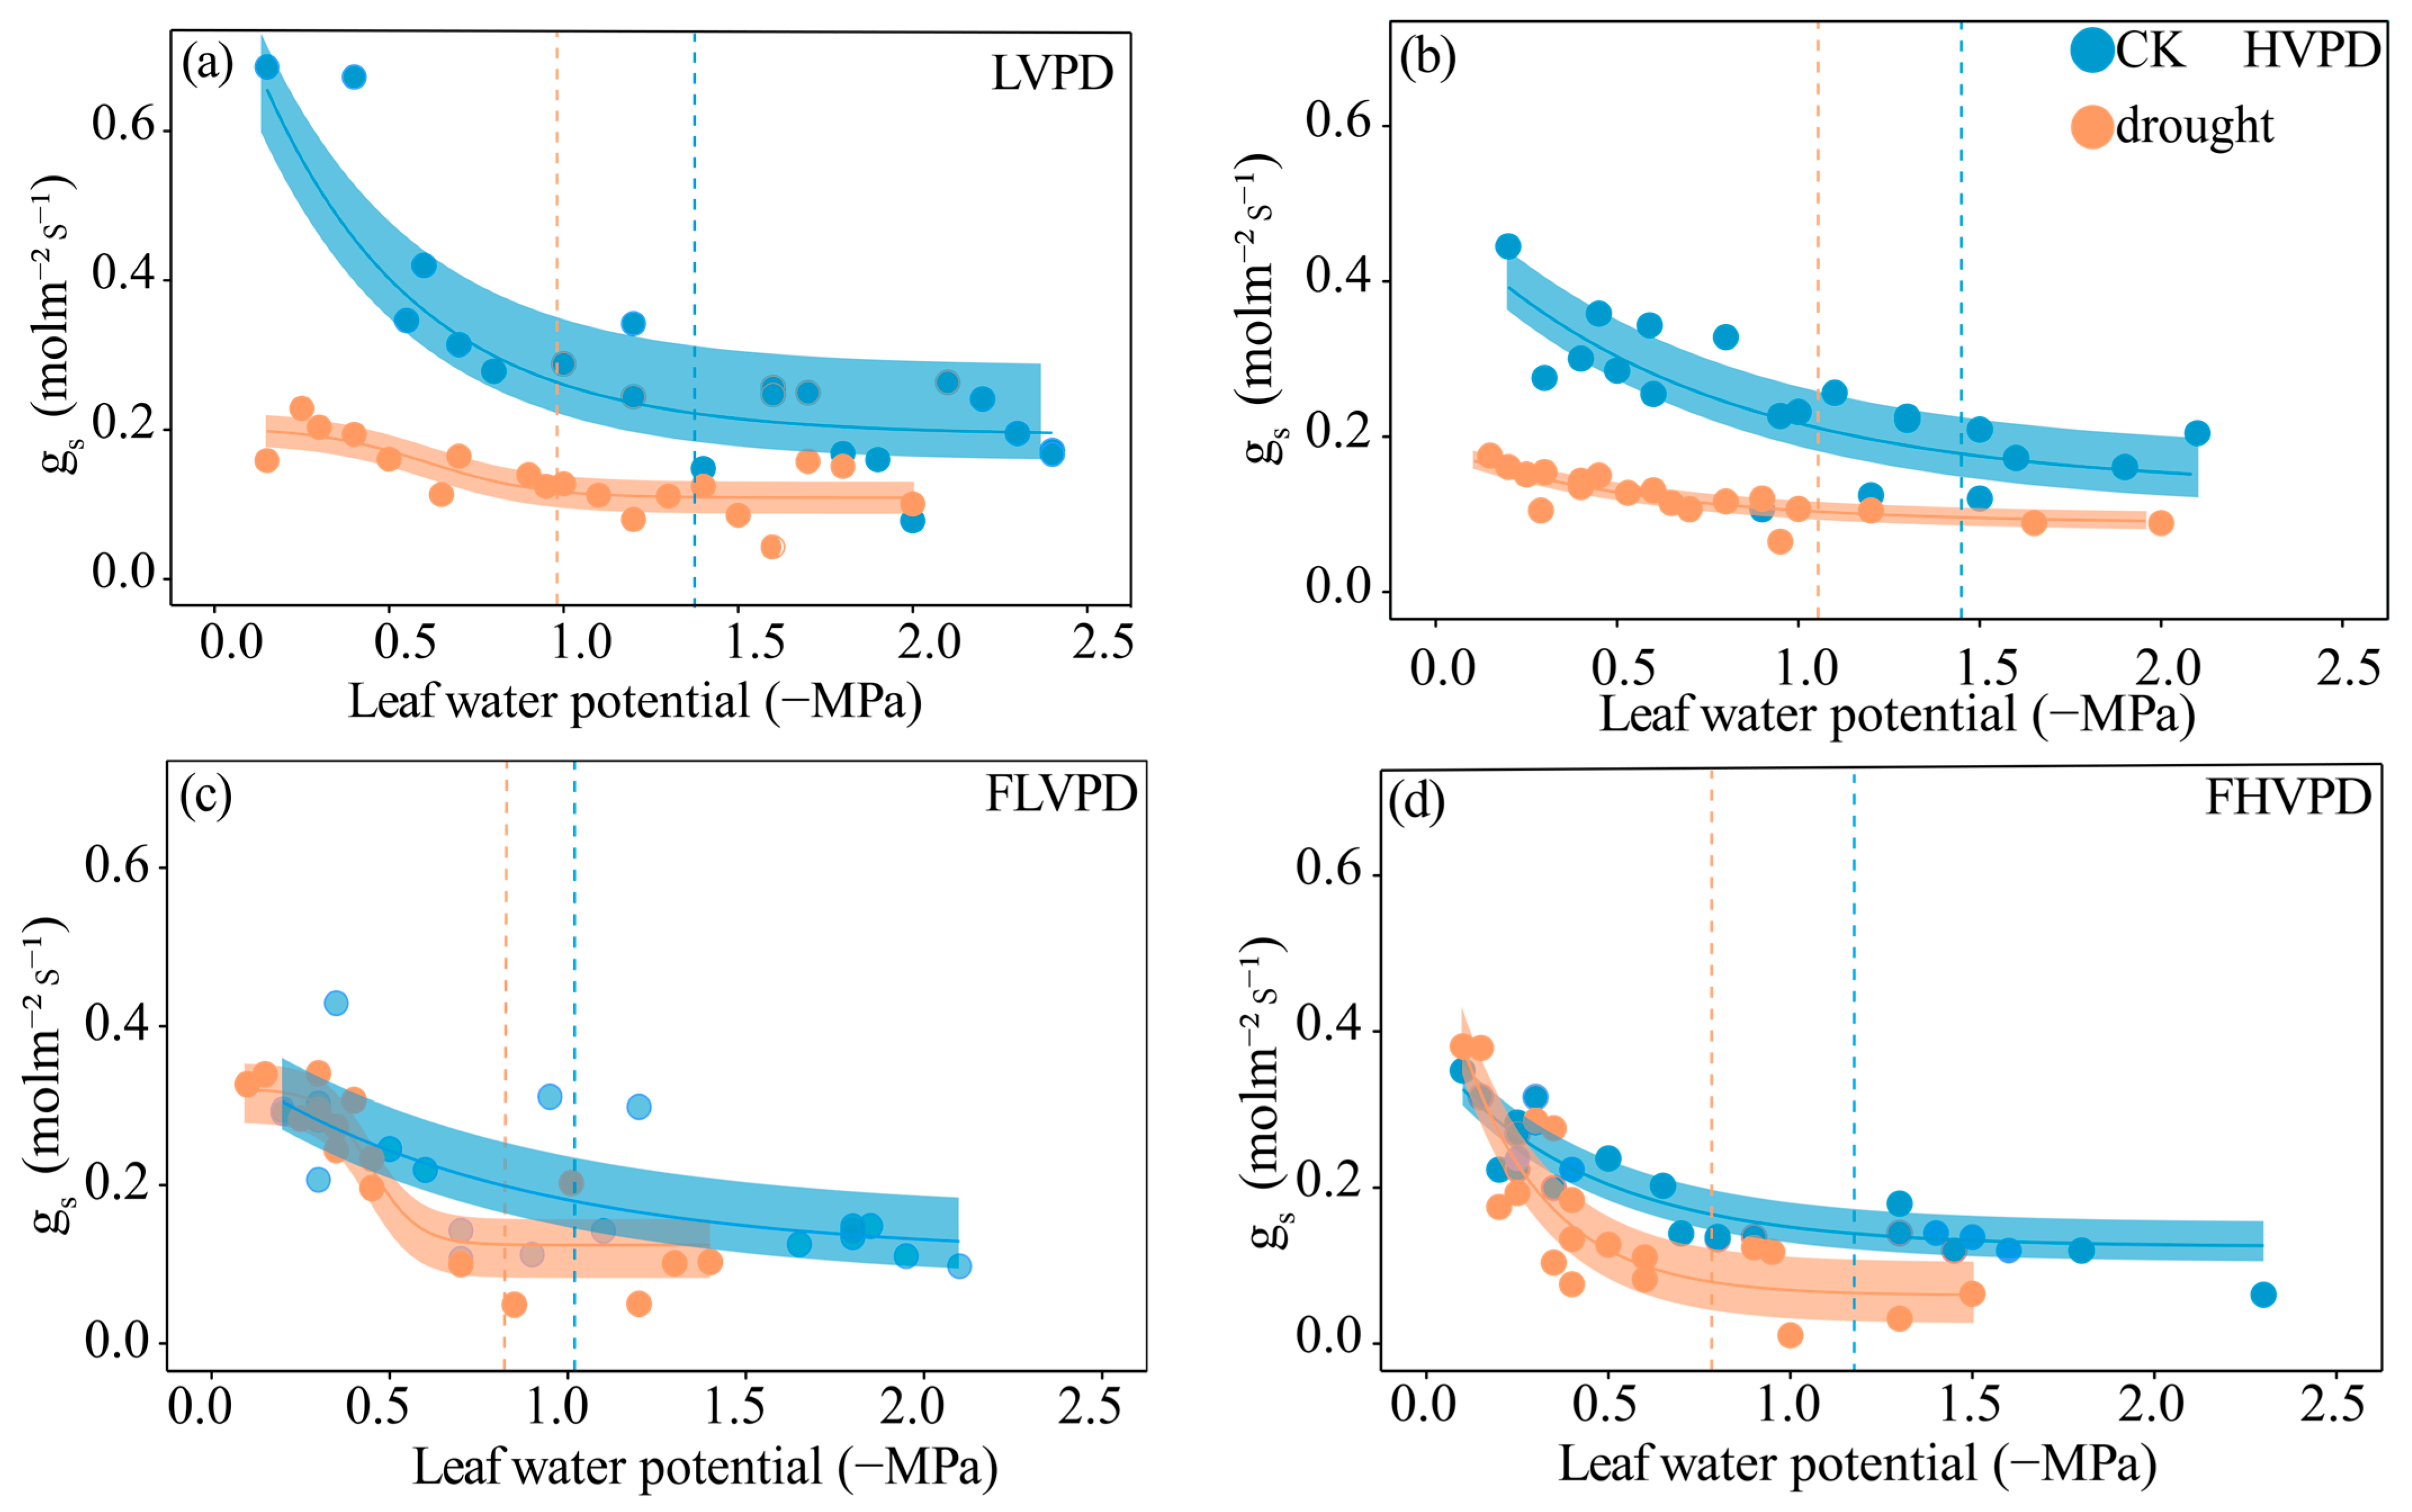
3.3. Comparison of Leaf Vulnerability Curves

The hydraulic vulnerability curves of wheat leaves under different treatments showed that high VPD and soil drought treatments decreased the P50 values. Under LVPD, the P50 values of CK and drought were approximately −0.74 and −0.82 MPa, respectively. These values shifted to −0.93 and −1.16 MPa under HVPD (Figure 3a,b).
After rewatering, differences between treatments still existed. Under FLVPD, the P50 values of CK and drought treatments were approximately −0.63 and −0.79 MPa, respectively; under FHVPD, the corresponding P50 values were approximately −0.69 and −1.15 MPa (Figure 3c,d). Notably, compared to before rewatering, the P50 values of drought treatments showed an overall downward trend after rewatering (increase in absolute value), especially under FHVPD.

3.4. Variation in Stomatal Closure Thresholds

The high VPD and soil drought treatments decreased Ψgs88 (representing leaf water potential at 80% stomatal conductance reduction). Under LVPD, Ψgs88 values reached approximately −1.38 MPa for CK and −0.97 MPa for drought. Under HVPD, Ψgs88 values reached approximately −1.42 MPa for CK and −1.05 MPa for drought (Figure 4a,b). After rewatering, the stomatal closure threshold generally increased. Under FLVPD, the Ψgs88 values of CK and drought treatments were approximately −1.08 and −0.85 MPa, respectively; under FHVPD, the corresponding Ψgs88 values were approximately −1.22 and −0.72 MPa (Figure 4c,d). The difference between CK and drought treatments after rewatering was greater than the difference under stress. In addition, the Ψgs88 values under high VPD (HVPD and FHVPD) were generally higher than those under low VPD (LVPD and FLVPD).
Table 3 shows the stomatal safety threshold (SSM50) of wheat leaves under different treatments. All CK treatments showed negative SSM50 values, indicating that wheat tends to adopt a non-isohydric regulation strategy under well-watered supply conditions. In contrast, drought treatment significantly increased SSM50 values. Under LVPD, drought treatment showed an SSM50 value of −0.15 MPa—still negative but significantly higher than that for CK. Under HVPD, the drought treatment SSM50 value shifted to be positive (0.11 MPa), indicating a transition to isohydric regulation behavior. After rewatering, CK treatments under both FLVPD and FHVPD maintained negative SSM50 values, confirming that the well-watered supply of wheat showed anisohydric regulation. The Drought treatment under FLVPD showed an SSM50 value of −0.10 MPa—still negative but approaching zero—indicating significantly weakened anisohydric behavior. Under FHVPD, the drought treatment SSM50 value became positive (0.26 MPa), with stomatal regulation shifting to an isohydric strategy.
In addition, drought stress not only affects P50 values but may also alter the sensitivity pattern of the leaf hydraulic system to changes in water potential. The slope of the vulnerability curve also reflects the vulnerability characteristics of the leaf hydraulic system. The curve slope of the drought treatment under HVPD was relatively larger. After rewatering, FLVPD and FHVPD treatments showed much higher values (101.91 and 112.3, respectively) compared to corresponding stress treatments (35.11 and 49.65).

4. Discussion

4.1. The Impact of Combined Drought Stress and Soil Rewatering on Water Transport and Gas Exchange

This study identified significant differences in wheat’s hydraulic transport and gas exchange responses to combined drought stress, as well as in recovery capacity. Our results demonstrated that soil drought significantly reduced ΨMD and Kleaf. This reduction likely occurs because when transpiration demand peaks at midday, soil drought increases hydraulic resistance, lowering Kleaf and directly impacting ΨMD [45]. After rewatering, no significant differences in ΨMD were observed between treatment groups, suggesting that short-term rewatering effectively alleviates drought effects on leaf water potential.
The recovery rates of ΨMD in LVPD-drought treatment (33.6%) and HVPD-drought (31.5%) were higher than that of HVPD-CK (22.5%), indicating that soil stressed plants possessed a stronger leaf water potential recovery capacity. The possible reason is that drought treatment reduces the cellular water potential through the accumulation of osmotic adjustment substances, maintaining turgor pressure stability, which allows for a rapid recovery of leaf water potential after rewatering [46].
After rewatering, the inhibitory effect of high VPD on Kleaf decreased from 47.0% to 42.2% during the stress period, while the inhibitory effect of soil drought on Kleaf decreased from 33.2% to 17.9% during the stress period. These results indicate that rewatering can effectively alleviate the impact of soil drought on Kleaf, but the hydraulic damage caused by atmospheric drought is more persistent. This disparity may be attributed to the high VPD causing xylem embolism with structural damage (such as vessel collapse), which is difficult to reverse after rewatering [35]. In contrast, soil drought partly influences hydraulic properties through hormone signaling pathways (such as abscisic acid, ABA), which can be rapidly downregulated following rewatering [47]. Additionally, leaf morphology (vein density and thickness) [10] and aquaporin activity [11] represent other important factors affecting Kleaf.
In contrast, VPD showed significant effects on An and gs during the stress period. Compared to LVPD, the reduction of gs (43.6%) in HVPD was substantially more than that of An (12.3%), indicating that the stomatal response is more sensitive to atmospheric stress than photosynthesis. This likely represents a conservative plant strategy that prioritizes water conservation under atmospheric stress conditions [19].
The VPD × SM interaction effect on An and gs was significant after rewatering. Specifically, under FLVPD, the gs of drought was significantly reduced compared to CK; under FHVPD, there was no significant difference in gs between the drought and CK. This interactive pattern indicates that the limiting effect of soil moisture on gs was only significant under low VPD conditions. Under CK, An and gs under high VPD (FHVPD) were significantly lower than under low VPD (FLVPD); under drought conditions, there was no significant difference between FHVPD and FLVPD. This interactive pattern indicates that the inhibitory effect of high VPD on An and gs was only significant under well-watered conditions. These results indicate the complexity of the interactive effects of atmospheric and soil drought on gas exchange in wheat [48].
Notably, although gas exchange parameters showed some recovery after rewatering, they remained significantly lower than pre-drought stress. In absolute terms, gs and An values under low VPD after rewatering (approximately 0.32 and 24 μmol m−2·s−1, respectively) were markedly higher than corresponding values under high VPD (approximately 0.26 and 20 μmol·m−2·s−1). This difference may be attributed to leaf aging between drought stress and rewatering measurements. Under both FLVPD and FHVPD, no significant differences in An and gs were observed between drought and CK, indicating that rewatering essentially eliminated the residual effects of soil drought. Furthermore, the main effects of SM and VPD on Kleaf:An remained significant after rewatering, with the reduction in this ratio due to SM decreasing from 32.0% during the stress period to 20% after rewatering. In contrast, the reduction in this ratio due to VPD slightly increased, from 26.5% during the stress period to 34.9% after rewatering, indicating that the impact of atmospheric drought on the Kleaf:An ratio is more persistent.
The differential recovery capabilities between hydraulic systems and photosynthetic processes reflect plants’ varied adaptation strategies: photosynthetic systems prioritize recovery to maintain basic productivity, while irreversible structural damage caused by embolism in hydraulic systems may persist longer.

4.2. Adaptive Changes in Hydraulic Vulnerability and Stomatal Regulation Strategies

Vulnerability curve analysis revealed significant effects of soil drought and VPD on wheat’s hydraulic system and stomatal regulation strategies. Drought stress shifted P50 values in a more negative direction, indicating enhanced embolism resistance, with this adaptation becoming more pronounced under HVPD. This indicates that drought stress treatment decreased P50 values (increased their absolute magnitude), representing an adaptive strategy under long-term water stress. Plants sacrifice some hydraulic efficiency to gain greater hydraulic safety [49], a critical survival mechanism in drought environments. Our results demonstrated that soil drought enhanced leaf embolism resistance, with this effect amplified under atmospheric drought. Previous studies on trees similarly found that rising VPD can induce negative shifts in P50 [50]. Under HVPD, the difference in P50 values between drought and CK was more substantial. Notably, this enhanced embolism resistance persisted after rewatering, particularly under HVPD, indicating that hydraulic system adaptations are durable. This persistence likely results from atmospheric drought intensifying transpiration tension, which triggers structural adjustments in vascular tissues—including reduced vessel diameter, increased wall thickness, and modified pit characteristics [16]. These changes enhance vascular tissue tolerance to negative pressure and improve future drought resistance. These findings advance our understanding of wheat’s drought adaptation mechanisms, suggesting that moderate drought exposure may enhance long-term drought resistance through hydraulic system remodeling [51], offering valuable insights for developing drought-resistant crops.
Stomatal regulation strategies exhibited similar adaptive changes. Analysis of the SSM50 revealed that drought stress induced a transition in wheat from anisohydric to isohydric regulation—shifting priority from carbon assimilation to hydraulic system protection. Following rewatering, Drought treatment adopted conservative water strategies in FHVPD environments by closing stomata earlier to protect their hydraulic systems. This transition from anisohydric to isohydric regulation represents a key adaptation mechanism to frequent drought events [52]. While sacrificing short-term carbon gain, this strategy ensures long-term survival capacity—a significant adaptive advantage as climate change intensifies drought conditions. Additionally, the S values increased significantly after rewatering, with FLVPD and FHVPD treatments showing much higher values than corresponding stress treatments (Table 3). This indicates steeper vulnerability curves after rewatering, suggesting enhanced sensitivity of the hydraulic system to water potential changes, which aligns with the conservative stomatal regulation strategy. This strategic shift was not only maintained after rewatering but further enhanced under FHVPD condition studies, which primarily attributed this to stomatal memory effects [53], enabling more effective and rapid responses to potential future drought events even under water-sufficient conditions.
Changes in Ψgs88 further supported this conclusion. Drought treatment increased Ψgs88 values (reduced their absolute values), raising the stomatal closure threshold and causing stomata to close at higher water potentials—demonstrating a more conservative water use strategy. This likely occurs because under severe or prolonged drought, crops may abandon photosynthesis maintenance in favor of rapid stomatal closure to prioritize water conservation [22]. This conservative strategy became more pronounced under high VPD and persisted after rewatering. Previous research suggests this may result from reactive oxygen species (ROS) accumulation and cell membrane damage [54]. These findings reflect long-term adaptive remodeling of plant stomatal regulation mechanisms.

5. Conclusions

This study systematically investigated stomatal behavior and hydraulic transport recovery in wheat following drought stress across different rewatering periods, yielding the following key findings:
Atmospheric and soil drought converge to impact plant gas exchange. Under atmospheric stress conditions, the reduction in stomatal conductance (gs) was significantly greater than that of the photosynthetic rate (An). This indicates that wheat maintains photosynthetic efficiency by restricting water loss when facing drought, which is a crucial water use efficiency strategy.
Wheat leaf hydraulic and photosynthetic systems demonstrated distinct response and recovery patterns to drought stress. Following rewatering, An and gs showed partial recovery, while leaf hydraulic conductance (Kleaf) continued to decline, suggesting possible irreversible structural damage to the hydraulic system.
Drought stress induced adaptive changes in wheat leaf hydraulic vulnerability and stomatal regulation strategies, characterized by more negative water potential thresholds (P50) and a shift from non-conservative to conservative water regulation behavior. These adaptations persisted after rewatering and even intensified, suggesting that plants developed a “memory” response to drought. This indicates that moderate pre-drought exposure may enhance long-term drought resistance in crops.
These findings reveal the physiological adaptation mechanisms in wheat during drought stress and subsequent rewatering, providing scientific evidence for understanding crop drought resistance and optimizing irrigation practices. Future research should explore the mechanisms linking hydraulic limitations and stomatal regulation, as well as how drought intensity affects long-term crop growth and yield.

Author Contributions

Conceptualization, Y.Z.; methodology and formal analysis, L.W., Y.Z. and H.L.; investigation, L.W., X.H. and P.F.; writing and original draft preparation, L.W., H.L. and Y.Z.; writing, reviewing, and editing of the manuscript, Y.Z., Y.M. and S.G.; supervision, Y.Z. and S.G. funding acquisition, Y.Z. and Y.M. All authors have read and agreed to the published version of the manuscript.

Funding

This work was supported by the Ministry of Science and Technology of China (2022YFD1900801), the National Natural Science Foundation of China (52279054, 52130906), and the Special Fund of the State Key Laboratory of Simulation and Regulation of Water Cycle in River Basins, China Institute of Water Resources and Hydropower Research (SKL2024YJTS07).

Institutional Review Board Statement

Not applicable.

Data Availability Statement

The original contributions presented in the study are included in the article. Further inquiries can be directed to the corresponding author.

Conflicts of Interest

The authors declare no conflicts of interest.

References

  1. Zander, A.; Bersier, L.-F.; Gray, S.M. Effects of Temperature Variability on Community Structure in a Natural Microbial Food Web. Glob. Change Biol. 2017, 23, 56–67. [Google Scholar] [CrossRef] [PubMed]
  2. Yang, J.; Lu, X.; Liu, Z.; Tang, X.; Yu, Q.; Wang, Y. Atmospheric Drought Dominates Changes in Global Water Use Efficiency. Sci. Total Environ. 2024, 934, 173084. [Google Scholar] [CrossRef] [PubMed]
  3. Huynh, A.; Aguirre, B.A.; English, J.; Guzman, D.; Wright, A.J. Atmospheric Drying and Soil Drying: Differential Effects on Grass Community Composition. Glob. Change Biol. 2024, 30, e17106. [Google Scholar] [CrossRef]
  4. Zhou, S.; Zhang, Y.; Park Williams, A.; Gentine, P. Projected Increases in Intensity, Frequency, and Terrestrial Carbon Costs of Compound Drought and Aridity Events. Sci. Adv. 2019, 5, eaau5740. [Google Scholar] [CrossRef]
  5. Haghpanah, M.; Hashemipetroudi, S.; Arzani, A.; Araniti, F. Drought Tolerance in Plants: Physiological and Molecular Responses. Plants 2024, 13, 2962. [Google Scholar] [CrossRef]
  6. Akter, N.; Brishty, T.A.; Karim, M.A.; Ahmed, M.J.U.; Islam, M.R. Leaf Water Status and Biochemical Adjustments as a Mechanism of Drought Tolerance in Two Contrasting Wheat (Triticum aestivum L.) Varieties. Acta Physiol. Plant 2023, 45, 50. [Google Scholar] [CrossRef]
  7. Wang, X.; Du, T.; Huang, J.; Peng, S.; Xiong, D. Leaf Hydraulic Vulnerability Triggers the Decline in Stomatal and Mesophyll Conductance during Drought in Rice. J. Exp. Bot. 2018, 69, 4033–4045. [Google Scholar] [CrossRef]
  8. Wang, X.; Wang, L.; Shangguan, Z. Leaf Gas Exchange and Fluorescence of Two Winter Wheat Varieties in Response to Drought Stress and Nitrogen Supply. PLoS ONE 2016, 11, e0165733. [Google Scholar] [CrossRef] [PubMed]
  9. Pinheiro, C.; Chaves, M.M. Photosynthesis and Drought: Can We Make Metabolic Connections from Available Data? J. Exp. Bot. 2011, 62, 869–882. [Google Scholar] [CrossRef]
  10. Sack, L.; Holbrook, N.M. Leaf Hydraulics. Annu. Rev. Plant Biol. 2006, 57, 361–381. [Google Scholar] [CrossRef]
  11. North, G.; Brinton, E.; Browne, M.; Gillman, M.; Roddy, A.; Kho, T.; Wang, E.; Fung, V.; Brodersen, C. Hydraulic Conductance, Resistance, and Resilience: How Leaves of a Tropical Epiphyte Respond to Drought. Am. J. Bot. 2019, 106, 943–957. [Google Scholar] [CrossRef] [PubMed]
  12. Scoffoni, C.; Sack, L. The Causes and Consequences of Leaf Hydraulic Decline with Dehydration. J. Exp. Bot. 2017, 68, 4479–4496. [Google Scholar] [CrossRef]
  13. Baird, A.S.; Taylor, S.H.; Pasquet-Kok, J.; Vuong, C.; Zhang, Y.; Watcharamongkol, T.; Cochard, H.; Scoffoni, C.; Edwards, E.J.; Osborne, C.P.; et al. Resolving the Contrasting Leaf Hydraulic Adaptation of C3 and C4 Grasses. New Phytol. 2025, 245, 1924–1939. [Google Scholar] [CrossRef]
  14. Devi, M.J.; Reddy, V.R.; Timlin, D. Drought-Induced Responses in Maize under Different Vapor Pressure Deficit Conditions. Plants 2022, 11, 2771. [Google Scholar] [CrossRef]
  15. Unce, J.A. How Do Leaf Hydraulics Limit Stomatal Conductance at High Water Vapour Pressure Deficits? Plant Cell Environ. 2006, 29, 1644–1650. [Google Scholar] [CrossRef]
  16. Schönbeck, L.C.; Schuler, P.; Lehmann, M.M.; Mas, E.; Mekarni, L.; Pivovaroff, A.L.; Turberg, P.; Grossiord, C. Increasing Temperature and Vapour Pressure Deficit Lead to Hydraulic Damages in the Absence of Soil Drought. Plant Cell Environ. 2022, 45, 3275–3289. [Google Scholar] [CrossRef]
  17. Tardieu, F.; Simonneau, T. Variability among Species of Stomatal Control under Fluctuating Soil Water Status and Evaporative Demand: Modelling Isohydric and Anisohydric Behaviours. J. Exp. Bot. 1998, 49, 419–432. [Google Scholar] [CrossRef]
  18. Christmann, A.; Grill, E.; Huang, J. Hydraulic Signals in Long-Distance Signaling. Curr. Opin. Plant Biol. 2013, 16, 293–300. [Google Scholar] [CrossRef]
  19. Fu, X.; Meinzer, F.C.; Woodruff, D.R.; Liu, Y.; Smith, D.D.; McCulloh, K.A.; Howard, A.R. Coordination and Trade-offs between Leaf and Stem Hydraulic Traits and Stomatal Regulation along a Spectrum of Isohydry to Anisohydry. Plant Cell Environ. 2019, 42, 2245–2258. [Google Scholar] [CrossRef]
  20. McDowell, N.; Pockman, W.T.; Allen, C.D.; Breshears, D.D.; Cobb, N.; Kolb, T.; Plaut, J.; Sperry, J.; West, A.; Williams, D.G.; et al. Mechanisms of Plant Survival and Mortality during Drought: Why Do Some Plants Survive While Others Succumb to Drought? New Phytol. 2008, 178, 719–739. [Google Scholar] [CrossRef]
  21. Luo, D.-D.; Weng, C.-K.; Jin, Y. Plant Water-Regulation Strategies: Isohydric versus Anisohydric Behavior. Chin. J. Plant Ecol. 2017, 41, 1020–1032. [Google Scholar] [CrossRef]
  22. Nguyen, T.H.; Langensiepen, M.; Gaiser, T.; Webber, H.; Ahrends, H.; Hueging, H.; Ewert, F. Responses of Winter Wheat and Maize to Varying Soil Moisture: From Leaf to Canopy. Agric. For. Meteorol. 2022, 314, 108803. [Google Scholar] [CrossRef]
  23. Skelton, R.P.; West, A.G.; Dawson, T.E. Predicting Plant Vulnerability to Drought in Biodiverse Regions Using Functional Traits. Proc. Natl. Acad. Sci. USA 2015, 112, 5744–5749. [Google Scholar] [CrossRef] [PubMed]
  24. Creek, D.; Blackman, C.J.; Brodribb, T.J.; Choat, B.; Tissue, D.T. Coordination between Leaf, Stem, and Root Hydraulics and Gas Exchange in Three Arid-Zone Angiosperms during Severe Drought and Recovery. Plant Cell Environ. 2018, 41, 2869–2881. [Google Scholar] [CrossRef] [PubMed]
  25. Martorell, S.; Díaz-Espejo, A.; Medrano, H.; Ball, M.C.; Choat, B. Rapid Hydraulic Recovery in Eucalyptus pauciflora after Drought: Linkages between Stem Hydraulics and Leaf Gas Exchange. Plant Cell Environ. 2014, 37, 617–626. [Google Scholar] [CrossRef]
  26. Brodribb, T.; Brodersen, C.R.; Carriqui, M.; Tonet, V.; Rodriguez Dominguez, C.; McAdam, S. Linking Xylem Network Failure with Leaf Tissue Death. New Phytol. 2021, 232, 68–79. [Google Scholar] [CrossRef]
  27. Vilagrosa, A.; Chirino, E.; Peguero-Pina, J.J.; Barigah, T.S.; Cochard, H.; Gil-Pelegrín, E. Xylem Cavitation and Embolism in Plants Living in Water-Limited Ecosystems. In Plant Responses to Drought Stress: From Morphological to Molecular Features; Aroca, R., Ed.; Springer: Berlin, Heidelberg, 2012; pp. 63–109. ISBN 978-3-642-32653-0. [Google Scholar]
  28. Tulik, M.K.; Marciszewska, K.D. Hydraulic Efficiency and Safety of Xylem Sap Flow in Relation to Water Stress in Woody Plants. In Hydraulic Conductivity; Silva, V.R.D., Ed.; IntechOpen: Rijeka, Croatia, 2013. [Google Scholar]
  29. Tonet, V.; Brodribb, T.; Bourbia, I. Variation in Xylem Vulnerability to Cavitation Shapes the Photosynthetic Legacy of Drought. Plant Cell Environ. 2024, 47, 1160–1170. [Google Scholar] [CrossRef]
  30. Skelton, R.P.; Brodribb, T.J.; McAdam, S.A.M.; Mitchell, P.J. Gas Exchange Recovery Following Natural Drought Is Rapid Unless Limited by Loss of Leaf Hydraulic Conductance: Evidence from an Evergreen Woodland. New Phytol. 2017, 215, 1399–1412. [Google Scholar] [CrossRef] [PubMed]
  31. Brodribb, T.J.; McAdam, S.A.M. Abscisic Acid Mediates a Divergence in the Drought Response of Two Conifers. Plant Physiol. 2013, 162, 1370–1377. [Google Scholar] [CrossRef]
  32. Rehschuh, R.; Cecilia, A.; Zuber, M.; Faragó, T.; Baumbach, T.; Hartmann, H.; Jansen, S.; Mayr, S.; Ruehr, N. Drought-Induced Xylem Embolism Limits the Recovery of Leaf Gas Exchange in Scots Pine. Plant Physiol. 2020, 184, 852–864. [Google Scholar] [CrossRef]
  33. Choat, B.; Brodersen, C.R.; McElrone, A.J. Synchrotron X-Ray Microtomography of Xylem Embolism in Sequoia Sempervirens Saplings during Cycles of Drought and Recovery. New Phytol. 2015, 205, 1095–1105. [Google Scholar] [CrossRef] [PubMed]
  34. Qi, M.; Liu, X.; Li, Y.; Song, H.; Yin, Z.; Zhang, F.; He, Q.; Xu, Z.; Zhou, G. Photosynthetic Resistance and Resilience under Drought, Flooding and Rewatering in Maize Plants. Photosynth. Res. 2021, 148, 1–15. [Google Scholar] [CrossRef] [PubMed]
  35. Johnson, K.M.; Jordan, G.J.; Brodribb, T.J. Wheat Leaves Embolized by Water Stress Do Not Recover Function upon Rewatering. Plant Cell Environ. 2018, 41, 2704–2714. [Google Scholar] [CrossRef]
  36. Zhang, P.; Yang, X.; Chen, Y.; Wei, Z.; Liu, F. Dissecting the Combined Effects of Air Temperature and Relative Humidity on Water-Use Efficiency of Barley under Drought Stress. J. Agron. Crop Sci. 2020, 207, 606–617. [Google Scholar] [CrossRef]
  37. Abid, M.; Ali, S.; Qi, L.K.; Zahoor, R.; Tian, Z.; Jiang, D.; Snider, J.L.; Dai, T. Physiological and Biochemical Changes during Drought and Recovery Periods at Tillering and Jointing Stages in Wheat (Triticum aestivum L.). Sci. Rep. 2018, 8, 4615. [Google Scholar] [CrossRef] [PubMed]
  38. Wang, L.; Zhang, Y.; Luo, D.; Hu, X.; Feng, P.; Mo, Y.; Li, H.; Gong, S. Integrated Effects of Soil Moisture on Wheat Hydraulic Properties and Stomatal Regulation. Plants 2024, 13, 2263. [Google Scholar] [CrossRef]
  39. Sack, L.; Scoffoni, C. Measurement of Leaf Hydraulic Conductance and Stomatal Conductance and Their Responses to Irradiance and Dehydration Using the Evaporative Flux Method (EFM). J. Vis. Exp. 2012, 70, 4179. [Google Scholar] [CrossRef]
  40. Sack, L. The Hydraulic Conductance of the Angiosperm Leaf Lamina: A Comparison of Three Measurement Methods. J. Exp. Bot. 2002, 53, 2177–2184. [Google Scholar] [CrossRef]
  41. Xiong, D.; Douthe, C.; Flexas, J. Differential Coordination of Stomatal Conductance, Mesophyll Conductance, and Leaf Hydraulic Conductance in Response to Changing Light across Species. Plant Cell Environ. 2018, 41, 436–450. [Google Scholar] [CrossRef]
  42. Pammenter, N.; Willigen, C. A Mathematical and Statistical Analysis of the Curves Illustrating Vulnerability of Xylem to Cavitation. Tree Physiol. 1998, 18, 589–593. [Google Scholar] [CrossRef]
  43. Corso, D.; Delzon, S.; Lamarque, L.J.; Cochard, H.; Torres-Ruiz, J.M.; King, A.; Brodribb, T. Neither Xylem Collapse, Cavitation, or Changing Leaf Conductance Drive Stomatal Closure in Wheat. Plant Cell Environ. 2020, 43, 854–865. [Google Scholar] [CrossRef] [PubMed]
  44. Duursma, R.; Choat, B. Fitplc - an R Package to Fit Hydraulic Vulnerability Curves. J. Plant Hydraul. 2017, 4, 002. [Google Scholar] [CrossRef]
  45. Chaves, M.M.; Flexas, J.; Pinheiro, C. Photosynthesis under Drought and Salt Stress: Regulation Mechanisms from Whole Plant to Cell. Ann. Bot. 2009, 103, 551–560. [Google Scholar] [CrossRef] [PubMed]
  46. Wang, X.; Mao, Z.; Zhang, J.; Hemat, M.; Huang, M.; Cai, J.; Zhou, Q.; Dai, T.; Jiang, D. Osmolyte Accumulation Plays Important Roles in the Drought Priming Induced Tolerance to Post-Anthesis Drought Stress in Winter Wheat (Triticum aestivum L.). Environ. Exp. Bot. 2019, 166, 103804. [Google Scholar] [CrossRef]
  47. Wu, C.; Liu, B.; Zhang, X.; Wang, M.; Liang, H. Phytohormone Response of Drought-Acclimated Illicium Difengpi (Schisandraceae). Int. J. Mol. Sci. 2023, 24, 16443. [Google Scholar] [CrossRef]
  48. Berauer, B.J.; Steppuhn, A.; Schweiger, A.H. The Multidimensionality of Plant Drought Stress: The RelativeImportance of Edaphic and Atmospheric Drought. Plant Cell Environ. 2024, 47, 3528–3540. [Google Scholar] [CrossRef]
  49. Schönbeck, L.; Grossiord, C.; Gessler, A.; Gisler, J.; Meusburger, K.; D’Odorico, P.; Rigling, A.; Salmon, Y.; Stocker, B.D.; Zweifel, R.; et al. Photosynthetic Acclimation and Sensitivity to Short- and Long-Term Environmental Changes in a Drought-Prone Forest. J. Exp. Bot. 2022, 73, 2576–2588. [Google Scholar] [CrossRef]
  50. Binks, O.; Cernusak, L.A.; Liddell, M.; Bradford, M.; Coughlin, I.; Bryant, C.; Palma, A.C.; Hoffmann, L.; Alam, I.; Carle, H.J.; et al. Vapour Pressure Deficit Modulates Hydraulic Function and Structure of Tropical Rainforests under Nonlimiting Soil Water Supply. New Phytol. 2023, 240, 1405–1420. [Google Scholar] [CrossRef]
  51. Backhaus, S.; Kreyling, J.; Grant, K.; Beierkuhnlein, C.; Walter, J.; Jentsch, A. Recurrent Mild Drought Events Increase Resistance Toward Extreme Drought Stress. Ecosystems 2014, 17, 1068–1081. [Google Scholar] [CrossRef]
  52. Brodribb, T.J.; Holbrook, N.M. Stomatal Closure during Leaf Dehydration, Correlation with Other Leaf Physiological Traits. Plant Physiol. 2003, 132, 2166–2173. [Google Scholar] [CrossRef]
  53. Yang, M.; He, J.; Sun, Z.; Li, Q.; Cai, J.; Zhou, Q.; Wollenweber, B.; Jiang, D.; Wang, X. Drought Priming Mechanisms in Wheat Elucidated by In-Situ Determination of Dynamic Stomatal Behavior. Front. Plant Sci. 2023, 14. [Google Scholar] [CrossRef] [PubMed]
  54. Mittler, R.; Zandalinas, S.I.; Fichman, Y.; Van Breusegem, F. Reactive Oxygen Species Signalling in Plant Stress Responses. Nat. Rev. Mol. Cell Biol. 2022, 23, 663–679. [Google Scholar] [CrossRef] [PubMed]
Figure 1. Dynamic of temperature, humidity, and soil moisture content during the experiment. Temperature and relative humidity under LVPD conditions (a) and HVPD conditions (b); Soil water content dynamics comparing CK and drought treatments under LVPD conditions (c) and HVPD conditions (d). The blue shaded area indicates the drought stress measurement period, while the green shaded area indicates the rewatering measurement period in Figure 1c,d.
Agriculture 15 01375 g001
Figure 2. Stomatal conductance (gs) under stress (a) and rewatering (b). Photosynthetic rate (An) under stress (c) and rewatering (d). Bars represent the mean ± standard deviation (n = 5). HVPD, high VPD; LVPD, low VPD; FHVPD, high VPD followed by rewatering; FLVPD, low VPD followed by rewatering; The different uppercase letters above bars indicate significant differences between VPD treatments under the average SM levels of CK and drought treatments. The different lower-case letters above bars indicate significant differences between SM treatments under the same VPD at p < 0.05 according to Tukey’s HSD (Figure 2a,b). The different uppercase letters above bars indicate the differences between VPD treatments under the same SM, and different lowercase letters above bars indicate the differences between SM treatments under the same VPD at p < 0.05, according to Tukey’s HSD (Figure 2c,d).
Agriculture 15 01375 g002
Figure 3. Percentage loss of wheat leaf hydraulic conductance with decreasing leaf water potential under LVPD (a), HVPD (b), FLVPD (c), and FHVPD (d). The vertical solid line in each curve represents the leaf water potential at 50% hydraulic conduction loss (P50), while the vertical dashed lines indicate its 95% confidence interval. HVPD, high VPD; LVPD, low VPD; FHVPD, high VPD followed by rewatering; FLVPD, low VPD followed by rewatering.
Agriculture 15 01375 g003
Figure 4. Percentage loss of stomatal conductance (gs) to the decline in leaf water potential under LVPD (a), HVPD (b), FLVPD (c), and FHVPD (d). The vertical solid line in each curve represents leaf water potential at which stomatal conductance decreases by 88% (Ψgs88), while the vertical dashed lines indicate its 95% confidence interval. HVPD, high VPD; LVPD, low VPD; FHVPD, high VPD followed by rewatering; FLVPD, low VPD followed by rewatering.
Agriculture 15 01375 g004
Table 1. The experimental sampling information for measured parameters.
Measured ParametersQuantity/DescriptionNotes
Midday leaf water potentialRandomly 5 pots, one plant each pot selectedThe remaining plants were equally subjected during the subsequent samplings
Leaf gas exchange parametersRandomly 5 pots, one plant each pot selectedNon-destructive measurements
Leaf hydraulic conductanceThe same flag leaves as above leaf gas exchange measuredIn total 5 flag leaves
Leaf hydraulic vulnerability curvesRandomly 4 pots selected, 5 plants/pot
In total 20 plants
Destructive measurements
Table 2. Significance analysis of ΨMD, Kleaf, and the Kleaf:An ratio during stress and rewatering periods.
Measured ParametersΨMDKleafKleaf:An
StressRewateringStressRewateringStressRewatering
SMCK−1.39 ± 0.09 a−1.20 ± 0.0612.07 ± 0.28 a8.75 ± 0.14 a0.50 ± 0.05 a0.40 ± 0.12 a
drought−1.87 ± 0.04 b−1.25 ± 0.098.06 ± 0.24 b7.18 ± 0.37 b0.34 ± 0.01 b0.32 ± 0.02 b
p<0.0010.259<0.001<0.0010.0020.005
VPDLVPD−1.59 ± 0.09−1.26 ± 0.0911.95 ± 0.21 a10.09 ± 0.29 a0.49 ± 0.03 a0.43 ± 0.02 a
HVPD−1.66 ± 0.05−1.20 ± 0.066.34 ± 0.07 b5.83 ± 0.21 b0.36 ± 0.02 b0.28 ± 0.02 b
p0.410.867<0.001<0.0010.004<0.001
VPD × SMp0.890.0540.090.760.3350.07
Note: The different lowercase letters above bars indicate the significant differences between SM treatments under the same VPD and significant differences between VPD treatments under the average SM levels of CK and drought treatment at p < 0.05 according to Tukey’s HSD. ns, no significant difference.
Table 3. Comparison of stomatal safety threshold (SSM50) under different treatments.
VPDSMΨgs88P50SSM50S
LVPDCK−1.38−0.74−0.6462.65
Drought−0.97−0.82−0.1535.11
HVPDCK−1.42−0.93−0.4959.51
Drought−1.05−1.160.1149.65
FLVPDCK−1.08−0.63−0.45114.36
Drought−0.85−0.75−0.10101.91
FHVPDCK−1.22−0.69−0.5385.03
Drought−0.89−1.150.26112.3
Disclaimer/Publisher’s Note: The statements, opinions and data contained in all publications are solely those of the individual author(s) and contributor(s) and not of MDPI and/or the editor(s). MDPI and/or the editor(s) disclaim responsibility for any injury to people or property resulting from any ideas, methods, instructions or products referred to in the content.

