Article

The Impact of Supply Chain Finance on the Total Factor Productivity of Agricultural Enterprises: Evidence from China

College of Economics, Sichuan Agricultural University, Chengdu 611130, China
*
Author to whom correspondence should be addressed.
Agriculture 2025, 15(12), 1325; https://doi.org/10.3390/agriculture15121325
Submission received: 23 May 2025 / Revised: 16 June 2025 / Accepted: 18 June 2025 / Published: 19 June 2025
(This article belongs to the Section Agricultural Economics, Policies and Rural Management)

Abstract

:
As the primary force driving the sustainable development of the rural economy, the improvement of the total factor productivity (TFP) of agricultural enterprises (AEs) is of great strategic significance. This study innovatively zeroes in on AEs, leveraging micro-level data from agricultural listed companies in China’s A-share market spanning from 2007 to 2023. It aims to investigate the impact of supply chain finance (SCF) on the TFP of these enterprises and elucidate the underlying mechanisms. Uniquely, this study incorporates enterprise digital transformation and innovation capability as moderating variables into the mechanism analysis framework. Furthermore, it examines the heterogeneous effects across different characteristics of AEs. The findings reveal that SCF significantly boosts the TFP of AEs. Specifically, a one-standard-deviation increase in the level of SCF is associated with a 0.2658% increase in TFP relative to the mean. This conclusion holds robustly across various tests. Moreover, the interaction terms of SCF with both enterprise digital transformation and innovation capability are significantly positive. This indicates that greater digital transformation and stronger innovation capability amplify the positive effect of SCF on TFP. The heterogeneous analysis further indicates that for AEs with highly optimized human capital, higher financing constraints, and more efficient credit resource allocation, the positive impact of SCF on TFP is particularly pronounced.

1. Introduction

Agriculture is the foundation of a country’s economic development, providing the necessary conditions for the survival and development of all production sectors. In the new development stage, agricultural development no longer relies solely on the initial endowment of inputs [1], but is increasingly dependent on improved production efficiency driven by technological progress [2]. The United Nations’ 2030 Agenda for Sustainable Development establishes the objective of “sustainable and inclusive economic growth” (SDG8), which requires a greater integration of technological innovation and sustainable economic development [3]. Total factor productivity (TFP), defined as the ratio of total output to comprehensive factor inputs, is a key indicator of economic growth quality and plays a crucial role in SDG8 [4], making it a focal point in the agricultural sector. Agricultural enterprises (AEs), as the leading force in agricultural modernization and rural economic development, play a vital role in promoting high-quality agricultural development [5], supporting the rural revitalization strategy, and achieving sustainable rural economic development. Enhancing their TFP is of great significance in this regard.
However, AEs in the agricultural supply chain face significant challenges due to the dual risks of natural and market factors. Natural risks include seasonal fluctuations and cyclical characteristics, while market risks involve price fluctuations. These challenges result in unstable cash flows, the slow transformation of scientific and technological inputs, insufficient collateral, and fluctuating profitability expectations. Consequently, these issues lead to financing dilemmas [6], which in turn affect the process of technological innovation and management optimization, ultimately restricting the improvement of TFP. To resolve the structural financing constraints of AEs and promote sustained improvements in their TFP, thereby driving their sustainable development, it is urgent to optimize the allocation of credit resources.
Along with the wave of financial technology, supply chain finance (SCF) has emerged as an innovative financial service industry. SCF uses financial technology to organically link logistics, capital flow, information flow, and other information across the entire supply chain industry. Based on genuine transactions, it leverages core enterprises within the supply chain to establish an integrated financial supply and risk assessment system for upstream and downstream enterprises [7], thereby providing systematic financing solutions. Relying on the real trade background of the capital deployment mechanism, SCF accurately solves the financing problems of enterprises in the supply chain [8] and guarantees the coherence and smooth operation of the supply chain. Given its ability to effectively substitute for physical collateral in agriculture, SCF holds broad application prospects in the agricultural sector [9]. Currently, the primary forms of SCF in China’s agricultural sector include inventory financing, accounts receivable financing, and order financing. With the application of digital technology, SCF provides in-depth services for agricultural supply chains characterized by the socio-economic features of different regions. These include models such as “leading enterprises + farmers” and “leading enterprises + cooperatives + farmers” [10]. The Chinese government is also highly focused on the role and value of SCF in the agricultural sector. From 2019 to 2023, a series of policy documents were issued in quick succession. These aim to build an efficient financial service ecosystem, promote the development of SCF, and provide more convenient and efficient financial services for the agricultural sector and the real economy. This will help stabilize the industrial chain cycle and improve corporate production efficiency.
Although the existing literature has extensively explored many influencing factors of total factor productivity and, with the rise in SCF, has begun to examine the relationship between SCF and TFP, most studies still adopt a macro perspective. Few studies have linked SCF and TFP from the micro perspective and explored the relationship between the two and their influencing mechanisms in depth. Given the strategic context of building China’s agricultural strength, China’s AEs, as key drivers of economic development, face significant financing challenges. Supply chain finance, as a new type of financing industry, can provide more convenient and efficient financing channels for these enterprises, thereby enhancing TFP. Therefore, how to give full play to the role of SCF in increasing the TFP of China’s AEs has become an important issue in the process of promoting high-quality economic development.
The research in this paper aims to explore how supply chain finance affects the TFP of AEs and the role that enterprises’ digital transformation and innovation capabilities play in this process, as well as examine the heterogeneous effects of different agribusiness firm characteristics. Specifically, the marginal contributions of this study are (1) to empirically analyze the effect of SCF on the TFP of AEs and elucidate the mechanisms through which SCF enhances enterprises’ resource utilization efficiency and production capacity; (2) to explore the moderating role of enterprises’ digital transformation and innovation ability by examining the regulatory mechanism of digital transformation and innovation ability in the relationship between SCF and the TFP of enterprises; and (3) to analyze the heterogeneity of the impact of SCF on TFP, including the degree of human capital optimization, the level of financing constraints, and different credit resource allocation efficiencies, which will provide empirical support for the differentiated development of TFP in AEs with different characteristics.

2. Literature Review

This study involves the following three main strands of research. The first branch of research examines the determinants of TFP. Firstly, there are macro-level influencing factors. Technical efficiency and technological progress are key factors affecting TFP [11]. Among these, the internet [12] and digital economy [13] have become important driving forces for TFP. Other factors, such as industrial policies [14], government subsidies [15], the level of openness to the outside world [16], and the development of financial technology [17] have all been found to significantly influence TFP. In the agricultural sector, TFP is profoundly influenced by agricultural technical efficiency, factor allocation [18], and rural finance [19]. Secondly, there are micro-level influencing factors. As the methods for measuring TFP have become more refined, more attention has been paid to firm-specific factors. Corporate innovation remains a key factor affecting TFP at the micro level. Factors such as human capital accumulation, R&D investment [20], corporate governance efficiency [21], and the degree of digital transformation [22] all have varying impacts on a firm’s TFP. In addition, financing constraints [23], ownership nature [24], asset allocation [25], and information disclosure are also important factors affecting a firm’s TFP.
The second branch explores relevant research on supply chain finance. The current research on SCF has shown steady growth. On the one hand, research findings from case studies show that supply chain finance integrates supply chain cash flows, enabling core enterprises to achieve visibility in their use of funds [26] and providing small and medium-sized enterprises with opportunities for real-time financing [27]. On the other hand, empirical findings based on listed companies show that SCF can significantly enhance the M&A and restructuring ability [28], technological innovation ability [29], and enterprise value [30] of listed companies in China, as well as inhibit corporate diversification [31]. In the agricultural sector, the application of SCF still faces several challenges. First, due to the underdeveloped rural infrastructure and the dispersed nature of Chinese farmers, information transmission in SCF incurs significant transaction costs [32]. Second, farmers generally have lower levels of human capital accumulation and varying willingness to adopt new technologies. The butterfly effect and herd mentality further complicate the implementation of SCF in this sector, necessitating targeted risk management strategies [33]. Third, inherent weaknesses in agricultural production and technological research and development also hinder the deeper application of SCF [34]. To address these challenges, it is essential to continuously enhance human capital accumulation and further improve SCF efficiency through financial technology [35]. By leveraging digital technologies such as the Internet of Things, big data, and cloud computing, agricultural SCF can be digitized. This will help reduce transaction costs in agricultural financing and optimize risk control strategies [10].
The third branch of research focuses on the impact of SCF on the TFP of enterprises. As an innovative financial model, SCF has demonstrated significant effects in enhancing enterprise TFP in recent years. Some studies have linked SCF and TFP from a micro perspective, exploring the relationship between the two and their influence mechanisms. Some scholars have selected specific industry or market samples for their studies, confirming that the development of SCF can significantly enhance the financing efficiency of small- and medium-sized enterprises [36], improve the TFP of listed manufacturing companies in China [37], and boost corporate productivity [38]. It can also enhance the green productivity of corporates [39] and TFP during the process of digital transformation [40].
In general, SCF and TFP are two key economic concepts that have been studied extensively in the literature. However, few studies have combined these two concepts, and most micro-perspective studies have selected all enterprises or manufacturing enterprises as samples and paid insufficient attention to AEs. AEs, the main body promoting rural revitalization, agricultural industrialization, and sustainable rural economic development, generally face financing constraints, information asymmetry, and innovation input risks. Supply chain financing can improve financing efficiency by providing credit to core enterprises in the agricultural supply chain. It can also reduce information asymmetry by facilitating information flow within the supply chain and improving TFP by integrating the agricultural supply chain and incentivizing innovation among AEs. Therefore, there is much room for further research on how SCF can promote the TFP of AEs.

3. Mechanism Analysis and Research Hypotheses

3.1. Supply Chain Finance and Total Factor Productivity of Agricultural Enterprises

Changes in the mode of economic growth have led to more efficient, sustainable, and innovative requirements for improving the TFP of enterprises [41]. At present, the TFP improvement of AEs covering the fields of agriculture, forestry, animal husbandry, fishery, and related processing and manufacturing faces a number of dilemmas. First, bank loans remain a crucial channel for the innovative financing of AEs [42]. However, AEs are constrained by the intrinsic vulnerabilities of agriculture, such as the cyclicality of agricultural production, natural disasters, and fluctuations in commodity markets. These factors lead to unstable cash flows and volatile expected returns. Additionally, the difficulty of collateralizing agricultural property rights further complicates the situation, making it challenging to increase TFP. Given the problems of cash flow instability and fluctuations in expected returns, coupled with the difficulty of collateralizing agricultural property rights and the low value of other collateral, such as agricultural machinery and equipment and agricultural inventory, financial institutions often adopt a cautious lending approach [43]. Second, most AEs are not supply chain cores, and financial institutions do not have sufficient information about the internal control of the enterprise, and information asymmetry has increased the constraints on financing for agribusiness-related upgrading enterprises. Third, agriculture-related innovations from biological breeding and breeding research and development to the deep processing of agricultural products and other innovative research as well as development technology innovations are characterized by a long cycle and high uncertainty [44]. To reduce financial risks and improve their own credit ratings, AEs tend to carry out more robust business operations, which once again impedes the enhancement of TFP.
In terms of financing efficiency, SCF embeds commercial credit as a supplement to traditional financing channels, which can broaden the financing channels of agriculture-related enterprises and improve the efficiency of capital allocation [45]. That is, agriculture-related enterprises in the supply chain, such as upstream farmers and plantation cooperatives, can obtain credit penetration of the core enterprise. This penetration reduces financial institutions’ focus on their individual finances during assessments, lowers investigation and assessment costs, and ultimately improves financing efficiency. As a result, AEs can obtain more liquidity support and enhance the supply chain’s ability to transform funds [46], thereby alleviating financing constraints and improving TFP [47].
From an information perspective, core AEs have close business dealings and interests with other AEs in the supply chain, and the information is more real and sufficient. SCF connects the upstream and downstream supply chain networks through core AEs. This connection can fully utilize the information advantage of core AEs and leverage the supply chain information flow to obtain operational information from other enterprises. This optimizes information efficiency and alleviates information asymmetry [40]. As a result, it can reduce the difficulty of risk control for financial institutions, thereby providing financing services to a wider range of long-tail customers.
In terms of human capital incentives, improving TFP relies on technological progress, which is fundamentally driven by human capital [48]. Particularly in the agricultural sector, enhancing the quality of human capital has become a fundamental support for agricultural technological innovation and the improvement of factor efficiency [49]. SCF can alleviate the financing constraints of AEs, enabling them to attract high-quality human capital with more competitive salaries; moreover, internal human capital quality can be enhanced through skill training and incentive schemes (e.g., allowances), thereby recruiting a group of employees with strategic vision, mastery of modern agricultural technology, and modern management and financial literacy. These employees are better equipped to address the inherent weaknesses of agriculture, more effectively identify market demands, engage in the breeding of new varieties, develop new processes, or apply advanced processing technologies [50]. Additionally, through the accumulation of knowledge stock and learning-by-doing, they can fully leverage and amplify the advantages of knowledge spillover and technological diffusion in supply chain collaboration, thereby promoting technological innovation [51] and enhancing TFP.
In terms of supply chain synergy, SCF integrates the logistics, capital flow, and information flow of the agricultural supply chain through resource allocation, information transfer, and benefit sharing; strengthens the connection between AEs; and makes the agricultural supply chain a community. This helps improve the acquisition and sharing of resources in the supply chain as a whole, promote technology spillovers and knowledge sharing, and enhance the collaborative innovation ability of the supply chain. It also facilitates the optimization of resource allocation and maximizes overall production efficiency [52]. It can also play the role of multiparty governance to inhibit the opportunistic behavior of management and the resulting resource mismatch problem [53]. In addition, SCF strengthens the overall business robustness of the supply chain, enhances anti-risk resilience, and reduces the operational impacts of factors such as agricultural product stagnation and natural disasters. This, in turn, motivates agro-related enterprises to actively carry out technological innovation and management optimization, which promotes the transformation of factors into real TFP [54]. Therefore, this paper proposes the following hypothesis:
Hypothesis 1.
Supply chain finance can increase the total factor productivity of agricultural enterprises.

3.2. Moderating Effects of Enterprise Digital Transformation

With the advancement of digital technologies and the rise of the digital economy, a new wave of globalization transformations has commenced [55]. The development of the digital economy fundamentally changes the interaction of economic entities, production processes, and cross-border trade. Enterprise digital transformation is a transition to the production of digital products and business models (management, logistics, labor organization, etc.) using digital platforms [56]. Against the backdrop of the booming SCF model, enhancing digitization levels and bridging digital gaps have intensified the intrinsic demand of AEs to improve TFP [57]. Digital transformation enables the real-time collection and sharing of data regarding agricultural production environments, processing workflows, and market trends. This reduces information asymmetry between core enterprises and small- and medium-sized AEs along the supply chain. Core enterprises can more efficiently monitor the operational status of agricultural supply chain firms. This, in turn, reduces the risk costs of credit guarantees and enhances their willingness to provide guarantees [58]. It also allows financial institutions to consider the operational data of agricultural supply chain participants, based on the credit guarantees provided by core enterprises. This reduces credit assessment and external governance costs, deepens the penetration rate of supply chain financial services, and enhances the financing constraint relief effect of SCF. However, when financial institutions leverage fintech to conduct SCF operations, small- and medium-sized AEs with low levels of digital transformation may struggle. They may face difficulties in maintaining technical compatibility with financial institutions, particularly in terms of data storage hardware and software [59]. This can impact the development of SCF. Additionally, digital transformation, through the deep integration of digital technology and data elements, offers several benefits. It reduces internal management and external transaction costs for agricultural products via digital platform mechanisms [60], creating a more agile and efficient operational foundation for AEs. It also promotes specialized division of labor, empowers precision agriculture and smart production, and enhances the overall operational efficiency of the agricultural supply chain. The implementation of big data and cloud computing technologies optimizes the combination of input factors. The liquidity injected by SCF can be more swiftly and precisely allocated to critical production processes and technological innovation activities. This avoids the misallocation or inefficient use of funds. In other words, the digital operational environment amplifies the efficiency of SCF funds. It enables them to fully unlock the value of production factors and strengthen the role of TFP improvement [61]. On this basis, this paper proposes the following hypothesis:
Hypothesis 2.
The digital transformation of enterprises can strengthen the positive impact of supply chain finance on the total factor productivity of agricultural enterprises.

3.3. Moderating Effects of Enterprise Innovativeness

Technological innovation, as the primary catalyst for productivity enhancement, plays a pivotal role in optimizing production efficiency and is intricately linked to the sustainable development of economic systems [62]. Enterprise innovativeness refers to a firm’s capacity to continuously engage in innovation activities and effectively convert innovation inputs into outputs through resource integration and technological application in a dynamic market environment [63]. In particular, the production and operation activities of AEs are often seasonal, requiring substantial capital investment for raw material procurement, equipment maintenance, and production operations during critical periods like spring plowing and fall harvesting [64]. This concentrated seasonal demand necessitates efficient capital allocation by enterprises. AEs with stronger innovation capabilities typically employ a higher proportion of research personnel, exhibit greater R&D investment intensity, utilize more advanced information and communication technology, and operate within more robust internal institutional environments. These factors enable them to provide the necessary innovative foundations for the efficient allocation of SCF funds, thereby enhancing production efficiency [65]. Firstly, the stronger the innovation capabilities of AEs, the higher their technology conversion rates. This enhances their status and creditworthiness within the agricultural supply chain, making them more likely to secure support from SCF. More importantly, after obtaining financial support, their well-developed R&D conditions and technology transfer capabilities enable them to efficiently allocate these funds to key innovative activities. These activities include agricultural technology R&D, equipment upgrades, and production process optimization, all of which enhance TFP. Secondly, AEs with strong innovation capabilities can better engage in technical cooperation and knowledge sharing within the supply chain. This promotes the sharing of innovative outcomes, which helps optimize the production processes and resource allocation of the entire supply chain and enhances overall operational efficiency. Within this collaborative and efficient supply chain ecosystem, the liquidity support provided by SCF—such as funding for seasonal procurement, supply chain equipment upgrades, and joint R&D projects—can flow and be allocated more smoothly along the supply chain. This enables it to be used more effectively to overcome technical bottlenecks and amplify its impact on TFP at the system level. In summary, this paper proposes the following hypothesis:
Hypothesis 3.
Improving enterprise innovation ability can strengthen the positive impact of supply chain finance on the total factor productivity of agricultural enterprises.

4. Empirical Design

4.1. Sample Selection and Data Sources

The advent of the concept of “modern agriculture” in Central Document No. 1 of 2006 was followed by China’s escalating commitment to agricultural industrialization in 2007. The present study was conducted on the basis of data availability, and the research sample consists of listed companies on the Chinese A-share market from 2007 to 2023. From the perspective of the agricultural supply chain valuation, this study focuses not only on primary agricultural production enterprises but also on processing industries whose raw materials originate from agricultural production. This assertion is supported by the findings of relevant research by Chen and Bu [66], which, according to the CSRC’s 2012 industry classification standards, identified seven categories of A-share listed companies as agricultural enterprises: The following AEs were selected for further analysis: “agriculture, forestry, animal husbandry, and fisheries,” “agricultural and sideline food processing,” “food manufacturing,” “wine, beverages, and refined tea manufacturing,” “textiles,” “leather, fur, feather products, and footwear manufacturing industry,” and “wood processing and wood, bamboo, rattan, palm, and grass products manufacturing industry.” Samples that experienced ST, PT, provisional listing, or delisting during the sample period were excluded from the study. This study obtained a total of 2139 firm-year observations. The firm database for this study was derived from the CSMAR and Wind databases.

4.2. Variable Selection and Descriptive Statistics

(1)
Explained Variable
Total factor productivity of enterprises: The prevailing methodologies employed within academic circles for the estimation of the TFP for micro-enterprises encompass the Solow residual method [67] (OLS), the Olley–Pakes method [68] (OP), the fixed effect model (FE), the generalized estimation method (GMM), the Levinsohn–Petrin method [69] (LP), and the Ackerberg–Caves–Frazer method [70] (ACF). Naive application of OLS can lead to issues like “simultaneity bias” and “sample selection bias.” The FE method incorporates individual fixed effects into the regression to address “simultaneity bias.” However, it does not effectively capture time-varying information, and the assumption that observable TFP remains constant over time is overly restrictive. The OP method assumes firms base investment decisions on current productivity, using current investment as a proxy for unobservable productivity shocks. However, this method also excludes firms with no new investment, resulting in significant sample loss. The ACF method takes into account the impact of productivity shocks on labor input; however, the assumption that labor is a free variable is overly stringent. The relative paucity of labor protection legislation in China has contributed to the relative obscurity of this issue. The GMM is an approach used to address endogeneity issues by incorporating instrumental variables. However, it requires extensive difference and lag processing of the sample, which imposes significant constraints. The LP method utilizes intermediate inputs as proxy variables, thereby effectively mitigating endogeneity and avoiding excessive sample loss. This approach offers a more nuanced perspective, capturing the multifaceted nature of productivity differences across firms and within specific entities. Furthermore, the LP method has been demonstrated to exhibit robust empirical performance in measuring TFP and can accurately estimate production function parameters.
Consequently, this paper employs the LP method to calculate the TFP of Chinese AEs in the benchmark regression test, aligning with the research conducted by Jin et al. [71] and Ding and Gao [72]. The specific algorithm is as follows:
The Cobb–Douglas production function is shown in Equation (1):
Y i t = A i t L i t α K i t β
where Y i t represents output (the output of firm i at time t); A i t represents total factor productivity; L i t α and K i t β represent labor and capital inputs, respectively; and α and β represent the output elasticities of capital and labor, respectively. Taking the logarithm of Equation (1), this study obtained Equation (2):
l n Y i t = α l n L i t + β l n K i t + μ i t
where μ i t represents the residual term, which contains information about the logarithmic form of total factor productivity   A i t . To solve the problem of simultaneity bias, the residual term of Equation (2) is decomposed to obtain Equation (3), where the split residual term ( μ i t ) can be observed and influenced by enterprises in their choice of current factors, and ( ε i t ) is the real residual term in the model:
l n Y i t = α l n L i t + β l n K i t + μ i t + ε i t
Further inputs of the main variables, i.e., the output variable ( l n Y i t ), capital input variable ( l n K i t ), labor input variable ( l n L i t ), and intermediate inputs, are used to calculate total factor productivity TFP_LP measured via the LP method.
(2)
Explanatory Variables
Supply chain finance: With reference to Zhou and Wu [73] and according to the different descriptions of supply chain finance keywords, to measure the level of corporate supply chain finance and quantitatively evaluate the activity and development level of the supply chain finance activities of listed companies, this paper uses the work frequency statistic method. Specifically, the frequency of supply chain finance-related terms in their annual reports is counted and logarithmic processing of the specific keywords is performed, as shown in Table 1.
(3)
Moderating Variables
Degree of digital transformation of enterprises (Digitaleco): Drawing on the study of Zhang et al. [74], this paper adopts the ratio of year-end digital technology intangible assets to year-end intangible assets to measure the degree of digital transformation of enterprises. Specifically, the keywords related to year-end intangible assets disclosed in the notes of the financial reports of listed companies include “software”, “network”, “client”, “management system”, and “smart assets”. The terms “management system”, “intelligent platform”, and other keywords related to digital transformation technology are used to represent digital technology intangible assets. Enterprise innovation ability (Inno): Referring to Zhang et al. [75], the logarithm of the sum of the number of patents obtained by listed agricultural enterprises in the year plus 1 is used to measure innovation ability.
(4)
Control Variables
To control for the influence of other variables on enterprise value and improve the empirical results, factors that have been proven to have an impact on enterprise value are selected as control variables: enterprise size (Size, natural logarithm of total assets), gearing ratio (Lev, total liabilities/total assets), return on total assets (ROA, net profit/total assets), company age (Age, ln(current year − year of incorporation + 1)), total asset turnover (ATO, operating income/average total assets), whether the auding agency is one of the big four (Big4, the company is audited by one of the Big 4 (Pricewaterhouse Coopers, Deloitte, KPMG, Ernst & Young) = 1), the proportion of fixed assets (FIXED, net fixed assets/total assets), percentage of shareholding of the first largest shareholder (Top1, number of shares held by the first largest shareholder/total number of shares), and the degree of equity checks and balances (Balance, the sum of the shareholding ratio of the second to fifth largest shareholders divided by the shareholding ratio of the first largest shareholder).
The descriptive statistics for each variable are shown in Table 2.

4.3. Model Setting

(1)
Benchmark Regression Model
To test the relationship between supply chain finance and enterprise total factor productivity, this paper sets the benchmark regression model as follows:
T F P i t = α + β l n S C F i t + γ C o n t r o l s i t + μ i + θ t + ε i t
where i and t denote the enterprise and year, respectively, T F P i t   denotes enterprise total factor productivity, l n S C F i t   denotes supply chain finance, C o n t r o l s i t denotes control variables, μ i denotes individual fixed effects, θ t denotes year fixed effects, and ε i t denotes random error terms.
(2)
Moderating Effect Model
To further verify the moderating role of the degree of enterprise digital transformation and enterprise innovation ability, the interaction terms of supply chain finance and the degree of enterprise digital transformation, supply chain finance, and enterprise innovation ability are introduced to construct Models (5) and (6) for the mechanism test as follows:
T F P i t = 0 + β 1 l n S C F i t + β 2 l n S C F i t × D i g i t a l e c o i t + β 3 D i g i t a l e c o i t + γ c o n t r o l s i t + μ i + θ t + ε i t
T F P i t = 0 + β 1 l n S C F i t + β 2 l n S C F i t × I n n o i t + β 3 I n n o i t + γ c o n t r o l s i t + μ i + θ t + ε i t
where i and t denote the enterprise and year, respectively; T F P i t    denotes enterprise total factor productivity; l n S C F i t   denotes supply chain finance; D i g i t a l e c o i t denotes enterprise digital transformation; I n n o i t denotes enterprise innovation capability; C o n t r o l s i t denotes control variables; μ i denotes individual fixed effects; θ t denotes year fixed effects; and ε i t denotes random error terms.

5. Empirical Analysis

5.1. Benchmark Regression

The regression results of the impact of SCF on the TFP of listed AEs are shown in Table 3. Column (1) shows the regression results without adding control variables, and the regression coefficient of SCF (lnSCF) is 0.0777, which is significant at the 1% level. Column (2) shows the regression results with all control variables added, and the SCF-level coefficient decreases to 0.0311, which is still significant at the 1% level, indicating that SCF still exerts a significant positive impact on the TFP of Chinese listed AEs. This indicates that a one-standard-deviation increase in the SCF level of an AE is associated with an increase in its TFP of approximately 0.2658% relative to the mean. (The standard deviation of lnSCF is 0.7105, and the coefficient of lnSCF in column (2) of Table 4 is 0.0311 after adding the control variable. The mean value of TFP_LP is 8.3144, and thus, 0.0311 ×0.7105/8.3144 = 0.2658%.) The significant positive correlation of the SCF-level coefficient validates the core conclusion and hypothesis of research Hypothesis 1. SCF can leverage the creditworthiness of core AEs to improve the efficiency of supply chain financing and alleviate information asymmetry. It has the capacity to integrate the agricultural supply chain, enhance collaborative innovation capabilities, and maximize overall production efficiency. Consequently, it improves the TFP of AEs and promotes sustainable agricultural development through continuous high-efficiency output.

5.2. Robustness Test

(1)
Replacement of explanatory variables
To prevent measurement errors in the dependent variables, the reliability of the conclusions should be verified. The OLS method, the OP method, the FE model, the GMM, the ACF method, and the LP method are used to remeasure the TFP of enterprises (expressed as TFP_OP, TFP_OLS, TFP_FE, TFP_GMM, and TFP_ACF, respectively). After the explanatory variables are replaced, the OLS regression coefficients for SCF corresponding to TFP_OP, TFP_OLS, TFP_FE, TFP_GMM, and TFP_ACF are 0.0333, 0.0281, 0.0272, 0.0347, and 0.0188, respectively, all of which are significantly positive at the 0.01 level. The above regression results again verify Hypothesis H1.
(2)
Extending the observation window
This study considers the cyclicality of the improvement in TFP of AEs. This paper draws on the research of Wei and Du [76] to investigate whether SCF can maintain a stable, positive effect on the TFP of listed AEs over the long term. A three-period lag and a one-period front term for the explained variable SCF and the explanatory variable the TFP of enterprises are adopted for calculation using the LP method, respectively. As the lag period lengthened, some samples had missing data, resulting in a decrease in the number of observations. The results show that the coefficients of the SCF lagged term and the enterprise TFP front term are both significantly positive. This finding indicates that the impact of SCF on the TFP of AEs has a significant superimposed effect over a longer time period, which further validates the research results of this paper (Table 5).
(3)
Regression excluding samples from municipalities and random subsamples
Beijing, Tianjin, Shanghai, and Chongqing, as municipalities directly under the central government, possess distinctive characteristics. The four municipalities have demonstrated a notable degree of financial technology development and have received increased policy support and resource allocation. This paper draws on the research of Qiu et al. [77] to exclude samples where the city of origin of the AEs is one of the four municipalities, and then performs regression analysis on the remaining subsamples. Furthermore, regression analysis is performed on subsamples randomly selected at 80%, 60%, and 40% of the total sample. The results of the aforementioned test are displayed in Table 6. The SCF coefficient, which is a measure of the relationship between SCF and financial performance, is found to be 0.0314. This coefficient is found to be significantly positive at the 1% level of statistical significance. Following the effective reduction in the potential advantage of municipalities on the estimated results, the robustness of the benchmark regression results is once again verified. The SCF coefficients in the 80%, 60%, and 40% sub-samples are all significantly positive, collectively supporting Hypothesis 1.

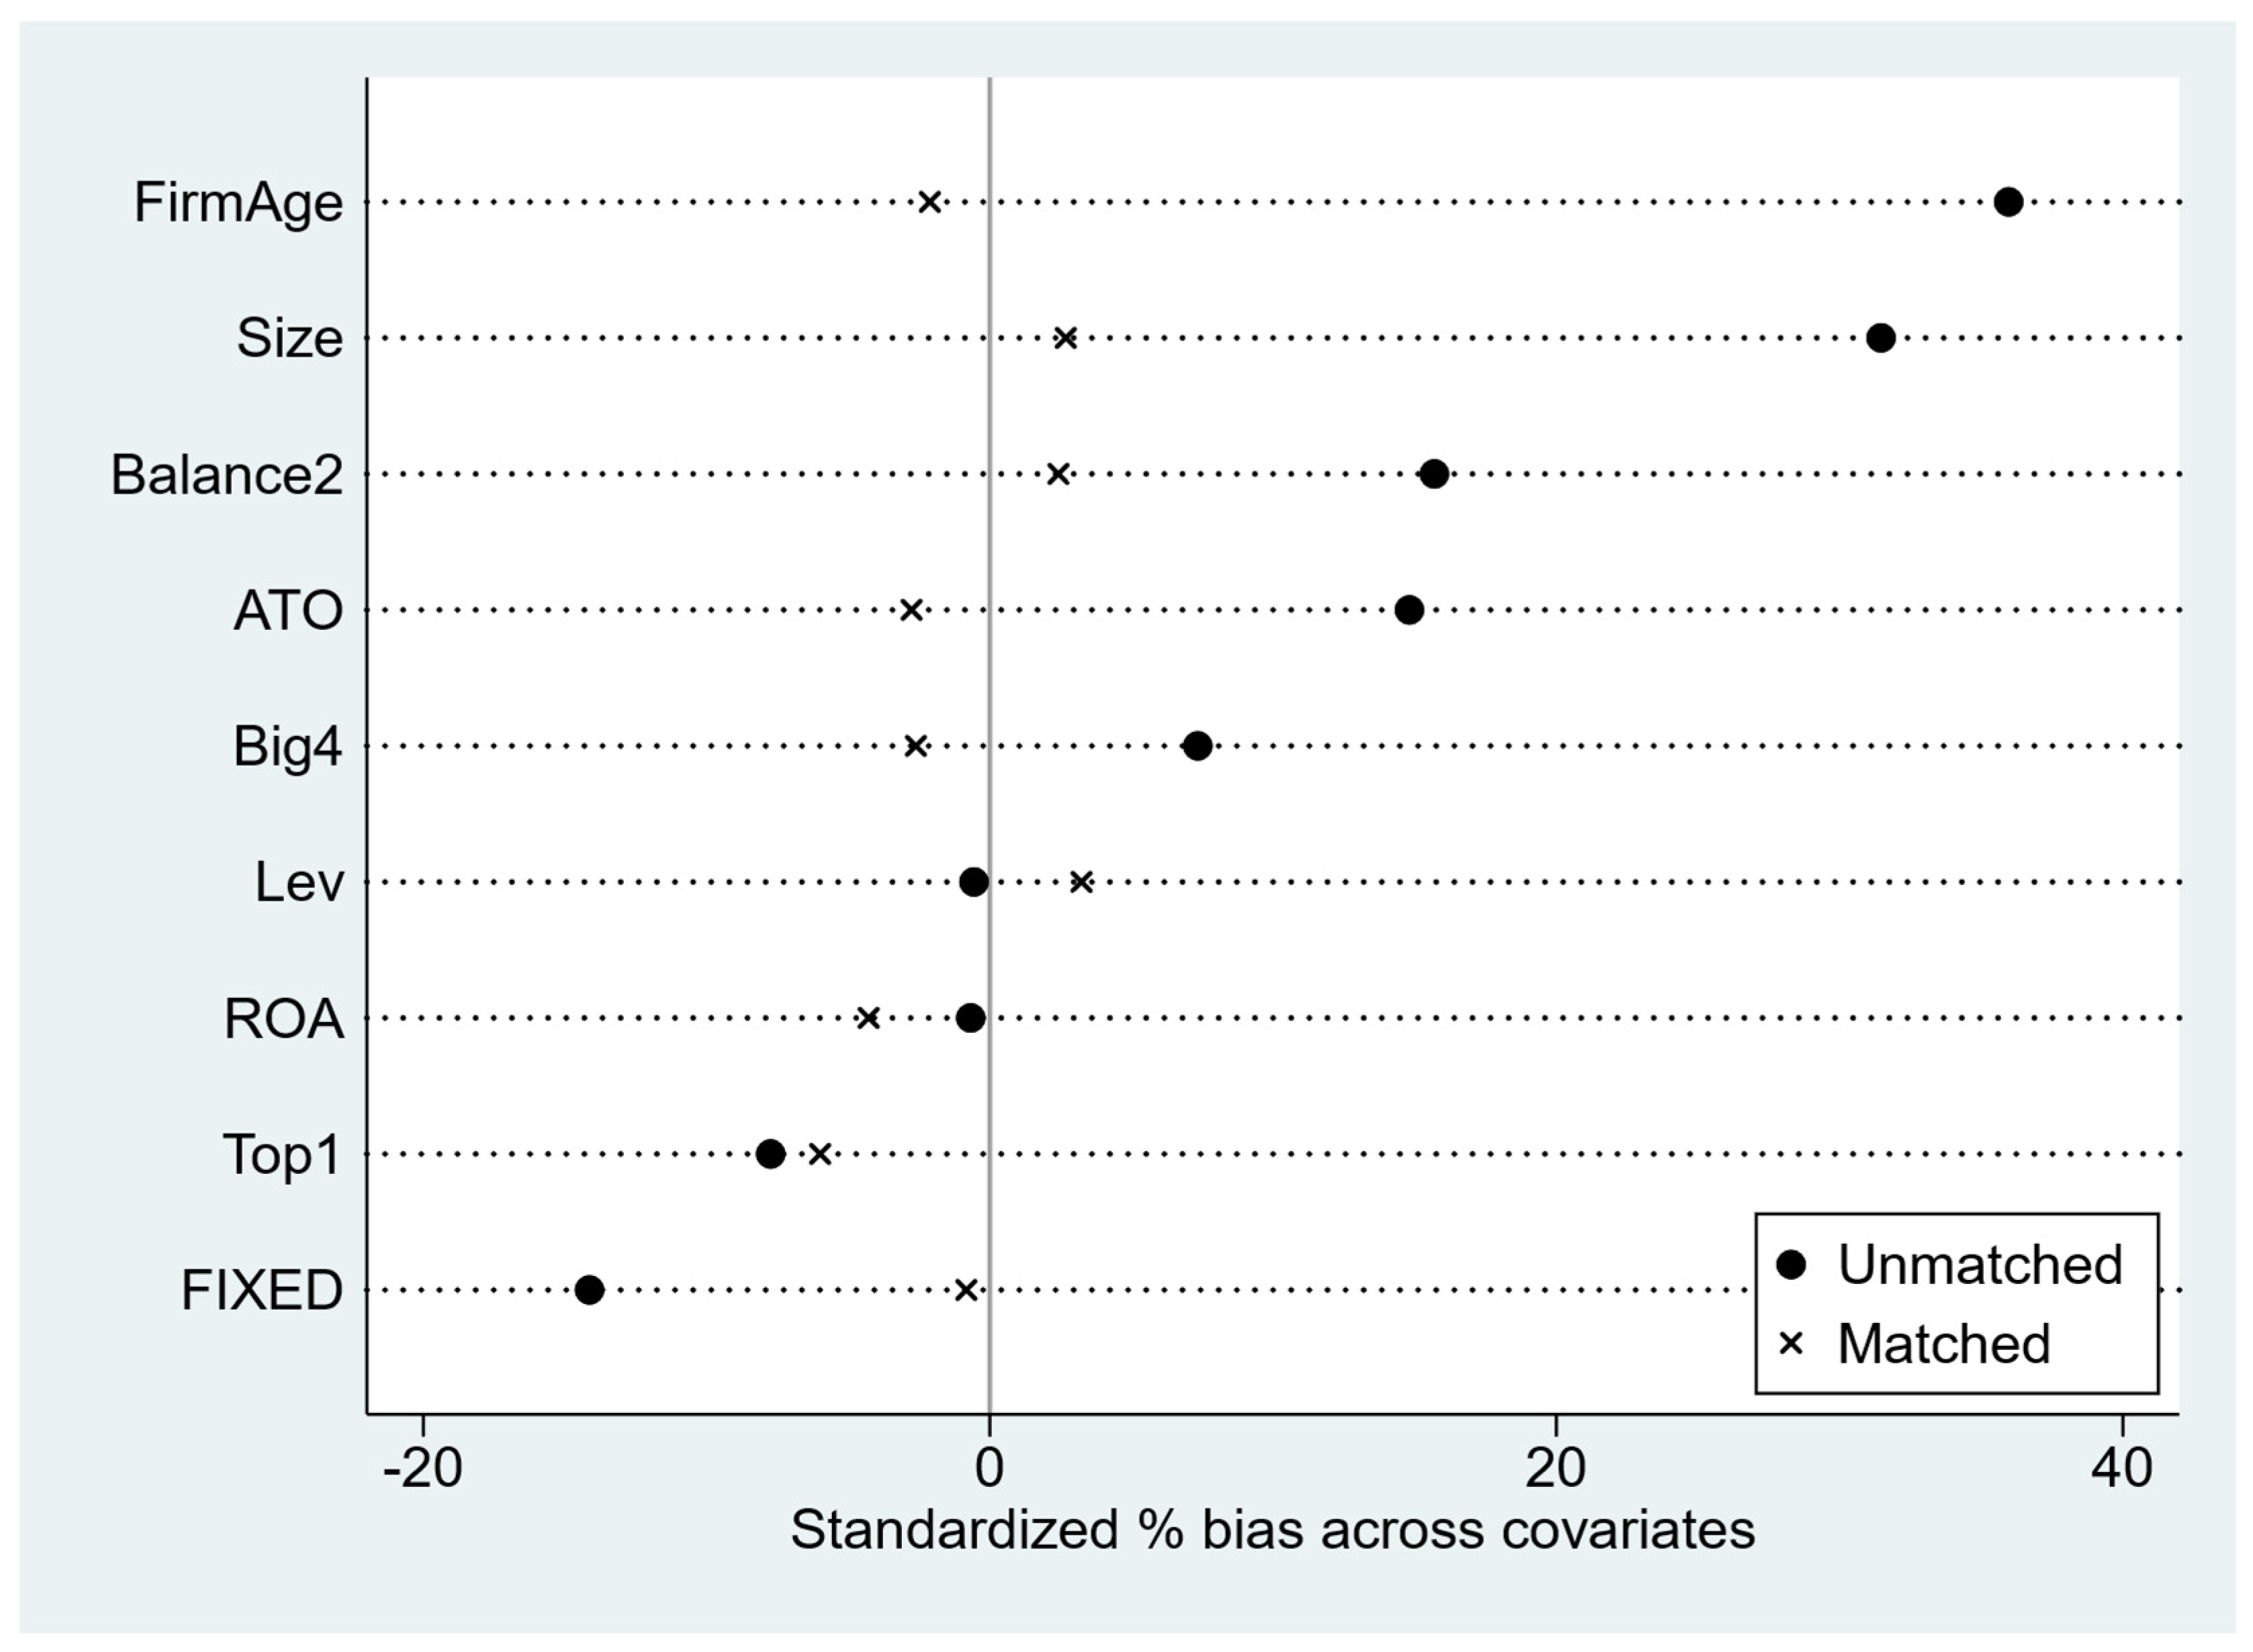
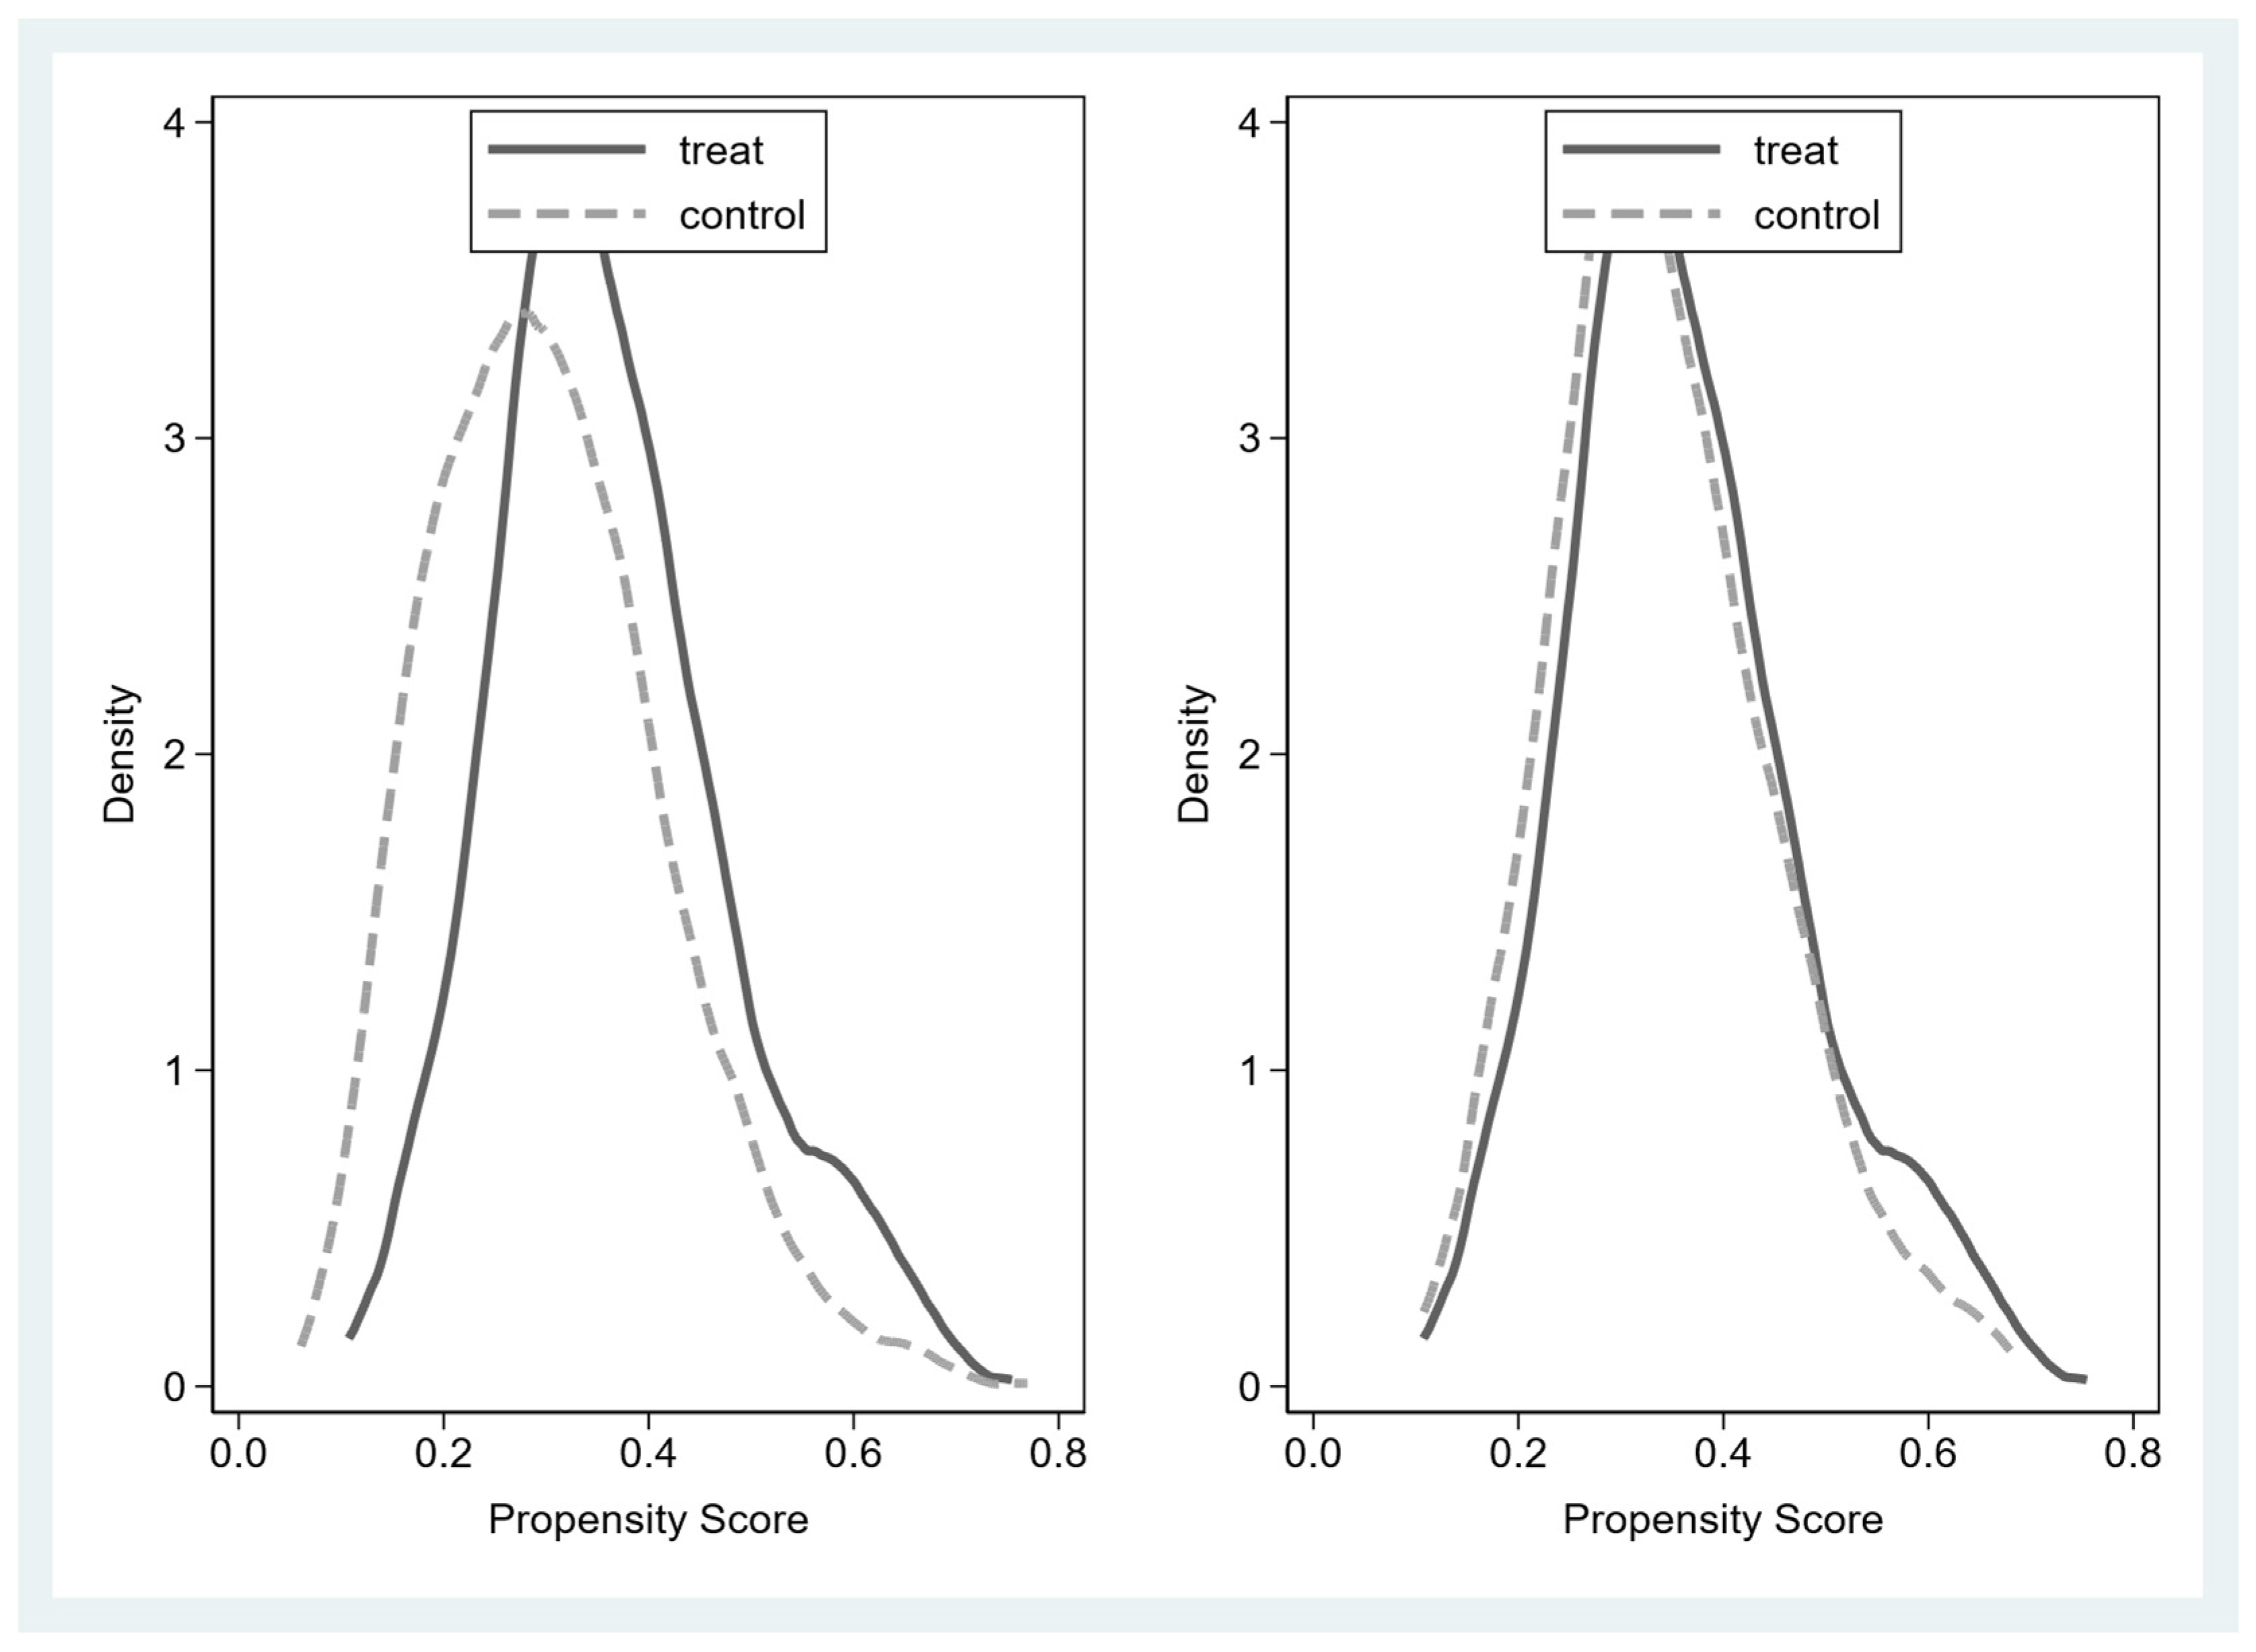
5.3. Endogeneity Test

(1)
Propensity Score Matching (PSM) Test
The decision of AEs to engage in SCF business is not arbitrary and is based on a careful analysis of their operational circumstances. To mitigate the endogeneity problem due to self-selection bias, this paper adopts propensity score matching (PSM) for endogeneity testing, referring to Cheng et al. [78]. In this paper, listed agricultural enterprises that have disclosed at least one keyword related to supply chain finance are taken as the treatment group, and listed agricultural enterprises that have not disclosed keywords related to supply chain finance are taken as the control group. The covariates are consistent with the control variables of the benchmark regression. Owing to the smaller sample size and greater number of matching variables in the treatment group, to avoid the loss of information caused by the failure to match too many samples, 1:2 nearest neighbor matching is used with a caliper range of 0.01, and a logit model is used to calculate the propensity scores. The results are shown in Table 7 and Table 8 and Figure 1 and Figure 2. The rate of change of bias for each covariate after matching, as shown in Table 7, is less than 10%, and there is no significant difference in the covariates. Figure 1 shows that the standardized deviation of all the variables decreases after matching, indicating that the matching is valid. From kernel probability density is shown in plot 2, which indicates that the trends of the treatment group and the control group after matching are basically the same. In addition, the regression results after matching are shown in Table 8, indicating that the level of supply chain finance still has a significant effect on the enterprise’s total factor productivity; these results suggest that the positive effect of the level of supply chain finance on the total factor productivity of agricultural enterprises still exists after the influence of the nonrandom distribution of the sample and confounding factors is excluded.
(2)
Instrumental Variable (IV) Test
There may be reverse causality between the level of supply chain finance and the total factor productivity of listed agricultural enterprises, and the higher the level of total factor productivity, the greater the likelihood that enterprises will engage in supply chain finance-related business and disclose supply chain finance. In addition, there may be unobserved variables that lead to changes in the impact of the supply chain finance level on the total factor productivity of listed agricultural enterprises. Therefore, this paper adopts the instrumental variable approach to further reduce the disturbance caused by the endogeneity problem.
Specifically, two instrumental variables are selected in this paper. The first instrumental variable is the Bartik instrumental variable constructed by drawing on Bartik [79,80]. The specific calculation is as follows: the lagged period average supply chain finance level in the province where the agricultural enterprise is located multiplied by (1 + the growth rate of the national average level of agricultural supply chain finance in the current period) and then 1 is added to the logarithmic treatment. On the one hand, since the national level of agricultural supply chain finance comes from more than two hundred listed companies, the level of supply chain finance will not be significantly affected by the enterprise total factor productivity of a listed company in a prefecture-level city, which satisfies the condition of exogeneity; on the other hand, although factors other than supply chain finance in the province where the enterprise is located may lead to estimation bias, as long as the factor is not significantly correlated with the level of supply chain finance in the whole country, the correlation assumption is satisfied. The second approach aligns with the research of Li et al. [81], which involves the selection of the mean value of the SCF level of agricultural enterprises in the same province and year, lagged by one period, as the instrumental variable. The average situation of SCF activities conducted by agricultural enterprises in the same region can exert a peer effect, enabling enterprises to observe and imitate each other. This, in turn, can influence their own participation in supply chain finance business, satisfying the assumption of correlation. The lagged value of other enterprises in the same region is unlikely to affect the total factor productivity of agricultural enterprises, satisfying the assumption of exogeneity.
The regression results indicate that in the first-stage regression results, the instrumental variables are significantly positively correlated with the level of SCF at the 1% level, suggesting a robust correlation between the two. Moreover, the Kleibergen–Paap rk LM statistic p value is 0.000, passing the nonidentifiable test; the Kleibergen–Paap rk Wald F statistic is much larger than the critical value at the 10% level of the Stock–Yogo weak identification test, passing the weak instrumental variable test. In the second-stage regression results, the regression coefficient of the SCF level and TFP is still significantly positive, indicating that after controlling for the effects of endogeneity, SCF can still significantly enhance the enterprise SCF of listed AEs (Table 9).

6. Further Analysis

6.1. Mechanism Test: Moderation Effect Analysis

(1)
The Moderating Effect of Enterprise Digital Transformation
The digital transformation of firms participating in supply chain finance can provide dynamic support for promoting corporate innovation and improving total factor productivity by optimizing data-driven innovation decisions, accelerating the application of new technologies, and providing flexible financing support. The results are shown in Table 10, which shows that the cross-multiplier term of the centered supply chain finance index and the degree of digital transformation of enterprises, i.e., variable scf_Digitaleco, is significantly positive at the 0.05 level, indicating that the digital transformation of enterprises enhances the role of supply chain finance in the total factor productivity of enterprises of listed agricultural enterprises. Hypothesis 2 is confirmed. In the process of the digital transformation of agricultural enterprises, a unified data platform can be established to monitor and manage the supply chain, improve the reliability of supply chain information, solve the problem of information asymmetry, narrow the financing channels, improve the production efficiency of agricultural enterprises, and promote the realization of more potential credit financing, thus fully tapping the value of the production factors of enterprises, releasing enterprises’ new development kinetic energy, and enhancing the total factor productivity of agricultural enterprises.
(2)
The Moderating Effect of Enterprise Innovation Capability
Supply chain finance can expand financing channels, enhance the financing capacity of enterprises, strengthen the level of enterprise resource allocation, and improve the allocation efficiency of the resources required for enterprise innovation. Enterprise innovation can also enhance total factor productivity driven by the structural effect of factor flow allocation supported by supply chain finance and promote the improvement of total factor productivity through the technological effect.
The results are shown in Table 10. The cross-multiplier term of the centered supply chain finance level and enterprise innovation capability, i.e., variable scf_Inno, is significantly positive at the 0.01 level, indicating that enterprise innovation capability enhances the role of supply chain finance in promoting the total factor productivity of agricultural enterprises. Hypothesis 3 is confirmed. The greater the enterprise innovation ability, the more obviously supply chain finance promotes the total factor productivity of agricultural enterprises. This means that improving the innovation ability of agricultural enterprises can lead to the development of more supply chain financial models through financial technology and other means, strengthen the technical cooperation and knowledge sharing of agricultural supply chain enterprises, improve the efficiency of the use of supply chain financial funds, reduce the risk of agricultural enterprises suffering from the impact of seasonal factors in production and operation activities, and more effectively enhance enterprises’ total factor productivity in the process of optimizing technology, equipment, and management innovations.

6.2. Heterogeneity Analysis

(1)
Based on the degree of human capital optimization
The enhancement of TFP in agriculture is contingent upon technological progress, which, in turn, is dependent on human innovation. Within the agricultural sector, the possession of highly skilled labor is particularly conducive to addressing the inherent limitations of agriculture. These skilled individuals can effectively leverage financial support within the supply chain, accurately identify market demand, and facilitate technological research and development applications. In the contemporary era, agricultural production that is characterized by a higher degree of technological sophistication and a more intricate agricultural product market environment has resulted in elevated demands for enhanced human capital quality. Consequently, this study draws on the research of Huang [82] and Guo et al. [83], employing the proportion of employees with graduate degrees or higher relative to the total workforce as a proxy variable for human capital optimization. The sample is then divided into two groups based on its annual average: high human capital optimization and low human capital optimization. Group-based regression analysis is conducted to analyze the data.
The results of this study are presented in Table 11 (1) and (2). In AEs characterized by a high degree of human capital optimization, the coefficient of SCF attains a significant positive value at the 5% level. Conversely, in AEs manifesting a low degree of human capital optimization, the coefficient does not attain statistical significance. Moreover, the intergroup coefficients that were subjected to Fisher’s exact test demonstrated significant disparities. This finding suggests that the impact of SCF on the TFP of AEs varies significantly depending on the level of human capital optimization, with a more pronounced impact observed in enterprises with higher-quality human capital. High-quality human capital exhibits a greater capacity for diversified product demands [48] and demonstrates a superior aptitude for the effective comprehension and utilization of SCF instruments, including big data and fintech. This facilitates the profound integration of SCF. Moreover, through the accumulation of knowledge reserves and experiential learning, it can effectively analyze actual operational conditions and conduct agricultural technological innovation and application. And financial support from SCF will be efficiently converted into improvements in production.
(2)
Based on the degree of financing constraints
The improved total factor productivity of agricultural enterprises cannot be achieved without stable financial support, and external financing constraints can affect the allocation of resources such as capital, thus inhibiting improvements of an enterprise’s total factor productivity. This paper draws on the research of Kaplan et al. [84] and uses the KZ index to measure the degree of financing constraints; the greater the absolute value of the financing constraint index, the greater the financing constraints of the enterprise, and vice versa. In this paper, the annual median of the financing constraint KZ index is used as a grouping criterion to divide the sample into two groups of high and low financing constraints, and a group regression is performed. The results are shown in Columns (1) and (2) of Table 11. The coefficients of the supply chain finance level are significantly positive at the 1% level in agricultural enterprises with a high degree of financing constraints, and in agricultural enterprises with a low degree of financing constraints, the supply chain finance level index is insignificant; the coefficients are also significantly different between the two groups. This finding indicates that, compared with agricultural enterprises with a lower degree of financing constraints, agricultural enterprises with a higher degree of financing constraints who participate in supply chain finance show a more obvious enhancement of their total factor productivity. Owing to the stable supply of funds, agricultural enterprises with lower financing constraints rely less on supply chain finance in the transformation process of enhancing total factor productivity; when the financing constraints of agricultural enterprises are high, supply chain finance improves their external financing capacity, which can improve the external financing capacity of agricultural enterprises, mitigate financing constraints, incentivize inputs for innovation and transformation, and make it easier to transform financial resources into enhanced total factor productivity.
(3)
Credit resource allocation efficiency
The participation of listed agricultural enterprises in supply chain finance helps expand the scale of credit resources in the supply chain, reduce the price of credit, improve the efficiency of credit allocation, alleviate financing pressure, and improve the total factor productivity of listed agricultural enterprises. On the one hand, supply chain finance has the characteristic of self-paying trade financing, which can significantly enhance the financing ability of supply chain enterprises to revitalize and make use of more liquid assets [46]. On the other hand, the reasonable optimization of credit allocation can effectively reduce credit distortion, promote the free flow of credit resources in the supply chain [85], and improve the supply and demand balance of enterprises in the chain, thus improving the cycle speed of the entire supply chain and accelerating the speed of enterprise input and output to further improve the total factor productivity of enterprises.
This paper draws on the practice of Liu and Qi [86] to measure the efficiency of credit resource allocation by dividing the increase in the sum of short-term borrowing and long-term borrowing by the total assets. A larger value indicates a higher efficiency of credit resource allocation, and vice versa. Through the use of its annual median as a grouping criterion, the sample is divided into two groups of high and low credit resource allocation efficiency, and a group regression is conducted. The results are shown in Columns (5) and (6) of Table 11. In enterprises with high credit resource allocation efficiency, the coefficient of the supply chain finance level is significantly positive at the 5% level. In enterprises with low digital transformation, the coefficient of the supply chain finance level is not significant. Furthermore, the coefficient difference between the two groups is significant. This finding shows that in the process of agricultural enterprises’ participation in supply chain finance, the greater the efficiency of credit resource allocation, the more they can realize the full potential of supply chain financial resources, promote the flow of supply chain resources and supply chain integration and circulation, and enhance the total factor productivity of enterprises.

7. Conclusions and Policy Recommendations

7.1. Conclusions

On the basis of the micro data of AEs listed in China’s A-share market from 2007 to 2023, this study thoroughly explores the impact of SCF on the TFP of AEs and its mechanism of action in terms of a theoretical analysis and empirical tests. The main conclusions are as follows: (1) The benchmark regression results show that SCF can significantly enhance the TFP of AEs. For every one-standard-deviation increase in the level of SCF for AEs, the TFP of these enterprises increases by 0.2658% relative to the mean. This means that the enhancement brought by SCF significantly strengthens the output capacity of AEs under the same resource inputs, which helps to increase the added value of agricultural products, enhance market competitiveness, and promote high-quality and sustainable development in agriculture. Robustness tests indicate that the conclusions remain robust even when the TFP measurement method is changed, and this effect exhibits a significant cumulative impact over the long term. After conducting endogeneity tests such as PSM tests and instrumental variable methods, the benchmark regression conclusions are still supported. (2) The moderating effect mechanism test reveals that enterprise digital transformation and innovation ability play significant moderating roles in the relationship between SCF and enterprise TFP. Specifically, the digital transformation of AEs can alleviate information asymmetry and financing constraints, thereby strengthening the promotional effect of SCF on the TFP of AEs. The enhancement of innovation capabilities in AEs can open up more SCF models, strengthen technical cooperation and utilization efficiency in agricultural supply chains, and enable SCF to more effectively improve corporate TFP. (3) Heterogeneity analysis reveals that the effect of SCF on improving the TFP of AEs varies significantly with financing constraints, bank–enterprise relationships, and credit resource allocation efficiency. SCF has a more pronounced effect on improving the TFP of enterprises characterized by high financing constraints, high human capital optimization, and high credit resource allocation efficiency.

7.2. Policy Recommendations

On this basis, this paper proposes the following countermeasures:
First, improve supply chain financial support policies to alleviate the financing constraints of AEs. The government is expected to guide core AEs to utilize their credit to carry out SCF business through tax relief or financial interest subsidies, joint social capital to increase the scope of SCF risk compensation funds, and compensation for the bad debt losses of agriculture-related financing to a certain extent. Financial institutions should innovate supply chain financial services. By developing diversified SCF products such as agricultural order financing and warehouse pledges tailored to the agricultural industry chain, they can broaden financing channels and alleviate the constraints faced by AEs in technological upgrading and management optimization. Financial institutions should innovate supply chain financial services and use SCF to develop diversified products such as order financing for agricultural products and warehouse pledges around the agricultural industry chain, which will broaden financing channels and alleviate the financing constraints faced by AEs in technological upgrading and management optimization. This promotes “sustained, inclusive, and sustainable economic growth” for AEs and rural economies. Meanwhile, relying on the supply chain information transmission mechanism, financial institutions are supposed to construct an agricultural supply chain credit-sharing ecology, fully utilize the agricultural supply chain network, supervise the flow of supply chain financial funds, improve operation status, and strengthen external governance of opportunistic behavior of AEs.
Second, accelerate the digital transformation of AEs and strengthen technology-driven innovation. By increasing financial subsidies and tax incentives, AEs can be guided to purchase digital equipment, digital management systems can be upgraded, and the transparency of agricultural supply chain information can be enhanced. In parallel, governments and AEs should prioritize and expedite coordinated efforts to develop rural network infrastructure and modernize digital hardware systems. Enterprises should be encouraged to carry out research and development related to agricultural breeding, deep-processing technology for agricultural products, and innovations in specialty agricultural products and management modes. Starting from the core enterprises of the agricultural supply chain, resources from industry, academia, and research should be integrated, which will lead to the establishment of an innovation platform, the formation of supply chain innovation synergy through upstream and downstream AEs’ innovation cooperation, and the transformation and application of agricultural innovation achievements. The supply chain financial digital participation ability of AEs should be increased, the penetration of SCF should be enhanced and coupled with innovation subsidies, the threshold for upgrading and transformation should be decreased, the cost of trial and error should be lowered, and the enabling effect of SCF to support the TFP of AEs should be increased.
Third, optimize the efficiency of credit resource allocation and enhance the precision of financial services. By leveraging the creditworthiness of core AEs and utilizing SCF for financing support, the agricultural supply chain can be integrated and optimized, and overall efficiency and credit standards will be enhanced, securing more long-term and stable agricultural financing services. This will drive improvements in the TFP of AEs and promote their sustainable development. Additionally, encourage financial institutions to innovate credit management models, develop intelligent credit systems based on big data and artificial intelligence, improve the efficiency of SCF credit approval processes, enhance SCF risk management capabilities, ensure the safe and effective use of credit funds, and provide financial support for the sustainable development of AEs. Furthermore, strengthen regulation to prevent credit funds from flowing into non-sustainable projects, ensuring the healthy and sustainable development of the rural economy.
Fourth, optimize the human capital structure and promote talent empowerment. Universities and vocational colleges should be encouraged to offer specialized courses in agricultural digitalization. This will help accumulate knowledge in agricultural technology and management innovation, and cultivate professionals suited to modern agriculture. Governments and businesses should set up special talent funds to support training in organizational optimization and technology application for AEs, enhancing employees’ skills in agricultural technology. AEs should be encouraged to establish long-term partnerships with universities and research institutions. They can attract high-quality talent to the agricultural sector through internships and other means. It is also important to improve incentive mechanisms, such as talent allowances and benefits, to retain excellent personnel. This will provide a solid human resource base for the sustainable development of the agricultural supply chain.

8. Limitations of the Study

Despite the contributions of this study in exploring the impact of SCF on the TFP of AEs and its underlying mechanisms, several limitations should be acknowledged:
First is the limitations of the data. This study primarily relies on data from agricultural listed companies in China’s A-share market, which limits the scope of the sample and excludes non-listed AEs and small and micro AEs. Future research could expand the sample to include non-listed and small and micro AEs to enhance the representativeness of the findings.
Second is the limitations of the macroeconomic context. This study is based on China’s macroeconomic environment. Moreover, this study did not take into account the long-term impact of supply chain finance on the total factor productivity of agricultural enterprises after incorporating long-term macroeconomic variables. Subsequent research endeavors may encompass the incorporation of countries exhibiting macroeconomic environments that diverge considerably from China’s. This expansion could entail a meticulous examination of the long-term ramifications, with the objective of augmenting the generalizability of the research conclusions.
Third is the limitations of the research focus. This study uses keyword frequency statistics as a proxy for the level of SCF and does not sufficiently explore the differential impacts of various SCF modes, such as accounts receivable financing and inventory financing, on TFP. Additionally, while corporate digital transformation and innovation capability are measured using the proportion of digital intangible assets and the number of patents, other forms of innovation outcomes, such as management and business model innovations, may be overlooked. Future research could refine and enrich these measurement indicators to provide more targeted conclusions for AEs to select appropriate SCF modes and enhance their digital transformation and innovation capabilities.

Author Contributions

Conceptualization, H.L. and Y.Y.; methodology, Y.Y.; software, H.L.; validation, H.L.; formal analysis, Y.Y.; investigation, L.W.; resources, H.L.; data curation, H.L.; writing—original draft preparation, H.L., Y.Y., L.W. and Y.W.; writing—review and editing, L.W. and Y.W.; visualization, L.W. and Y.Y.; supervision, Y.L.; project administration, Y.L.; funding acquisition, Y.L. All authors have read and agreed to the published version of the manuscript.

Funding

The work has been financially supported by the Major Program of the National Social Science Foundation of China (No. 18BMZ126).

Institutional Review Board Statement

Not applicable.

Informed Consent Statement

Not applicable.

Data Availability Statement

The data can be obtained from the corresponding authors upon a reasonable request.

Conflicts of Interest

The authors declare that they have no conflicts of interest.

References

  1. Yin, N.; Wang, Y. Impacts of Rural Labor Resource Change on the Technical Efficiency of Crop Production in China. Agriculture 2017, 7, 26. [Google Scholar] [CrossRef]
  2. Lin, L.; Gu, T.; Shi, Y. The Influence of New Quality Productive Forces on High-Quality Agricultural Development in China: Mechanisms and Empirical Testing. Agriculture 2024, 14, 1022. [Google Scholar] [CrossRef]
  3. Manioudis, M.; Meramveliotakis, G. Broad strokes towards a grand theory in the analysis of sustainable development: A return to the classical political economy. New Political Econ. 2022, 27, 866–878. [Google Scholar] [CrossRef]
  4. Dan, L.; Longlong, L. Building a Global Community of Shared Development: Core Connotations and China’s Practice. Int. Stud. 2024, 4, 5–36+138–139. [Google Scholar]
  5. Yun, D.; Jia, Z. An investigation into the connection between green total factor productivity in agriculture and high-quality agricultural progress: Based on the mechanism of regional financial development. Financ. Res. Lett. 2025, 81, 107324. [Google Scholar] [CrossRef]
  6. Schipmann, C.; Qaim, M. Supply chain differentiation, contract agriculture, and farmers’ marketing preferences: The case of sweet pepper in Thailand. Food Policy 2011, 36, 667–677. [Google Scholar] [CrossRef]
  7. Hofmann, E.; Zumsteg, S. Win-win and No-win Situations in Supply Chain Finance: The Case of Accounts Receivable Programs. Supply Chain Forum 2015, 16, 30–50. [Google Scholar] [CrossRef]
  8. Wang, H.; Wang, Q.; Lai, Y.; Liang, C. Drivers and outcomes of supply chain finance adoption: An empirical investigation in China. Int. J. Prod. Econ. 2020, 220, 107453. [Google Scholar] [CrossRef]
  9. Dong, C.; Feng, X. The Problems and Solutions of Supply Chain Financial Services in Agricultural Modernization. Academics 2020, 12, 130–139. [Google Scholar]
  10. Xu, Y.; Zhang, L. The Digital Transformation of Agricultural Supply Chain Finance: Theory and Chinese Cases. Issues Agric. Econ. 2020, 41, 72–81. [Google Scholar] [CrossRef]
  11. Yan, P.; Wang, B. Efficiency, Technical Progress & Productivity Growth: An Empirical Analysis Based on DEA. Econ. Res. J. 2004, 9, 55–65. [Google Scholar]
  12. Guo, J.; Luo, P. Does the Internet promote China’s total factor productivity? J. Manag. World 2016, 10, 34–49. [Google Scholar] [CrossRef]
  13. Yang, H.; Jiang, L. Digital economy, spatial effects, and total factor productivity. Stat. Res. 2021, 38, 3–15. [Google Scholar] [CrossRef]
  14. Li, J.; Liu, H.; Wan, J. Research on the Impact of Industrial Policies on Total Factor Productivity: Based on the Perspectives of Competitiveness and Fairness. Ind. Econ. Res. 2017, 4, 115–126. [Google Scholar] [CrossRef]
  15. Li, Z.; Yang, S.; Lu, J. The heterogeneous impact of government subsidies on total factor productivity of manufacturing enterprises. Bus. Manag. J. 2019, 41, 5–20. [Google Scholar] [CrossRef]
  16. Mao, Q.; Sheng, B. Opening up to the outside world, regional market integration, and total factor productivity. China Econ. Q. 2012, 11, 181–210. [Google Scholar] [CrossRef]
  17. Tang, S.; Lai, X.; Huang, R. How does fintech innovation affect total factor productivity: Promoting or inhibiting? Theor. Anal. Framew. Reg. Pract. China Soft Sci. 2019, 7, 134–144. [Google Scholar]
  18. Ren, S.; Lv, B.; Zhu, X.; Shi, Q.; Gai, Q. Misallocation and TFP in Rural China. Econ. Res. J. 2011, 46, 86–98. [Google Scholar]
  19. Yin, L.; Shen, Y. Impact of China’s Rural Financial Development on Agricultural Total Factor Productivity: Technical Progress or Technical Efficiency? Financ. Trade Res. 2014, 25, 32–40. [Google Scholar] [CrossRef]
  20. Männasoo, K.; Hein, H.; Ruubel, R. The contributions of human capital, R&D spending and convergence to total factor productivity growth. Reg. Stud. 2018, 52, 1598–1611. [Google Scholar] [CrossRef]
  21. Li, T.; Dong, Y.; Wang, Z. Management Efficiency, Quality Ability and Firms Total Factor Productivity: Empirical Studies Based on the China Employer-Employee Survey. J. Manag. World 2018, 34, 86–99+184. [Google Scholar] [CrossRef]
  22. Zhao, C.; Wang, W.; Li, X. How Does Digital Transformation Affect the Total Factor Productivity of Enterprises? Financ. Trade Econ. 2021, 42, 114–129. [Google Scholar] [CrossRef]
  23. Ren, S.; Lv, B. The Financial Constraints, the Government Subsidies and the Factor Productivity: A Case Study on the Equipment—Manufacturing Enterprises in China. J. Manag. World 2014, 11, 10–23+187. [Google Scholar] [CrossRef]
  24. Xiong, A.; Zhang, Z. State-owned Enterprise Mixed Ownership Reform, Degree of Financialization and Total Factor Productivity South China. J. Econ. 2020, 39, 86–106. [Google Scholar] [CrossRef]
  25. Qian, X.; Kang, J.; Tang, Y.; Cao, X. Industrial Policy, Efficiency of Capital Allocation and Firm’s Total Factor Productivity—Evidence from a Natural Experiment in China. China Ind. Econ. 2018, 8, 42–59. [Google Scholar] [CrossRef]
  26. Grosse-Ruyken, P.T.; Wagner, S.M.; Jönke, R. What is the right cash conversion cycle for your supply chain? Int. J. Serv. Oper. Manag. 2011, 10, 13–29. [Google Scholar] [CrossRef]
  27. Song, H.; Lu, Q. How Does Supply Chain Finance Dominated by Industrial Enterprises Promote SMEs’ Financing Performance—A Multi-Case Comparative Study. Econ. Theory Bus. Manag. 2017, 12, 47–58. [Google Scholar]
  28. Pan, A.; Wang, H.; Ling, R. Can Supply Chain Finance Promote the Cultivation of Chain Owner Enterprises?—Based on the Empirical Evidence of Enterprise M&A. Account. Res. 2023, 14, 120–134. [Google Scholar]
  29. Zhang, S. Supply Chain Finance and Enterprise Technological Innovation: Mechanisms and Effects. Stat. Decis. 2024, 40, 184–188. [Google Scholar]
  30. Lam, K.H.; Zhan, Y.; Zhang, M.; Wang, Y.; Lyons, A. The effect of supply chain finance initiatives on the market value of service providers. Int. J. Prod. Econ. 2019, 216, 227–238. [Google Scholar] [CrossRef]
  31. Lei, X.; Bin, L.; Chen, M.; Jingyu, L. Supply chain finance and firm diversification: Evidence from China. Aust. J. Manag. 2023, 48, 408–435. [Google Scholar] [CrossRef]
  32. Jiang, B.; Wen, T. Research Progress on Agricultural Supply Chain Finance (ASCF). Issues Agric. Econ. 2021, 2, 84–97. [Google Scholar] [CrossRef]
  33. Peng, L. The Main Characteristics of the Financial risk in Agricultural Supply Chain and the Basic Principles of Risk Prevention. Theory Pract. Financ. Econ. 2015, 36, 20–24. [Google Scholar] [CrossRef]
  34. Wang, T.; Lan, Q.; Chu, Y. Supply Chain Financing Model: Based on China’s Agricultural Products Supply Chain. Appl. Mech. Mater. 2013, 380–384, 4417–4421. [Google Scholar] [CrossRef]
  35. Chen, X.; Liu, C.; Li, S. The role of supply chain finance in improving the competitive advantage of online retailing enterprises. Electron. Commer. Res. Appl. 2019, 33, 100821. [Google Scholar] [CrossRef]
  36. Guan, Y.; Sun, N.; Wu, S.J.; Sun, Y. Supply Chain Finance, Fintech Development, and Financing Efficiency of SMEs in China. Adm. Sci. 2025, 15, 86. [Google Scholar] [CrossRef]
  37. Yang, L.; Yuan, H. Supply Chain Financing and Total Factor Productivity: Evidence From Listed Manufacturing Companies in China. J. Int. Dev. 2025, 37, 334–349. [Google Scholar] [CrossRef]
  38. Zhou, Y.; Wang, X.; Wu, J. Will Supply Chain Finance Improve Total Factor Productivity of Enterprises? Econ. Probl. 2023, 11, 57–64. [Google Scholar] [CrossRef]
  39. Gu, H.; Yang, S.; Xu, Z.; Cheng, C. Supply chain finance, green innovation, and productivity: Evidence from China. Pac.-Basin Financ. J. 2023, 78, 101981. [Google Scholar] [CrossRef]
  40. Zhang, L.; Su, X.; Yuan, L. Supply Chain Finance and Digital Transformation of Enterprises: Heterogeneous Features, Channel Mechanisms, and Effect Differences in an Untrustworthy Environment. Financ. Econ. Res. 2021, 36, 51–67. [Google Scholar]
  41. Song, M.; Zhou, P.; Si, H. Financial Technology and Enterprise Total Factor Productivity—Perspective of “Enabling” and Credit Rationing. China Ind. Econ. 2021, 4, 138–155. [Google Scholar] [CrossRef]
  42. Ayyagari, M.; Demirgüç-Kunt, A.; Maksimovic, V. Formal versus Informal Finance: Evidence from China. Rev. Financ. Stud. 2010, 23, 3048–3097. [Google Scholar] [CrossRef]
  43. Guo, J.; Gu, L. Can Agricultural Supply Chain Finance Alleviate the Financing Constraints of Agricultural Enterprises?—Evidence from the Enterprises’ Participation in Targeted Poverty Alleviation. Oper. Res. Manag. Sci. 2022, 31, 112–118. [Google Scholar]
  44. Li, W.; Niu, J. Climate Change, Climate Adaptation Measures and Agricultural Total Factor Productivity—From the Perspective of Input Factors. World Agric. 2025, 5, 29–41. [Google Scholar] [CrossRef]
  45. Zheng, K.; Zheng, L.J.; Gauthier, J.; Zhou, L.; Xu, Y.; Behl, A.; Zhang, J.Z. Blockchain technology for enterprise credit information sharing in supply chain finance. J. Innov. Knowl. 2022, 7, 100256. [Google Scholar] [CrossRef]
  46. Chakuu, S.; Masi, D.; Godsell, J. Exploring the relationship between mechanisms, actors and instruments in supply chain finance: A systematic literature review. Int. J. Prod. Econ. 2019, 216, 35–53. [Google Scholar] [CrossRef]
  47. Liu, L.; Zhao, S. Local government debt, financing constraints and firms’ green total factor productivity. Int. Rev. Financ. Anal. 2025, 97, 103874. [Google Scholar] [CrossRef]
  48. Zhou, K.; Yu, L. How to Empower Common Prosperity with the Advanced Structure of Human Capital. J. Nanjing Audit. Univ. 2025, 22, 100–111. [Google Scholar]
  49. Zheng, Z.; Gao, M. Rural Human Capital Promotes New Quality Productive Forces:Key Problem and Policy Optimization. J. Huazhong Agric. Univ. (Soc. Sci. Ed.) 2024, 5, 10–21. [Google Scholar] [CrossRef]
  50. Cheng, M.; Gai, Q.; Jin, Y.; Shi, Q. Accumulation of Human Capital and Growth of Farmers’ Income. Econ. Res. J. 2016, 51, 168–181+192. [Google Scholar]
  51. Yue, S.; Liu, C. Analysis of Human Capital and Regional Total Factor Productivity. Econ. Res. J. 2006, 4, 90–96+127. [Google Scholar]
  52. Solaimani, S.; van der Veen, J. Open supply chain innovation: An extended view on supply chain collaboration. Supply Chain Manag. Int. J. 2022, 27, 597–610. [Google Scholar] [CrossRef]
  53. Hu, H.; Dou, B.; Wang, A. Corporate Financialization and Productivity. J. World Econ. 2021, 43, 70–96. [Google Scholar] [CrossRef]
  54. Murinde, V.; Rizopoulos, E.; Zachariadis, M. The Impact of the FinTech Revolution on the Future of Banking: Opportunities and Risks. Int. Rev. Financ. Anal. 2022, 81, 102103. [Google Scholar] [CrossRef]
  55. Maryna, D.; Viktor, K.; Volodymyr, H.; Valentyna, K.; Dzintra, A. Ensuring sustainable development of enterprises in the conditions of digital transformations. E3S Web Conf. 2021, 280, 02002. [Google Scholar] [CrossRef]
  56. Kaminsky, O.; Koval, V.; Yereshko, J.; Vdovenko, N.; Bocharov, M.; Kazancoglu, Y. Evaluating the Effectiveness of Enterprises’ Digital Transformation by Fuzzy Logic. Adv. Soft Comput. Appl. 2023, 1, 15. [Google Scholar] [CrossRef]
  57. Guo, J.; Huo, J.; Zhang, J. How Does Digital Finance Affect the Cost of Different Financing Modes?—Based on the Dual Perspective of Internal and External Information Asymmetry. J. Guizhou Univ. Financ. Econ. 2024, 5, 38–47. [Google Scholar]
  58. Qiu, H.; Xu, H. The impact of digital transformation on the performance of agricultural enterprises. Stat. Decis. 2022, 38, 90–95. [Google Scholar]
  59. Hua, J.; Liu, C.; Zhu, D. Digital Transformation, Financing Constraints and Enterprise Total Factor Productivity. South China Financ. 2022, 7, 54–65. Available online: https://link.cnki.net/urlid/44.1479.F.20220701.1759.004 (accessed on 16 June 2025).
  60. Yang, Z.; Wang, X. Digital transformation and high-quality development of agricultural enterprises. J. Huazhong Agric. Univ. (Soc. Sci. Ed.) 2025, 1, 108–120. [Google Scholar]
  61. Li, L.; Zhao, J. Digital Economy Policies and Enterprise Total Factor Productivity: Effect and Mechanism. J. Lanzhou Univ. (Soc. Sci.) 2023, 51, 29–41. [Google Scholar] [CrossRef]
  62. Klarin, T. The Concept of Sustainable Development: From its Beginning to the Contemporary Issues. Zagreb Int. Rev. Econ. Business 2018, 21, 67–94. [Google Scholar] [CrossRef]
  63. Chenxin, M.; Ji, X. R&D Globalization and Enterprise innovation capability. Financ. Res. Lett. 2024, 65, 105613. [Google Scholar] [CrossRef]
  64. Yao, D.; Yan, K. Can factoring business alleviate the seasonal impact on agricultural supply chain enterprises? Int. Rev. Financ. Anal. 2025, 98, 103891. [Google Scholar] [CrossRef]
  65. Guo, X.; Chmutova, I.; Sochynska-Sybirtseva, I.; Karpunina, M. Assessment of China’s Macro-Readiness for Integrated Innovative Management Technologies Employment. Econ. Ecol. Socium 2023, 7, 40–53. [Google Scholar] [CrossRef]
  66. Chen, Y.; Bu, D. Agricultural Information Infrastructure Construction and Agricultural Enterprises’ Values: A Quasi-natural Experiment Based on the “Broadband China” Strategy. J. Agrotech. Econ. 2024, 5, 126–144. Available online: https://link.cnki.net/doi/10.13246/j.cnki.jae.20240312.001 (accessed on 16 June 2025).
  67. Solow, R.M. Technical change and the aggregate production function. Rev. Econ. Stat. 1957, 39, 312–320. [Google Scholar] [CrossRef]
  68. Olley, J.M.; Murray, A.; Roberts, R.G. The effects of disequilibria in the uranium and thorium decay chains on burial dose rates in fluvial sediments. Quat. Sci. Rev. 1996, 15, 751–760. [Google Scholar] [CrossRef]
  69. Levinsohn, J.; Petrin, A. Estimating production functions using inputs to control for unobservables. Rev. Econ. Stud. 2003, 70, 317–341. Available online: https://www.jstor.org/stable/3648636 (accessed on 16 June 2025). [CrossRef]
  70. Ackerberg, D.A.; Caves, K.; Frazer, G. Identification Properties of Recent Production Function Estimators. Econometrica 2015, 83, 2411–2451. [Google Scholar] [CrossRef]
  71. Jin, S.; Tang, P.; Ren, Z. Can Digital Transformation Improve the Total Factor Productivity of Agribusiness? Reform 2024, 2, 131–148. [Google Scholar]
  72. Ding, M.; Gao, Q. The impact of artificial intelligence technology application on total factor productivity in agricultural enterprises: Evidence from China. Econ. Anal. Policy 2025, 86, 399–415. [Google Scholar] [CrossRef]
  73. Zhou, L.; Wu, H. Supply Chain Finance and Product Market Performance. Financ. Econ. Res. 2022, 37, 99–112. [Google Scholar]
  74. Zhang, Y.; Li, X.; Xing, M. Enterprise Digital Transformation and Audit Pricing. Audit. Res. 2021, 3, 62–71. [Google Scholar]
  75. Zhang, Y.; Zhuo, C.F.; Deng, F. Policy Uncertainty, Financialization and Enterprise Technological Innovation: A Way Forward Towards Economic Development. Front. Environ. Sci. 2022, 5, 905505. [Google Scholar] [CrossRef]
  76. Wei, S.; Du, J. How Does Supply Chain Finance Affect Enterprise Innovation? Comp. Econ. Soc. Syst. 2023, 2, 62–74. [Google Scholar]
  77. Qiu, J.; Cui, M.; Pan, A. Supply Chain Finance and Corporate Sustainable Development: Empirical Evidence from ESG Performance. Nankai Bus. Rev. 2025, 6, 1–32. Available online: https://link.cnki.net/urlid/12.1288.f.20250321.1116.003 (accessed on 16 June 2025).
  78. Cheng, C.; Tian, X.; Xu, Z. Supply Chain Finance and Corporate Efficiency Upgrading: Dual Evidence from Listed Company Announcements and Local Policy Documents. J. Financ. Res. 2023, 516, 132–149. [Google Scholar]
  79. Bartik, T.J. Who Benefits from State and Local Economic Development Policies; W.E. Upjohn Institute for Employment Research: Kalamazoo, MI, USA, 1991. [Google Scholar]
  80. Goldsmith-Pinkham, P.; Sorkin, I.; Swift, H. Bartik Instruments: What, When, Why, and How. Am. Econ. Rev. 2020, 110, 2589–2624. [Google Scholar] [CrossRef]
  81. Li, R.; Lai, Z. The Impact of Supply Chain Finance on Corporate Resilience: A Resource Acquisition Perspective. Commer. Res. 2025, 2, 41–50. [Google Scholar] [CrossRef]
  82. Huang, Y. Can Talent Policies Drive Enterprise Digital Technology Innovation: Evidence from Enterprise Digital Patents China. J. Econ. 2025, 12, 247–264. [Google Scholar]
  83. Guo, W.; Guo, T.; Geng, Y. Digital Economy, Upgrading of Human Capital Structure and Total Factor Productivity of Enterprises. Econ. Probl. 2023, 11, 73–79+129. [Google Scholar] [CrossRef]
  84. Kaplan, S.; Zingales, L. Do Financing Constraints Explain Why Investment Is Correlated with Cash Flow? Q. J. Econ. 1997, 112, 168–216. [Google Scholar] [CrossRef]
  85. Bu, J.; Zhu, Y. Can Supply Chain Finance Improve the Total Factor Productivity of Enterprises? Res. Financ. Econ. Issues 2024, 5, 89–104. [Google Scholar] [CrossRef]
  86. Liu, H.; Qi, J. Is the “competition friendly” industrial policy more conducive to improving the efficiency of enterprise investment? A quasi natural experiment based on the fair competition review system. Financ. Trade Econ. 2022, 43, 101–116. [Google Scholar] [CrossRef]
Figure 1. PSM analysis: standardized bias plot for each variable.
Agriculture 15 01325 g001
Figure 2. PSM analysis: Kernel density plots before and after matching.
Agriculture 15 01325 g002
Table 1. Supply chain finance keywords.
TypeKeywords
Accounts receivable-relatedAccounts receivable financing, factoring, reverse factoring, dynamic discounting, accounts receivable securitization
Prepayment-relatedPrepayment financing, future claim financing, pledge of goods financing, guarantee–warehouse financing
Inventory-relatedMovable property pledge financing, inventory pledge financing, inventory financing, stock financing, spot goods pledge financing, warehouse receipt financing, purchase order financing, raw material financing
ComprehensiveSupply chain finance, supply chain financing, supply chain fund, supply chain investment, supply chain loan, supply chain management, trade credit, financial supply chain, supplier financing, buyer financing, supplier–managed inventory, buyer investment, distributor financing, working capital management, logistics financing, unified credit financing, financial value chain, working capital optimization
Table 2. Basic descriptive statistics of each variable.
VarNameNMeanp50SDMinMax
TFP_LP21398.31448.23630.91305.640811.4030
lnSCF21390.401700.710504.5430
Size213922.088021.96331.077119.045626.3316
Lev21390.36820.35880.17170.01981.0369
ROA21390.05520.04560.0763−0.43090.6754
Age21392.90842.94440.34111.09863.6889
Big421390.064500.245701
ATO21390.80200.67160.57040.07446.1342
FIXED21390.26950.25150.13620.00870.7364
Top121390.36650.35420.14760.03910.8999
Balance21390.66990.46510.62250.01083.7306
Table 3. Benchmark regression results.
(1)(2)
VariablesTFP_LPTFP_LP
lnSCF0.0777 ***
(4.0573)
0.0311 ***
(3.0319)
Size 0.6407 ***
(41.1273)
Lev 0.1106 **
(2.1928)
ROA 0.6872 ***
(6.4271)
FirmAge −0.0439
(−0.4953)
Big4 0.1925 ***
(3.9978)
ATO 0.6636 ***
(13.9041)
FIXED −0.5710 ***
(−9.1880)
Top1 0.4110 ***
(2.8528)
Balance −0.0013
(−0.0595)
Constant8.2857 ***
(735.0122)
−6.3429 ***
(−14.3708)
Individual fixed effectsYesYes
Year fixed effectsYesYes
N21182118
R20.88400.9712
Note: **, and *** represent significance at the 5%, and 1% levels, respectively, and the t values are in parentheses.
Table 4. Robustness tests: replacing the explanatory variables.
(1)(2)(3)(4)(5)
VariablesTFP_OPTFP_OLSTFP_FETFP_GMMTFP_ACF
lnSCF0.0333 ***
(2.6950)
0.0281 ***
(3.0042)
0.0272 ***
(2.9777)
0.0347 ***
(2.7693)
0.0188 ***
(2.7075)
ControlsYesYesYesYesYes
Constant−4.5080 ***
(−9.4579)
−8.5669 ***
(−19.6772)
−9.2642 ***
(−21.0192)
−3.4756 ***
(−7.3275)
0.7465 ***
(2.6853)
Individual fixed effectsYesYesYesYesYes
Year fixed effectsYesYesYesYesYes
N21182118211821182118
R20.94440.98150.98350.93660.9540
Note: *** represent significance at the 1% levels, and the t values are in parentheses.
Table 5. Robustness tests: extending the observation window.
(1)(2)(3)(4)
VARIABLESTFP_LPTFP_LPTFP_LPF.TFP_LP
L.lnSCF0.0352 ***
(3.1507)
L2.lnSCF 0.0315 ***
(2.6932)
L3.lnSCF 0.0305 **
(2.4113)
lnSCF 0.0243 *
(1.6643)
ControlsYesYesYesYes
Constant−6.5273 ***
(−11.7812)
−6.2706 ***
(−10.4392)
−5.7345 ***
(−9.1626)
−2.9572 ***
(−2.9434)
Individual fixed effectsYesYesYesYes
Year fixed effectsYesYesYesYes
N1844163414571844
R20.97200.97410.97630.9449
Note: *, **, and *** represent significance at the 10%, 5%, and 1% levels, respectively, and the t values are in parentheses.
Table 6. Robustness tests: excluding samples from municipalities and random subsamples.
Excluding Samples
from Municipalities
80% Random Subsamples60% Random Subsamples40% Random Subsamples
TFP_LPTFP_LPTFP_LPTFP_LP
lnSCF0.0315 ***
(2.8418)
0.0280 **
(2.4081)
0.0231 *
(1.7077)
0.0495 ***
(2.9974)
ControlsYesYesYesYes
Constant−5.8072 ***
(−13.1194)
−6.2199 ***
(−12.4628)
−5.9522 ***
(−10.0541)
−6.8076 ***
(−8.0159)
Individual fixed effectsYesYesYesYes
Year fixed effectsYesYesYesYes
N186517231295826
R20.97050.97030.97500.9812
Note: *, **, and *** represent significance at the 10%, 5%, and 1% levels, respectively, and the t values are in parentheses.
Table 7. PSM test: balanced test results.
CovariateSample CategoryMeanDeviation Change Rate (%)t Test
Treatment GroupControl Grouptp > |t|
SizePrematching22.32321.97731.57.020.000
Postmatching22.31422.2842.70.480.628
LevPrematching0.36760.3686−0.6−0.120.904
Postmatching0.36690.36133.20.610.540
ROAPrematching0.05490.0554−0.7−0.150.882
Postmatching0.05530.0586−4.3−0.790.432
FirmAgePrematching2.98832.870536.07.560.000
Postmatching2.98742.9944−2.1−0.430.666
Big4Prematching0.07700.05867.31.620.105
Postmatching0.07730.0838−2.6−0.450.656
ATOPrematching0.85880.775114.83.180.002
Postmatching0.85840.8740−2.8−0.450.654
FIXEDPrematching0.25650.2757−14.1−3.050.002
Postmatching0.25640.2575−0.8−0.160.874
Top1Prematching0.35880.3701−7.7−1.670.096
Postmatching0.35930.3681−6.0−1.090.275
Balance2Prematching0.73680.638215.73.430.001
Postmatching0.73360.71832.40.430.666
Table 8. PSM analysis: regression of the postmatching sample.
VariablesTFP_LP
lnSCF0.0232 *
(1.7105)
Size0.6420 ***
(21.1058)
Lev0.0966
(0.9547)
ROA0.6662 ***
(3.4403)
FirmAge0.3269 *
(1.7900)
Big40.1989 **
(2.3461)
ATO0.6317 ***
(7.5105)
FIXED−0.5824 ***
(−4.1883)
Top10.5628 *
(1.8312)
Balance20.0086
(0.2221)
Constant−7.4797 ***
(−8.3249)
Individual fixed effectsYes
Year fixed effectsYes
N1397
R20.9746
Note: *, **, and *** represent significance at the 10%, 5%, and 1% levels, respectively, and the t values are in parentheses.
Table 9. IV test results.
(1)(2)(3)(4)
VariableslnSCFTFP_LPlnSCFTFP_LP
lnSCF 0.0942 *
(1.7472)
0.0659 *
(1.9171)
bartik_iv3.4390 ***
(5.0651)
L.provscf_iv 0.5265 ***
(8.7275)
ControlsYesYesYesYes
Constant−3.4352 ***
(−2.9413)
−6.1102 ***
(−11.3168)
−1.7817 *
(−1.7538)
−5.5761 ***
(−12.5396)
Individual fixed effectsYesYesYesYes
Year fixed effectsYesYesYesYes
Kleibergen–Paap rk LM24.56
[0.0000]
74.73
(0.0000)
Kleibergen–Paap rk Wald F25.65
[16.38]
76.17
[16.38]
N1873187318731873
R2 0.9715 0.9775
Note: *, and *** represent significance at the 10%, and 1% levels, respectively, and the t values are in parentheses. The values in [] are the p values, and the critical values at the 10% level of the Stock–Yogo weak identification test.
Table 10. Moderation effect analysis.
(1)(2)
VariablesTFP_LPTFP_LP
lnSCF0.0303 ***
(2.9670)
0.0249 **
(2.3533)
scf_Digitaleco0.1630 **
(2.0203)
Digitaleco−0.1075 **
(−2.2402)
scf_Inno 0.0164 ***
(3.3094)
Inno 0.0009
(0.1842)
ControlsYesYes
Constant−6.3077 ***
(−14.2818)
−6.2900 ***
(−13.9705)
Individual fixed effectsYesYes
Year fixed effectsYesYes
N21182118
R20.97140.9715
Note: **, and *** represent significance at the 5%, and 1% levels, respectively, and the t values are in parentheses.
Table 11. Heterogeneity analysis: regression results.
(1)(2)(3)(4)(5)(6)
High-Quality Human CapitalLow-Quality Human CapitalHigh Financing ConstraintsLow Financing ConstraintsHigh Efficiency of Credit Resource AllocationLow Efficiency of Credit Resource Allocation
VariablesTFP_LPTFP_LPTFP_LPTFP_LPTFP_LPTFP_LP
Supply chain finance level index0.0372 **
(2.0853)
0.0101
(0.9636)
0.0428 ***
(2.6740)
0.0121
(0.9484)
0.0252 **
(2.3414)
0.0371
(1.1287)
ControlsYesYesYesYesYesYes
Constant−7.6474 ***
(−8.8161)
−6.3400 ***
(−10.9969)
−5.4217 ***
(−8.3510)
−6.9266 ***
(−9.9621)
−6.2369 ***
(−13.9408)
−5.5013 ***
(−4.1936)
Individual fixed effectsYesYesYesYesYesYes
Year fixed effectsYesYesYesYesYesYes
p value0.080 **0.060 *0.030 **
N9621137104910321643444
R20.96800.97970.96980.98150.97610.9729
Note: *, **, and *** represent significance at the 10%, 5%, and 1% levels, respectively, and the t values are in parentheses.
Disclaimer/Publisher’s Note: The statements, opinions and data contained in all publications are solely those of the individual author(s) and contributor(s) and not of MDPI and/or the editor(s). MDPI and/or the editor(s) disclaim responsibility for any injury to people or property resulting from any ideas, methods, instructions or products referred to in the content.

