1. Introduction
Rice is a staple food crop of critical importance in China. With the improvement of living standards, the demand for premium-tasting rice has grown significantly. Heilongjiang Province, the leading producer of high-quality japonica rice in China, contributes one out of every nine bowls of rice consumed nationally. Cultivars such as Wuyoudao 4, Longdao 18, Songjing 22, and Yinongdao 12 have been awarded gold medals in the “National High-Quality Rice Taste Evaluation” [
1,
2,
3,
4,
5]. These cultivars form the foundation of renowned brands like Wuchang Rice, Xiangshui Rice, and Yanshou Rice, which enjoy nationwide acclaim [
6]. The superior taste of Heilongjiang rice is attributed to a combination of elite cultivars, optimized cultivation techniques, and favorable ecological conditions, with genetic factors being the primary determinant [
7]. Zhu et al. identified unique physicochemical properties in northern japonica rice rated highly for taste [
8]. Concurrently, agronomic practices must ensure high yields. Zhao et al. demonstrated that point fertilization outperforms full-layer or side-deep fertilization in enhancing both grain quality and yield, with basal-tillering co-application further improving taste [
9]. Hua et al. recommended alternating wetting and drying irrigation with 70% slow-release fertilizer (basal) + 30% urea (topdressing), in the middle-lower Yangtze River region, to balance yield, quality, and resource efficiency [
10]. Nitrogen significantly influences rice yield and taste; excessive nitrogen during grain filling reduces taste value by decreasing amylose content, increasing protein content, and degrading starch-granule morphology [
11].
Cold-region rice production faces two major bottlenecks: (1) narrow genetic diversity, limiting stress resistance and yield potential [
12], and (2) the negative correlation between high yield and premium quality under conventional nitrogen management. Although molecular marker technologies have been employed to dissect genetic diversity and explore fertilization strategies (e.g., nitrogen reduction with density increase or organic substitution), systematic studies on the genetic differentiation of new cold-adapted germplasms and their responses to fertilization remain scarce, hindering breakthroughs in synergistic yield-quality improvement.
Varietal characteristics are the primary determinant of rice palatability. Studies by Liu Youhong et al. demonstrated that the taste value of cold-region japonica rice exhibits an upward trend over time [
13], aligning with the increasing consumer demand for premium rice quality, driven by rising living standards. Notable Heilongjiang japonica cultivars, including Wuyoudao, Longdao 18, Songjing 28, and Yinongdao 12, have received Gold Awards in the National Premium Rice Taste Evaluation [
1,
2,
3,
4,
5] and exhibit superior palatability [
8]. However, since the registration of Wuyoudao 4 (2009) and Longdao 18 (2014, the first national Grade I rice in Heilongjiang), no newly approved varieties have surpassed their sensory quality, highlighting the persistent challenges in breeding cold-region japonica rice with exceptional palatability.
Germplasm resources form the foundation of rice breeding. Heilongjiang has developed high-yielding, premium-quality varieties such as Longjing 31, Suijing 18, and Longdao 18 [
14], contributing significantly to national food security. However, extensive studies indicate the need to broaden the genetic diversity of Heilongjiang rice. This limitation arises from two factors: (1) the unique cold-region agroecology, which restricts the introgression of indica genetic lineages, compared to the rice systems in Jilin and Liaoning provinces [
15], and (2) reliance on conventional breeding techniques with limited parental genetic divergence [
14]. Data from the National Rice Data Center (
https://www.ricedata.cn/variety/index.htm accessed on 24 May 2025) reveal that Longdao 21 and Longdao 18 each contributed to 7 derived varieties, Suijing 18 to 22, and Longjing 31 to 131, predominantly developed through traditional crossbreeding (often single crosses) and pedigree selection. Breeding programs utilizing these parental lines remain concentrated in Heilongjiang and Jilin. Therefore, modern biotechnological approaches are imperative to integrate novel genes into existing Heilongjiang germplasms, thereby creating materials with enhanced physiological activity, optimized yield architecture, improved palatability, and balanced productivity. The cultivar Zhongke 5, developed from crosses involving Kongyu 131, southern long-grain japonica, and Jijing 88, exemplifies this strategy. By introducing indica-derived segments from southern premium japonica, it broadened the genetic base of northeastern japonica rice, pyramiding critical gene modules for blast resistance (
Pi-ta,
Ptr), grain shape (
GW5,
GS3,
GL7), and lodging resistance (
SCM2), achieving synergistic improvement of multiple traits and elevating yield potential [
12].
This study innovatively integrates population genetics and phenomics to address these gaps. Using 29 newly developed cold-region rice lines and elite cultivars, we conducted genetic structure analysis and a two-year split-plot field experiment to investigate (1) genetic differentiation and diversity contributions of cold-region rice germplasms; (2) genotype-specific responses influencing yield, taste, and value, as well as photosynthetic traits, with respect to nitrogen treatments; and (3) screening of breakthrough germplasms and optimized fertilization strategies for cold regions. Key findings include the following: Lines 1, 3, and 8 formed a novel genetic cluster, enriching the genetic base for cold-region rice. Lines 4 and Longdao 17029 exhibited synergistic improvements in yield and taste, with the latter’s high photosynthetic efficiency during grain filling revealing a new physiological mechanism for quality formation. Additionally, moderate nitrogen reduction combined with bio-organic fertilizer (Treatment 2) effectively reconciled the yield–quality trade-off, providing a practical cultivation paradigm for quality-efficiency synergy in cold-region rice production.
2. Materials and Methods
2.1. Experimental Site
Northeast China’s rice cultivation region is a single-cropping early-maturing japonica rice area. Within this region, the area located between 43°25′ N and 53°33′ N is designated as the cold-region japonica rice area, characterized by a frost-free period of 100–150 d and an active accumulated temperature ≥ 10 °C of 2000–2800 °C. Trials were conducted in 2022–2023 at the paddy fields of the Heilongjiang Academy of Agricultural Sciences (45°50′ N, 126°49′ E). Four independent plots which had undergone consistent fertilization since 2017 were used. Soil at the experimental site was identified as Chernozem [FAO classification]. Pre-trial physicochemical analysis revealed the following: total N (1.0 g kg−1), total P (0.6 g kg−1), total K (20.4 g kg−1), alkali-hydrolyzable N (96.4 mg kg−1), available P (24.5 mg kg−1), available K (142.9 mg kg−1), and organic matter content (27.4 g kg−1), with a pH 8.1 measured in a 1:2.5 soil/water suspension.
2.2. Materials
Twenty-nine samples were tested, including drought-tolerant lines bred by our team, as well as elite cultivars (
Table 1). In 2023, the rice cultivars Longdao 18, Longdao 21, and Longdao 17029 were selected as experimental samples for further investigation. All information on officially released rice varieties can be accessed in the Variety section of the China Rice Data Center website at
https://www.ricedata.cn/ (accessed on 24 May 2025).
2.3. Experimental Design
A split-plot design was adopted, with fertilization treatments assigned to the main plots and rice genotypes to the subplots. Seedlings were raised on 16 April and transplanted on 25 May in both 2022 and 2023, with a planting density of 30 × 13.3 cm (row × hill spacing) and four seedlings per hill. The plot areas were 7.5 m2 in 2022 and 15 m2 in 2023, with three replicates arranged in a randomized complete block design (RCBD). Four fertilization treatments were consistently applied across both years: Treatment 1 (T1), 120 kg·ha−1 N, 100 kg·ha−1 P2O5, and 100 kg·ha−1 K2O; Treatment 2 (T2), chemical fertilizer combined with bio-organic fertilizer, with a 20% reduction in nitrogen compared to T1, 100 kg·ha−1 P2O5, and 100 kg·ha−1 K2O; Treatment 3 (T3), no NPK application (control); and Treatment 4 (T4), 450 kg·ha−1 of Longfutianxia slow-release fertilizer.
Nitrogen (N) fertilizer application is divided into basal fertilizer, green-recovery fertilizer, and tillering fertilizer at a ratio of 2:1:1. Phosphorus (P) fertilizer is applied once as the basal fertilizer. Potassium (K) fertilizer is applied as basal fertilizer and panicle fertilizer at a ratio of 1:1. The basal fertilizer was applied one day before land levelling. The green-recovery fertilizer was applied 7 days after transplanting. The tillering fertilizer was applied in mid-June. The panicle fertilizer was applied during the booting stage. Irrigation employed the alternating shallow–wet–dry method. Field drying was conducted for 7 days at the end of June. Pest, disease, and weed control followed standard field-management practices.
Longfu Tianxia slow-release fertilizer has a nitrogen (N), phosphorus pentoxide (P2O5), and potassium oxide (K2O) ratio of 20%–8%–12%. This fertilizer is applied once as a basal fertilizer. The bio-organic fertilizer has an organic matter content ≥60% and a viable bacteria count ≥2 × 10⁸ CFU/g. The microbial consortium includes Bacillus subtilis, Photosynthetic bacteria, Bacillus licheniformis, Bacillus mucilaginosus, Bacillus amyloliquefaciens, and Paenibacillus mucilaginosus.
2.4. Genotyping and Agronomic Trait Measurements
2.4.1. SNP Genotyping (2022)
2022 Measurements: Quality and yield parameters were evaluated. Leaves sampled at the tillering stage were subjected to genetic diversity analysis using a customized 56 K liquid-phase SNP array. This array, jointly developed by Beidahuang Kenfeng Seed Co., Ltd. (Harbin, China) and Huazhi Biotechnology Co., Ltd. (Changsha, China), employs targeted genomic region capture sequencing for precise genotyping. It integrates 56,000 high-polymorphism, genome-wide distributed loci and high-quality SNP markers derived from the re-sequencing data of global rice germplasms. Detailed protocols followed the methodology described in Reference [
16]. Leaf samples collected at the tillering stage were subjected to genomic DNA extraction using the CTAB method, followed by quality assessment. Genotyping was performed using a rice 56 K high-density SNP array. The workflow involved (1) random fragmentation of genomic DNA; (2) hybridization and enrichment of target fragments using molecular probes; (3) sequencing library preparation through adapter ligation; and (4) sequencing on an Illumina platform. Post-sequencing data processing included (i) quality control to remove low-quality reads and adapter sequences (generation of clean data); (ii) sequence alignment using a BWA (Burrows–Wheeler aligner, San Diego, CA, USA) with default bwa-mem parameters; (iii) SNP genotyping within target regions via the Genome Analysis Toolkit (GATK); and (iv) identification of polymorphic SNPs across samples.
2.4.2. Agronomic Trait Measurements (2023)
For the 2023 measurements, the population structure traits were Tillering dynamics, leaf area, and dry matter accumulation. The physiological indices comprised leaf color (SPAD value) and photosynthetic rate. The yield and quality traits comprised grain yield, taste score, and protein content. The analytical procedures adhered to those described in References [
17,
18]. Tiller numbers were recorded every 7 days, from the tillering stage until the jointing stage. For each treatment, 15 uniformly growing plants were consecutively sampled from representative plots, and the average value was calculated. Samples were collected at the peak tillering stage, heading stage, and early grain-filling stage. For each treatment, five representative hills were selected based on average tiller counts, and plants were separated into shoots and roots. Tissues were enzyme-deactivated at 120 °C in a forced-air drying oven and then oven-dried at 80 °C to constant weight for dry matter quantification.
Leaf chlorophyll content was measured using a SPAD-502 chlorophyll meter under clear skies between 8:00 a.m. and 2:00 p.m. Prior to measurements, the instrument was calibrated with the manufacturer’s calibration card. Fifteen flag leaves per treatment were randomly selected, and SPAD values were recorded at the upper, middle, and lower leaf positions, with the average value being calculated. Photosynthetic rate measurements were conducted on the same leaves.
At maturity, rice grains were harvested separately according to experimental plots. Yield and moisture content were determined, and the determination of final grain yield was adjusted to reflect the standard moisture content (14%). For quality analysis, 2 kg of grains from each replicate were stored at ambient temperature for three months to stabilize their physicochemical properties. Grain quality parameters were assessed following the Chinese Agricultural Industry Standards for Cereal and Oil Crops. Samples were processed into polished rice using an FC-2K laboratory husker (Satake, Hiroshima, Japan) and a VP-32 laboratory mill (Yamamoto, Osaka, Japan). Amylose content, protein content, and taste value were analyzed in triplicate using a Foss Tecator 1241 near-infrared analyzer (FOSS, Hillerød, Denmark).
2.5. Data Analysis
The descriptive analysis of the genotypic data and estimation of genetic distances among the rice resources were performed using TASSEL 5.0 software. The neighbor-joining method was employed for cluster analysis, with the phylogenetic tree being visualized using the MEGA 7 software. The genetic distance heatmap was generated through R software-based computations.
Agronomic data were analyzed in SPSS 19.0 using two-way ANOVA, with fertilization and genotype as fixed factors. Post hoc comparisons employed Duncan’s test (p < 0.05). Assumptions of normality (Shapiro–Wilk) and homogeneity (Levene’s test) were verified. Data visualization was conducted with the GraphPad Prism 6 software for graphical representations.
3. Results
3.1. Genetic Structure Analysis
The genotypic dataset of 29 accessions comprised 32,895 molecular markers, including 32,798 single nucleotide polymorphisms (SNPs), 38 deletions (DELs), and 59 insertions (INSs). Among the SNP markers, 4783 exhibited monomorphic variation (single allele), while 28,015 polymorphic SNPs (with >1 allele) were retained for subsequent analyses.
Descriptive analysis of the filtered genotypic data was performed using TASSEL 5.0 software. Through quality control thresholds of minor allele frequency (MAF) > 0.01 and missing data proportion < 0.01, 17,426 high-quality SNP markers were ultimately selected from the 29 rice accessions for downstream analyses.
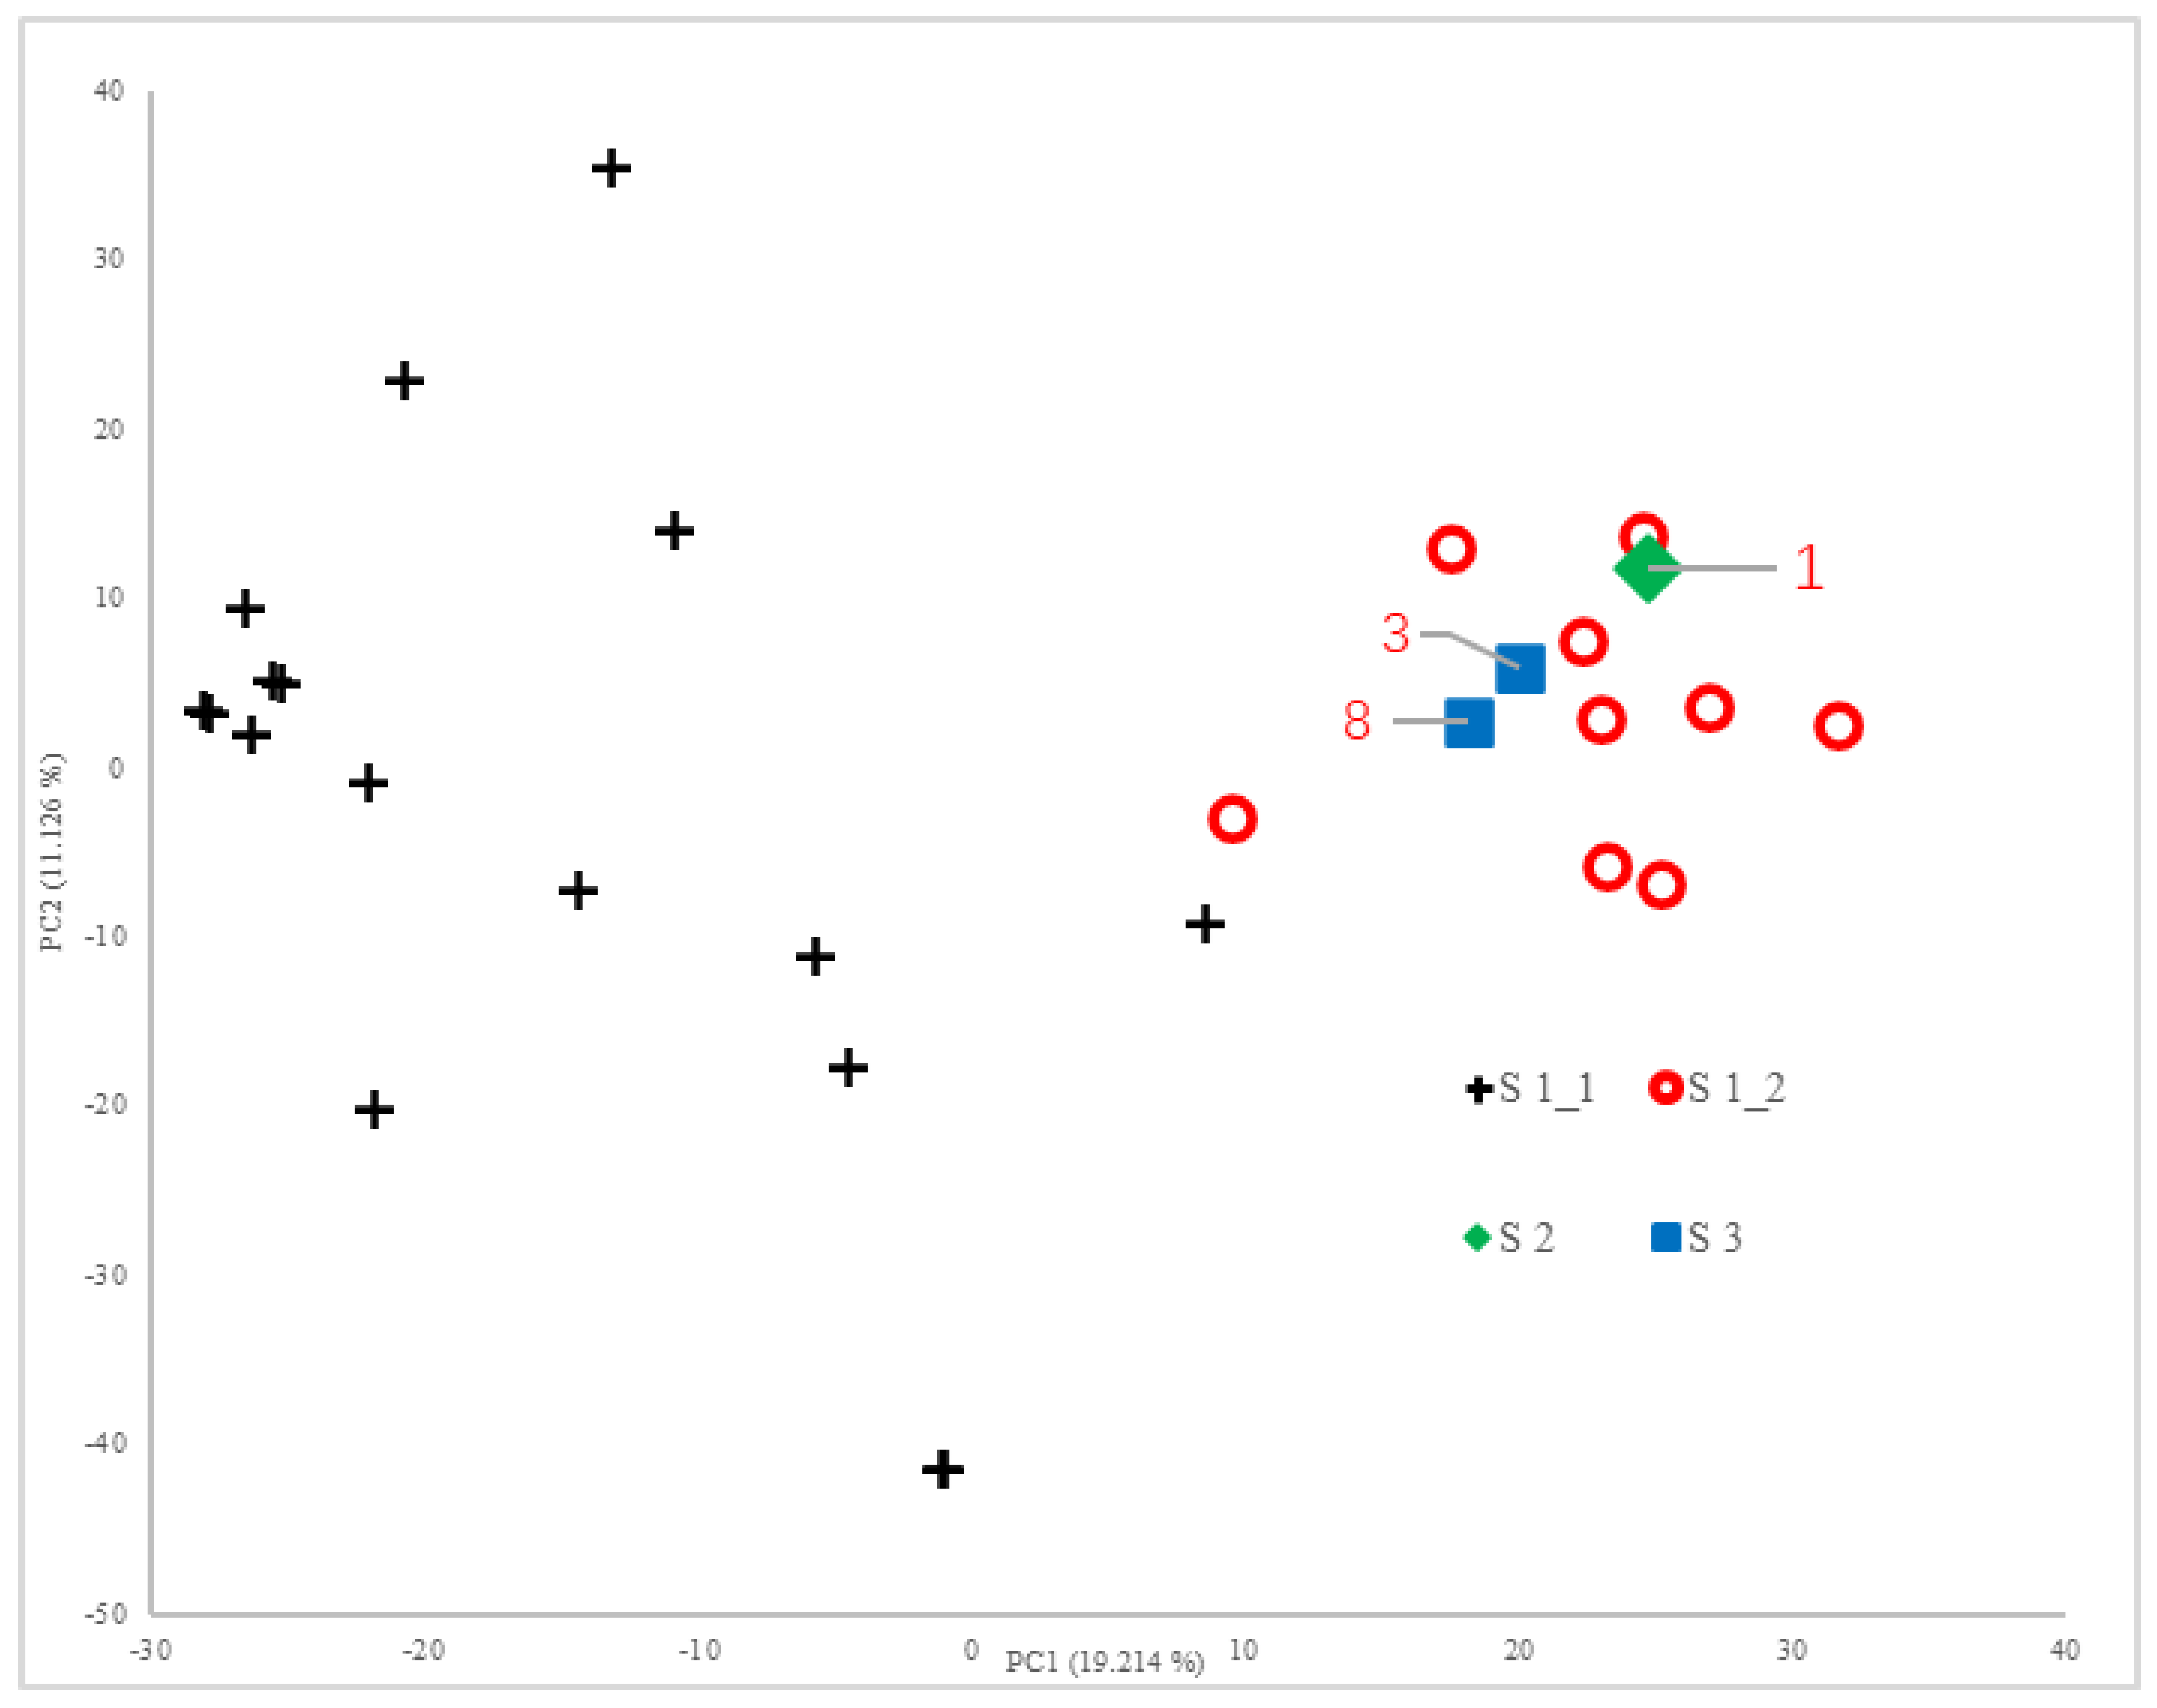
Principal component analysis (PCA) implemented in TASSEL 5.0 was applied to the 17,426 SNP markers. The first two principal components explained 19.214% and 11.126% of the phenotypic variance respectively, cumulatively accounting for 30.340% of the total variance. The genetic relationships among accessions were visualized through a two-dimensional scatter plot constructed using the first and second principal components as coordinate axes (
Figure 1).
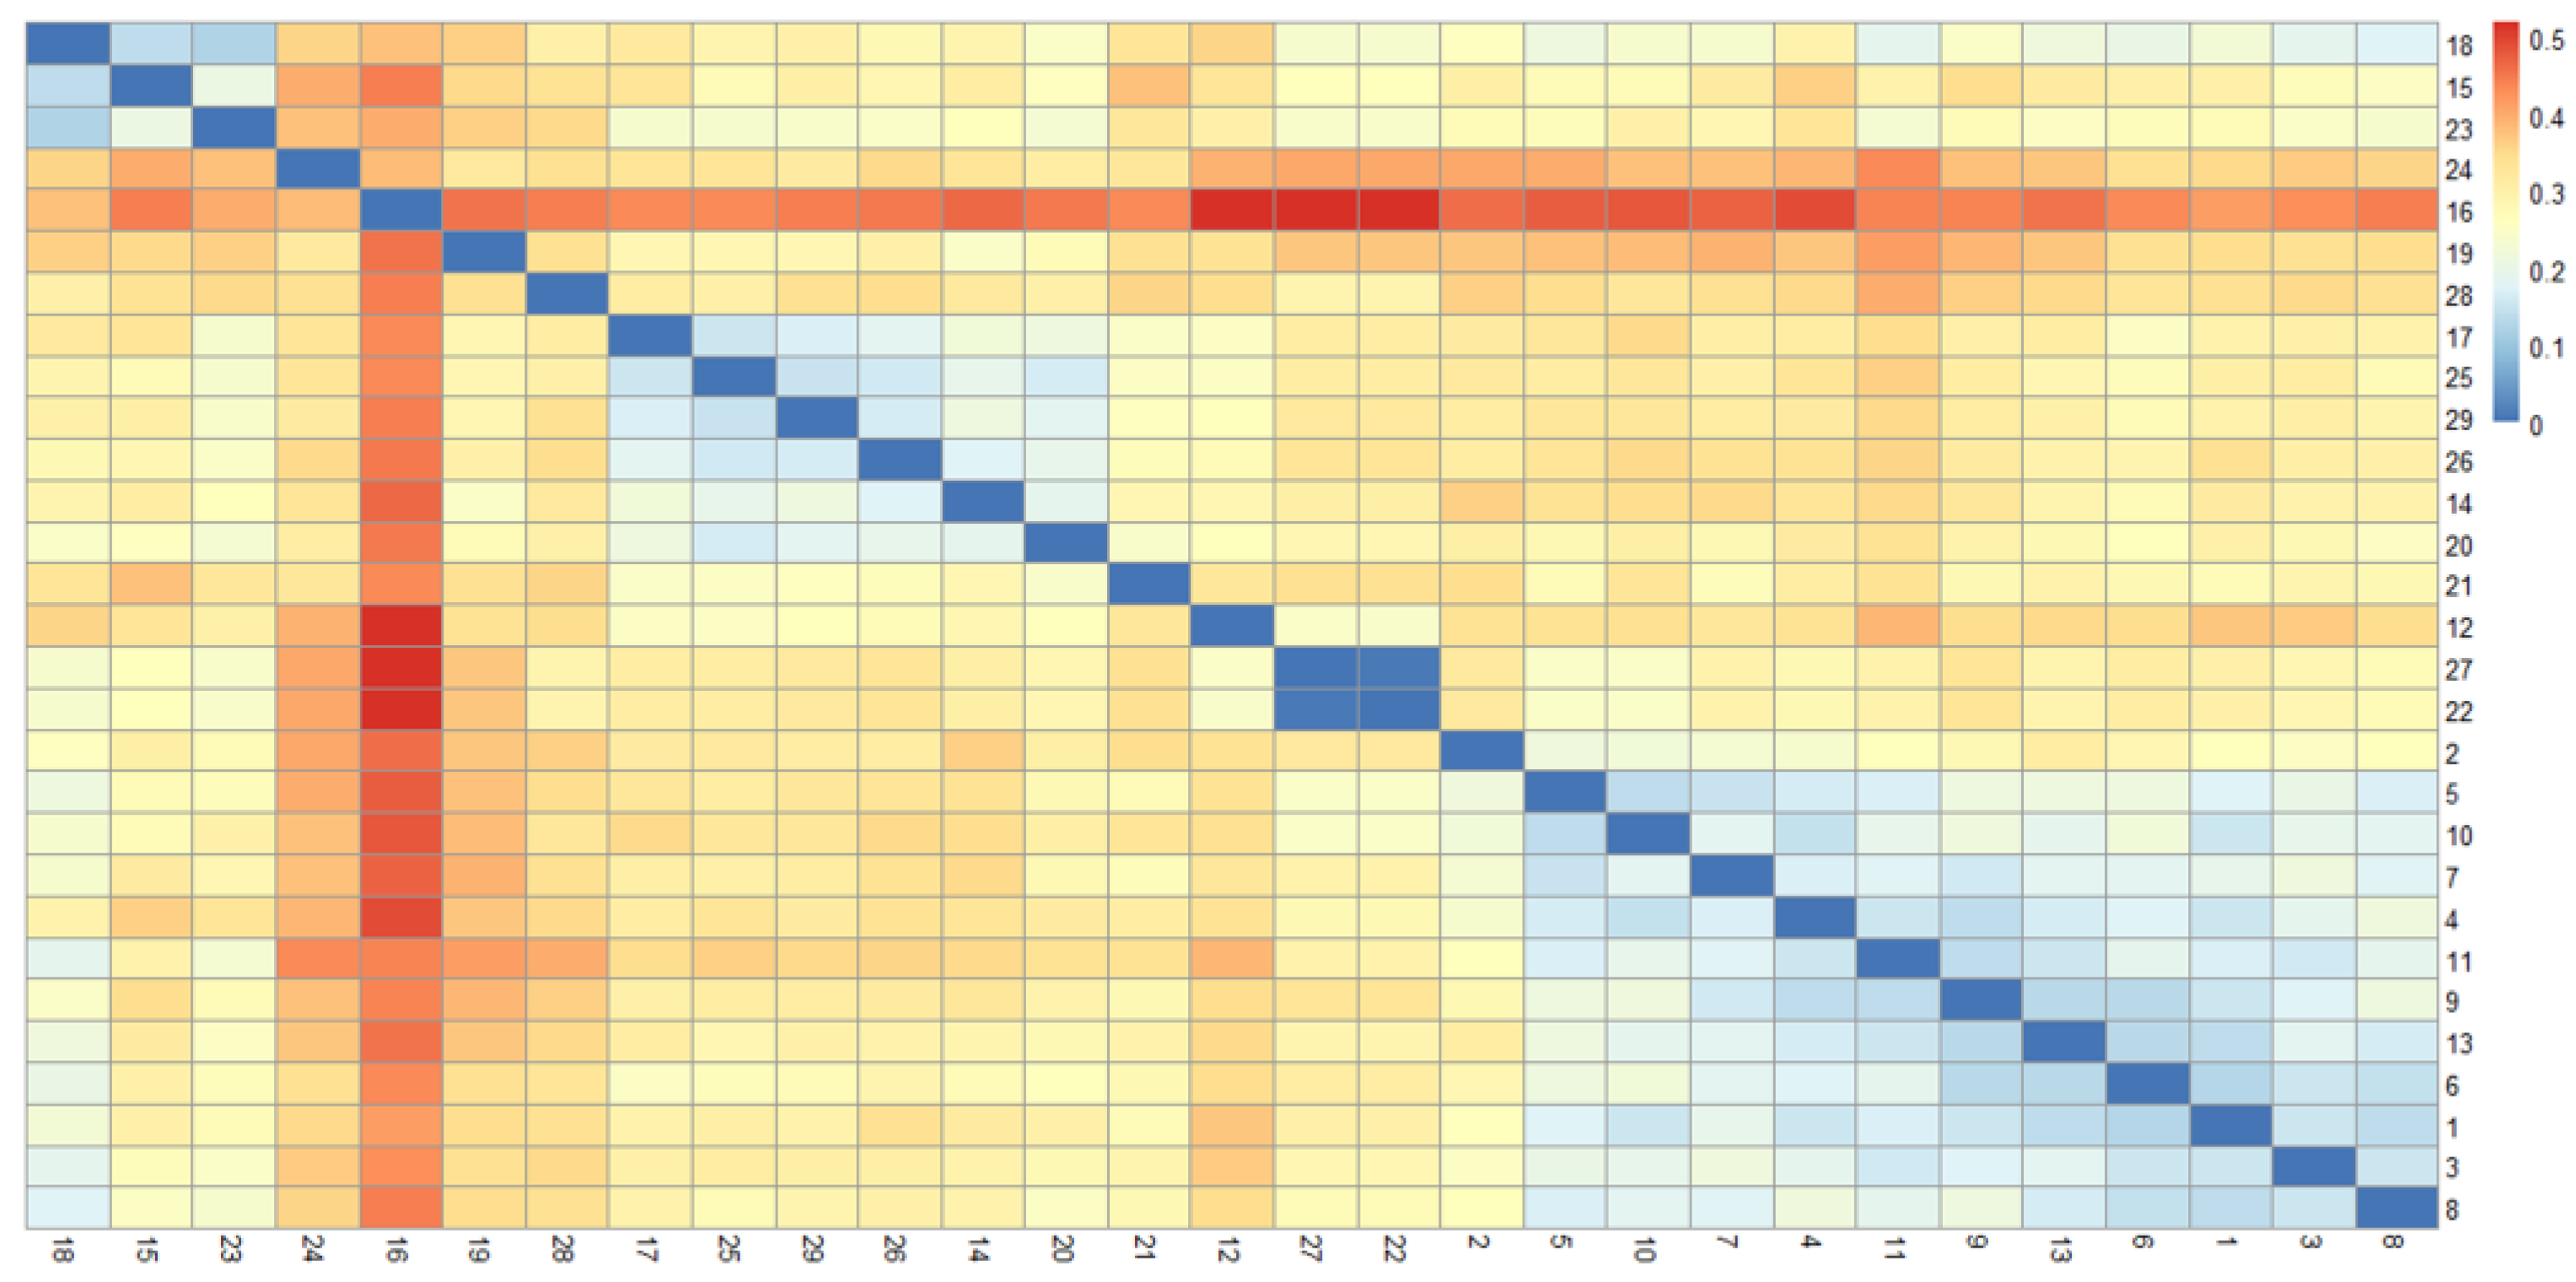
As shown in
Figure 2 and
Figure 3, the 29 rice accessions could be classified into three major groups: Group I comprised 26 accessions, Group II contained a single accession (Line 1), and Group III included two accessions (Line 3 and LD17029).
Group I was further subdivided into two distinct subgroups: Subgroup 1 consisted of 17 accessions (Line 15, Line 16, Line 22, Beilu 128, Longjing 1755, Longjing 31, Longdao 18, Longdao 124, Longdao 185, Jijing 528, Longdao 143, Longdao 132, Longken 2021, Longjing 1656, Qijing 10, Longdao 21, and Suijing 18), while Subgroup 2 encompassed 9 accessions (Line 2, Line 4, Line 5, Line 6, Line 7, Line 9, Line 10, Line 11, and Line 13).
3.2. Effects of Different Fertilization Treatments on Yield
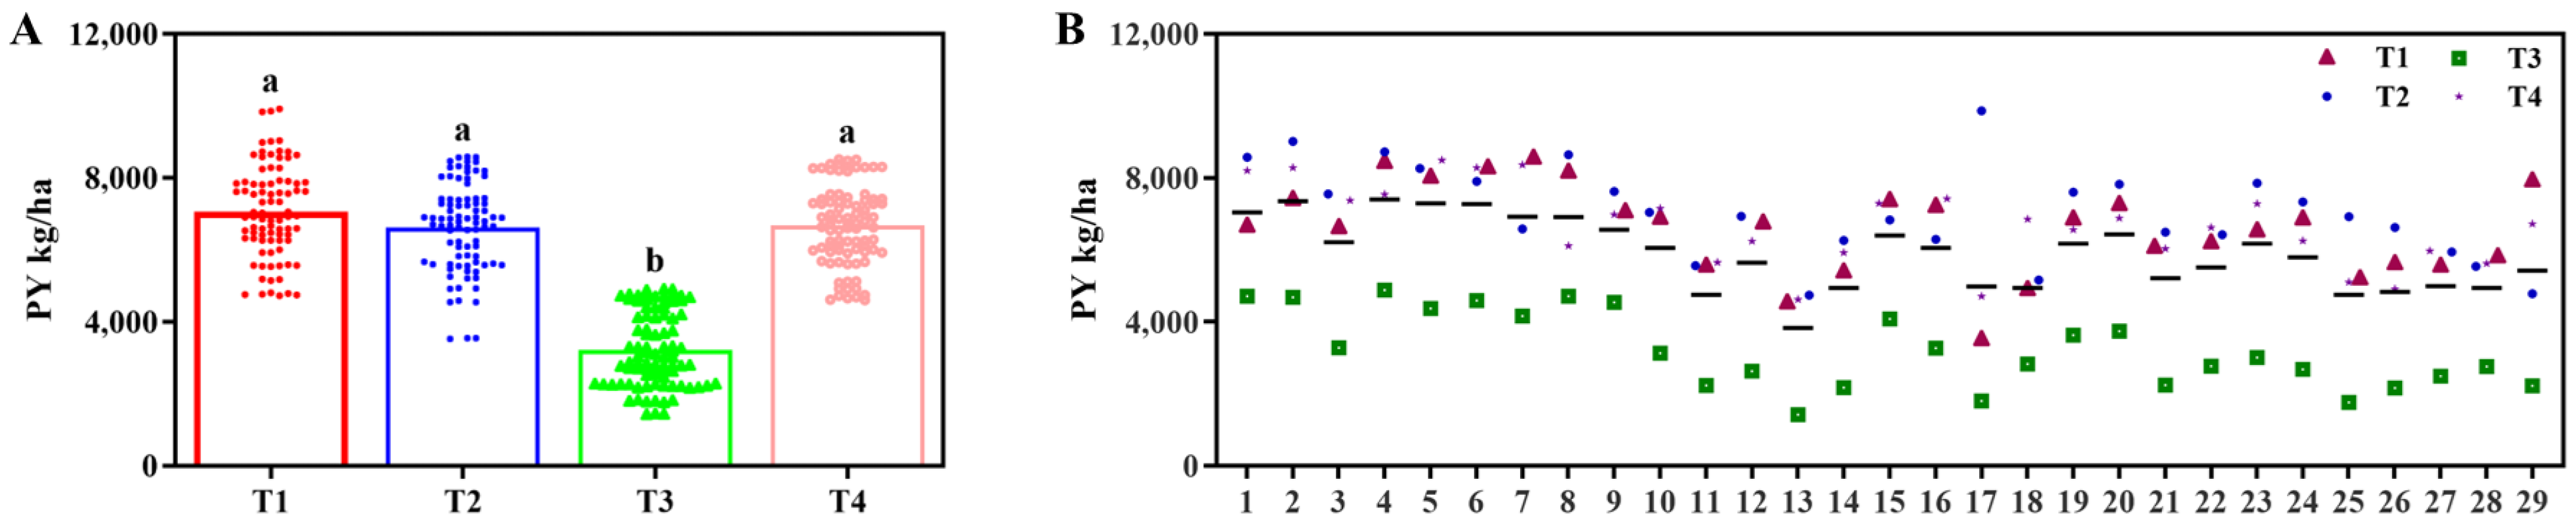
In the 2022 trial, yield differences among the four fertilizer treatments reached significant levels (
p < 0.05,
Table 2). Treatment 1 exhibited the highest yield, significantly surpassing other treatments, followed by Treatment 4, while Treatment 3 recorded the lowest yield (
Figure 4A). The five highest-yielding accessions were Line 4, Line 2, Line 5, Line 6, and Line 1, with significant yield differences occurring among these five samples (
p < 0.05), all of which significantly outperformed the remaining accessions. Longdao 17029 demonstrated significantly higher yields relative to Longdao 18 and Longdao 21. Although Longdao 18 yielded more than Longdao 21, this difference was not statistically significant (
p < 0.05,
Figure 4B).
In the 2023 trial, yield trends across treatments remained consistent with those observed in 2022. However, no significant yield differences were detected among Treatments 1, 2, and 4 (
p < 0.05), whereas Treatment 3 yielded significantly less than the others (
Figure 5A). The yield hierarchy of Longdao 17029, Longdao 18, and Longdao 21 mirrored the 2022 results: Longdao 17029 maintained the highest yield, significantly exceeding both counterparts, followed by Longdao 18, which outperformed Longdao 21 at a statistically significant level (
p < 0.05,
Figure 5B).
3.3. Effects of Different Fertilization Treatments on Quality
In the 2022 trial, taste values differed significantly among treatments: Treatment 2 exhibited the highest score, 82.6, followed by Treatment 1 (82.1) and Treatment 4 (81.9), and Treatment 3 returned the lowest value (79.3) (
Figure 6A). The top five samples for eating quality were Longdao 17029, Line 2, Line 4, Line 5, and Line 6. Longdao 17029 achieved the highest taste score, 85.7, significantly surpassing the other samples (
p < 0.05). Line 13 recorded the lowest taste score, 73.8, which was significantly inferior to all other accessions (
p < 0.05,
Figure 6B).
Longdao 124, an aromatic rice cultivar developed by our team, showed a taste value of 82.3. In contrast, Longdao 115 (a national standard first-grade rice cultivar) scored 81.3, significantly lower than Longdao 124 (
p < 0.05). Longdao 143, a newly certified premium long-grain rice variety, demonstrated a taste value of 82.1, while Longdao 132 (a high-yielding cultivar) scored 81.4. No significant differences were detected among Longdao 124, Longdao 115, Longdao 143, and Longdao 132 (
p < 0.05,
Figure 6B).
As for traits in 2022, Treatment 2 had the lowest protein content, significantly lower than those of the other treatments (
p < 0.05). Treatment 1 showed the highest amylose content (19.2%), significantly exceeding the others (
p < 0.05). Treatment 3 exhibited the lowest amylose content. No significant differences in brown rice rate were observed among Treatments 1, 2, and 4 (
p < 0.05). Treatment 3 achieved the highest milled rice rate, significantly surpassing the others (
p < 0.05), followed by Treatment 2 (
Figure 7).
In the 2023 trial, Treatment 1 attained the highest taste value (83.7 points), exceeding Treatment 2 by 0.4 points and Treatments 3/4 by 0.6 points, though no significant inter-treatment differences were detected (
p < 0.05). Longdao 17029 maintained superior eating quality (85 points), significantly outperforming Longdao 18 (83) and Longdao 21 (82) (
p < 0.05), while no significant difference existed between Longdao 18 and Longdao 21 (
Figure 8).
3.4. Effects of Different Fertilization Treatments on Agronomic Traits
As shown in
Figure 9, Treatment 4 exhibited the highest final tiller number (22.5), which was significantly greater than those of the other treatments (
p < 0.05). In contrast, Treatment 3 recorded the lowest tiller number (11.7), which was significantly inferior to all other treatments. Longdao 18 and Longdao 17029 demonstrated significantly higher final tiller numbers (19.0 and 19.3, respectively) compared to Longdao 21 (15.9), explaining their superior yield performance.
Figure 10 illustrates the differential dry matter accumulation patterns: Fertilizer Treatments 1 and 2 achieved the maximum shoot dry weights at the tillering and heading stages, respectively. Among cultivars, Longdao 18 and Longdao 21 accumulated the highest shoot dry matter at the tillering and heading stages, correspondingly. No significant differences were observed among Treatments 1, 2, and 4, or between cultivars, during the grain-filling stage (
p < 0.05). Root dry weight analysis revealed the following: Treatment 1 showed the greatest root biomass at the peak tillering stage. Treatments 1, 2, and 4 displayed comparable root dry weights during the heading and grain-filling stages. Longdao 18 consistently maintained the highest root biomass across all growth phases, with significant advantages recorded over Longdao 21 and Longdao 17029 at both the peak tillering and the grain-filling stages (
p < 0.05).
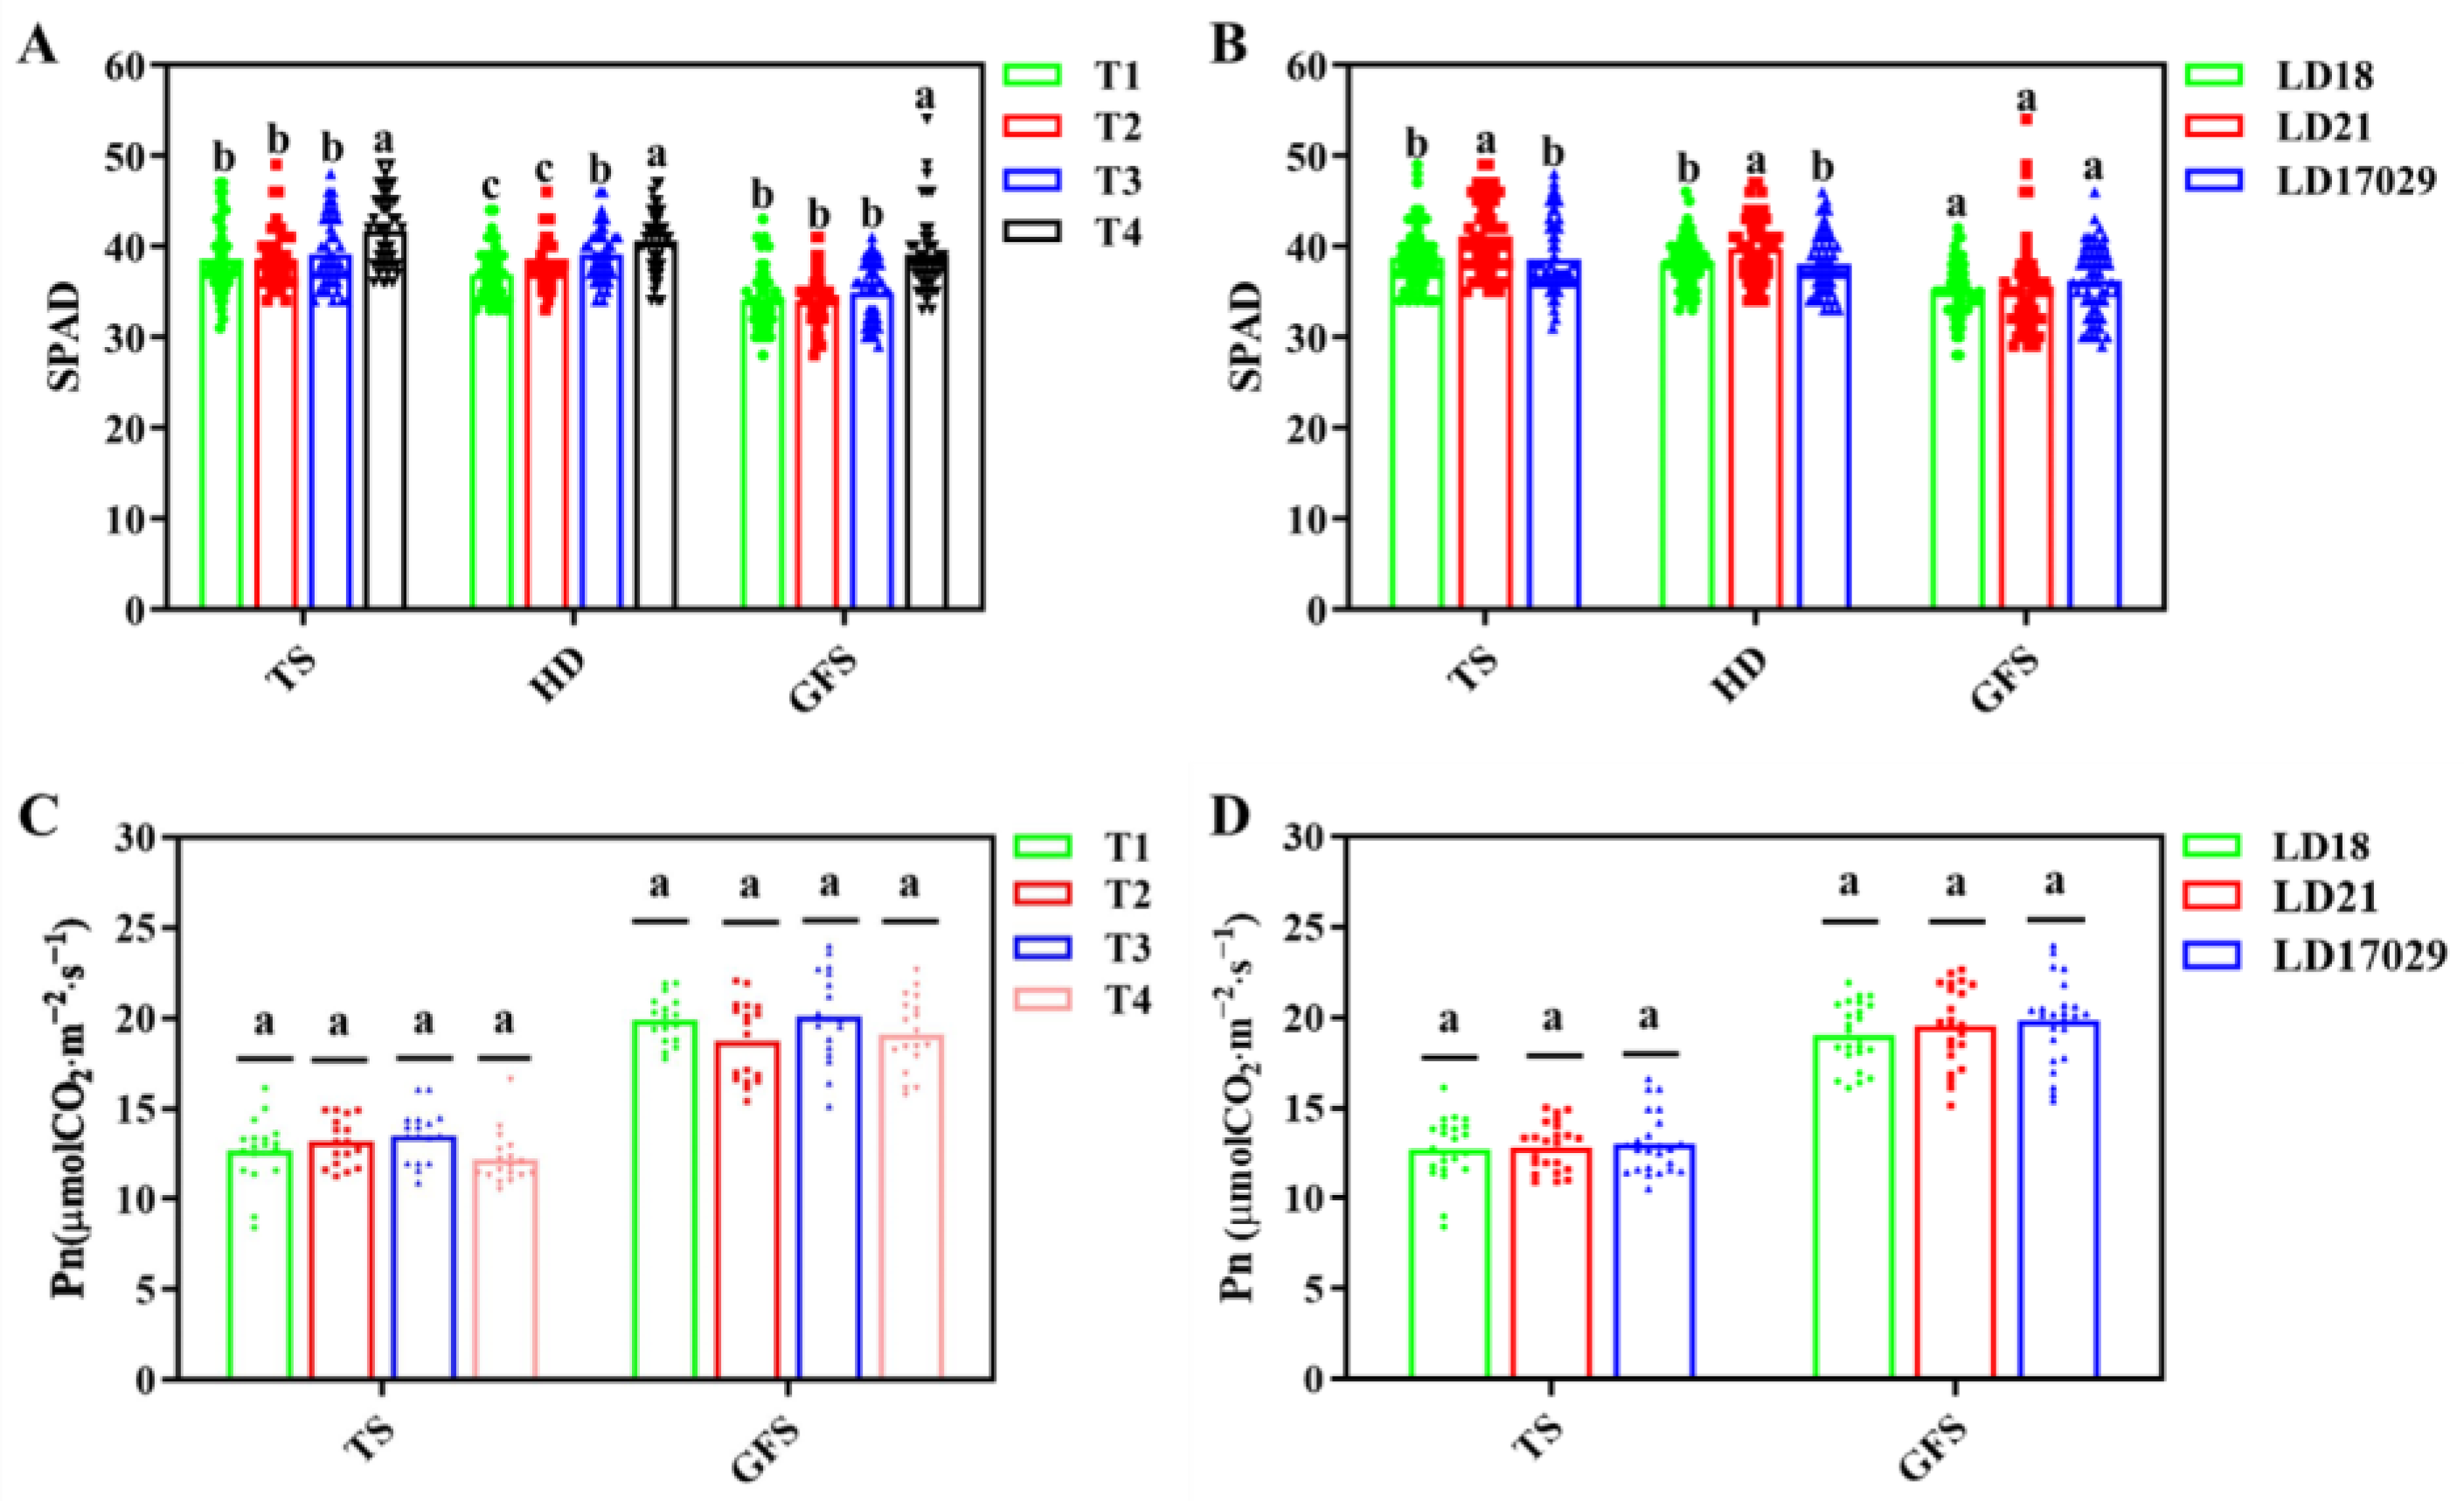
3.5. Effects of Different Fertilization Treatments on Photosynthesis and SPAD Values
Longdao 17029 showed the highest photosynthetic rates during the tillering and grain-filling stages, though no significant differences were observed compared to Longdao 18 and Longdao 21 (p < 0.05). Photosynthetic rates across fertilizer treatments also exhibited no significant variation at the peak tillering and grain-filling stages. Treatment 4 consistently displayed significantly higher leaf color indices than other fertilizer treatments across all developmental phases (the tillering, heading, and grain-filling stages) (p < 0.05). Longdao 21 demonstrated significantly elevated leaf color indices, compared to the other two cultivars, at both the peak tillering and the heading stages. However, during the grain-filling stage, no significant differences in leaf color indices were detected among the three cultivars (p < 0.05).
4. Discussions
Our research group has developed novel germplasms through hybridization between upland rice and local Heilongjiang samples, demonstrating promising palatability and yield potential [
18,
19]. In this study, Line 4 (derived from upland rice) exhibited the highest yield, while Longdao 17029 achieved the highest taste score. Notably, these samples exhibit substantial genetic divergence from existing registered premium varieties (
Figure 3), positioning them as valuable resources for broadening genetic diversity. For instance, the high-yielding, long-grain, and lodging-resistant rice cultivar Zhongke Fa 5 was developed by utilizing the cold-adapted foundational parent material Kongyu 131 (suited to the cold regions of Heilongjiang Province), while incorporating elite genes from southern long-grain japonica rice and Jijing 88. This breeding strategy effectively broadened the genetic base and generated a novel rice variety adapted to frigid ecological conditions [
12].
Starch and protein constitute the primary components of milled rice, directly determining palatability. Numerous studies confirm a significant negative correlation between protein content and taste value [
11]. Tanno Hisashi’s research further indicates that lower protein and amylose contents enhance palatability in Hokkaido rice [
20]. In our study, protein content ranged from 6.8% to 9.0%, with Line 13 displaying the highest protein content (9.0%) and significantly inferior taste value, consistent with previous findings. Longdao 132, with the lowest protein content, serves as a potential donor for protein content reduction. Meanwhile, Longdao 17029, combining premium taste with robust yield potential, represents a promising candidate for palatability improvement without yield penalty in cold regions. Breeders can utilize Longdao 17029 as a genetic resource to broaden the genetic base. Using locally adapted elite cultivars from Heilongjiang Province as donor parents, improvements can be achieved through hybridization, backcrossing, or multiple crosses. This approach should be combined with progeny genotyping, to identify favorable genes and alleles, along with phenotypic evaluation (e.g., yield, grain quality, and disease resistance assessment). The goal is to develop germplasm with enriched genetic background, higher yield, improved quality, and enhanced resistance, thereby achieving the dual objectives of genetic base broadening and agronomic trait improvement, similar to the breeding process of Zhongke 5 [
12].
Fertilization strategies critically influence rice quality and productivity. Studies demonstrate that 70% slow-release nitrogen +30% conventional nitrogen boosts yield by 7.4% while reducing nitrogen input by 32%, though organic substitution exceeding 20% risks yield reduction [
21]. Bio-organic fertilizers can reduce synthetic nitrogen by 30% and fully replace triple superphosphate (TSP) without compromising yield [
22]. Integration of the two-year study results revealed that treatment T1 demonstrated the highest yield. In 2022, its yield was significantly higher than those of the other treatments. In 2023, no significant differences were observed between T1 and treatments T2 and T4, which aligns with previous research findings (
Figure 4A and
Figure 5A). Notably, the application of Longfu Tianxia slow-release fertilizer enhanced SPAD values across all growth stages (
Figure 11A), indicating improved nitrogen utilization efficiency. Future research will focus on further optimizing the fertilization strategy to achieve high yields under a simplified cultivation model.


 ,
, 


