

Phenotyping in Green Lettuce Populations Through Multispectral Imaging

 ,
, 
 , and
, and
Abstract
1. Introduction
2. Materials and Methods
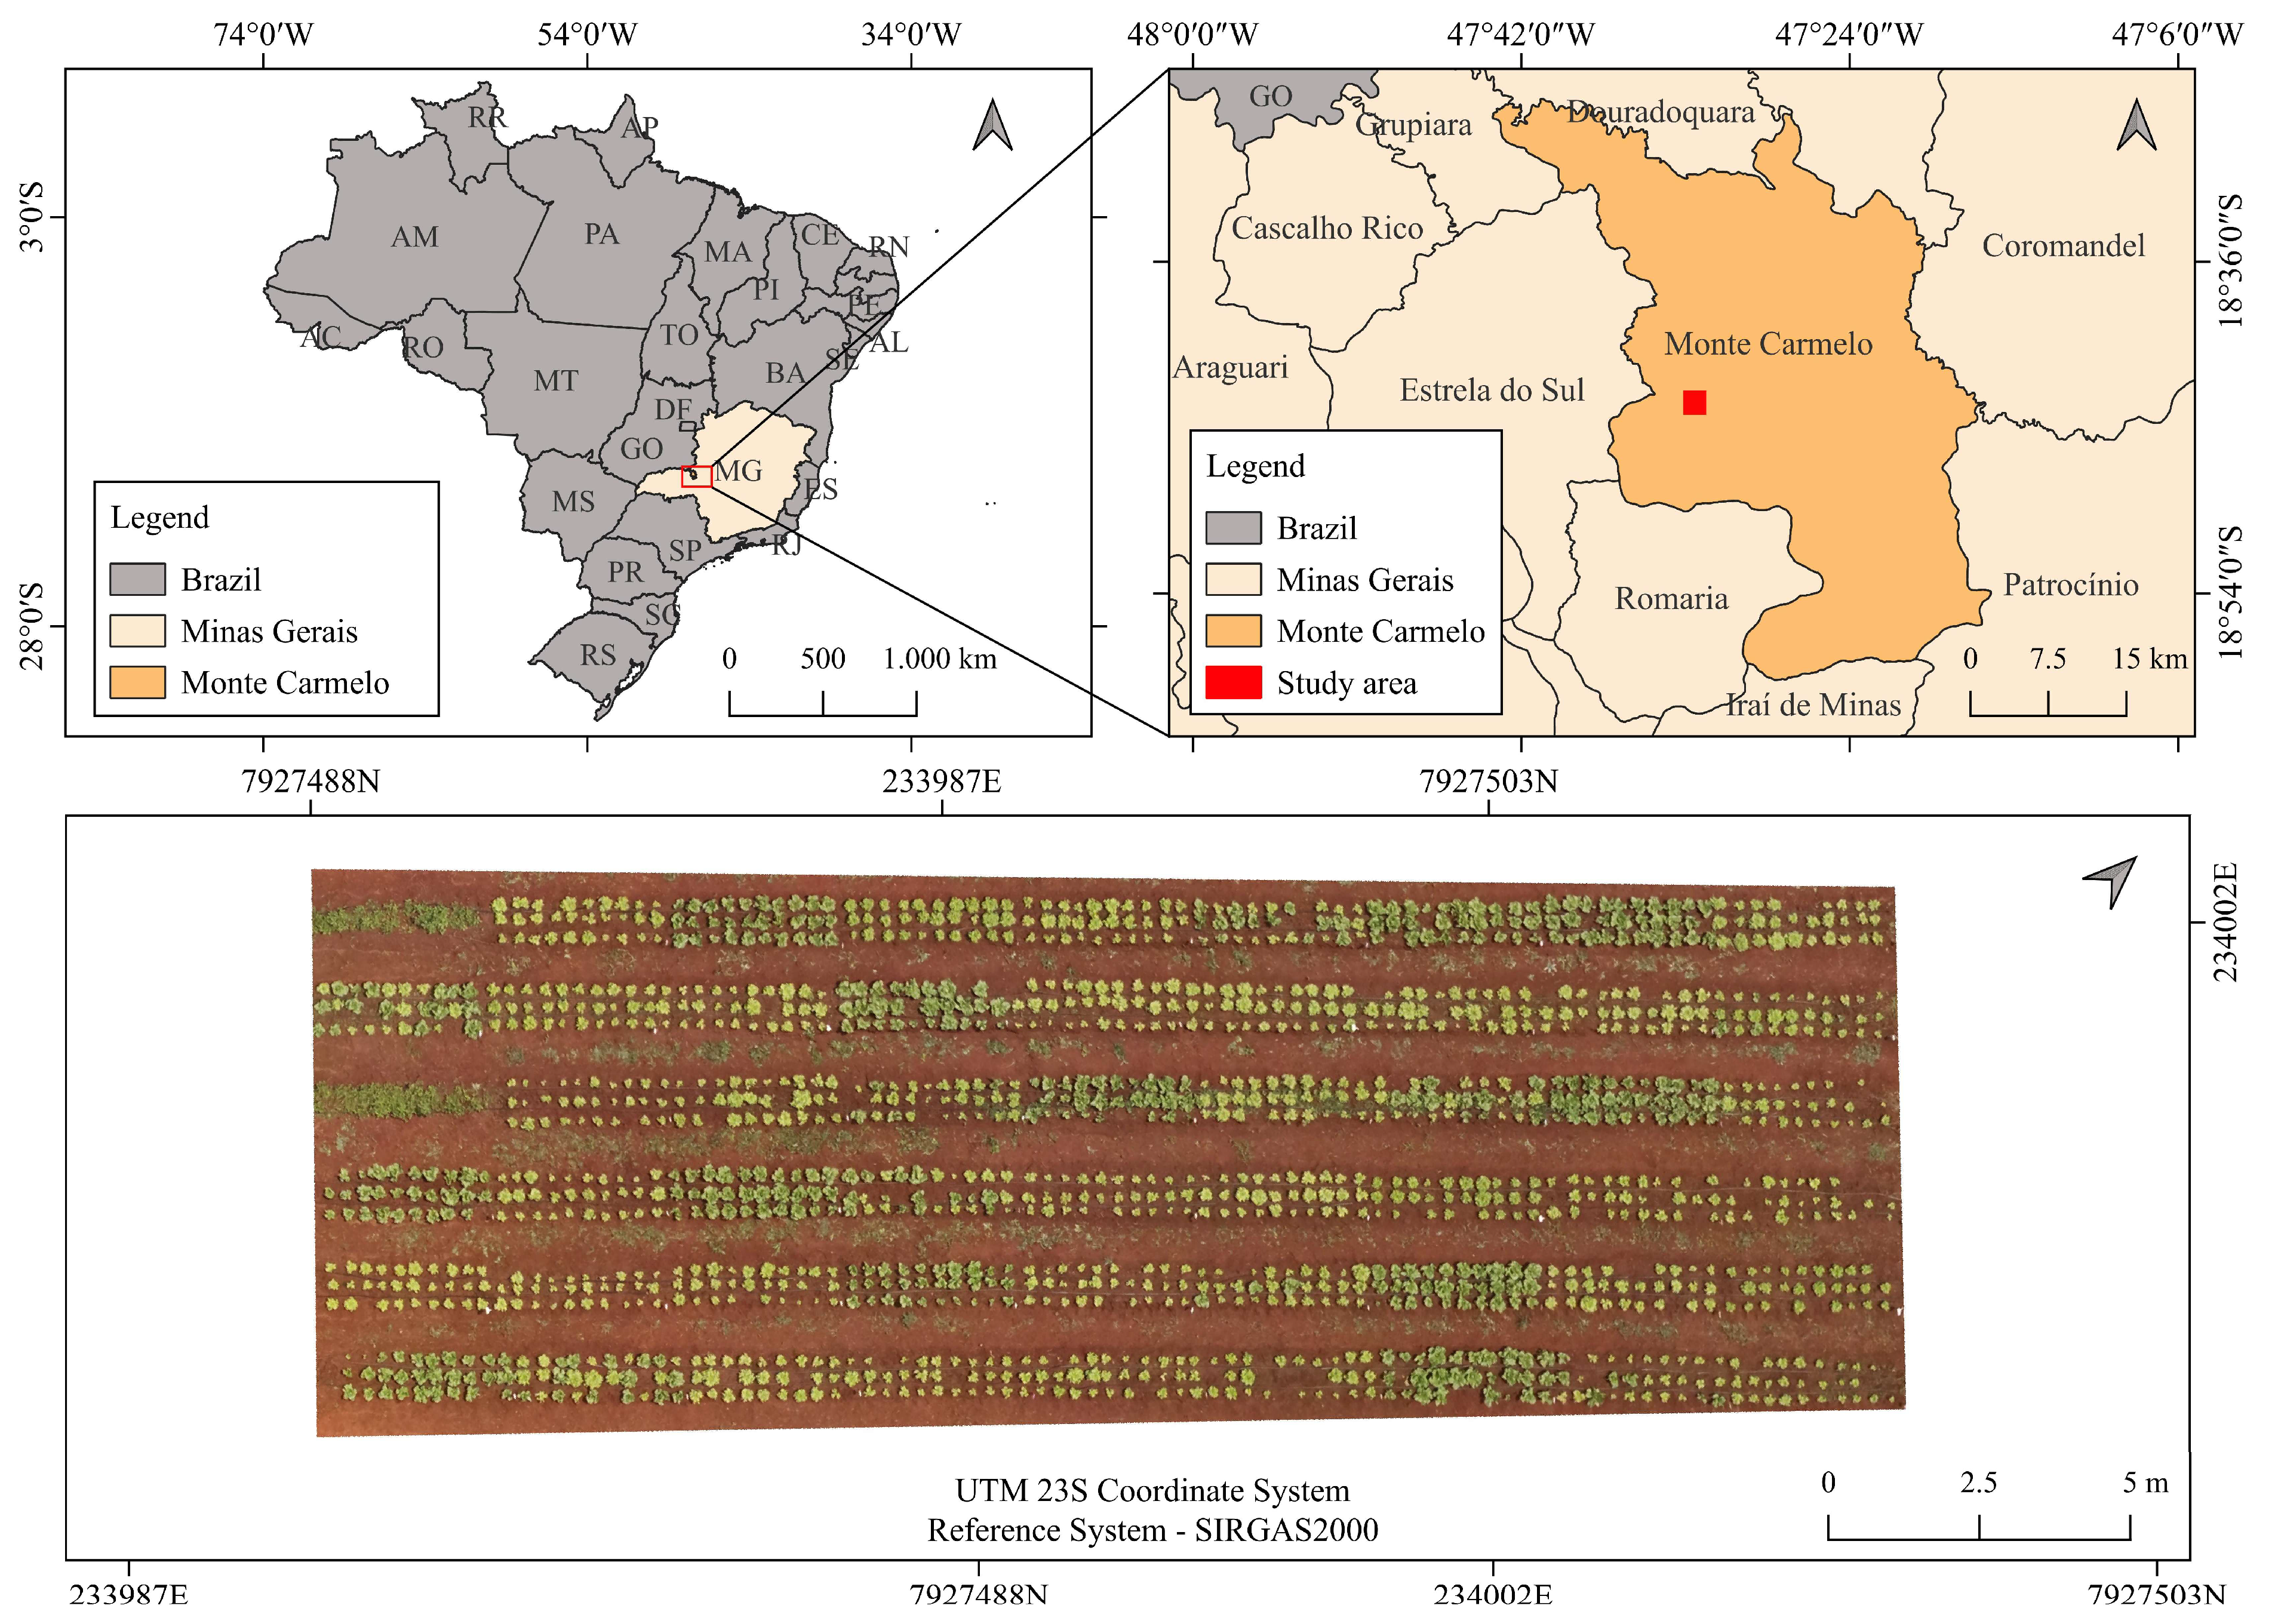
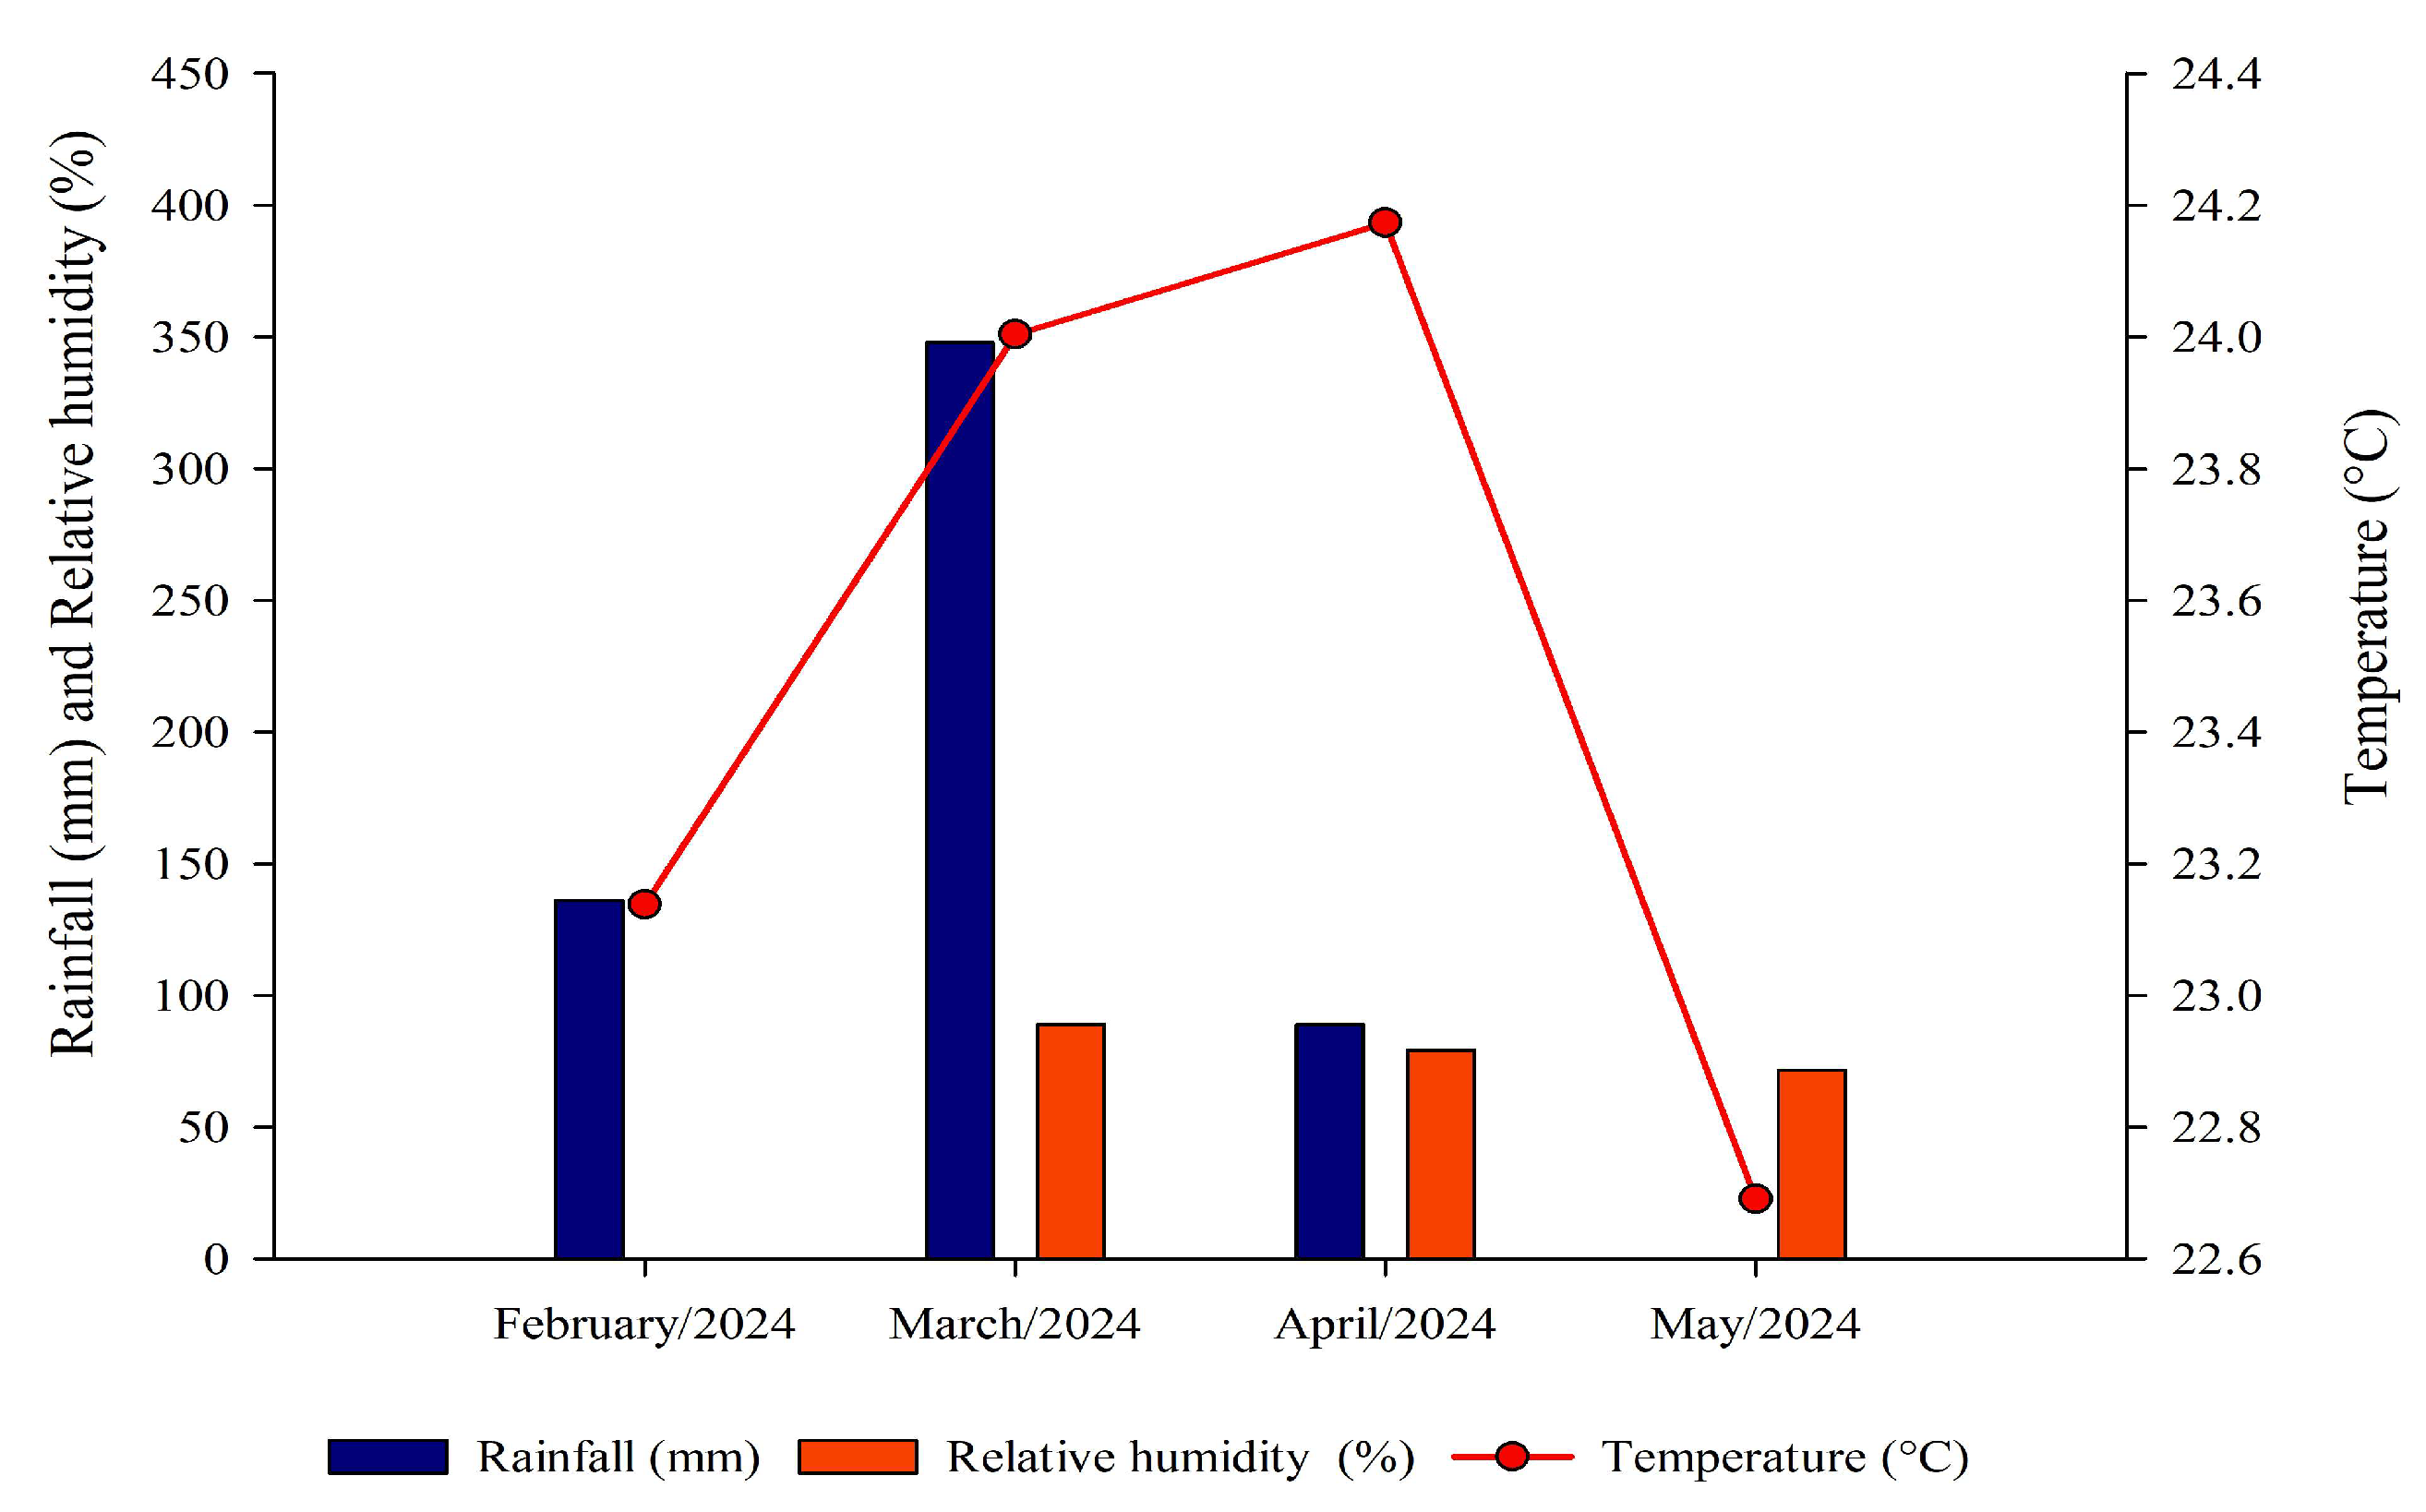
2.1. Characterization of Experimental Area and Treatments
2.2. Morphological and Agronomic Characterization of Lettuce Populations
2.3. Acquisition and Processing of Aerial Images
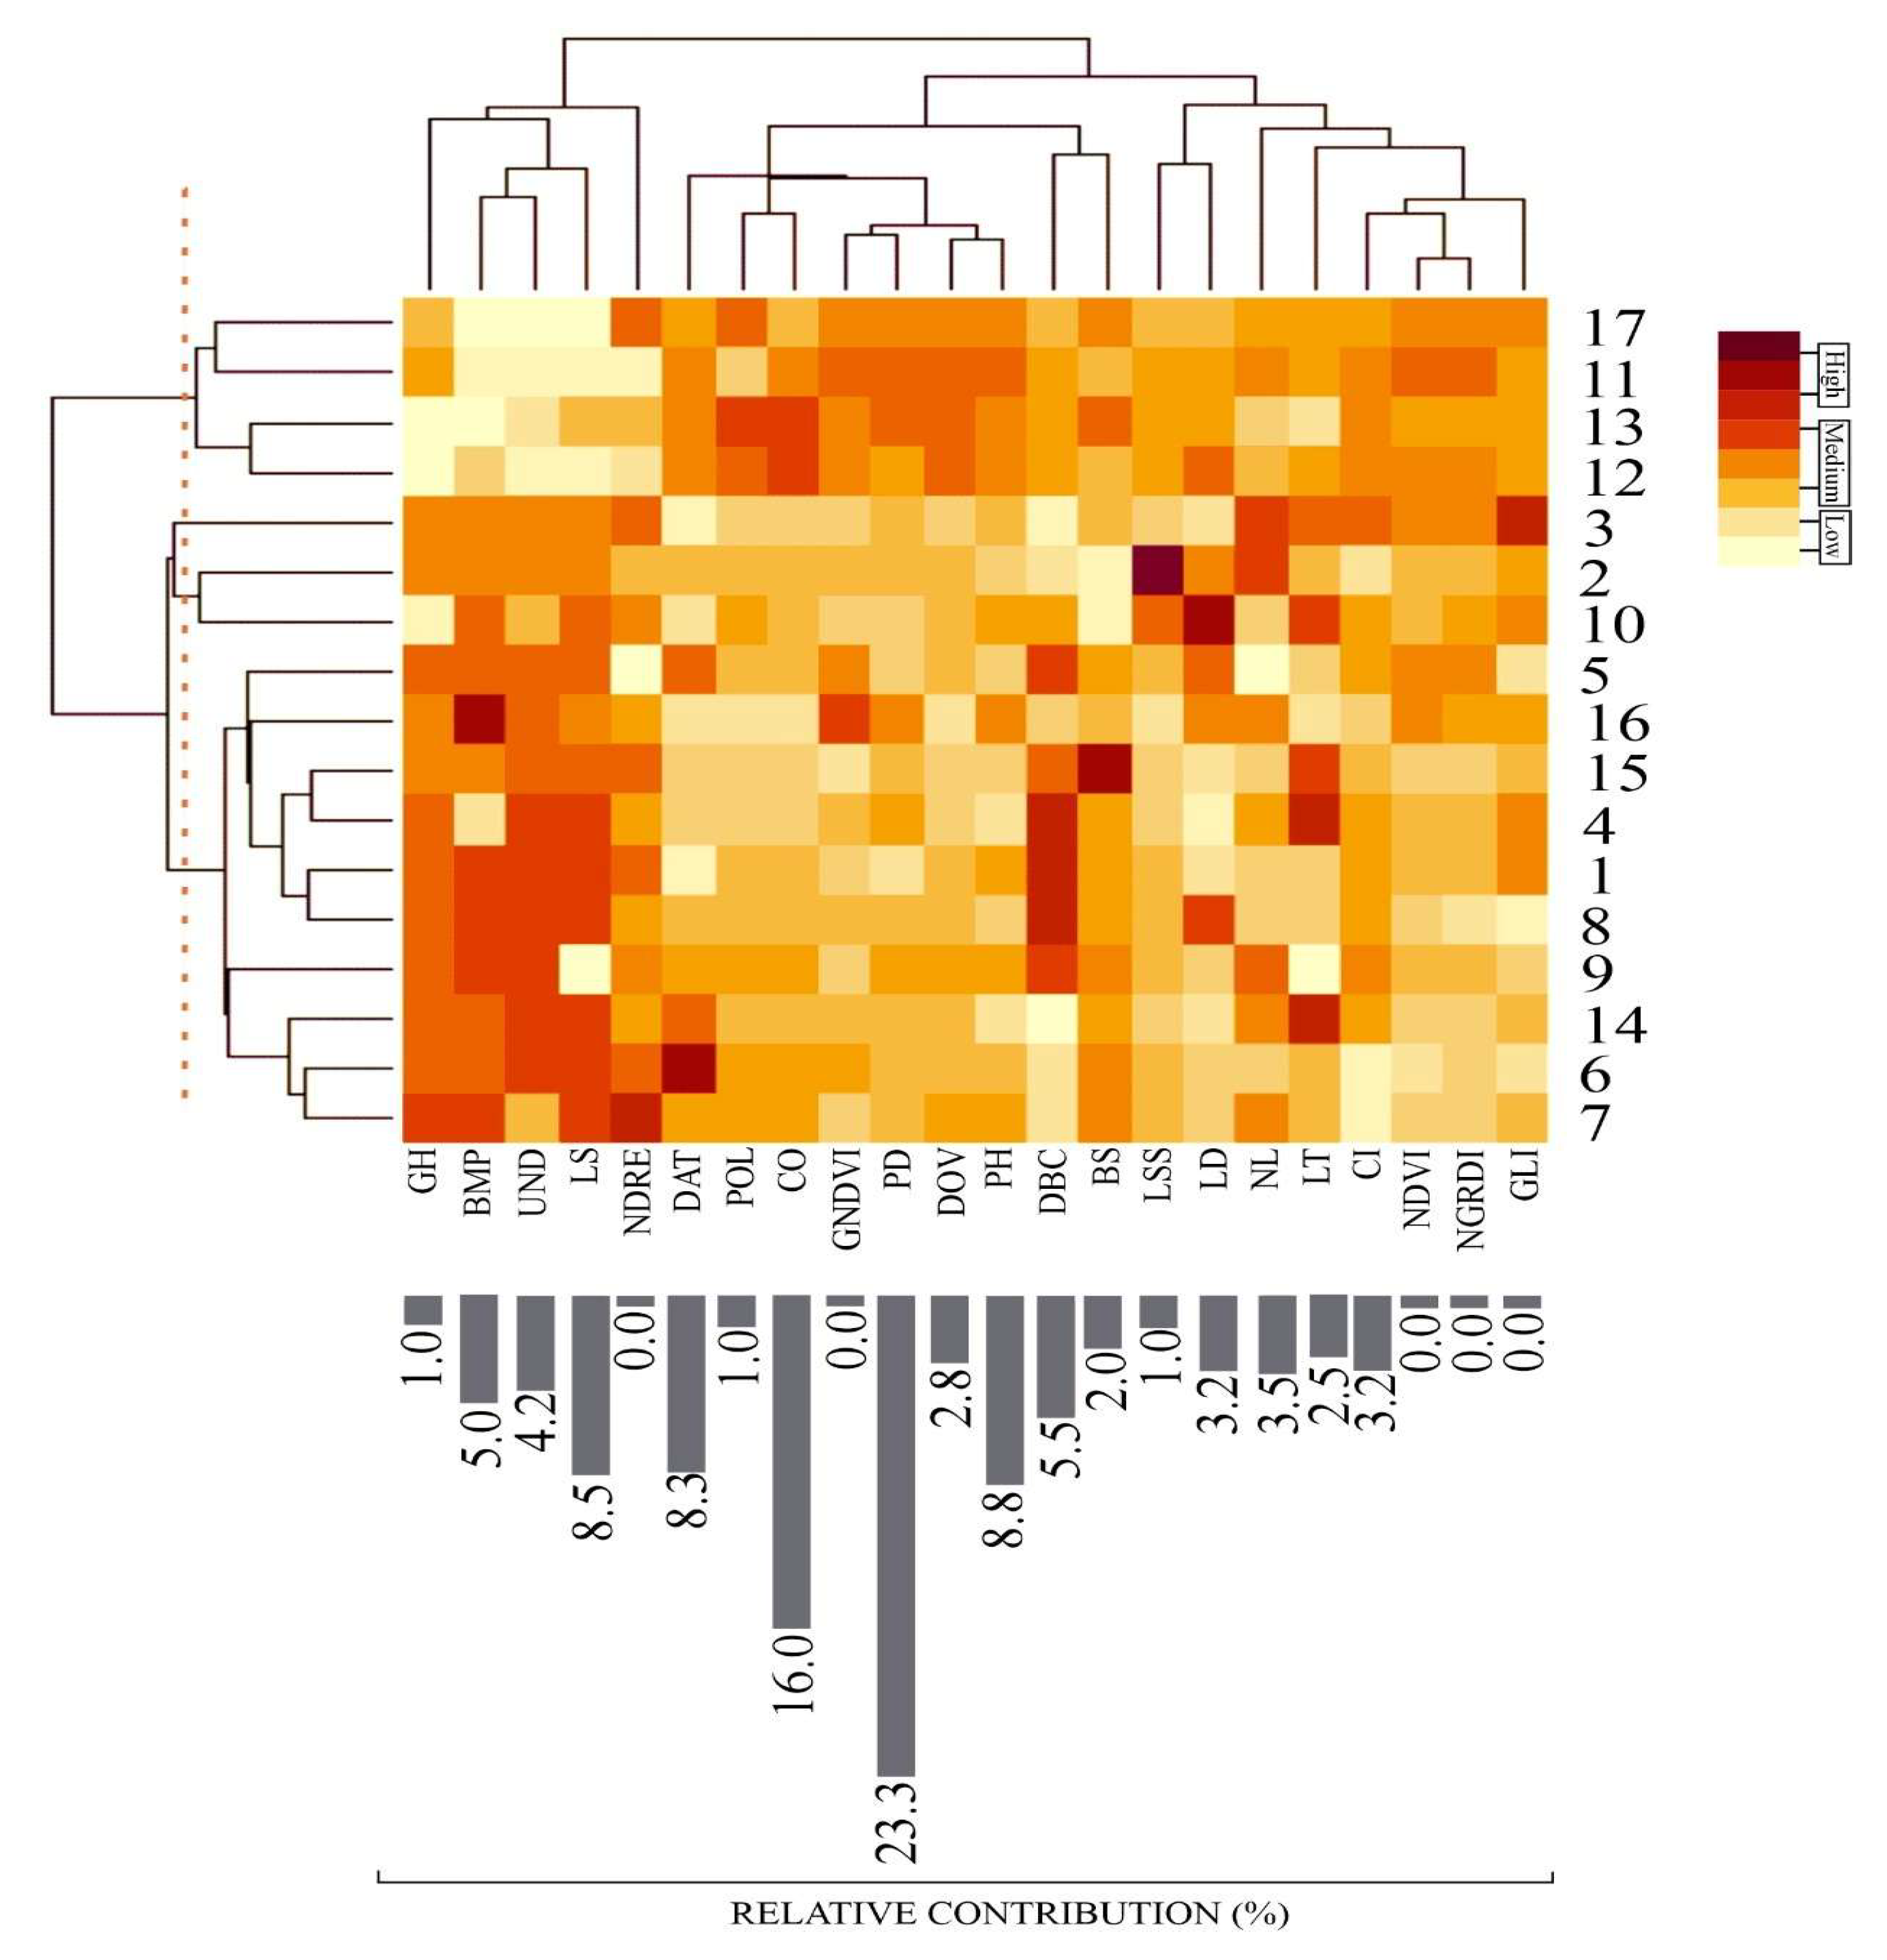
2.4. Statistical Analysis
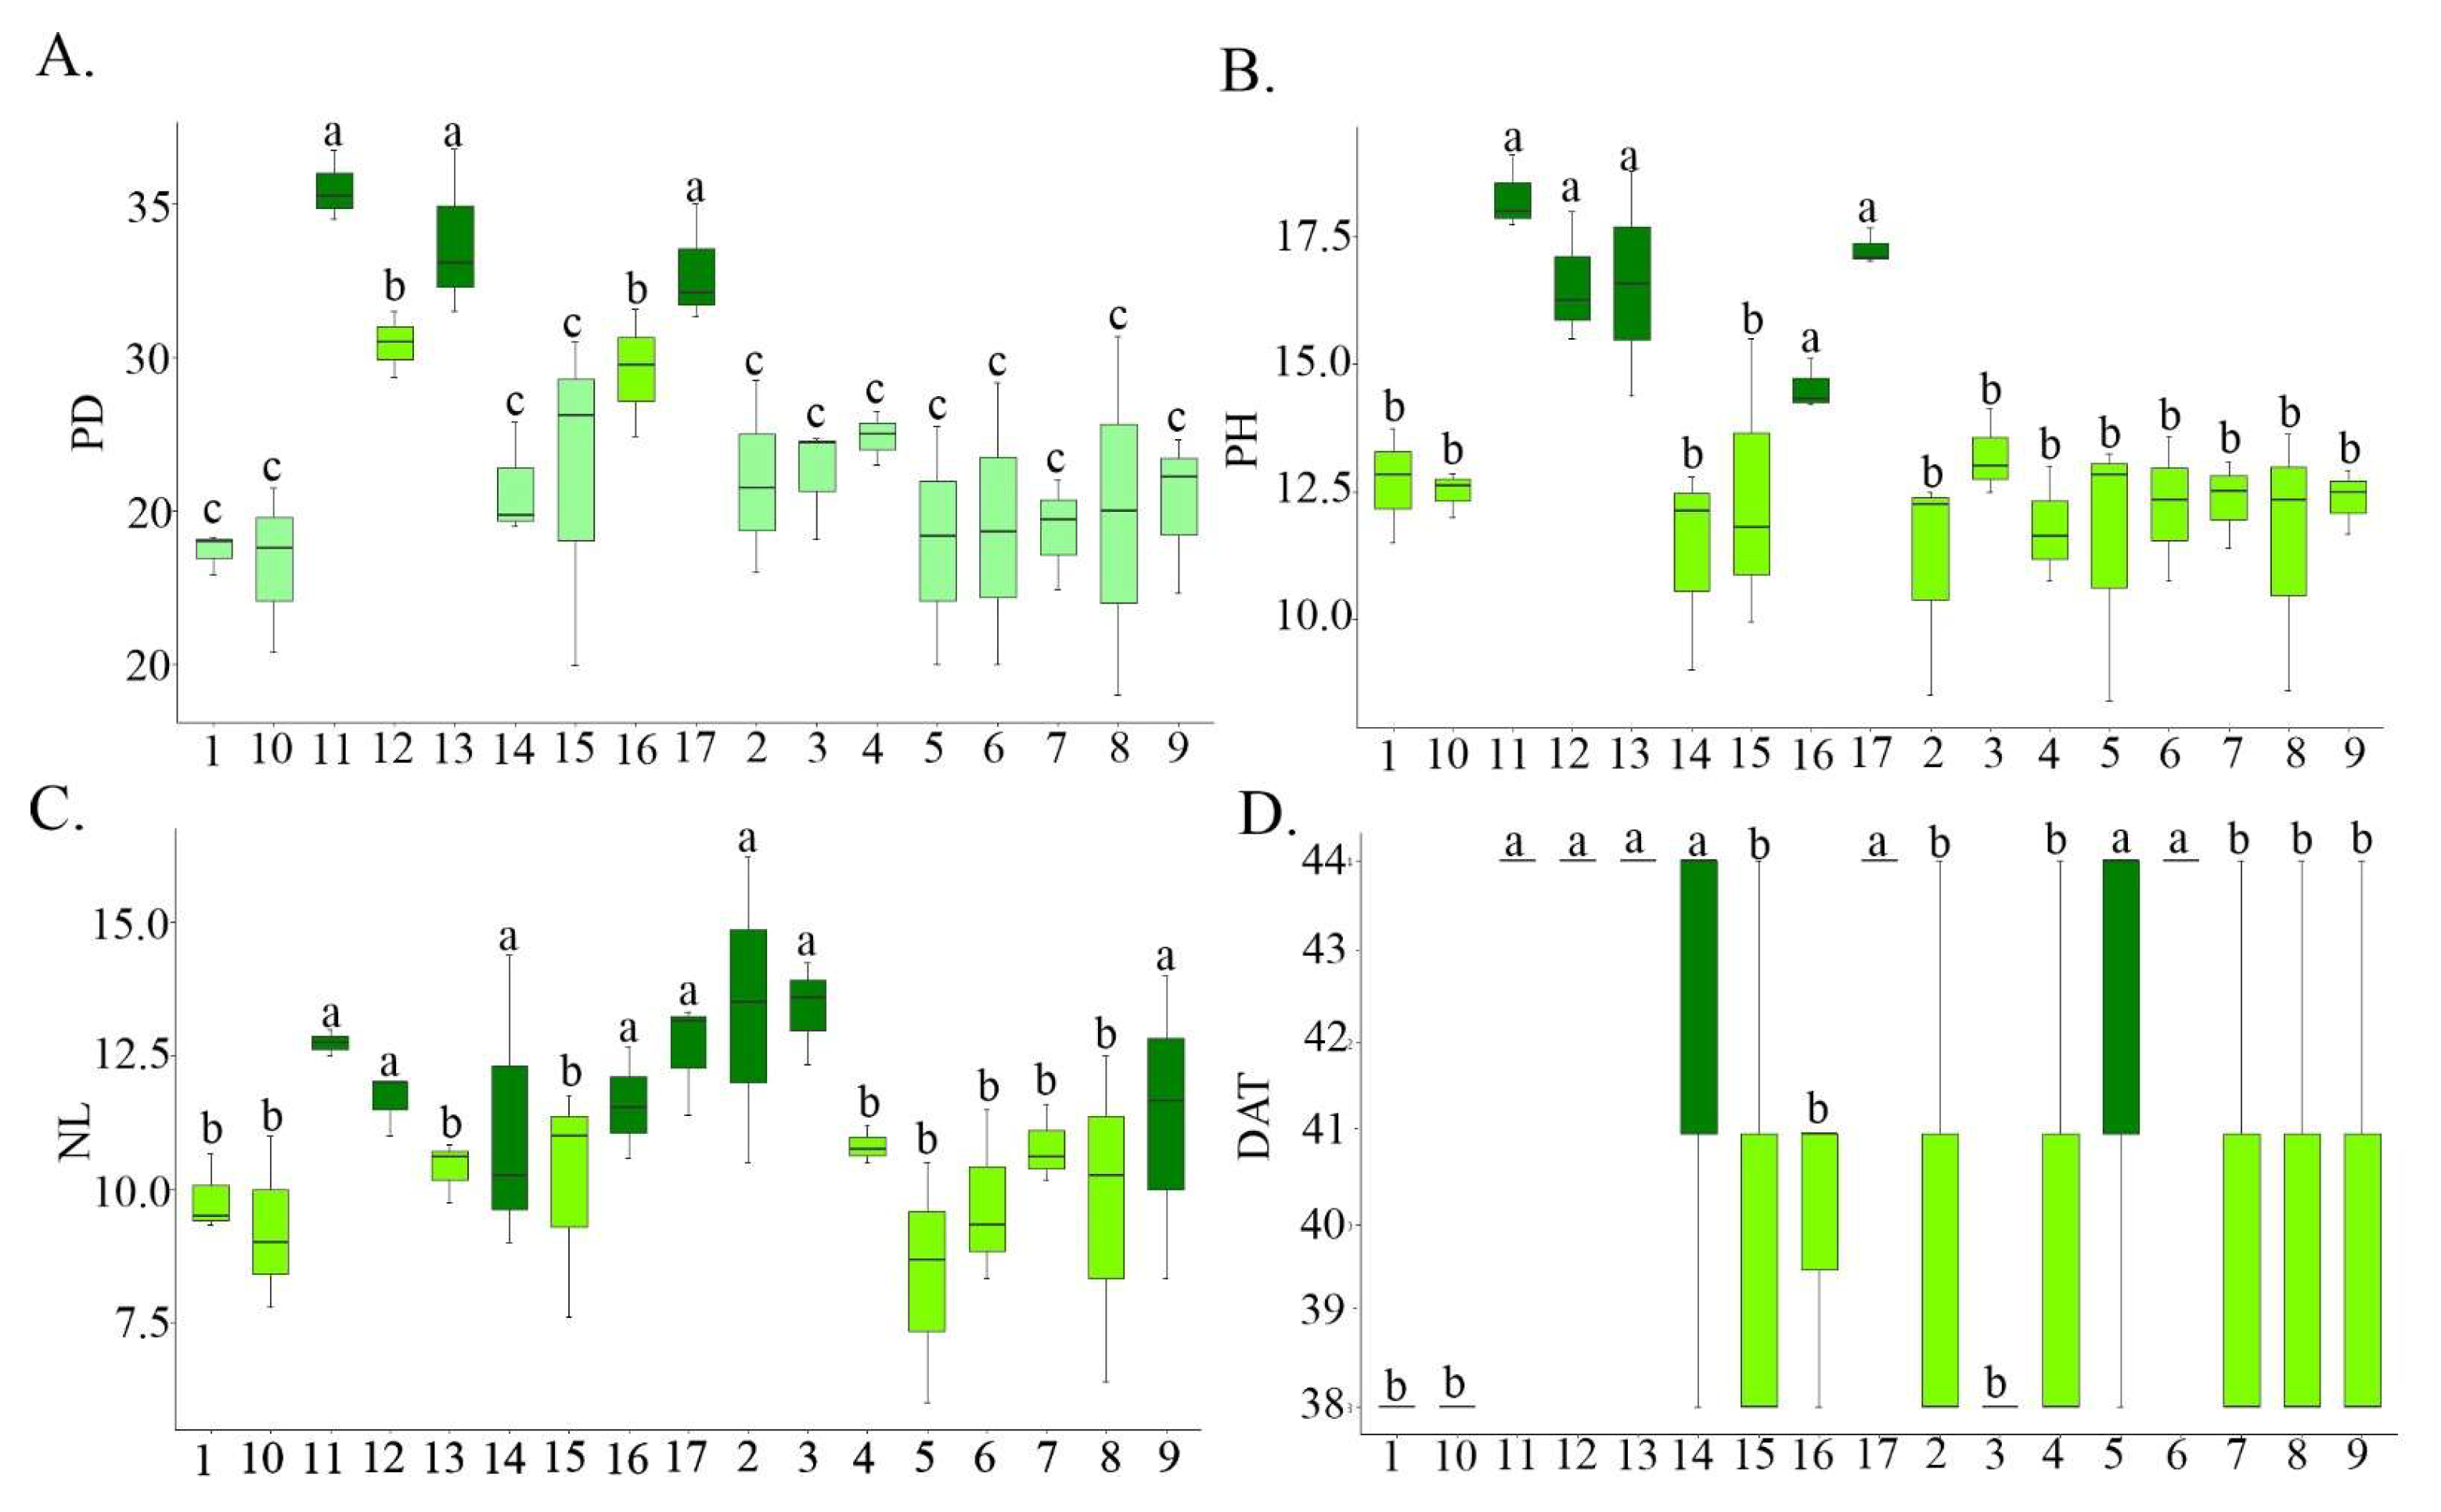
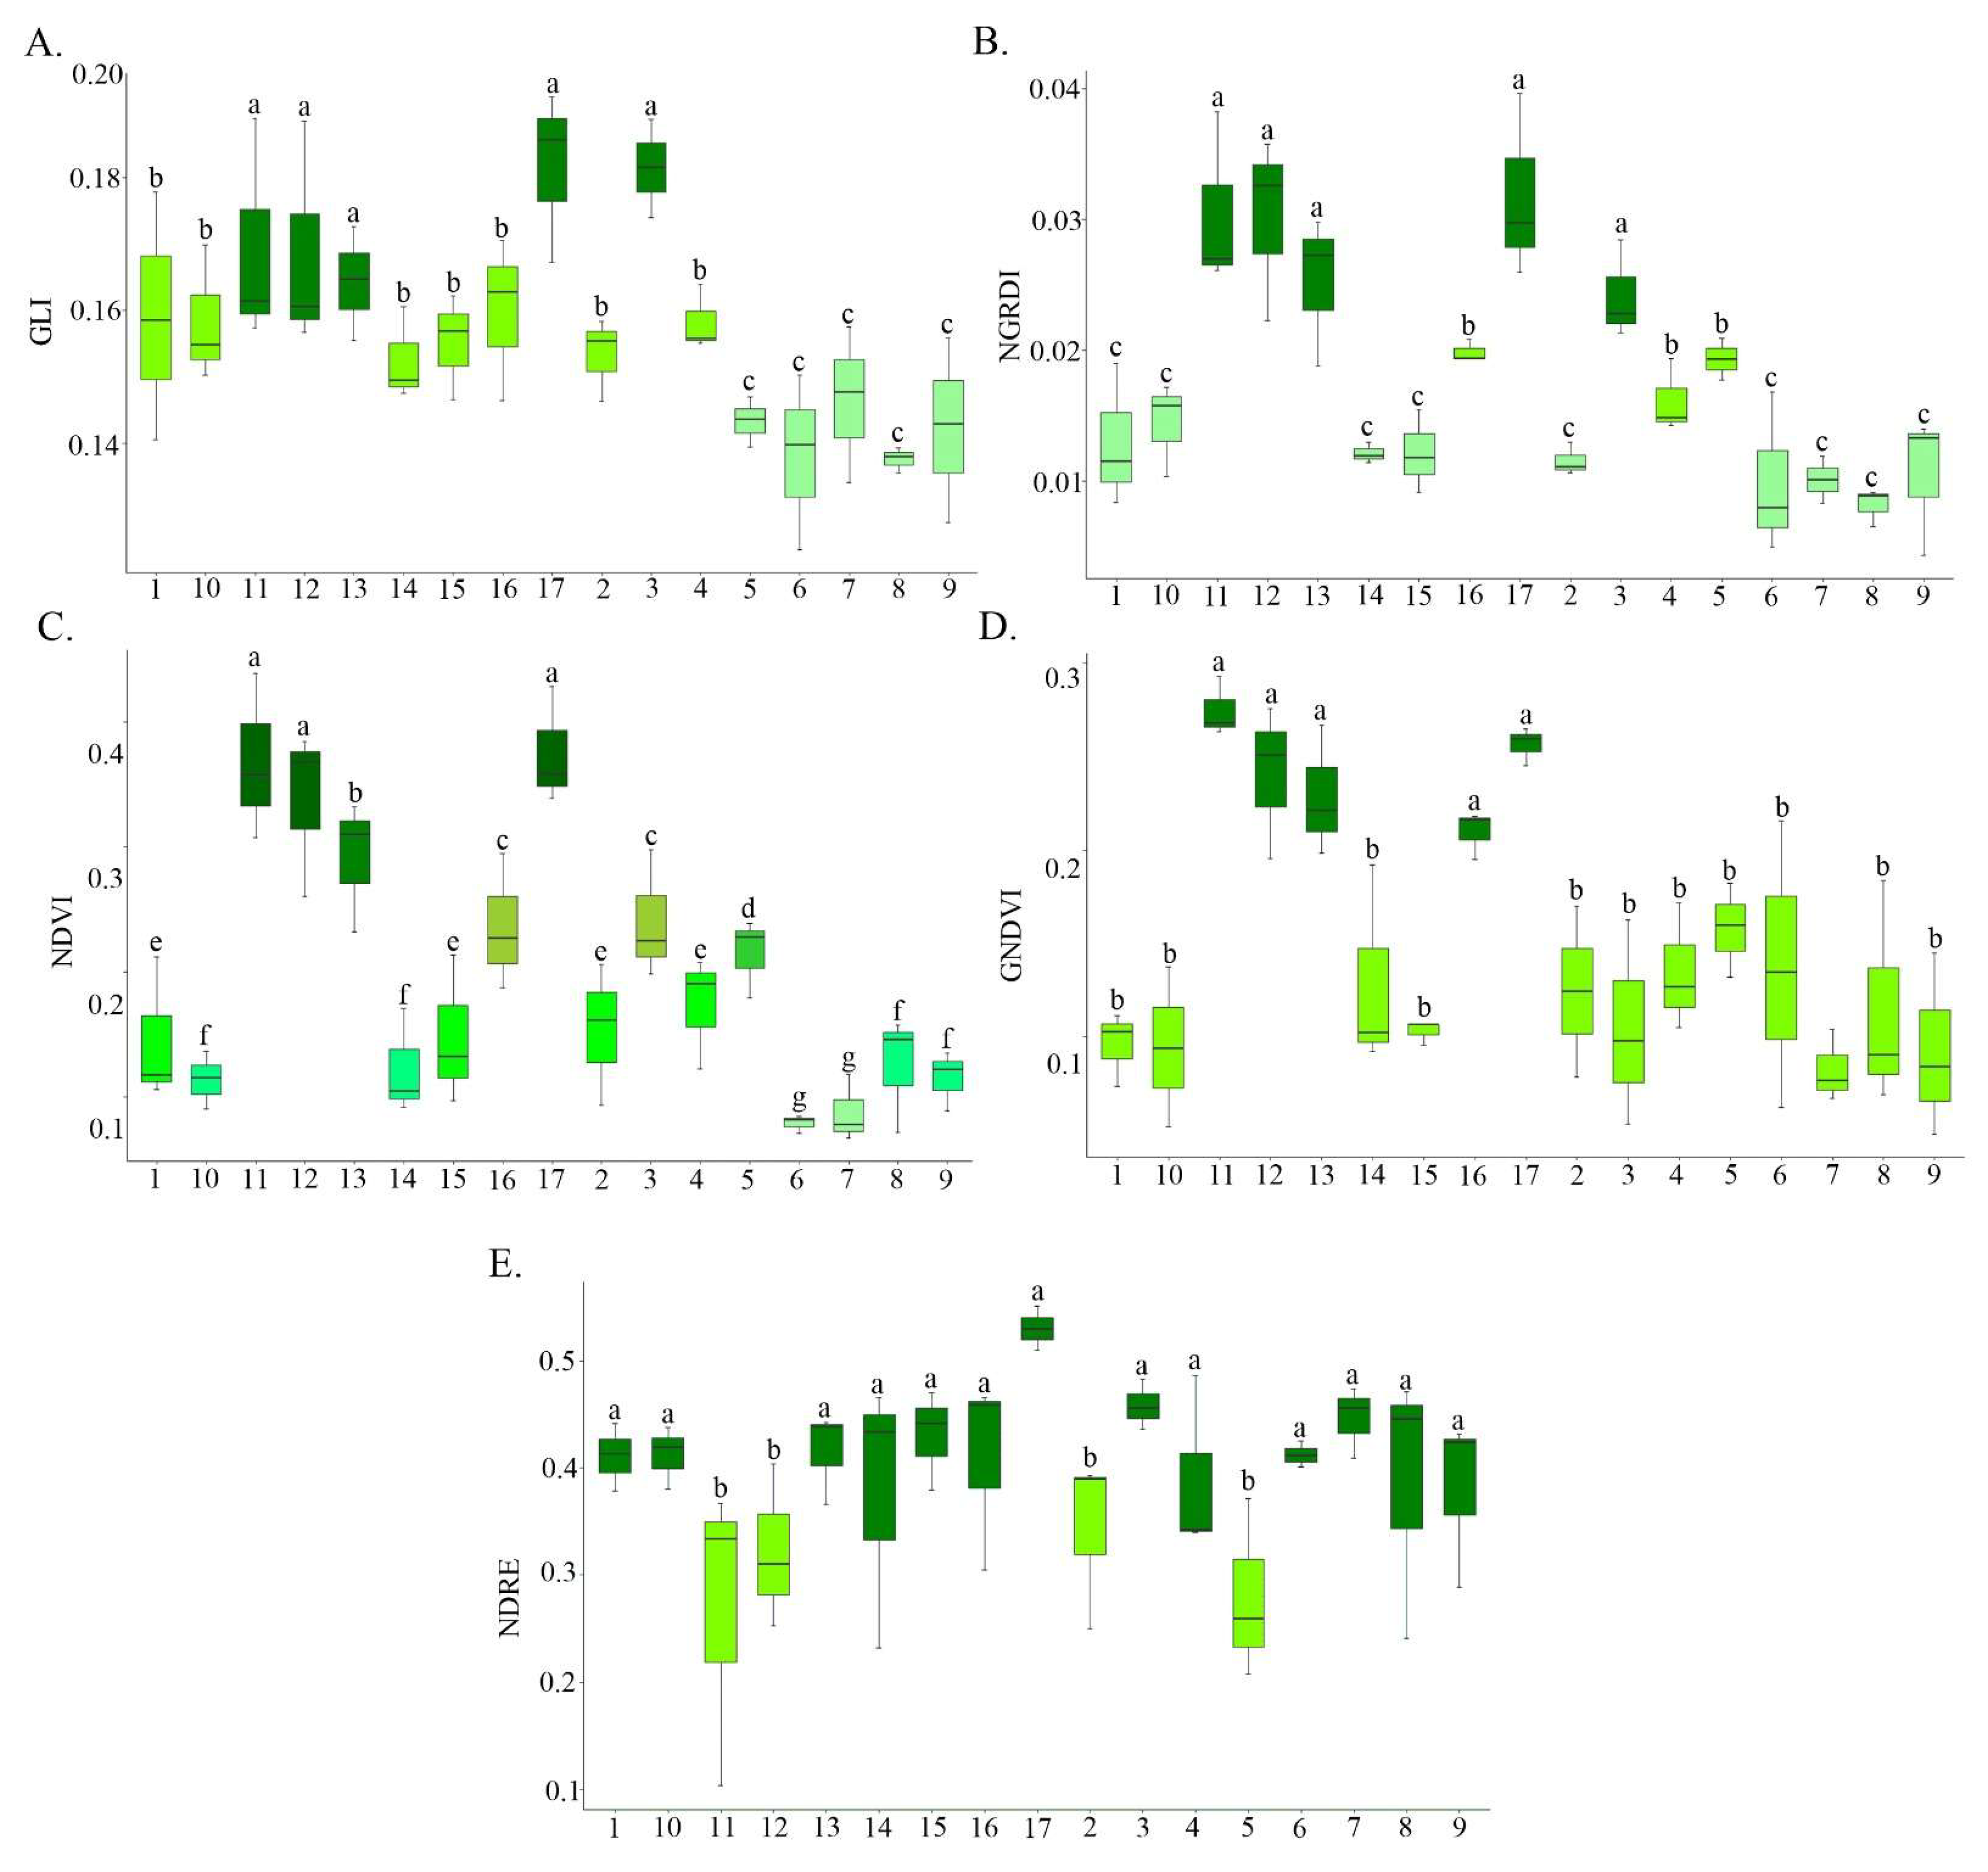
3. Results and Discussion
4. Conclusions
Limitations and Future Prospects
Author Contributions
Funding
Institutional Review Board Statement
Data Availability Statement
Acknowledgments
Conflicts of Interest
References
- Viacava, G.; Goyeneche, R.; Goñi, M.G.; Roura, S.I.; Aguero, M.V. Natural elicitors as pre-harvest treatments to improve the post-harvest quality of butterhead lettuce. Sci. Hortic. 2018, 228, 145–152. [Google Scholar] [CrossRef]
- Kist, B.B.; Beling, R.R. Anuário Brasileiro de Horti&fruti. Santa Cruz do Sul: Editora Gazeta Santa Cruz, 2023. 108p. Available online: https://editoragazeta.com.br/produto/anuario-brasileiro-do-horti-fruti-2024/ (accessed on 6 November 2024).
- Veras, R.N.S.; Lima, D.S.; Carvalho, J.A.; Reis, A.S.; Silva, M.R. Desempenho da alface Vanda em relação ao uso de adubo químico e composto orgânico. Res. Soc. Dev. 2019, 8, 1–24. [Google Scholar] [CrossRef]
- Echer, R.; Lovatto, P.B.; Trecha, C.O.; Shiedeck, G. Alface à mesa: Implicações sócio-econômicas e ambientais da semente ao prato. Rev. Thema 2016, 13, 17–29. [Google Scholar] [CrossRef]
- Matsuda, O.; Tanaka, A.; Fujita, T.; Iba, K. Hyperspectral Imaging Techniques for Rapid Identification of Arabidopsis Mutants with Altered Leaf Pigment Status. Plant Cell Physiol. 2012, 53, 1154–1170. [Google Scholar] [CrossRef]
- Sousa, C.A.F.; Martins, P.K.; Cunha, B.A.D.B.; Molinari, H.B.C. New approach for plant phenotyping: Concepts, current tools and perspectives. Rev. Bras. Geogr. Física 2015, 8, 660–672. [Google Scholar] [CrossRef]
- Coelho, F.G.T.; Maciel, G.M.; Siquieroli, A.C.; Gallis, R.B.A.; Oliveira, C.S.; Ribeiro, A.A.; Pereira, L.M. High-Throughput Phenotyping for the Evaluation of Agronomic Potential and Root Quality in Tropical Carrot Using RGB Sensors. Agriculture 2024, 14, 710. [Google Scholar] [CrossRef]
- Cortes, D.F.M.; Catarina, R.S.; Barros, G.B.A.; Arêdes, F.A.S.; Silveira, S.F.; Ferreguetti, G.A.; Ramos, H.C.C.; Viana, A.P.; Pereira, M.G. Model-assisted phenotyping by digital images in papaya breeding program. Sci. Agric. 2017, 74, 294–302. [Google Scholar] [CrossRef]
- Reynolds, M.; Tattaris, M.; Cossani, C.M.; Ellis, M.; Shinozaki, K.Y.; Pierre, C.S. Exploring Genetic Resources to Increase Adaptation of Wheat to Climate Change. In Advances in Wheat Genetics: From Genome to Field; Springer: Tokyo, Japan, 2015; pp. 355–368. [Google Scholar] [CrossRef]
- Dhont, S.; Wuyts, N.; Inzé, D. Cell to whole-plant phenotyping: The best is yet to come. Trends Plant Sci. 2013, 18, 428–439. [Google Scholar] [CrossRef]
- Gomes, A.P.A.; Queiroz, D.M.; Valente, D.S.M.; Pinto, F.A.C.; Rosas, J.T.F. Comparing a single-sensor camera with multisensory camera for monitoring coffee crop using unmanned aerial vehicles. Eng. Agrícola 2021, 41, 87–97. [Google Scholar] [CrossRef]
- Yang, G.; Liu, J.; Zhao, C.; Zhenhong, L.; Huang, Y.; Yu, H.; Xu, B.; Yang, X.; Zhu, D.; Zhang, X.; et al. Unmanned Aerial Vehicle Remote Sensing for Field-Based Crop Phenotyping: Current Status and Perspectives. Front. Plant Sci. 2017, 8, 1–26. [Google Scholar] [CrossRef]
- Maciel, G.M.; Pereira, L.M.; Gallis, R.B.A.; Siquieroli, A.C.S.; Barbora, R.L.; Peixoto, J.V.M. Image phenotyping of lettuce germplasm with genetically diverse carotenoid levels. Bragantia 2020, 79, 224–235. [Google Scholar] [CrossRef]
- Clemente, A.A.; Maciel, G.M.; Siquieroli, A.C.S.; Gallis, R.B.A.; Luz, J.M.Q.; Sala, F.C.; Pereira, L.M.; Yada, R.Y. Nutritional Characterization Based on Vegetation Indices to Detect Anthocyanins, Carotenoids, and Chlorophylls in Mini-Lettuce. Agronomy 2023, 13, 1403. [Google Scholar] [CrossRef]
- Santos, H.G.; Jacomine, P.K.T.; Anjos, L.H.C.; Oliveira, V.A.; Lumbreras, J.F.; Coelho, M.R.; Almeida, J.A.; Araujo Filho, J.C.; Oliveira, J.B.; Cunha, T.J.F. Sistema Brasileiro de Classificação de Solos, 5th ed.; Embrapa Solos: Brasília, Brazil, 2018; 355p. [Google Scholar]
- Martins, F.B.; Gonzaga, G.; Santos, D.F.; Reboita, M.S. Classificação Climática De Köppen E De Thornthwaite Para Minas Gerais: Cenário Atual e Projeções Futuras. Rev. Bras. Climatol. 2018, 2, 129–156. [Google Scholar] [CrossRef]
- Cooperativa dos Cafeicultores de Guaxupé (COOXUPÉ). Sismet Cooxupé. 2024. Available online: https://sismet.cooxupe.com.br:9000/dados/estacao/ (accessed on 7 October 2024).
- Ribeiro, A.C.; Guimarães, P.T.G.; Alvarez, V.V.H. Recomendações para o uso de corretivos e fertilizantes em Minas Gerais—5ª Aproximação. In Comissão de Fertilidade do Solo do Estado de Minas Gerais; UFV: Viçosa, Brazil, 1999; 359p. [Google Scholar]
- Ministério da Agricultura Pecuária e Abastecimento (MAPA). Instruções para Execução dos Ensaios de Distinguibilidade, Homogeneidade e Estabilidade de Cultivares de Alface (Lactuca sativa L.). 2001. Available online: https://www.gov.br/agricultura/pt-br/assuntos/insumos-agropecuarios/insumos-agricolas/protecao-de-cultivar/olericolas (accessed on 1 November 2024).
- Luz, A.O. Resistência ao pendoamento de genótipos de alface em ambientes de cultivo. Agrarian 2009, 2, 71–82. [Google Scholar]
- Rouse, J.W.; Haas, R.H.; Schell, J.A.; Deering, D.W. Monitoring vegetation systems in the Great Plains with ERTS (Earth Resources Technology Satellite). In Proceedings of the Third Erts Symposium, Washington, DC, USA, 10–14 December 1973; pp. 309–317. [Google Scholar]
- Gitelson, A.A.; Kaufman, Y.J.; Merzilyak, M.N. Use of a green channel in remote sensing of global vegetation from EOS-MODIS. Remote Sens. Environ. 1996, 58, 289–298. [Google Scholar] [CrossRef]
- Louhaichi, M.; Borman, M.M.; Johnson, D.E. Spatially Located Platform and Aerial Photography for Documentation of Grazing Impacts on Wheat. Geocarto Int. 2001, 16, 65–70. [Google Scholar] [CrossRef]
- Tucker, C.J. Red and photographic infrared linear combinations for monitoring vegetation. Remote Sens. Environ. 1979, 8, 127–150. [Google Scholar] [CrossRef]
- Barnes, E.M.; Clarke, T.R.; Richards, S.E.; Colaizzi, P.D.; Haberland, J.; Kostrzewski, M.; Waller, P.; Choi, C.; Riley, E.; Thompson, T.; et al. Coincident detection of crop water stress, nitrogen status and canopy density using ground-based multispectral data. In Proceedings of the 5th International Conference on Precision Agriculture, Bloomington, MN, USA, 16–19 July 2000. [Google Scholar]
- Cruz, C.D.; Regazzi, A.J.; Carneiro, P.C.S. Modelos Biométricos Aplicados ao Melhoramento Genético; UFV: Viçosa, Brazil, 2012; 514p. [Google Scholar]
- Mantel, N. The Detection of Disease Clustering and a Generalized Regression Approach. Cancer Res. 1967, 27, 209–220. [Google Scholar]
- Singh, D. The relative importance of characters affecting genetic divergence. Indian J. Genet. Plant Breed. 1981, 41, 237–245. [Google Scholar]
- Cruz, C.D. GENES—A software package for analysis in experimental statistics and quantitative genetics. Acta Sci. 2013, 35, 271–276. [Google Scholar]
- R Core Team. A Language and Environment for Statistical Computing, Version 3.6; Foundation for Statistical Computing: Vienna, Austria, 2019. Available online: https://cran.r-project.org/bin/windows/base/old/ (accessed on 10 November 2024).
- Ramalho, M.A.P.; Santos, J.B.; Zimmermann, M.J.O. Genética Quantitativa em Plantas Autógamas: Aplicações ao Melhoramento do Feijoeiro; Editora da UFG: Goiânia, Brazil, 1993; 271p. [Google Scholar]
- Lima, A.A.; Miranda, E.G.; Campos, L.Z.O.; Cuznato Júnior, W.H.; Melo, S.C.; Camargo, M.S. Competição das cultivares de alface Vera e Verônica em dois espaçamentos. Hortic. Bras. 2004, 22, 314–316. [Google Scholar] [CrossRef]
- Otto, R.F.; Reghin, M.Y.; Sá, G.D. Utilização do ‘não tecido’ de polipropileno como proteção da cultura de alface durante o inverno de Ponta Grossa PR. Hortic. Bras. 2001, 19, 49–52. [Google Scholar] [CrossRef]
- Neves, J.F.; Nodari, I.D.E.; Seabra Junior, S.; Dias, L.D.E.; Silva, L.B.; Dallacort, R. Produção de cultivares de alface americana sob diferentes ambientes em condições tropicais. Rev. Agro@Mbiente-Line 2016, 10, 130. [Google Scholar] [CrossRef]
- Madar, Á.K.; Hájos, M.T. Evolution of quality parameters of different lettuce (Lactuca sativa L.) varieties under unheated plastic tunnel. Acta Universitatis Sapientiae. Agric. Environ. 2021, 13, 88–99. [Google Scholar] [CrossRef]
- Jacinto, A.C.P.; Castoldi, R.; Silva, I.G.; Mota, D.C.S.; Moreira, L.G.; Maciel, G.M.; Oliveira, C.S.; Charlo, H.C.O. Conventional morphological descriptors and artificial neural networks for characterizing biofortified lettuce germplasm. Rev. Caatinga 2024, 37, e12466. [Google Scholar] [CrossRef]
- Alves, L.S.; Barbosa, L.J.C.; Moreira, B.R.A.; Cruz, V.H.; Takahashi, L.S.; Miasaki, C.T.; Lopes, P.R.M. Desempenho Agronômico de Alface Cultivada em Sistema Aquapônico sob Diferentes Densidades de Estocagem de Tilápia. Científica 2024, 52, 1418. [Google Scholar] [CrossRef]
- Costa, K.P.A.; Pinheiro, F.A.S.; Silva, A.C.A.; Costa, A.L.E.; Antos, J.; Zanandrea, I. Leaf growth and anatomy of cymbidium sp. Cultivated in different light conditions. Braz. J. Dev. 2021, 7, 108690–108703. [Google Scholar] [CrossRef]
- Santos, C.P.; Noboa, C.S.; Martinez, M.; Cardoso, J.C.; Sala, F.C. Morphological evaluation of lettuce genotypes grown under hydroponic system. Hortic. Bras. 2021, 39, 312–318. [Google Scholar] [CrossRef]
- Covre, E.A.; Borba, K.R.; Ferreira, M.D.; Spoto, M.H.F.; Sala, F.C.; Bernardi, M.R.V. Caracterização físico-química e sensorial da alface Brunela. Agrarian 2020, 13, 265–272. [Google Scholar] [CrossRef]
- Enciso-Garay, C.R.; Chaves, J.A.; Oviedo, V.R.S.; Medina, N.I.G.; Rotela, R.B.; Veron, N.C.S. Produtividade de cultivares de alface crespa em ambiente protegido durante o verão. Rev. Bras. Agropecuária Sustentável 2022, 12, 157–163. [Google Scholar] [CrossRef]
- Koefender, J.; Schoffel, A.; Manfio, C.E.; Golle, D.P.; Silva, A.N.; Horn, R.C. Consorciação entre alface e cebola em diferentes espaçamentos. Hortic. Bras. 2016, 34, 580–583. [Google Scholar] [CrossRef]
- Cardoso, S.S.; Guimarães, M.A.; Lemos Neto, H.S.; Telo, J.P.J.; Do Vale, J.C. Morphological and productive aspects of lettuce in low altitude and latitude. Rev. Ciência Agronômica 2018, 49, 644–652. [Google Scholar] [CrossRef]
- Sala, F.C.; Costa, C.P. Retrospectiva e tendência da alfacicultura brasileira. Hortic. Bras. 2012, 30, 187–194. [Google Scholar] [CrossRef]
- Souza, R.C.; Almeida, U.O.; Ávila, J.C.; Nogueira, A.E.; Anselmo, M.C.; Mendes Júnior, J.C.L. Effect of shadowing on lettuce cultivars in hydroponic system in Ariquemes-RO. Rev. Científica Fac. Educ. Meio Ambiente-Faema 2022, 13, 16–30. [Google Scholar] [CrossRef]
- Pereira, D.F.; Silva, T.P.; Freire, W.A.; Souza, E.G.; Cruz, E.A.; Feitosa, R.M. Agronomic characteristics and quality of lettuce cultivars in different crop seasons in western Alagoas, Brazil. Rev. Caatinga 2023, 36, 106–114. [Google Scholar] [CrossRef]
- Vialle, L.; Coelho, E.L.; Alves, R.E.A. Development and production of curly and iceberg lettuce under the influence of different types of mulch. Rev. Agrogeoambiental 2024, 16, e20241812-1. [Google Scholar] [CrossRef]
- Bezerra Neto, F.; Rocha, R.C.C.; Negreiros, M.Z.; Rocha, R.H.; Queiroga, R.C.F. Produtividade de alface em função de condições de sombreamento e temperatura e luminosidade elevadas. Hortic. Bras. 2005, 23, 189–192. [Google Scholar] [CrossRef]
- Volpato, T.; Ribera, L.M.; Todaka, L.M.B.; Hernandes, F.B.; Lima, E.D.P.; Silva, M.L. Residual effect of different toppings on lettuce cultivars. Braz. J. Dev. 2021, 7, 61370–61379. [Google Scholar] [CrossRef]
- Blind, A.D.; Silva Filho, D.F. Desempenho de cultivares de alface americana cultivadas com e sem mulching em período chuvoso da Amazônia. Rev. Agro@Mbiente-Line 2015, 9, 143–151. [Google Scholar] [CrossRef]
- Limberger, P.A.; Gheller, J.A. Efeito da aplicação foliar de extrato de algas, aminoácidos e nutrientes via foliar na produtividade e qualidade de alface crespa. Rev. Bras. Energ. Renov. 2012, 1, 148–161. [Google Scholar] [CrossRef]
- Diamante, M.S.; Seabra Júnior, S.; Inagaki, A.M.; Silva, M.B.; Dallacort, R. Produção e resistência ao pendoamento de alfaces tipo lisa cultivadas sob diferentes ambientes. Rev. Ciência Agronômica 2013, 44, 133–140. [Google Scholar] [CrossRef]
- Henz, G.P.; Suinaga, F. Tipos de Alface Cultivados no Brasil; Comunicado Técnico 75. Embrapa Hortaliças: Brasília, Brazil, 2009. Available online: https://www.infoteca.cnptia.embrapa.br/bitstream/doc/783588/1/cot75.pdf (accessed on 10 November 2024).
- Suinaga, F.A.; Resende, F.V.; Boiteux, L.S.; Pinheiro, J.B. Avaliação Fitotécnica de Dez Genótipos de Alface Crespa: I—Cultivo Orgânico; Boletim de Pesquisa e Desenvolvimento 108. Embrapa Hortaliças: Brasília, Brazil, 2014. Available online: https://www.infoteca.cnptia.embrapa.br/infoteca/handle/doc/1009140 (accessed on 5 November 2024).
- Ribeiro, A.L.A.; Maciel, G.M.; Siquieroli, A.C.; Luz, J.M.Q.; Gallis, R.B.A.; Assis, P.H.S.; Catão, H.C.R.M.; Yada, R.Y. Vegetation Indices for Predicting the Growth and Harvest Rate of Lettuce. Agriculture 2023, 13, 1091. [Google Scholar] [CrossRef]
- Clemente, A.A.; Maciel, G.M.; Siquieroli, A.C.S.; Gallis, R.B.A.; Pereira, L.M.; Duarte, J.G. High-throughput phenotyping to detect anthocyanins, chlorophylls, and carotenoids in red lettuce germplasm. Int. J. Appl. Earth Obs. Geoinf. 2021, 103, 102533. [Google Scholar] [CrossRef]
- Sampaio, M.I.R.; Kunz, A.; Hillebrand, F.L.; Zamberlan, J.F.; Idalino, F.D. Análise d os índices de vegetação NDVI e NDRE em imagens obtidas por meio de sensor embarcado em um RPAS para as culturas da soja (Glycine max) e milho (Zea mays) irrigados. Rev. Bras. Geomática 2021, 9, 350–362. [Google Scholar] [CrossRef]
- Pandit, S.; Tsuyuki, S.; Dube, T. Estimating Above-Ground Biomass in Sub-Tropical Buffer Zone Community Forests, Nepal, Using Sentinel 2 Data. Remote Sens. 2018, 10, 601. [Google Scholar] [CrossRef]
- Cavalcanti, V.P.; Santos, A.F.; Rodrigues, F.A.; Terra, W.C.; Araújo, R.C.; Ribeiro, C.R.; Campos, V.P.; Rigobelo, E.C.; Medeiros, F.H.V.; Dória, J. Use of RGB images from unmanned aerial vehicle to estimate lettuce growth in root-knot nematode infested soil. Smart Agric. Technol. 2023, 3, 100100. [Google Scholar] [CrossRef]
- Assis, P.H.S.; Luz, J.M.Q.; Gallis, R.B.A.; Maciel, G.M.; Oliveira, R.C.; Borges, R.T.O.; Siquieroli, A.C.S. Vegetation indices for monitoring agronomic performance of potato under combinations of mineral and organic fertilization. Rev. Bras. Eng. Agrícola Ambient. 2024, 28, e278100-1. [Google Scholar] [CrossRef]
- Souza, I.V.; Silva, F.C.S.; Batista, A.C.; Santos, G.R.; Coelho, M.C.B.; Giongo, M. Uso de drone para a estimativa do material combustível em formações campestres no Cerrado. Ciência Florest. 2024, 34, e73469. [Google Scholar] [CrossRef]
- Silva, G.O.; Vieira, J.V.; Vilela, M.S. Seleção de caracteres de cenoura cultivada em dois sistemas de produção agroecológicos no Distrito Federal. Rev. Ceres 2009, 56, 595–601. [Google Scholar]
- Souza, M.C.M.; Resende, L.V.; Menezes, D.; Loges, V.; Soute, T.A.; Santos, V.F. Variabilidade genética para características agronômicas em progênies de alface tolerantes ao calor. Hortic. Bras. 2008, 26, 3. [Google Scholar] [CrossRef]
- Prado, E.V. Fenotipagem de plantas por meio de ferramentas digitais. Rev. Gestão Foco 2023, 101–110. Available online: https://portal.unisepe.com.br/unifia/wp-content/uploads/sites/10001/2023/02/FENOTIPAGEM-DE-PLANTAS-POR-MEIO-DE-FERRAMENTAS-DIGITAIS-p%C3%A1g-101-a-110.pdf (accessed on 16 April 2025).


| Lines | Parents |
|---|---|
| UFU 001 | Coral × BS AC0055 |
| UFU 002#2 | BS AC0055 × Coral |
| UFU 003#1 | BS AC0055 × Coral |
| UFU 004 | BS AC0055 × Aliot |
| UFU 005 | Luiza × L3 |
| UFU 006 | Vanda × L1 |
| UFU 007 | Vanda × L1 |
| UFU 008 | Vanda × Coral |
| UFU 009#2 | Vanda × Coral |
| UFU 010 | Vanda × Coral |
| UFU 011 | Lectrice × Lais |
| UFU 012 | Lectrice × Lais |
| UFU 013 | Lectrice × Lais |
| UFU 014 | Coral × L1 |
| UFU 015 | Coral × L7 |
| UFU 016 | Vanda × L7 |
| UFU 017 | Vanda × L7 |
| Characteristic | Values |
|---|---|
| pH (H2O) (1:2.5) | 6.4 |
| Phosphorus (P) Mehlich-1—mg dm−3 | 9.9 |
| Potassium (K)—mg dm−3 | 0.53 |
| Calcium (Ca2+)—cmolc dm−3 | 5.79 |
| Magnesium (Mg2+)—cmolc dm−3 | 1.3 |
| Aluminum (Al3+)—cmolc dm−3 | 0.0 |
| H+Al (SMP Extractant)—cmolc dm−3 | 1.8 |
| Sum of exchangeable bases (SB)—cmolc dm−3 | 7.58 |
| CEC (t)—cmolc dm−3 | 7.58 |
| CEC at pH 7.0 (T)—cmolc dm−3 | 9.38 |
| Base saturation index (V)—% | 81.0 |
| Aluminum saturation index (m)—% | 0.0 |
| Boron (B)—mg dm−3 | 0.24 |
| Copper (Cu)—mg dm−3 | 1.9 |
| Iron (Fe)—mg dm−3 | 57.0 |
| Manganese (Mg)—mg dm−3 | 21.3 |
| Zinc (Zn)—mg dm−3 | 6.8 |
| Organic matter (OM)—% | 2.4 |
| Characteristics 1 | Descriptive Scale |
|---|---|
| Degree of overlap of the upper leaves (DOV) | 1 = very weak, 3 = weak, 5 = medium, 7 = strong and 9 = very strong |
| Degree of base closure (DBC) | 3 = weak, 5 = medium and 7 = strong |
| Longitudinal section shape (LSS) | 1 = elliptical, 2 = enlarged elliptical, 3 = circular and 4 = transverse elliptic |
| Growth habit (GH) | 3 = erect, 5 = semi-erect and 7 = nearly horizontal |
| Leaf shape (LS) | 1 = narrowed elliptical, 2 = elliptical, 3 = enlarged elliptical, 4 = circular, 5 = enlarged transverse elliptical, 6 = transverse elliptical, 7 = oval, 8 = enlarged transverse rhomboidal, 9 = triangular |
| Leaf thickness (LT) | 3 = thin, 5 = medium, 7 = thick |
| Leaf color intensity (CI) | 1 = very light, 3 = light, 5 = medium, 7 = dark and 9 = very dark |
| Leaf top side brightness (LB) | 1 = very weak, 3 = weak, 5 = medium, 7 = strong and 9 = very strong |
| Profile of outer leaves (POL) | 3 = concave, 5 = flat, 7 = convex |
| Bumpiness (BMP) | 1 = absent or very weak, 3 = weak, 5 = medium, 7 = strong and 9 = very strong |
| Degree of margin undulation (UND) | 1 = absent or very weak, 3 = weak, 5 = medium, 7 = strong and 9 = very strong |
| Head compactness (CO) | 1 = very loose, 3 = loose, 5 = medium, 7 = compact and 9 = very compact |
| Bump size (BS) | 3 = small, 5 = medium and 7 = large |
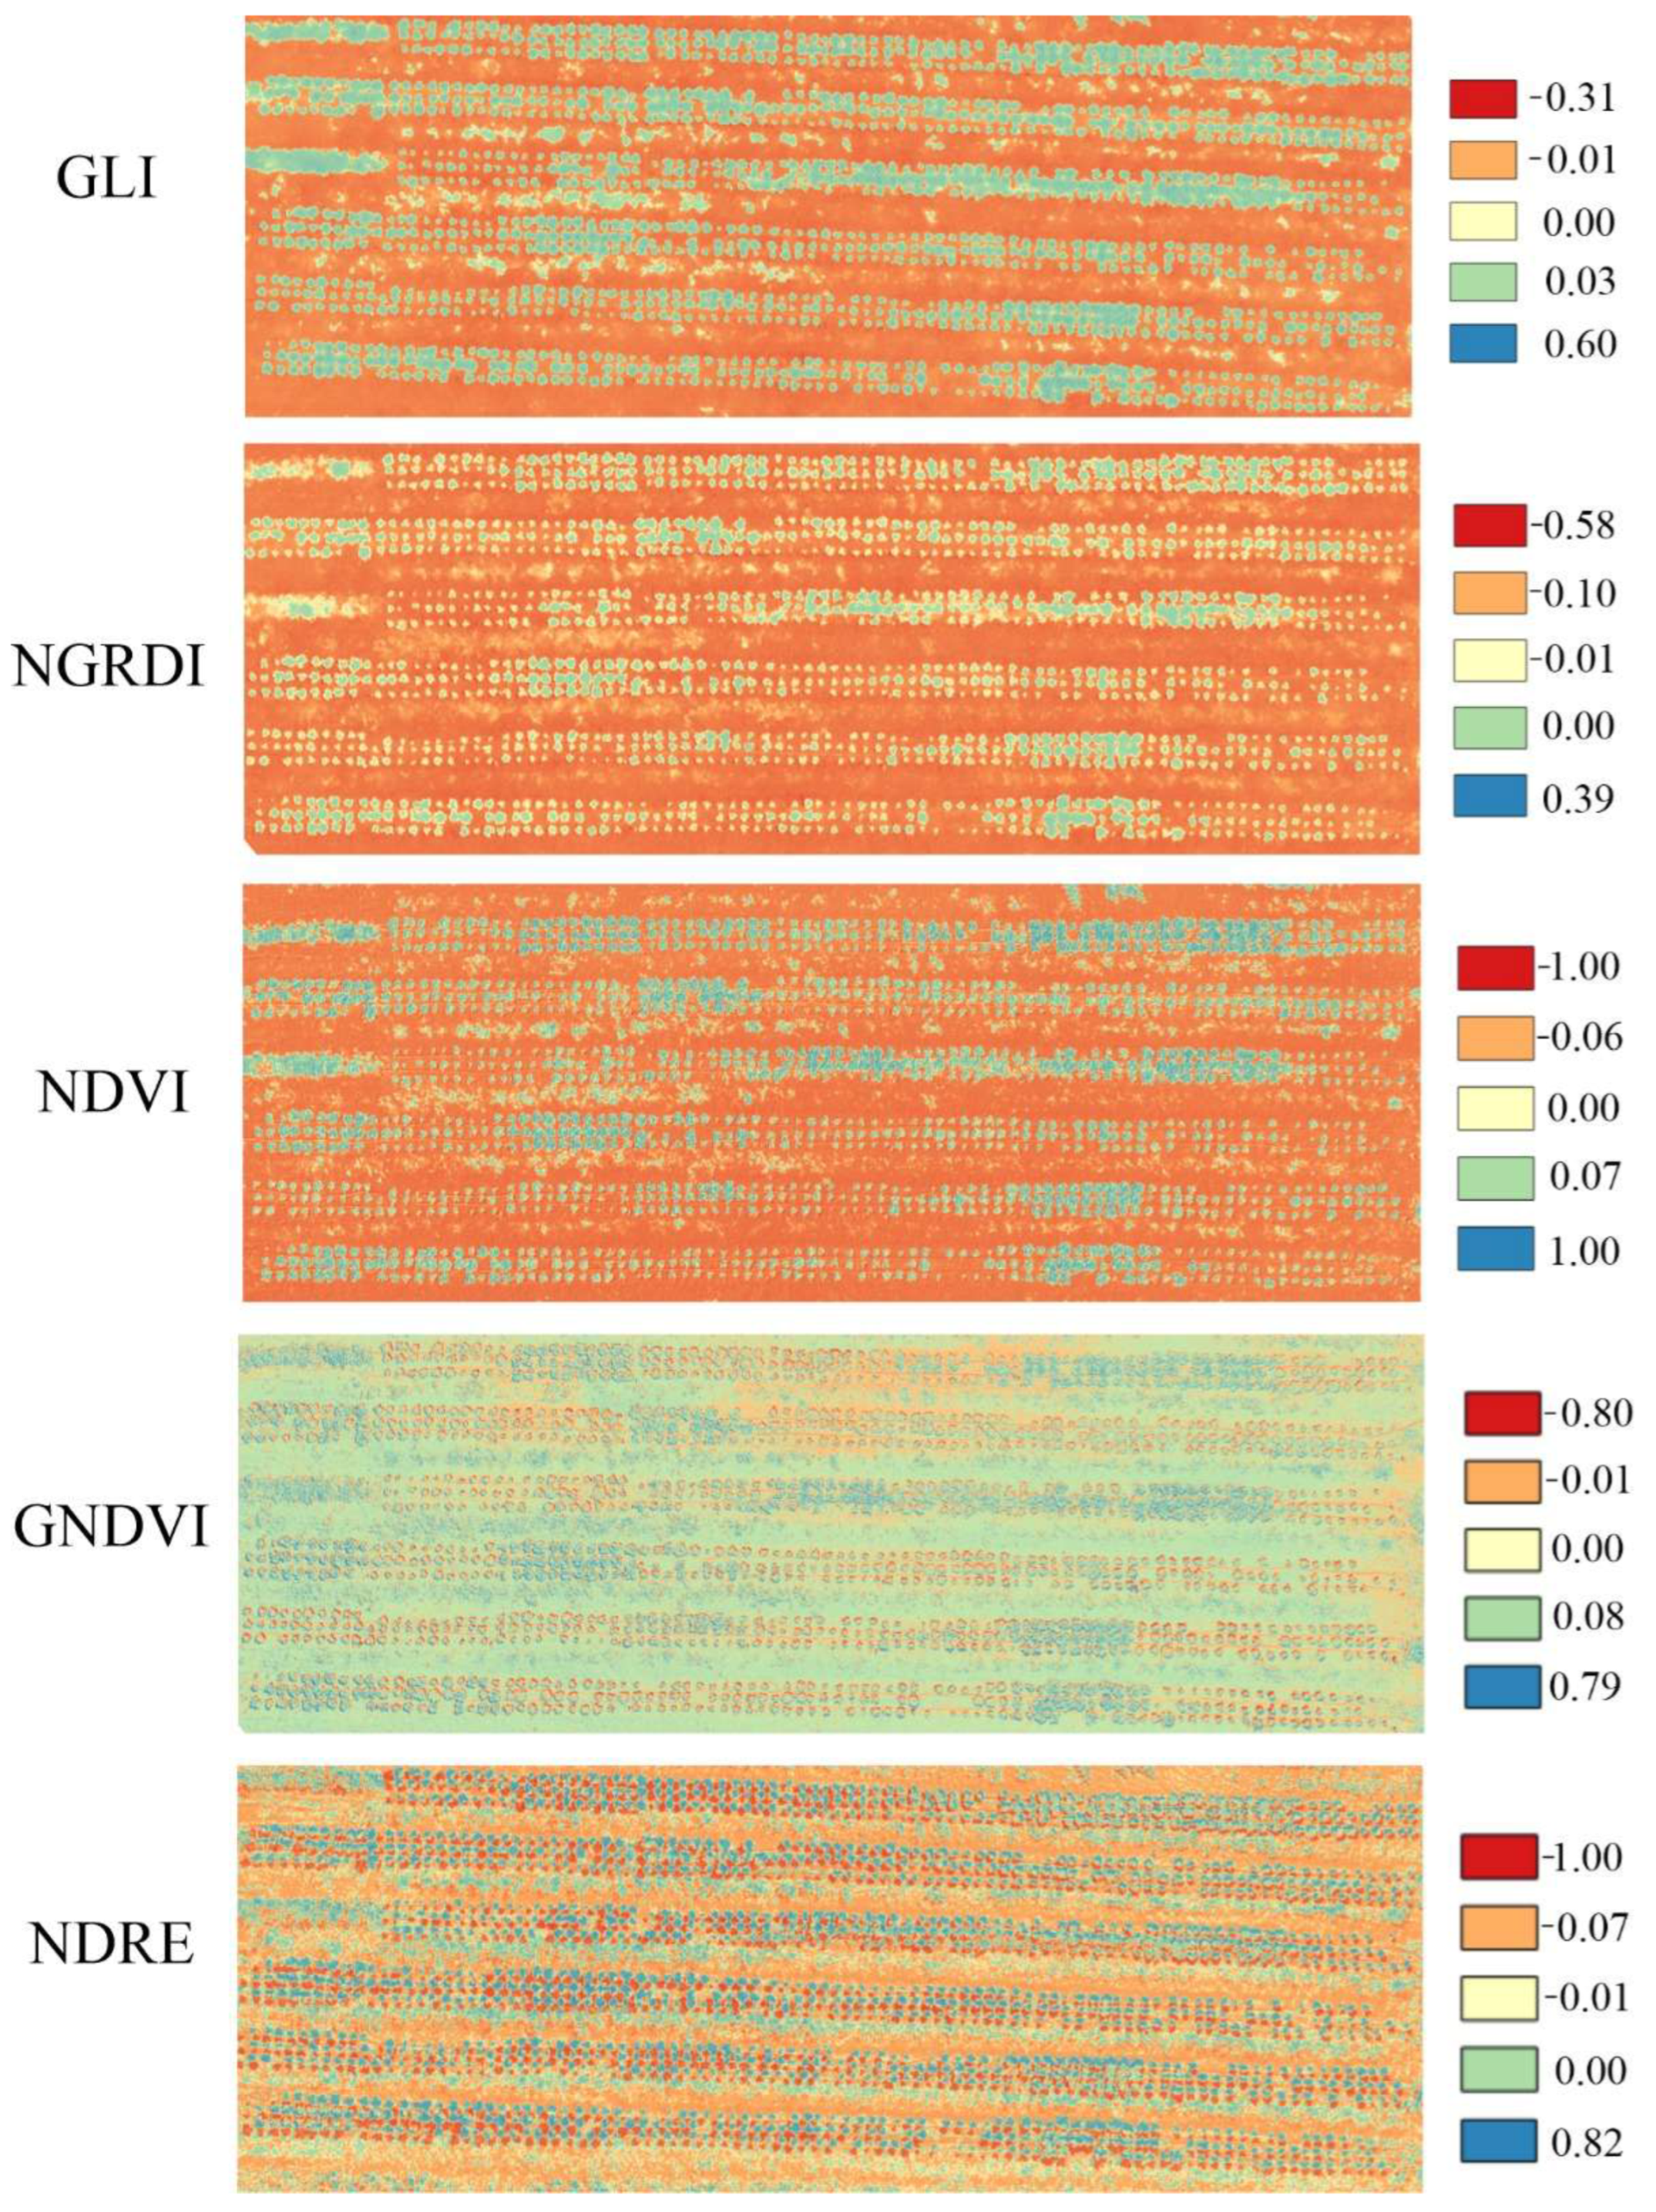
| Vegetation Indices | Formula | Application | Reference |
|---|---|---|---|
| NDVI | Plant biomass. | [21] | |
| GNDVI | Chlorophyll concentration. | [22] | |
| GLI | Chlorophyll indicator created to classify the presence of live plants, dead plants and exposed soil. | [23] | |
| NGRDI | Biomass. | [24] | |
| NDRE | Chlorophyll content in plants, as well as their nitrogen uptake and possible fertilizer demands. | [25] |
| Populations | DOV | CO | DBC | LSS | GH | LS | LT | LCI | LB | POL | BMP | BS | UND |
|---|---|---|---|---|---|---|---|---|---|---|---|---|---|
| UFU 001 | 1 | 1 | 7 | 1 | 5 | 8 | 5 | 5 | 3 | 3 | 7 | 5 | 7 |
| UFU 002#2 | 1 | 1 | 3 | 4 | 5 | 8 | 5 | 3 | 5 | 3 | 7 | 3 | 7 |
| UFU 003#1 | 1 | 1 | 3 | 1 | 5 | 8 | 7 | 7 | 3 | 3 | 7 | 5 | 7 |
| UFU 004 | 1 | 1 | 7 | 1 | 5 | 8 | 7 | 5 | 3 | 3 | 5 | 5 | 7 |
| UFU 005 | 1 | 1 | 7 | 1 | 5 | 8 | 5 | 5 | 5 | 3 | 7 | 5 | 7 |
| UFU 006 | 1 | 1 | 3 | 1 | 5 | 8 | 5 | 3 | 3 | 3 | 7 | 5 | 7 |
| UFU 007 | 1 | 1 | 3 | 1 | 5 | 8 | 5 | 3 | 3 | 3 | 7 | 5 | 5 |
| UFU 008 | 1 | 1 | 7 | 1 | 5 | 8 | 5 | 5 | 5 | 3 | 7 | 5 | 7 |
| UFU 009#2 | 1 | 1 | 7 | 1 | 5 | 2 | 3 | 5 | 3 | 3 | 7 | 5 | 7 |
| UFU 010 | 1 | 1 | 5 | 2 | 3 | 8 | 7 | 5 | 7 | 3 | 7 | 3 | 5 |
| UFU 011 | 3 | 5 | 7 | 2 | 5 | 3 | 7 | 7 | 5 | 3 | 3 | 5 | 3 |
| UFU 012 | 3 | 9 | 7 | 2 | 3 | 3 | 7 | 7 | 7 | 5 | 5 | 5 | 3 |
| UFU 013 | 3 | 9 | 7 | 2 | 3 | 7 | 5 | 7 | 5 | 5 | 3 | 7 | 5 |
| UFU 014 | 1 | 1 | 3 | 1 | 5 | 8 | 7 | 5 | 3 | 3 | 7 | 5 | 7 |
| UFU 015 | 1 | 1 | 7 | 1 | 5 | 8 | 7 | 5 | 3 | 3 | 7 | 7 | 7 |
| UFU 016 | 3 | 3 | 7 | 2 | 3 | 4 | 5 | 7 | 7 | 5 | 3 | 7 | 3 |
| UFU 017 | 1 | 1 | 5 | 1 | 5 | 8 | 5 | 5 | 5 | 3 | 9 | 5 | 7 |
Disclaimer/Publisher’s Note: The statements, opinions and data contained in all publications are solely those of the individual author(s) and contributor(s) and not of MDPI and/or the editor(s). MDPI and/or the editor(s) disclaim responsibility for any injury to people or property resulting from any ideas, methods, instructions or products referred to in the content. |
© 2025 by the authors. Licensee MDPI, Basel, Switzerland. This article is an open access article distributed under the terms and conditions of the Creative Commons Attribution (CC BY) license (https://creativecommons.org/licenses/by/4.0/).
Share and Cite
Silva, J.M.; Jacinto, A.C.P.; Ribeiro, A.L.A.; Damascena, I.R.; Ballador, L.M.; Lacerra, P.H.; Vargas, P.F.; Martins, G.D.; Castoldi, R. Phenotyping in Green Lettuce Populations Through Multispectral Imaging. Agriculture 2025, 15, 1295. https://doi.org/10.3390/agriculture15121295
Silva JM, Jacinto ACP, Ribeiro ALA, Damascena IR, Ballador LM, Lacerra PH, Vargas PF, Martins GD, Castoldi R. Phenotyping in Green Lettuce Populations Through Multispectral Imaging. Agriculture. 2025; 15(12):1295. https://doi.org/10.3390/agriculture15121295
Chicago/Turabian StyleSilva, Jordhanna Marilia, Ana Carolina Pires Jacinto, Ana Luisa Alves Ribeiro, Isadora Rodrigues Damascena, Livia Monteiro Ballador, Paulo Henrique Lacerra, Pablo Forlan Vargas, George Deroco Martins, and Renata Castoldi. 2025. "Phenotyping in Green Lettuce Populations Through Multispectral Imaging" Agriculture 15, no. 12: 1295. https://doi.org/10.3390/agriculture15121295
APA StyleSilva, J. M., Jacinto, A. C. P., Ribeiro, A. L. A., Damascena, I. R., Ballador, L. M., Lacerra, P. H., Vargas, P. F., Martins, G. D., & Castoldi, R. (2025). Phenotyping in Green Lettuce Populations Through Multispectral Imaging. Agriculture, 15(12), 1295. https://doi.org/10.3390/agriculture15121295