
Instance Segmentation of Sugar Apple (Annona squamosa) in Natural Orchard Scenes Using an Improved YOLOv9-seg Model
Abstract
1. Introduction
- (1)
- This paper presents the first investigation into the application of instance segmentation for detecting sugar apples (Annona squamosa) in natural orchard settings.
- (2)
- This paper proposes GCE-Yolov9-seg, an improved instance segmentation model that outperforms the original model in sugar apple detection, with gains in the F1 score, recall, mAP@50, and mAP@[50:95].
- (3)
- This paper creates an instance segmentation dataset for sugar apple images under natural conditions to evaluate the performance of GCE-Yolov9-seg.
2. Materials and Methods
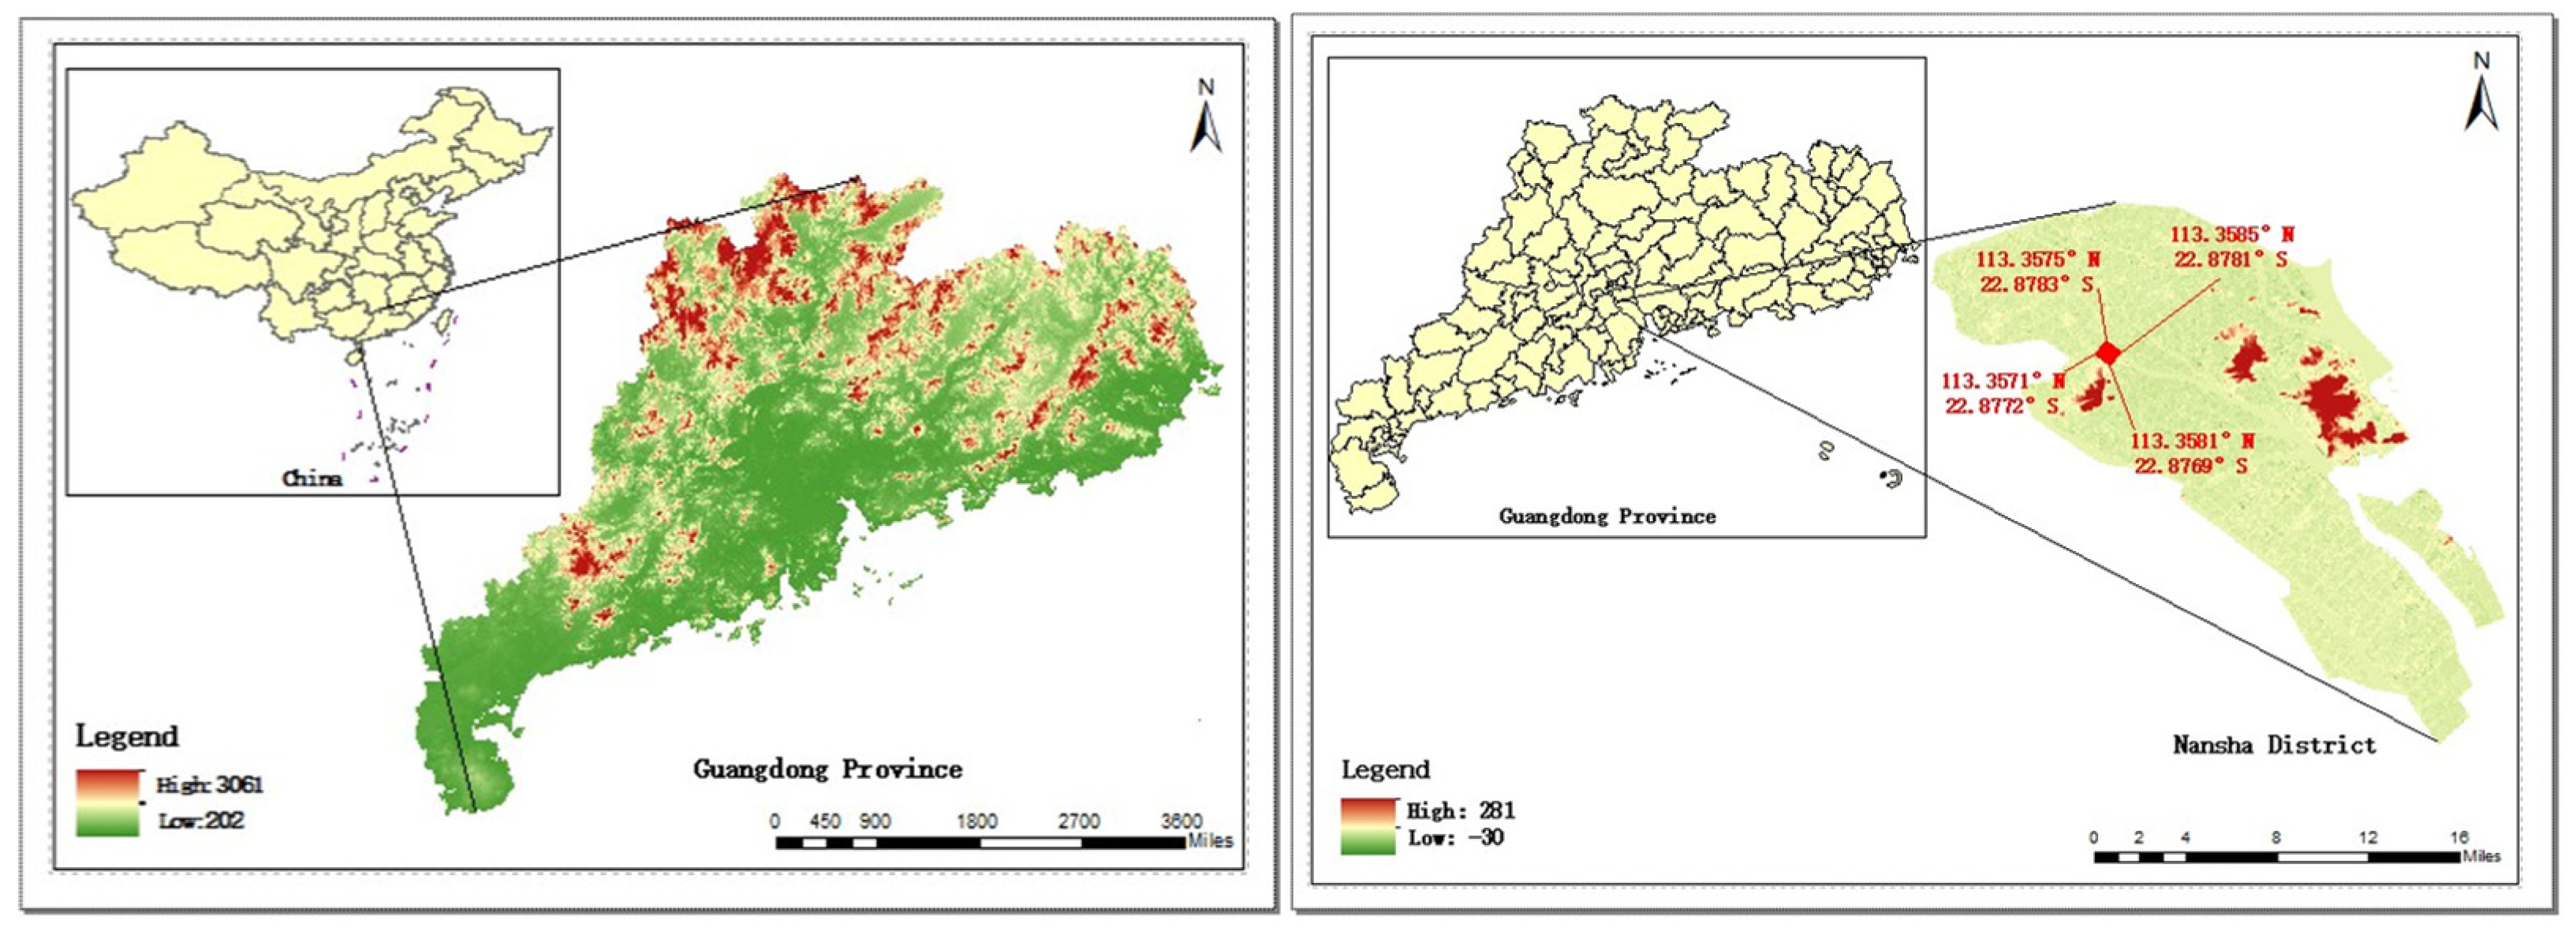
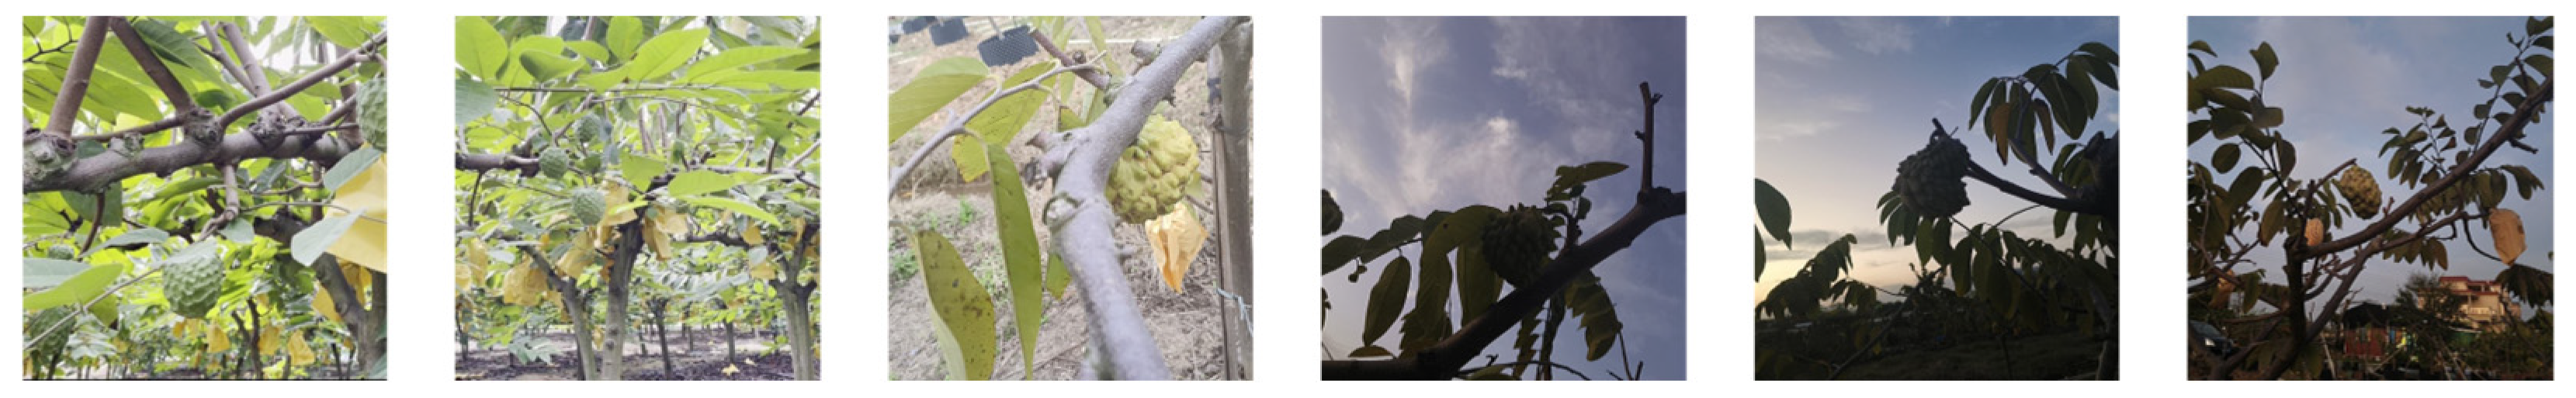
2.1. Dataset
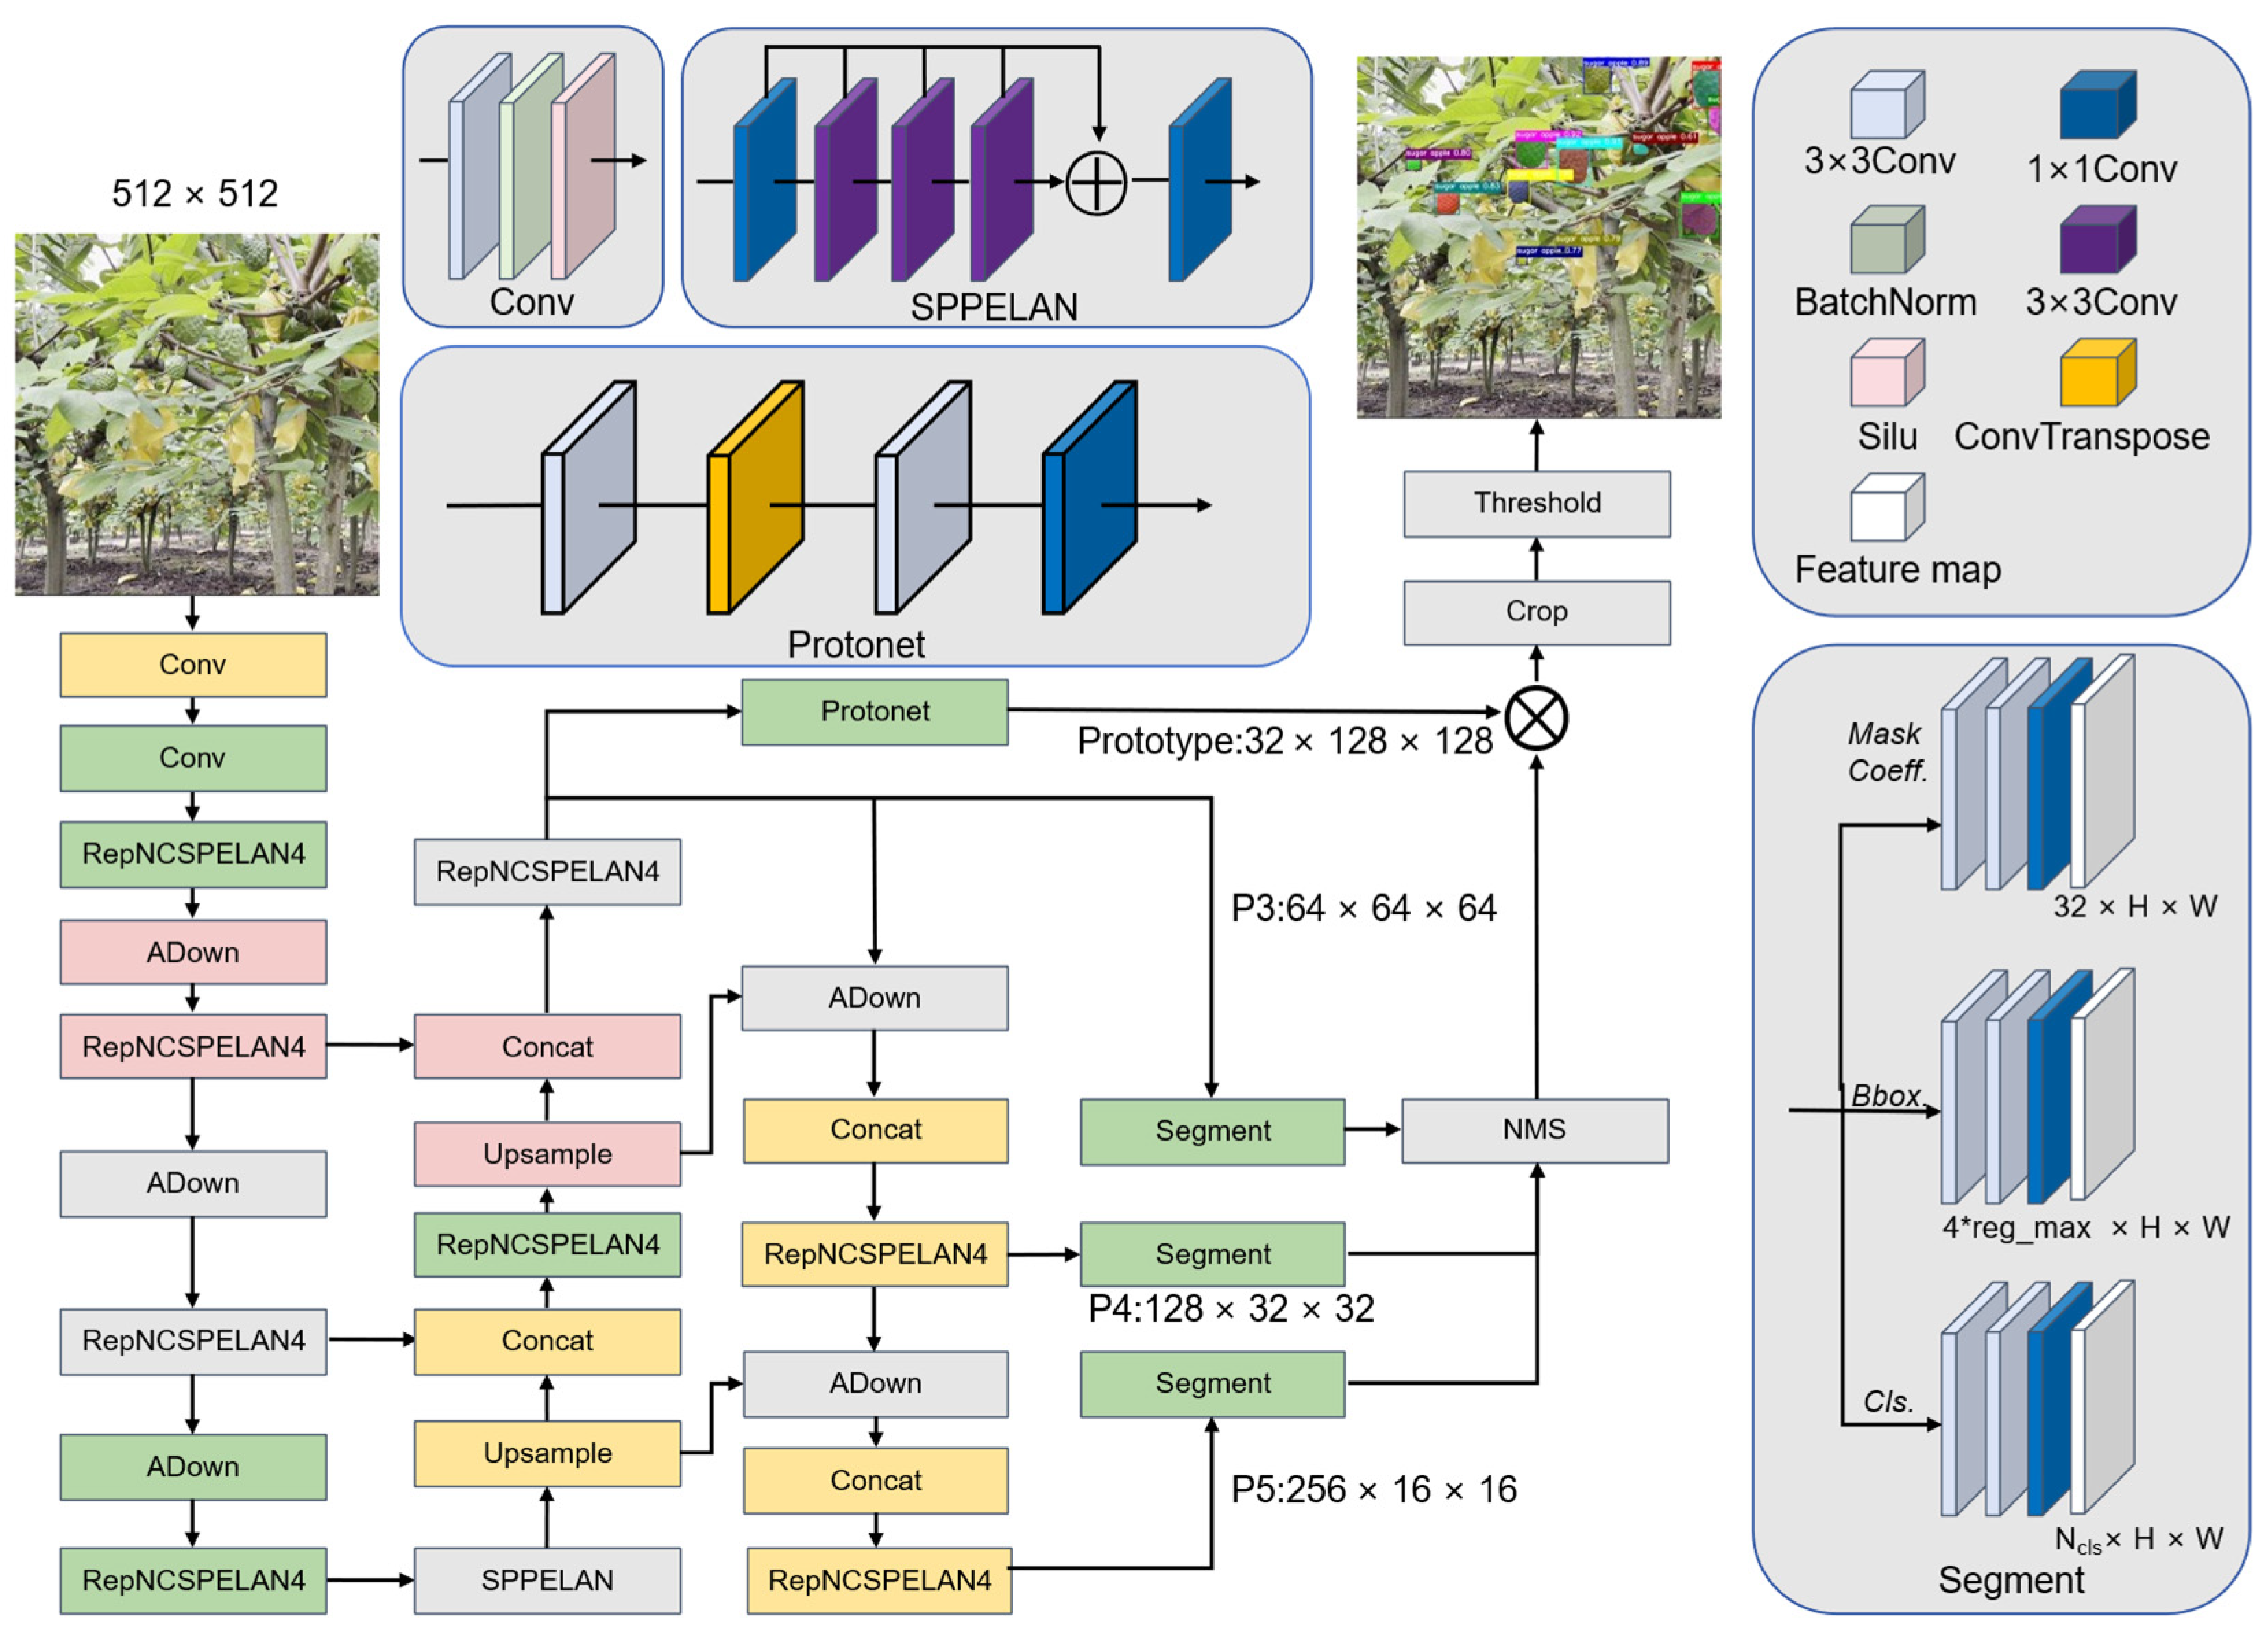
2.2. YOLOv9-seg
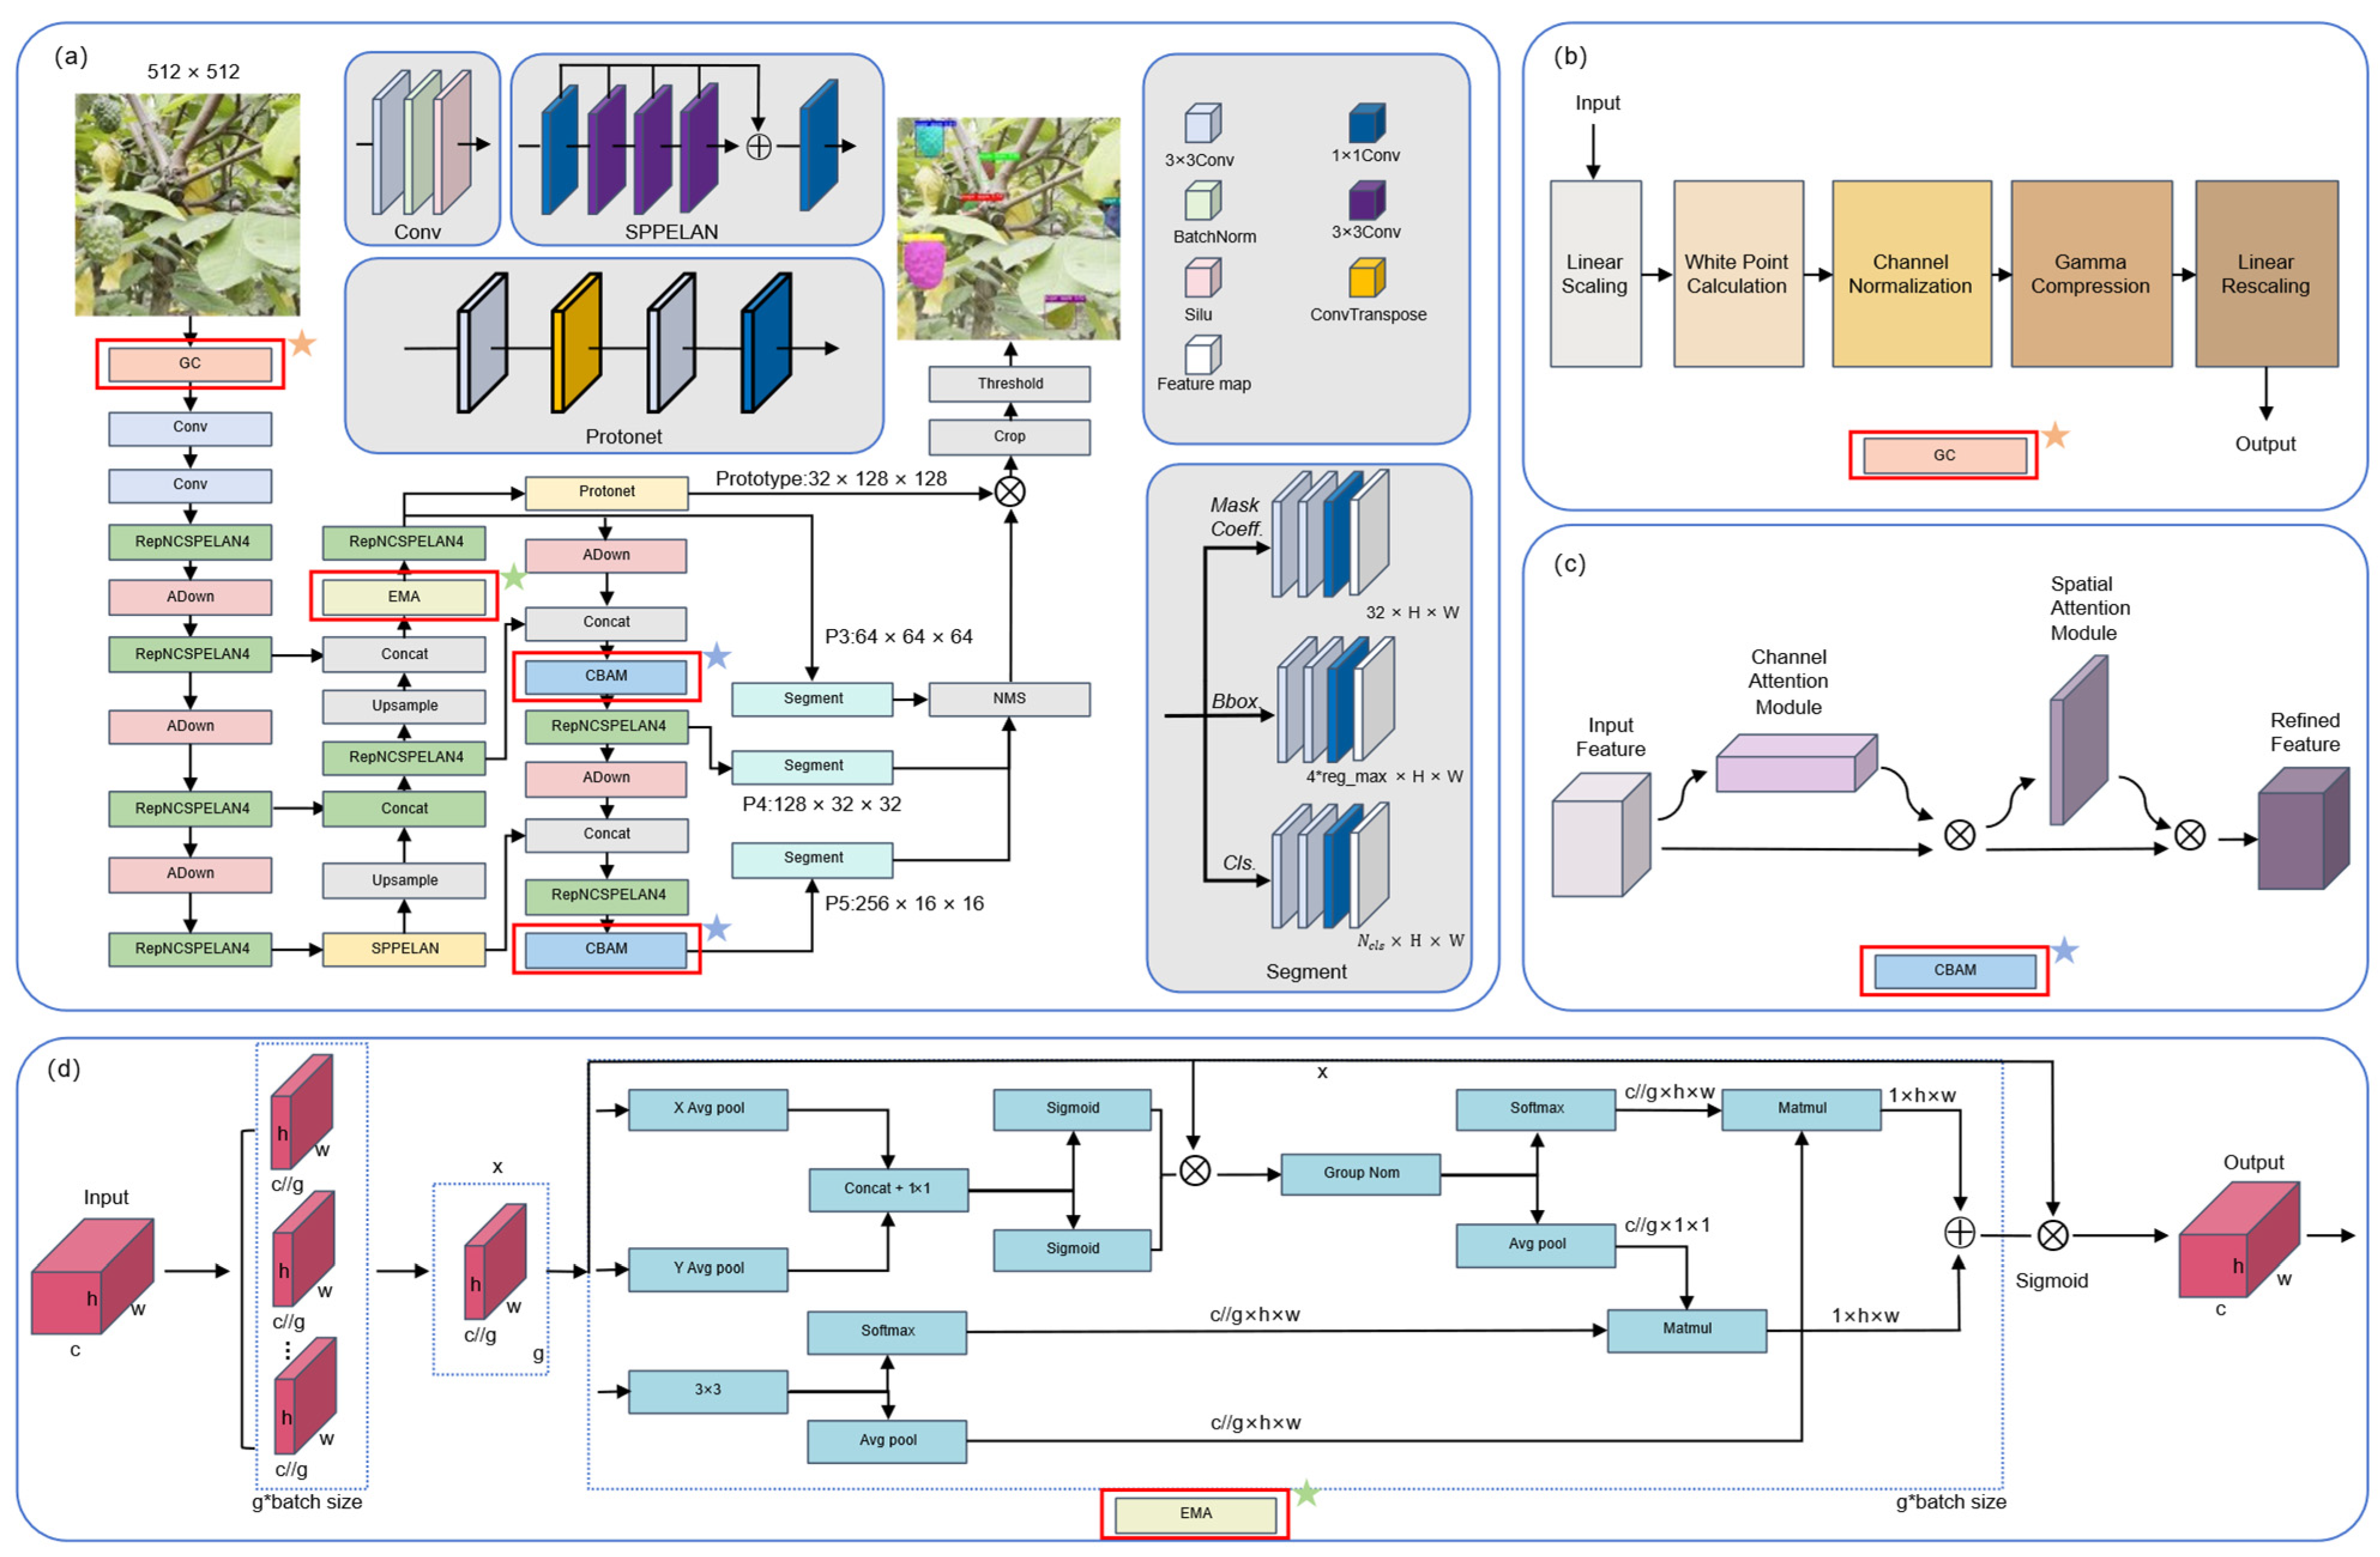
2.3. Architecture of the proposed GCE-YOLOv9-seg
- i.
- During the image input stage, a Gamma Correction (GC) image enhancement technique was employed to preprocess the orchard-acquired sugar apple images. By improving image brightness and contrast, this method enhances the model’s ability to distinguish target regions and extract critical features effectively.
- ii.
- After the fusion of the backbone feature map P3 and the upsampled features, an Efficient Multiscale Attention (EMA) module was introduced. This module strengthens the model’s capability to capture and express multi-scale spatial features from sugar apple images collected in complex orchard environments. Consequently, it enables a more accurate extraction of salient features from targets of varying scales and poses, improving recognition and segmentation performance in scenarios with dense distributions, occlusions, and varying lighting conditions.
- iii.
- After fusing backbone features P3 and P4, followed by downsampling and concatenation, a Convolutional Block Attention Module (CBAM) was incorporated to enhance the model’s sensitivity to medium-scale targets. Additionally, another CBAM was integrated after the RepNCSPELAN4 module, which follows the fusion of P4 and P5, to further strengthen the model’s attention to critical regions within deep semantic features.
| Algorithm 1: GCE-YOLOv9-seg: A Gamma Correction and Attention-Enhanced YOLOv9-seg for Sugar Apple Segmentation | |
| Input: Raw sugar apple RGB image I | |
| Output: Pixel-wise segmentation map O | |
| 1 | F1 ← Upsample (F2, P3); |
| 2 | {3, P4, P5} ← Backbone(I); // Extract multi-scale features |
| // Feature map resolution details: | |
| // P3: stage 3, stride 8 | |
| // P4: stage 5, stride 16 | |
| // P5: stage 7, stride 32 | |
| 3 | F1 ← Upsample (F2, P3); |
| 4 | F1 ← Concat(F1, P4); |
| 5 | F1 ← RepNCSPELAN4(F1); |
| 6 | F2 ← Upsample(F1); |
| 7 | F2 ← Concat (F2, P3); |
| 8 | F2 ← EMA(F2); // EMA fusion after P4 ↑ +P3 |
| 9 | P3seg ← RepNCSPELAN4(F2); |
| 10 | P3ds ← Adown (P3seg); |
| 11 | P4seg ← Concat (P3ds, F1); |
| 12 | P4seg ← CBAM (P4seg); // CBAM after P3 ↓ +F1 |
| 13 | P4seg ← RepNCSPELAN4(P4seg); |
| 14 | P4ds ← Adown (P4seg); |
| 15 | P5seg ← Concat (P4ds, P5); |
| 16 | P5seg ← RepNCSPELAN4(P5seg); |
| 17 | P5seg ← CBAM (P5seg); // CBAM after P4 ↓ +P5 |
| 18 | O ← Segment ([P3seg, P4seg, P5seg]); // Final segmentation output |
| 19 | return O |
2.3.1. Gamma Correction (GC)
2.3.2. Convolutional Block Attention Module (CBAM)
2.3.3. Efficient Multiscale Attention (EMA)
2.4. Evaluation Indicators
2.5. Loss Function
3. Results
3.1. Experiment Details
3.2. Baseline Model Results
3.2.1. Quantitative Analysis of the Baseline Model
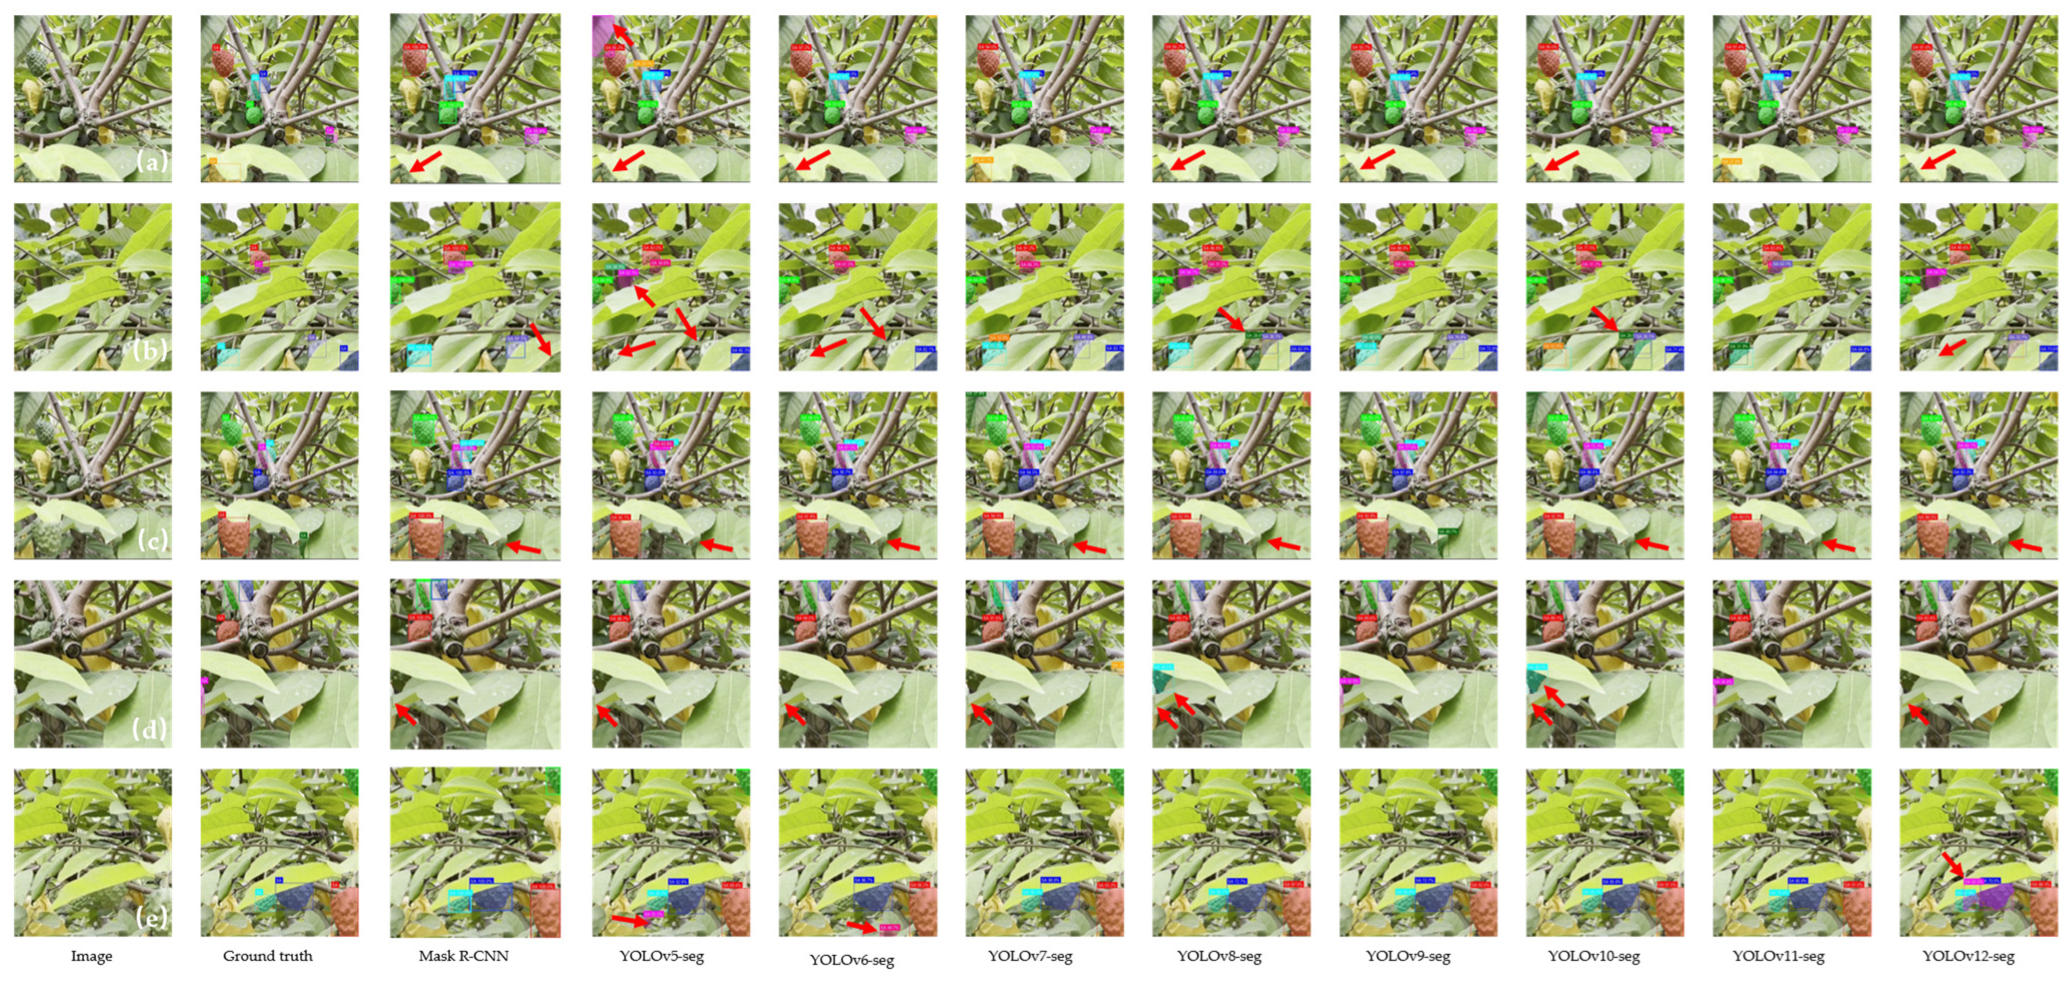
3.2.2. Qualitative Analysis of the Baseline Model
3.3. Backbone Replacement Results
3.4. Image Enhancement Results
3.4.1. Quantitative Analysis of the Image Enhancement Experiment
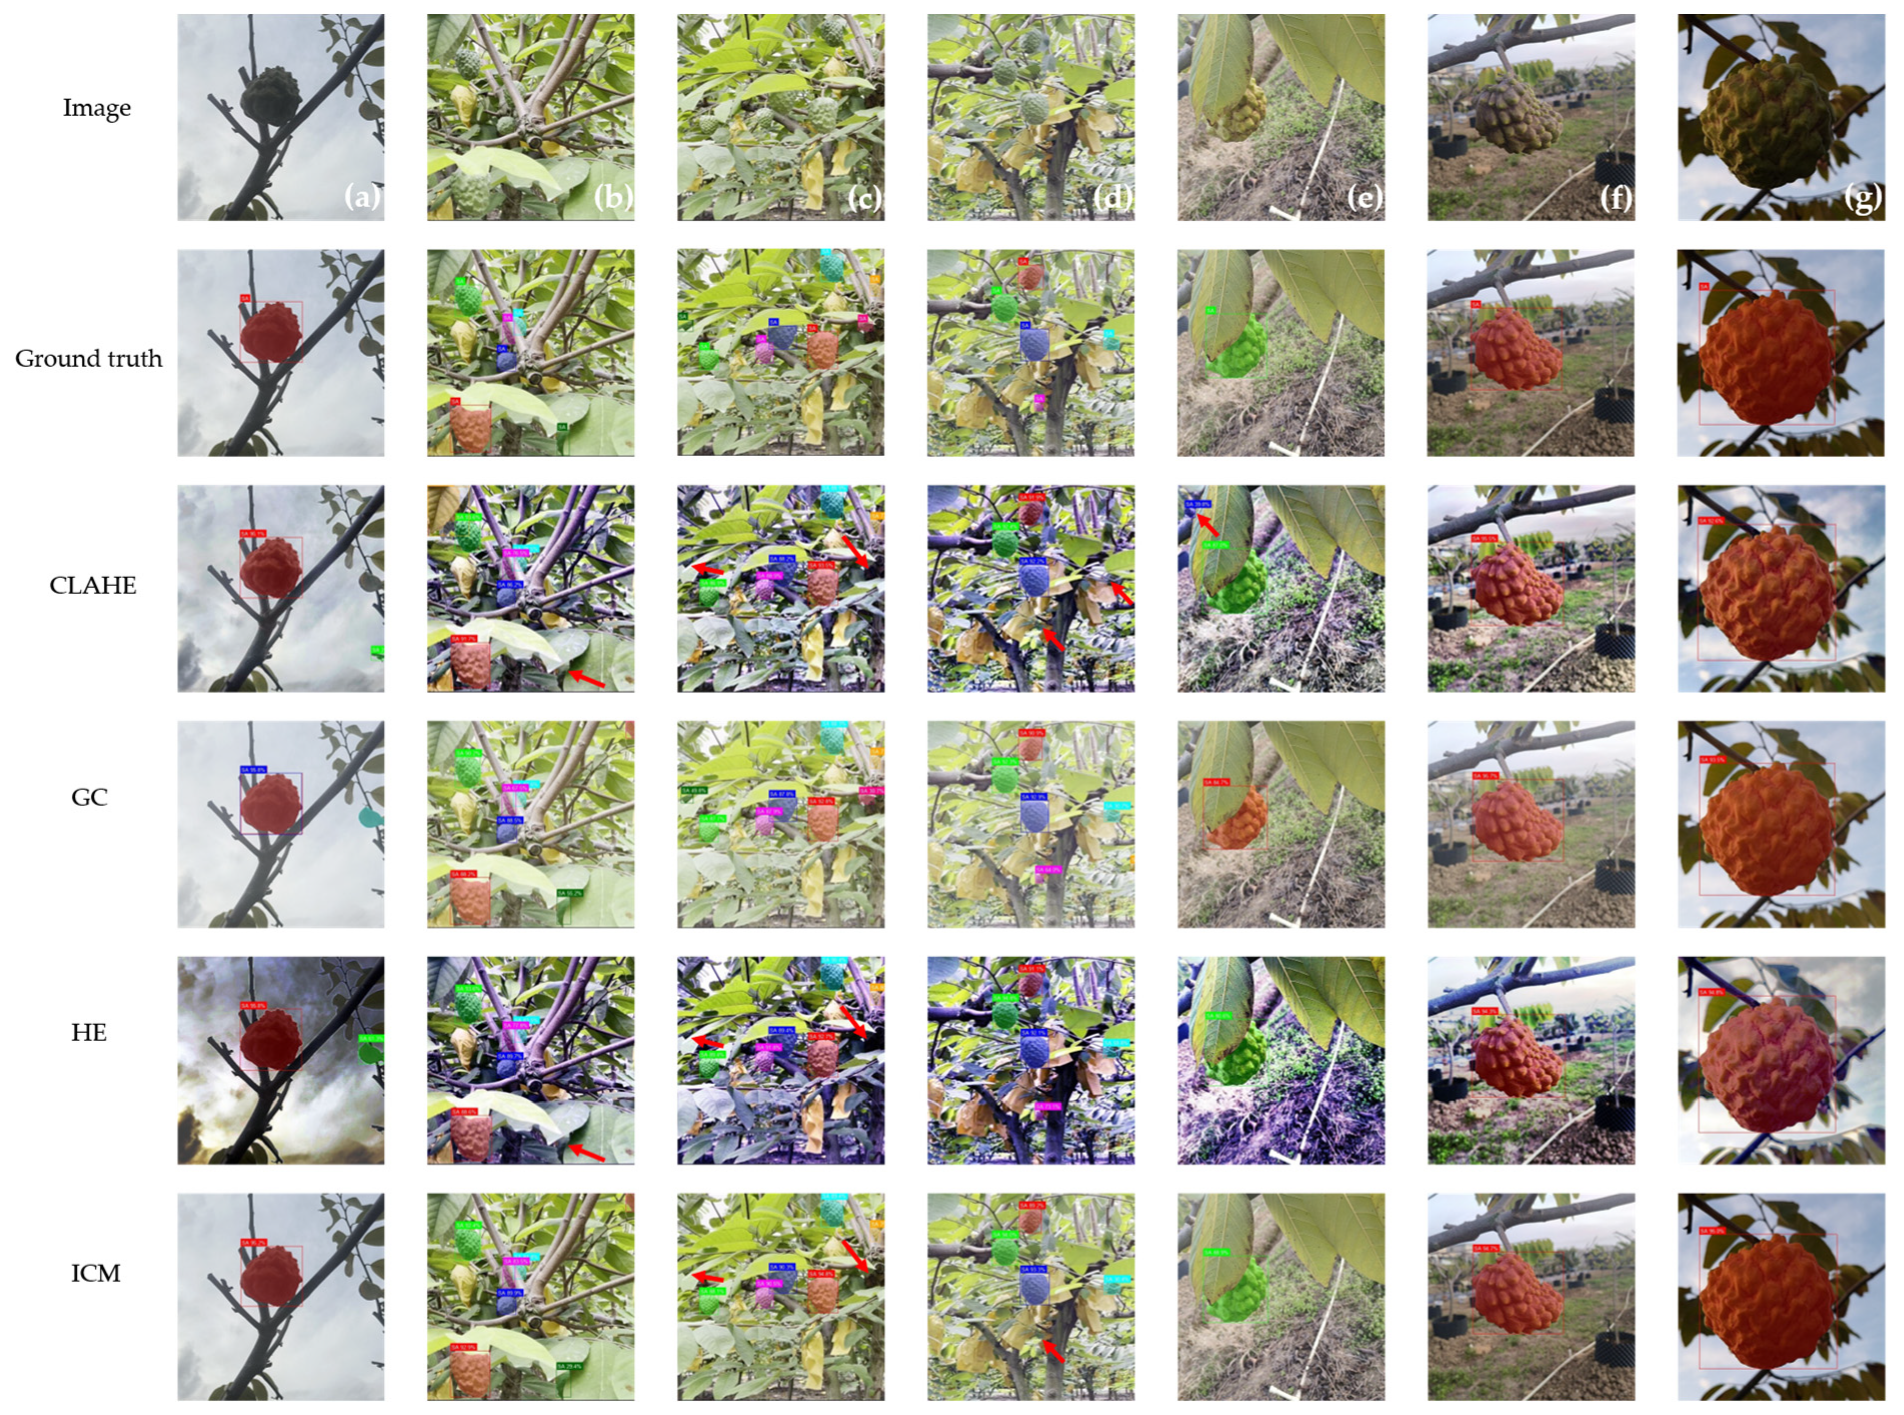
3.4.2. Qualitative Analysis of the Image Enhancement Experiment
3.5. YOLOv9-seg Before and After Improvement Results
3.5.1. Quantitative Analysis of the Improved YOLOv9-seg
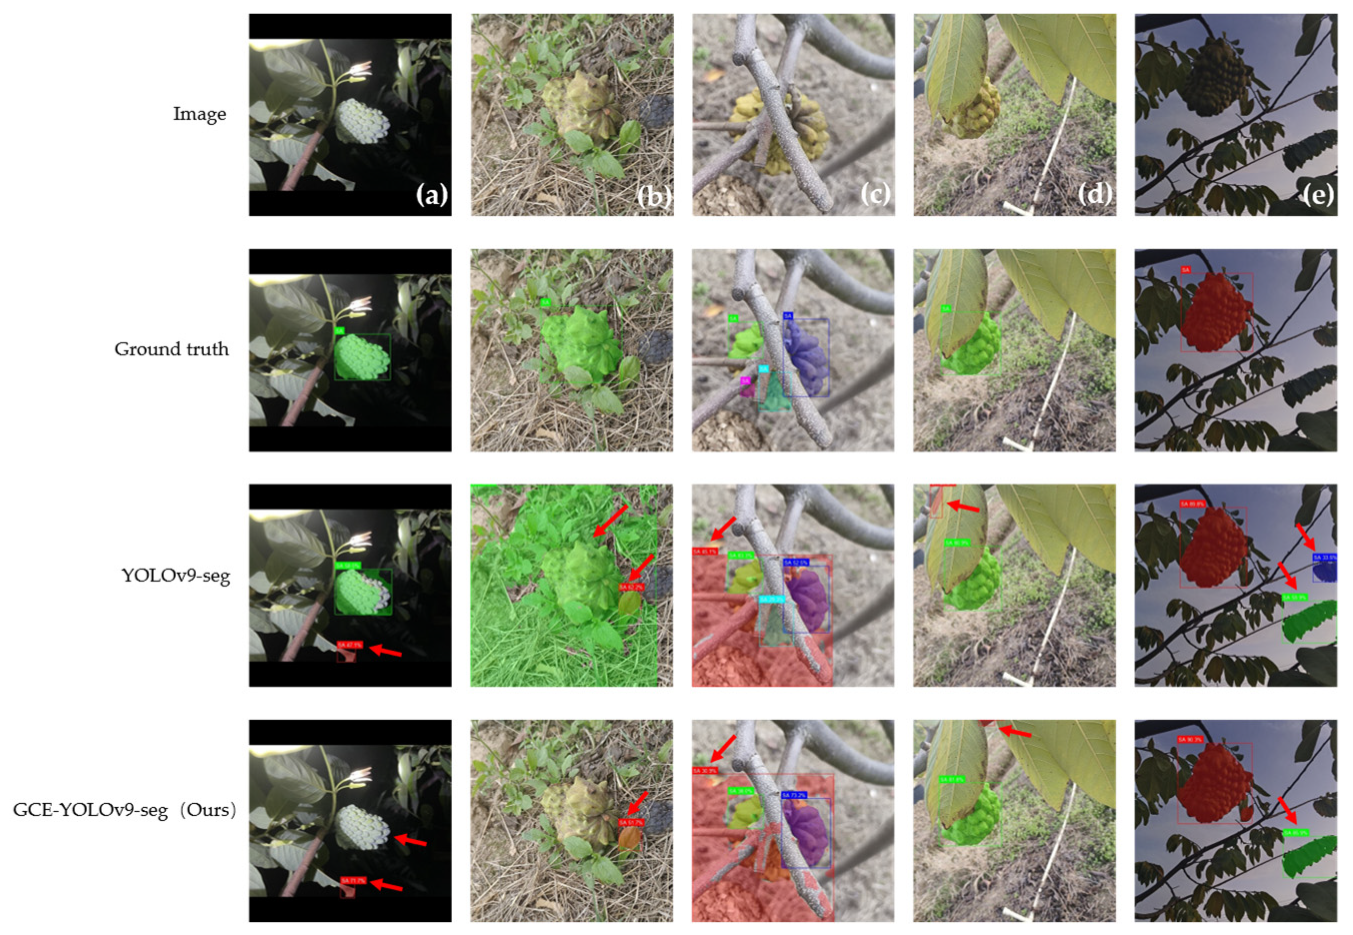
3.5.2. Qualitative Analysis of the GCE-YOLOv9-seg
3.6. Ablation Analysis
3.6.1. Ablation Analysis of Gamma Correction
3.6.2. Ablation Analysis of the GCE-YOLOv9-seg
3.7. Sensitive Analysis
3.7.1. Sensitive Analysis of the Batch Size
3.7.2. Sensitive Analysis of the Initial Learning Rate
3.8. Generalizability Analysis
4. Discussion
5. Conclusions
Author Contributions
Funding
Institutional Review Board Statement
Data Availability Statement
Acknowledgments
Conflicts of Interest
References
- Shehata, M.G.; Abu-Serie, M.M.; Abd El-Aziz, N.M.; El-Sohaimy, S.A. Nutritional, phytochemical, and in vitro anticancer potential of sugar apple (Annona squamosa) fruits. Sci. Rep. 2021, 11, 6224. [Google Scholar] [CrossRef] [PubMed]
- Van Damme, P.; Scheldeman, X. Commercial development of cherimoya (Annona cherimola Mill.) in Latin America. In Proceedings of the First International Symposium on Cherimoya 497, Loja, Ecuador, 16–19 March 1999; pp. 17–42. [Google Scholar]
- Pargi Sanjay, J.; Gupta, P.; Balas, P.; Bambhaniya, V. Comparison between manual harvesting and mechanical harvesting. J. Sci. Res. Rep. 2024, 30, 917–934. [Google Scholar]
- Anjom, F.K.; Vougioukas, S.G.; Slaughter, D.C. Development of a linear mixed model to predict the picking time in strawberry harvesting processes. Biosyst. Eng. 2018, 166, 76–89. [Google Scholar] [CrossRef]
- Gallardo, R.K.; Galinato, S.P. 2019 Cost Estimates of Establishing, Producing, and Packing Honeycrisp Apples in Washington; Washington State University Extension: Washington, DC, USA, 2020. [Google Scholar]
- Martinez-Romero, D.; Serrano, M.; Carbonell, A.; Castillo, S.; Riquelme, F.; Valero, D. Mechanical damage during fruit post-harvest handling: Technical and physiological implications. In Production Practices and Quality Assessment of Food Crops: Quality Handling and Evaluation; Springer: Berlin/Heidelberg, Germany, 2004; pp. 233–252. [Google Scholar]
- Hall, R.E. The process of inflation in the labor market. Brook. Pap. Econ. Act. 1974, 1974, 343–393. [Google Scholar] [CrossRef]
- King, R.G.; Watson, M.W. Inflation and unit labor cost. J. Money Credit. Bank. 2012, 44, 111–149. [Google Scholar] [CrossRef]
- Xiao, F.; Wang, H.; Li, Y.; Cao, Y.; Lv, X.; Xu, G. Object detection and recognition techniques based on digital image processing and traditional machine learning for fruit and vegetable harvesting robots: An overview and review. Agronomy 2023, 13, 639. [Google Scholar] [CrossRef]
- Arivazhagan, S.; Shebiah, R.N.; Nidhyanandhan, S.S.; Ganesan, L. Fruit recognition using color and texture features. J. Emerg. Trends Comput. Inf. Sci. 2010, 1, 90–94. [Google Scholar]
- Tan, S.H.; Lam, C.K.; Kamarudin, K.; Ismail, A.H.; Rahim, N.A.; Azmi, M.S.M.; Yahya, W.M.N.W.; Sneah, G.K.; Seng, M.L.; Hai, T.P. Vision-based edge detection system for fruit recognition. J. Phys. Conf. Ser. 2021, 2107, 012066. [Google Scholar] [CrossRef]
- Jana, S.; Parekh, R. Shape-based fruit recognition and classification. In Proceedings of the International Conference on Computational Intelligence, Communications, and Business Analytics, Kolkata, India, 24–25 March 2017; pp. 184–196. [Google Scholar]
- Moreda, G.; Muñoz, M.; Ruiz-Altisent, M.; Perdigones, A. Shape determination of horticultural produce using two-dimensional computer vision—A review. J. Food Eng. 2012, 108, 245–261. [Google Scholar] [CrossRef]
- Mehl, P.; Chao, K.; Kim, M.; Chen, Y. Detection of defects on selected apple cultivars using hyperspectral and multispectral image analysis. Appl. Eng. Agric. 2002, 18, 219. [Google Scholar]
- Mehl, P.M.; Chen, Y.-R.; Kim, M.S.; Chan, D.E. Development of hyperspectral imaging technique for the detection of apple surface defects and contaminations. J. Food Eng. 2004, 61, 67–81. [Google Scholar] [CrossRef]
- Sa, I.; Ge, Z.; Dayoub, F.; Upcroft, B.; Perez, T.; McCool, C. Deepfruits: A fruit detection system using deep neural networks. Sensors 2016, 16, 1222. [Google Scholar] [CrossRef] [PubMed]
- Bargoti, S.; Underwood, J. Deep fruit detection in orchards. In Proceedings of the 2017 IEEE International Conference on Robotics and Automation (ICRA), Singapore, 29 May–3 June 2017; pp. 3626–3633. [Google Scholar]
- Rahnemoonfar, M.; Sheppard, C. Real-time yield estimation based on deep learning. In Proceedings of the Autonomous Air and Ground Sensing Systems for Agricultural Optimization and Phenotyping II, Anaheim, CA, USA, 10–11 April 2017; pp. 59–65. [Google Scholar]
- Fawzia Rahim, U.; Mineno, H. Highly accurate tomato maturity recognition: Combining deep instance segmentation, data synthesis and color analysis. In Proceedings of the 2021 4th Artificial Intelligence and Cloud Computing Conference, Kyoto, Japan, 17–19 December 2021; pp. 16–23. [Google Scholar]
- Wang, D.; He, D. Fusion of Mask RCNN and attention mechanism for instance segmentation of apples under complex background. Comput. Electron. Agric. 2022, 196, 106864. [Google Scholar] [CrossRef]
- Yang, L.; Wei, Y.Z.; He, Y.; Sun, W.; Huang, Z.; Huang, H.; Fan, H. ishape: A first step towards irregular shape instance segmentation. arXiv 2021, arXiv:2109.15068. [Google Scholar]
- Yaseen, M. What is yolov9: An in-depth exploration of the internal features of the next-generation object detector. arXiv 2024, arXiv:2409.07813. [Google Scholar]
- Sapkota, R.; Ahmed, D.; Karkee, M. Comparing YOLOv8 and Mask R-CNN for instance segmentation in complex orchard environments. Artif. Intell. Agric. 2024, 13, 84–99. [Google Scholar] [CrossRef]
- Lu, D.; Wang, Y. MAR-YOLOv9: A multi-dataset object detection method for agricultural fields based on YOLOv9. PLoS ONE 2024, 19, e0307643. [Google Scholar] [CrossRef]
- Xie, Z.; Ke, Z.; Chen, K.; Wang, Y.; Tang, Y.; Wang, W. A Lightweight Deep Learning Semantic Segmentation Model for Optical-Image-Based Post-Harvest Fruit Ripeness Analysis of Sugar Apples (Annona squamosa). Agriculture 2024, 14, 591. [Google Scholar] [CrossRef]
- Sanchez, R.B.; Esteves, J.A.C.; Linsangan, N.B. Determination of sugar apple ripeness via image processing using convolutional neural network. In Proceedings of the 2023 15th International Conference on Computer and Automation Engineering (ICCAE), Sydney, Australia, 3–5 March 2023; pp. 333–337. [Google Scholar]
- Thite, S.; Patil, K.; Jadhav, R.; Suryawanshi, Y.; Chumchu, P. Empowering agricultural research: A comprehensive custard apple (Annona squamosa) disease dataset for precise detection. Data Brief 2024, 53, 110078. [Google Scholar] [CrossRef]
- Tonmoy, M.R.; Adnan, M.A.; Al Masud, S.M.R.; Safran, M.; Alfarhood, S.; Shin, J.; Mridha, M. Attention mechanism-based ultralightweight deep learning method for automated multi-fruit disease recognition system. Agron. J. 2025, 117, e70035. [Google Scholar] [CrossRef]
- Gaikwad, S.S.; Rumma, S.S.; Hangarge, M. Classification of Fungi Infected Annona Squamosa Plant Using CNN Architectures. In Proceedings of the International Conference on Soft Computing and Pattern Recognition, Online, 15–17 December 2021; pp. 170–177. [Google Scholar]
- Dong, Z.; Wang, J.; Sun, P.; Ran, W.; Li, Y. Mango variety classification based on convolutional neural network with attention mechanism and near-infrared spectroscopy. J. Food Meas. Charact. 2024, 18, 2237–2247. [Google Scholar] [CrossRef]
- Jrondi, Z.; Moussaid, A.; Hadi, M.Y. Exploring End-to-End object detection with transformers versus YOLOv8 for enhanced citrus fruit detection within trees. Syst. Soft Comput. 2024, 6, 200103. [Google Scholar] [CrossRef]
- Xiao, F.; Wang, H.; Xu, Y.; Zhang, R. Fruit detection and recognition based on deep learning for automatic harvesting: An overview and review. Agronomy 2023, 13, 1625. [Google Scholar] [CrossRef]
- Li, L.; Chan, P.; Deng, T.; Yang, H.-L.; Luo, H.-Y.; Xia, D.; He, Y.-Q. Review of advances in urban climate study in the Guangdong-Hong Kong-Macau greater bay area, China. Atmos. Res. 2021, 261, 105759. [Google Scholar] [CrossRef]
- Patrício, D.I.; Rieder, R. Computer vision and artificial intelligence in precision agriculture for grain crops: A systematic review. Comput. Electron. Agric. 2018, 153, 69–81. [Google Scholar] [CrossRef]
- Zhuang, Y.; Chen, W.; Jin, T.; Chen, B.; Zhang, H.; Zhang, W. A review of computer vision-based structural deformation monitoring in field environments. Sensors 2022, 22, 3789. [Google Scholar] [CrossRef]
- Metaxas, D.N. Physics-Based Deformable Models: Applications to Computer Vision, Graphics and Medical Imaging; Springer Science & Business Media: Berlin/Heidelberg, Germany, 2012; Volume 389. [Google Scholar]
- Redmon, J.; Divvala, S.; Girshick, R.; Farhadi, A. You only look once: Unified, real-time object detection. In Proceedings of the IEEE Conference on Computer Vision and Pattern Recognition, Las Vegas, NV, USA, 26 June–1 July 2016; pp. 779–788. [Google Scholar]
- Qi, Y.; Yang, Z.; Sun, W.; Lou, M.; Lian, J.; Zhao, W.; Deng, X.; Ma, Y. A comprehensive overview of image enhancement techniques. Arch. Comput. Methods Eng. 2021, 29, 583–607. [Google Scholar] [CrossRef]
- Reza, A.M. Realization of the contrast limited adaptive histogram equalization (CLAHE) for real-time image enhancement. J. VLSI Signal Process. Syst. Signal Image Video Technol. 2004, 38, 35–44. [Google Scholar] [CrossRef]
- Rahman, S.; Rahman, M.M.; Abdullah-Al-Wadud, M.; Al-Quaderi, G.D.; Shoyaib, M. An adaptive gamma correction for image enhancement. EURASIP J. Image Video Process. 2016, 2016, 35. [Google Scholar] [CrossRef]
- Pizer, S.M.; Amburn, E.P.; Austin, J.D.; Cromartie, R.; Geselowitz, A.; Greer, T.; ter Haar Romeny, B.; Zimmerman, J.B.; Zuiderveld, K. Adaptive histogram equalization and its variations. Comput. Vis. Graph. Image Process. 1987, 39, 355–368. [Google Scholar] [CrossRef]
- Iqbal, K.; Salam, R.A.; Osman, A.; Talib, A.Z. Underwater image enhancement using an integrated colour model. IAENG Int. J. Comput. Sci. 2007, 34, 239–244. [Google Scholar]
- Woo, S.; Park, J.; Lee, J.-Y.; Kweon, I.S. Cbam: Convolutional block attention module. In Proceedings of the European Conference on Computer Vision (ECCV), Munich, Germany, 8–14 September 2018; pp. 3–19. [Google Scholar]
- Ouyang, D.; He, S.; Zhang, G.; Luo, M.; Guo, H.; Zhan, J.; Huang, Z. Efficient multi-scale attention module with cross-spatial learning. In Proceedings of the ICASSP 2023—2023 IEEE International Conference on Acoustics, Speech and Signal Processing (ICASSP), Rhodes Island, Greece, 4–9 June 2023; pp. 1–5. [Google Scholar]
- He, K.; Gkioxari, G.; Dollár, P.; Girshick, R. Mask r-cnn. In Proceedings of the IEEE International Conference on Computer Vision, Venice, Italy, 22–29 October 2017; pp. 2961–2969. [Google Scholar]
- Jocher, G.; Stoken, A.; Borovec, J.; Changyu, L.; Hogan, A.; Diaconu, L.; Poznanski, J.; Yu, L.; Rai, P.; Ferriday, R. ultralytics/yolov5, v3.0; Zenodo: Geneva, Switzerland, 2020. [Google Scholar]
- Li, C.; Li, L.; Jiang, H.; Weng, K.; Geng, Y.; Li, L.; Ke, Z.; Li, Q.; Cheng, M.; Nie, W. YOLOv6: A single-stage object detection framework for industrial applications. arXiv 2022, arXiv:2209.02976. [Google Scholar]
- Wang, C.-Y.; Bochkovskiy, A.; Liao, H.-Y.M. YOLOv7: Trainable bag-of-freebies sets new state-of-the-art for real-time object detectors. In Proceedings of the IEEE/CVF Conference on Computer Vision and Pattern Recognition, Vancouver, BC, Canada, 17–24 June 2023; pp. 7464–7475. [Google Scholar]
- Reis, D.; Kupec, J.; Hong, J.; Daoudi, A. Real-time flying object detection with YOLOv8. arXiv 2023, arXiv:2305.09972. [Google Scholar]
- Wang, C.-Y.; Yeh, I.-H.; Mark Liao, H.-Y. Yolov9: Learning what you want to learn using programmable gradient information. In Proceedings of the European Conference on Computer Vision, Milan, Italy, 29 September–4 October 2024; pp. 1–21. [Google Scholar]
- Wang, A.; Chen, H.; Liu, L.; Chen, K.; Lin, Z.; Han, J. Yolov10: Real-time end-to-end object detection. Adv. Neural Inf. Process. Syst. 2024, 37, 107984–108011. [Google Scholar]
- Khanam, R.; Hussain, M. Yolov11: An overview of the key architectural enhancements. arXiv 2024, arXiv:2410.17725. [Google Scholar]
- Tian, Y.; Ye, Q.; Doermann, D. Yolov12: Attention-centric real-time object detectors. arXiv 2025, arXiv:2502.12524. [Google Scholar]
- Sandler, M.; Howard, A.; Zhu, M.; Zhmoginov, A.; Chen, L.-C. Mobilenetv2: Inverted residuals and linear bottlenecks. In Proceedings of the IEEE Conference on Computer Vision and Pattern Recognition, Lake City, UT, USA, 18–22 June 2018; pp. 4510–4520. [Google Scholar]
- Tan, M.; Le, Q. Efficientnet: Rethinking model scaling for convolutional neural networks. In Proceedings of the International Conference on Machine Learning, Long Beach, CA, USA, 9–15 June 2019; pp. 6105–6114. [Google Scholar]
- Gan, Y.Q.; Zhang, H.; Liu, W.H.; Ma, J.M.; Luo, Y.M.; Pan, Y.S. Local-global feature fusion network for hyperspectral image classification. Int. J. Remote Sens. 2024, 45, 8548–8575. [Google Scholar] [CrossRef]
- Cui, C.; Gao, T.; Wei, S.; Du, Y.; Guo, R.; Dong, S.; Lu, B.; Zhou, Y.; Lv, X.; Liu, Q. PP-LCNet: A lightweight CPU convolutional neural network. arXiv 2021, arXiv:2109.15099. [Google Scholar]
- Wang, A.; Chen, H.; Lin, Z.; Han, J.; Ding, G. Repvit: Revisiting mobile cnn from vit perspective. In Proceedings of the IEEE/CVF Conference on Computer Vision and Pattern Recognition, Seattle, WA, USA, 17–21 June 2024; pp. 15909–15920. [Google Scholar]
- Chen, J.; Kao, S.-h.; He, H.; Zhuo, W.; Wen, S.; Lee, C.-H.; Chan, S.-H.G. Run, don’t walk: Chasing higher FLOPS for faster neural networks. In Proceedings of the IEEE/CVF Conference on Computer Vision and Pattern Recognition, Vancouver, BC, Canada, 17–24 June 2023; pp. 12021–12031. [Google Scholar]
- Han, K.; Wang, Y.; Tian, Q.; Guo, J.; Xu, C.; Xu, C. Ghostnet: More features from cheap operations. In Proceedings of the IEEE/CVF Conference on Computer Vision and Pattern Recognition, Seattle, WA, USA, 13–19 June 2020; pp. 1580–1589. [Google Scholar]
- Liao, J.; Wang, Y.; Zhu, D.; Zou, Y.; Zhang, S.; Zhou, H. Automatic segmentation of crop/background based on luminance partition correction and adaptive threshold. IEEE Access 2020, 8, 202611–202622. [Google Scholar] [CrossRef]
- Zilvan, V.; Ramdan, A.; Supianto, A.A.; Heryana, A.; Arisal, A.; Yuliani, A.R.; Krisnandi, D.; Suryawati, E.; Kusumo, R.B.S.; Yuawana, R.S. Automatic detection of crop diseases using gamma transformation for feature learning with a deep convolutional autoencoder. J. Teknol. Dan Sist. Komput. 2024, 10. [Google Scholar]
- Sharma, A.; Kumar, V.; Longchamps, L. Comparative performance of YOLOv8, YOLOv9, YOLOv10, YOLOv11 and Faster R-CNN models for detection of multiple weed species. Smart Agric. Technol. 2024, 9, 100648. [Google Scholar] [CrossRef]
- Wang, G.; Gao, Y.; Xu, F.; Sang, W.; Han, Y.; Liu, Q. A Banana Ripeness Detection Model Based on Improved YOLOv9c Multifactor Complex Scenarios. Symmetry 2025, 17, 231. [Google Scholar] [CrossRef]
- Li, X.; Liu, M.; Ling, Q. Pixel-wise gamma correction mapping for low-light image enhancement. IEEE Trans. Circuits Syst. Video Technol. 2023, 34, 681–694. [Google Scholar] [CrossRef]
- Weng, S.-E.; Miaou, S.-G.; Christanto, R.; Hsu, C.-P. Exposure Correction in Driving Scenes Using the Atmospheric Scattering Model. In Proceedings of the 2024 International Conference on Consumer Electronics-Taiwan (ICCE-Taiwan), Taichung, Taiwan, 9–11 July 2024; pp. 493–494. [Google Scholar]
- Tommandru, S.; Sandanam, D. Low-illumination image contrast enhancement using adaptive gamma correction and deep learning model for person identification and verification. J. Electron. Imaging 2023, 32, 053018. [Google Scholar] [CrossRef]
- Li, C.; Zhu, J.; Bi, L.; Zhang, W.; Liu, Y. A low-light image enhancement method with brightness balance and detail preservation. PLoS ONE 2022, 17, e0262478. [Google Scholar] [CrossRef]
- Guo, J.; Ma, J.; García-Fernández, Á.F.; Zhang, Y.; Liang, H. A survey on image enhancement for Low-light images. Heliyon 2023, 9, e14558. [Google Scholar] [CrossRef]
- Liu, T.; Yuan, Y.; Teng, G.; Meng, X. Improved Deep Convolutional Neural Network-Based Method for Detecting Winter Jujube Fruit in Orchards. Eng. Lett. 2024, 32, 569–578. [Google Scholar]
- De Moraes, J.L.; de Oliveira Neto, J.; Badue, C.; Oliveira-Santos, T.; de Souza, A.F. Yolo-Papaya: A papaya fruit disease detector and classifier using CNNs and convolutional block attention modules. Electronics 2023, 12, 2202. [Google Scholar] [CrossRef]
- Tang, R.; Lei, Y.; Luo, B.; Zhang, J.; Mu, J. YOLOv7-Plum: Advancing plum fruit detection in natural environments with deep learning. Plants 2023, 12, 2883. [Google Scholar] [CrossRef]
- Wang, Q.; Wu, B.; Zhu, P.; Li, P.; Zuo, W.; Hu, Q. ECA-Net: Efficient channel attention for deep convolutional neural networks. In Proceedings of the IEEE/CVF Conference on Computer Vision and Pattern Recognition, Seattle, WA, USA, 13–19 June 2020; pp. 11534–11542. [Google Scholar]
- Chen, J.; Ma, A.; Huang, L.; Li, H.; Zhang, H.; Huang, Y.; Zhu, T. Efficient and lightweight grape and picking point synchronous detection model based on key point detection. Comput. Electron. Agric. 2024, 217, 108612. [Google Scholar] [CrossRef]
- Liu, W.; Wang, S.; Gao, X.; Yang, H. A Tomato Recognition and Rapid Sorting System Based on Improved YOLOv10. Machines 2024, 12, 689. [Google Scholar] [CrossRef]
- Negi, A.; Kumar, K. Classification and detection of citrus diseases using deep learning. In Data Science and Its Applications; Chapman and Hall/CRC: Boca Raton, FL, USA, 2021; pp. 63–85. [Google Scholar]
- Sangeetha, K.; Rima, P.; Pranesh Kumar, M.; Preethees, S. Apple leaf disease detection using deep learning. In Proceedings of the 2022 6th International Conference on Computing Methodologies and Communication (ICCMC), Erode, India, 29–31 March 2022; pp. 1063–1067. [Google Scholar]
- Yue, Y.; Cui, S.; Shan, W. Apple detection in complex environment based on improved YOLOv8n. Eng. Res. Express 2024, 6, 045259. [Google Scholar] [CrossRef]
- Zhang, R.; Huang, Z.; Zhang, Y.; Xue, Z.; Li, X. Msgv-yolov7: A lightweight pineapple detection method. Agriculture 2023, 14, 29. [Google Scholar] [CrossRef]
- Anandakrishnan, J.; Sangaiah, A.K.; Darmawan, H.; Son, N.K.; Lin, Y.-B.; Alenazi, M.J. Precise Spatial Prediction of Rice Seedlings From Large Scale Airborne Remote Sensing Data Using Optimized Li-YOLOv9. IEEE J. Sel. Top. Appl. Earth Obs. Remote Sens. 2024, 18, 2226–2238. [Google Scholar] [CrossRef]
- Gao, F.; Fang, W.; Sun, X.; Wu, Z.; Zhao, G.; Li, G.; Li, R.; Fu, L.; Zhang, Q. A novel apple fruit detection and counting methodology based on deep learning and trunk tracking in modern orchard. Comput. Electron. Agric. 2022, 197, 107000. [Google Scholar] [CrossRef]
- Chen, Y.; Pan, J.; Wu, Q. Apple leaf disease identification via improved CycleGAN and convolutional neural network. Soft Comput. 2023, 27, 9773–9786. [Google Scholar] [CrossRef]
- Tang, Y.; Chen, M.; Wang, C.; Luo, L.; Li, J.; Lian, G.; Zou, X. Recognition and localization methods for vision-based fruit picking robots: A review. Front. Plant Sci. 2020, 11, 510. [Google Scholar] [CrossRef]


| Category | Train | Val | Test | Total |
|---|---|---|---|---|
| Frontal lighting | 128 | 62 | 59 | 249 |
| Backside lighting | 109 | 22 | 27 | 158 |
| Obscured by foliage | 410 | 131 | 130 | 671 |
| Total | 647 | 215 | 216 | 1078 |
| Parameter | Configuration |
|---|---|
| CPU | Intel Xeon E5-2678 V3 processor |
| GPU | NVIDIA GeForce RTX 3090 |
| CUDA version | CUDA 12.2 |
| Operating system | Windows 10 |
| Programming language | Python 3.10 |
| Deep learning framework | Pytorch 2.6.0 |
| Parameter | Setting |
|---|---|
| Epoch | 100 |
| Batch Size | 16 |
| Optimizer | SGD |
| Initial Learning Rate | 1 × 10⁻² |
| Learning Rate Factor | 1 × 10⁻² |
| Model | F1 | P | R | Segment mAP@0.5 | Segment mAP@[0.5:0.95] | Params (M) | GFLOPs |
|---|---|---|---|---|---|---|---|
| Mask R-CNN | 82.9% | 84.2% | 81.6% | 91.6% | 75.8% | 43.9 | 133.08 |
| YOLOv5-seg | 85.1% | 88.4% | 82.0% | 88.4% | 63.2% | 1.88 | 6.9 |
| YOLOv6-seg | 88.3% | 90.4% | 86.4% | 92.0% | 70.9% | 4.00 | 7 |
| YOLOv7-seg | 88.5% | 89.5% | 87.6% | 92.3% | 67.6% | 37.87 | 142.6 |
| YOLOv8-seg | 87.5% | 89.3% | 85.8% | 91.0% | 67.1% | 3.26 | 12.1 |
| YOLOv9-seg | 88.5% | 90.4% | 86.6% | 93.1% | 72.2% | 27.36 | 144.2 |
| YOLOv10-seg | 87.5% | 90.4% | 84.8% | 90.9% | 66.0% | 2.85 | 11.8 |
| YOLOv11-seg | 87.9% | 89.4% | 86.4% | 90.8% | 65.9% | 2.84 | 10.4 |
| YOLOv12-seg | 87.2% | 90.0% | 84.6% | 89.6% | 65.3% | 2.82 | 10.4 |
| Backbone | F1 | P | R | Segment mAP@0.5 | Segment mAP@[0.5:0.95] | Params (M) | GFLOPs |
|---|---|---|---|---|---|---|---|
| Original | 88.5% | 90.4% | 86.6% | 93.1% | 72.2% | 27.36 | 144.2 |
| MobileNetV2 | 88.6% | 90.3% | 86.9% | 92.5% | 71.2% | 21.34 | 106.6 |
| MobileNetV3 | 87.3% | 90.2% | 84.5% | 90.7% | 66.8% | 19.83 | 102.4 |
| MobileNetV4 | 86.9% | 90.1% | 84.0% | 89.7% | 65.3% | 21.61 | 105.5 |
| EfficientNet | 88.6% | 90.7% | 86.6% | 92.3% | 71.9% | 23.12 | 108.6 |
| StarNet | 86.7% | 91.8% | 82.1% | 88.2% | 63.8% | 19.09 | 101.8 |
| LCNetV2 | 85.9% | 91.2% | 81.1% | 88.9% | 64.9% | 23.42 | 113 |
| RepViT | 89.1% | 89.8% | 88.4% | 92.7% | 70.4% | 23.66 | 115.4 |
| FasterNet | 88.5% | 89.8% | 87.3% | 92.5% | 70.9% | 31.88 | 133.4 |
| GhostNetv1 | 89.4% | 88.8% | 90.0% | 92.4% | 71.3% | 21.71 | 104.9 |
| Algorithm | F1 | P | R | Segment mAP@0.5 | Segment mAP@[0.5:0.95] |
|---|---|---|---|---|---|
| Original | 88.5% | 90.4% | 86.6% | 93.1% | 72.2% |
| CLAHE | 88.7% | 90.2% | 87.3% | 93.3% | 73.0% |
| GC | 89.6% | 90.3% | 88.9% | 93.1% | 72.7% |
| HE | 88.6% | 88.7% | 88.6% | 93.1% | 72.6% |
| ICM | 89.4% | 90.3% | 88.6% | 93.4% | 72.9% |
| Model | F1 | P | R | Segment mAP@0.5 | Segment mAP@[0.5:0.95] | Params (M) | GFLOPs |
|---|---|---|---|---|---|---|---|
| YOLOv9-seg | 88.5% | 90.4% | 86.6% | 93.1% | 72.2% | 27.36 | 144.2 |
| GCE-YOLOv9-seg | 90.0% | 90.4% | 89.6% | 93.4% | 73.2% | 27.95 | 162 |
| Value of Gamma | F1 | P | R | Segment mAP@0.5 | Segment mAP@[0.5:0.95] |
|---|---|---|---|---|---|
| 0.1 | 86.1% | 88.0% | 84.3% | 90.5% | 66.4% |
| 0.2 | 89.0% | 91.2% | 86.9% | 92.1% | 70.3% |
| 0.3 | 89.5% | 91.4% | 87.6% | 92.1% | 70.8% |
| 0.4 | 89.0% | 91.5% | 86.7% | 92.4% | 71.1% |
| 0.5 | 89.7% | 91.0% | 88.4% | 93.0% | 73.1% |
| 0.6 | 89.4% | 91.6% | 87.3% | 93.0% | 72.8% |
| 0.7 | 90.0% | 90.4% | 89.6% | 93.4% | 73.2% |
| 0.8 | 89.4% | 91.3% | 87.5% | 93.0% | 73.0% |
| 0.9 | 89.5% | 89.4% | 89.6% | 93.1% | 73.7% |
| 1.0 | 89.8% | 90.1% | 89.5% | 92.8% | 72.7% |
| Method | GC | CBAM | EMA | F1 | P | R | Segment mAP@0.5 | Segment mAP@[0.5:0.95] | Params (M) | Flops (G) |
|---|---|---|---|---|---|---|---|---|---|---|
| (1) | 88.5% | 90.4% | 86.6% | 93.1% | 72.2% | 27.36 | 144.2 | |||
| (2) | √ | 89.6% | 90.3% | 88.9% | 93.1% | 72.7% | 27.36 | 144.2 | ||
| (3) | √ | 89.5% | 91.8% | 87.3% | 93.6% | 72.9% | 27.79 | 146 | ||
| (4) | √ | 89.6% | 90.1% | 89.2% | 93.8% | 73.1% | 27.74 | 161.7 | ||
| (5) | √ | √ | 89.8% | 90.6% | 89.1% | 93.2% | 71.7% | 27.79 | 146 | |
| (6) | √ | √ | 89.6% | 89.9% | 89.4% | 93.1% | 72.1% | 27.74 | 161.7 | |
| (7) | √ | √ | 89.4% | 90.1% | 88.8% | 93.4% | 72.9% | 27.95 | 162 | |
| (8) | √ | √ | √ | 90.0% | 90.4% | 89.6% | 93.4% | 73.2% | 27.95 | 162 |
| Value of Batch Size | F1 | P | R | Segment mAP@0.5 | Segment mAP@[0.5:0.95] |
|---|---|---|---|---|---|
| 4 | 88.4% | 89.1% | 87.8% | 92.7% | 71.7% |
| 8 | 89.5% | 90.2% | 88.9% | 93.2% | 72.5% |
| 16 | 90.0% | 90.4% | 89.6% | 93.4% | 73.2% |
| 32 | 89.9% | 88.8% | 91.0% | 93.2% | 73.3% |
| Value of Initial Learning Rate | F1 | P | R | Segment mAP@0.5 | Segment mAP@[0.5:0.95] |
|---|---|---|---|---|---|
| 0.002 | 86.9% | 88.3% | 85.5% | 90.2% | 63.8% |
| 0.005 | 87.8% | 88.2% | 87.5% | 91.9% | 70.0% |
| 0.01 | 90.0% | 90.4% | 89.6% | 93.4% | 73.2% |
| 0.02 | 89.6% | 90.6% | 88.6% | 93.5% | 73.6% |
| 0.05 | 89.0% | 91.3% | 86.9% | 92.0% | 70.2% |
| Model | F1 | P | R | Segment mAP@0.5 | Segment mAP@[0.5:0.95] | Params (M) | GFLOPs |
|---|---|---|---|---|---|---|---|
| YOLOv9-seg | 95.1% | 93.1% | 97.2% | 98.7% | 98.2% | 27.36 | 144.2 |
| GCE-YOLOv9-seg | 97.6% | 95.8% | 99.4% | 99.5% | 99.2% | 27.95 | 162 |
Disclaimer/Publisher’s Note: The statements, opinions and data contained in all publications are solely those of the individual author(s) and contributor(s) and not of MDPI and/or the editor(s). MDPI and/or the editor(s) disclaim responsibility for any injury to people or property resulting from any ideas, methods, instructions or products referred to in the content. |
© 2025 by the authors. Licensee MDPI, Basel, Switzerland. This article is an open access article distributed under the terms and conditions of the Creative Commons Attribution (CC BY) license (https://creativecommons.org/licenses/by/4.0/).
Share and Cite
Zhu, G.; Luo, Z.; Ye, M.; Xie, Z.; Luo, X.; Hu, H.; Wang, Y.; Ke, Z.; Jiang, J.; Wang, W. Instance Segmentation of Sugar Apple (Annona squamosa) in Natural Orchard Scenes Using an Improved YOLOv9-seg Model. Agriculture 2025, 15, 1278. https://doi.org/10.3390/agriculture15121278
Zhu G, Luo Z, Ye M, Xie Z, Luo X, Hu H, Wang Y, Ke Z, Jiang J, Wang W. Instance Segmentation of Sugar Apple (Annona squamosa) in Natural Orchard Scenes Using an Improved YOLOv9-seg Model. Agriculture. 2025; 15(12):1278. https://doi.org/10.3390/agriculture15121278
Chicago/Turabian StyleZhu, Guanquan, Zihang Luo, Minyi Ye, Zewen Xie, Xiaolin Luo, Hanhong Hu, Yinglin Wang, Zhenyu Ke, Jiaguo Jiang, and Wenlong Wang. 2025. "Instance Segmentation of Sugar Apple (Annona squamosa) in Natural Orchard Scenes Using an Improved YOLOv9-seg Model" Agriculture 15, no. 12: 1278. https://doi.org/10.3390/agriculture15121278
APA StyleZhu, G., Luo, Z., Ye, M., Xie, Z., Luo, X., Hu, H., Wang, Y., Ke, Z., Jiang, J., & Wang, W. (2025). Instance Segmentation of Sugar Apple (Annona squamosa) in Natural Orchard Scenes Using an Improved YOLOv9-seg Model. Agriculture, 15(12), 1278. https://doi.org/10.3390/agriculture15121278