Article

Detection of Copy Number Variations from HIF1A and HIF2A Gene as Genetic Determinants of Bovine Carcass Traits

1
College of Animal Science and Technology, Northwest A&F University, Yangling 712100, China
2
Key Laboratory of Livestock and Poultry Multi-Omics of MARA, Institute of Animal Science and Veterinary Medicine, Shandong Academy of Agricultural Sciences, Jinan 250100, China
*
Authors to whom correspondence should be addressed.
These authors contributed equally to this work.
Agriculture 2025, 15(12), 1240; https://doi.org/10.3390/agriculture15121240
Submission received: 25 April 2025 / Revised: 23 May 2025 / Accepted: 4 June 2025 / Published: 6 June 2025
(This article belongs to the Section Farm Animal Production)

Abstract

:
The beef cattle industry has seen rapid expansion, necessitating the optimization of slaughter traits for enhanced economic benefits. Copy number variation (CNV) has emerged as a pivotal molecular marker in marker-assisted selection (MAS) for genetic improvement in livestock. In this study, we focused on CNVs within the HIF1A and HIF2A genes, which play crucial roles in hypoxic signaling and energy metabolism. Four CNVs were identified in the bovine HIF1A gene and three in HIF2A using the AAOD database. In Gaoqing Black cattle (GQB), the distribution of CNVs for both genes was investigated, revealing predominantly median copy numbers. Association analysis showed a significant relation between CNVs in HIF1A and carcass traits such as cervical vertebrae (CNV1), initial weight and beef diaphragm (CNV2), slaughter weight and chuck (CNV3), and femur and chuck (CNV4) (p < 0.05 or p < 0.01). Similarly, CNVs in HIF2A are associated with traits like beef diaphragm, beef knuckle bone, and beef tendon (CNV1), longissimus dorsi width and beef diaphragm (CNV2), and slaughter weight and limb weights (CNV3) (p < 0.05 or p < 0.01). These findings provide insights into the potential influence of CNVs in HIF1A and HIF2A on carcass traits in Gaoqing Black cattle, offering a theoretical basis for genetic improvement in beef cattle breeding.

1. Introduction

In recent years, the beef cattle industry has witnessed rapid expansion within the agricultural sector, rendering the optimization of slaughter traits a pivotal aspect for boosting economic benefits. Consequently, research on livestock slaughter characteristics and the genetic regulatory mechanisms of growth and development has gathered increasing attention. Against this backdrop, the integration of regulatory gene exploration with molecular marker-assisted selection (MAS) technology has emerged as a core strategy in modern animal breeding. Notably, copy number variation (CNV), as an important molecular marker, is increasingly being adopted in the application of MAS [1,2].
CNV refers to changes in the copy number of DNA segments or segments in the genome relative to a reference genome, encompassing regions ranging from a few base pairs to millions of base pairs [3]. CNV exhibits variation and can influence gene expression levels and patterns, thereby affecting various traits in organisms [4]. Its advantage as a molecular marker lies in its ability to cover larger genomic regions compared to single nucleotide polymorphisms (SNPs), potentially associating with more genes and traits. In beef cattle breeding, selecting CNV markers related to growth, slaughter, and carcass traits can accelerate the process of genetic improvement. For instance, identifying CNVs associated with traits such as body size and muscle development can provide robust support for formulating more precise breeding strategies, thereby contributing to the sustainable development of the beef cattle industry [5]. Additionally, slaughter traits, often measured using techniques such as ultrasonic inspection, have a direct impact on carcass composition and carcass traits. Therefore, utilizing molecular markers like CNV for assisted selection is of great significance in improving beef cattle slaughter traits and overall economic benefits.
To identify key CNVs that affect the carcass traits of Gaoqing Black cattle, we employed the following strategy for experimentation (Figure 1): Initially, we selected genes potentially playing crucial roles in animal growth as candidate genes and screened for CNVs within these genes. Consequently, transcriptome data of beef cattle from various altitudes were downloaded from public databases (Figure 1A). Subsequently, differential analysis was conducted on the transcriptome data to identify key differentially expressed genes as candidates for this study (Figure 1B). Ultimately, CNVs within these candidate genes were determined, and qPCR was utilized to detect these CNVs in the Gaoqing Black cattle population, enabling the examination of their association with slaughter traits (Figure 1C). During this process, Hypoxia-inducible factor-2α (HIF2A, also known as EPAS1) was found to be differentially expressed between different groups. Furthermore, HIF1A and HIF2A belong to the same gene family and share numerous functional similarities. Therefore, HIF1A and HIF2A were selected for further investigation.
Hypoxia-Inducible Factor-1α (HIF1A) and HIF2A serve as core transcriptional factors in the hypoxic signaling pathway, jointly regulating downstream gene expression and participating in the body’s adaptive response to hypoxic environments [6]. Both transcription factors consist of α and β subunits forming heterodimer structures, with the stability of the α subunit directly affected by oxygen concentration [7,8]. In normoxic conditions, the HIF-α subunit undergoes hydroxylation by prolyl hydroxylase (PHD) and is degraded through the ubiquitin-proteasome pathway [9,10]. However, under hypoxic conditions, the HIF-α subunit remains stable, enters the nucleus, binds to HIF-1β, and subsequently activates the transcription of target genes [10].
Despite structural similarities between HIF1A and HIF2A, both containing bHLH and PAS domains, they exhibit significant functional differences. HIF1A primarily functions under acute hypoxic conditions, activating genes related to glucose metabolism and cell survival (such as GLUT1 and VEGF) [11], while HIF2A tends to regulate erythropoiesis (EPO) [12] and iron metabolism genes under chronic hypoxic conditions [13].
HIF1A and HIF2A not only play crucial roles in human medicine but also have significant importance in livestock and poultry physiological regulation and animal husbandry production. HIF1A plays a key role in post-slaughter muscle glycolysis in livestock and poultry. After slaughter, the cellular oxygen supply is interrupted, triggering a hypoxic stress response. At this point, HIF1A rapidly stabilizes and activates downstream genes (such as GLUT-1, hexokinase (HK), and phosphofructokinase (PFK)), promoting the glycolysis pathway and lactate production to maintain cellular energy demands [14]. This process directly affects meat qualities such as tenderness, water retention, and color. For livestock and poultry on the plateau, the hypoxic environment poses challenges to their growth and reproduction, while HIF2A (EPAS1) is a key gene for species adaptation to hypoxia [15,16]. Plateau livestock breeds such as Tibetan sheep and cattle carry specific haplotypes of HIF2A, which can reduce hemoglobin concentrations and avoid excessive blood viscosity, thereby enhancing hypoxia tolerance and survival rates [17]. These genetic characteristics provide valuable molecular markers for the selection and breeding of plateau livestock breeds. Furthermore, under hypoxic conditions, HIF2A promotes erythrocyte proliferation by activating EPO, improving oxygen transport efficiency, and supporting normal metabolism and growth of livestock and poultry in plateau environments [18,19].
In addition, HIF1A and HIF2A also influence the growth efficiency of livestock and poultry by regulating energy metabolism pathways. HIF1A preferentially activates the glycolysis pathway under hypoxic conditions, while HIF2A may balance energy utilization by regulating fatty acid oxidation-related genes (such as PHD2 and PHD23) [20]. Optimizing the activity of these two factors is expected to improve feed utilization and promote muscle deposition. HIF1A also plays a crucial role in placental angiogenesis, and abnormal expression may lead to embryonic development retardation or abortion [21]. By regulating the HIF pathway, the reproductive performance of livestock can be improved, increasing litter sizes. In high-temperature environments, hypoxic conditions in cells are more severe. At this point, HIF1A activates protective genes such as heat shock proteins (HSP) to alleviate damage from heat stress on livestock and poultry [22,23,24]. Meanwhile, HIF2A enhances the clearance ability of animals against pathogens by regulating immune-related genes (such as VEGF and IL-6) [25,26].
HIF1A and HIF2A play vital roles in livestock and poultry physiological regulation and animal husbandry production. By regulating different physiological processes, they affect the growth, reproduction, and ability of livestock and poultry to cope with environmental challenges. Therefore, this study aims to explore the effects of CNV in HIF1A and HIF2A on the carcass traits of Gaoqing Black cattle to lay down a theoretical basis for improving the carcass traits of beef.

2. Materials and Methods

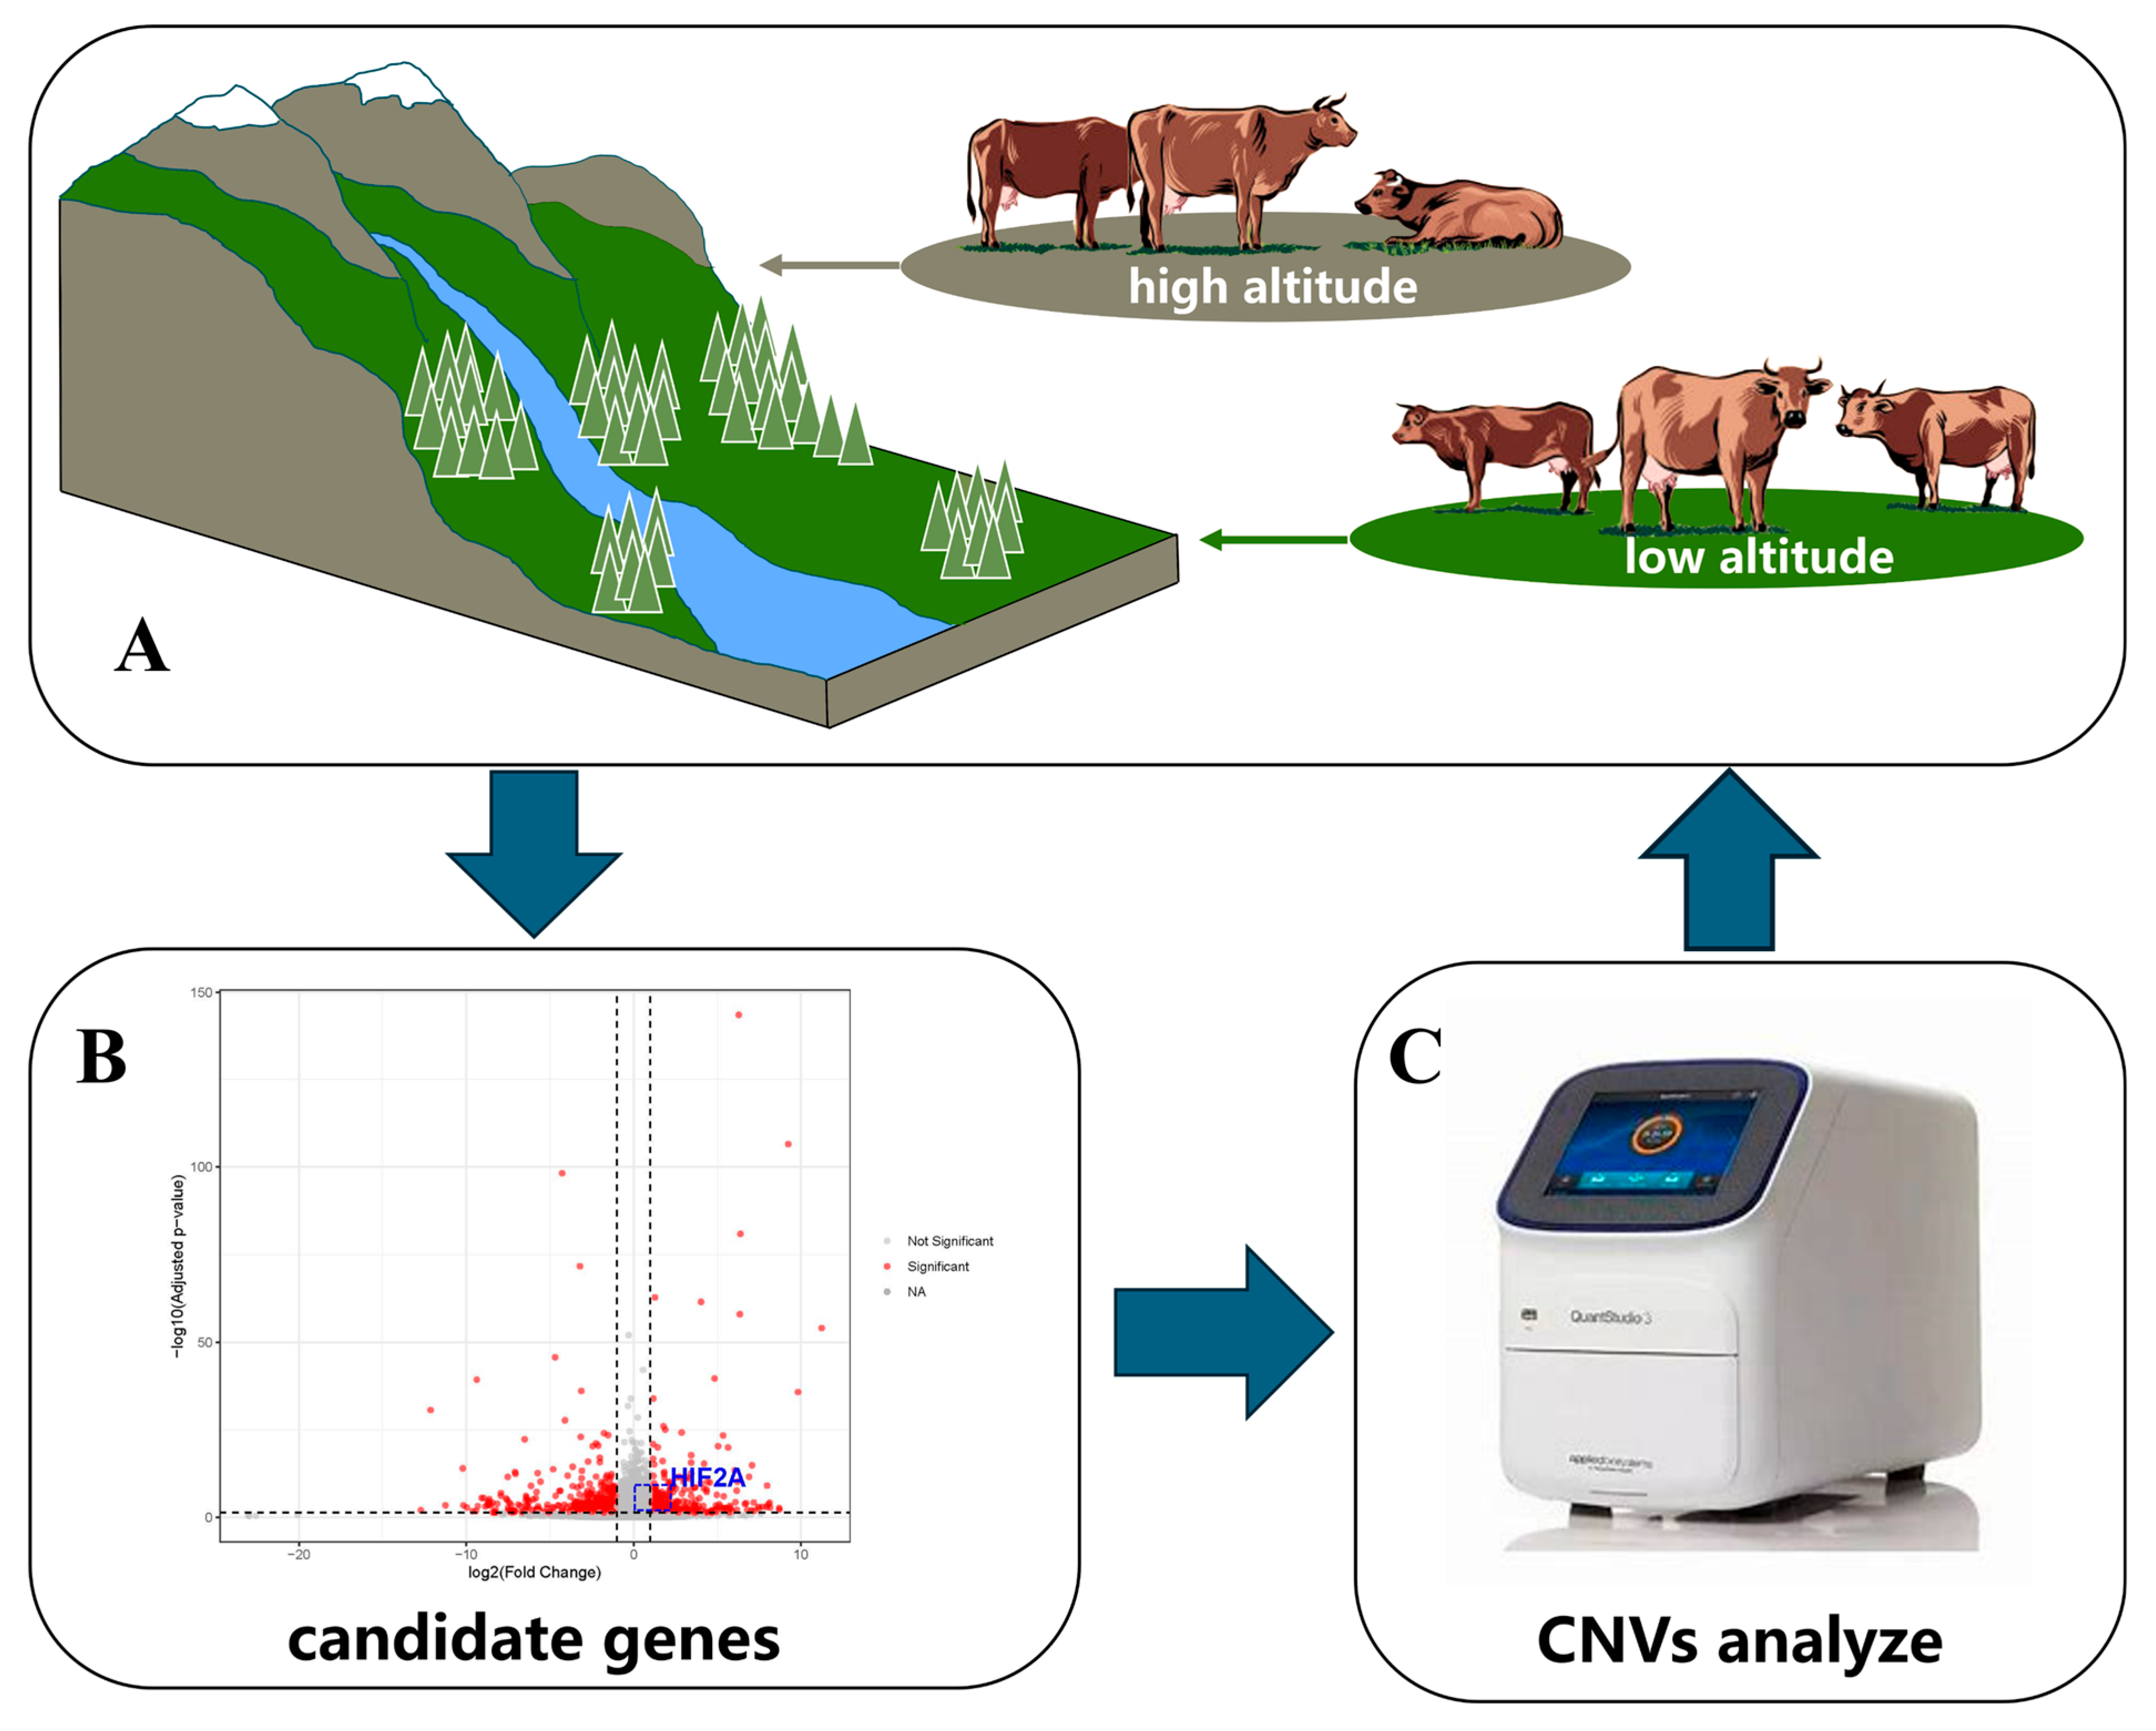
2.1. Screening of Candidate Genes

This study downloaded transcriptome data from nine cattle located at different altitudes from the PRJNA644042 project in the NCBI public database (https://www.ncbi.nlm.nih.gov/sra/, accessed on 20 January 2025). The sample of data sources is 9 healthy, 4.5-year-old, non-pregnant and unrelated adult LWQY yak cows from Leiwoqi County, Changdu City, Tibet Province, China, at an altitude of 4200 m and geographical coordinates of 962,333 E 31,273 N, and 2 related local cattle breeds located at high altitude HAC, Changdu City, Tibet Province, China, at an altitude of 4200 m and geographical coordinates of 962,333 E 31,273 N, and low altitude LAC, Wenchuan County, Aba City, Sichuan Province, China, at an altitude of 1200 m and geographical coordinates of 1,033,526 E 312,836 N. Each group is represented by three healthy individuals with similar body weights for heart tissue sampling. LWQY yak and HAC cattle were raised under similar environmental and feeding conditions in Leiwuqi Township, while LAC cattle were raised under the same conditions as LWQY yak and HAC cattle in Wenchuan County [27]. The corresponding accession numbers are SRR12170551, SRR12170552, SRR12170553, SRR12170554, SRR12170555, SRR12170556, SRR12170557, SRR12170558, and SRR12170559. The data was for differential expression analysis. First, raw sequence reads were preprocessed by using Trimmomatic v0.39, with the following quality control parameters: ILLUMINACLIP: TruSeq3-PE-2. fa:2:30:10 LEADING:3 TRAILING:3 SLIDINGWINDOW:4:15 MINLEN:36. The filtered reads were then aligned to the bovine reference genome (ARS-UCD2.0) using HISAT2 v2.2.1. Following alignment, SAM files were converted into BAM files and indexed using SAMtools (version: 1.16.1). Gene expression analysis was then performed at the gene level using HTSeq v2.0.5 (-s no), based on the “exon” feature of the reference genome annotation file (in GTF format) and generating the raw count matrix for downstream analysis. Differential expression analysis was performed using DESeq2 v1.34.0, and data visualization was conducted using ggplot2 v3.4.2 and dplyr v1.1.2.

2.2. Tissue Sample and Data Collection

To systematically investigate genetic factors underlying beef quality traits, we collected muscle tissue samples from 361 healthy adult Gaoqing Black cattle with diverse phenotypic characteristics. These cattle were sourced from two commercial farms under comparable breeding protocols—Shandong Yangxin Yiliyuan Halal Meat Company (address: Binzhou City, Shandong Province, China) and Shandong Kai-yuan Animal Husbandry Company (address: Zhaoyuan City, Shandong Province, China)—where standardized feeding regimens, housing conditions, and health monitoring were maintained. All animals entered the fattening phase between 10 and 11 months of age and were harvested at 26–28 months under centralized slaughter protocols to ensure developmental uniformity. The collected data includes initial body weight, slaughter weight, and muscle development indices. Data from muscle development indices include beef shin weight (quantified from thigh tendons to evaluate muscle mass and texture), beef silverside weight (measured from hind leg outer thighs to evaluate cut quality and yield), ribeye muscle weight (extracted between rib bones to evaluate tenderness and flavor potential), and knuckle muscle weight (taken from buttocks to analyze carcass conformation and market value). All measurements were executed by trained personnel following standardized operating procedures, with calibrated instrumentation and duplicate recordings to guarantee data reliability. This systematic approach ensures accurate phenotyping for subsequent genetic association analyses.

2.3. Extraction of Genomic DNA

For genomic DNA extraction, approximately 2 g of muscle tissue samples were obtained. Employing the phenol-chloroform extraction method [28], we successfully isolated genomic DNA from these tissue samples. To ensure the quality of the extracted DNA, we utilized a NanoDrop 1000 spectrophotometer to measure the A260/A280 ratio of each DNA sample. Subsequently, the DNA samples were diluted to a concentration of 50 ng/µL and stored in a refrigerator maintained at −40 °C for future experimental use.

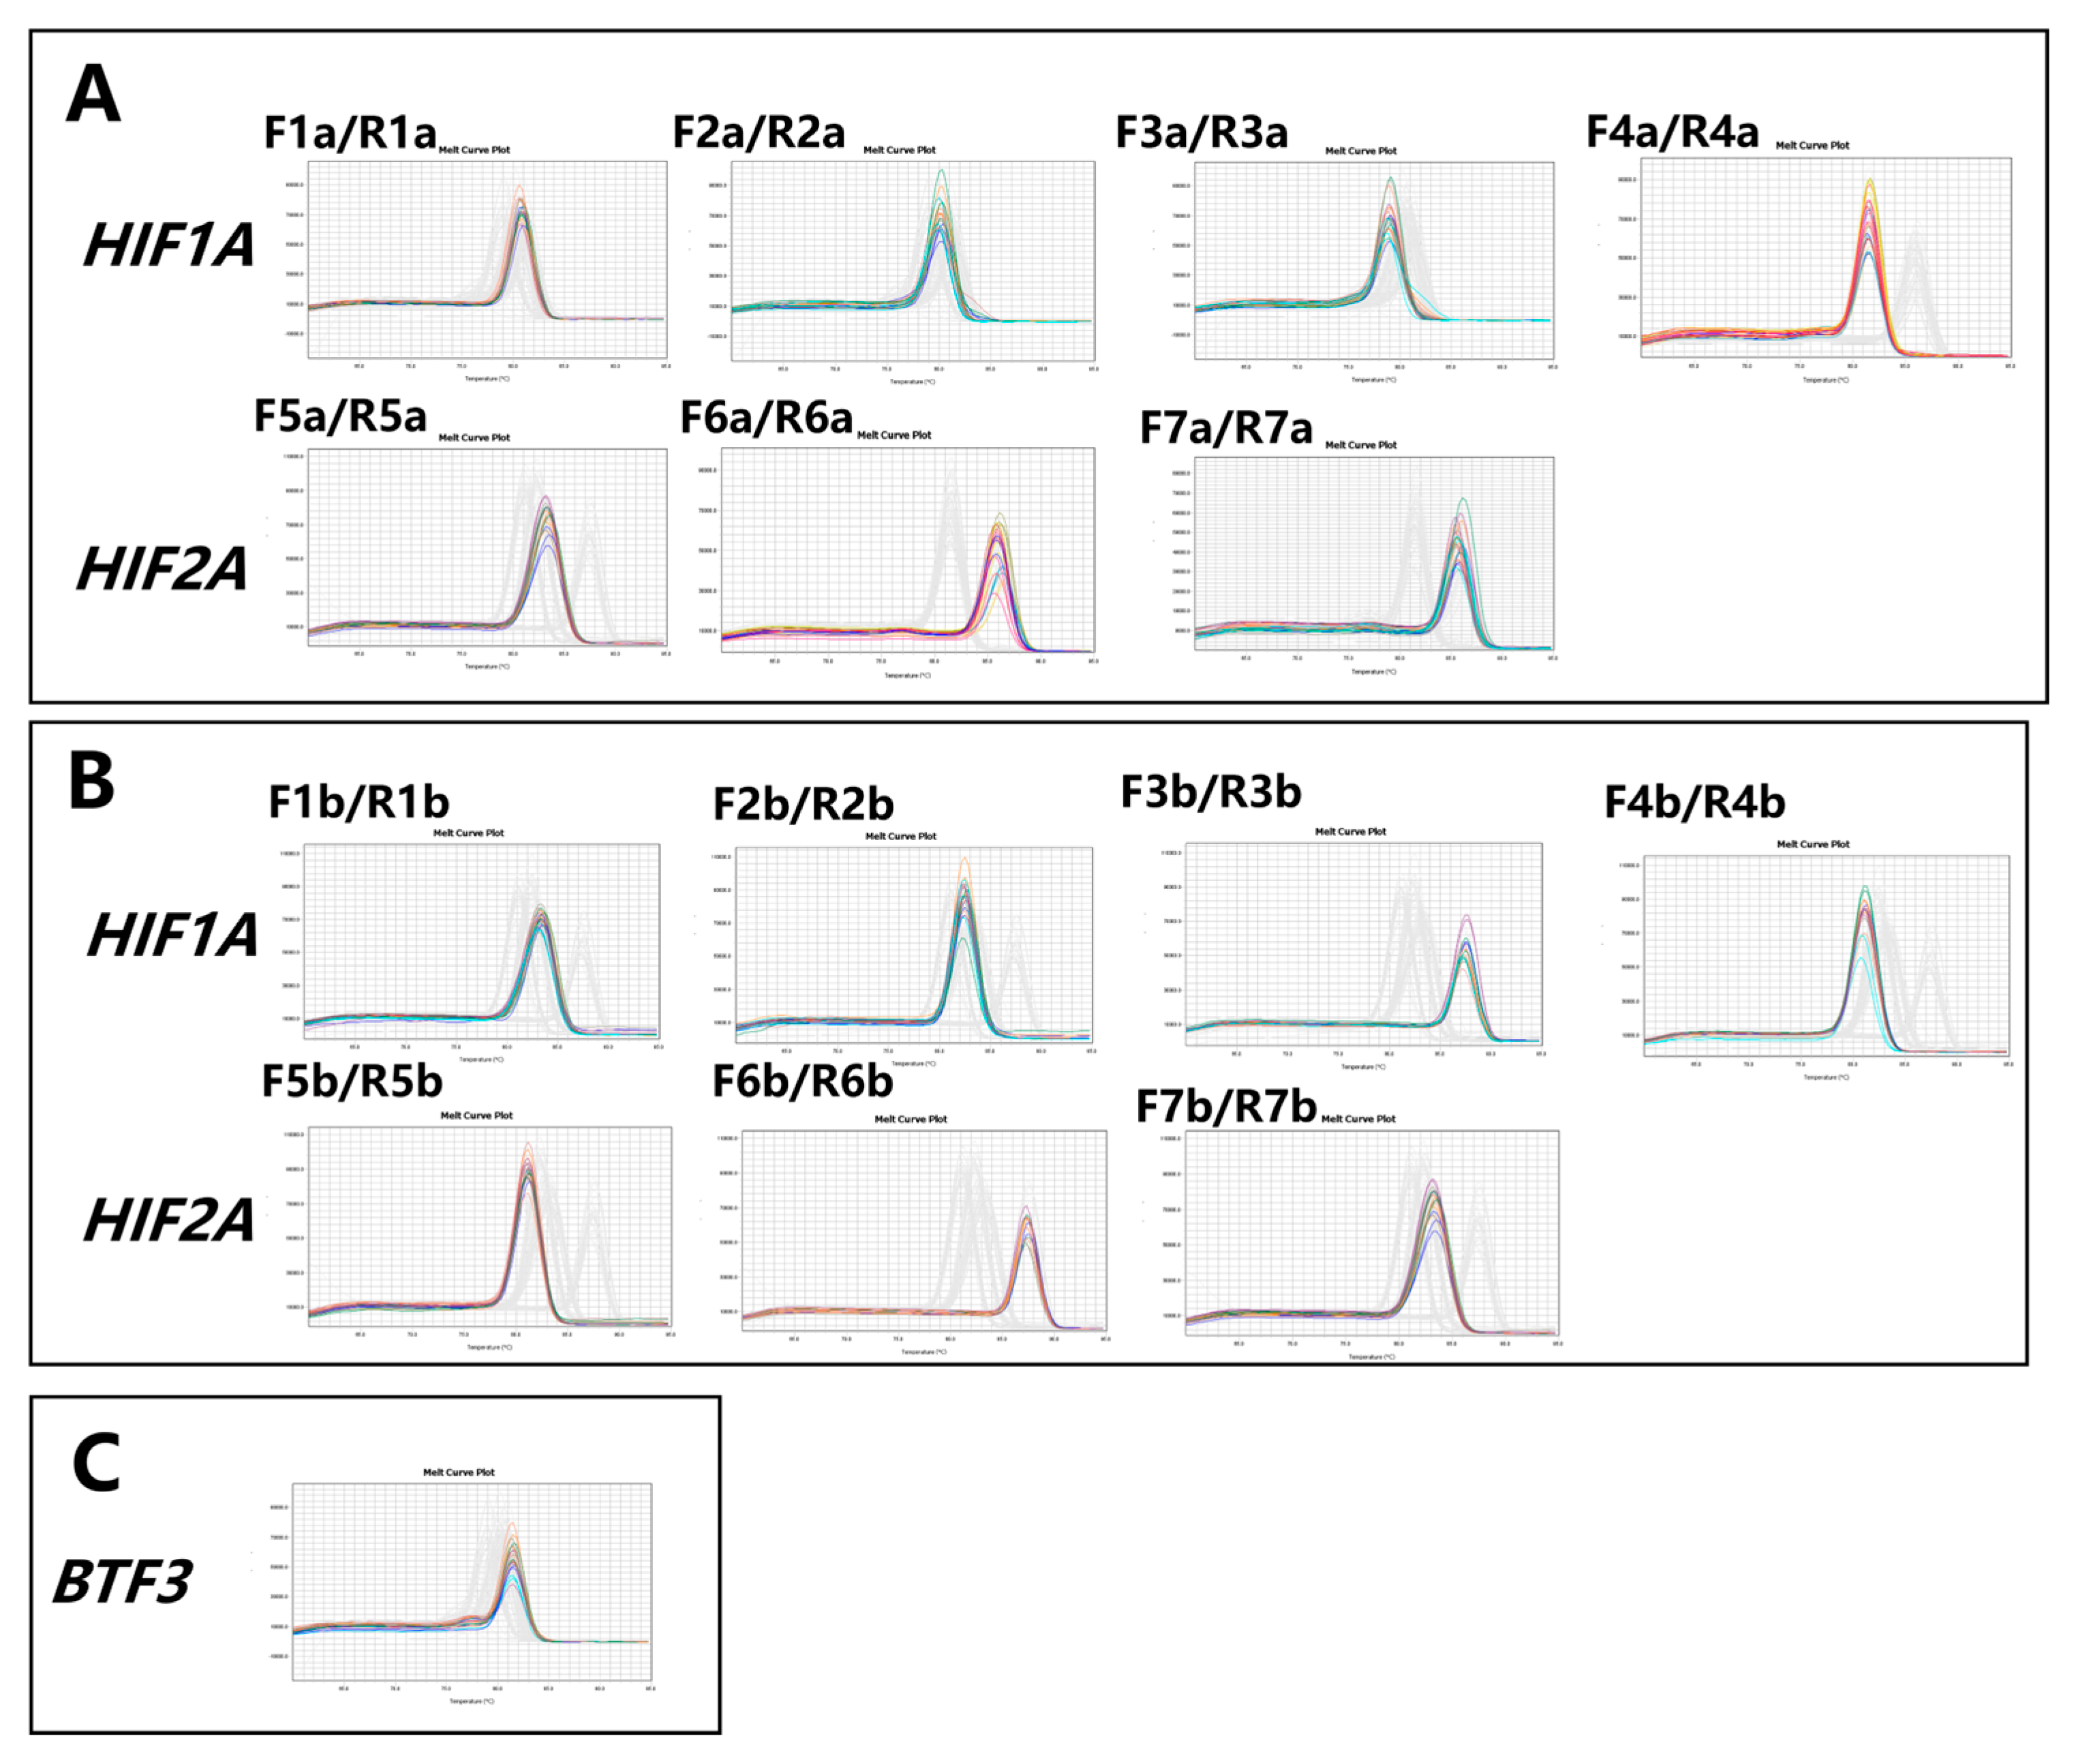
2.4. Identification and Genotyping of Copy Number Variants of Bovine HIF1A and HIF2A Genes

To determine the CNV types of the HIF1A and HIF2A genes, we performed qPCR using the BTF3 gene as an internal reference, which is stably maintained at two copies per diploid genome (median type). Each 15 μL reaction mixture contained 25 ng of genomic DNA, 7.5 μL SYBR Green Premix Ex TaqTM II, and 10 pmol of gene-specific primers. Primer sequences were designed using Primer 5 software based on conserved regions of the HIF1A and HIF2A DNA sequences (Designated as F1a~F7a/R1a~R7a, Table 1). Additionally, to validate the reliability of these primers, we designed an alternative primer pair for each CNV locus (designated as F1b~F7b/R1b~R7b, Table 2), aiming to confirm their reliability through comparative analysis of CNV genotyping results generated by both primer sets. The genomic positions of all primers are illustrated in Figure 2. All genomic qPCR experiments were conducted in triplicate using SYBR Green chemistry to ensure reproducibility. For CNV analysis, we employed the 2−ΔΔCt method by normalizing target gene Ct values against both the BTF3 reference and an Angus control sample. Based on the calculated 2−ΔΔCt values, CNV types were classified as follows: gain (>2 copies), median (2 copies, equivalent to the Angus reference), or loss (<2 copies). The melting curves of qPCR are shown in Figure 3.

2.5. Statistical Analysis

The associations between CNVs in the HIF1A and HIF2A genes and growth and carcass composition traits of Gaoqing Black cattle were analyzed using a general linear model: Yjk = μ + Gj + ejk, where Yjk denotes the phenotypic measurement of growth and carcass traits, μ represents the population mean, Gj represents genetic variants of CNV, and ejk corresponds to the random residual error. Statistical analyses were performed using SPSS 25.0 (IBM Corp., Armonk, NY, USA), with all data presented as mean ± standard error of the mean (SEM). The threshold for statistical significance was set at p < 0.05.

3. Results

3.1. Identification of the CNVs of the HIF1A and HIF2A Genes

Differential expression analysis among three groups (high-altitude cattle, low-altitude cattle, and yak at high altitudes) identified 4151 significantly differentially expressed genes out of a total of 15,823 genes using the likelihood ratio test (LRT) (Padj < 0.05). There were 1891 upregulated genes and 2260 downregulated genes in the comparison between high-altitude cattle and low-altitude cattle; 2120 upregulated and 2031 downregulated genes were found when comparing high-altitude cattle with yak; and 2233 upregulated and 1918 downregulated genes were observed in the comparison between low-altitude cattle and yak. Notably, the HIF2A gene exhibited significant differences (Figure 1B). Considering that HIF1A and HIF2A belong to the same gene family and share similarities and synergies in function, subsequent research was focused on exploring the CNVs of HIF1A and HIF2A for further investigation.
Studies have shown that copy number variation (CNV) regions can be detected in many functional genes, and copy number variations may exert their effects on the expression of other genes by influencing both their own loci and other genes [29,30]. To ascertain the presence of CNVs in the bovine HIF1A and HIF2A genes, we utilized the AAOD database (accessible at: https://animal.nwsuaf.edu.cn/, accessed on 2 February 2025)). Through analysis of this database, four CNVs were identified within the HIF1A gene of cattle (Figure 2A): CNV1, located in the upstream region of the HIF1A gene, spans 4399 bp (position identifier: NC_037337.1_73831116_73835516); CNV2, found within the exon region of the HIF1A gene, measures 12,797 bp (position identifier: NC_037337.1_73836720_73849517); similarly, CNV3 is also situated in the exon region of the HIF1A gene, with a length of 6800 bp (position identifier: NC_037337.1_73868718_73875518); and CNV4, also located in the exon region, encompasses 14800 bp (position identifier: NC_037337.1_73875518_73890318).
Additionally, three CNV loci were identified in the bovine HIF2A gene (Figure 2B): CNV1, positioned in the intron region of the HIF2A gene, is 8300 bp in size (position identifier: NC_037337.1_28736884_28744887); CNV2, likewise situated within the intron region, spans 3199 bp (position identifier: NC_037337.1_28758457_28761656); and CNV3, found in the exon region, measures 2800 bp (position identifier: NC_037337.1_28794561_28797361).

3.2. Validation of the Accuracy of CNV Detection by qPCR

To validate the reliability of using qPCR for CNV genotyping, we designed two primer pairs for each CNV locus (Table 1 and Table 2 and Figure 2). The objective was to confirm the reliability by comparing the consistency of CNV genotyping results obtained from both primer pairs.
Initially, we evaluated the specificity of each primer pair by analyzing the melting curves generated during qPCR. As indicated by the dissociation profiles, each primer pair exhibited a single distinct peak, confirming the absence of non-specific amplification products. This validation ensures their suitability for subsequent experimental applications (Figure 3).
To assess the reliability of the qPCR-based method for CNV genotyping, we randomly selected approximately 30 DNA samples from Gaoqing Black cattle and performed CNV genotyping using both primer pairs. The accuracy rate was calculated as the ratio of individuals showing consistent genotyping results between the two independent experiments to the total number of individuals analyzed. Statistical analysis confirmed >90% concordance in genotype classification between the two primer sets, thereby validating the robustness of our qPCR-based CNV detection methodology (Table 3). In subsequent experiments, genotyping was performed on over 300 DNA samples from Gaoqing Black cattle using the former primer pairs (F1a~F7a/R1a~R7a, Table 1).

3.3. CNV Polymorphisms of the HIF1A and HIF2A Genes in Gaoqing Black Cattle

To determine the presence and investigate the distribution of CNVs of HIF1A and HIF2A genes in the Gaoqing Black cattle breed, we detected and estimated the relative gene copy numbers. Based on the 2−ΔΔCt values, the copy numbers were classified into three types: loss, median, and gain, where loss represents fewer than two DNA copies, median means two DNA copies, and gain indicates more than two DNA copies compared to the BTF3 gene. As shown in Table 4, the median type is relatively more common in Gaoqing Black cattle for the HIF1A gene. The CNVs of the HIF2A gene also exhibit similar distribution characteristics (Table 4).

3.4. Association Between HIF1A CNV Polymorphisms and Carcass Traits in Gaoqing Black Cattle

Association analysis revealed a significant relation between various HIF1A CNVs and multiple carcass traits in Gaoqing Black cattle. Specifically, CNV1 was significantly associated with four traits, including cervical vertebrae (p = 0.009), oxtail (p = 0.042), rendered fat (p = 0.009), and beef brisket (p = 0.023) (Table 5). CNV2 exhibited significant associations with seven traits, such as initial weight (p = 0.026), beef diaphragm (p = 0.030), beef knuckle bone (p = 0.001), and other traits (Table 5). Similarly, CNV3 demonstrated a strong association with seven traits encompassing initial weight (p = 0.024), slaughter weight (p = 0.020), chuck (p = 0.003), and other traits (Table 5). Lastly, CNV4 showed a significant association with four traits, including femur (p = 0.001), chuck (p = 0.003), coccygeal meat (p = 0.011), and patellar tendon (p = 0.003) (Table 5). These findings highlight the potential influence of HIF1A CNVs on the carcass characteristics of Gaoqing Black cattle.

3.5. Association Between HIF2A CNV Polymorphisms and Carcass Traits in Gaoqing Black Cattle

Association analysis revealed a significant relation between CNVs of the HIF2A gene and multiple traits in Gaoqing Black cattle. Specifically, CNV1 exhibited a notable association with seven traits, including beef diaphragm (p = 0.030), beef knuckle bone (p = 0.004), and beef tendon (p = 1.345 × 10⁻⁴), etc. (Table 6). CNV2 showed a significant relationship with six traits, such as longissimus dorsi width (p = 0.007), beef diaphragm (p = 0.042), and beef knuckle bone (p = 0.017) (Table 6). Finally, CNV3 demonstrated a strong association with seven traits, including initial body weight (p = 0.036), left limb weight (p = 0.042), right limb weight (p = 0.045), etc. (Table 6). These findings underscore the potential impact of HIF2A CNVs on the diverse carcass characteristics of Gaoqing Black cattle.

4. Discussion

The rapid expansion of the beef cattle industry in recent years has elevated the optimization of slaughter traits to a critical determinant of economic efficiency. This study systematically investigated the effects of CNVs in HIF1A and HIF2A key HIF pathway genes on carcass traits in Gaoqing Black cattle. Utilizing the AAOD database, we identified four CNVs in HIF1A (located in upstream and exonic regions) and three CNVs in HIF2A (spanning intronic and exonic regions). Distribution analysis classified these CNVs into loss, median, and gain types, revealing a predominant median-type distribution for both genes (Table 4). This genetic profiling provides foundational insights into breed-specific variation and supports marker-assisted selection strategies.
Our phenotype-genotype association analyses highlighted key associations between HIF1A and HIF2A CNVs and economically important carcass traits. For HIF1A, specific CNVs demonstrated significant associations with traits such as cervical vertebrae development (CNV1, p < 0.05 or p < 0.01), initial weight and diaphragm mass (CNV2, p < 0.05 or p < 0.01), slaughter weight and chuck yield (CNV3, p < 0.05 or p < 0.01), and femur characteristics and chuck quality (CNV4, p < 0.05 or p < 0.01). Similarly, HIF2A CNVs showed robust associations with traits like diaphragm thickness, knuckle bone morphology, and tendon structure (CNV1, p < 0.05 or p < 0.01); longissimus dorsi muscle width and diaphragm composition (CNV2, p < 0.05); and slaughter weight and limb muscle mass (CNV3, p < 0.05). These findings underscore the potential regulatory roles of HIF1A and HIF2A CNVs in shaping carcass traits of economic significance. Similarly, previous studies have reported the associations between CNVs and economic traits from livestock and chicken [31,32]. For example, CNV of the SH3RF2 gene has been linked to variation in the body weight at different growth stages and carcass weight e. Additionally, CNVs in the Plectin gene were found to be significantly associated with linear body measurements, body weight, carcass weight, and longissimus dorsi muscle for Leizhou black goats [33].
These coordinated patterns demonstrate that HIF1A and HIF2A CNVs regulate carcass traits through distinct yet complementary mechanisms, potentially influencing skeletal development, muscle deposition, and connective tissue properties. As core transcriptional regulators of hypoxia adaptation, HIF1A and HIF2A directly modulate muscle physiology and postmortem metabolism. Under acute hypoxia, HIF1A activates glycolytic genes (GLUT1, HK, and PFK) to sustain ATP production [14]. Post-slaughter oxygen deprivation stabilizes HIF1A, accelerating glycolysis and impacting meat pH, tenderness, and water-holding capacity.
In contrast, HIF2A (EPAS1) governs chronic hypoxia responses by regulating EPO and iron metabolism to optimize oxygen transport, which is a critical trait for growth efficiency [13]. In Gaoqing Black cattle, HIF2A CNV gains likely enhance erythrocyte proliferation, improving oxygen delivery for muscle development and energy metabolism. Additionally, its role in fatty acid oxidation [20] suggests that CNVs may shift energy substrate utilization, influencing economically vital traits like marbling and fat distribution.
The spatiotemporal functional divergence of HIF1A and HIF2A reveals a complementary regulatory framework: HIF2A modulates pre-slaughter growth adaptation through oxygen utilization, while HIF1A dictates post-slaughter metabolic processes. This dual regulation aligns with differential expression patterns observed in altitude-adapted cattle, suggesting that CNV selection could fine-tune hypoxia adaptation across environments. Furthermore, HIF signaling pleiotropy including angiogenesis, immune modulation, and heat stress resilience [25], may indirectly enhance carcass quality by improving animal health. For instance, HIF1A-mediated heat shock protein induction could mitigate slaughter stress, preserving meat integrity.
This study establishes that HIF1A and HIF2A CNVs influence Gaoqing Black cattle slaughter traits through hypoxia-responsive pathways governing energy metabolism, oxygen transport, and stress adaptation. These genes emerge as promising biomarkers for precision breeding, enabling CNV profile optimization to concurrently improve growth efficiency and meat quality. Future work should prioritize functional validation of CNV impacts and explore their applicability across diverse breeds and production systems. By integrating MAS strategies targeting these CNVs, the beef industry can accelerate genetic gains, driving sustainable advancements in carcass trait optimization and economic returns.

5. Conclusions

This study underscores the significant potential of copy number variations (CNVs) in the HIF1A and HIF2A genes as valuable molecular markers for optimizing slaughter traits in beef cattle breeding. Through targeted analysis of Gaoqing Black cattle, we identified four CNVs in e and three in HIF2A, demonstrating their association with economically important carcass traits, including cervical vertebrae count, slaughter weight, meat yields (e.g., chuck, diaphragm, and tendon), and limb weights (p < 0.05). The findings provide a mechanistic basis for integrating CNV-based marker-assisted selection (MAS) into breeding programs to enhance precision and efficiency.

Author Contributions

E.J. and Y.Z.: draft writing and data analysis; Y.H., Z.H., H.W., and L.Z.: investigation; C.P. and C.L.: resources and writing—review and editing; F.J. and X.L.: supervision, project administration, and writing—review and editing. All authors have read and agreed to the published version of the manuscript.

Funding

This work was funded by the Science Fund for Distinguished Young Scholars of Shaanxi Province (No. 2024JC-JCQN-30), the Natural Science Basic Research Program of Shaanxi Province for Key Project on Frontier Exploration (No. 2025JC-QYCX-027), Shaanxi Provincal Innovation Leadership Program in Sciences and Technologies for Young and Middle-aged Scientists (No. 2023SR205).

Institutional Review Board Statement

All experimental procedures used in this study followed the principle of the International Animal Care and Use Committee of the Northwest A&F University (protocol number: NWAFAC1008).

Informed Consent Statement

Not applicable.

Data Availability Statement

Data are contained within the article.

Acknowledgments

The authors are grateful to Shaanxi Key Laboratory of Molecular Biology for Agriculture and The Life Science Research Core Services (LSRCS) of Northwest A&F University (Northern Campus) for their cooperation and support. The authors would like to thank the staff of the College of Veterinary Medicine at Northwest A&F University.

Conflicts of Interest

The authors declare no conflict of interest.

References

  1. Peng, S.J.; Cao, X.K.; Dong, D.; Liu, M.; Hao, D.; Shen, X.M.; Huang, Y.Z.; Lei, C.Z.; Ma, Y.; Bai, Y.Y.; et al. Integrative analysis of APOL3 gene CNV for adult cattle stature. Anim. Biotechnol. 2020, 31, 440–446. [Google Scholar] [CrossRef] [PubMed]
  2. Ladeira, G.C.; Pilonetto, F.; Fernandes, A.C.; Bóscollo, P.P.; Dauria, B.D.; Titto, C.G.; Coutinho, L.L.; e Silva, F.F.; Pinto, L.F.B.; Mourão, G.B. CNV detection and their association with growth, efficiency and carcass traits in Santa Inês sheep. J. Anim. Breed. Genet. 2022, 139, 476–487. [Google Scholar] [CrossRef] [PubMed]
  3. Jiang, E.; Zhang, C.; He, Z.; Zhang, Y.; Yang, Y.; Pan, C.; Jiang, F.; Song, E.; Zhang, S.; Lan, X. A novel A-to-G mutation in circBDP1 alters adipocyte proliferation and differentiation and affects bovine carcass traits. J. Zhejiang Univ. Sci. B, 2025. (in press) [Google Scholar]
  4. Song, X.; Bai, Y.; Yuan, R.; Zhu, H.; Lan, X.; Qu, L. InDel and CNV within the AKAP13 gene revealing strong associations with growth traits in goat. Animals 2023, 13, 2746. [Google Scholar] [CrossRef] [PubMed]
  5. Liu, X.; Yang, P.; Sun, H.; Zhang, Z.; Cai, C.; Xu, J.; Ding, X.; Wang, X.; Lyu, S.; Li, Z.; et al. CNV analysis of VAMP7 gene reveals variation associated with growth traits in Chinese cattle. Anim. Biotechnol. 2023, 34, 1095–1101. [Google Scholar] [CrossRef]
  6. Wu, D.; Liu, Y.; Chen, W.; Shao, J.; Zhuoma, P.; Zhao, D.; Yu, Y.; Liu, T.; Yu, R.; Gan, Y.; et al. How Placenta Promotes the Successful Reproduction in High-Altitude Populations: A Transcriptome comparison between adaptation and acclimatization. Mol. Biol. Evol. 2022, 39, msac120. [Google Scholar] [CrossRef]
  7. Basse, A.L.; Isidor, M.S.; Winther, S.; Skjoldborg, N.B.; Murholm, M.; Andersen, E.S.; Pedersen, S.B.; Wolfrum, C.; Quistorff, B.; Hansen, J.B. Regulation of glycolysis in brown adipocytes by HIF-1α. Sci Rep. 2017, 7, 4052. [Google Scholar] [CrossRef]
  8. Liu, D.; Luo, X.; Xie, M.; Zhang, T.; Chen, X.; Zhang, B.; Sun, M.; Wang, Y.; Feng, Y.; Ji, X.; et al. HNRNPC downregulation inhibits IL-6/STAT3-mediated HCC metastasis by decreasing HIF1A expression. Cancer Sci. 2022, 113, 3347–3361. [Google Scholar] [CrossRef]
  9. Mole, D.R.; Blancher, C.; Copley, R.R.; Pollard, P.J.; Gleadle, J.M.; Ragoussis, J.; Ratcliffe, P.J. Genome-wide association of hypoxia-inducible factor (HIF)-1alpha and HIF-2alpha DNA binding with expression profiling of hypoxia-inducible transcripts. J. Biol. Chem. 2009, 284, 16767–16775. [Google Scholar] [CrossRef]
  10. Lawson, H.; Holt-Martyn, J.P.; Dembitz, V.; Kabayama, Y.; Wang, L.M.; Bellani, A.; Atwal, S.; Saffoon, N.; Durko, J.; van de Lagemaat, L.N.; et al. The selective prolyl hydroxylase inhibitor IOX5 stabilizes HIF-1α and compromises development and progression of acute myeloid leukemia. Nat. Cancer. 2024, 5, 916–937. [Google Scholar] [CrossRef]
  11. Masoud, G.N.; Li, W. HIF-1α pathway: Role, regulation and intervention for cancer therapy. Acta Pharm. Sin. B 2015, 5, 378–389. [Google Scholar] [CrossRef]
  12. Rainville, N.; Jachimowicz, E.; Wojchowski, D.M. Targeting EPO and EPO receptor pathways in anemia and dysregulated erythropoiesis. Expert. Opin. Ther. Targets 2016, 20, 287–301. [Google Scholar] [CrossRef] [PubMed]
  13. Sanchez, M.; Galy, B.; Muckenthaler, M.U.; Hentze, M.W. Iron-regulatory proteins limit hypoxia-inducible factor-2alpha expression in iron deficiency. Nat. Struct. Mol. Biol. 2007, 14, 420–426. [Google Scholar] [CrossRef] [PubMed]
  14. Chen, C.; Guo, Y.; Shi, X.; Guo, Z.; Ma, G.; Yu, Q. Glycolysis capacity of bovine muscle during early stage of postmortem aging under action of HIF1α. Transactions of the Chinese society for agriculture machinary (In Chinese). Trans. Chin. Soc. Agric. Mach. 2022, 53, 403–411. [Google Scholar] [CrossRef]
  15. Yi, X.; Liang, Y.; Huerta-Sanchez, E.; Jin, X.; Cuo, Z.X.; Pool, J.E.; Xu, X.; Jiang, H.; Vinckenbosch, N.; Korneliussen, T.S.; et al. Sequencing of 50 human exomes reveals adaptation to high altitude. Science 2010, 329, 75–78. [Google Scholar] [CrossRef]
  16. Liang, X.; Duan, Q.; Li, B.; Wang, Y.; Bu, Y.; Zhang, Y.; Kuang, Z.; Mao, L.; An, X.; Wang, H.; et al. Genomic structural variation contributes to evolved changes in gene expression in high-altitude Tibetan sheep. Proc. Natl. Acad. Sci. USA 2024, 121, e2322291121. [Google Scholar] [CrossRef]
  17. Newman, J.H.; Holt, T.N.; Cogan, J.D.; Womack, B.; Phillips, J.A., 3rd; Li, C.; Kendall, Z.; Stenmark, K.R.; Thomas, M.G.; Brown, R.D.; et al. Increased prevalence of EPAS1 variant in cattle with high-altitude pulmonary hypertension. Nat. Commun. 2015, 6, 6863. [Google Scholar] [CrossRef]
  18. Tomc, J.; Debeljak, N. Molecular Insights into the Oxygen-Sensing Pathway and Erythropoietin Expression Regulation in Erythropoiesis. Int. J. Mol. Sci. 2021, 22, 7074. [Google Scholar] [CrossRef]
  19. Shih, H.M.; Pan, S.Y.; Wu, C.J.; Chou, Y.H.; Chen, C.Y.; Chang, F.C.; Chen, Y.T.; Chiang, W.C.; Tsai, H.C.; Chen, Y.M.; et al. Transforming growth factor-β1 decreases erythropoietin production through repressing hypoxia-inducible factor 2α in erythropoietin-producing cells. J. Biomed. Sci. 2021, 28, 73. [Google Scholar] [CrossRef]
  20. Pirri, D.; Tian, S.; Tardajos-Ayllon, B.; Irving, S.E.; Donati, F.; Allen, S.P.; Mammoto, T.; Vilahur, G.; Kabir, L.; Bennett, J.; et al. EPAS1 Attenuates Atherosclerosis Initiation at Disturbed Flow Sites Through Endothelial Fatty Acid Uptake. Circ. Res. 2024, 135, 822–837. [Google Scholar] [CrossRef]
  21. Javerzat, S.; Franco, M.; Herbert, J.; Platonova, N.; Peille, A.L.; Pantesco, V.; De Vos, J.; Assou, S.; Bicknell, R.; Bikfalvi, A.; et al. Correlating global gene regulation to angiogenesis in the developing chick extra-embryonic vascular system. PLoS ONE 2009, 4, e7856. [Google Scholar] [CrossRef]
  22. Hellwig-Bürgel, T.; Stiehl, D.P.; Wagner, A.E.; Metzen, E.; Jelkmann, W. Review: Hypoxia-inducible factor-1 (HIF-1): A novel transcription factor in immune reactions. J. Interf. Cytokine Res. 2005, 25, 297–310. [Google Scholar] [CrossRef]
  23. Wang, J.; Zhang, Y.; Cao, J.; Wang, Y.; Anwar, N.; Zhang, Z.; Zhang, D.; Ma, Y.; Xiao, Y.; Xiao, L.; et al. The role of autophagy in bone metabolism and clinical significance. Autophagy. 2023, 19, 2409–2427. [Google Scholar] [CrossRef] [PubMed]
  24. Zhang, D.; Li, J.; Costa, M.; Gao, J.; Huang, C. JNK1 mediates degradation HIF-1alpha by a VHL-independent mechanism that involves the chaperones Hsp90/Hsp70. Cancer Res. 2010, 70, 813–823. [Google Scholar] [CrossRef] [PubMed]
  25. Bai, J.; Li, L.; Li, Y.; Zhang, L. Genetic and immune changes in Tibetan high-altitude populations contribute to biological adaptation to hypoxia. Environ. Health Prev. Med. 2022, 27, 39. [Google Scholar] [CrossRef]
  26. Bhasuran, B.; Subramanian, D.; Natarajan, J. Text mining and network analysis to find functional associations of genes in high altitude diseases. Comput. Biol. Chem. 2018, 75, 101–110. [Google Scholar] [CrossRef]
  27. Wang, H.; Zhong, J.; Wang, J.; Chai, Z.; Zhang, C.; Xin, J.; Wang, J.; Cai, X.; Wu, Z.; Ji, Q. Whole-Transcriptome Analysis of Yak and Cattle Heart Tissues Reveals Regulatory Pathways Associated With High-Altitude Adaptation. Front. Genet. 2021, 12, 579800. [Google Scholar] [CrossRef] [PubMed]
  28. Koshy, L.; Anju, A.L.; Harikrishnan, S.; Kutty, V.R.; Jissa, V.T.; Kurikesu, I.; Jayachandran, P.; Jayakumaran Nair, A.; Gangaprasad, A.; Nair, G.M.; et al. Evaluating genomic DNA extraction methods from human whole blood using endpoint and real-time PCR assays. Mol. Biol. Rep. 2017, 44, 97–108. [Google Scholar] [CrossRef]
  29. Jing, Z.; Wang, X.; Cheng, Y.; Wei, C.; Hou, D.; Li, T.; Li, W.; Han, R.; Li, H.; Sun, G.; et al. Detection of CNV in the SH3RF2 gene and its effects on growth and carcass traits in chickens. BMC Genet. 2020, 21, 22. [Google Scholar] [CrossRef] [PubMed] [PubMed Central]
  30. Zhang, B.; Li, H.; Hu, Z.; Jiang, H.; Stablewski, A.B.; Marzullo, B.J.; Yergeau, D.A.; Feng, J. Generation of mouse-human chimeric embryos. Nat. Protoc. 2021, 16, 3954–3980. [Google Scholar] [CrossRef]
  31. Li, Y.; Liu, Q.; Pan, C.; Lan, X. The free fatty acid receptor 2 (FFA2): Mechanisms of action, biased signaling, and clinical prospects. Pharmacol. Ther. 2025, 272, 108878. [Google Scholar] [CrossRef]
  32. Wu, Q.; You, L.; Nepovimova, E.; Heger, Z.; Wu, W.; Kuca, K.; Adam, V. Hypoxia-inducible factors: Master regulators of hypoxic tumor immune escape. J. Hematol. Oncol. 2022, 15, 77. [Google Scholar] [CrossRef] [PubMed]
  33. Wang, K.; Zhang, Y.; Han, X.; Wu, Q.; Liu, H.; Han, J.; Zhou, H. Effects of Copy Number Variations in the Plectin (PLEC) Gene on the Growth Traits and Meat Quality of Leizhou Black Goats. Animals 2023, 13, 3651. [Google Scholar] [CrossRef] [PubMed] [PubMed Central]
Figure 1. Research strategies for examining HIF1A and HIF2A CNVs and slaughter traits. (A) type of altitude for data collection (B) differential expression genes; and (C) qPCR amplification.
Agriculture 15 01240 g001
Figure 2. Schematic diagram of the distribution of CNVs in the bovine HIF1A gene (A) and HIF2A gene (B). Below the CNV schematic diagram is a schematic diagram showing the locations of primers associated with different CNV sites.
Agriculture 15 01240 g002
Figure 3. Melt curve plot of CNVs in the bovine HIF1A gene, HIF2A gene, and BTF3 gene (reference holding gene). (A) Melt curve plot of primers for genotyping of CNVs. (B) Melt curve plot of primers for validation of the accuracy of CNV detection by qPCR. (C) Melt curve plot of primers BTF3 gene.
Agriculture 15 01240 g003
Table 1. Primers for bovine HIF1A and HIF2A CNVs.
GenesLociPrimer Sequences (5′–3′)Size (bp)Position
HIF1ACNV1F1a: TACGTGTGCAGTGCTCCTTT155NC_037337.1
73835197-73835352
R1a: GGCAGCAGTATTGCCTGTTT
CNV2F2a: CGTGCAGGTTTGGTTTGGTT220NC_037337.1
73837401-73837621
R2a: AGCCATCCGCTACGTTTTC
CNV3F3a: TACAGCCTAACAGTCCCAGT195NC_037337.1
73875262-73875457
R3a: GTTAAACCCACAGCCACTTGAG
CNV4F4a: TGGGTGTTTCTTATCCCGCC211NC_037337.1
73889164-73889375
R4a: GAGGCCCCAAAATGGATGGA
HIF2ACNV1F5a: CGTTCAAGAAGTGGGCAGGA155NC_037337.1
28738050-28738205
R5a: AGTGGTAGTGGGCATTCGTG
CNV2F6a: GGGTGGAAATCACCACACCA205NC_037337.1
28759005-28759210
R6a: TCAGGTGTCAAGGGCCTCTA
CNV3F7a: ATGGTAAGGTGTTCTTCGGTGT172NC_037337.1
28797001-28797173
R7a: GGGCCCTTGATCTCATCTCC
BTF3Reference geneF8a: AACCAGGAGAAACTCGCCAA166NC_037347.1
8122394-8122559
R8a: TTCGGTGAAATGCCCTCTC
Table 2. Primers for validation of bovine HIF1A and HIF2A CNVs.
LociPrimer Sequences (5′–3′)Size (bp)Position
HIF1ACNV1F1b: AGTGTGGGAACACTGTGAGC151NC_037337.1_
73834371-73834522
R1b: CTCCAAATTTGTGCCACTGCT
CNV2F2b: TGTAACCCTGTTCCTTTTAGTGA243NC_037337.1_
73847365-73847608
R2b: GGGAGTTAACATGGCAGGCT
CNV3F3b: GCTTTAACTTTGCTGGCCCC252NC_037337.1_
73872952-73873204
R3b: GTGCAGAAAACATGGCAGCA
CNV4F4b: GCCTTTGCCTGGCTACCTTA224NC_037337.1_
73889766-73889990
R4b: AGGGAGTGGGGCTCCATAAT
HIF2ACNV1F5b: CGAAGCAGGGAAGGGACTTT193NC_037337.1_
28737151-28737344
R5b: CGATTGCAACATTCGCCGAT
CNV2F6b: CAAGAGGGAGCAGGTGTCTG225NC_037337.1_
28761404-28761629
R6b: TCAGGTGTCAAGGGCCTCTA
CNV3F7b: CCTAGCAACCACCTCCACAG275NC_037337.1_
28795090-28795365
R7b: AGACACTGGAAAGCACGGAG
Table 3. Validation of bovine HIF1A and HIF2A CNVs.
LociPrimer PairsLossMediumGainAccuracy Rate
HIF1A–CNV1F/R1b0.200 (n = 6)0.767 (n = 23)0.033 (n = 1)29/30 = 96.7%
HIF1A–CNV2F/R2b0.111 (n = 3)0.889 (n = 24)0.000 (n = 0)26/27 = 96.3%
HIF1A–CNV3F/R3b0.125 (n = 4)0.688 (n = 22)0.188 (n = 6)32/32 = 100%
HIF1A–CNV4F/R4b0.000 (n = 0)0.567 (n = 17)0.433 (n = 13)30/30 = 100%
HIF2A–CNV1F/R5b0.344 (n = 11)0.469 (n = 15)0.188 (n = 6)32/32 = 100%
HIF2A–CNV2F/R6b0.100 (n = 3)0.533 (n = 16)0.367 (n = 11)29/30 = 96.7%
HIF2A–CNV3F/R7b0.065 (n = 2)0.710 (n = 22)0.226 (n = 7)30/31 = 96.8%
Table 4. Typical frequencies of copy number variations within the HIF1A and HIF2A gene.
GenesLociSizes (bp)Genotypic Frequencies
LossMediumGain
HIF1ACNV143990.110 (n = 36)0.702 (n = 229)0.187 (n = 61)
CNV212,7970.134 (n = 43)0.680 (n = 219)0.186 (n = 60)
CNV368000.228 (n = 74)0.502 (n = 163)0.271 (n = 88)
CNV414,8000.208 (n = 64)0.476 (n = 146)0.316 (n = 97)
HIF2ACNV180030.342 (n = 104)0.411 (n = 125)0.247 (n = 75)
CNV232000.174 (n = 53)0.454 (n = 138)0.372 (n = 113)
CNV328000.260 (n = 79)0.421 (n = 128)0.319 (n = 97)
Table 5. The correlation between bovine HIF1A CNVs and beef production traits.
CNVsTraitsLossMedianGainp Values
CNV1Cervical vertebrae10.99 a ± 1.91 (n = 11)7.94 a ± 0.57 (n = 114)5.44 b ± 0.82 (n = 44)0.009
Oxtail0.73 a ± 0.04 (n = 33)0.64 b ± 0.01 (n = 204)0.64 b ± 0.02 (n = 61)0.042
Rendered fat84.80 b ± 1.93 (n = 28)89.00 b ± 1.46 (n = 174)96.93 a ± 3.05 (n = 56)0.009
Flank steak2.10 a ± 0.10 (n = 33)1.95 b ± 0.03 (n = 205)1.89 b ± 0.05 (n = 60)0.023
CNV2Initial weight (kg)335.53 ab ± 7.97 (n = 40)325.18 b ± 3.83 (n = 202)342.90 a ± 6.48 (n = 57)0.026
Beef diaphragm (kg)2.07 ab ± 0.07 (n = 40)1.93 b ± 0.03 (n = 201)2.07 a ± 0.05 (n = 57)0.030
Beef knuckle bone (kg)2.03 b ± 0.13 (n = 5)2.06 ab ± 0.05 (n = 55)2.56 a ± 0.18 (n = 19)0.001
Beef tendon (kg)0.06 b ± 0.03
(n = 27)
0.16 b ± 0.05 (n = 163)0.51 a ± 0.17 (n = 47)4.59 × 10⁻⁴
Cervical vertebrae (kg)9.26 a ± 1.27 (n = 21)8.07 a ± 0.64 (n = 103)5.36 b ± 0.68 (n = 44)0.017
Flank steak (kg)6.96 a ± 0.23 (n = 39)6.97 a ± 0.10 (n = 200)6.38 b ± 0.14 (n = 57)0.017
CNV3Initial weight (kg)344.73 a ± 7.21
(n = 60)
328.38 b ± 3.87
(n = 163)
320.18 b ± 6.42
(n = 78)
0.024
Slaughter weight (kg)100.46 a ± 11.68
(n = 74)
85.94 b ± 6.73
(n = 163)
80.70 b ± 8.60
(n = 88)
0.020
Chuck (kg)9.71 a ± 0.40
(n = 56)
8.21 b ± 0.27
(n = 133)
7.70 b ± 0.46
(n = 67)
0.003
Flank steak (kg)7.26 a ± 0.16
(n = 58)
6.73 b ± 0.12
(n = 167)
6.72 b ± 0.14
(n = 77)
0.032
Beef brisket (kg)2.06 a ± 0.07
(n = 60)
1.92 ab ± 0.03
(n = 160)
1.86 b ± 0.05
(n = 77)
0.025
Chuck roll (kg)17.80 a ± 0.40
(n = 60)
16.80 ab ± 0.22
(n = 162)
16.41 b ± 0.35
(n = 77)
0.019
Patellar tendon (kg)1.16 a ± 0.03
(n = 59)
1.14 a ± 0.02
(n = 156)
1.07 b ± 0.04
(n = 72)
0.035
CNV4Femur (kg)16.80 a ± 2.47
(n = 35)
12.53 b ± 0.64
(n = 105)
11.13 b ± 0.59
(n = 77)
0.001
Chuck (kg)9.51 a ± 0.48
(n = 55)
7.94 b ± 0.28
(n = 126)
8.47 ab ± 0.39
(n = 72)
0.003
Coccygeal meat (kg)0.70 a ± 0.03
(n = 62)
0.63 b ± 0.01
(n = 145)
0.64 b ± 0.02
(n = 87)
0.011
Patellar tendon (kg)1.18 a ± 0.04
(n = 63)
1.04 b ± 0.02
(n = 139)
1.04 b ± 0.04
(n = 82)
0.003
Where: CNVs = copy number variations; Data represent means ± SEM; Row with different letters (a, b) means p < 0.05.
Table 6. The correlation between bovine HIF2A CNVs and beef production traits.
CNVsTraitsLossMedianGainp Values
CNV1Beef diaphragm (kg)2.06 a ± 0.04
(n = 103)
1.97 ab ± 0.04
(n = 125)
1.92 b ± 0.04
(n = 75)
0.030
Beef knuckle bone (kg)2.45 a ± 0.07
(n = 86)
2.26 ab ± 0.10
(n = 95)
2.04 b ± 0.10
(n = 56)
0.004
Beef tendon (kg)0.42 a ± 0.04
(n = 36)
0.27 b ± 0.06
(n = 39)
0.10 c ± 0.06
(n = 32)
1.345 × 10⁻⁴
Chuck (kg)9.07 a ± 0.37
(n = 85)
8.20 ab ± 0.37
(n = 108)
7.70 b ± 0.44
(n = 65)
0.024
Flank steak (kg)6.61 a ± 0.13
(n = 103)
6.69 ab ± 0.12
(n = 123)
7.063 b ± 0.16
(n = 75)
0.028
Patellar tendon (kg)1.21 a ± 0.04
(n = 100)
1.07 b ± 0.03
(n = 115)
0.97 c ± 0.03
(n = 71)
8.900 × 10⁻⁷
Striploin (kg)13.27 a ± 0.2
(n = 102)
12.6 b ± 0.25
(n = 125)
12.66 ab ± 0.26
(n = 75)
0.040
CNV2Longissimus dorsi width (cm)6.07 a ± 0.19
(n = 38)
5.7 b ± 0.09
(n = 59)
5.54 b ± 0.11
(n = 39)
0.007
Beef diaphragm (kg)2.07 a ± 0.05
(n = 53)
2.02 ab ± 0.04
(n = 138)
1.93 b ± 0.04
(n = 112)
0.042
Beef knuckle bone (kg)2.56 a ± 0.2
(n = 40)
2.19 b ± 0.07
(n = 107)
2.26 ab ± 0.07
(n = 90)
0.017
Chuck (kg)9.54 a ± 0.64
(n = 43)
7.86 b ± 0.31
(n = 121)
8.48 ab ± 0.37
(n = 94)
0.010
Flank steak (kg)6.39 a ± 0.17
(n = 53)
6.78 ab ± 0.12
(n = 137)
6.89 b ± 0.12
(n = 112)
0.023
Chuck roll (kg)17.74 a ± 0.44
(n = 53)
16.73 ab ± 0.27
(n = 137)
16.48 b ± 0.35
(n = 113)
0.027
CNV3Slaughter weight (kg)681.09 ab ± 9.42
(n = 78)
694.2 a ± 7.8
(n = 128)
671.03 b ± 7.18
(n = 97)
0.036
Left forelimb weight (kg)210.71 ab ± 3.86
(n = 78)
214.29 a ± 2.94
(n = 128)
205.53 b ± 2.84
(n = 97)
0.042
Right forelimb weight (kg)211.24 ab ± 3.97
(n = 78)
215.36 a ± 3.03
(n = 128)
206.43 b ± 2.96
(n = 97)
0.045
Longissimus dorsi width (cm)5.86 a ± 0.13
(n = 53)
5.83 ab ± 0.13
(n = 50)
5.47 b ± 0.10
(n = 31)
0.049
Beef Diaphragm (kg)1.96 ab ± 0.06
(n = 78)
2.07 a ± 0.04
(n = 128)
1.92 b ± 0.03
(n = 97)
0.010
Chuck (kg)9.14 a ± 0.5
(n = 62)
8.38 ab ± 0.36
(n = 115)
7.74 b ± 0.35
(n = 81)
0.024
Chuck roll (kg)17.13 ab ± 0.41
(n = 79)
17.12 a ± 0.3
(n = 128)
16.16 b ± 0.32
(n = 96)
0.036
Where: CNVs = copy number variations; Data represent means ± SEM; Row with different letters (a, b and c) means p < 0.05.
Disclaimer/Publisher’s Note: The statements, opinions and data contained in all publications are solely those of the individual author(s) and contributor(s) and not of MDPI and/or the editor(s). MDPI and/or the editor(s) disclaim responsibility for any injury to people or property resulting from any ideas, methods, instructions or products referred to in the content.

