1. Introduction
In recent years, China has made significant strides in advancing agricultural mechanization, which is an essential component of modernizing its agricultural sector. In 2023, China’s comprehensive mechanization rate of crop cultivation, planting, and harvesting reached 74.3%, and the three major staple grains of wheat, rice, and corn were mechanized, reaching 97.81%, 88.03%, and 91.67%, respectively [
1]. However, some hilly and mountainous provinces still have a low level of agricultural mechanization due to their complex topography, poor arable land conditions, and fragmented and irregular plots. In 2023, the comprehensive mechanization rate of crop cultivation in the major hilly and mountainous provinces (except for Tibet) was 53.43%, and the individual provinces still have no more than 30%, such as Yunnan, where it was only 22.56 per cent or less than 1/3 of the average for plain areas. Hilly and mountainous areas are important production bases for grain and specialty agricultural products in China, accounting for about one-third of the country’s arable land and sown area for crops, and are directly related to the production and life of nearly 300 million agricultural people. From the perspective of an all-encompassing approach to food, agricultural development in hilly and mountainous areas has a significant impact on national agricultural development. Therefore, it is necessary to study the development level, development constraints, and regional differences in the characteristics of agricultural machinery socialized services in hilly and mountainous provinces.
Agricultural Machinery Socialization Services (AMSS) is an important solution to achieve agricultural mechanization and an important way to solve the problem of “who to plant the land.” AMSS has largely solved the problem of insufficient mechanical elements in the production process of small farmers, effectively narrowing the differences in labor and technical endowments in the agricultural production process [
2] and promoting the organic convergence of small farmers and modern agriculture [
3]. By the end of 2023, the number of China’s farm machinery service organizations and farm machinery households had reached 195,600, with a farm machinery hosting operation area of 509 million mu (mu is the main unit of land area measurement used in China, 1 mu acre equals approximately 666.6667 square meters); the number of national farm machinery maintenance factories and repair points had reached 142,800, with about 49.93 million rural employees, and the income from farm machinery services had reached 482.9 billion yuan [
1]. It has become one of the significant markets in the agricultural sector in China.
Although many scholars have achieved fruitful results on the impact of the AMSS, revealing its positive effects on agricultural labor productivity [
4,
5,
6], the transfer of farmland [
7], land-scale management [
8], farmers’ motivation to grow food [
9], and alleviating relative poverty [
10], they have fully demonstrated the important role of the AMSS in organically connecting small farmers and modern agriculture [
2]. However, in terms of the regional perspective of the study, previous studies have mainly focused on the plains or economically more developed provinces, where agricultural production conditions are more favorable, and studies on the hilly and mountainous regions from this regional perspective are relatively rare [
11,
12]. Given the distinct geographic, economic, and infrastructural challenges faced by these regions, the dynamics and effectiveness of AMSS may differ significantly from those in more favorable environments. This represents a notable gap in the existing body of research.
In view of this, this manuscript focuses on the regional perspective of hilly mountainous areas, aims to explore the development level and regional differences of AMSS in hilly mountainous areas of China, analyzes the causes of obstacles restricting the coordinated development of AMSS in hilly mountainous areas, and puts forward policy recommendations to promote the development of the level of agricultural machinery socialization and the level of agricultural mechanization in hilly mountainous areas.
2. Research Design
2.1. Index System Construction of the Development Level of AMSS
Before the index system of the development level of agricultural machinery socialization is built, the first step is to clarify “How to socialize the level of agricultural machinery services”. Based on productive force determinism [
13], the existing research literature on the construction of industrial productivity evaluation systems [
14,
15], and the results of the assessment of the development level of related fields [
12,
16,
17,
18], this study intends to construct a comprehensive evaluation framework applicable to the development level of AMSS in the hilly mountainous areas of China through the three core dimensions of laborers, labor objects, and labor means. The systematic structure of the framework is characterized by the following features:
In the evaluation of the laborers’ dimension, we established a triple evaluation standard consisting of Labor Skill Level, Labor productivity, and Labor Awareness. Among them, the skill level of workers is quantitatively characterized by two indicators: the ratio of licensed agricultural machinery employees and maintenance support level; labor productivity is assessed using the disposable income of rural residents and Engel’s coefficient as the key economic parameters; and labor awareness is measured by analyzing the annual investment of rural households in fixed assets in agriculture.
In terms of the assessment framework for the labor object dimension, this study focuses on the core secondary indicator of Industrial Development. This indicator is further decomposed into three quantifiable tertiary observation points: the degree of coverage of socialized agricultural services, the index of the input level of agricultural machinery operation services, and the share of the value added of the primary industry in regional GDP.
For the comprehensive evaluation of the labor means dimension, we designed a multilevel assessment system containing four second-level indicators: Land Development (land resource allocation status), infrastructure (the degree of infrastructure completeness), Financial Support (the level of financial support), and Organizational Construction. Specifically, Land Development is assessed in two dimensions: mechanization-friendly land level and degree of land fragmentation. Infrastructure uses the total power of regional agricultural machinery as a core measurement standard. The Financial Support dimension is subdivided into two observations: the level of agricultural machinery promotion inputs and the level of agricultural machinery research inputs. Finally, the level of Organizational Construction is quantitatively characterized by the number of agricultural machinery cooperatives in the region.
The indicator system is presented in
Table 1.
2.2. Methodology for Determining Indicator Weights
In the field of methodologies for the comprehensive evaluation of agricultural development levels, existing research demonstrates significant diversity. Among them, the Delphi method, Analytic Hierarchy Process (AHP), Grey Relational Analysis (GRA), and Entropy Weight Method each exhibit distinct theoretical characteristics and application limitations. Specifically, the efficacy of the Delphi method heavily relies on expert experience, where the introduction of subjective preferences may lead to systematic bias [
19]; AHP excels in its hierarchical decision-making framework but faces mathematical challenges in consistency testing when handling complex indicator systems [
20]; GRA performs well in scenarios with small samples or high data uncertainty, yet its dynamic adaptability in weight allocation mechanisms remains insufficient [
21]; the traditional Entropy Weight Method achieves objective weight assignment through data dispersion, but its sorting capability in multi-dimensional comprehensive evaluations is constrained by inherent algorithmic structures [
22].
Based on a comparative analysis of these methodologies, this study adopts a hybrid model, the TOPSIS-Entropy Weight Method, which integrates the comprehensive sorting capability of TOPSIS (Technique for Order Preference by Similarity to Ideal Solution) with the objective weight assignment advantages of the Entropy Weight Method [
23]. The innovation of this model lies in the following: TOPSIS constructs positive and negative ideal solutions and calculates the relative closeness of evaluation objects to these solutions, ensuring mathematically rigorous interpretability and operational feasibility; the Entropy Weight Method assigns weights based on the dispersion degree of indicator data, thereby effectively avoiding interference from subjective factors [
24]. The synergy between these two approaches not only guarantees the scientific rigor of the weight allocation process but also significantly enhances the precision and robustness of the comprehensive evaluation results [
25].
Compared to other methods, the TOPSIS-Entropy Weight Method exhibits multidimensional advantages: first, its objective weight assignment mechanism substantially reduces the risk of human intervention; second, the bidirectional reference framework of positive and negative ideal solutions strengthens the scientific validity and comparability of evaluation outcomes; and third, the method demonstrates universality for complex evaluation systems with multiple hierarchies and indicators. Consequently, this study asserts that the TOPSIS-Entropy Weight Method can more comprehensively and accurately analyze the regional heterogeneity characteristics of agricultural machinery socialization service levels in hilly and mountainous areas, thereby providing robust methodological support for the core research objectives.
Entropy Weight TOPSIS Method
In order to standardize the data, this manuscript uses the polar deviation standardization process, and the specific formula is as follows:
Within the formula’s definitional framework, the variable is designated as the raw observed value of the -th indicator for the -th provincial-level administrative unit (province, municipality, or autonomous region, hereinafter collectively referred to as province), prior to standardization. Here represents the maximum value within the time series of the -th indicator for the respective administrative unit during the period 2018–2022, while corresponds to the minimum value of the same indicator series within the identical temporal scope. The standardized outcome is subsequently quantified by the variable , which encapsulates the normalized performance of the -th administrative unit on the -th indicator.
The information entropy is calculated as follows:
In Equation (3), , is the product of the number of hilly and mountainous provinces and the number of years selected, and is the relative value of the standardized value of the -th indicator in the -th province.
Determine the weights
:
In Equation (3), and .
Next, the weighting matrix is constructed as follows:
Determine the optimal and worst solutions.
The Euclidean distance of each solution from the optimal and worst solutions is calculated as follows:
Finally, the composite evaluation index is calculated as follows:
2.3. The Obstacle Degree Model
The Obstacle Degree Model, rooted in systems theory and multi-criteria decision analysis (MCDA), was initially conceptualized to quantify impediments within complex socio-ecological systems (SES). By assigning weighted indices to barrier factors through entropy-based objective weighting, The Obstacle Degree Model identifies dominant obstacles while minimizing subjective bias [
26], making it particularly suited for evaluating agricultural mechanization challenges in topographically fragmented regions.
In order to explore the obstacle factors constraining the development of AMSS in hilly and mountainous areas, this manuscript uses the obstacle degree model, as well as the weight indicator system and data sources determined based on the TOPSIS-entropy weight method, to analyze the main obstacle factors of the development level of AMSS in different regions, aiming at identifying constraints to AMSS in different hilly and mountainous provinces.
The diagnostic model of the obstacle degree factors is as follows:
In Equations (9) and (10), is the barrier degree of a single indicator, K is the number of indicators (number of dimensions), and is the barrier degree of a subsystem.
2.4. Dagum Gini Coefficient Decomposition Method
The Dagum Gini coefficient and decomposition method is a method that can measure regional differences [
27]. The Gini coefficient can be decomposed into three parts: intra-regional disparity (
), inter-regional disparity (
) and hypervariable density (
).
The specific method is as follows:
In Equation (11), G is the overall Gini coefficient, where represents the number of regional divisions and represents 30 provinces; represents the level of AMSS in province within region , represents the number of provinces within region , and represents the average of the level of AMSS in all provinces.
In Equation (12), represents the Gini coefficient for area .
In Equation (13), , ,, and , .
In Equation (15), , and is the relative impact of the index of the level of development of AMSS between j and h regions; , which is the difference in the contribution of the level of development of AMSS between regions, is the weighted average of all sample values of in j and h regions; , which denotes the hypervariable first-order moments, which is the weighted average of all sample values of for j and h regions average. are the cumulative density distribution functions for region j(h), respectively.
2.5. Data Sources and Description
Administratively, China is divided into 34 provincial-level administrative regions, of which hilly and mountainous regions are mainly found in 18 provinces. Based on the academic framework of China’s tillage system zoning and the spatiotemporal dynamics of hilly and mountainous area distributions across regions, with provincial-level administrative units serving as the core spatial analytical units, China’s hilly and mountainous areas can be classified into six agroecological zones. These include:
Northeast and Huang-Huai-Hai Hills Single- or Double-Cropping
Northwest Plateau Hills and Mountains Single- or Double-Cropping Zone;
Qinghai-Tibet Plateau Mountain Single Cropping Zone;
Southwest Mountainous Hills Double-Cropping Zone
Yangtze River Mid-Lower Reaches Hills and Mountains, Double-or-Triple-Cropping Zone
South China Hills and Mountains Triple- or Double-Cropping Zone.
Further integrating the official 2019 county-level delineation of hilly and mountainous areas issued by the Department of Agricultural Mechanization Management under the Ministry of Agriculture and Rural Affairs of China, the focal research subjects are categorized into three geographic clusters:
Cluster 1: Southwestern hilly and mountainous regions encompassing Yunnan, Guizhou, Sichuan, and Chongqing;
Cluster 2: Northwestern loess hilly and mountainous areas, including Shaanxi, Gansu, Ningxia, Shanxi, and Qinghai
Cluster 3: Southern low-relief hilly regions, including Guangxi, Guangdong, Hunan, Hubei, Jiangxi, Fujian, Hainan, and Zhejiang.
(Considering the unique cultivation structure of Tibet, this manuscript excludes Tibet.)
Grounded in this multi-dimensional zoning framework, combined with the most recent publicly available statistical data from the Chinese government, the empirical analysis ultimately selects a panel dataset spanning 2020–2022 from 17 provincial-level administrative units within four representative zones:
Northwest Plateau Hills and Mountains Single- or Double-Cropping Zone
Southwest Mountainous Hills Double-Cropping Zone
Yangtze River Mid-Lower Reaches Hills and Mountains, Double-or-Triple-Cropping Zone
South China Hills and Mountains Triple- or Double-Cropping Zone.
This dataset aims to systematically elucidate the spatiotemporal heterogeneity in the development of socialized agricultural machinery services across these regions.
This indicator system contains a total of 14 Tertiary Indicators. The data for this study were obtained from the China Rural Statistics Yearbook, China Agricultural Machinery Industry Yearbook, China Environmental Statistics Yearbook, and relevant web portals of the Ministry of Agriculture and Rural Development, National Bureau of Statistics, Ministry of Natural Resources, and provincial governments. Since there is a small amount of missing data in the original data, in order to minimize the sample loss, the missing data were processed using the analogical method or the linear interpolation method.
3. Empirical Analysis
3.1. Analysis of the Results of the Development Level of AMSS
This study systematically applied the Entropy Weight Method to preliminarily quantify the weights of indicators within the comprehensive evaluation system for the development level of the AMSS in China’s hilly and mountainous areas. Subsequently, minor rational adjustments were implemented to the weight parameters through an expert scoring method, resulting in finalized weight allocations that integrate theoretical consistency and practical applicability (see
Table 2). Under this methodological framework, the TOPSIS-Entropy Weight hybrid model was employed to conduct a multidimensional quantitative assessment of the composite indices reflecting provincial-level development of machinery socialization services (results shown in
Table 3).
The analysis of the weight structure in
Table 2 reveals the following hierarchical insights:
The Labor Means dimension dominates the weighting system (55.52%), with its tertiary indicators—including Land Mechanization Suitability, Land Fragmentation Index, and Proportion of Machinery Cooperatives—each exceeding the 10% critical threshold.
The Labor Object dimension ranks second in importance (25.24%), where the Service Coverage Rate and Service Revenue Index contribute over 10% weight each.
The Laborers dimension holds the lowest aggregate weight (16.83%), yet its core sub-indicators—Operator Skill Level and Maintenance Support Capacity—demonstrate significant influence, with weights surpassing 5%.
Among the 17 provinces studied, 12 exhibited positive growth trends in their composite indices, with Fujian Province leading at a growth rate of 20.43%, followed by Zhejiang Province (10.14%), while Gansu (7.33%), Chongqing (6.83%), Shaanxi (5.08%), and Hubei (5.12%) surpassed the significant threshold of 5% growth. In contrast, Jiangxi Province (−5.31%), Shanxi Province (−2.11%), Guangxi Zhuang Autonomous Region (−1.97%), and Yunnan Province (−1.38%) showed declines in their composite indices compared to the baseline year (2020), with Jiangxi Province demonstrating the most pronounced negative fluctuations.
Regarding the absolute value distribution in 2022, Hunan Province (0.3701), Hubei Province (0.3469), Guangxi Zhuang Autonomous Region (0.3328), Ningxia Hui Autonomous Region (0.3257), Shanxi Province (0.3061), Gansu Province (0.3059), and Guangdong Province (0.3091) all exceeded 0.30, forming the high-value zone; Zhejiang Province (0.2987), Shaanxi Province (0.2752), Qinghai Province (0.2465), Sichuan Province (0.2414), and Hainan Province (0.2925) were situated in the median range of 0.20–0.30; whereas Yunnan Province (0.1361), Chongqing Municipality (0.1611), Guizhou Province (0.1842), and Fujian Province (0.2328) remained in the low-value zone, despite Fujian’s notable growth rate, its baseline value remained relatively low.
From a geographical perspective, the Yangtze River Mid-Lower Reaches and South China Hilly Regions achieved a mean composite index of 0.3309 in 2022, consistently leading nationally. The Southwest Mountainous Hills Double Cropping Zone recorded a mean of only 0.1605, which was significantly lower than that of the other regions. The Northwest Loess Hilly Region saw its mean rise to 0.2987, primarily attributed to the outstanding contribution of Gansu Province (+7.33%).
3.2. Analysis of the Results of the Obstacle Degree Model
In systematically identifying the critical barriers constraining the development level of AMSS in hilly and mountainous areas, this study employs the Barrier Degree Model (BDM) to conduct a diagnostic analysis from the dual perspective of the hierarchical indicator system. Specifically, grounded in the previously established three-dimensional evaluation framework encompassing Laborers, Labor Object, and Labor Means, the barrier degrees are quantified for both secondary indicators (e.g., labor productivity, industrial development, land development) and tertiary indicators (e.g., land fragmentation index, proportion of machinery cooperatives, skill level of agricultural machinery practitioners). This dual-scale analytical approach is designed to elucidate the interaction mechanisms between macro-structural and micro-operational barriers, thereby precisely pinpointing the core contradictions hindering service efficiency—whether stemming from imbalanced policy resource allocation, technological adaptability limitations, or grassroots organizational capacity deficits.
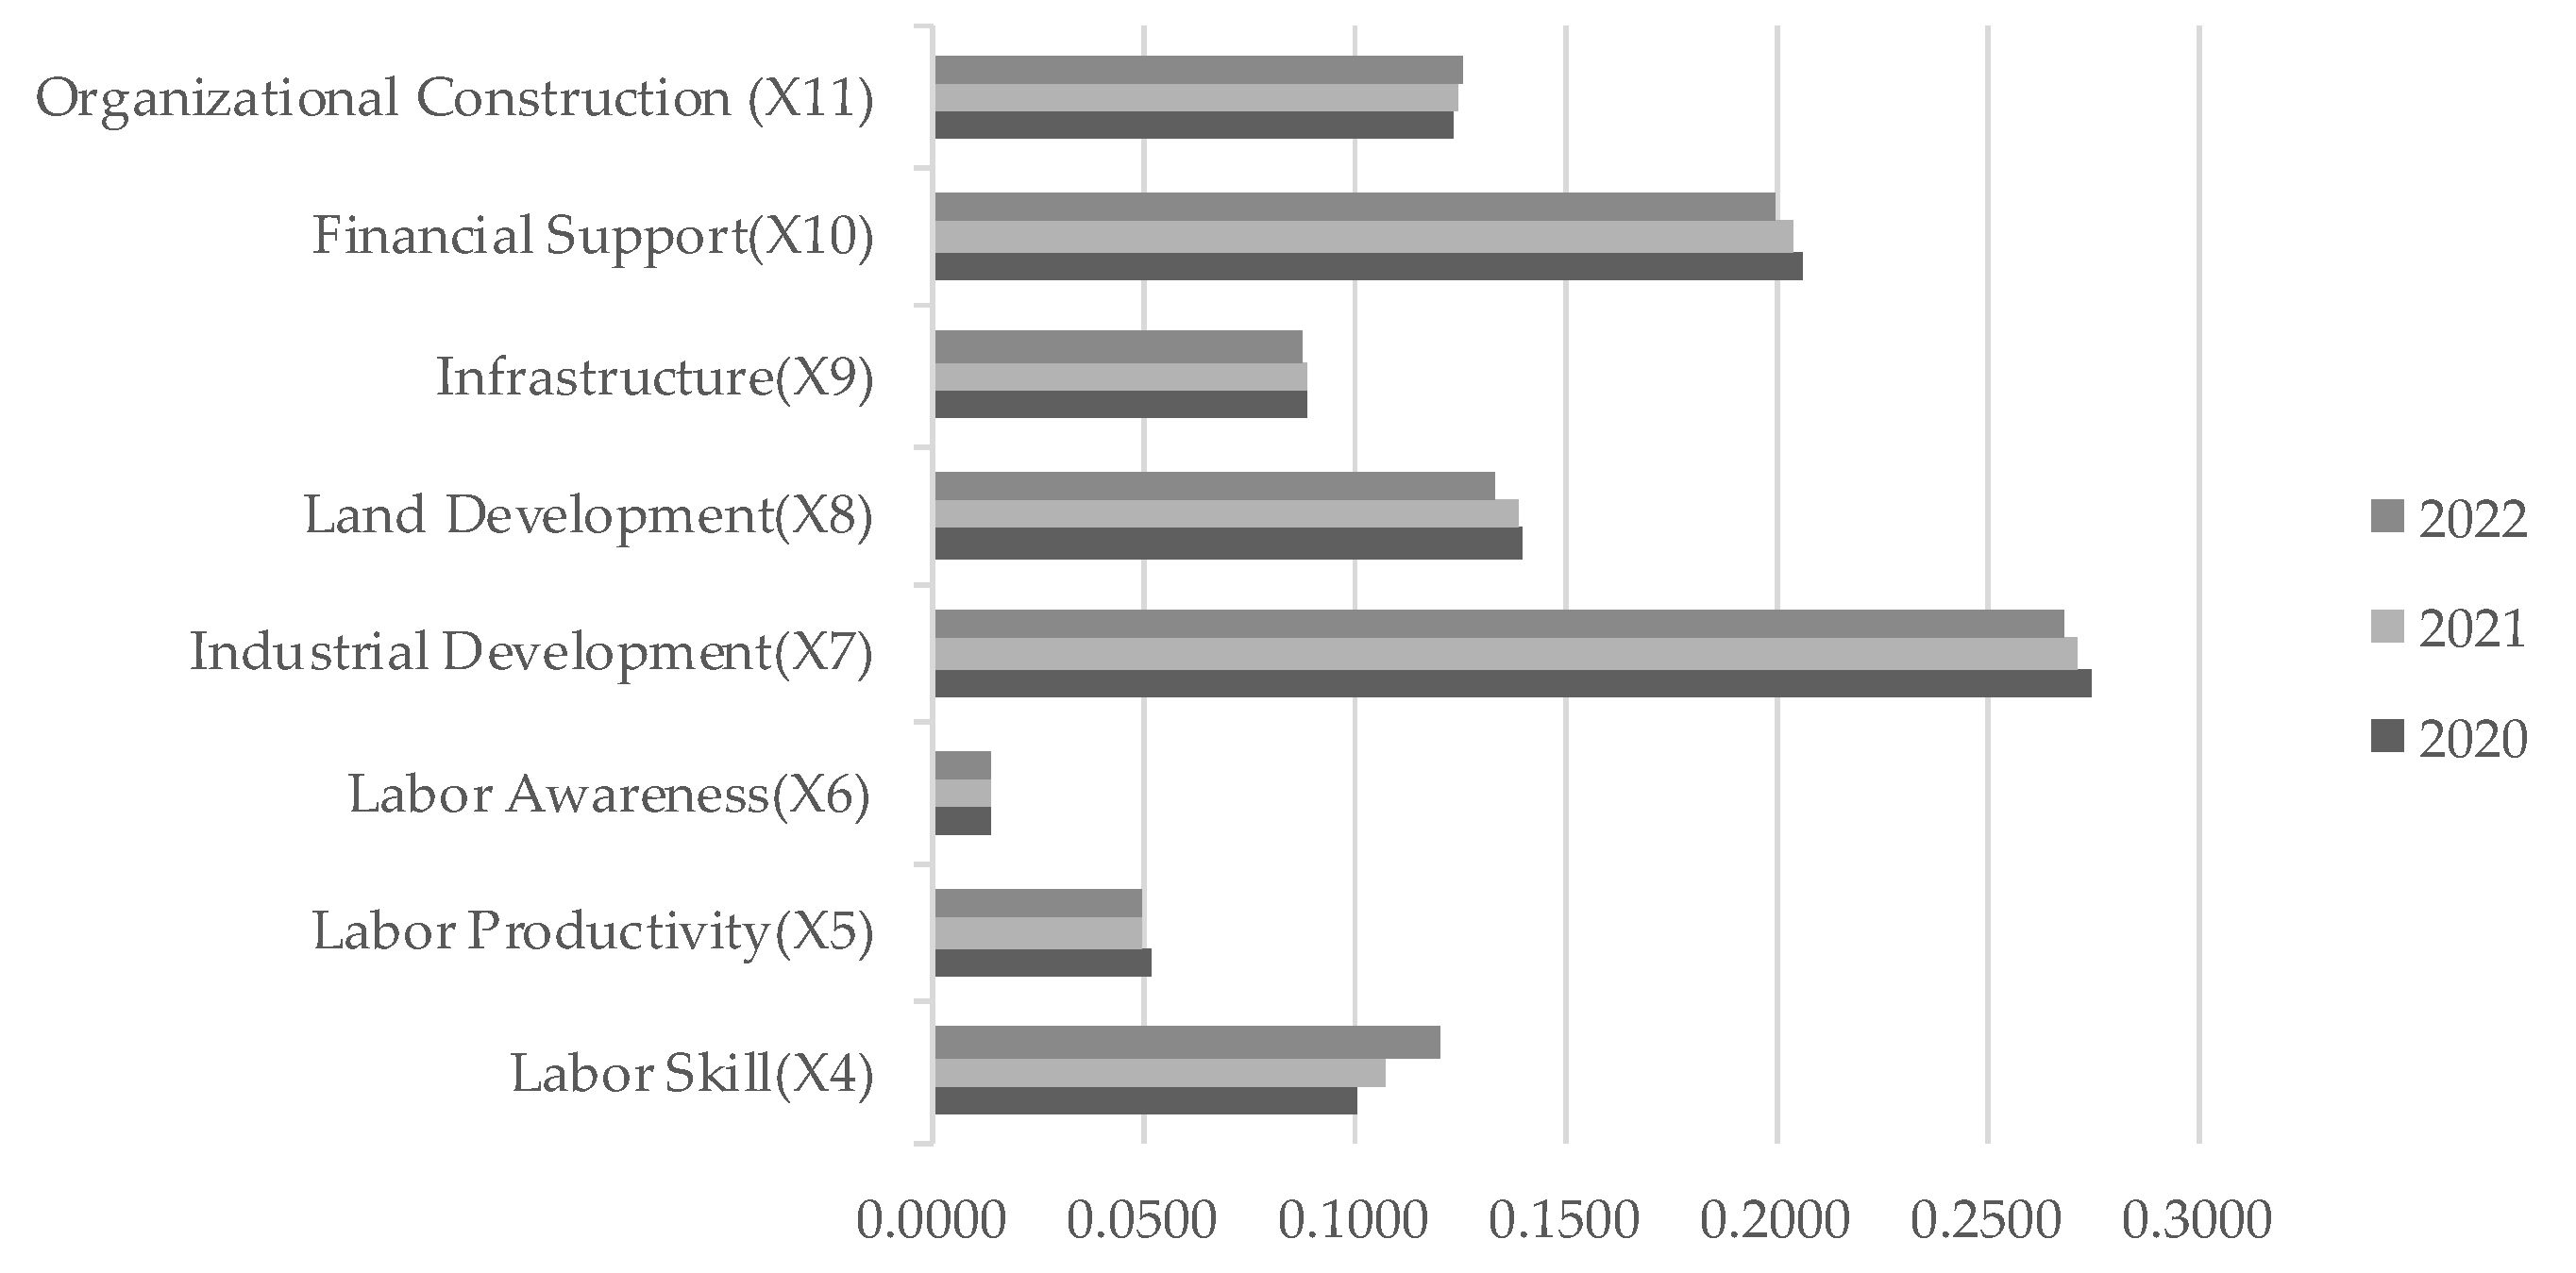
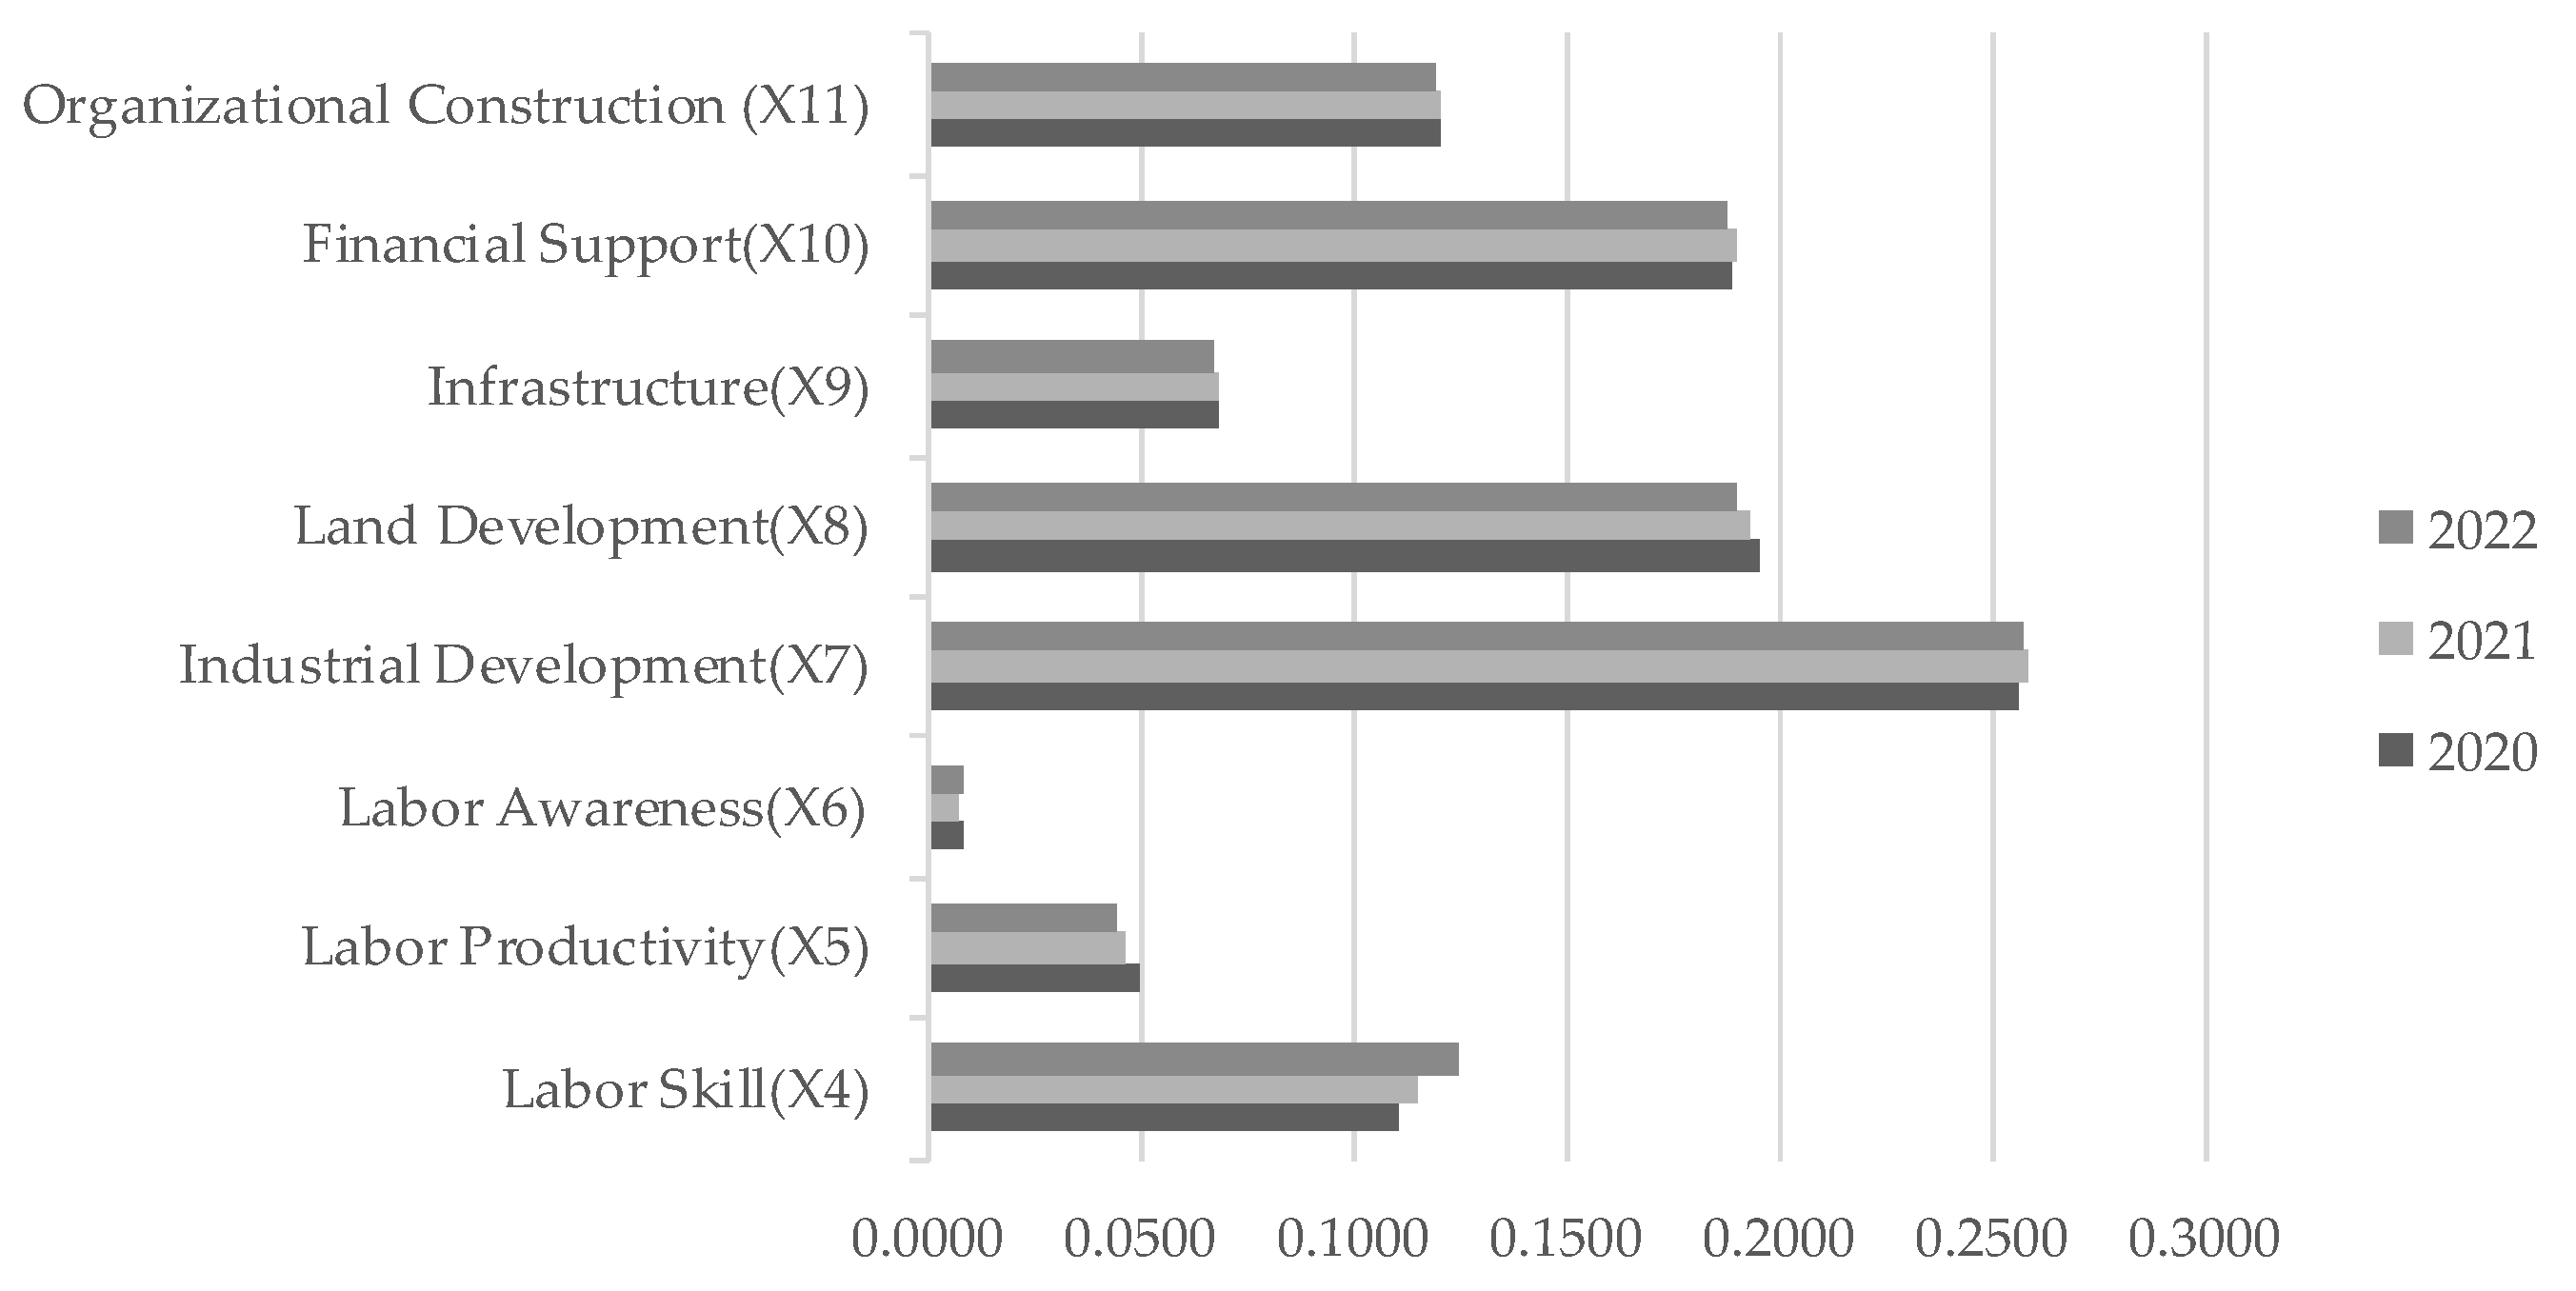
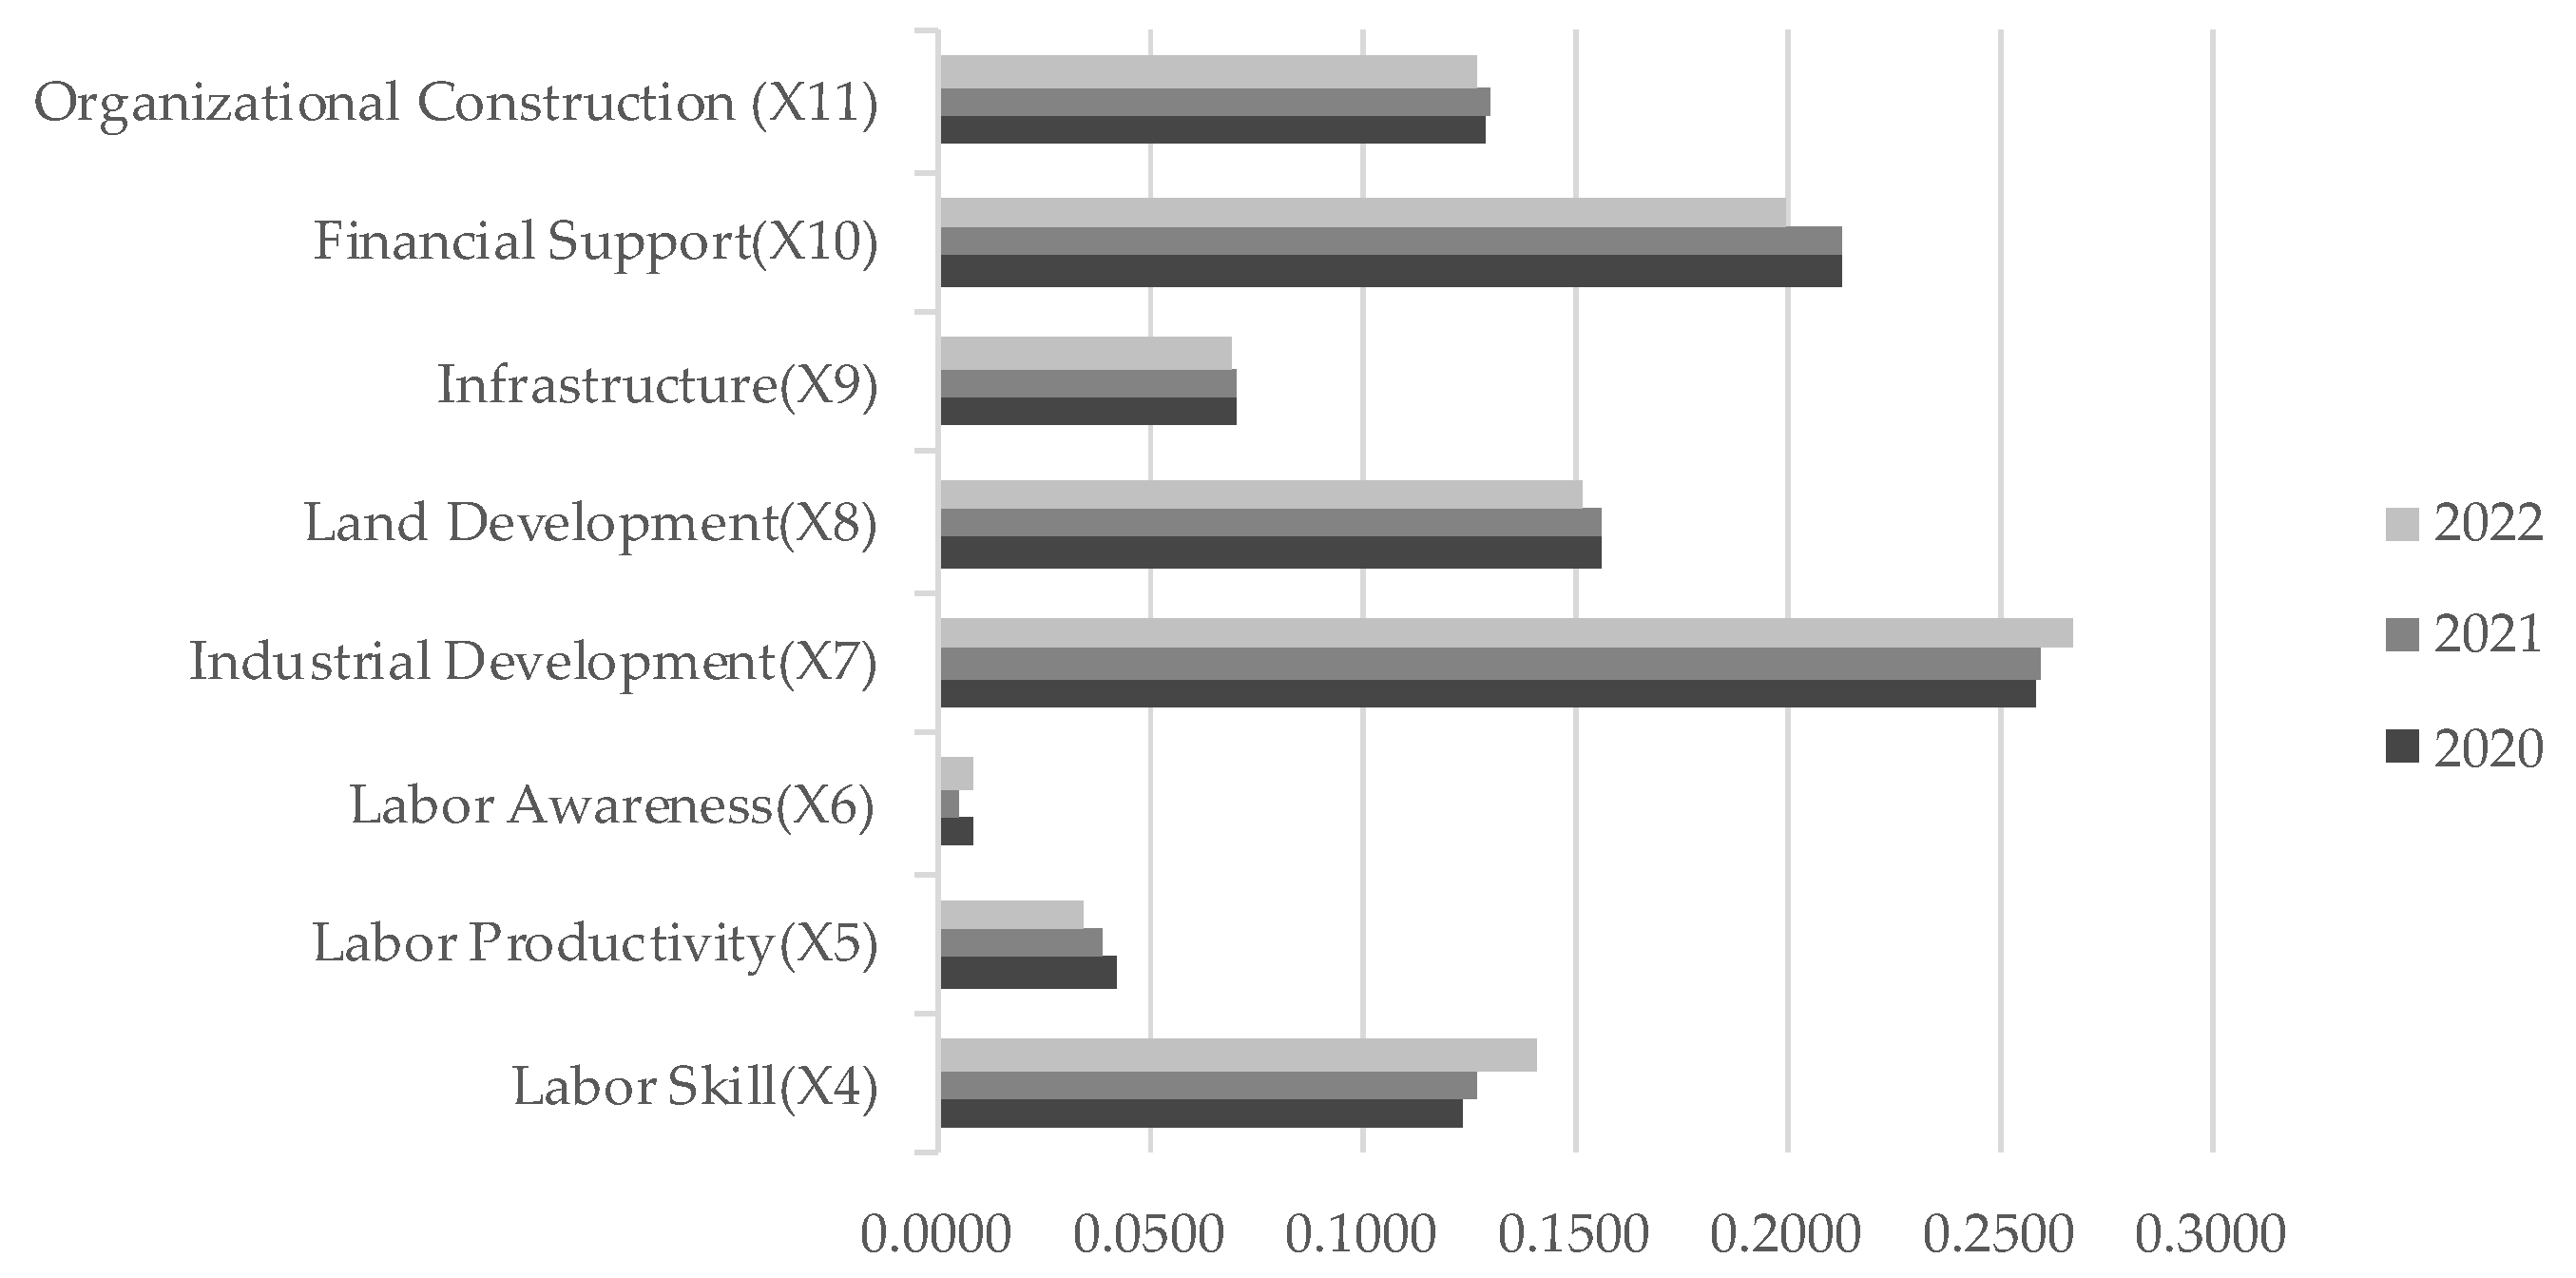
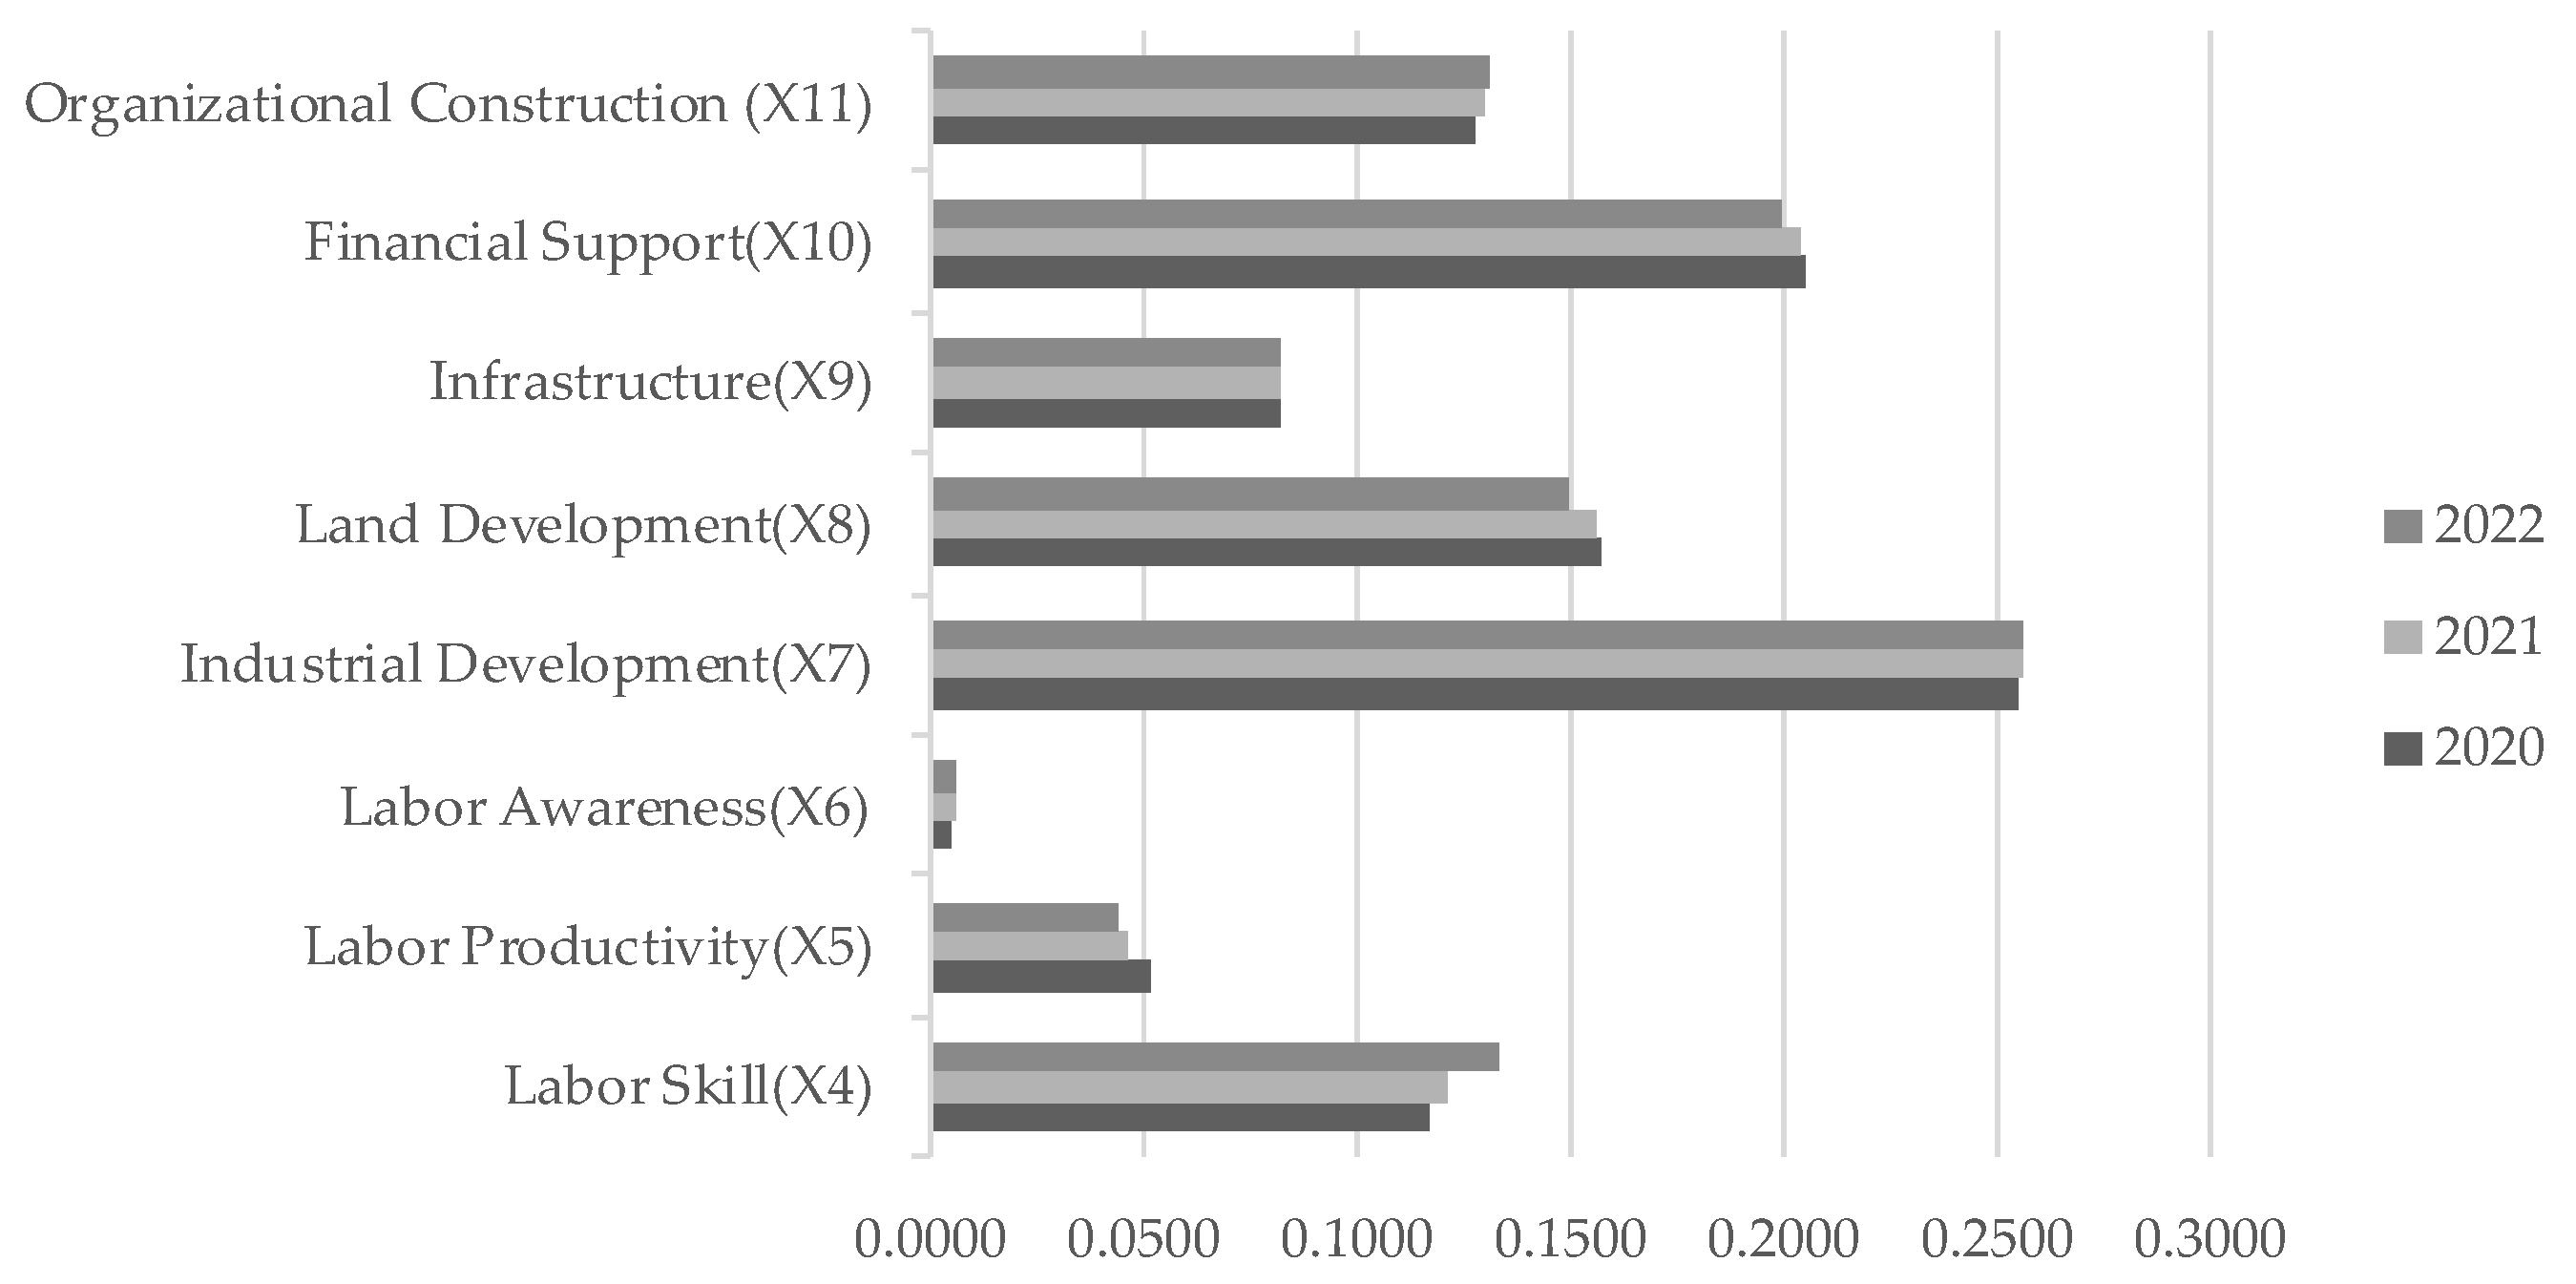
3.2.1. Trend Analysis of Barrier Effects from the Perspective of Secondary Indicator
Analysis of the barrier degrees of secondary indicators in four hilly and mountainous regions— the Northwest Plateau Hills and Mountains Single-or-Double Cropping Zone, Southwest Mountainous Hills Double Cropping Zone, Yangtze River Mid-Lower Reaches Hills and Mountains Double-or-Triple Cropping Zone, and South China Hills and Mountains Triple-or-Double Cropping Zone—reveals the following characteristics from 2020 to 2022:
Labor Skill (X4) showed continuous increases across all regions, rising from 0.1003 to 0.1208 in the Northwest Zone and from 0.1238 to 0.1416 in the Yangtze River Mid-Lower Reaches Zone; Labor Productivity (X5) declined in all regions except the Northwest Zone (0.0517→0.0500), with the Southwest Zone decreasing from 0.0502 to 0.0447 (11.0% reduction); Industrial Development (X7) slightly decreased in the Northwest Zone (0.2744→0.2683) and South China Zone (0.2554→0.2564), while increasing from 0.2587 to 0.2667 in the Yangtze River Mid-Lower Reaches Zone; Land Development (X8) declined universally, from 0.1954 to 0.1899 in the Southwest Zone and 0.1573 to 0.1499 in the South China Zone; Financial Support (X10) decreased in the Northwest Zone (0.2060→0.2003), Southwest Zone (0.1891→0.1878), and South China Zone (0.2054→0.1992), with a temporary peak of 0.2131 in the Yangtze River Mid-Lower Reaches Zone in 2021 before dropping to 0.2002 in 2022.
Regional disparities highlight that Industrial Development (X7) exhibited the highest barrier degrees in the Northwest Zone (0.2683 in 2022) and Yangtze River Mid-Lower Reaches Zone (0.2667 in 2022), while Land Development (X8) was significantly higher in the Southwest Zone (0.1899 in 2022), and Labor Awareness (X6) remained below 0.015 in all regions (0.0057 in the South China Zone, 2022).
Notable anomalies include Labor Skill (X4) in the Yangtze River Mid-Lower Reaches Zone reaching 0.1416 in 2022 (a 14.4% increase from 2020), its Financial Support (X10) peaking at 0.2131 in 2021 before declining to 0.2002 in 2022, and Land Development (X8) in the Southwest Zone recording the highest value (0.1954) in 2020 across all regions.
3.2.2. Trend Analysis of Barrier Effects from the Perspective of Tertiary Indicator
The degree of obstacles from the perspective of the tertiary indicator is shown in
Table 4.
From the perspective of barrier factor frequency:
Coverage of Agricultural Socialized Services(X17) appears in the top five barriers of 16 provinces (94.1%), ranking within the top two positions in 14 provinces, with barrier degrees ranging from 0.1187 (Fujian) to 0.1498 (Hunan);
Land Fragmentation Degree (X21) occurs in 15 provinces (88.2%), ranking within the top two in 11 provinces, peaking at 0.1534 in Hunan;
Number of Agricultural Machinery Cooperatives (X25) is observed in 14 provinces (82.4%), entering the top three in Gansu (0.1289), Hubei (0.1352), and Guangdong (0.1341);
Input Level of Agricultural Machinery Operation Services (X18) appears in 12 provinces (70.6%), with a higher frequency in northwestern provinces such as Ningxia (0.1314), Qinghai (0.1285), and Gansu (0.1137).
Level of Agricultural Machinery Promotion Inputs (X23) is present in 14 provinces (82.4%), but its values range from 0.0978 (Chongqing) to 0.1137 (Ningxia), except for Guangxi (0.199).
Among the low-frequency factors, Mechanization-Friendly Land Level (X20) is recorded only once (Yunnan: 0.1113), Level of Agricultural Machinery Research Inputs (X24) appears in four provinces (23.5%) with values between 0.0946 (Hunan) and 0.1050 (Guangxi), and Total Agricultural Machinery Power (X22) is absent from all provinces’ top five rankings.
3.3. Regional Disparity Analysis of the Development Level of AMSS
To conduct a deep analysis of the overall disparities and their sources in the development level of the AMSS, we use the Dagum Gini coefficient decomposition method to decompose the overall disparities into disparities within a region, disparities between regions, and hypervariable density. The results are presented in
Table 5.
For simplicity, the Northwest Plateau Hills and Mountains Single-or-Double Cropping Zone is abbreviated as Northwest Zone, Southwest Mountainous Hills Double Cropping Zone is abbreviated as Southwest Zone, and Yangtze River Mid-Lower Reaches Hills and Mountains Double-or-Triple Cropping Zone is abbreviated as Yangtze River Mid-Lower Reaches Zone. The South China Hills and Mountains Triple-or-Double Cropping Zone is referred to as the South China Zone.
First, in terms of overall disparities, the overall Gini coefficient of the AMSS exhibits a declining trend, decreasing from 0.137 in 2020 to 0.127 in 2022, with an average value of 0.132. This indicates a gradual mitigation of interregional imbalances in the service development levels.
Second, at the level of disparities within the regions, the Gini coefficients of the four major zones (Northwest, Southwest, Yangtze River Mid-Lower Reaches, and South China) range from 0.052 (Northwest Zone, 2022) to 0.119 (Southwest Zone, 2021), all of which are lower than the overall national level. Among them, the Southwest Zone consistently demonstrates the highest intra-regional disparities, potentially linked to its complex topography and fragmented land management systems, while the Northwest Zone shows the lowest internal divergence. The evolutionary trends vary regionally: the Southwest Zone experiences minor fluctuations with a slight upward tendency (0.114→0.117), whereas the South China Zone exhibits a significant reduction (0.100→0.068).
Third, in terms of disparities between regions, the largest interregional gaps are observed between the Southwest Zone and Yangtze River Mid-Lower Reaches Zone (0.288–0.289), followed by disparities between the Southwest Zone and South China Zone (0.237–0.240). In contrast, the smallest gaps exist between the Northwest Zone and Yangtze River Mid-Lower Reaches Zone (0.073–0.076). These patterns reflect structural constraints, such as uneven policy implementation in southwestern provinces and technological diffusion barriers between coastal and inland regions.
Fourth, regarding the contribution rate, the mean contributions of intra-regional disparities, interregional disparities, and hypervariable density during 2020–2022 are 13.67%, 73.28%, and 13.05%, respectively. The dominance of interregional disparities (73.28%) highlights systemic imbalances in cross-regional resource allocation, particularly in financial support (X10) and machinery cooperative networks (X25). Notably, the hypervariable density shows a consistent decline (14.58%→11.53%), suggesting reduced asymmetric interactions among adjacent regions over time.
4. Conclusions and Implications
Based on the basic connotation of new quality productivity, this manuscript constructs a comprehensive evaluation index system for the development level of agricultural machinery socialized services in hilly and mountainous areas and uses the comprehensive index measured by the entropy weight method combined with the TOPSIS model. The obstacle factor diagnostic model and the Dagum Gini coefficient and its decomposition were respectively adopted to analyze and describe the evolution trends of the obstacle factors and obstacle degrees of the development level of agricultural machinery socialized services in hilly and mountainous areas, as well as the regional differences and evolution dynamics of the development level. The basic conclusions are as follows:
First, from the perspective of the criterion layer weights measured by the entropy weight method, the coverage degree of agricultural machinery socialized services, income level of agricultural machinery operation services, proportion of agricultural machinery professional cooperatives, degree of land fragmentation, and level of land suitability for machinery have a higher relative importance for the development level of agricultural machinery socialized services in hilly and mountainous areas. According to the TOPSIS model results, the development level indices of Hunan, Hubei, Guangxi, and Ningxia are relatively high. The development level indices of Gansu, Zhejiang, and Fujian show a strong upward trend, while those of Sichuan, Fujian, Guizhou, Chongqing, and Yunnan are relatively low. The development level indices of Guangxi, Jiangxi, and Yunnan show a downward trend.
Secondly, the diagnostic model of obstacle factors indicates that there are many commonalities in the trend of the obstacle degree of the secondary indicators of agricultural machinery socialized services in hilly and mountainous areas in China. The development level of the industry ranks first. The influence of financial support, land construction, labor skills, and organizational construction on the development of socialized services of agricultural machinery is also at the forefront. This is closely related to the relatively backward industries in our hilly and mountainous areas, the high incidence of poverty, the relatively backward socialized service market, the loss and aging of the labor force, and the fragmented nature of the land.
Thirdly, the Dagum Gini coefficient and its decomposition results indicate that the overall differences in the development levels of agricultural machinery socialized services in hilly and mountainous areas of our country show a narrowing trend. Intra-regional differences are lower than the overall relative differences. Among them, the intra-regional differences within the middle and lower reaches of the Yangtze River are lower than those within the northwest region and also lower than those within the South China region, while the internal differences within the southwest region are the greatest. In addition, the differences among regions as a whole also show a slight narrowing trend, among which the differences between the southwest region and the other three regions are the greatest. The relative differences among regions are the main source that dominates the relative differences in the development level of agricultural machinery socialized services in hilly and mountainous areas, and the contribution rate shows a gradually increasing trend.
Based on the above research findings, this manuscript proposes the following recommendations to enhance AMSS in hilly and mountainous regions:
1. Increase Research Investment to Inject Technological Innovation Vitality.
The primary challenge for agricultural machinery services in hilly areas is the contradiction between equipment demand and the scarcity of suitable machinery. To address this, increased fiscal investment and project support are essential. Accelerating the development of machinery tailored to the needs of hilly and mountainous industries, such as equipment that meets young operators’ ergonomic requirements and aligns with green, low-carbon development goals.
2. Explore Service Models and Encourage Moderate-Scale Operations.
Support service organizations should provide comprehensive mechanized or specialized services for critical farming stages through cross-regional operations, contract farming, and agricultural production trusteeship. Transfer labor-intensive and technically demanding tasks to professional service providers to achieve economies of scale. Governments should enhance subsidies for high-demand specialized operations to reduce land transfer costs for service organizations and facilitate large-scale contiguous operations.
3. Leverage Institutional Advantages to Form Policy-Funding Synergies.
Innovate policies for “mechanization-friendly” farmland modifications in hilly areas and reform machinery purchase subsidy mechanisms. Expanding subsidy coverage for hilly-specific machinery can simultaneously enhance land adaptability and machinery suitability, thereby boosting agricultural mechanization.
4. Prioritize Talent Development and Building a Skilled Workforce.
Address the aging workforce of machinery operators by attracting younger generations through the following: Firstly, designing ergonomic machinery (as noted in Recommendation 1); Secondly, enhancing operators’ professional pride and recognition via skill competitions, certification programs, and incentives; Thirdly, conducting field operation and maintenance training through existing service organizations and enterprises to cultivate a high-quality workforce.
5. Improve Market Mechanisms and Standardize Service Markets.
The market-driven nature of machinery services necessitates standardized governance. Strengthen regulatory oversight to ensure service quality, provide dispute resolution channels, and establish robust market frameworks. This will reduce transaction costs, enhance the operational efficiency of service providers, and lower costs for farmers.


