Article

Spatiotemporal Patterns of Agriculture Expansion Intensity and Land-Use/Cover Changes in the Mixed Urban-Rural Upper Kafue River Basin of Zambia (1989–2019)

1
School of Graduate Studies, Copperbelt University, Kitwe 10101, Zambia
2
Department of Plant and Environmental Sciences, School of Natural Resources, Copperbelt University, Kitwe 10101, Zambia
3
Department of Environmental Management, Rajarata University of Sri Lanka, Mihintale 50300, Sri Lanka
4
Faculty of Life and Environmental Sciences, University of Tsukuba, 1-1-1 Tennodai, Tsukuba City 305-8572, Ibaraki, Japan
*
Author to whom correspondence should be addressed.
Agriculture 2025, 15(10), 1047; https://doi.org/10.3390/agriculture15101047
Submission received: 26 January 2025 / Revised: 24 April 2025 / Accepted: 27 April 2025 / Published: 12 May 2025
(This article belongs to the Section Agricultural Economics, Policies and Rural Management)

Abstract

:
Understanding land-use and land-cover (LULC) changes is essential for sustainable land management, particularly in regions experiencing rapid urbanization and agricultural expansion. This study analyzes the LULC dynamics in the Upper Kafue River Basin, Zambia, from 1989 to 2019, using remote-sensing data, Geographic Information Systems (GISs), and advanced analytical techniques such as intensity analysis and directional gradient analysis. The findings indicate a notable decline in forest cover, primarily driven by agricultural expansion, while built-up areas increased, reflecting urban growth. Forest-to-agriculture conversion emerged as the dominant driver of change, with significant transitions also occurring across multiple land categories. The results highlight a dynamic and complex landscape shaped by overlapping socio-economic and environmental pressures, emphasizing the need for targeted policy interventions to mitigate environmental degradation. These insights provide valuable guidance for policymakers and land managers seeking to balance development with conservation in Zambia and similar regions.

1. Introduction

Land-use and land-cover (LULC) changes represent critical environmental processes influenced by socio-economic, demographic, and environmental factors [1,2]. These changes have far-reaching implications for ecosystems, climate regulation, and sustainable development. Understanding the dynamics of LULC changes, especially in transitional landscapes like river basins, is essential for developing evidence-based policies and informed land-management decisions [3]. River basins are ecological hotspots due to their roles in supporting livelihoods, biodiversity, and agricultural productivity, making them ideal regions for analyzing human–environment interactions [4].
The Upper Kafue River Basin in Zambia exemplifies a complex urban–rural interface undergoing significant LULC transformations. As a key component of the Kafue River system, this basin sustains various land uses, including agriculture, forestry, and urban development [5]. However, rapid urbanization and agricultural expansion have intensified competition for land and natural resources, resulting in deforestation, habitat fragmentation, and land degradation [6,7]. Despite its ecological and socio-economic significance, there is limited research investigating the spatiotemporal patterns of LULC changes within this region, particularly the interactions between urban growth and agricultural intensification [8,9].
Existing studies on LULC changes in Zambia and broader sub-Saharan Africa have primarily examined either rural agricultural systems or urban expansion in isolation. For instance, Ref. [7] conducted a detailed analysis of deforestation in Zambia’s Miombo woodlands, attributing significant forest loss to the combined pressures of charcoal production and agricultural encroachment. Similarly, Simwanda et al. provided an in-depth examination of urban expansion in Lusaka, highlighting how rapid population growth and infrastructural development have led to extensive land-use changes [6]. In addition, regional studies have underscored the alarming rates of deforestation and biodiversity loss due to agricultural expansion and population pressure [4,8]. Laurence et al. emphasized the global importance of tracking LULC changes in tropical landscapes to address food security, climate change mitigation, and ecosystem conservation [2]. However, integrated analyses of how urban and rural dynamics converge in transitional landscapes like river basins remain scarce. Bridging this knowledge gap is crucial for crafting sustainable land-management strategies that balance environmental protection with socio-economic development.
This study examines the spatiotemporal patterns of LULC changes and agricultural expansion intensity in the Upper Kafue River Basin from 1989 to 2019. Utilizing advanced remote-sensing and Geographic Information System (GIS) techniques, the research generates high-resolution LULC maps through robust classification methods. To capture the magnitude, intensity, and spatial distribution of agricultural expansion, the study applies intensity analysis and directional gradient analysis, following best practices established in LULC research [3,9,10]. This comprehensive approach ensures an in-depth understanding of the drivers and dynamics of land-use transformations over the study period.
The study’s primary objectives are threefold: (1) to map and quantify LULC changes within the Upper Kafue River Basin over three decades, (2) to assess the intensity and spatial distribution of agricultural expansion and other LULC changes, and (3) to evaluate the socio-economic and environmental implications of these changes for sustainable land-use planning and policy development. By pursuing these goals, the research makes significant contributions to understanding LULC dynamics in sub-Saharan Africa and provides practical insights for managing similar landscapes undergoing rapid socio-economic transformations.
This study supports the achievement of several United Nations sustainable development goals (SDGs). Specifically, the findings contribute to SDG 2 (zero hunger) by assessing the impacts of agricultural expansion on food production and land-use efficiency, aligning with Target 2.3 (double the agricultural productivity and incomes of small-scale food producers) and Indicator 2.4.1 (proportion of agricultural area under productive and sustainable agriculture). Additionally, the study informs SDG 13 (climate action) by analyzing deforestation trends and land-use transitions that influence climate resilience, supporting Target 13.1 (strengthen resilience and adaptive capacity to climate-related hazards) and Indicator 13.2.1 (integration of climate change measures into national policies and strategies). Furthermore, it contributes to SDG 15 (life on land) by evaluating forest degradation and biodiversity loss, aligning with Target 15.2 (promote sustainable management of forests, halt deforestation, and restore degraded forests) and Indicator 15.3.1 (proportion of land that is degraded over total land area) [11]. The study offers actionable data and policy recommendations that can inform integrated development strategies in Zambia and other comparable regions across Africa.
The study is structured as follows: Section 2 presents a comprehensive literature review, examining key themes related to agricultural expansion, its impact on land-use changes in river basins, and comparative studies from other global regions. Section 3 describes the materials and methods used in the study, including data sources, image processing, and analytical techniques such as intensity analysis and directional gradient analysis. Section 4 presents the results, highlighting key findings on land-use/cover changes, agricultural expansion intensity, and spatiotemporal trends in the Upper Kafue River Basin. Section 5 provides a detailed discussion of the results in relation to the existing literature, emphasizing the drivers of land-use changes and their implications for sustainable land management. Section 5.7 outlines the limitations of the study, including potential data constraints and methodological considerations. Section 6 presents the conclusions drawn from the study and provides recommendations for policymakers and land managers. Lastly, the References Section includes all the cited literature that supports the study’s findings and discussions.

2. Literature Review

2.1. Agriculture Expansion

Agriculture expansion refers to the conversion of natural vegetation into agricultural land [1]. It remains a significant driver of economic growth and development in sub-Saharan Africa (SSA) [2]. However, this expansion has profound effects on ecosystem services, biodiversity, and environmental sustainability [3]. The loss of natural vegetation leads to diminished ecosystem functions, adversely affecting human well-being [4]. Key drivers of agricultural expansion include population growth, urbanization, and rising food demands [5]. While expansion supports economic livelihoods, it also results in environmental challenges such as deforestation, soil degradation, and water pollution [6]. Thus, balancing agricultural growth with sustainable land-use practices is essential for long-term ecological stability.

2.2. Agriculture Expansions and Land-Use Changes in River Basins

Agriculture expansion is a leading cause of land-use change in river basins, influencing hydrological cycles, biodiversity, and human livelihoods [7]. Drivers of land-use changes in river basins include urbanization, climate change, infrastructure development, and wetland degradation [9,10]. These changes not only affect land cover but also disrupt ecosystem services, leading to water pollution and increased vulnerability to extreme climatic events [10]. Changes in water quality and quantity, as observed in the Nile and Okavango River Basins, directly impact agriculture and fisheries [11]. The interconnected nature of land-use dynamics in river basins highlights the need for an integrated approach to land and water-resource management.

2.3. Studies from Other Important Basins in Sub-Saharan Africa and Globally

SSA is home to several key river basins, including the Nile, Congo, and Zambezi, which are critical for agricultural production, fisheries, and human sustenance [12]. However, these basins face growing pressures from land-use changes, climate change, and unsustainable water management [13]. Research on the Nile River Basin has shown that land-use and water management practices significantly affect water availability and ecosystem services (Uhlendahl et al., 2011 [13]). Similarly, studies of the Okavango Delta highlight the impacts of climate variability and land conversion on water quality and biodiversity [4].
In Asia, major river basins such as the Mekong, Yangtze, and Ganges support millions of people through agriculture and fisheries but are increasingly threatened by dam construction and deforestation [14]. In South America, land-use changes in the Amazon and Paraná River Basins have led to significant biodiversity loss and water quality deterioration [15]. North American basins, including the Mississippi and Colorado River Basins, also experience challenges related to climate change and agricultural runoff [16]. Understanding these regional experiences provides valuable lessons for managing the Upper Kafue River Basin in Zambia.

2.4. Mixed Urban–Rural Land-Cover Changes in Developing Countries

The dynamics of land-use and land-cover (LULC) changes in mixed urban–rural environments differ from those in exclusively urban or rural areas. In developing countries, these landscapes are shaped by rapid urban sprawl, peri-urban agriculture, and fragmented land-use patterns [17]. Studies from the Peruvian Amazon and Southeast Asia suggest that urban expansion often displaces agricultural activities into ecologically sensitive areas, leading to deforestation and soil degradation [18]. In SSA, factors such as land tenure reforms and economic transitions further complicate the spatial organization of mixed urban–rural land use [19]. Understanding these trends is crucial for formulating policies that balance development with ecological conservation.

2.5. Comparative Studies from Other Continents

Comparative studies from different continents highlight commonalities and differences in LULC transitions. Research on agricultural expansion in the Mekong Delta (Vietnam), Paraná River Basin (South America), and Mississippi River Basin (United States) underscores the role of policy interventions, economic incentives, and environmental regulations in shaping land-use patterns [5,17]. In tropical forest regions, such as the Amazon and the Congo Basin, unregulated land conversion for agriculture has led to severe biodiversity losses and climate change concerns [2,18]. The insights from these regions can guide land-management strategies in Zambia’s Upper Kafue River Basin to ensure sustainable agricultural development while maintaining ecosystem integrity.

3. Materials and Methods

3.1. Study Area

In this study, we selected a stretch (~40 km) along the Upper Kafue River Basin located in Kitwe District, Zambia, between 12° and 13° South and 27° to 29° East (Figure 1). The Kafue River is the longest tributary (~1576 km) of the Zambezi River Basin rising in the northwestern part of Zambia on the border with the Democratic Republic of the Congo (DRC) and traversing through three provinces, Copperbelt, Central, and Southern. The Kafue Catchment (~156,000 km2) is entirely located within Zambia [12] and covers approximately 20% of Zambia’s total land [13]. The catchment is subdivided into two collective basins: the Upper and Lower Kafue Catchments. The Upper Kafue River Basin covers an area of approximately 23,065 km2 with elevations ranging from 0–1200 m above mean sea level.
To capture the spatial temporal patterns of agriculture expansion and other LULC changes along the 40 km stretch chosen in Kitwe District for this study, we used a 5 km buffer on the right (eastern) and left (western) sides of the Upper Kafue River Basin. With agriculture being the second-biggest economic activity after mining, Kitwe is a representative case study for examining agriculture expansion and LULC changes along riverbanks. Across the Kafue Riverbanks in Kitwe District, agricultural activities are increasingly prevalent and have been expanding over the last three decades. The landscape around the Kafue River in Kitwe is an attractive mix of gently undulating woodlands, dambos, and farmland [5].
Kitwe is Zambia’s third-largest district located in the central part of the Copperbelt Province and one of the fastest growing cities in the country [14]. The population of Kitwe was slightly over 0.5 million in 2010 [15], and by 2022 it was estimated to reach nearly 1.2 million [16], representing a relatively high growth rate of 13.5% compared to the national average of 5% during the same 2010–2022 period. The population of Kitwe is over 95% urban, and most of its inhabitants are young, with slightly over 66 percent of the population below the age of 25 years [16]. From an economic standpoint, poverty and unemployment remain high in Kitwe following the decline of the mining sector in the 1990s. As a result, informal employment and urban agriculture activities have been the means to sustain livelihoods.
The Upper Kafue River Basin, particularly the stretch between Kitwe and Chingola, is characterized by diverse agricultural activities that are integral to local livelihoods. The predominant farming systems in the region include subsistence farming, where small-scale farmers cultivate staple crops such as maize and cassava for household consumption and market sale. Riverbank cultivation is also practiced along the fertile banks of the Kafue River, taking advantage of nutrient-rich alluvial soils deposited during seasonal floods, which support the growth of vegetables, maize, and groundnuts. Additionally, horticultural farming, including the cultivation of tomatoes, cabbage, and onions, is widespread, providing essential produce for local markets. Farmers also engage in livestock farming, particularly cattle rearing, which plays a crucial role in plowing, manure production, and serving as a form of wealth and social status [1].
Despite the benefits of agricultural activities, several challenges impact sustainable land management. The reliance on manual irrigation methods, such as bucket or cane irrigation, poses safety risks due to the presence of crocodiles and hippos in the river. In response, efforts are being made to promote the use of water pumps to enhance efficiency and reduce exposure to hazards [3] Furthermore, the expansion of agriculture into riverine and forested areas has led to environmental concerns, including deforestation, soil erosion, and sedimentation of the Kafue River, necessitating sustainable land-management practices [20]. The agricultural activities in this region directly influence land-use and land-cover changes, reinforcing the need for policies that balance agricultural expansion with environmental sustainability.

3.2. Overall Workflow

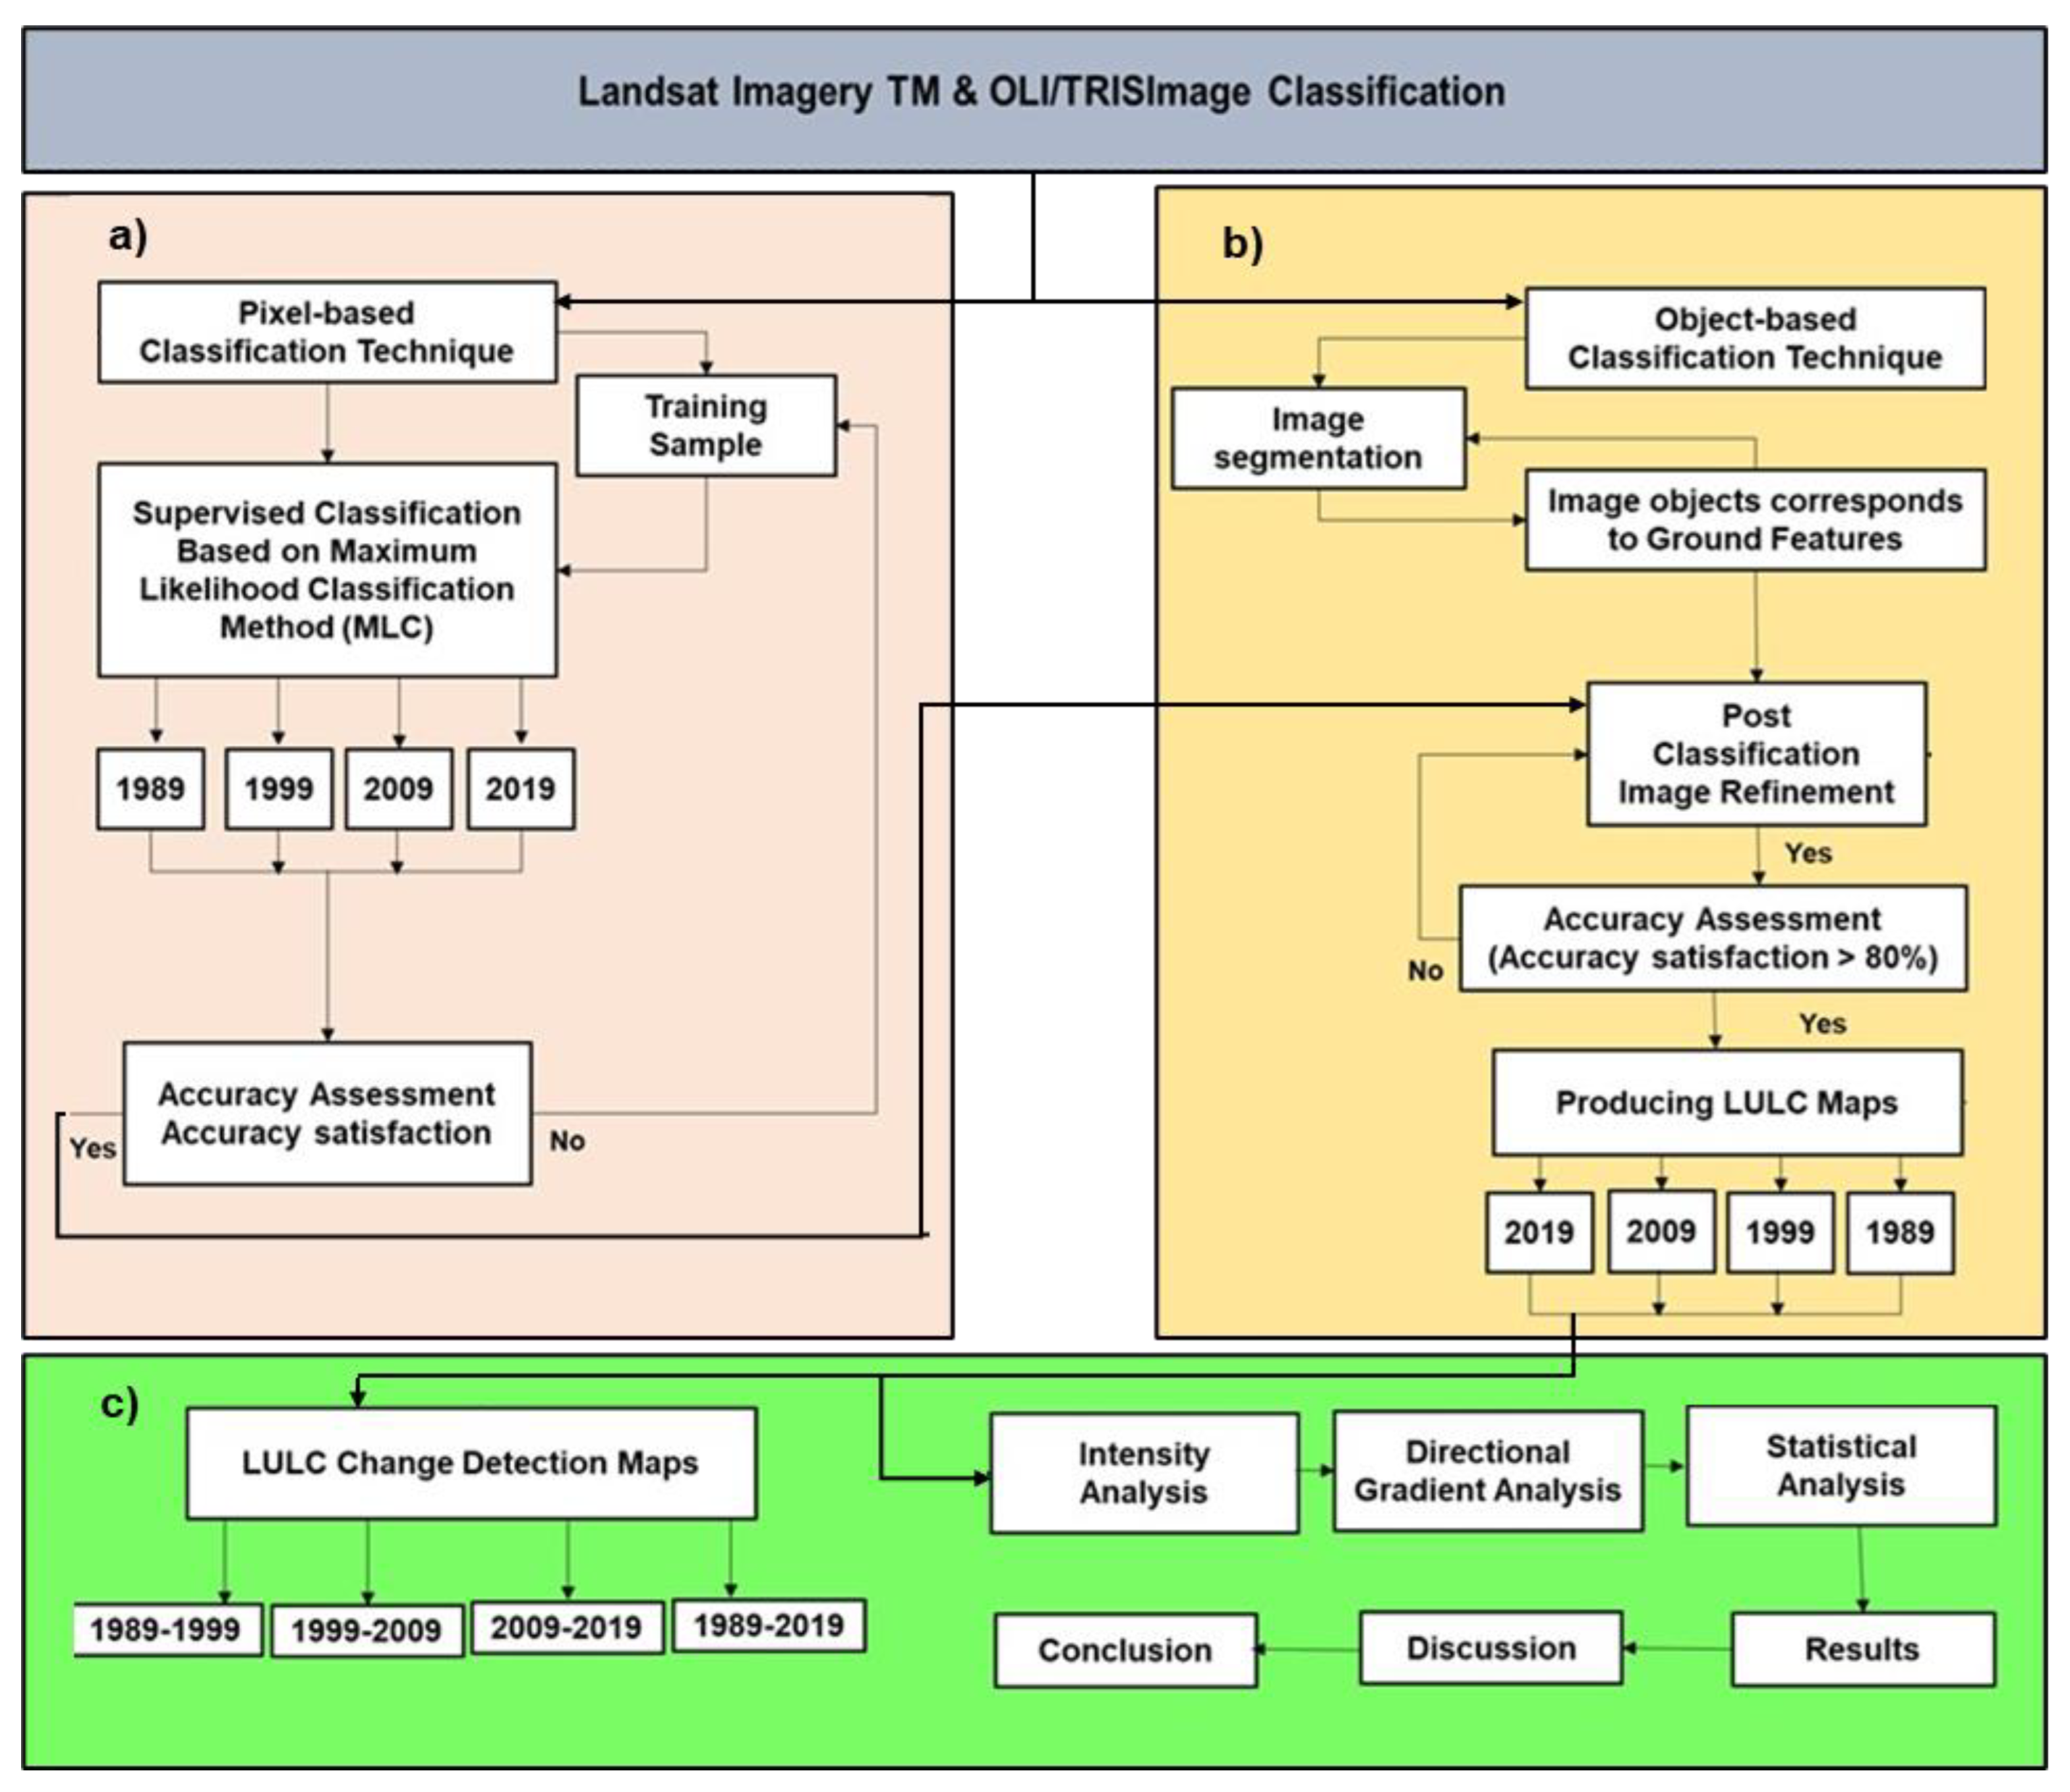
Figure 2 shows the workflow adopted to achieve the objectives of this study. The methodological approach in this study followed a structured and systematic workflow, ensuring a clear and logical progression from data acquisition to analysis. The study integrated remote-sensing, GIS, and advanced analytical techniques to assess LULC changes and their implications. The methodology is divided into key phases: (i) data acquisition and preprocessing, (ii) hybrid LULC classification using a combination of pixel-based classification (PBC) and object-based post-classification refinement (OBPR), (iii) accuracy assessment of classification results, (iv) change detection analysis using post-classification comparison, (v) intensity analysis to quantify LULC transitions, (vi) directional gradient analysis to examine spatial trends in landscape transformation.

3.3. Data

Time-series Landsat 5TM (1989, 1999, 2009) and 8 OLI/TRS (2019) imagery were used in this study, which were downloaded from the United States Geological Survey (USGS) website (https://earthexplorer.usgs.gov/, accessed on 10 June 2021) in for the purpose of extracting LULC maps. For the optimal LULC classification, atmospherically corrected (<10% cloud-free) and pre-processed (Level 2) Landsat images with a spatial resolution of 30 m were acquired within the same month/season. All the downloaded Landsat images were acquired in May, which is the end of the rainy season and when agriculture fields are active (Table 1).
Auxiliary spatial data were also collected to support the classification of LULC and additional data processing and analysis. The main auxiliary spatial data comprised study area boundary shapefiles, land-use information, a digital elevation model (DEM), topographical maps, and Google Earth imagery.

3.4. LULC Classification

Based on reconnaissance surveys and our expert knowledge of the study area, we created a classification scheme consisting of six LULC classes, including built-up, forest, agricultural land, grassland, bare land, and water. Due to the study’s primary focus on the expansion of agriculture, the study adopted a LULC classification approach that would detect any spectral confusion between the agricultural class and any of the other five classes, and among all classes. The hybrid classification approach combining pixel-based classification (PBC) technique and object-based post-classification refinement (OBPR) were adopted. Previous research has demonstrated the suitability of the hybrid classification technique to produce accurate LULC classification results [17,18,19,21,22] (Table 2).

3.4.1. PBC Technique

We began LULC classification by using the PBC technique in ArcGIS (Version 10.7.1). For each of the six LULC classes, training sets from the Landsat images in each time point (1989, 1999, 2009, and 2019) were developed and spectral signatures from the specified areas were generated. We carefully selected at least 77 training sets with sizes ranging from 198 to 758 pixels. The topographical maps and Google Earth images were used as supplementary data to make training sites more reliable. The signatures were then used to classify the pixels using Maximum Likelihood Classification (MLC) algorithm. However, from PBC alone, misclassifications from spectral confusion were seen, especially, among the classes of agricultural land, built-up areas, and bare land.

3.4.2. OBPR

After PBC, we employed OBPR to eliminate the misclassifications from spectral confusion. We used the multi-resolution segmentation algorithm in the eCognition Developer software (version 9) [15] to segment the Landsat imageries into distinct image objects in each time point. For the purpose of creating the necessary homogeneity image objects, three parameters (scale, shape, and compactness) were applied. Based on expert visualization of the spectral information in the Landsat imagery, shape and compactness were used to control homogeneity, while scale was used to determine the maximum size of the generated image objects. We used the large-scale parameters for the identification of larger ground objects such as large-scale agriculture fields while smaller-scale parameters were used to capture ground features with fine and medium scales such as small-scale farming fields and some informal built-up areas. Smaller image objects that represented the same LULC classes were then merged before using the final resulting image objects for post-classification refinement of the PB classification result.
To evaluate the misclassified areas, an overlay technique utilizing the object-based image segments, supplementary spatial data, the original PBC-LULC maps and expert based visual interpretation was employed [19,22]. Misclassified pixels were extracted using the object-based image segments covering specific LULC classes, reclassified into the correct classes, and then mosaicked back to replace all incorrectly classified pixels. OBPR was performed for the LULC maps in each time point and we finally produced four LULC maps for 1989, 1999, 2009, and 2019.

3.4.3. Accuracy Assessment

To assess the accuracy of the LULC maps produced from the Landsat data, we carried out an accuracy assessment. In this study, 600 random points were generated using a stratified random sampling approach, with at least 100 of those points covering each LULC class at each time point. Using Google Earth, topographic maps, and the authors’ extensive local knowledge of the study area, all the random points were taken to represent reference ground truth data and visually evaluated. The comparisons between the reference points and the actual points on the LULC maps were then recorded in a database. Finally, we used a confusion matrix to calculate the user’s accuracy, producer’s accuracy, overall accuracy, and Kappa coefficient for each year, while accounting for errors of commission and omission. Details of this approach, which is commonly used in similar studies, can be found elsewhere [19,20].

3.5. LULC Change Detection

The four LULC maps from 1989, 1999, 2009, and 2019 were overlaid to quantify and detect changes in LULC. This process resulted in three LULC change maps for the three- time intervals 1989–1999, 1999–2009, and 2009–2019 showing the nature and location of changes for each LULC class. The area and percent estimate of each LULC class were calculated for each time point for the quantitative analysis. Equation (1) was also used to obtain the percent change for each LULC class over each time interval [6] (see Table 3 for the mathematical notation).
N t i = ( size   of   net   change   of   i   during   [ Y t ,   Y t + 1 ] ) 100 % ( size   of   i   at   time   Y t )   ( duration   of   [ Y t ,   Y t + 1 ] ) = j = 1 J C t i j j = 1 J C t i j 100 % j = 1 J C t i j ( Y t + 1 Y t )

3.6. Agriculture Expansion and LULC Change Intensity Analysis

In addition to the LULC change detection, the study was also interested in comparing agricultural land to the other five LULC classes in terms of size and change intensity. We were able to compare the size and intensity of loss and gain of agricultural land to the other five classes in each time interval using Equations (2)–(4) based on the category level intensity analysis approach created by [23] (see Table 3 for the mathematical notation).
The annual change intensity of the total changes in all LULC categories in each time interval was calculated using Equation (2). The annual gain and loss intensity of each LULC category in each time interval were calculated using Equations (3) and (4), respectively.
S t = ( size   of   change   during   [ Y t , Y t + 1 ] ) 100 % ( size   of   spatial   extent ) ( duration   of   [ Y t , Y t + 1 ] ) = i = 1 J j = 1 J C t i j C t i i 100 % i = 1 J j = 1 J C t i j ( Y t + 1 Y t )
G t j = ( size   of   gain   of   j   during   [ Y t , Y t + 1 ] ) 100 % ( size   of   j   at   time   Y t + 1 ) ( duration   of   [ Y t , Y t + 1 ] ) = i = 1 J C t i j C t j j 100 % i = 1 J C t i j ( Y t + 1 Y t )
L t i = ( size   of   loss   of   i   during   [ Y t , Y t + 1 ] ) 100 % ( size   of   i   at   time   Y t ) ( duration   of   [ Y t , Y t + 1 ] ) = j = 1 J C t i j C t i i 100 % j = 1 J C t i j ( Y t + 1 Y t )
The methodology proposed by [23] utilizes the concept of uniform intensity, which categorizes changes as active, dormant, or uniform based on their deviation from a uniform hypothesis. If the annual loss intensity Lti during interval t was less than St, then the loss of category i during interval t was dormant. If Lti > St, then the loss of category i during interval t was active [23]. Similarly, if Gtj > St, then the gain of category j during interval t was active; if Gtj < St, then the gain of category j during interval t was dormant. If either Gtj = St or Lti = St, category j’s gain or category i’s loss was uniform, respectively [23].
However, we opted not to utilize the concept of uniform intensity. This decision was informed by several critiques of the methodology. The uniform intensity approach has been criticized for its sensitivity to map errors, which can introduce significant uncertainties and lead to potentially misleading categorizations [9]. Furthermore, the uniform hypothesis simplifies complex land-change processes such as those in the mixed urban–rural Upper Kafue River Basin that are often driven by diverse socio-economic and environmental factors. Alternative studies suggest that broader dynamics, such as net change and persistence, or process-based approaches like spatial simulation models, provide more nuanced and reliable insights into land-use transitions [24]. By excluding the uniform intensity concept, our analysis avoids these limitations and emphasizes a more comprehensive interpretation of land-change dynamics.

3.7. Directional Gradient Analysis

The gradient analysis technique was initially created for use with vegetation analysis [25]. Gradient analysis has since been extensively employed in recent years to capture the spatial and temporal variations in LULC changes over a distance especially in urban landscape change studies [6,26,27,28]. In the literature, two primary gradient analysis techniques have frequently been used. The first one involves using directional transects that span a certain distance [29]. The second technique extends outward concentric rings as predetermined buffer zones over a distance from a central point [29,30,31].
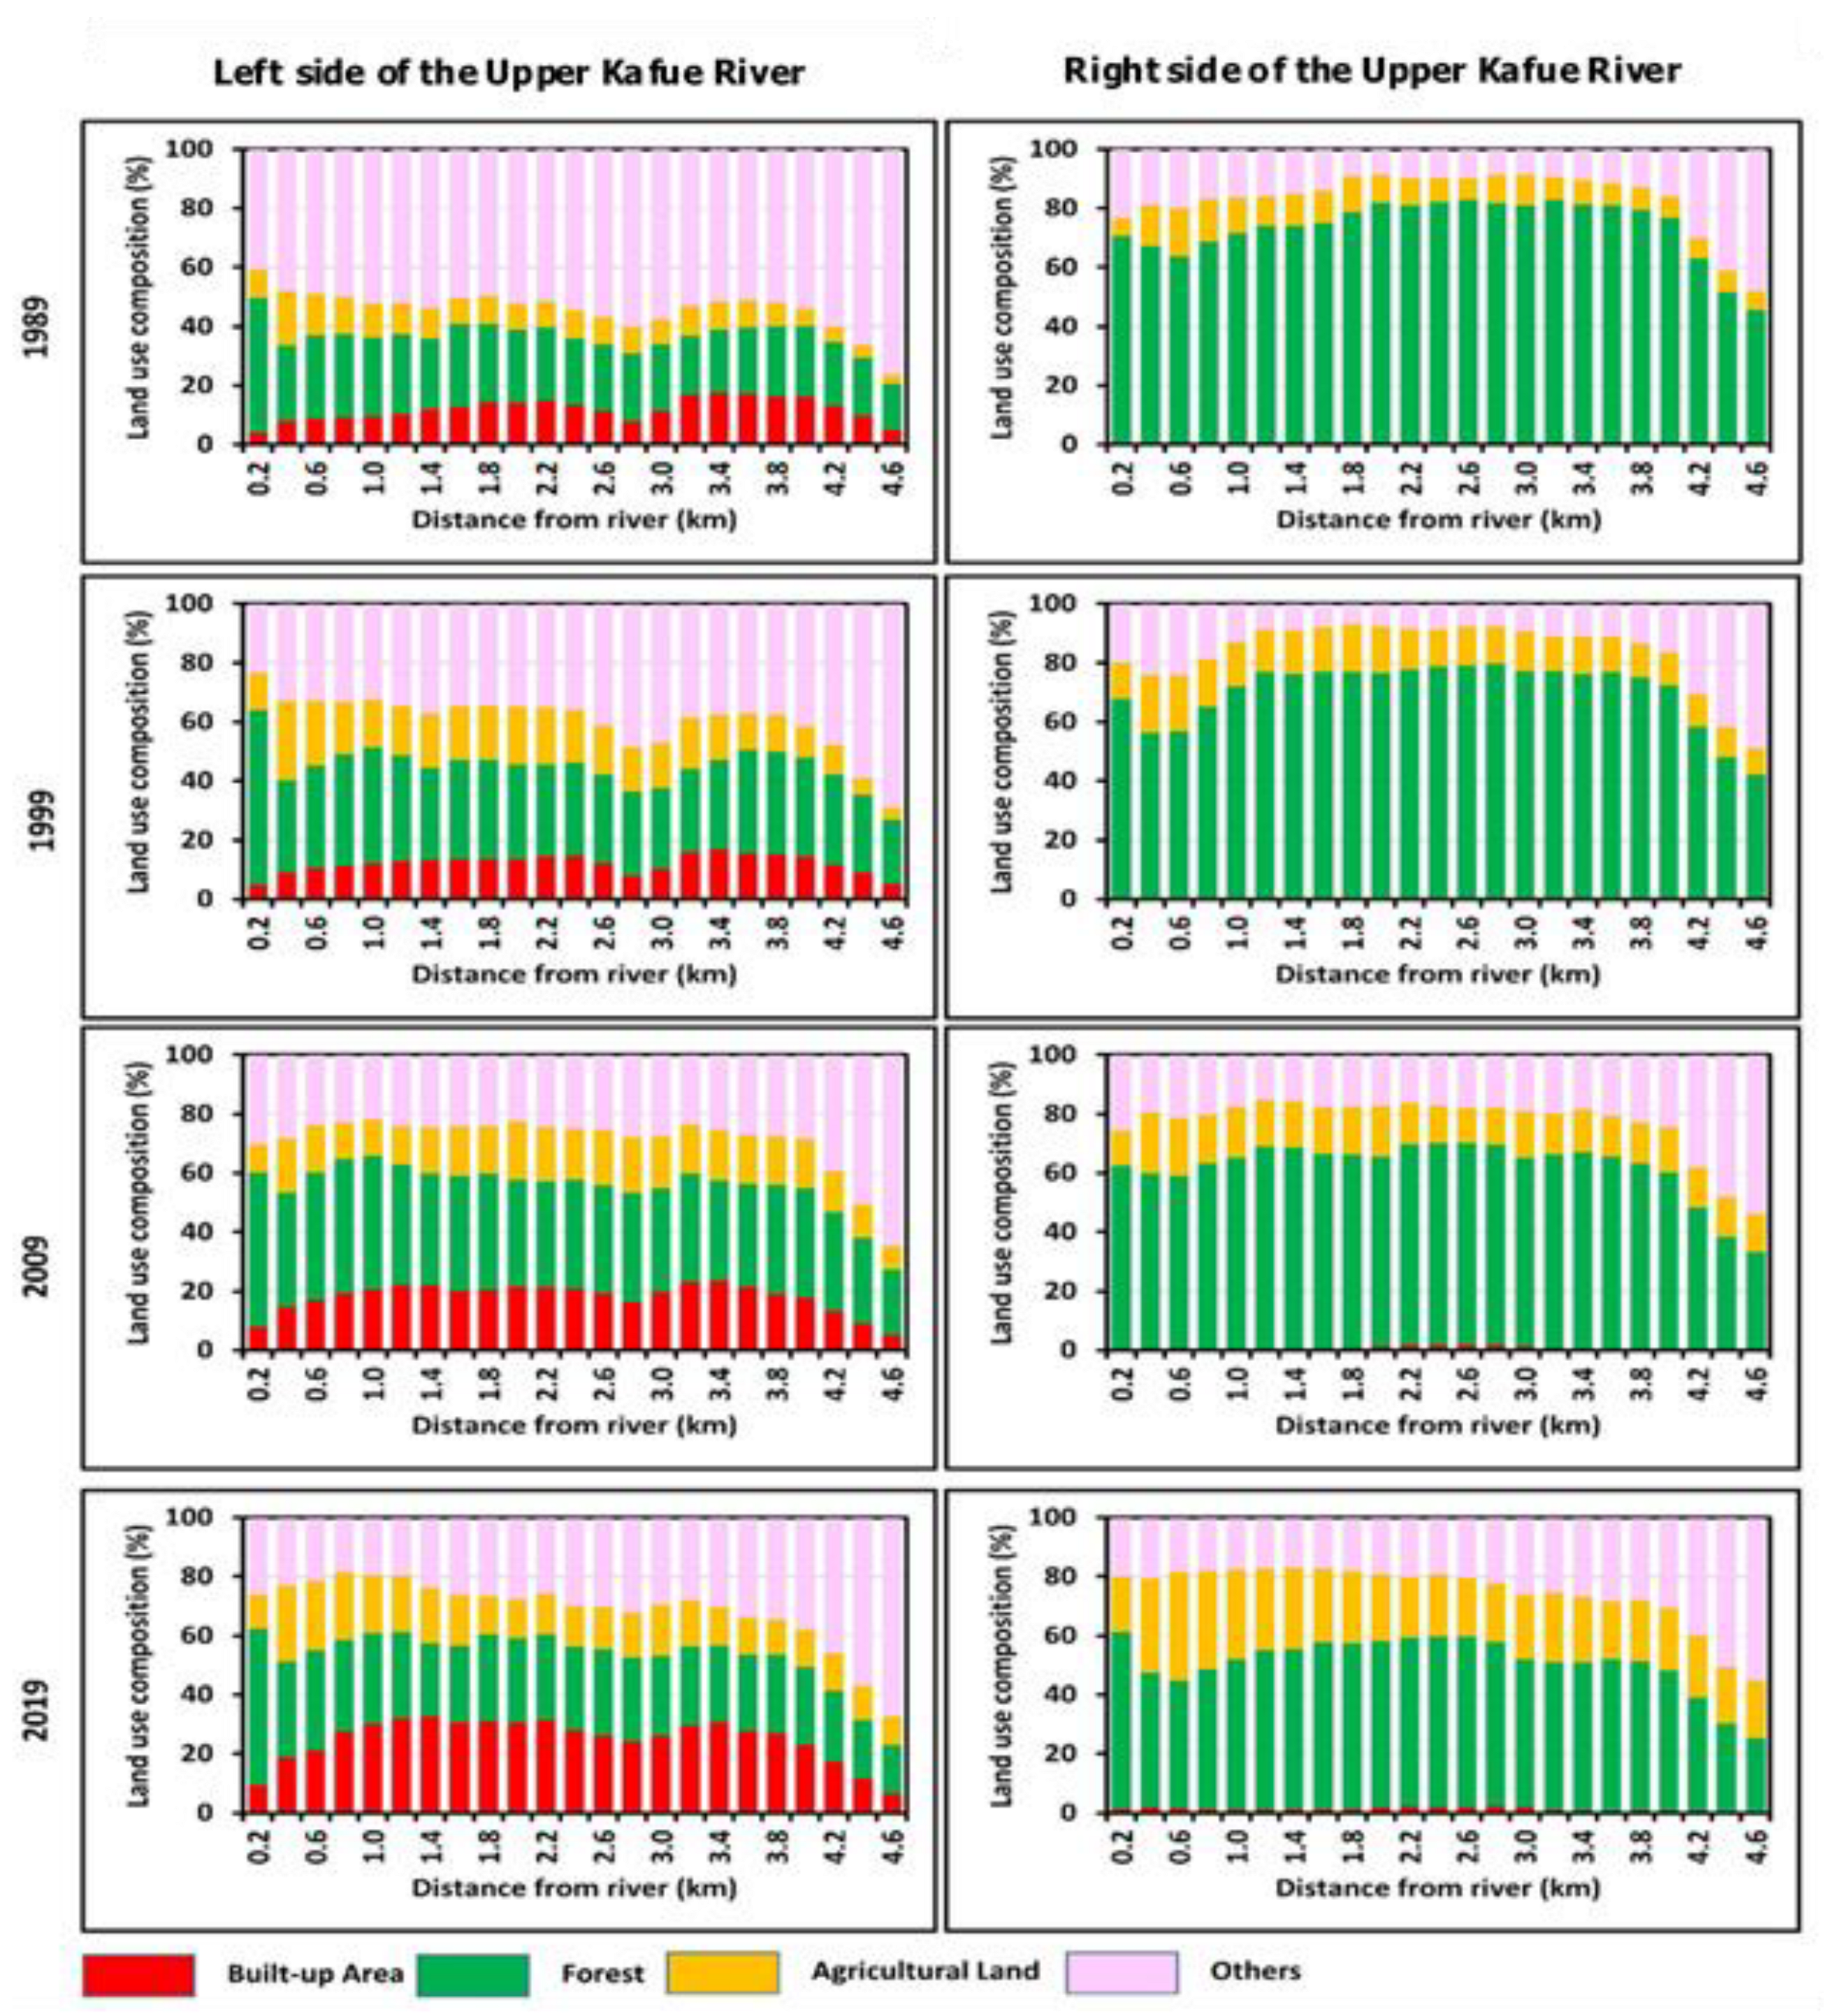
In the context of the directional gradient analysis in this study, both techniques were somewhat utilized. Using an incrementing radius of 200 m over a distance of 5 km from the river, we created a series of buffer zones that generally resembled concentric rings, both on the left and the right side of the river. Given the study focus, the Kafue River, is a linear stretch, the buffer zones also formed south-to-north directional transects spanning the 40 km stretch of the river. We then extracted the LULC information in each of the buffer zones and along each directional transect. Afterwards, each buffer zone’s total area was calculated, and the proportion of each LULC class was then computed on the basis of its land area in the buffer zone and along the respective directional transects.

4. Results

4.1. LULC Maps and Accuracy

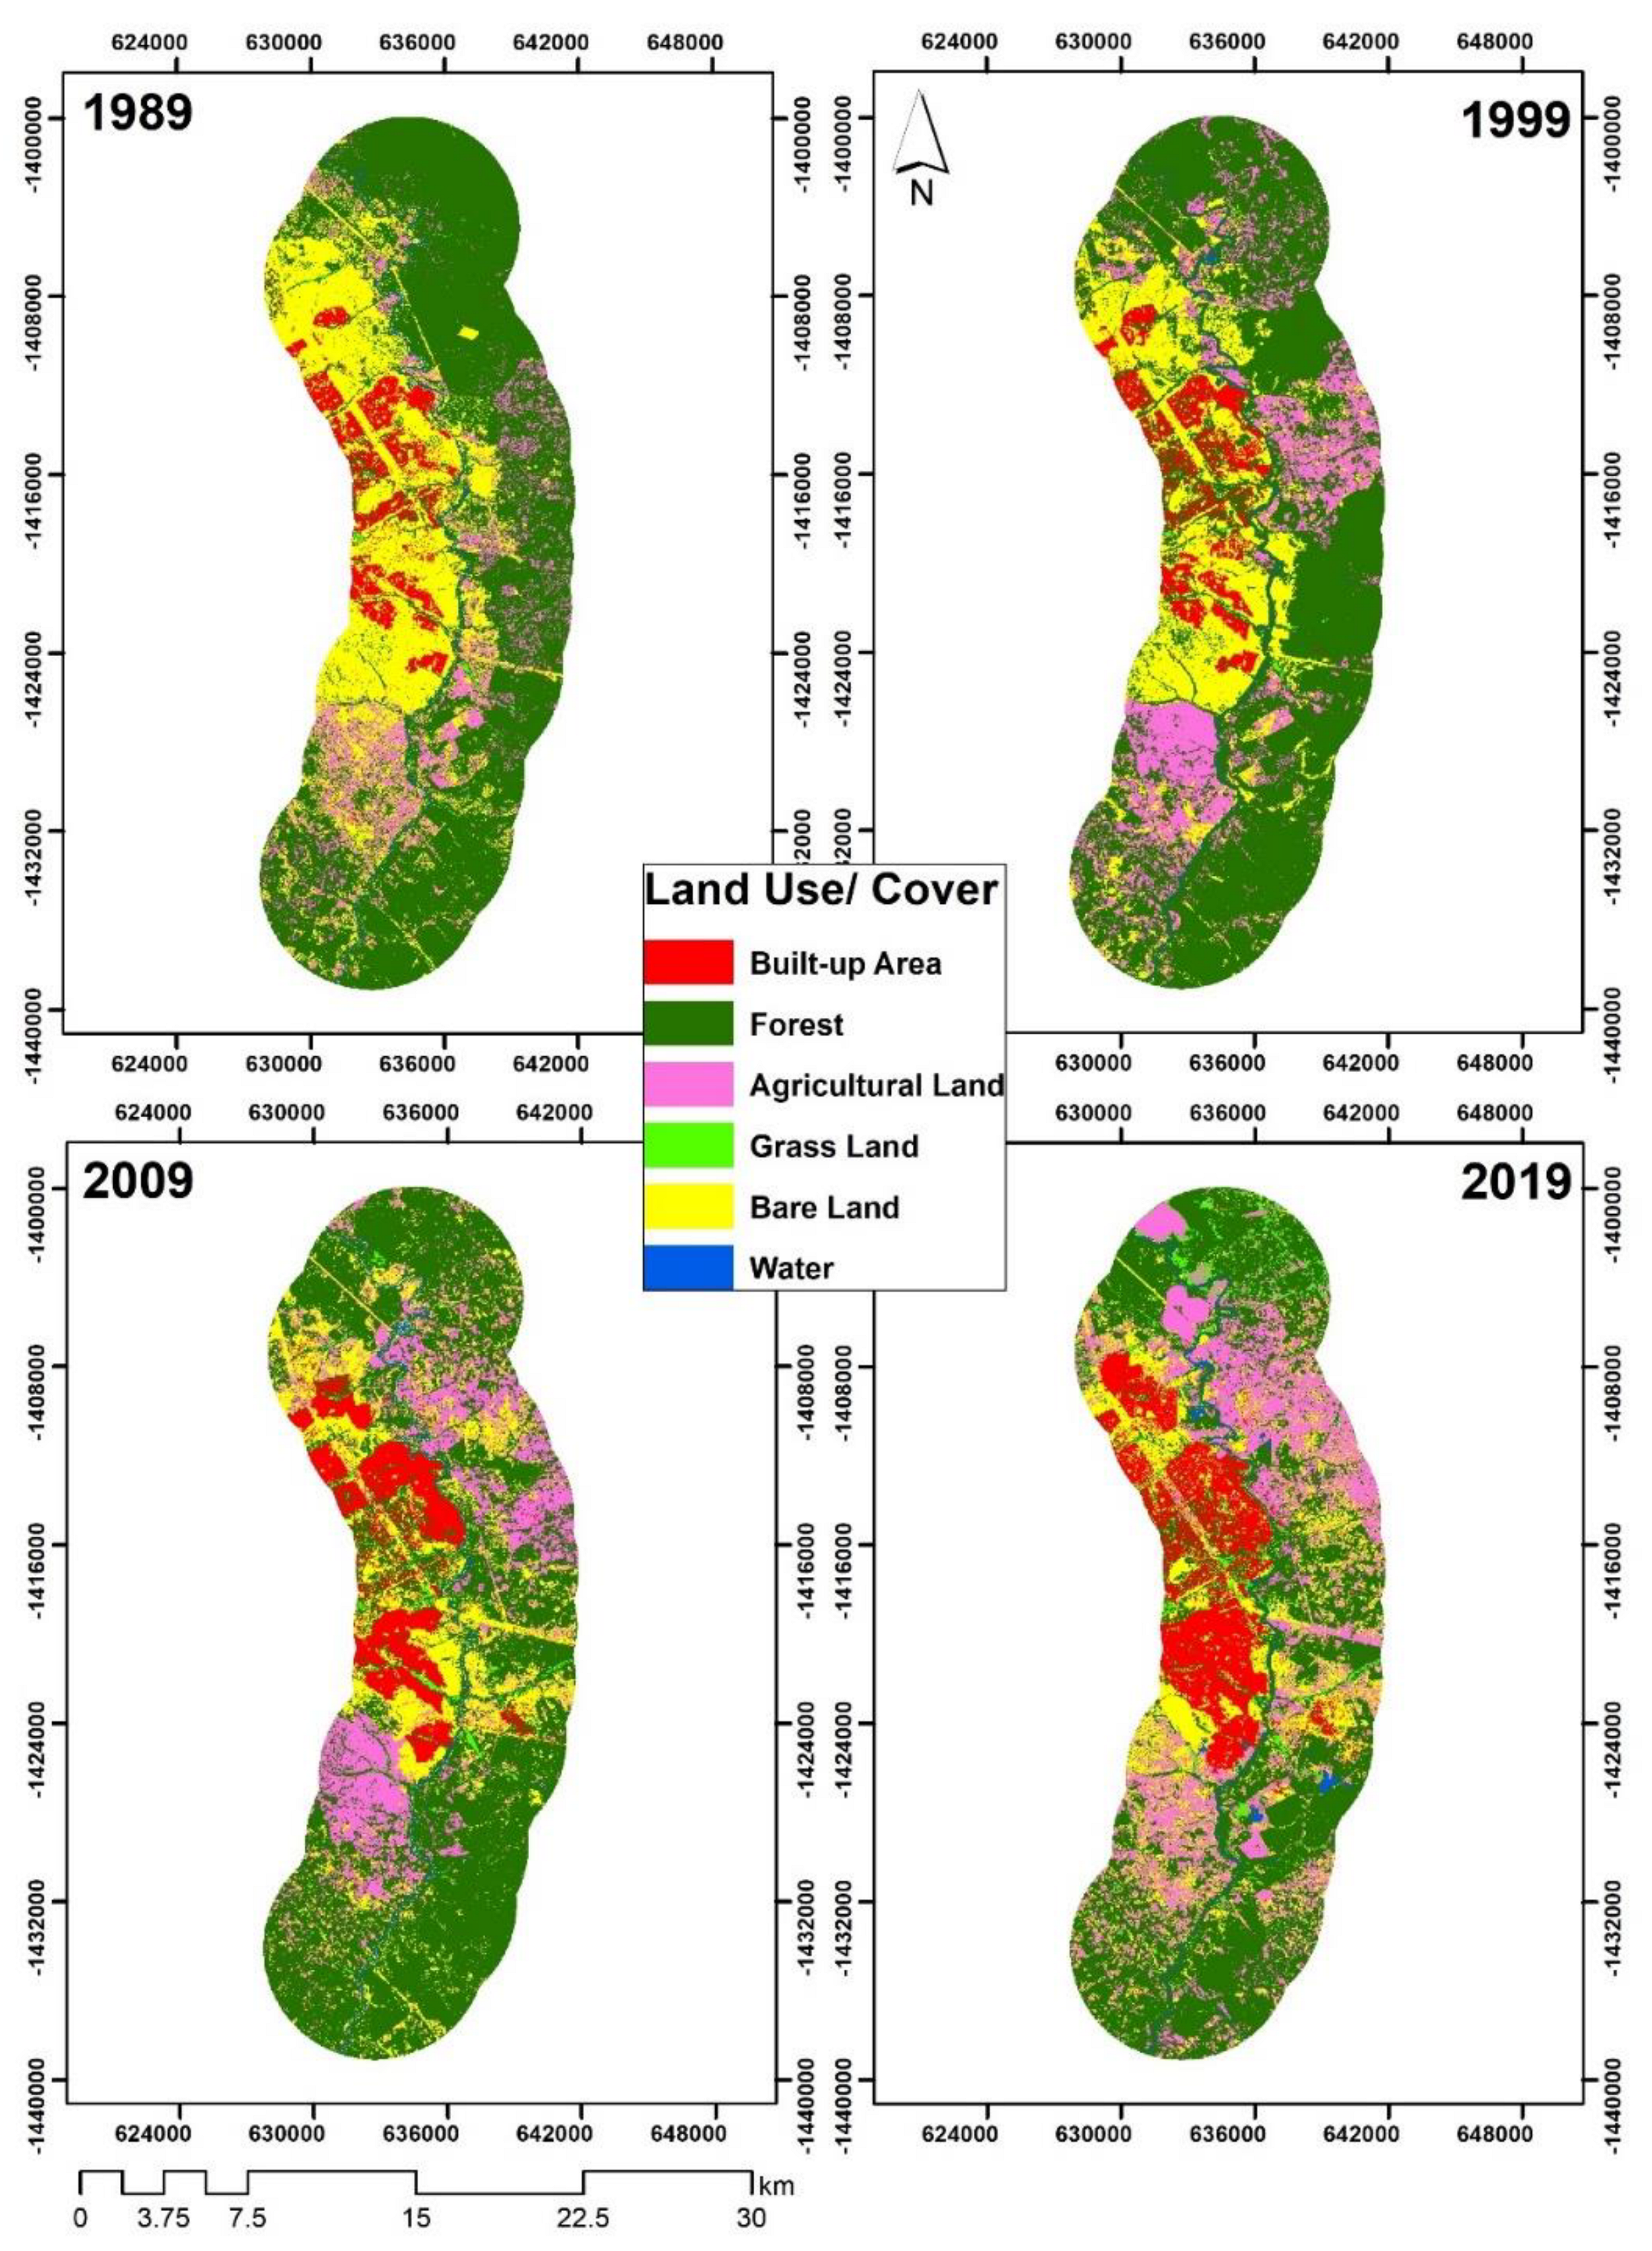
Figure 3 shows the LULC maps for the Upper Kafue River Basin developed for the years 1989, 1999, 2009, and 2019. The accuracy of the LULC maps was assessed using a confusion matrix, achieving overall accuracies of 93.4%, 89.0%, 90.4%, and 87.4% for the years 1989, 1999, 2009, and 2019, respectively. These results were considered to be at an acceptable level, ensuring reliable representation of the LULC dynamics over the study period.

4.2. LULC Changes

Table 4 summarizes the statistical distribution of LULC classes over the study period. In 1989, forest cover dominated the landscape, accounting for 55.5% of the total area, followed by bare land at 27.4% and agricultural land at 10.3%. By 1999, forest cover had increased slightly to 57.7%, possibly due to natural regrowth or conservation efforts, while bare land decreased to 19.8%, indicating a shift towards more productive land uses. Agricultural land expanded to 15.8%, and built-up areas grew marginally to 5.9%, reflecting gradual urbanization. The period between 1999 and 2009 saw notable changes, with forest cover decreasing to 54.7% and bare land further declining to 17.7%. This was accompanied by significant growth in agricultural land, which reached 16.4%, and a sharp rise in built-up areas to 9.2%, driven by accelerated urban development. Grassland, which was minimal in earlier years, increased to 1.1%, suggesting a transition from bare land or forested areas. By 2019, the landscape had shifted substantially. Forest cover reduced to 43.6%, while agricultural land expanded to 21.6%, reflecting intensified farming activities along the river basin. Built-up areas continued to grow, accounting for 12.8% of the total area, indicative of ongoing urban sprawl. Grassland reached 3.8%, marking a significant rise, while water bodies remained relatively stable, fluctuating between 0.6% and 1.3% throughout the study period.
The area changes across the different LULC categories highlight significant transformations (Table 5). Built-up areas increased steadily, with annual growth rates rising from 4.2 ha between 1989 and 1999 to 141.5 ha annually between 2009 and 2019, reflecting rapid urbanization. Forest cover experienced a consistent decline, particularly from 1999 to 2009, with an annual loss of 431.5 ha. Agricultural land showed substantial expansion, particularly between 1999 and 2009 (244.2 ha annually) and from 2009 to 2019 (200.2 ha annually), indicating the intensification of agriculture over the three decades. Grassland areas also expanded significantly, particularly between 2009 and 2019, with an annual increase of 105.1 ha. Water bodies showed minor fluctuations over the study period, with a slight decrease in area during the earlier years and a modest increase thereafter.

4.3. Spatiotemporal Patterns of Agriculture Land Expansion and LULC Changes

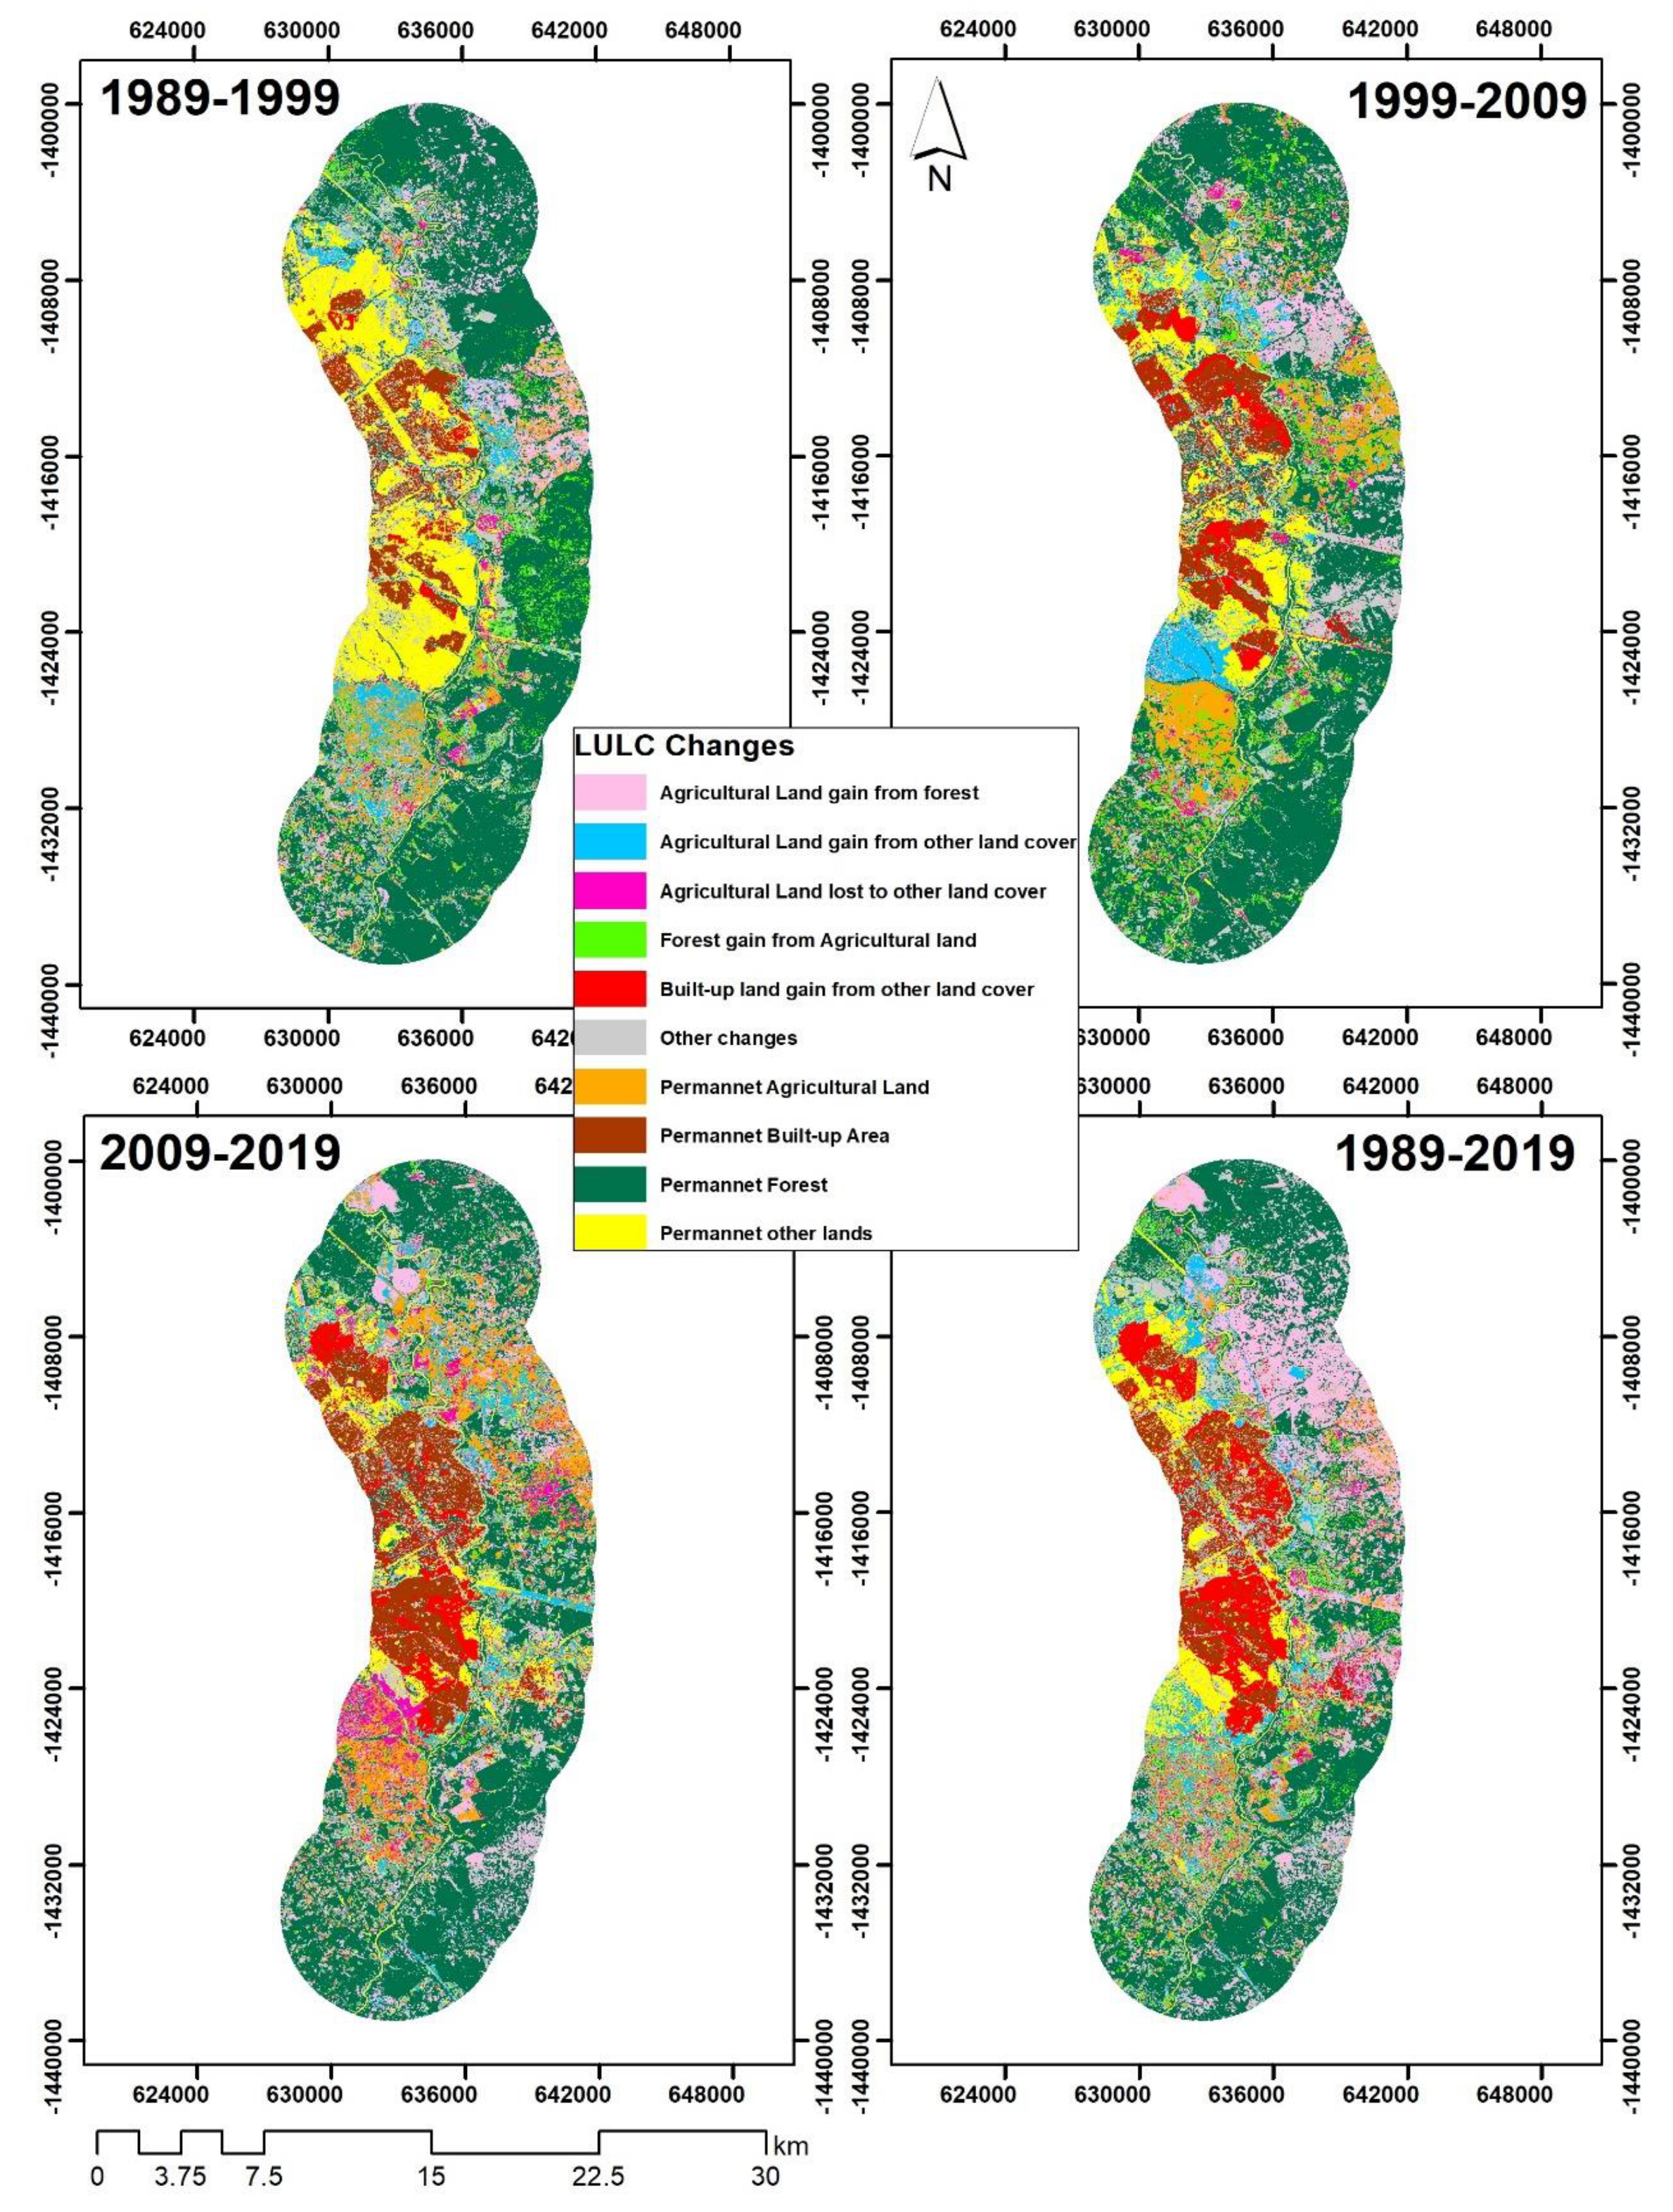
Between 1989 and 2019, the Upper Kafue River Basin witnessed substantial agricultural expansion, which emerged as the dominant driver of land-use and land-cover (LULC) changes across the region. Agriculture gained significant ground, particularly from forested areas, with a total of 4895.1 hectares converted over the study period, translating to an annual change rate of 163.2 hectares. The most intense periods of forest-to-agriculture conversion occurred between 1989 and 1999, and 2009 and 2019, with annual rates of 276.1 hectares and 317.0 hectares, respectively. These transitions were concentrated in the northern and northeastern sections of the basin, where fertile soils and access to water resources facilitated agricultural expansion. Agricultural land also encroached on other land-cover types, contributing an additional 2034.6 hectares to its overall expansion, at an annual rate of 67.8 hectares. These changes were widespread but showed a notable clustering in the central parts of the basin, where mixed land-cover types provided opportunities for agricultural activities. This steady expansion highlights the critical role of agriculture in shaping the landscape dynamics of the basin over the three decades.
Despite these gains, agricultural land experienced losses amounting to 1048.2 hectares during the study period, primarily transitioning to other land-cover types. A key component of this loss was the regrowth of forests on abandoned agricultural lands, particularly in the southern and western regions, contributing 1294.7 hectares at an annual rate of 43.2 hectares. However, these forest gains were overshadowed by the extensive clearing of forests for agriculture, underscoring the basin’s ongoing land-use pressure. The intensity of agricultural expansion also influenced the persistence of other land-use types. Permanent agricultural land accounted for 1578.0 hectares, representing areas consistently maintained for agriculture throughout the study period, with an annual persistence of 52.6 hectares. This persistence underscores the long-term commitment to agricultural productivity in certain parts of the basin, particularly in the northeastern and central regions, which remain hubs of farming activity.
Built-up areas, while notable in their growth, played a secondary role compared to agriculture. These areas expanded by 3335.5 hectares over the 30 years, with an annual increase of 111.2 hectares. This growth was concentrated near urban centers and transportation corridors, reflecting the spread of settlements and infrastructure development. Similarly, other land-cover changes, including mixed and fragmented land uses, amounted to 6771.0 hectares, further illustrating the dynamic interplay between agricultural expansion and other LULC categories (Figure 4, Table 6).

4.4. Intensity of Agriculture Land Expansion and LULC Changes

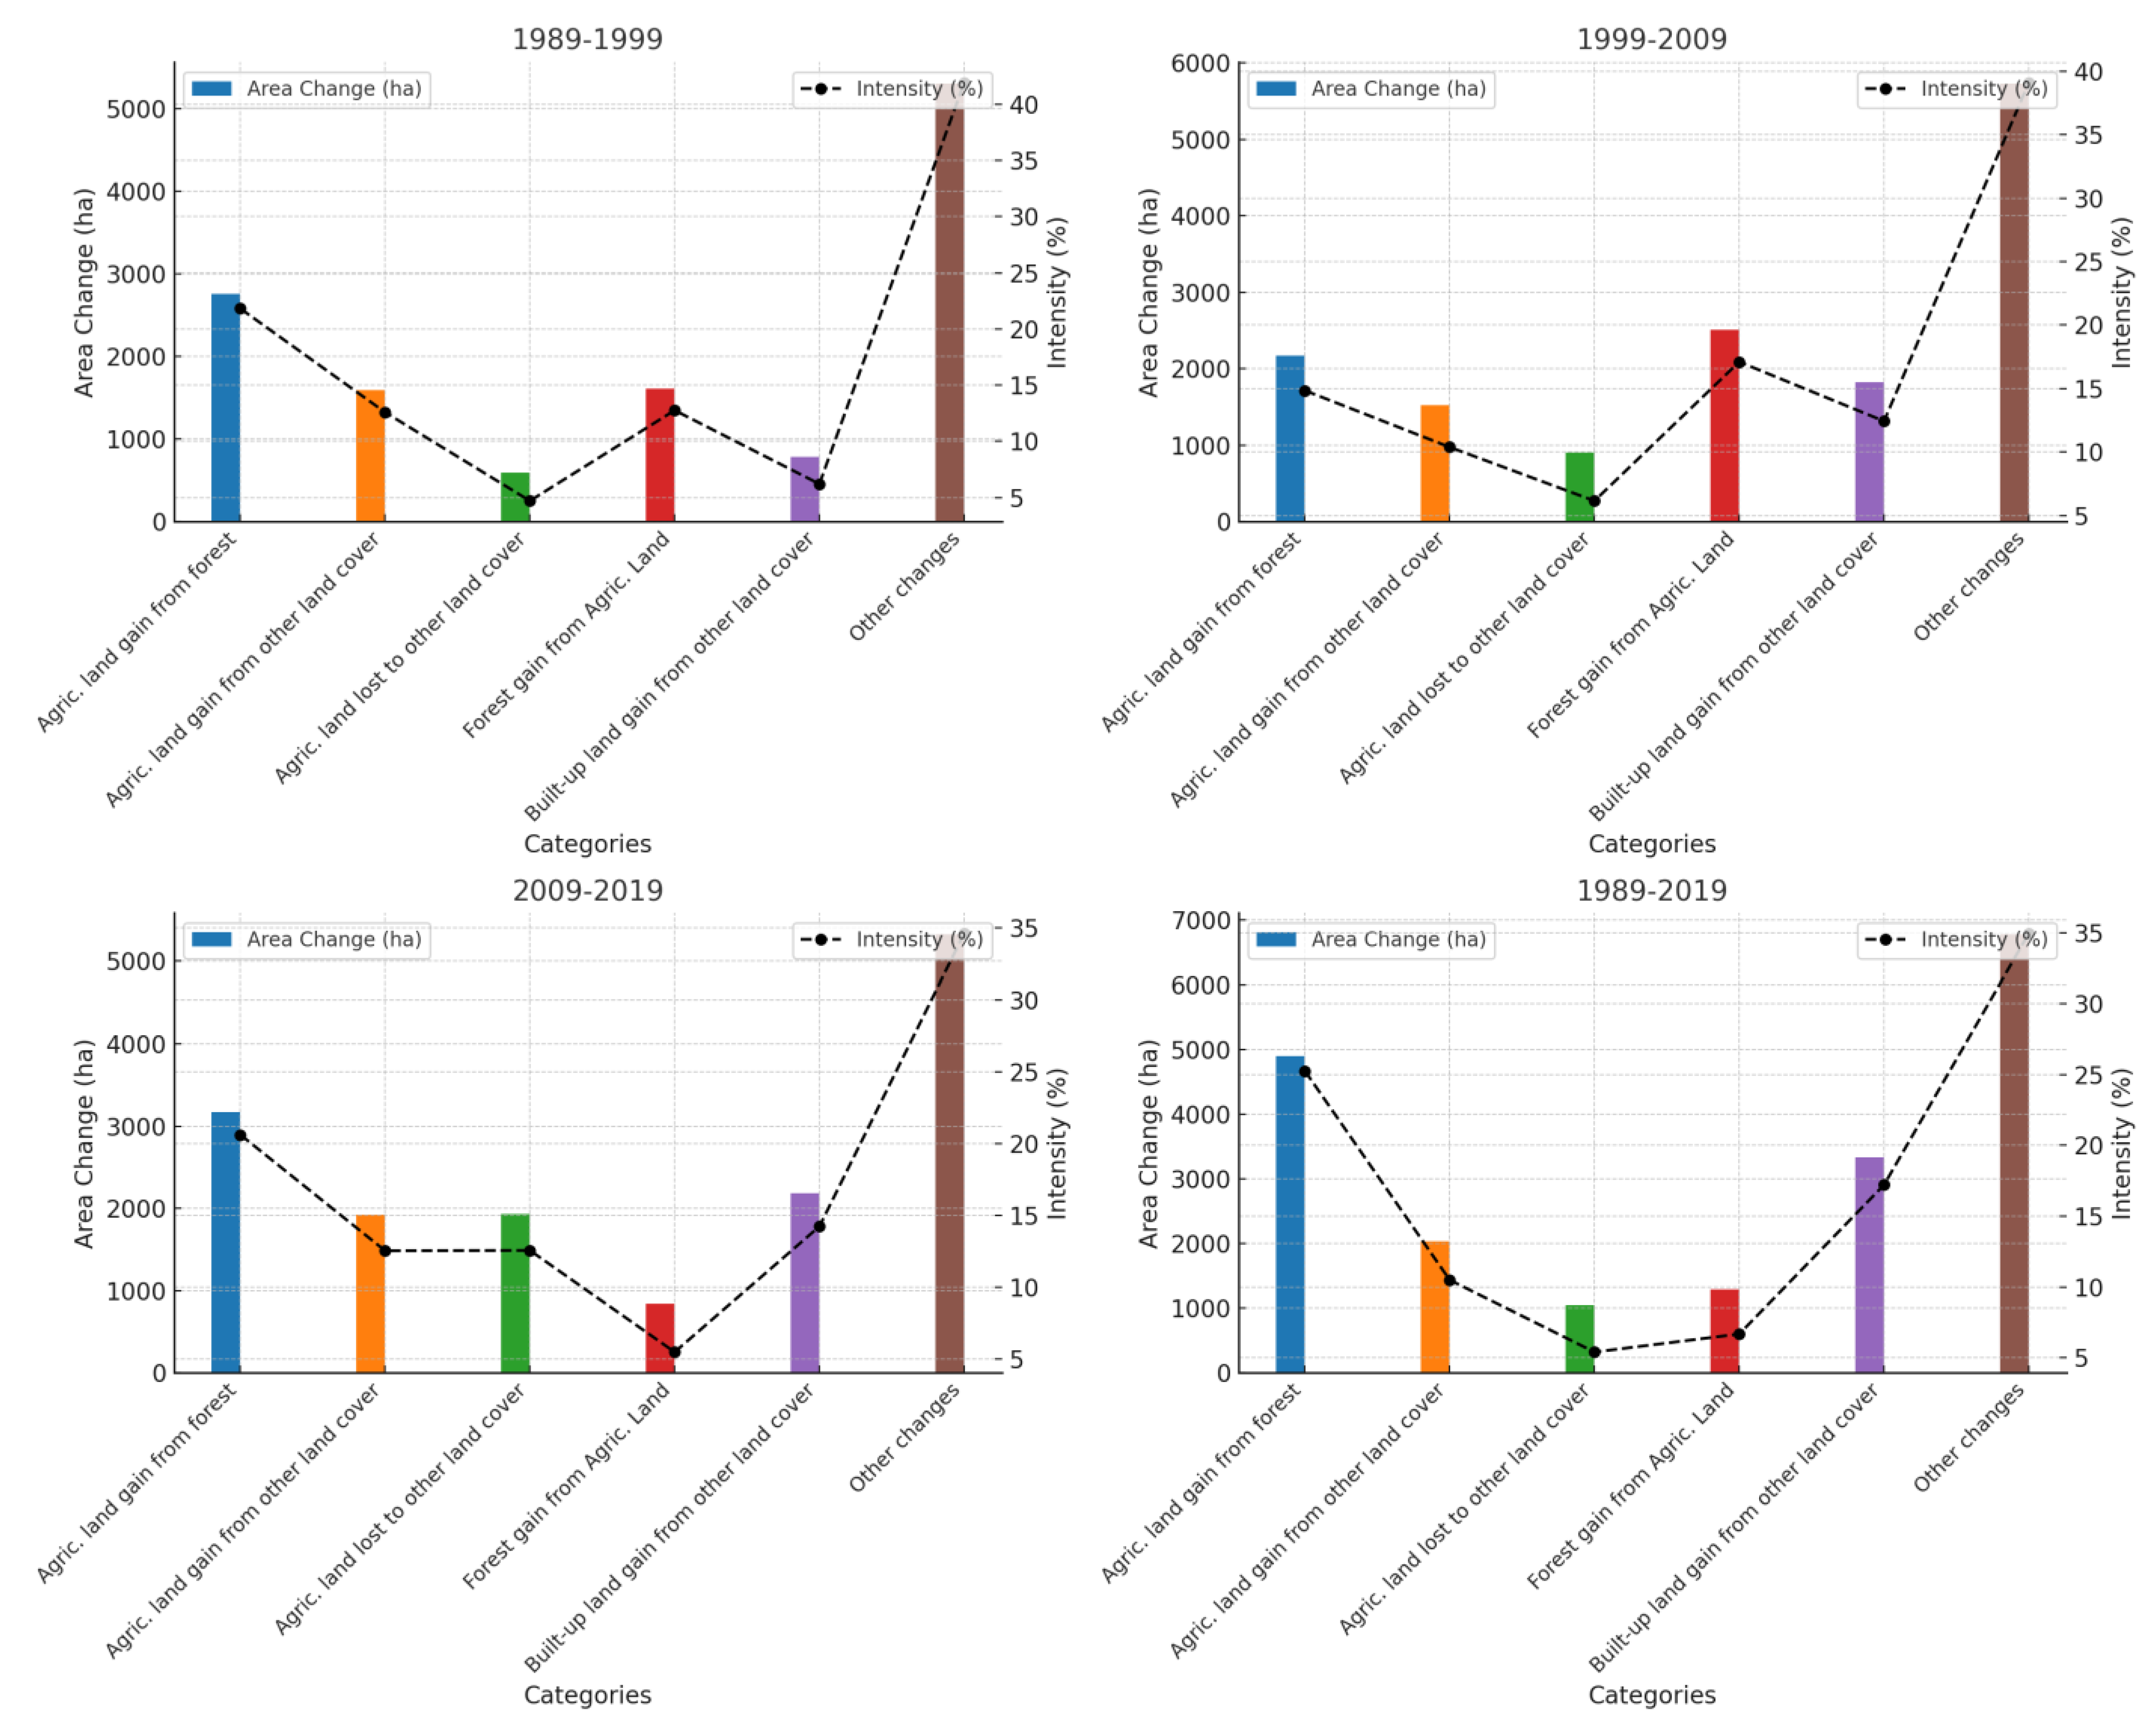
Across all time intervals (1989–1999, 1999–2009, 2009–2019, and 1989–2019), the analysis highlights the intensity of agricultural expansion within the mixed urban–rural Upper Kafue River Basin of Zambia, alongside its interactions with other LULC changes. From 1989 to 1999, the intensity of agricultural expansion was high, with substantial gains from forest areas and moderate contributions from other land categories. This agricultural intensity coincided with moderate urbanization reflected in built-up land gains and limited losses of agricultural land to other categories.
Between 1999 and 2009, agricultural expansion intensity persisted, though it was slightly reduced compared to the earlier period. During this interval, forest recovery showed heightened intensity, suggesting possible reforestation or land abandonment. Urbanization displayed growing intensity, indicative of increasing demands on the mixed urban–rural landscape. The period 2009–2019 witnessed the peak intensity of agricultural expansion, marked by significant gains from both forested areas and other land categories. This intensification reflects heightened pressures for agricultural productivity and expansion in response to socio-economic factors. Concurrently, urbanization intensity continued to grow, emphasizing the dynamic interaction between agricultural expansion and urban development within the basin.
Over the entire 30-year period (1989–2019), agricultural expansion intensity dominated the land-use dynamics of the Upper Kafue River Basin, driven primarily by the conversions of forested areas. This intensity, coupled with steady urbanization, underscores the basin’s dual role as a critical agricultural hub and an area undergoing significant urban transformation. The prominence of “other changes” across all intervals indicates systemic transitions affecting multiple land categories, further amplifying the landscape’s complexity. These findings highlight the central role of agricultural expansion intensity in shaping LULC changes within the mixed urban–rural Upper Kafue River Basin, providing critical insights for sustainable land management and planning (Figure 5).

4.5. Directional Gradient Analysis of Agriculture Expansion and LULC Changes

The directional gradient analysis from 1989 to 2019 reveals distinct patterns of agricultural expansion and LULC changes on both sides of the Upper Kafue River Basin. These trends reflect the contrasting rural and urban characteristics of the right and left sides, with notable changes observed both within and beyond 3 km from the river.
On the right side of the river, which is predominantly rural with scattered village settlements and extensive forest cover, agricultural land expanded significantly over the study period (see Figure 1). In 1989, forest cover dominated across all buffer zones, particularly beyond 3 km (3.0–4.6 km), where forested areas accounted for over 70% of the land. Agricultural land was sparse and primarily limited to closer buffer zones (0.6–3.0 km). Between 1989 and 1999, agricultural expansion became apparent within 0.6–3.0 km, with forest cover being steadily converted into farmland. Beyond 3 km, changes were initially minimal, but from 1999 to 2009, agricultural activity expanded further into the outer zones (3.0–4.6 km). By 2019, agricultural land had become a prominent feature even beyond 3 km, reflecting increased pressure to utilize marginal and forested lands for cultivation. This trend underscores the intensification of agricultural practices in rural areas and the diminishing availability of undeveloped land.
On the left side of the river, which is characterized by urbanized settlements and infrastructure, land-use changes beyond 3 km followed a different trajectory (see Figure 1 above). In 1989, forest cover was significant in zones beyond 3 km (3.0–4.6 km), while built-up areas were concentrated closer to the river (0.2–2.0 km). Agricultural land was scattered and comparatively limited. Between 1989 and 1999, modest agricultural expansion occurred in zones beyond 3 km, but the growth was much slower than on the right side. Instead, urbanization pressures closer to the river (within 0.2–2.0 km) began to shape the landscape, limiting agricultural expansion. From 1999 to 2009, agricultural land beyond 3 km showed minimal increases, while forest cover in these outer zones declined steadily. By 2019, agricultural land in the 3.0–4.6 km buffer zones had grown slightly, but the urban pressures closer to the river dominated the overall trends on the left side.
Comparing both sides of the river, the trends beyond 3 km highlight key differences in land-use dynamics. On the right side, agricultural expansion extended into the outer zones (3.0–4.6 km) over time, driven by the conversion of forests and unused lands. By 2019, these zones had seen a significant increase in agricultural activity, making them an important frontier for cultivation in the rural landscape. In contrast, on the left side, agricultural expansion beyond 3 km was more subdued, as urbanization closer to the river diverted development pressures away from these zones. Forest cover in the 3.0–4.6 km zones declined on both sides of the river, but the rate of decline was more pronounced on the rural right side, where forests were converted into agricultural land, than on the urbanized left side (Figure 6).

5. Discussion

5.1. LULC Maps and Accuracy

The high overall accuracies achieved for the LULC maps (93.4%, 89.0%, 90.4%, and 87.4% for 1989, 1999, 2009, and 2019, respectively) emphasize the robustness of the hybrid classification method utilized in this study. This accuracy is particularly significant in the context of Zambia, where LULC mapping often encounters challenges due to the complexity of mixed land-use systems. Compared to similar studies in sub-Saharan Africa, these accuracy levels exceed the average range reported, which often falls between 75% and 85% due to limitations in data quality and methodology [17,32]. Simwanda et al. demonstrated that hybrid approaches integrating pixel- and object-based methods improve classification reliability, especially in heterogeneous landscapes [19,20,22].
The results reinforce the reliability of the generated LULC maps as a foundation for analyzing long-term changes in the Upper Kafue River Basin. Accurate LULC maps are crucial for informing land-management policies and development strategies, particularly as Zambia strives to balance urbanization with sustainable natural resource use. This study addressed the methodological gaps in mapping mixed urban–rural landscapes in the region [22,27].

5.2. LULC Changes

The observed trends of forest cover decline and agricultural land expansion reflect ongoing pressures on Zambia’s natural resources. The significant decrease in forest cover from 55.5% in 1989 to 43.6% in 2019 is consistent with findings from Kalaba et al., who highlighted similar patterns in the Miombo woodlands due to agricultural encroachment and charcoal production [7]. Similarly, other studies noted comparable deforestation trends driven by agricultural land-use changes [6,20,22,23,26,27,33].
The expansion of agricultural land to 21.6% by 2019 aligns with broader trends in sub-Saharan Africa, where agricultural expansion has escalated to meet food security demands [1,16,34]. This study’s findings fill critical knowledge gaps regarding the spatiotemporal dynamics of LULC changes in Zambia’s urban–rural interfaces. Unlike previous studies that primarily focused on rural or urban settings in isolation [35,36], this analysis captures the interactions between urban growth and agricultural expansion along river basins. For instance, the rise in built-up areas from 5.9% in 1999 to 12.8% in 2019 demonstrates the dual pressures of urbanization and agriculture on land resources.

5.3. Spatiotemporal Patterns of Agricultural Expansion

The dominance of agricultural expansion as a driver of LULC changes highlights the critical role of agriculture in shaping Zambia’s landscapes, particularly along the Upper Kafue River Basin. The annual rate of forest-to-agriculture conversion, peaking at 317.0 hectares between 2009 and 2019, underscores the growing demand for agricultural land. These findings resonate with observations in other river basins in Africa [28,29] such as the Mara River Basin in Kenya, where agricultural expansion was similarly driven by population growth and socio-economic pressures [8]. Studies have further shown that agricultural expansion is linked to policy-driven land tenure reforms, which can influence the spatial distribution of land-use changes [19].
The persistence of agricultural land in the northeastern and central regions of the basin highlights areas of high agricultural productivity and long-term land-use stability. This observation supports the findings of Simwanda et al. and Jayne et al., emphasizing the importance of spatially targeted policies to balance agricultural productivity with environmental conservation [34,37]. Furthermore, forest regrowth on abandoned agricultural lands in the southern and western regions provides an opportunity for restoration and sustainable land use, aligning with recommendations by [2,38]. The role of smallholder farmers in driving agricultural expansion has also been well documented in sub-Saharan Africa [18,30,31].

5.4. Intensity of Agricultural Land Expansion and LULC Changes

The intensity analysis reveals critical insights into the dynamic interplay between agricultural expansion and other LULC changes. The peak intensity of agricultural expansion between 2009 and 2019, coupled with steady urbanization, reflects the dual pressures of food production and urban development. These findings align with studies in Ethiopia and Nigeria [39,40] as well as other regions [9,32], where agricultural intensification occurs alongside urban sprawl. The link between agricultural intensification and ecosystem degradation has also been observed in regions where land resources are under high demand [15].
This study’s contribution lies in its comprehensive understanding of these interactions within the mixed urban–rural context of Zambia’s Upper Kafue River Basin. By identifying areas of high-intensity change, such as the northeastern sections, policymakers can prioritize interventions to mitigate deforestation and promote sustainable agriculture. Additionally, the prominence of “other changes” indicates systemic transitions affecting multiple land categories, highlighting the need for integrated land-management approaches [18,41].

5.5. Directional Gradient Analysis of Agricultural Expansion and LULC Changes

The directional gradient analysis highlights the contrasting dynamics on the rural right side and urbanized left side of the river. The significant agricultural expansion into outer buffer zones on the right side illustrates the pressure to convert marginal and forested lands for cultivation. This trend aligns with findings by Simwanda et al. who noted similar patterns of expansion into peripheral areas in urban–rural gradients [6]. Studies have further shown that proximity to water bodies plays a critical role in determining land-use change patterns, particularly in arid and semi-arid regions [6,7,33,34].
On the left side, subdued agricultural expansion reflects the dominance of urbanization pressures near the river. This pattern is consistent with Zhou et al. who found that urban expansion often redirects development pressures away from agriculture [42]. The study’s identification of forest cover decline beyond 3 km on both sides underscores the widespread impact of agricultural and urban pressures on forested areas, echoing concerns raised by [2]. Studies have further shown that proximity to water bodies plays a critical role in determining land-use change patterns, particularly in arid and semi-arid regions [5,6,35].
By providing a detailed spatial understanding of these dynamics, this study addresses a critical gap in the literature on land-use planning in Zambia and sub-Saharan Africa. The contrasting trends emphasize the need for region-specific strategies to manage land resources effectively, such as promoting agroforestry in rural areas and optimizing urban land use near river basins.

5.6. Implications on Policy and Sustainable Management of River Basins

The findings of this study underline the need for integrated land-management policies that balance developmental pressures with environmental conservation in Zambia’s River basins. The Upper Kafue River Basin, as a critical agricultural hub, exemplifies the challenges of managing competing land uses in mixed urban–rural contexts. Agricultural expansion, while essential for food security, must be balanced against the degradation of forests and other critical ecosystems. Policies promoting agroforestry and conservation agriculture can mitigate these impacts, aligning land-use practices with sustainable development goals and the African Union Agenda 2063.
The identification of forest regrowth on abandoned agricultural lands presents an opportunity for reforestation and ecosystem restoration programs. Such initiatives can enhance biodiversity, improve water quality, and contribute to climate change mitigation through carbon sequestration. Moreover, enforcing buffer zones and zoning regulations along river basins is essential to curbing encroachment into ecologically sensitive areas. This can help to maintain ecosystem services while supporting agricultural productivity in marginal lands.
Urban growth near river basins must also be managed to prevent conflicts with agricultural and ecological priorities. Integrating urban planning with river basin management can ensure that infrastructure development does not compromise the ecological integrity of river systems. Green infrastructure and urban growth boundaries are potential tools to achieve this balance.
Stakeholder engagement is critical in the formulation and implementation of these policies. Farmers, local communities, and urban planners must be involved in decision-making processes to ensure the policies are both effective and equitable. Participatory approaches can help address socio-economic realities while fostering community ownership of conservation and development initiatives. Therefore, the Upper Kafue River Basin serves as an example of the broader challenges facing sub-Saharan Africa in managing land resources. By integrating sustainable practices and policies, it is possible to address the dual objectives of agricultural productivity and environmental conservation, providing a blueprint for other regions in similar contexts.

5.7. Limitations of the Study

This study relied on remote-sensing and GIS techniques, which provide spatial insights but do not capture the socio-economic drivers of land-use change. The absence of extensive socio-economic surveys limit the ability to directly link the observed changes to policy, economic activities, and local decision-making processes. To compensate for this limitation, the study employed advanced analytical techniques: intensity analysis and directional gradient analysis. These methods provide a deeper understanding of land-transition patterns, offering insights that guide policy interventions even in the absence of field-based socio-economic data. In addition, the temporal resolution, based on decadal intervals (1989, 1999, 2009, and 2019), may not fully capture short-term fluctuations in land-use dynamics such as temporary agricultural abandonment or seasonal land-cover variation.
This study also focused on a specific 40 km stretch of the Upper Kafue River Basin, which limits the generalizability of the findings to other regions of Zambia or sub-Saharan Africa with different climatic, economic, or policy contexts. Despite spatial constraints, the study provides a representative case of mixed urban–rural land transitions in a developing country context. The methodological framework used can be adapted to analyze similar regions, making the findings relevant for broader applications in sustainable land management
Future studies should incorporate multi-seasonal imagery and socio-economic assessments to further refine LULC change analyses. However, despite these areas for improvement, this study offers critical insights that can inform sustainable land-management policies, balancing agricultural expansion with environmental conservation.

6. Conclusions

This study provides critical insights into the spatiotemporal patterns of agricultural expansion intensity and land-use/cover changes in the Upper Kafue River Basin of Zambia over a 30-year period. The findings reveal the dominance of agricultural expansion as a primary driver of land-use changes, often at the expense of forested areas, which declined significantly over the study period. While agricultural growth is essential for food security and economic development, its implications on forest loss and ecosystem degradation highlight the need for sustainable land-management strategies.
By employing robust methodologies such as hybrid classification, intensity analysis, and directional gradient analysis, this study fills significant knowledge gaps in understanding the interactions between urbanization, agriculture, and environmental conservation in mixed urban–rural landscapes. The results emphasize the importance of spatially targeted interventions to balance developmental needs with ecological sustainability.
The study’s implications extend beyond Zambia, offering valuable lessons for managing similar river basins across sub-Saharan Africa. Integrated policies that promote sustainable agricultural practices, enforce zoning regulations, and support reforestation efforts are critical for mitigating the adverse effects of land-use changes. Moreover, fostering stakeholder participation in land-management decisions ensures equitable and effective solutions. In addressing the dual challenges of agricultural expansion and urban growth, the Upper Kafue River Basin serves as a model for achieving sustainable development goals in resource-constrained settings. Future research should focus on refining these findings through longitudinal studies and exploring innovative strategies to enhance the resilience of river basin ecosystems under growing developmental pressures.

Author Contributions

Conceptualization, R.V.D., M.S., M.R., Y.M. and R.V.; methodology, R.V.D., M.S., M.R., Y.M. and R.V.; software, M.S., M.R., Y.M. and R.V.D.; validation, M.S., R.V., M.R., Y.M. and R.V.D.; formal analysis, R.V.D., M.S., M.R., Y.M. and R.V., investigation, R.V.D. and M.S.; resources, R.V. and M.S.; data curation, M.S., M.R., Y.M. and R.V.D.; writing—original draft preparation, R.V.D.; writing—review and editing, R.V.D., M.S., M.R., Y.M. and R.V.; visualization, M.S. and R.V.D.; supervision, M.S. and R.V.; project administration, R.V.D. and M.S.; funding acquisition, R.V.D. All authors have read and agreed to the published version of the manuscript.

Funding

This research was partly funded by (i) COPPERBELT UNIVERSITY, Africa Centre of Excellence for Sustainable Mining (ACESM II), (ii) UK Research and Innovation (UKRI) through the Global Challenges Research Fund (GCRF) Programme, Grant Ref: ES/P011306/ under the project Social and Environmental Trade-offs in African Agriculture (SENTINEL) led by the International Institute for Environment and Development (IIED) in part implemented by the Regional Universities Forum for Capacity Building in Agriculture (RUFORUM), and (iii) JSPS Grant 24K04416.

Institutional Review Board Statement

Not applicable.

Data Availability Statement

Dataset available on request from the authors. The raw data supporting the conclusions of the article will be made available by the authors on request.

Conflicts of Interest

The authors declare no conflicts of interest. The funders had no role in the design of the study; in the collection, analyses, or interpretation of data; in the writing of the manuscript; or in the decision to publish the results.

Abbreviations

The following abbreviations are used in this manuscript:
LULCLand-use land-cover
SDGsSustainable development goals
GISGeographic Information Systems
OBPRObject-based post-classification refinement
PBCPixel-based classification

References

  1. Lambin, E.F.; Turner, B.L.; Geist, H.J.; Agbola, S.B.; Angelsen, A.; Bruce, J.W.; Coomes, O.T.; Dirzo, R.; Fischer, G.; Folke, C.; et al. The causes of land-use and land-cover change: Moving beyond the myths. Glob. Environ. Chang. 2001, 11, 261–269. [Google Scholar] [CrossRef]
  2. Laurance, W.F.; Sayer, J.; Cassman, K.G. Agricultural expansion and its impacts on tropical nature. Trends Ecol. Evol. 2014, 29, 107–116. [Google Scholar] [CrossRef] [PubMed]
  3. Pontius, R.G.; Gao, Y.; Giner, N.M.; Kohyama, T.; Osaki, M.; Hirose, K. Design and interpretation of intensity analysis illustrated by land change in Central Kalimantan, Indonesia. Land 2013, 2, 351–369. [Google Scholar] [CrossRef]
  4. Gibbs, H.K.; Ruesch, A.S.; Achard, F.; Clayton, M.K.; Holmgren, P.; Ramankutty, N.; Foley, J.A. Tropical forests were the primary sources of new agricultural land in the 1980s and 1990s. Proc. Natl. Acad. Sci. USA 2010, 107, 16732–16737. [Google Scholar] [CrossRef]
  5. FAO. Assessing and Planning City Region Food System Kitwe (Zambia) Synthesis Report; FAO: Rome, Italy, 2018. [Google Scholar]
  6. Simwanda, M.; Murayama, Y. Spatiotemporal patterns of urban land use change in the rapidly growing city of Lusaka, Zambia: Implications for sustainable urban development. Sustain. Cities Soc. 2018, 39, 262–274. [Google Scholar] [CrossRef]
  7. Kalaba, F.K.; Quinn, C.H.; Dougill, A.J.; Vinya, R. Floristic composition, species diversity and carbon storage in charcoal and agriculture fallows and management implications in Miombo woodlands of Zambia. For. Ecol. Manag. 2013, 304, 99–109. [Google Scholar] [CrossRef]
  8. Mwangi, H.M.; Lariu, P.; Julich, S.; Patil, S.D.; McDonald, M.A.; Feger, K.H. Characterizing the intensity and dynamics of land-use change in the Mara River Basin, East Africa. Forests 2017, 9, 8. [Google Scholar] [CrossRef]
  9. Enaruvbe, G.O.; Pontius, R.G. Influence of classification errors on Intensity Analysis of land changes in southern Nigeria. Int. J. Remote Sens. 2015, 36, 244–261. [Google Scholar] [CrossRef]
  10. Huang, F.; Huang, B.; Huang, J.; Li, S. Measuring land change in coastal zone around a rapidly urbanized bay. Int. J. Environ. Res. Public Health 2018, 15, 1059. [Google Scholar] [CrossRef]
  11. 2020 Africa Sustainable Development Report 1; United Nations Economic Commission for Africa: Addis Ababa, Ethiopia, 2020.
  12. Casarotto, C. Water Economics and Governance in the Kafue River Basin, Zambia. Ph.D. Thesis, ETH Zürich, Zürich, Switzerland, 2013. [Google Scholar]
  13. Uhlendahl, T.; Salian, P.; Casarotto, C.; Doetsch, J. Good water governance and IWRM in Zambia: Challenges and chances. Water Policy 2011, 13, 845–862. [Google Scholar] [CrossRef]
  14. UN-HABITAT. Zambia: Kitwe Urban Profile; UN-Habitat: Nairobi, Kenya, 2009. [Google Scholar]
  15. Central Statistical Office (CSO). 2010 Census of Population and Housing; Central Statistical Office (CSO): Lusaka, Zambia, 2012. [Google Scholar]
  16. Central Statistical Office (CSO). 2022 Census of Population and Housing.pdf; Central Statistical Office (CSO): Lusaka, Zambia, 2023. [Google Scholar]
  17. Aguirre-Gutiérrez, J.; Seijmonsbergen, A.C.; Duivenvoorden, J.F. Optimizing land cover classification accuracy for change detection, a combined pixel-based and object-based approach in a mountainous area in Mexico. Appl. Geogr. 2012, 34, 29–37. [Google Scholar] [CrossRef]
  18. Li, X.; Lei, L. Regional Sustainability Evaluating rural sustainable land use from a system perspective based on the ecosystem service value. Reg. Sustain. 2023, 4, 96–114. [Google Scholar]
  19. Simwanda, M.; Murayama, Y. Integrating geospatial techniques for urban land use classification in the developing sub-Saharan African City of Lusaka, Zambia. ISPRS Int. J. Geo-Inf. 2017, 6, 102. [Google Scholar] [CrossRef]
  20. Congalton, R.G. A review of assessing the accuracy of classification of remotely sensed data. Remote Sens. Environ. 1991, 37, 34–46. [Google Scholar] [CrossRef]
  21. Liu, S.; Qi, Z.; Li, X.; Yeh, A.G.O. Integration of convolutional neural networks and object-based post-classification refinement for land use and land cover mapping with optical and sar data. Remote Sens. 2019, 11, 690. [Google Scholar] [CrossRef]
  22. Subasinghe, S.; Wang, R.; Simwanda, M.; Murayama, Y.; Vitanova, L.L. Neighborhood dynamics of urban expansion based on morphological spatial pattern analysis and geospatial techniques: A case study of the Colombo metropolitan area, Sri Lanka. Asian Geogr. 2022, 39, 155–175. [Google Scholar] [CrossRef]
  23. Aldwaik, S.Z.; Pontius, R.G., Jr. Intensity analysis to unify measurements of size and stationarity of land changes by interval, category, and transition. Landsc. Urban Plan. 2012, 106, 103–114. [Google Scholar] [CrossRef]
  24. Zaehringer, J.G.; Eckert, S.; Messerli, P. Revealing Regional Deforestation Dynamics in North-Eastern Madagascar—Insights from Multi-Temporal Land Cover Change Analysis. Land 2015, 4, 454–474. [Google Scholar] [CrossRef]
  25. Luck, M.; Wu, J. A gradient analysis of urban landscape pattern: A case study from the Phoenix metropolitan region, Arizona, USA. Landsc. Ecol. 2002, 17, 327–339. [Google Scholar] [CrossRef]
  26. Estoque, R.C.; Murayama, Y.; Myint, S.W. Effects of landscape composition and pattern on land surface temperature: An urban heat island study in the megacities of Southeast Asia. Sci. Total Environ. 2017, 577, 349–359. [Google Scholar] [CrossRef]
  27. Ranagalage, M.; Wang, R.; Gunarathna, M.H.J.P.; Dissanayake, D.M.S.L.B.; Murayama, Y.; Simwanda, M. Spatial forecasting of the landscape in rapidly urbanizing hill stations of South Asia: A case study of Nuwara Eliya, Sri Lanka (1996–2037). Remote Sens. 2019, 11, 1743. [Google Scholar] [CrossRef]
  28. Hou, H.; Wang, R.; Murayama, Y. Scenario-based modelling for urban sustainability focusing on changes in cropland under rapid urbanization: A case study of Hangzhou from 1990 to 2035. Sci. Total Environ. 2019, 661, 422–431. [Google Scholar] [CrossRef] [PubMed]
  29. Zhou, X.; Wang, Y. Spatial—Temporal dynamics of urban green space in response to rapid urbanization and greening policies. Landsc. Urban Plan. 2011, 100, 268–277. [Google Scholar] [CrossRef]
  30. Hou, Y.; Müller, F.; Li, B.; Kroll, F. Urban-Rural Gradients of Ecosystem Services and the Linkages with Socioeconomics. Landsc. Online 2015, 31, 1–31. [Google Scholar] [CrossRef]
  31. Subasinghe, S.; Estoque, R.C.; Murayama, Y. Spatiotemporal Analysis of Urban Growth Using GIS and Remote Sensing: A Case Study of the Colombo Metropolitan Area, Sri Lanka. Int. J. Geo-Inf. 2016, 5, 197. [Google Scholar] [CrossRef]
  32. Li, X.; Wang, Y.; Li, J.; Lei, B. Physical and Socioeconomic Driving Forces of Land-Use and Land-Cover Changes: A Case Study of Wuhan City, China. Discret. Dyn. Nat. Soc. 2016, 2016, 8061069. [Google Scholar] [CrossRef]
  33. Schneibel, A.; Stellmes, M.; Röder, A.; Finckh, M.; Revermann, R.; Frantz, D.; Hill, J. Evaluating the trade-off between food and timber resulting from the conversion of Miombo forests to agricultural land in Angola using multi-temporal Landsat data. Sci. Total Environ. 2016, 548–549, 390–401. [Google Scholar] [CrossRef]
  34. Jayne, T.S.; Chapoto, A.; Sitko, N.; Nkonde, C.; Chamberlin, J. Eoreclosing a Smallholder Agricultural Expansion Strategy? J. Int. Aff. 2014, 67, 35–54. [Google Scholar]
  35. Phiri, D.; Mwitwa, J.; Ng, P.; Kanja, K. Agricultural Expansion into Forest Reserves in Zambia: A Remote Sensing Agricultural expansion into forest reserves in Zambia: A remote sensing approach. Geocarto Int. 2023, 38, 2213203. [Google Scholar] [CrossRef]
  36. Vinya, R.; Syampungani, S.; Kasumu, E.; Monder, C.; Kasubika, R. Preliminary Study on the Drivers of Deforestation and Potential for REDD+ in Zambia; UN Environment Programme: Nairobi, Kenya, 2011; p. 66. [Google Scholar]
  37. Simwanda, M.; Murayama, Y.; Ranagalage, M. Land Use Policy Modeling the drivers of urban land use changes in Lusaka, Zambia using multi-criteria evaluation: An analytic network process approach. Land Use Policy 2020, 92, 104441. [Google Scholar] [CrossRef]
  38. Elias, E.; Seifu, W.; Tesfaye, B.; Girmay, W. Impact of land use/cover changes on lake ecosystem of Ethiopia central rift valley. Cogent Food Agric. 2019, 5, 1595876. [Google Scholar] [CrossRef]
  39. Jiang, L.; Deng, X.; Seto, K.C. The impact of urban expansion on agricultural land use intensity in China. Land Use Policy 2013, 35, 33–39. [Google Scholar] [CrossRef]
  40. Olokeogun, O.S.; Ayanlade, A.; Popoola, O.O. Assessment of riparian zone dynamics and its flood—Related implications in Eleyele area of Ibadan, Nigeria. Environ. Syst. Res. 2020, 9, 6. [Google Scholar] [CrossRef]
  41. Hamilton, S.K.; Hussain, M.Z.; Lowrie, C.; Basso, B.; Robertson, G.P. Evapotranspiration is resilient in the face of land cover and climate change in a humid temperate catchment. Hydrol. Process. 2018, 32, 655–663. [Google Scholar] [CrossRef]
  42. Zhou, P.; Huang, J.; Pontius, R.G.; Hong, H. Land classification and change intensity analysis in a coastal watershed of Southeast China. Sensors 2014, 14, 11640–11658. [Google Scholar] [CrossRef]
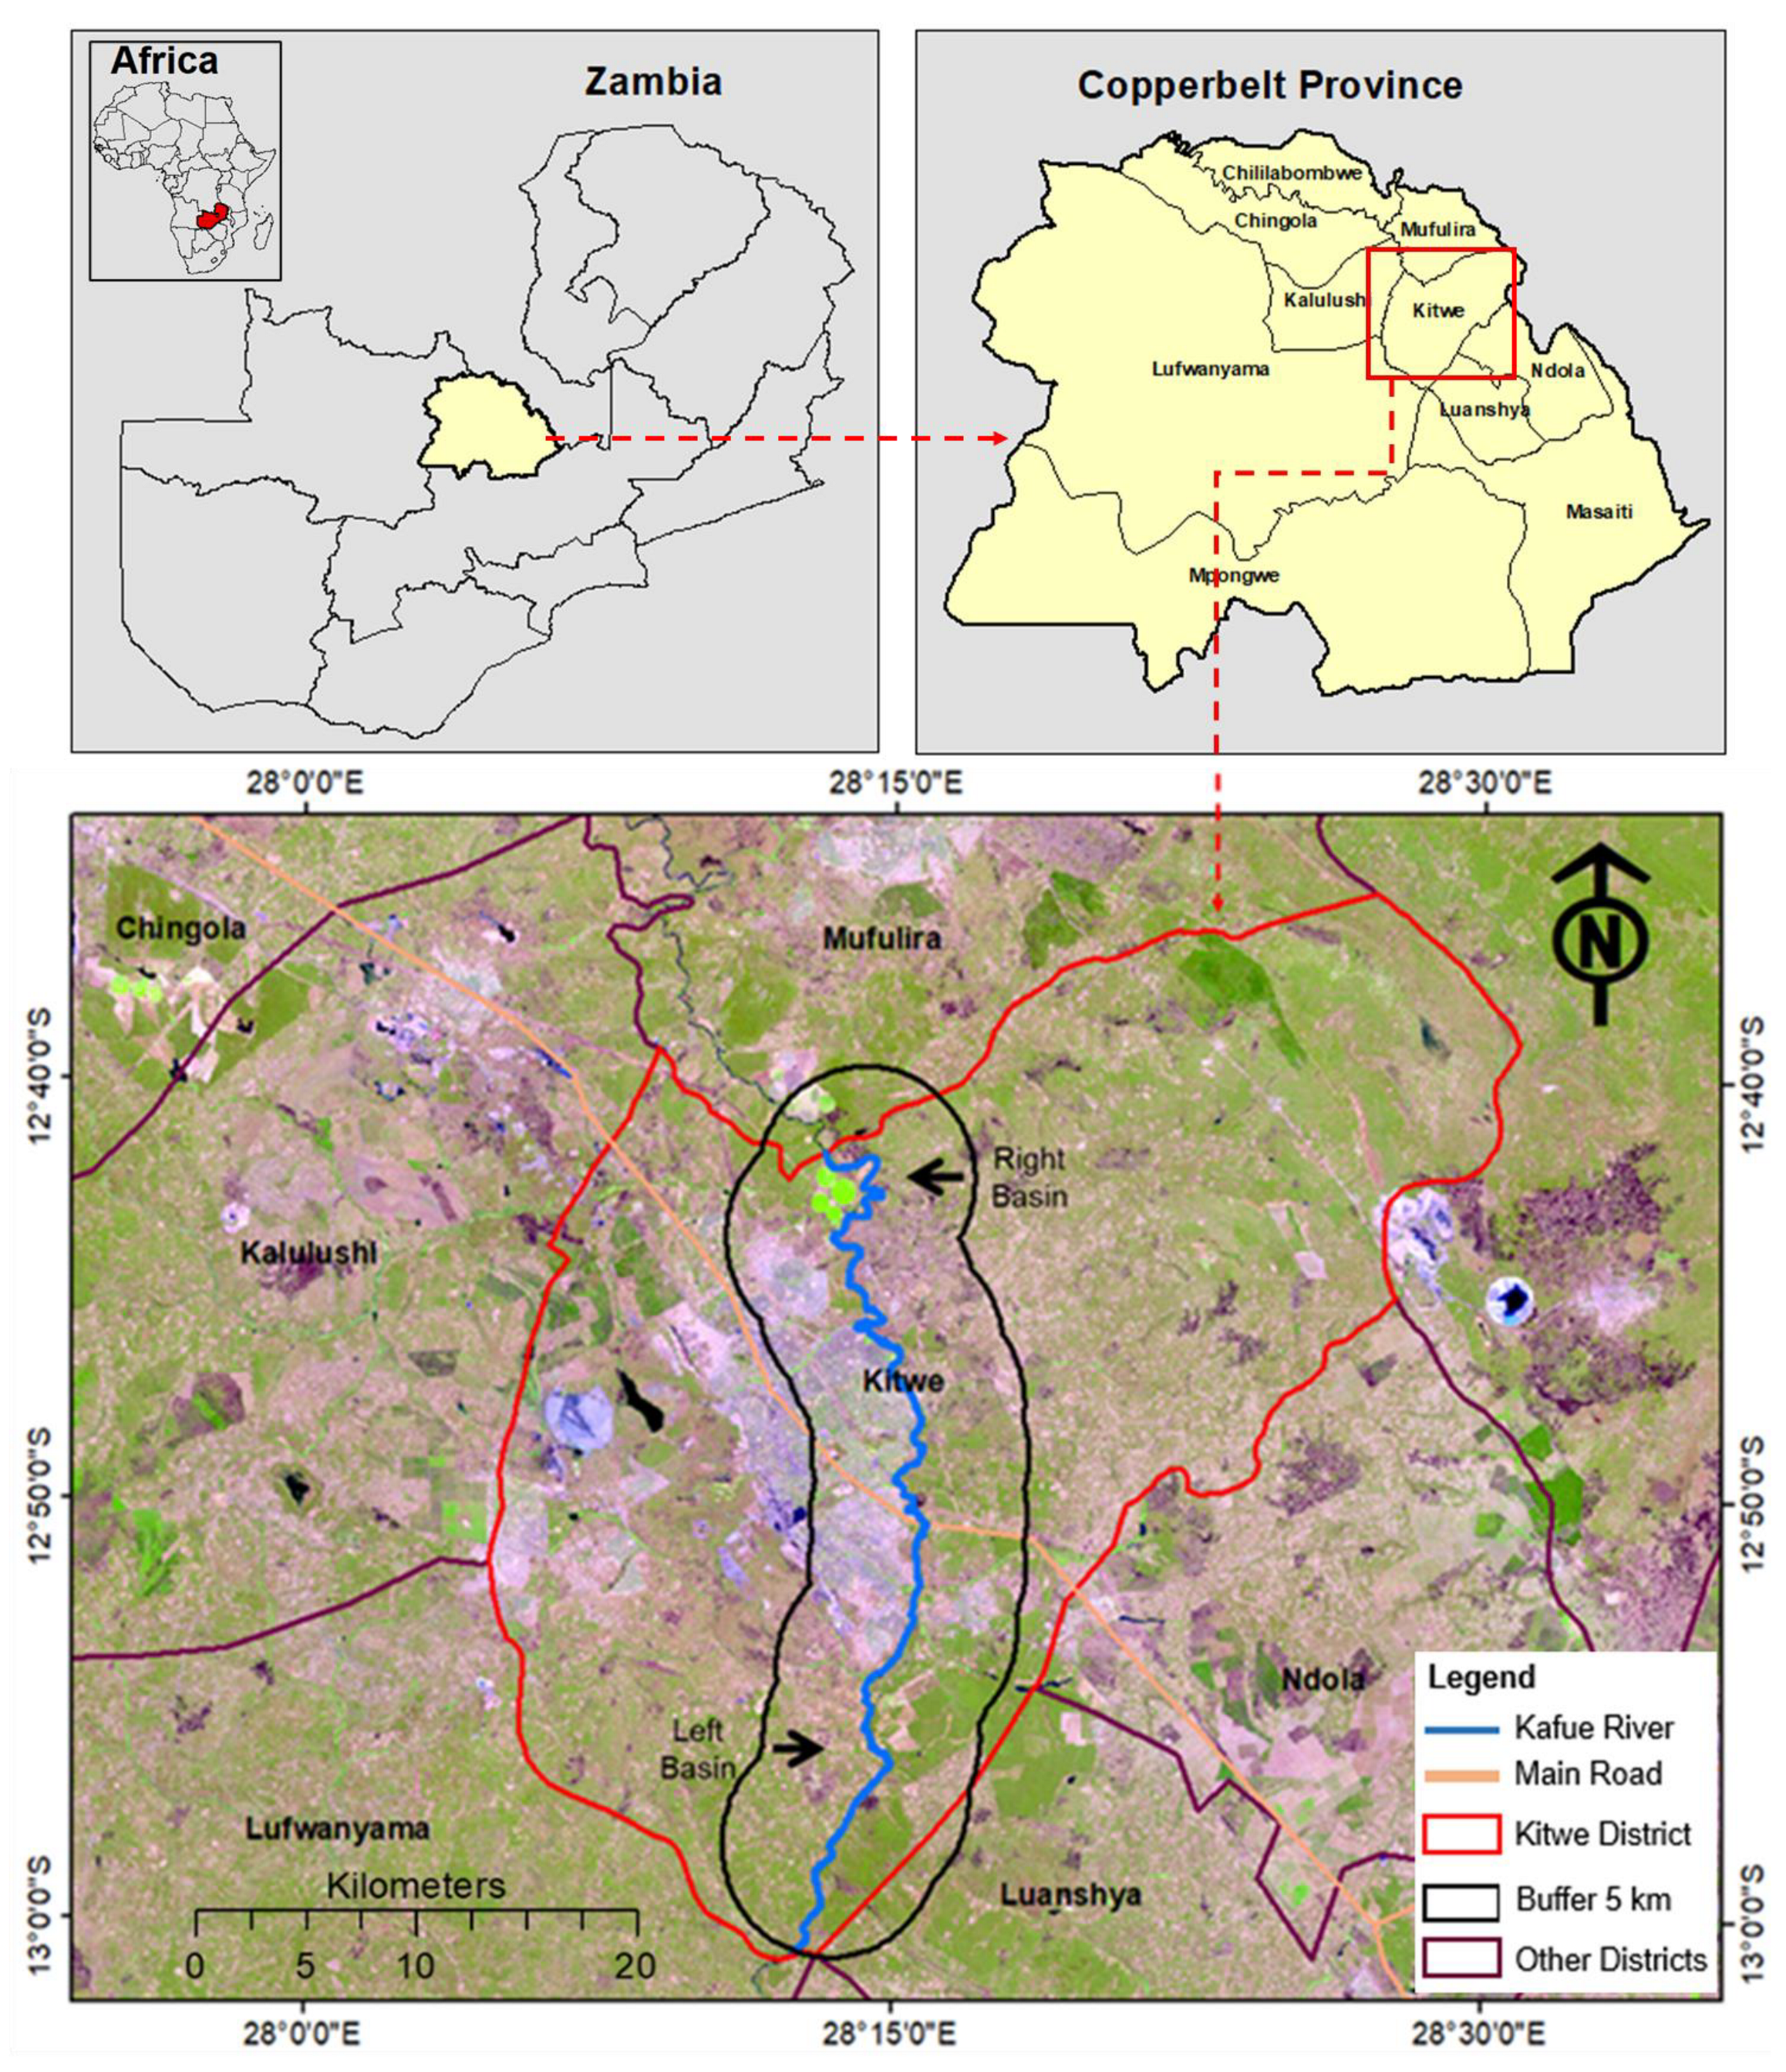
Figure 1. Study area: Upper Kafue River Stretch (40 km) located in Kitwe District, Copperbelt Province, Zambia.
Agriculture 15 01047 g001
Figure 2. Overall workflow of the study: (a) Pixel-Based Classification (PBC) technique; (b) Object-Based Post-Classification Refinement (OBPR); and (c) LULC Analysis (Change detection, intensity analysis, directional gradient analysis, and statistical analysis).
Agriculture 15 01047 g002
Figure 3. LULC maps for the Upper Kafue River Basin (1989 to 2019).
Agriculture 15 01047 g003
Figure 4. Spatiotemporal patterns of agriculture land expansion and LULC changes.
Agriculture 15 01047 g004
Figure 5. Intensity of agriculture land expansion and LULC changes.
Agriculture 15 01047 g005
Figure 6. Agriculture expansion and LULC changes along the river basin directional (left and right) gradient.
Agriculture 15 01047 g006
Table 1. Details of the Landsat 5TM and 8 OLI/TRS imagery.
SensorScene IDAcquisition DateTime (GMT)
Landsat-8 OLI/TIRSLC81720692019156LGN005 May 201908:46:15
Landsat-5TMLT51720692009176JSA0224 May 200907:30:45
Landsat-5TMLT51720691999181JSA002 May 199907:56:53
Landsat-5TMLT51720691999181JSA0018 May 198908:30:33
Table 2. LULC classification scheme.
LULC ClassDescription
Built-upAreas with a high concentration of human-made structures and activities, including urban and rural residential zones, commercial and industrial areas, transportation networks, and all impervious surfaces.
ForestForested areas including customary land forests, plantations, and deciduous and mixed forests, as well as protected forests.
Agricultural landLands primarily used for crop cultivation at both subsistence and commercial levels.
GrasslandOpen landscapes predominantly covered by grasses and small shrubs, with minimal tree cover.
Bare landLand with little-to-no vegetation, lacking significant human-made structures.
WaterAll natural and artificial water bodies, including streams, rivers, lakes, and reservoirs.
Table 3. Mathematical notation for all equations.
SymbolMeaning
Ntiintensity of annual net change for category i during time interval [Yt,Yt + 1] relative to size of category i at time point t
Stannual change percentage during time interval [Yt,Yt + 1]
Ctijnumber of pixels that are category i at time t and category j at time point t + 1
Gtjintensity of annual gain of category j during time interval [Yt,Yt + 1] relative to size of category j at time point t + 1
Ltiintensity of annual loss of category i during time interval [Yt,Yt + 1] relative to size of category i at time point t + 1
iindex for a category
jindex for a category
Jnumber of categories
tindex for a time point
Ytyear at time point t
Table 4. LULC maps statistics for the Upper Kafue River Basin (1989 to 2019).
LULC Class1989199920092019
Area (ha)%Area (ha)%Area (ha)%Area (ha)%
Built-up2236.15.82278.05.93557.19.24971.812.8
Forest21,505.855.522,362.757.721,213.954.716,898.943.6
Agricultural land3983.910.36112.015.86356.216.48358.121.6
Grassland126.90.385.10.2411.91.11463.03.8
Bare land10,610.727.47690.719.86856.817.766,02.217.0
Water316.80.8251.80.6384.31.0486.31.3
Total38,780.210038,780.210038,780.210038,780.2100
Table 5. Area changes in LULC classes along the Upper Kafue River Basin (1989 to 2019).
LULC
Changes
1989–19991999–20092009–20191989–2019
Area (ha)Annual ChangeArea (ha)Annual ChangeArea (ha)Annual ChangeArea (ha)Annual Change
Built-up 41.84.21279.1127.91414.7141.52735.691.2
Forest856.985.7−1148.8−114.9−4315.1−431.5−4606.9−153.6
Agricultural land2128.1212.8244.224.42002.0200.24374.3145.8
Grassland−41.9−4.2326.932.71051.0105.11336.144.5
Bare land−2920.1−292.0−833.9−83.4−254.6−25.5−4008.5−133.6
Water−65.0−6.5132.513.2102.010.2169.55.6
Table 6. Agriculture land expansion and LULC change patterns.
LULC Change1989–19991999–20092009–20191989–2019
Area (ha)Annual Change (ha/y)Area (ha)Annual Change (ha/y)Area (ha)Annual Change (ha/y)Area (ha)Annual Change (ha/y)
Agricultural land gain from forest2760.8276.12175.3217.53169.7317.04895.1163.2
Agricultural land gain from other land cover1592.7159.31522.0152.21926.5192.72034.667.8
Agricultural land lost to other land cover595.259.5902.190.21930.0193.01048.234.9
Forest gain from agricultural land1614.9161.52506.4250.6840.284.01294.743.2
Built-up land gain from other land cover785.578.61822.1182.22186.9218.73335.5111.2
Other changes5305.7530.65728.5572.95323.7532.46771.0225.7
Permanent agricultural land1758.4175.82658.9265.93411.5341.11578.052.6
Permanent built-up area1492.5149.21735.0173.52773.3277.31624.754.2
Permanent forest17,151.21715.116,440.51644.014,420.91442.112,811.5427.1
Permanent other lands5723.3572.33289.5329.02797.6279.83386.9112.9
38,780.2-38,780.2-38,780.2-38,780.2-
Disclaimer/Publisher’s Note: The statements, opinions and data contained in all publications are solely those of the individual author(s) and contributor(s) and not of MDPI and/or the editor(s). MDPI and/or the editor(s) disclaim responsibility for any injury to people or property resulting from any ideas, methods, instructions or products referred to in the content.