Article

Assessing the Economic Value of Carbon Sinks in Farmland Using a Multi-Scenario System Dynamics Model

1
School of Economics and Management, Zhejiang Sci-Tech University, Hangzhou 310018, China
2
Zhejiang Academy of Eco-Civilization, Zhejiang Sci-Tech University, Hangzhou 310018, China
3
School of Public Administration, Zhejiang University of Finance and Economics, Hangzhou 310018, China
*
Author to whom correspondence should be addressed.
Agriculture 2025, 15(1), 69; https://doi.org/10.3390/agriculture15010069
Submission received: 4 November 2024 / Revised: 12 December 2024 / Accepted: 26 December 2024 / Published: 30 December 2024
(This article belongs to the Section Agricultural Economics, Policies and Rural Management)

Abstract

:
Exploring the economic value of carbon sinks in agricultural systems can improve the development of sustainable agriculture. However, there are few studies on the economic value of farmland carbon sinks from a systemic perspective. This study takes Zhejiang, China’s first common wealth demonstration zone, as an example, and quantifies the carbon sinks in farmland and their economic value. The driving mechanism is analyzed by using a system dynamics model. The potential value and management of farmland carbon sinks are discussed. The results show that from 2007 to 2021, the average annual carbon sinks in farmland of Zhejiang were 5.84 million tons, a downward trend. The annual economic value was CNY 149.80 million, a marked upward trend. A rational fertilization project is a win-win ecological and economical measure to enhance the carbon sinks in farmland. Artificially increasing the carbon price to 32% will help Zhejiang achieve the core goal of the common prosperity plan, bringing the urban–rural income gap below 1.9 in 2025. Achieving the economic value of farmland carbon sinks is a green way to narrow the urban–rural income gap. Our study indicates that the marketization of carbon sinks in agricultural land systems may be a very promising path to promote green agriculture.

1. Introduction

The per capita disposable income ratio of urban and rural residents in China has shown a trend of first increasing and then decreasing, from 2.5 in 1978 to 3.33 in 2009, and then decreasing to 2.51 in 2021 [1]. However, the ratio is still higher than the international average [2]. The urban–rural income gap has become a serious obstacle to the sustainable development of China’s economy. How to effectively improve the income of rural residents and narrow the urban–rural income gap is the focus of the Chinese government [3]. Exploring the potential economic value in farmland carbon sinks provides an effective and green way to address this issue [4]. Carbon sinks represent the capacity of farmland to absorb and store carbon dioxide [5]. Carbon sinks in farmland can not only store carbon dioxide in the atmosphere, but also have economic value in the carbon trading market [6]. Therefore, exploring the economic value and influencing factors of carbon sinks in the farmland ecosystem is helpful to improve the carbon sinks, and then can provide useful policy guidance for enhancing farmers’ income and narrowing the urban–rural income gap.
Currently, relevant research can be summarized into three main aspects: carbon sinks in farmland, the economic value of carbon sinks and the analysis of influencing factors. In terms of carbon sinks in farmland, scholars have mainly used the empirical coefficient models [7,8], mathematical models [9,10] and remote sensing inversion methods [11,12] to quantify the biomass of carbon sinks. Among these, the results of the mathematical model and remote sensing inversion are more accurate, but it is difficult to obtain high-precision and long-term series data. The empirical coefficient model has been widely used due to its being simple and easy, especially for an area with sufficient statistical data [13]. In terms of the economic value of carbon sinks, scholars have mainly calculated the market value of farmland carbon sinks [14,15]. In the study of economic value, the market value method is the main method. The market value method uses market transaction data to evaluate the economic value, which has been tested by the market. The evaluation results have strong persuasiveness and are easily accepted and recognized by the trading parties [16]. In terms of influencing factors, current research has mainly analyzed the relationship between carbon sinks in farmland and different factors from two perspectives: quantitative relationship [17,18] and spatial relationship [19,20]. These studies have mainly adopted regression analysis and the spatial statistics method. Regression analysis and spatial statistical methods can intuitively describe the linear relationship between factors, but cannot quantify the complex nonlinear relationship. The current researches have done sufficient works on the carbon sink in the farmland ecosystem, providing a good reference for this study. However, there are still shortcomings. First, the change in carbon sinks in farmland is a complex process, which is influenced by many factors such as policy, market and production factors. Traditional statistical methods cannot describe the complex nonlinear relationship between carbon sinks in farmland and their influencing factors [21]. Second, there have been relatively few studies on the economic value of carbon sinks in farmland. The policy implications of these studies are biased towards ecological protection, while their guidance for farmers’ income and the rural economy is relatively weak. Therefore, the core scientific issue of this study is to explore the economic value of farmland carbon sinks and its influencing factors, in order to enhance the economic value of farmland carbon sinks, and then promote coordinated development between urban and rural areas.
The System Dynamics (SD) model provides a potential solution for analyzing the complex and systematic driving mechanism of farmland carbon sinks. SD is a simulation method to analyze the nonlinear behavior of complex systems over time. The approach utilizes cause-and-effect relationships and feedback systems and combines with qualitative and quantitative studies to analyze complex interaction systems between influencing factors [22]. Compared with traditional qualitative methods, SD is more suitable for exploring dynamic and complex systems [23]. At present, many scholars have used the SD model to analyze the influence mechanism of carbon emissions. Wang et al. [24] explored the internal influencing mechanisms of carbon sources, carbon flows and the carbon sinks system by using the SD model. Yu et al. [25] comprehensively considered the relationship between power generation structure, carbon intensity, technological progress and carbon emission reduction in the power industry. However, there is still little research on the driving mechanism of the economic value of carbon sinks in the farmland ecosystem.
Zhejiang Province provides a typical study area for the study of the economic value of farmland carbon sinks and its factors. Zhejiang is China’s first common prosperity demonstration zone, the core plan goal of which is to narrow the urban–rural income gap and promote coordinated development between urban and rural areas. Previous studies have shown that the farmland ecosystem in Zhejiang has abundant carbon sinks [26,27]. Local governments have also introduced a series of policies to enhance the carbon sinks of regional farmland ecosystems and promote rural economic development. For example, the Finance Department issued the implementation opinions on supporting carbon peak and carbon neutrality work in 2022. China’s carbon sink practices also indicated that marketization of farmland carbon sinks is a green way to improve the development of rural areas. However, there is still little research on the carbon sink value of the farmland ecosystem in Zhejiang.
The objective of this study is to assess the economic value of carbon sinks in farmland and its influencing factors using the SD model in Zhejiang, China. By simulating the changes in farmland carbon sinks under different social and economic development scenarios, we discuss the effect of various factors on carbon sinks in the farmland ecosystem and their economic value. Firstly, we quantified carbon sinks in farmland based on the empirical coefficient model. Then, the economic value of farmland carbon sinks was calculated using the market value method. Finally, we built an SD model and analyzed the factors influencing the value of farmland carbon sinks in multiple scenarios. Our research will enable analysis of the farmland carbon sink and the driving mechanisms behind its value from a systematic perspective. The study will help deepen the understanding of the economic value of farmland carbon sinks and provide a feasible way to improve the income of rural residents and narrow the urban–rural income gap.

2. Materials and Methods

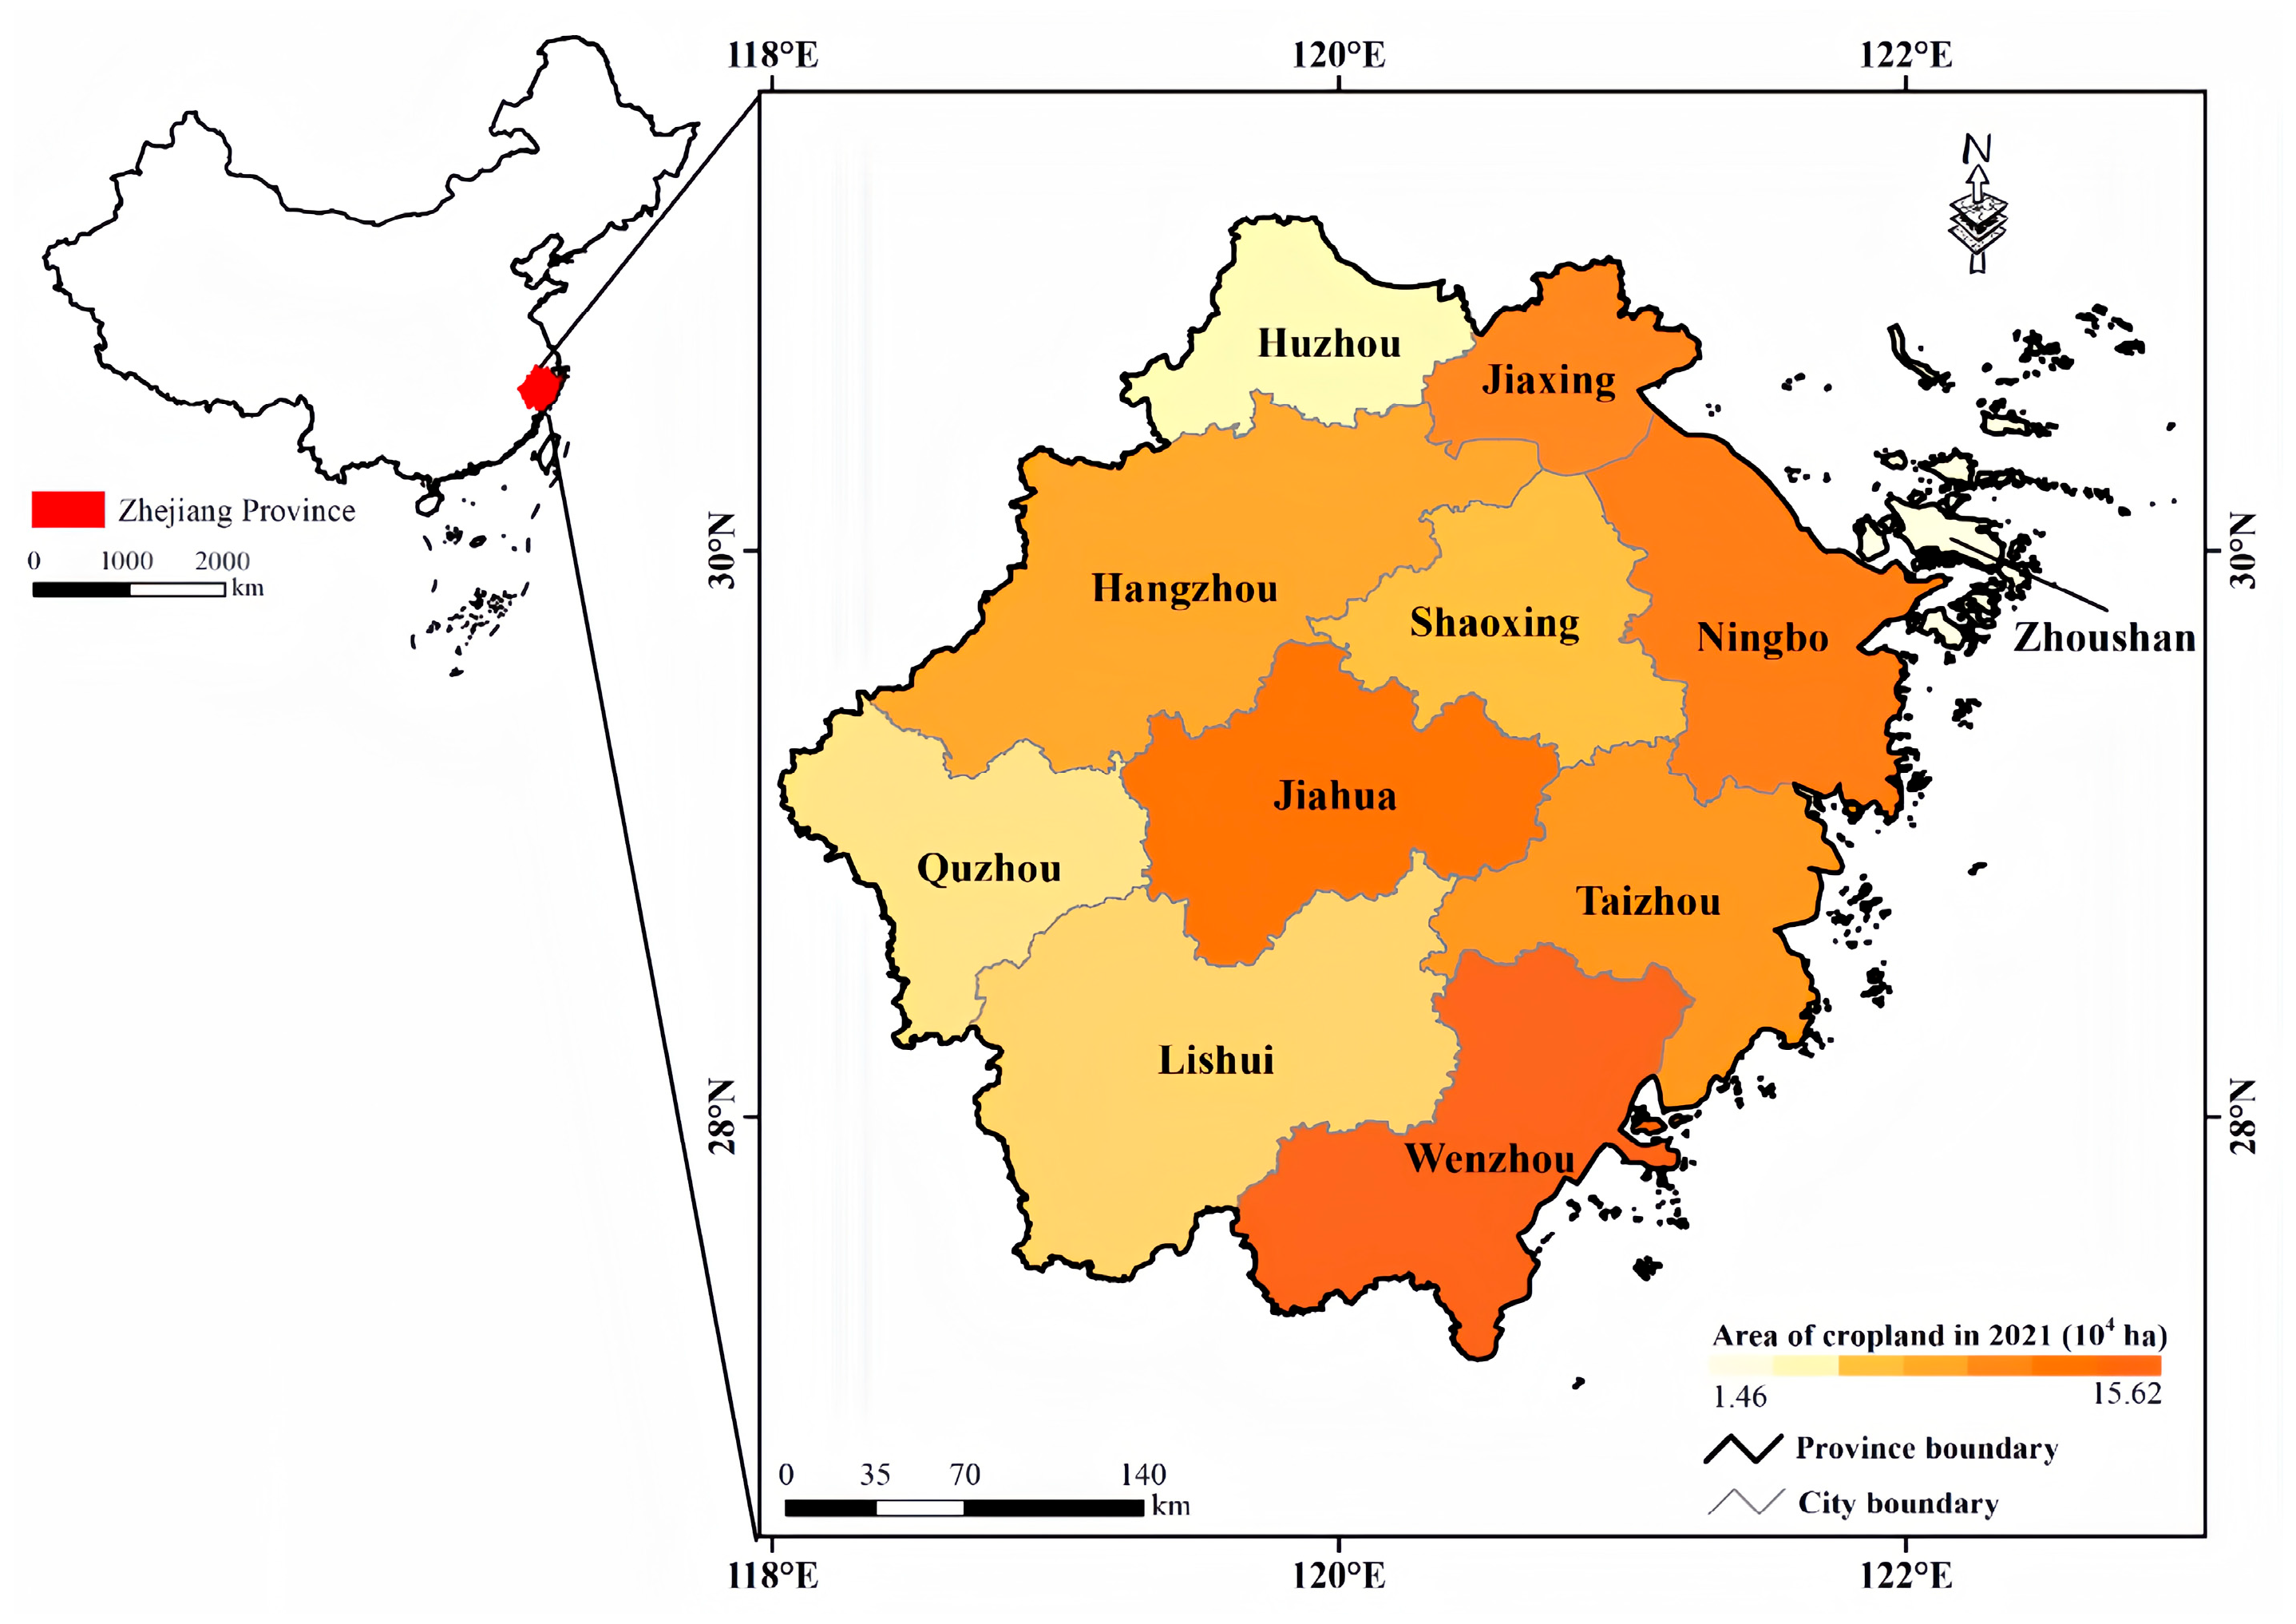
2.1. Subsection Study Area and Data

The study takes Zhejiang province as the study area, which is located on the southeast coast of China (118°01′–123°10′ E and 27°02′–31°11′ N), with a total area of 10.55 million hectares and 11 prefecture-level cities (Figure 1). According to The Third National Land Resource Survey of Zhejiang Province, Zhejiang had 1.29 million hectares of farmland in 2021, accounting for 12.23% of the total area. Within this, there are 1.06 million hectares of paddy fields, accounting for 82.36%, and 0.23 million hectares of dry land, accounting for 17.64%. Although Zhejiang province is one of the provinces with the most comprehensive and rapid development in China, there is still the problem of an excessive income gap between urban and rural areas. According to the China Statistical Yearbook and the Zhejiang Statistical Yearbook in 2022, the per capita income of urban residents in Zhejiang was CNY 68,487 and that of rural residents was CNY 35,247 in 2021, both higher than the national average. However, the income gap between urban and rural residents in Zhejiang is CNY 33,240, higher than the national average, CNY 28,481.
This study used the economic and social statistics data, carbon trading data and empirical data of the farmland carbon sink project (Table 1). Due to the availability of data and the fact that the yields of rice, soybean, vegetables, corn and wheat accounted for about 90% of the total yields in the study area, we selected these crops as the research object. Agricultural inputs, the crop-planting area and yields, agricultural output value, the rural population and the per capita disposable income are all from the Statistical Yearbook of prefecture-level cities in Zhejiang province from 2007 to 2021. Farmland areas are obtained from The Third National Land Resource Survey of Zhejiang Province. The carbon trading data are from the Carbon Emissions Trading Network, including carbon trading total amount and volume from 2014 to 2021. The empirical data of the farmland carbon sink project come from the Institute of Environment and Sustainable Development in Agriculture, Chinese Academy of Agricultural Sciences, including unit cost and unit carbon absorptions of farmland carbon sink management.

2.2. Methods

Referring to Yang et al. [28], we used the difference between the carbon absorption and emissions of farmland to quantify carbon sinks in the farmland ecosystem. The carbon absorption of farmland includes carbon absorption of crops and soil. The carbon emissions of farmland include carbon emissions of agricultural inputs, soil and crops. Then, the market value method was used to quantify the economic value of carbon sinks. Finally, we used the SD model to simulate the impacts of different factors on the economic value of carbon sinks (Figure 2).

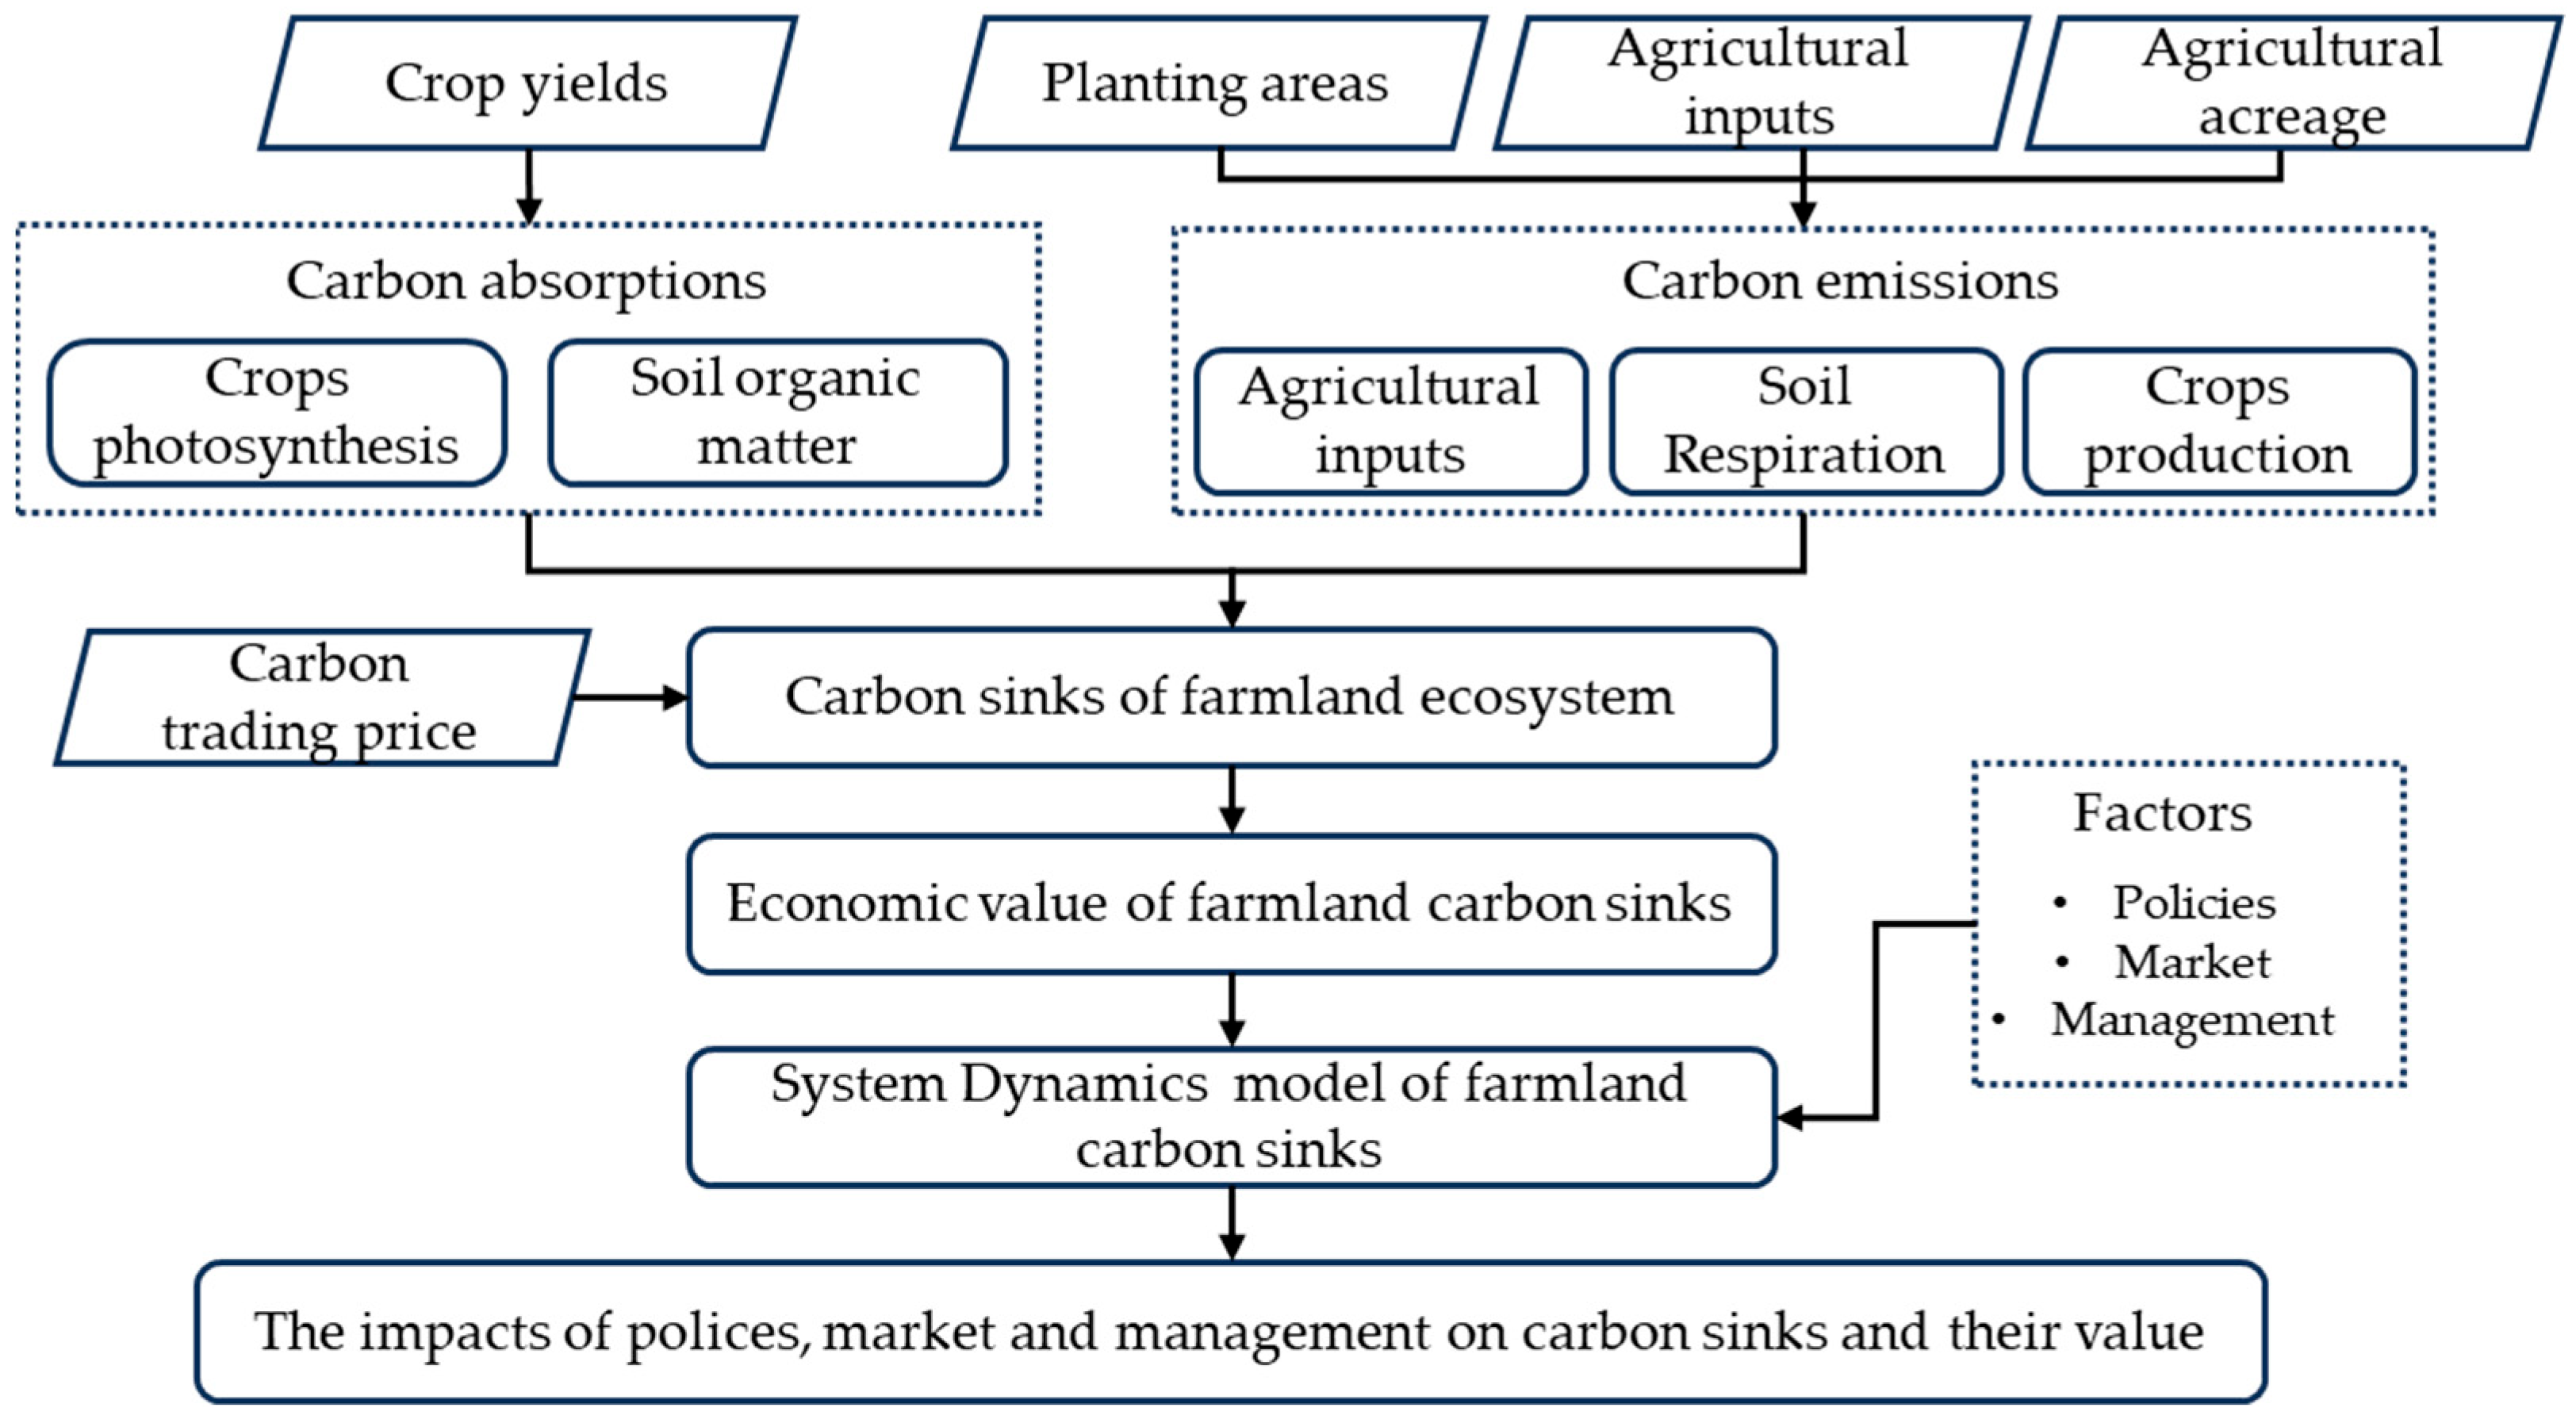
2.2.1. Quantifying Carbon Sinks in Farmland

Referring to Yang et al. [28], we used the difference between carbon absorption and emissions of farmland to quantify carbon sinks. The equation is as follows:
NS ij = CS ij CE ij
where NS ij is the carbon sinks in farmland in year j of region i ; CS ij is the carbon absorption in year j of region i ; CE ij is the carbon emissions in year j of region i .
Referring to the IPCC Guidelines for National Greenhouse Gas Inventories, combined with She et al. [29], we used the carbon absorptions of crops and soil to calculate the carbon absorption of farmland. The formula is as follows:
CS ij = C ij + S ij
where CS ij is the carbon absorption in year j of region i ; C ij is the carbon absorption of crops in year j of region i ; S ij is the carbon absorption of farmland soil in year j of region i .
Referring to Huang and Zhou [30], we used net primary productivity (NPP) to calculate the carbon absorptions of crops. The formula is as follows:
C ij = k n ca k × Y ijk × 1 wc k / HI k
where C ij is the carbon absorptions of crops in year j of region i ; n is crop’s type, including rice, soybean, vegetables, corn and wheat; ca k is the carbon uptake rate of crop k , which is the carbon that needs to be absorbed to synthesize unit organic matter through photosynthesis; Y ijk is the economic yield of the crop k in year j of region i ; wc k is the water content of the crop k ; HI k is the crop economic coefficient of the crop k , indicating the ratio of economic output to biological output. Guo et al. [31] provided us with the relevant specific coefficients in Table 2.
Referring to GB/T1.1-2020 ecosystem assessment guidelines for gross ecosystem product accounting, the formula for calculating the carbon absorption of soil is as follows:
S ij = S BSij + R SCSNij + R Pij × R SCSSij × C Sij
S BSij = C NSij × D Bij × H ij × 0.1
R SCSNij = 1.5539 × F TNij 266.7
F TNij = F Nij + F Cij × 0.3 / S Pij
where S ij is the carbon absorption of farmland soil in year j of region i ; S BSij is the rate of carbon absorption of farmland soil without carbon absorption measures in year j of region i ; R SCSNij is the rate of carbon absorption with nitrogen fertilizer and compound fertilizer in year j of region i ; R Pij is the popularization and implementation rate of crop straw returning to field in year j of region i ; R SCSSij is the rate of carbon absorption with all straw returned to field in year j of region i ; C Sij is the farmland area in year j of region i ; C NSij is changes in organic carbon in farmland without the application of fertilizer and organic fertilizer in year j of region i ; D Bij is the soil bulk density in year j of region i ; H ij is the soil thickness in year j of region i ; F TNij is the total application amount of nitrogen and compound fertilizer per unit area of farmland; F Nij is the application amount of nitrogen fertilizer in year j of region i ; F Cij is the application amount of compound fertilizer; S Pij is the planting area in year j of region i .
Referring to the IPCC Guidelines for National Greenhouse Gas Inventories, combined with Wu et al. [8], we used the carbon emissions of agricultural production, soil and crops to calculate the carbon emissions of farmland. The equation is as follows:
CE ij = G ij + N ij + Z ij
where CE ij is the carbon emissions in year j of region i ; G ij is the carbon emissions of agricultural inputs in year j of region i ; N ij is the carbon emissions of farmland soil in year j of region i ; Z ij is the carbon emissions of crop in year j of region i .
Referring to Qiao et al. [32], we used the carbon emissions generated by agricultural inputs to represent the carbon emissions of agricultural production. The formula is as follows:
G ij = k m GF ijk × f k
where G ij is the carbon emissions of agricultural production in year j of region i ; m is the carbon sources of agricultural production; GF ijk is the application amount or area of carbon source k in year j of region i ; f k is the carbon emission coefficient of carbon source k . For reference to Liu and Gao [5], the relevant specific coefficients are shown in Table 3.
Referring to Xiong et al. [33], we used the N2O spillover effect caused by the destruction of soil surface during the cultivation of crops to characterize the carbon emissions of farmland soil. The formula is as follows:
N ij = k t M ijk × α k × T k
where N ij is the carbon emissions of farmland soil in year j of region i ; t is the carbon sources from soil; M ijk is the planting area of crop k in year j of region i ; α k is the carbon emission coefficient of carbon source k ; T k is the conversion coefficient of carbon source k . For reference to Huang et al. [34], the relevant specific coefficients are shown in Table 4.
Referring to Song et al. [35], we used CH4 produced by paddy planting to indicate the carbon emissions of crops. The formula is as follows:
Z ijk = k r DT ijk × β k × T k
where Z ij is the carbon emissions of crop cultivation in year j of region i ; r is the paddy type, including early rice, late rice and mid-season rice; DT ijk is the planting area of paddy k in year j of region i ; β k is the CH4 emission coefficient of paddy k in Zhejiang Province; T k is the CH4 conversion coefficient of paddy k . Referring to Huang et al. [34], the specific emission coefficient is shown in Table 4.

2.2.2. Quantifying the Economic Value of Farmland Carbon Sinks

Referring to Feng [16], we used the market value method to calculate the economic value of farmland carbon sinks. The equation is as follows:
V ij = NS ij × P j
P j = GA j / GM j
where V ij is the economic value of farmland carbon sinks in year j of region i ; NS ij is carbon sinks in year j of region i ; P j is the unit price of carbon trading in year j ; GA j is the total amount of carbon trading in year j ; GM j is the total volume of carbon trading in year j . Due to the lack of carbon trading data before 2014, the carbon price during this period is the average from 2014 to 2021.

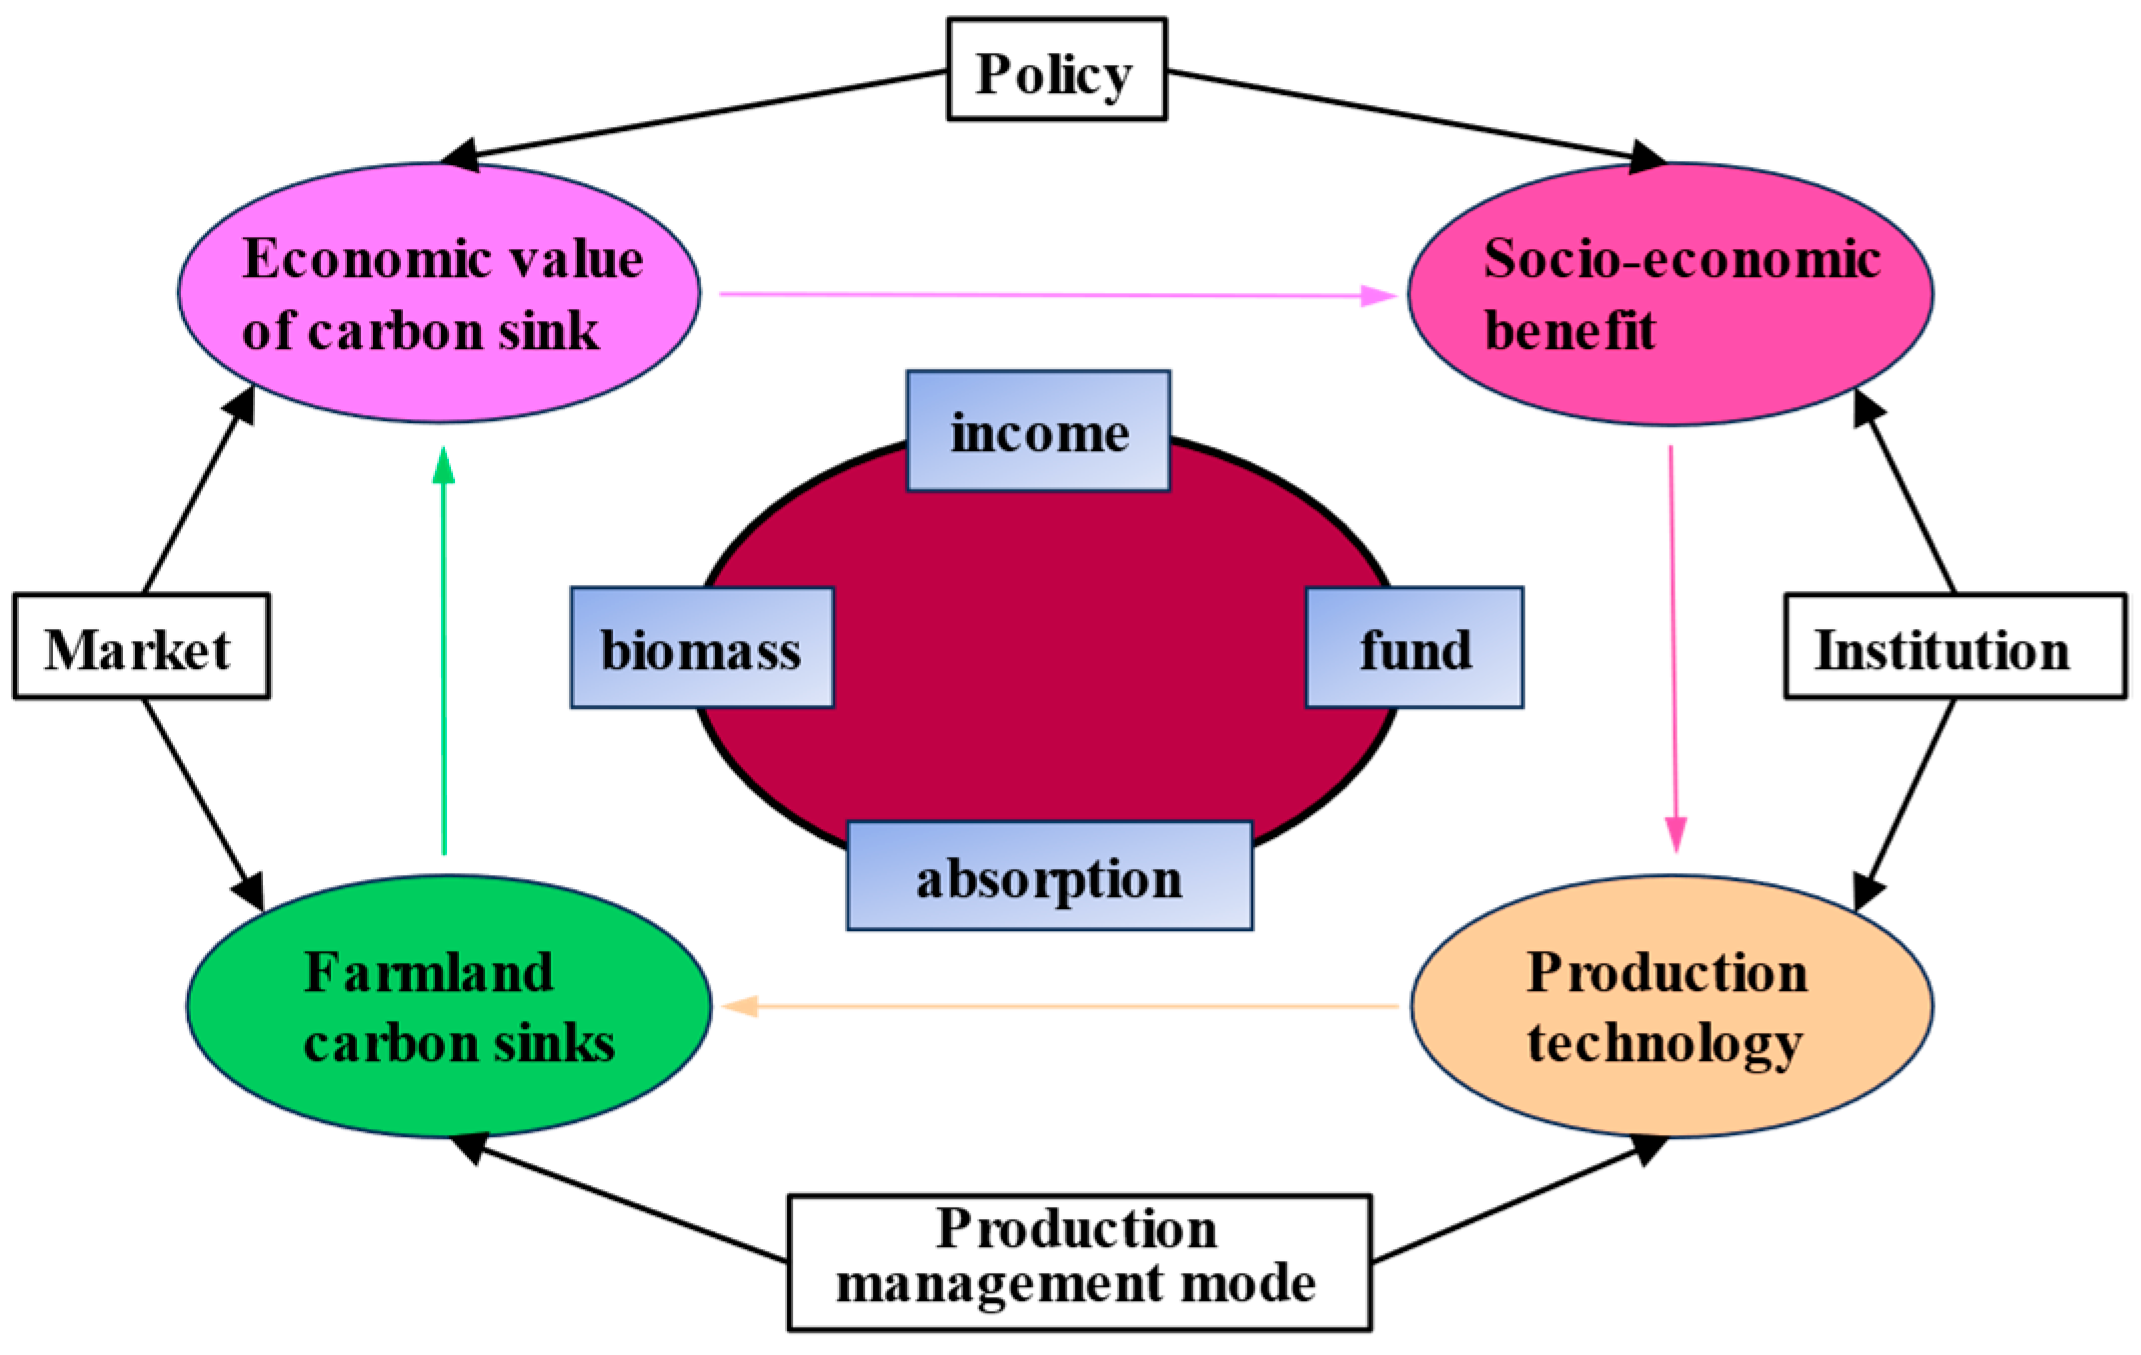
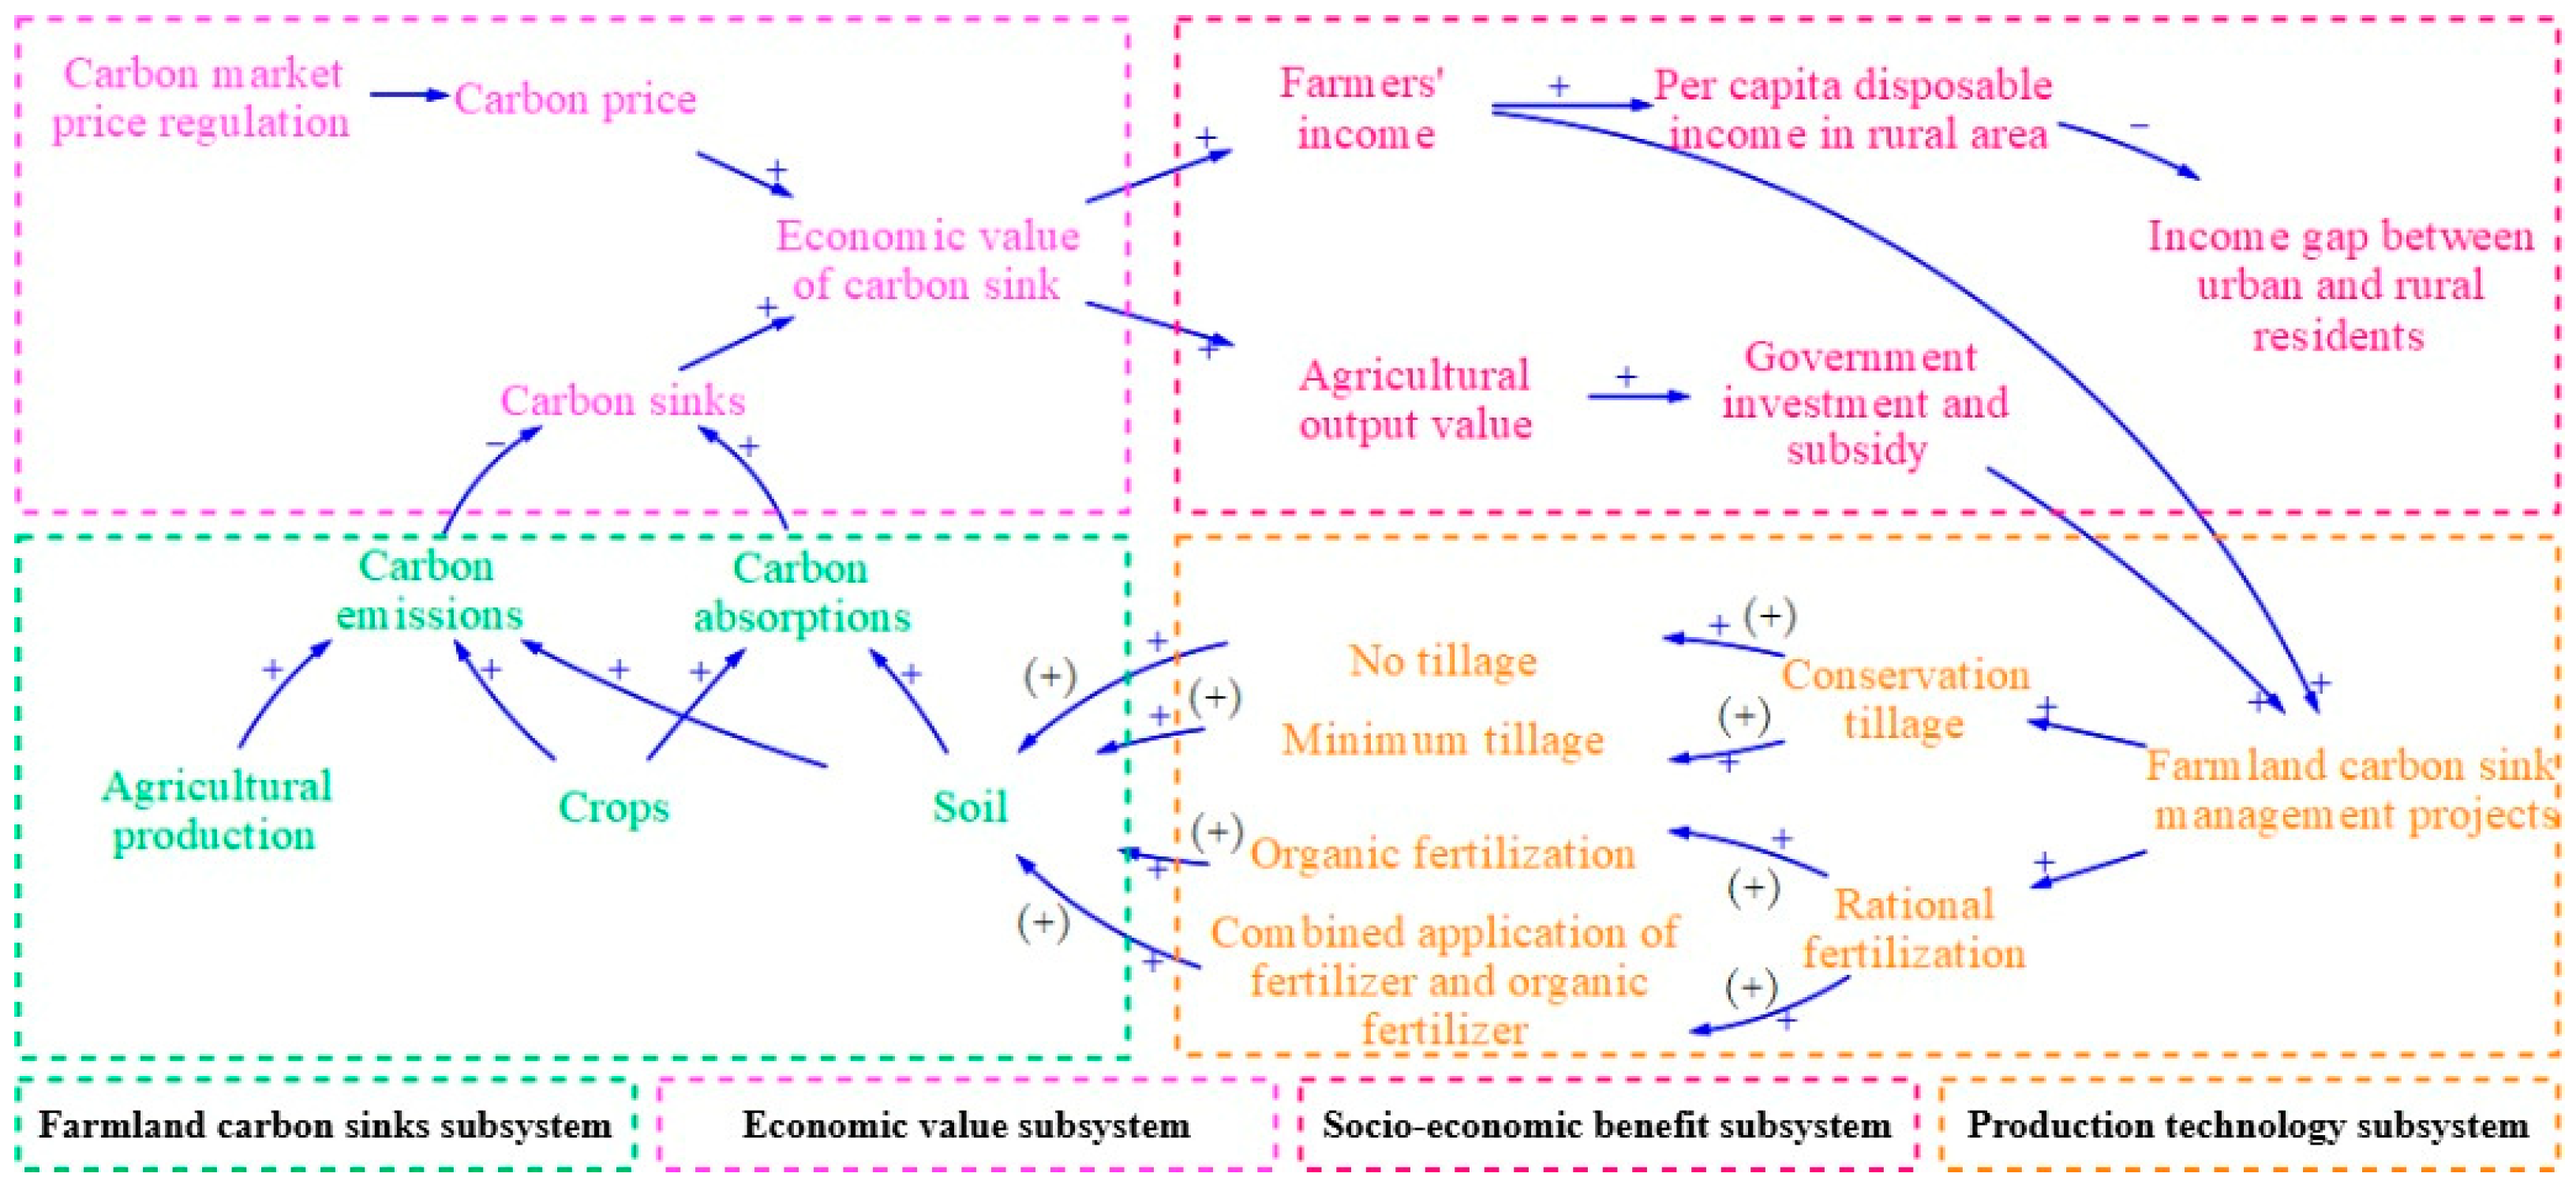
2.2.3. Analyzing the Influencing Factors on the Economic Value of Farmland Carbon Sinks

The farmland ecosystem is complex; it not only includes various factors of production, but is also influenced by comprehensive factors such as farmland protection institution, agricultural policies and markets [36]. Traditional qualitative and quantitative analysis methods often fail to fully reflect the complex changes between various parts of the system, while SD methods have significant advantages in studying complex systems [37]. Therefore, we chose an SD model to simulate the policy effects and economic value of the farmland ecosystem.
Considering the characteristics of the study area and the availability of data, we have established four subsystems: farmland carbon sinks, economic value of carbon sinks, socio-economic benefit and production technology (Figure 3). Among them, the farmland carbon sinks subsystem provides the biomass for the economic value of the carbon sink subsystem, and then realizes the economic value of farmland carbon sinks through market transactions. The economic value of farmland carbon sinks can promote the increase of socio-economic benefit in the form of enhancing farmers’ income. But in this process, there must be a sound system to safeguard the interests of farmers, enterprises and other parties, and maintain the operation of the market. After the improvement of socio-economic benefit, the farmland production is fed back through policy adjustment, especially in the form of financial support to promote the popularization and improvement of production technology. Different farmland production technology represents different production management modes. The carbon absorption amount of different production management modes varies, resulting in different farmland carbon sinks. The SD model will reveal the complex relationships between these subsystems and provide a more comprehensive perspective for understanding the policy effects and economic value of farmland ecosystems.
(1)
Assumption
We assumed that farmland carbon sinks are allowed to be included in the market for trading, and only the production and trading of farmland carbon sinks are considered, without considering other types of carbon sinks such as forest, ocean and grassland. We only considered transactions in the spot market and did not consider the forward market. The domestic carbon trading market meets the trading needs of farmland carbon sinks. The investment amount of each farmland carbon sink project is the same.
(2)
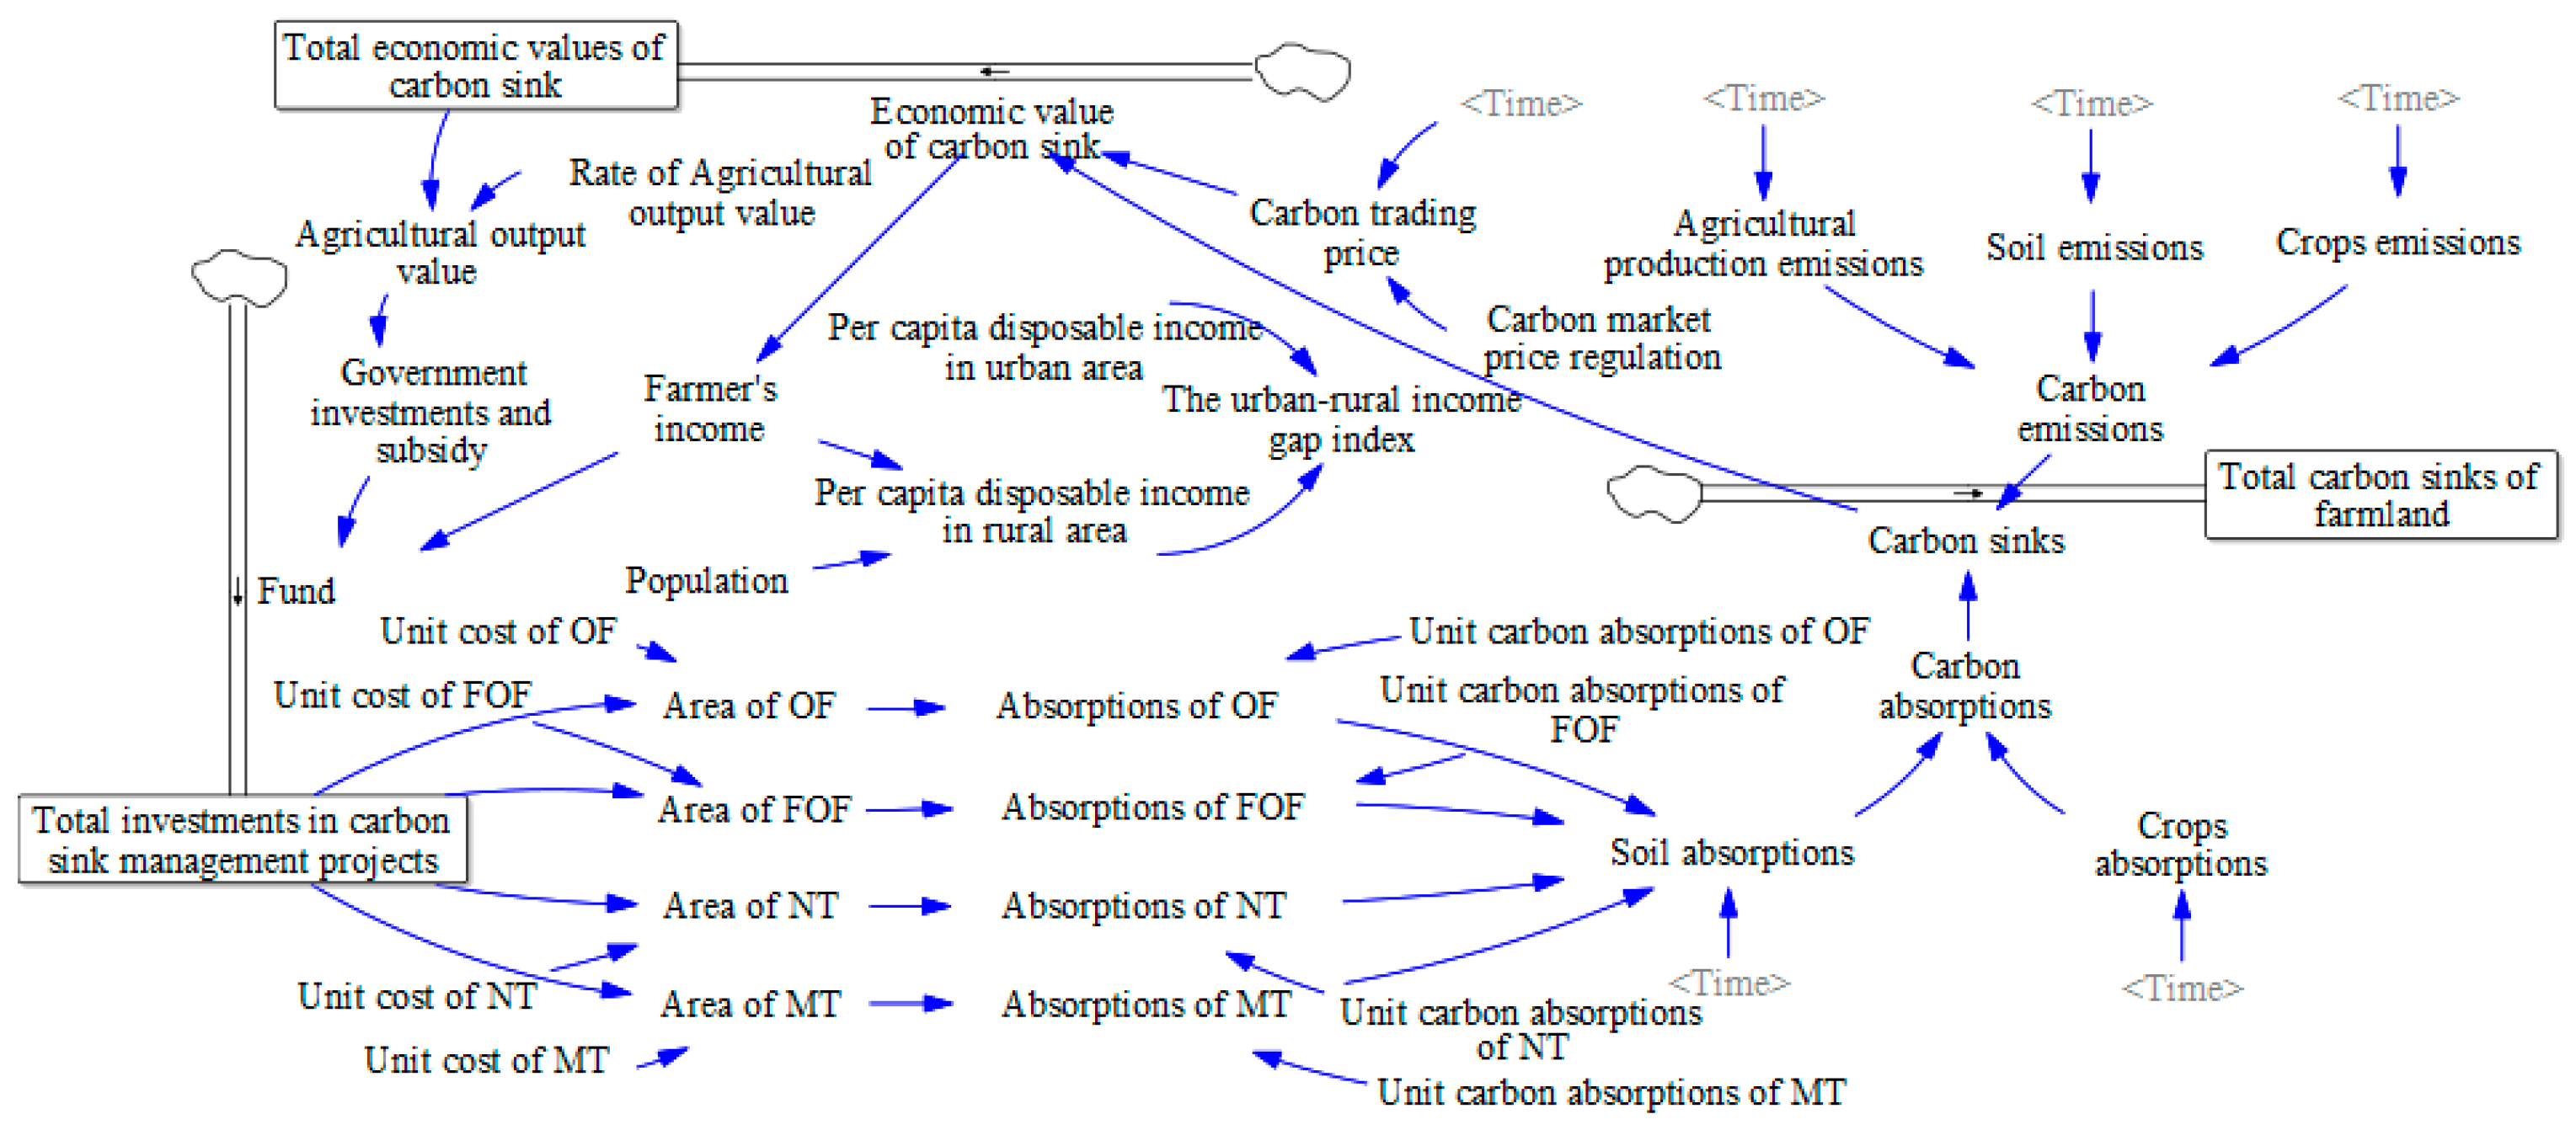
Building system dynamics model
To explore the interactions between key factors, we constructed a causal loop diagram (Figure 4). There are eight feedback loops in the diagram, with arrows representing the interactions between these variables. The specific causal relationship is as follows:
Economic value of carbon sink → (+) farmers’ income → (+) farmland carbon sink management projects → (+) rational fertilization project/conservation tillage project → (+) organic fertilization (OF)/combined application of fertilizer and organic fertilizer (FOF)/no-tillage (NT)/minimum tillage (MT) → (+) soil carbon absorptions → (+) carbon sinks → (+) economic value of carbon sink.
The growth of the economic value of farmland carbon sinks allows farmers to obtain more income. Farmers with increased income will tend to adopt more advanced farmland production technology to seek more benefit, such as operating farmland carbon sink management projects [38]. Typical farmland carbon sink projects include rational fertilization and conservation tillage. Rational fertilization is divided into OF and FOF. Conservation tillage is divided into NT and MT. According to Bai and Zhou [17], different tillage methods will significantly affect the content of soil organic carbon. The rise in soil carbon absorption increases carbon sinks, and ultimately leads to an increase in economic value.
Economic value of carbon sink → (+) agricultural output value → (+) government investments and subsidy → (+) farmland carbon sink management projects → (+) rational fertilization project/conservation tillage project → (+) OF/FOF/NT/MT → (+) soil carbon absorptions → (+) carbon sinks → (+) economic value of carbon sink.
The economic value of farmland carbon sinks belongs to intangible assets, which can increase agricultural output value. When the agricultural output value increases, the government can obtain more financial allocations. With more funds, the government can invest in farmland carbon sink management projects or give certain subsidies to farmers operating management projects [39]. This will reduce the operational risks of management projects, guarantee the income of farmers and attract more farmers and social capital to operate management projects. The rise of management projects will promote the increase of soil carbon absorption, carbon sinks and their economic value.
We constructed the flow graph based on the extended causality diagram (Figure 5). In the model, we selected three product variables, three rate variables and forty auxiliary variables, and used fifty equations to express the quantitative relationship between parameters and variables, so as to simulate the influence of each key variable in the system on the whole system as closely as possible. The following describes the equations of great significance in the model.
The subsystem of farmland carbon sinks mainly calculates farmland carbon absorption and emissions. Its calculation formula is the same as part 3.1. Each arrow represents an equation. Finally, we used the table function to simulate the changes in five auxiliary variables: the carbon emissions of agricultural production, soil and crops and the absorption of soil and crops.
CSA ( t ) = CSA ( t 1 ) + SNT ( t ) + SMT ( t ) + SOF ( t ) + SFOF ( t )
where CSA ( t ) is the soil carbon absorption in year t ; CSA ( t 1 ) is the soil carbon absorption in year t 1 ; SNT ( t ) is the absorption of no-tillage in year t ; SMT ( t ) is the absorption of minimum tillage in year t ; SOF ( t ) is the absorption of organic fertilization in year t ; SFOF ( t ) is the absorption of combination application of fertilizer and organic fertilizer in year t .
The subsystem of economic value mainly calculates the economic value of carbon sinks. Each arrow represents an equation. The calculation formula of farmland carbon sinks and their economic value is the same as Section 2.2.1 and Section 2.2.2. The carbon price is represented by the table function.
The subsystem of farmland production technology mainly calculates the increase in the carbon absorption of soil in different projects. Similarly, each arrow represents an equation. We used a series of equations to calculate the carbon absorption in four projects.
SMT ( t ) = AMT ( t ) × UCSMT ( t )
AMT ( t ) = UCMT ( t ) × TI ( t ) × IPMT ( t )
where AMT ( t ) is the area of minimum tillage in year t ; UCSMT ( t ) is the unit carbon absorption of minimum tillage in year t ; UCMT ( t ) is the unit cost of minimum tillage in year t ; TI ( t ) is the total investment in the farmland carbon sinks management project in year t ; IPMT ( t ) is the investment proportion of minimum tillage in year t .
Similarly, the subsystem of social-economic benefit mainly calculates the effect of the economic value of carbon sinks on the increase in farmers’ income and agricultural output value. Each arrow represents an equation. We used a series of equations to measure the impact of farmland carbon sinks on farmers’ income and the urban–rural income gap index.
URIGI ( t ) = IUA ( t ) / IRA ( t )
where URIGI ( t ) is the urban–rural income gap index in year t ; IUA ( t ) is the per capita disposable income in the urban area in year t ; IRA ( t ) is the per capita disposable income in the rural area in year t .
After collecting the data and building the SD model, we tested the validity of the model. The simulated values of farmland carbon sinks and their economic value from 2019 to 2021 are compared with the statistical data (Table 5). The SD model is considered valid if the error between the simulated results and the actual values of the SD model is less than ±10% [40]. The maximum absolute error of these two variables is 6.52% and 9.71%, respectively. The average error is 2.74% and 8.58%, respectively, both of which are less than 10%. Therefore, the simulation results of the model are basically consistent with the actual situation and can better reflect the change law and correlation between the variables in the farmland ecosystem.
(3)
Setting scenarios
The farmland ecosystem is affected by many factors such as agricultural policy, production management mode, carbon sink market and institution. In order to further explore the complex systematic and quantitative relationship between them, we designed five scenarios from the three perspectives of policy, market and production management mode (Table 6).
Firstly, the No.1 Central Document of the Chinese Government in 2022 pointed out that it is necessary to increase investment in rural areas and continue to regard agriculture and rural areas as a priority of the general public budget. Therefore, we set the scenario of government investment to explore the impact of government investment on the economic value of farmland carbon sinks. Secondly, according to the China Carbon Price Survey 2022, respondents expect the carbon price to rise steadily. Therefore, we set the scenario of market regulation to explore the impact of the rising carbon price on the economic value of farmland carbon sinks. Thirdly, according to the Implementation Plan of Zhejiang Demonstration Zone for High-quality Development and Common Prosperity (2021–2025), Zhejiang should make significant progress in promoting high-quality development and constructing a common prosperity demonstration zone in 2025. One of the landmark targets is that the urban–rural income gap will be reduced to less than 1.9 in 2025. Therefore, based on the conditions in 2021, we set the scenario of human intervention to explore what level of carbon price change is required to reduce the urban–rural income gap to less than 1.9 in 2025. Finally, the factor inputs behavior of farmers and production means cannot be ignored. Therefore, we set the scenarios of farmers’ production factor and farmland production means to reflect the potential and difference of different farmers.

3. Results

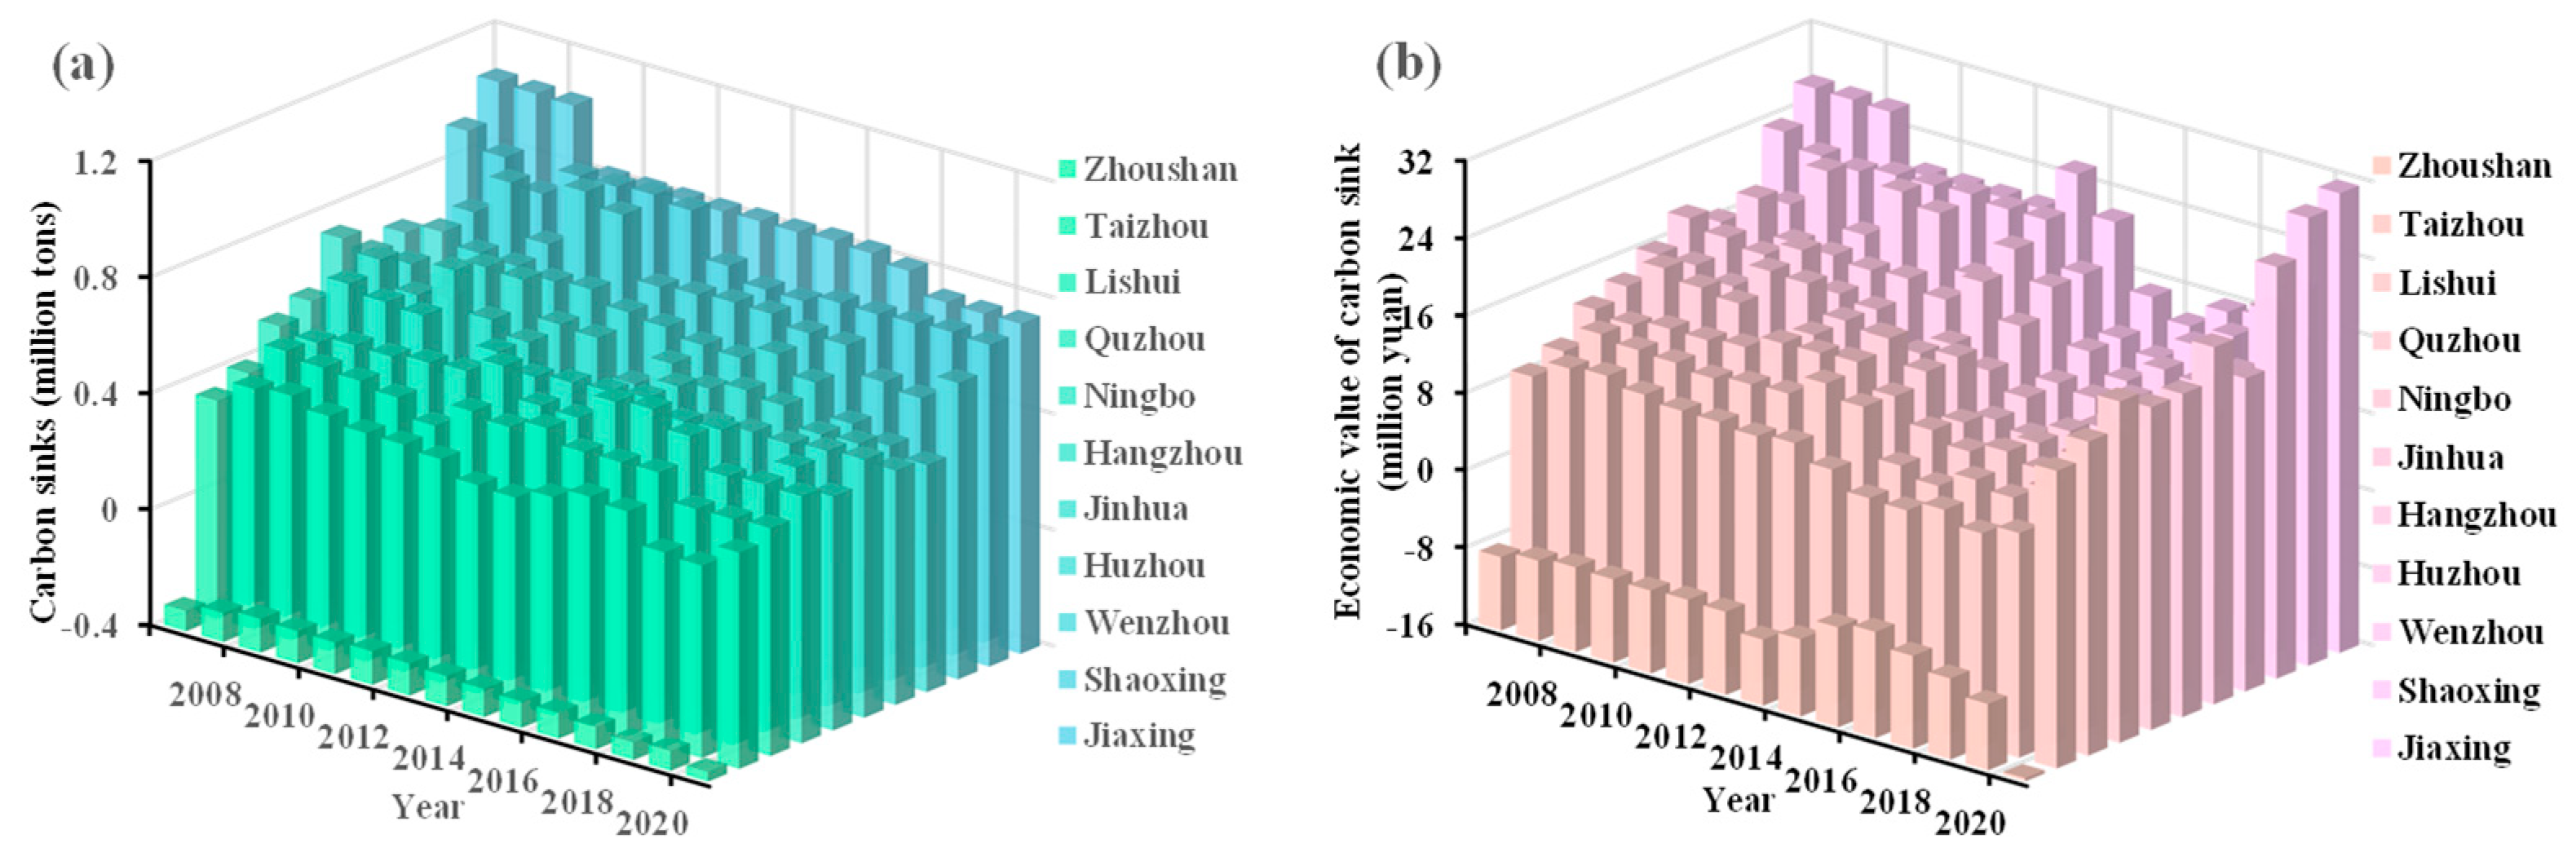
3.1. Carbon Sinks in Farmland in Zhejiang from 2007 to 2021

During 2007–2021, there are large carbon sinks in the farmland ecosystem. The average annual volume of carbon sinks in the farmland ecosystem in Zhejiang Province is 5.84 million tons (Figure 6), which provides a material basis for the development and utilization of the economic value of carbon sinks. Among the 11 prefecture-level cities, 10 cities have a surplus of farmland carbon sinks, while only Zhoushan has a deficit of farmland carbon sinks (Figure 7a). Jiaxing has the largest carbon sinks in farmland, with more than 0.70 million tons every year, reaching 1.05 million tons at the peak. Shaoxing and Wenzhou follow. The total volume of carbon sinks generated by these three cities during 2007–2021 was 35.78 million tons, accounting for 43.68% of the total farmland carbon sinks. Note: The farmers’ production factors scenario shows the change of farmers’ input, and other parameters are consistent with BAU.
The carbon sinks in farmland showed a downward trend in general from 2007 to 2021 (Figure 6). The carbon sinks decreased from 6.25 million tons in 2007 to 4.83 million tons in 2021, with a decrease rate of 22.78% and an average annual decrease rate of 1.52%. Among cities, only Wenzhou has achieved an increase in farmland carbon sinks; the rest show the same trend as the whole. The carbon sinks in farmland in Wenzhou increased from 0.44 million tons in 2007 to 0.61 million tons in 2021, with an increase of 0.17 million tons and an average annual growth rate of 2.70%. Jiaxing has the largest decline, with a decrease of 0.32 million tons, with an average annual decline rate of 2.52%.

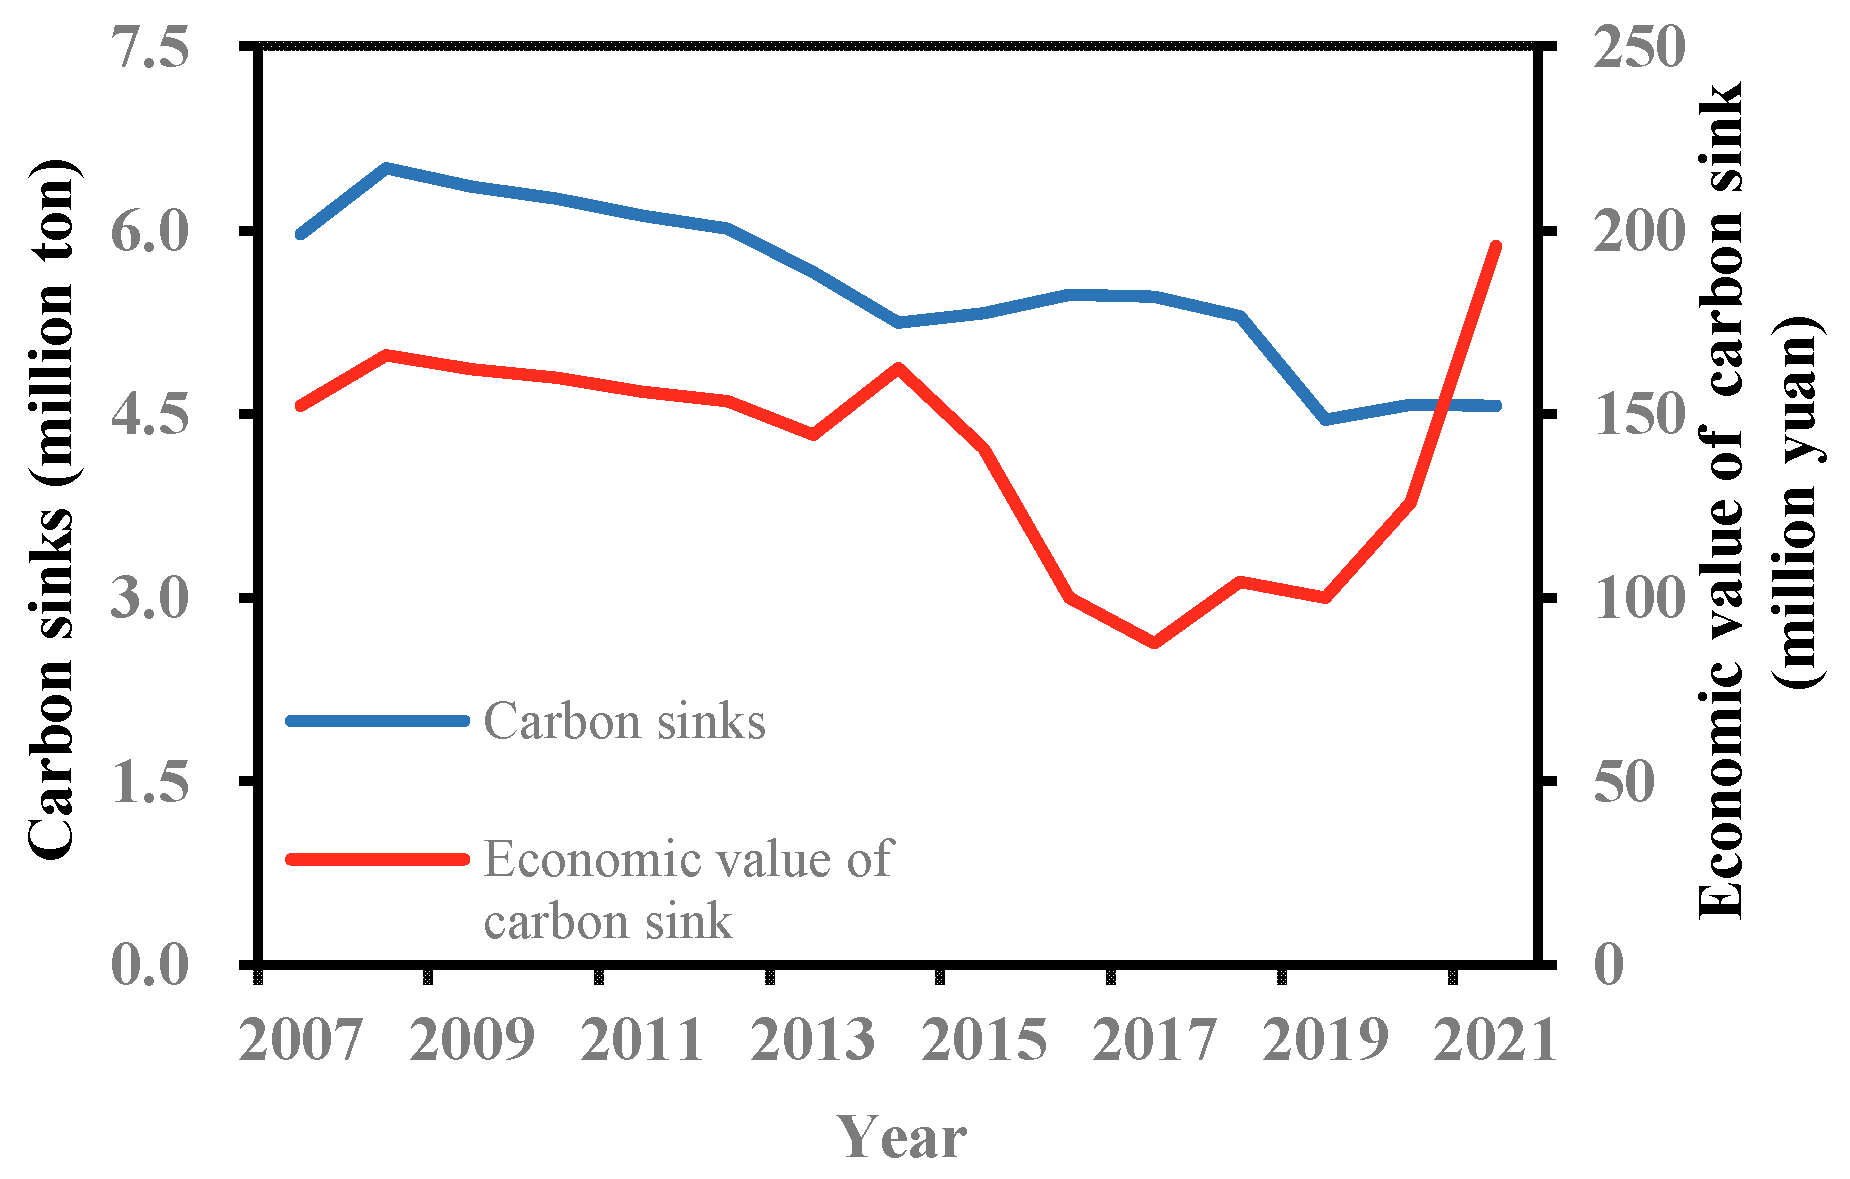
3.2. Economic Value of Farmland Carbon Sinks in Zhejiang from 2007 to 2021

The carbon sinks in the farmland ecosystem in Zhejiang have a certain economic value. From 2007 to 2021, the average annual economic value of carbon sinks in the farmland ecosystem was CNY 149.80 million (Figure 6). Similar to the carbon sinks, there are 10 cities that generate economic value of carbon sinks. Among them, Jiaxing has the highest economic value of carbon sinks, reaching an average annual average of CNY 22.41 million.
The economic value of farmland carbon sinks from 2007 to 2021 generally showed a trend of first decreasing and then increasing (Figure 6). Before 2017, the economic value of carbon sinks showed a downward trend on the whole, from CNY 159.27 million in 2007 to CNY 94.77 million in 2017, a decrease of 42.36%, with an average annual decline rate of 5.36%. There were significant fluctuations from 2013 to 2016. After 2017, the economic value of carbon sinks increased rapidly, from CNY 87.77 million to 196.82 million, with an increase rate of 123.09% and an average annual growth rate of 17.41%. The upward trend is most evident from 2019 to 2021. In 2021, it reached the peak over the past 15 years.
On the scale of cities, the change trend of the economic value of farmland carbon sinks in 10 cities is consistent with the overall trend, while only Zhoushan shows the opposite trend. The economic value of farmland carbon sinks in Zhoushan showed an overall rising trend before 2017, but decreased rapidly after 2017 and reached its lowest value in 2021 (Figure 7b). Compared with 2007, nine cities achieved an increase in the economic value of farmland carbon sinks in 2021, and only Zhoushan and Huzhou decreased. Wenzhou increased the most, by CNY 15.52 million. Zhoushan and Huzhou decreased by CNY 7.29 million and 0.60 million, respectively.

3.3. Change Trends of Carbon Sinks in Farmland and Their Economic Value Under Different Scenarios

3.3.1. Carbon Sinks in Farmland and Their Economic Value Under Business-as-Usual Scenario

Carbon sinks in farmland will show a trend of decline under the BAU scenario, but the decline rate is decreasing (Figure 8). From 2022 to 2035, the carbon sinks in farmland will be reduced from 4.48 million tons to 3.95 million tons, a decrease of 11.79%, with an average annual decline rate of 0.07%. The decline rate of farmland carbon sinks in 2022–2030 is 9.87%, while the decline rate in 2031–2035 is reduced to 1.41%. The economic value of farmland carbon sinks will maintain a steady increase. From 2022 to 2035, the economic value of carbon sinks will increase from CNY 199.05 million to CNY 285.13 million, with an increase of 43.22% and an average annual growth rate of 2.80%.

3.3.2. Carbon Sinks in Farmland and Their Economic Value Under Policies Scenario

Government investment has a positive effect on the carbon sinks in farmland and their economic value. The higher the government investment in farmland carbon sink projects, the larger the carbon sinks and their economic value. The difference between scenarios will become larger and larger as time goes by. The change curve of farmland carbon sinks is similar to the shape of a “U”, which decreases continuously at the beginning, but stops declining and realizes growth at a certain point. The increase in government investment will advance the growth time of farmland carbon sinks. The farmland carbon sinks under the A2 scenario are expected to grow in 2032, while the A3 scenario is 2030 (Figure 9a). Compared with the A1 scenario, the proportion of government investment in the A2 scenario will increase by 15%, the carbon sinks in farmland will increase by 2.46% and the economic value of carbon sinks will increase by 2.84%. Compared with A1, the proportion of government investment in the A3 scenario increased by 30%, the carbon sinks in farmland increased by 4.95% and the economic value of carbon sinks increased by 5.71% (Figure 9).

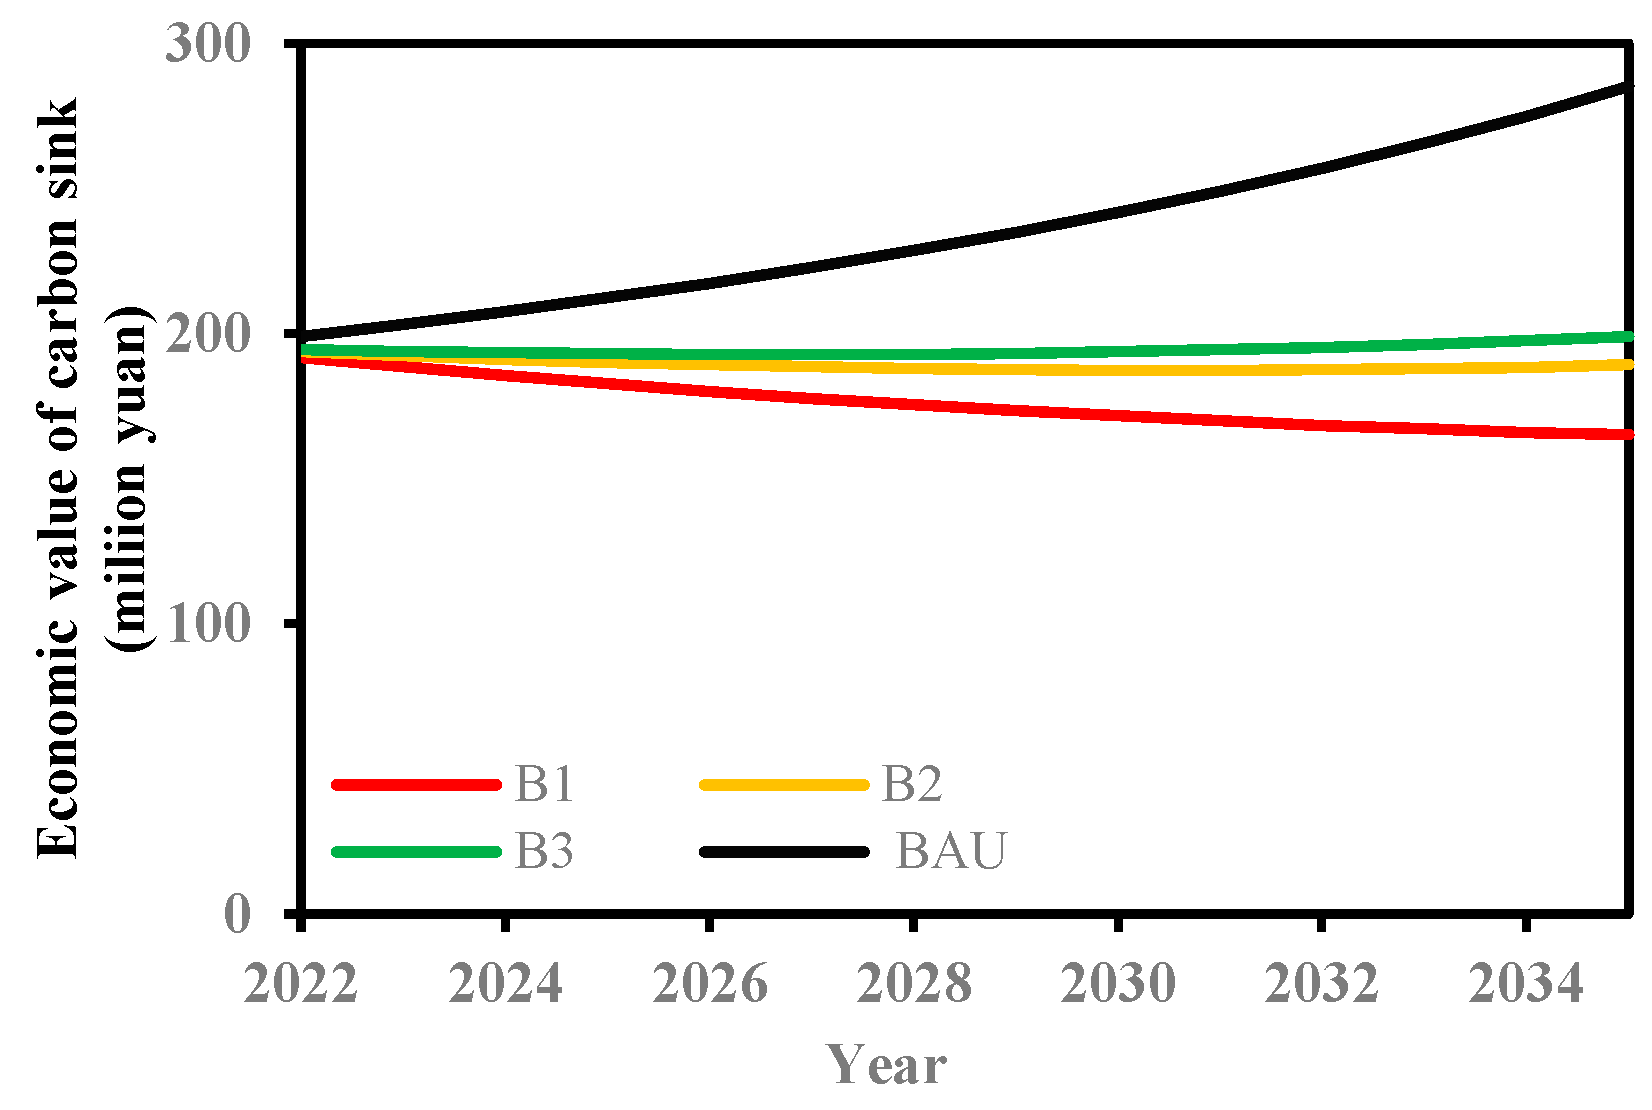
3.3.3. Economic Value of Farmland Carbon Sinks Under Market Scenario

There is a positive correlation between carbon price and the economic value of farmland carbon sinks. The higher the carbon price, the larger the economic value of farmland carbon sinks. The simulation results show that when the carbon price is unchanged, the economic value of carbon sinks shows a downward trend. When the growth rate of the carbon price is 1.4%, the economic value of carbon sinks can remain roughly stable. The greater the growth rate of the carbon price, the greater the economic value of carbon sinks (Figure 10).
Artificially raising the carbon price will help Zhejiang achieve its goal of having the urban–rural income gap within 1.9 by 2025. The simulation results show that under the BAU scenario, the urban–rural income gap index will be 1.93 in 2025, which cannot achieve the core goal of common prosperity in Zhejiang. If the urban–rural income gap index is to be less than 1.9 from the perspective of farmland carbon sinks trading, the growth rate of the carbon price needs to reach at least 32% and remain stable (Figure 11).

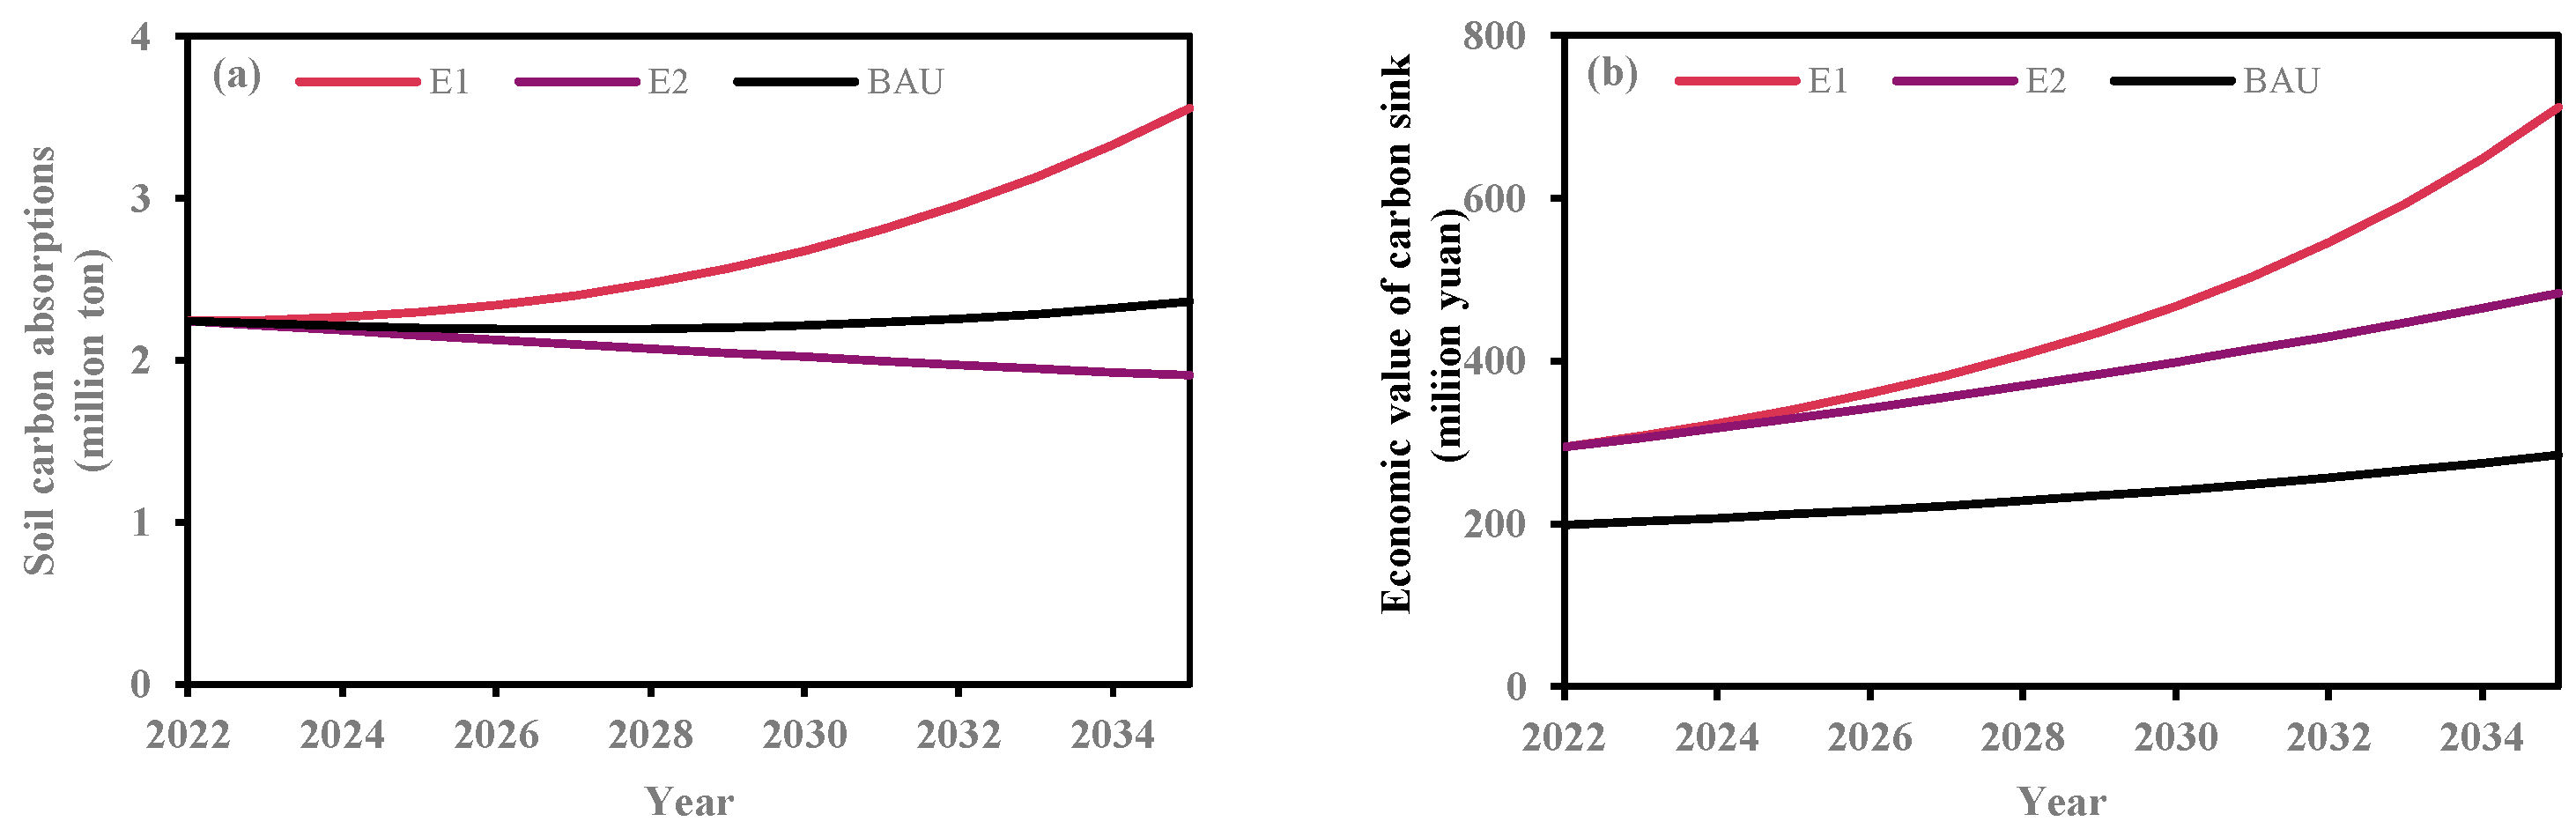
3.3.4. Carbon Sinks in Farmland and Their Economic Value Under Production Management Mode Scenario

The factor inputs of production have a positive effect on the carbon sinks in farmland and their economic value. The greater the inputs of farmers’ production factors, the greater the carbon sinks in farmland and their economic value. The change curve of farmland carbon sinks showed a trend of first decreasing and then increasing. The greater the production inputs, the earlier the carbon sinks changed from decreasing to increasing (Figure 12a). Carbon sinks in farmland under the D2 scenario are expected to increase in 2034, while the D3 scenario is 2032. Compared with the D1 scenario, the production inputs in D2 are more than double, the carbon sinks will increase by 1.84% and the economic value of carbon sinks will increase by 2.04%. Compared with D1, the production inputs in D3 are twice as much, the carbon sinks in farmland increase by 3.58% and the total economic value of farmland carbon sinks increases by 3.94% (Figure 12).
The soil carbon absorption of rational fertilization projects is higher than that of conservation tillage projects, providing higher environmental and economic benefit. The simulation results showed that compared with conservation tillage projects, the soil carbon absorption of rational fertilization projects increased by 8.40 million tons (Figure 13a) and the economic value of carbon sinks increased by CNY 983.38 million during 2022–2035 (Figure 13b). The E1 scenario has the highest farmland soil carbon absorption and economic value. The E2 scenario has lower carbon absorption than BAU, while the economic value of the carbon sink is higher. Compared with BAU, the carbon absorption of the soil of E2 will be 2.44 million tons less (Figure 12a), and the economic value of the carbon sink will increase by CNY 2.04 billion (Figure 13b).

4. Discussion

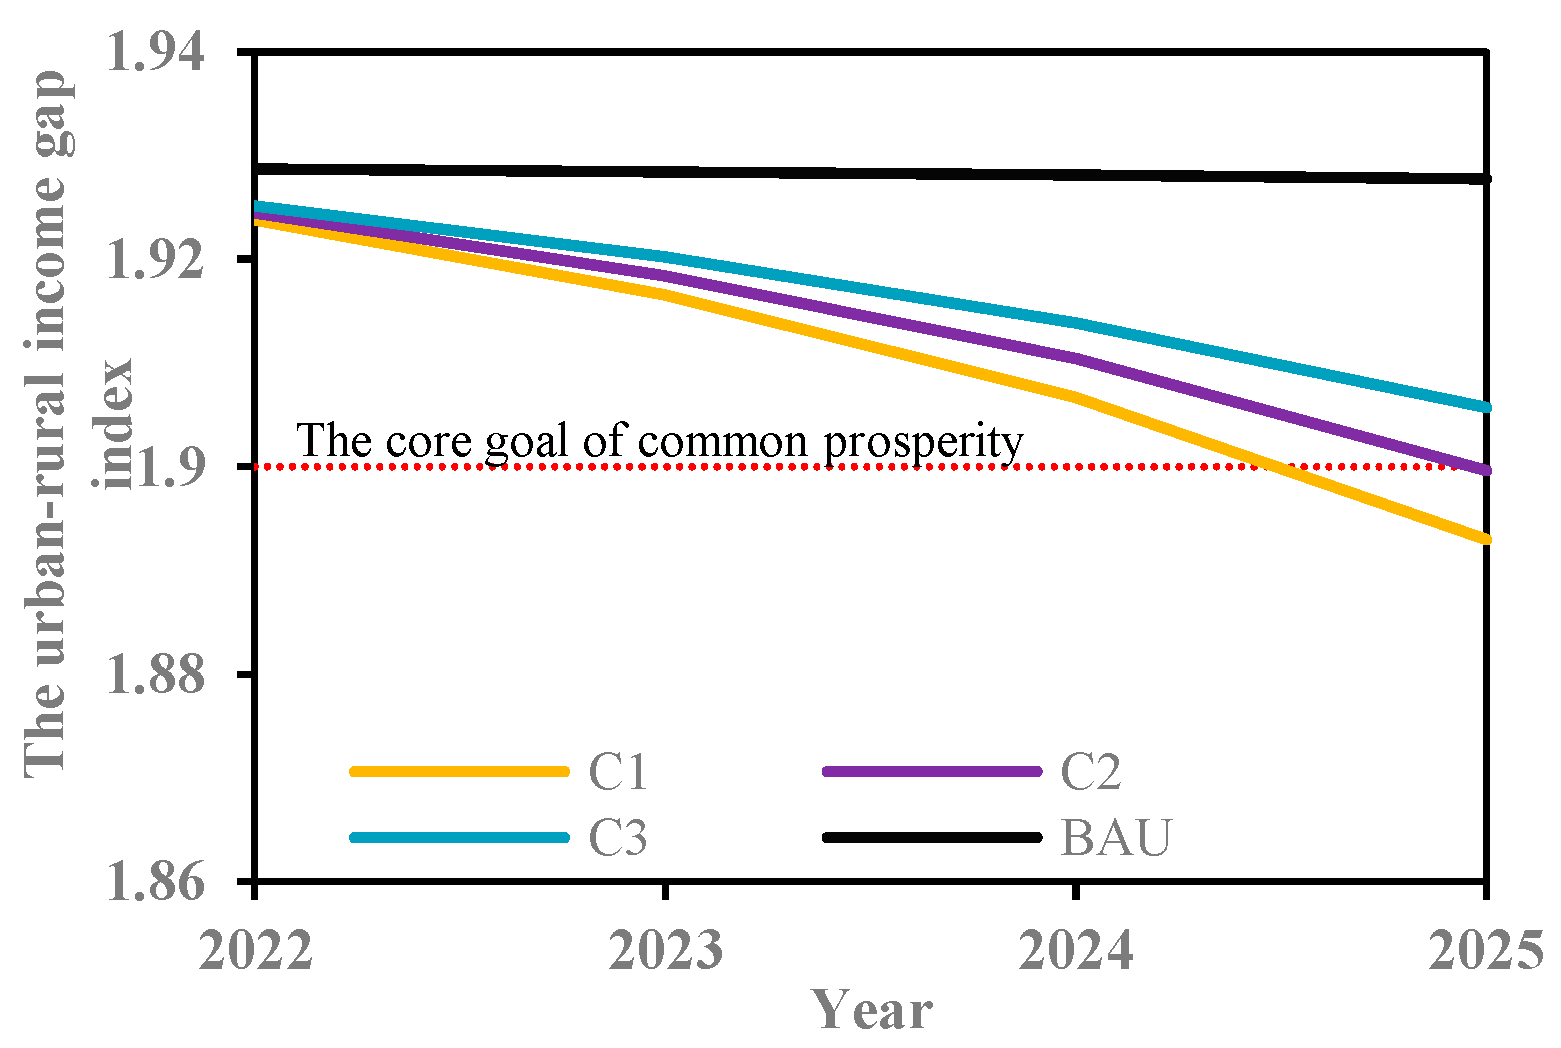
4.1. The Marketization of Carbon Sinks in Farmland System Is a Green Way to Narrow the Urban–Rural Income Gap

Realizing the economic value of farmland carbon sinks will help Zhejiang achieve the planning goal of common prosperity. Our research shows that the farmland ecosystem in Zhejiang has a certain volume of carbon sinks and potential economic value. From 2007 to 2021, the average annual volume of carbon sinks in the farmland ecosystem in Zhejiang was 5.84 million tons and the average annual economic value of carbon sinks was CNY 149.80 million, which could increase farmers’ per capita income by CNY 82.74. This is consistent with the conclusion of [41]. Farmers may benefit by selling carbon sinks in the carbon market but the revenue is likely to be limited. However, when conducting economic evaluation, we should not only consider the market price, but also recognize the broader social and environmental impacts [42]. The marketization of farmland carbon sink is conducive to the steady growth of farmers’ income and the construction of ecological civilization. According to the multi-scenario simulation, based on the base year of 2021, if the growth rate of the carbon price is more than 32%, it will be possible to achieve the core goal of the “14th Five-Year Plan” of Zhejiang Province in 2025: the urban–rural income gap index will reach less than 1.9 (Figure 11). Existing studies have also shown that the realization of forest carbon sinks and their value in Zhejiang can also effectively increase farmers’ income and thus narrow the income gap [43].
The marketization of carbon sinks in the farmland system is a green way to narrow the urban–rural income gap. Our results show that realizing the economic value of farmland carbon sinks can not only improve agricultural output but also contribute to ecological construction, such as carbon-neutral actions and ecological civilization construction. This is also consistent with previous research findings. For example, Priori et al. [44] found that considering the carbon sink value of soil in the economic evaluation of farmland can not only help to more clearly understand the soil characteristics and economic value of each plot, but also stimulate farmers’ interest and enhance the function of soil through proper land management. Chen et al. [14] believed that the value of carbon sinks in the farmland ecosystem can increase farmers’ income, thus promoting farmers’ production enthusiasm, while alleviating the trend of abandonment, which will promote the development of China’s low-carbon agricultural system. In addition, some scholars have found that the value of farmland carbon sinks can also improve the quality of farmland. She et al. [29] revealed that farmland not only creates economic value, but also has ecological functions. Realizing the economic value of carbon sinks in farmland will enable farmers to obtain more benefit, so as to voluntarily protect farmland and enhance the initiative of cultivation.
There are still some bottlenecks in realizing the economic value of carbon sinks in farmland. For example, the market mechanism is not perfect. The carbon sinks in farmland have not yet been included in the trading system, but a few regions have already conducted pilot projects based on local agricultural characteristics. In addition, the carbon compensation mechanism urgently needs to be established. Therefore, realizing the economic value of farmland carbon sinks needs to be coordinated through multiple approaches. The first is to improve the policy and regulatory system of the national carbon market. Ji et al. [45] believed that changes in carbon market policies and regulations will significantly affect carbon prices and the expansion and centralized trading of carbon markets will increase carbon prices. Carbon prices will rise when governments include more industries and companies in the carbon market, or when companies trade centrally. Governments should attract more enterprises to voluntarily join the carbon trading market. The second approach is to expand market supply and demand, and to develop diversified carbon trading. In addition to the power industry, which has been included in the carbon market, seven high-emission industries, including petrochemical, chemical, building materials, steel, nonferrous metals, paper making and aviation, need to be gradually included. Allowing carbon sinks in ecosystems such as farmland to be traded in the market can meet the growing demand for carbon sinks. Expanding market supply and demand can develop the diversity of carbon trading, thereby reducing market risk. Third, establishing a carbon compensation mechanism that suits China’s actual conditions is important [46]. Jiang et al. [47] believed that carbon offsets are the most widely used flexible mechanism in international carbon emissions trading practices. They suggest that proportional carbon offsets and safety thresholds involving upper and lower prices be adopted as ideal policy solutions to stabilize the carbon market in China. Wang and Wang [48] believed that carbon offsetting is a double-edged sword and suggested that the government seriously formulate a reasonable upper limit for offsetting. Therefore, under the market regulation behavior, if the regional carbon price cannot meet the target (such as greater than 32%), both economic and ecological goals may be achieved through compensation.

4.2. Improving the Production and Management Mode of Farmland Is a Reliable Means to Increase the Carbon Sinks

Improving the production and management mode can enhance the carbon sinks and production efficiency of farmland. Therefore, in cities with a deficit in farmland carbon sinks and their economic value, we suggest that farmers improve the farmland production management mode. Reasonable farmland management measures can not only increase the soil carbon pool and reduce greenhouse gas emissions, but also improve soil quality and output efficiency [17]. Different management strategies of farmland carbon sink projects will produce different environmental and economic benefits. We found that rational fertilization is the most profitable management project (Figure 13). Rational fertilization can maintain soil organic matter balance and increase soil organic carbon content. Hayatu et al. [49] recommended combining the application of chemical fertilizers with organic amendments as a strategy for improving soil carbon storage. They suggested substituting 70% of chemical fertilizer with organic manure to increase the carbon sequestration rate in the farmland of southern China. We suggest that soil testing and formulated fertilization techniques (STFFT) should be adopted in the operation of rational fertilization projects to supplement the nutrients required by crops, improve the combined application rate of various fertilizers and enhance the carbon sinks and production efficiency.
Our research shows that both rational fertilization and conservation tillage can increase soil carbon sinks, which is also consistent with Wang et al. [50]. In our study, the economic value of carbon sinks of all conservation tillage projects (E2 scenario) was CNY 2.04 billion higher than that of the average rational fertilization and conservation tillage projects (BAU scenario), but the soil carbon absorption was 2.44 million tons less. The former is due to the lower unit cost and higher economic benefit of conservation tillage, while the latter is related to the way fertilization and conservation tillage affect soil carbon dynamics. Man et al. [51] found that compared with conventional tillage, conservation tillage increased the content of specific organic matter components under different fertilization levels. The effect of fertilization on soil organic matter dynamics may depend on the production mode. Tamburini et al. [52] also believed that conservation tillage had a weaker effect on soil carbon balance than conventional tillage. Nevertheless, conservation tillage has been widely promoted in China, with the advantages of cost saving and soil structure improvement [53]. Li et al. [19] found that the carbon sinks of conservation tillage in China were significant and had the potential to see a constant rise. However, the adoption rate of conservation tillage technology currently is still low, with the highest adoption rate being only slightly over 30% [54]. Therefore, it is necessary to encourage more farmers to adopt conservation tillage technology to increase the carbon sinks in the farmland system.

4.3. Future Perspectives

Based on the marketization of carbon sinks, we systematically analyzed the influence factors of carbon sinks in farmland. We calculated the biomass and value of carbon sinks in the farmland ecosystem, and simulated the effects of different factors on the carbon sinks in farmland and their economic value by using an SD model from three perspectives: policy, market and production management. Our research results will help to promote the realization of the core goal of common prosperity in Zhejiang and provide a useful reference for narrowing the urban–rural income gap in China.
Our study also has some shortcomings. First, due to the availability of data, we only quantified the carbon absorption and emissions of major crops. However, the planting area and output of crops that we selected accounted for more than 90% of the total. Second, we analyzed the impacts of the main internal and external factors (policy, market and production management mode) on the farmland system, but there are still some natural factors that are not taken into account. In addition, Zhejiang has not only set up special funds to encourage farmers to produce, but also supported and promoted new planting modes. However, the carbon price scenario is set up according to the historical changes in the carbon market, so its feasibility needs to be further studied according to current and future carbon market practice.
In the future, we can use remote sensing data to quantify the carbon sinks in farmland more accurately. The original SD model can be extended to build a coupled model to comprehensively analyze the impacts of climate, agricultural trade and more production technology and policies on the economic value of carbon sinks. Combined with the future carbon trading market and policies, we can set up scenario models that are more in line with regional farmland carbon sink production to put forward more constructive measures for the development of carbon sinks in farmland and their economic value.

5. Conclusions

We quantified the carbon sinks in farmland and their economic value, and then analyzed the effects of policy, market and production management on the economic value of carbon sinks. Finally, we discussed the implication of realizing the economic value of carbon sinks and how to enhance the carbon sinks. The results showed that the average annual volume of carbon sinks in farmland in Zhejiang from 2007 to 2021 was 5.84 million tons, which showed a downward trend and tended to be flat. The average annual economic value of carbon sinks was CNY 149.80 million, which showed a trend of decreasing first and then increasing. At the city scale, Jiaxing, Shaoxing and Wenzhou have the largest carbon sinks in farmland, accounting for 43.68% of the whole region. Jiaxing has the highest economic value of farmland carbon sinks, reaching CNY 22.41 million per year.
In different scenarios of government investment and inputs, the change in farmland carbon sinks is similar to a “U” shape, showing a trend of first decreasing and then increasing. The increase in investments will advance the time in which the carbon sinks in farmland will increase. Artificially raising the carbon price can help Zhejiang narrow the urban–rural income gap and promote the realization of the goal of common prosperity. If the carbon price increases by 32%, Zhejiang will achieve the goal of bringing the urban–rural income gap index below 1.9 in 2025. Therefore, local governments can attempt to incorporate carbon sinks into the trading system to facilitate the achievement of planning objectives. Compared with conservation tillage, rational fertilization is a better carbon sink management project for farmland with better environmental and economic benefit. In addition, efficient farmland production management can improve the carbon sink output and production efficiency. We suggest that farmers adopt soil testing and formulated fertilization techniques when operating reasonable fertilization projects.

Author Contributions

Conceptualization, S.S., L.K. and Y.M.; Methodology, S.S., M.S., L.K. and M.K.; Software, M.S.; Writing—original draft, S.S. and M.S.; Writing—review & editing, L.K., M.K. and Y.M.; Visualization, S.S. and M.S.; Project administration, Y.M. All authors have read and agreed to the published version of the manuscript.

Funding

This research was funded by the Soft Science Research Program of Zhejiang grant number 2024C35058.

Institutional Review Board Statement

Not applicable.

Data Availability Statement

Data are contained within the article.

Conflicts of Interest

The authors declare no conflict of interest.

References

  1. National Bureau of Statistics. China Statistical Yearbook 2022; China Statistics Press: Beijing, China, 2022; pp. 171–174. Available online: https://www.stats.gov.cn/sj/ndsj/2022/indexch.htm (accessed on 10 January 2024).
  2. Yang, R.; Zhong, C.; Yang, Z.; Wu, Q. Analysis on the Effect of the Targeted Poverty Alleviation Policy on Narrowing the Urban-Rural Income Gap: An Empirical Test Based on 124 Counties in Yunnan Province. Sustainability 2022, 14, 12560. [Google Scholar] [CrossRef]
  3. Xie, Y.F.; Wu, H.T.; Yao, R.K. The Impact of Climate Change on the Urban-Rural Income Gap in China. Agriculture 2023, 13, 1703. [Google Scholar] [CrossRef]
  4. Ye, X.; Chuai, X.W. Have rural settlement changes harmed ecosystem carbon in China? Appl. Geogr. 2023, 153, 9. [Google Scholar] [CrossRef]
  5. Liu, Y.; Gao, Y. Measurement and impactor analysis of agricultural carbon emission performance in Changjiang economic corridor. Alex. Eng. J. 2022, 61, 873–881. [Google Scholar] [CrossRef]
  6. Malliet, P.; Reynès, F.; Landa, G.; Hamdi-Cherif, M.; Saussay, A. Assessing Short-Term and Long-Term Economic and Environmental Effects of the COVID-19 Crisis in France. Environ. Resour. Econ. 2020, 76, 867. [Google Scholar] [CrossRef]
  7. Li, Y.L.; Yi, F.J.; Yuan, C.J. Influences of large-scale farming on carbon emissions from cropping: Evidence from China. J. Integr. Agric. 2023, 22, 3209–3219. [Google Scholar] [CrossRef]
  8. Wu, H.Y.; Tang, J.; Huang, H.J.; Chen, W.K.; Meng, Y. Net Carbon Sequestration Performance of Cropland Use in China’s Principal Grain-Producing Area: An Evaluation and Spatiotemporal Divergence. Land 2021, 10, 714. [Google Scholar] [CrossRef]
  9. Gao, Y.G.; Wang, M.; Jiang, L.Q.; Zhao, F.; Gao, F.; Zhao, H.Y. Dynamics of carbon budget and meteorological factors of a typical maize ecosystem in Songnen Plain, China. Span. J. Agric. Res. 2023, 21, 4. [Google Scholar] [CrossRef]
  10. Ke, S.A.; Wu, Y.Q.; Cui, H.Y.; Lu, X.H. The mechanisms and spatial-temporal effects of farmland spatial transition on agricultural carbon emission: Based on 2018 counties in China. Environ. Sci. Pollut. Res. 2023, 30, 107716–107732. [Google Scholar] [CrossRef]
  11. Hua, L.; Ran, R.; Xie, M.J.; Li, T.R. The capacity of land carbon sinks in poverty-stricken areas in China continues to increase in the process of eradicating extreme poverty: Evidence from a study of poverty-stricken counties on the Qinghai-Tibet Plateau. Environ. Dev. Sustain. 2023, 28, 17253–17280. [Google Scholar] [CrossRef]
  12. Pan, Y.; Zhang, X.L.; Liu, H.J.; Wu, D.Q.; Dou, X.; Xu, M.Y.; Jiang, Y. Remote sensing inversion of soil organic matter by using the subregion method at the field scale. Precis. Agric. 2022, 23, 1813–1835. [Google Scholar] [CrossRef]
  13. Holmberg, M.; Junttila, V.; Schulz, T.; Gronroos, J.; Paunu, V.-V.; Savolahti, M.; Minunno, F.; Ojanen, P.; Akujarvi, A.; Karvosenoja, N.; et al. Role of land cover in Finland’s greenhouse gas emissions. Ambio 2023, 52, 1697–1715. [Google Scholar] [CrossRef] [PubMed]
  14. Chen, Y.; Chen, X.W.; Zheng, P.; Tan, K.M.; Liu, S.Q.; Chen, S.X.; Yang, Z.X.; Wang, X.L. Value compensation of net carbon sequestration alleviates the trend of abandoned farmland: A quantification of paddy field system in China based on perspectives of grain security and carbon neutrality. Ecol. Indic. 2022, 138, 108815. [Google Scholar] [CrossRef]
  15. Song, S.X.; Kong, M.L.; Su, M.J.; Ma, Y.X. Study on carbon sink of cropland and influencing factors: A multiscale analysis based on geographical weighted regression model. J. Clean. Prod. 2024, 447, 141455. [Google Scholar] [CrossRef]
  16. Feng, B. Forest Carbon Sink Resource Asset Evaluation with Case Study of Fujian Province in China. Math. Probl. Eng. 2022, 2022, 7391473. [Google Scholar] [CrossRef]
  17. Bai, Y.; Zhou, Y. The main factors controlling spatial variability of soil organic carbon in a small karst watershed, Guizhou Province, China. Geoderma 2020, 357, 113938. [Google Scholar] [CrossRef]
  18. Wu, Z.H.; Liu, Y.L.; Han, Y.R.; Zhou, J.A.; Liu, J.M.; Wu, J.A. Mapping farmland soil organic carbon density in plains with combined cropping system extracted from NDVI time-series data. Sci. Total Environ. 2021, 754, 142120. [Google Scholar] [CrossRef]
  19. Li, Y.Y.; Xue, C.X.; Chai, C.Q.; Li, W.; Li, N.; Yao, S.B. Influencing factors and spatiotemporal heterogeneity of net carbon sink of conservation tillage: Evidence from China. Environ. Sci. Pollut. Res. 2023, 30, 110913–110930. [Google Scholar] [CrossRef]
  20. Zhang, H.; Zhencheng, O.; Jiang, P.; Li, M.; Zhao, X. Spatial distribution patterns and influencing factors of soil carbon, phosphorus, and C:P ratio on farmlands in southeastern China. Catena 2022, 216, 106409. [Google Scholar] [CrossRef]
  21. Zhang, W.; Zhang, M.; Wu, S.; Liu, F. A complex path model for low-carbon sustainable development of enterprise based on system dynamics. J. Clean. Prod. 2021, 321, 128934. [Google Scholar] [CrossRef]
  22. Jiao, J.L.; Pan, Z.T.; Li, J.J. Effect of carbon trading scheme and technological advancement on the decision-making of power battery closed-loop supply chain. Environ. Sci. Pollut. Res. 2023, 30, 14770–14791. [Google Scholar] [CrossRef] [PubMed]
  23. Li, L.H.; Shi, J.; Liu, H.; Zhang, R.Y.; Guo, C.B. Simulation of Carbon Emission Reduction in Power Construction Projects Using System Dynamics: A Chinese Empirical Study. Buildings 2023, 13, 3117. [Google Scholar] [CrossRef]
  24. Wang, W.; Zhao, X.-G.; Lu, W.; Hu, S. The sustainable development of a low-carbon system using a system dynamics model: A case study of China. J. Renew. Sustain. Energy 2023, 15, 015902. [Google Scholar] [CrossRef]
  25. Yu, X.; Tan, Z.; Zhang, Y.; Peng, D.; Xia, H. The Feedback Mechanism of Carbon Emission Reduction in Power Industry of Delayed Systems. Math. Probl. Eng. 2017, 2017, 4163729. [Google Scholar] [CrossRef]
  26. Deng, X.F.; Chen, X.J.; Ma, W.Z.; Ren, Z.Q.; Zhang, M.H.; Grieneisen, M.L.; Long, W.L.; Ni, Z.H.; Zhan, Y.; Lv, X.N. Baseline map of organic carbon stock in farmland topsoil in East China. Agric. Ecosyst. Environ. 2018, 254, 213–223. [Google Scholar] [CrossRef]
  27. Li, J.J.; Li, S.W.; Liu, Q.; Ding, J.L. Agricultural carbon emission efficiency evaluation and influencing factors in Zhejiang province, China. Front. Environ. Sci. 2022, 10, 1005251. [Google Scholar] [CrossRef]
  28. Yang, M.; Hou, Y.R.; Wang, Q.J.Y. Rethinking on regional CO2 allocation in China: A consideration of the carbon sink. Environ. Impact Assess. Rev. 2022, 96, 106822. [Google Scholar] [CrossRef]
  29. She, W.; Wu, Y.; Huang, H.; Chen, Z.D.; Cui, G.X.; Zheng, H.B.; Guan, C.Y.; Chen, F. Integrative analysis of carbon structure and carbon sink function for major crop production in China’s typical agriculture regions. J. Clean. Prod. 2017, 162, 702–708. [Google Scholar] [CrossRef]
  30. Huang, H.Q.; Zhou, J. Study on the Spatial and Temporal Differentiation Pattern of Carbon Emission and Carbon Compensation in China’s Provincial Areas. Sustainability 2022, 14, 7627. [Google Scholar] [CrossRef]
  31. Guo, H.; Xie, S.; Pan, C. The Impact of Planting Industry Structural Changes on Carbon Emissions in the Three Northeast Provinces of China. Int. J. Environ. Res. Public Health 2021, 18, 705. [Google Scholar] [CrossRef]
  32. Qiao, G.T.; Chen, F.; Wang, N.; Zhang, D.D. Inter-annual variation patterns in the carbon footprint of farmland ecosystems in Guangdong Province, China. Sci. Rep. 2022, 12, 10. [Google Scholar] [CrossRef]
  33. Xiong, C.; Yang, D.; Huo, J.; Wang, G. Agricultural Net Carbon Effect and Agricultural Carbon Sink Compensation Mechanism in Hotan Prefecture, China. Pol. J. Environ. Stud. 2017, 26, 365–373. [Google Scholar] [CrossRef] [PubMed]
  34. Huang, X.; Xu, X.; Wang, Q.; Zhang, L.; Gao, X.; Chen, L. Assessment of Agricultural Carbon Emissions and Their Spatiotemporal Changes in China, 1997-2016. Int. J. Environ. Res. Public Health 2019, 16, 3105. [Google Scholar] [CrossRef] [PubMed]
  35. Song, S.X.; Zhao, S.Y.; Zhang, Y.; Ma, Y.X. Carbon Emissions from Agricultural Inputs in China over the Past Three Decades. Agriculture 2023, 13, 919. [Google Scholar] [CrossRef]
  36. Zhao, Y.N.; Wang, M.; Lan, T.H.; Xu, Z.H.; Wu, J.S.; Liu, Q.Y.; Peng, J. Distinguishing the effects of land use policies on ecosystem services and their trade-offs based on multi-scenario simulations. Appl. Geogr. 2023, 151, 102864. [Google Scholar] [CrossRef]
  37. Karami, S.; Karami, E.; Buys, L.; Drogemuller, R. System dynamic simulation: A new method in social impact assessment (SIA). Environ. Impact Assess. Rev. 2017, 62, 25–34. [Google Scholar] [CrossRef]
  38. Chen, Y.L.; Yu, P.H.; Chen, Y.Y.; Chen, Z.Y. Spatiotemporal dynamics of rice-crayfish field in Mid-China and its socioeconomic benefits on rural revitalisation. Appl. Geogr. 2022, 139, 102636. [Google Scholar] [CrossRef]
  39. Li, J.; Li, S. Agricultural Subsidies and Land Rental Prices: New Evidence from Meta-analysis. Agric. Commun. 2024, 2, 100051. [Google Scholar] [CrossRef]
  40. Wang, G.; Feng, Y. Assessment and prediction of net carbon emission from fishery in Liaoning Province based on eco-economic system simulation. J. Clean. Prod. 2023, 419, 138080. [Google Scholar] [CrossRef]
  41. Jiang, Y.; Koo, W.W. The Short-Term Impact of a Domestic Cap-and-Trade Climate Policy on Local Agriculture: A Policy Simulation with Producer Behavior. Environ. Resour. Econ. 2014, 58, 511–537. [Google Scholar] [CrossRef]
  42. Reddy, A.A.; Bhagwat, K.D.; Tiwari, V.L.; Kumar, N.; Dixit, G.P. Policies and incentives for promotion of pulses production and consumption: A Review. J. Food Legumes 2023, 36, 209–228. [Google Scholar] [CrossRef]
  43. Liu, D.H.; Zhang, Z.W.; Liu, Z.H.; Chi, Y. A three-class carbon pool system for normalizing carbon mapping and accounting in coastal areas. Ecol. Indic. 2024, 158, 111537. [Google Scholar] [CrossRef]
  44. Priori, S.; Barbetti, R.; Meini, L.; Morelli, A.; Zampolli, A.; D’Avino, L. Towards Economic Land Evaluation at the Farm Scale Based on Soil Physical-Hydrological Features and Ecosystem Services. Water 2019, 11, 1527. [Google Scholar] [CrossRef]
  45. Ji, C.-J.; Hu, Y.-J.; Tang, B.-J.; Qu, S. Price drivers in the carbon emissions trading scheme: Evidence from Chinese emissions trading scheme pilots. J. Clean. Prod. 2021, 278, 123469. [Google Scholar] [CrossRef]
  46. Deng, Y.; Sarkar, A.; Yu, C.; Lu, Q.; Zhao, M.J.; Das, J.C. Ecological compensation of grain trade within urban, rural areas and provinces in China: A prospect of a carbon transfer mechanism. Environ. Dev. Sustain. 2021, 23, 16688–16712. [Google Scholar] [CrossRef]
  47. Jiang, J.J.; Xie, D.J.; Ye, B.; Shen, B.; Chen, Z.M. Research on China’s cap-and-trade carbon emission trading scheme: Overview and outlook. Appl. Energy 2016, 178, 902–917. [Google Scholar] [CrossRef]
  48. Wang, Z.; Wang, C. How carbon offsetting scheme impacts the duopoly output in production and abatement: Analysis in the context of carbon cap-and-trade. J. Clean. Prod. 2015, 103, 715–723. [Google Scholar] [CrossRef]
  49. Hayatu, N.G.; Liu, Y.R.; Han, T.F.; Daba, N.A.; Zhang, L.; Shen, Z.; Li, J.W.; Muazu, H.; Lamlom, S.F.; Zhang, H.M. Carbon sequestration rate, nitrogen use efficiency and rice yield responses to long-term substitution of chemical fertilizer by organic manure in a rice-rice cropping system. J. Integr. Agric. 2023, 22, 2848–2864. [Google Scholar] [CrossRef]
  50. Wang, J.; Lu, G.A.; Guo, X.S.; Wang, Y.Q.; Ding, S.W.; Wang, D.Z. Conservation tillage and optimized fertilization reduce winter runoff losses of nitrogen and phosphorus from farmland in the Chaohu Lake region, China. Nutr. Cycl. Agroecosyst. 2015, 101, 93–106. [Google Scholar] [CrossRef]
  51. Man, M.; Tosi, M.; Dunfield, K.E.; Hooker, D.C.; Simpson, M.J. Tillage management exerts stronger controls on soil microbial community structure and organic matter molecular composition than N fertilization. Agric. Ecosyst. Environ. 2022, 336, 108028. [Google Scholar] [CrossRef]
  52. Tamburini, G.; De Simone, S.; Sigura, M.; Boscutti, F.; Marini, L. Soil management shapes ecosystem service provision and trade-offs in agricultural landscapes. Proc. R. Soc. B Biol. Sci. 2016, 283, 20161369. [Google Scholar] [CrossRef] [PubMed]
  53. Jia, L.Z.; Zhao, W.W.; Zhai, R.J.; Liu, Y.; Kang, M.M.; Zhang, X. Regional differences in the soil and water conservation efficiency of conservation tillage in China. Catena 2019, 175, 18–26. [Google Scholar] [CrossRef]
  54. Teng, C.G.; Lyu, K.; Zhu, M.S.; Zhang, C.S. Impact of Conservation Tillage Technology Application on Farmers’ Technical Efficiency: Evidence from China. Agriculture 2023, 13, 1147. [Google Scholar] [CrossRef]
Figure 1. Study area.
Agriculture 15 00069 g001
Figure 2. Flow chart.
Agriculture 15 00069 g002
Figure 3. Research framework.
Agriculture 15 00069 g003
Figure 4. Causal loop diagram.
Agriculture 15 00069 g004
Figure 5. Flow diagram. Note: NT is no-tillage. MT is minimum tillage. OF is organic fertilization. FOF is fertilizer and organic fertilizer combined application.
Agriculture 15 00069 g005
Figure 6. Carbon sinks in farmland and their economic value in cities from 2007 to 2021.
Agriculture 15 00069 g006
Figure 7. Carbon sinks in farmland and their economic value in cities from 2007 to 2021. (a) Carbon sinks in farmland. (b) Economic value of farmland carbon sink.
Agriculture 15 00069 g007
Figure 8. Change in carbon sinks and their economic value under business-as-usual scenario.
Agriculture 15 00069 g008
Figure 9. Effects of government investment on carbon sinks and their economic value. (a) Carbon sinks. (b) Economic value of carbon sinks. Note: The A1–3 scenarios represent a change in the proportion of government investment (10, 25, 40%).
Agriculture 15 00069 g009
Figure 10. Effects of market on economic value of farmland carbon sinks. Note: The B1–3 scenarios represent natural fluctuations in carbon prices (0, 1, 1.4%).
Agriculture 15 00069 g010
Figure 11. Effects of human intervention on the urban–rural income gap. Note: The C1–3 scenarios represent an artificial change in carbon prices (30, 32, 35%).
Agriculture 15 00069 g011
Figure 12. Effects of production inputs on carbon sinks in farmland and their economic value. (a) Carbon sinks in farmland. (b) Economic value of farmland carbon sinks. Note: The D1–3 scenarios represent a change in farmers’ input (20, 40, 60%).
Agriculture 15 00069 g012
Figure 13. Effects of production structure on soil carbon absorption and economic value of carbon sink. (a) Soil carbon absorption of farmland. (b) Economic value of carbon sink. Note: The E1–2 scenarios represent a change in production methods.
Agriculture 15 00069 g013
Table 1. Data resources.
CategoryDataSource
Economic and social
statistics data
Agricultural inputs,
crop-planting areas and yields,
agricultural output value,
rural population,
per capita disposable income in rural and urban areas
Statistical Yearbook
(http://tjj.zj.gov.cn/col/col1525563/index.html) accessed on 10 January 2024
Farmland areasThe Third National Land
Resource Survey of Zhejiang Province (https://zrzyt.zj.gov.cn/art/2021/12/3/art_1289924_58988385.html) accessed on 10 January 2024
Carbon trading dataCarbon trading total amountCarbon Emissions Trading
Network (http://www.tanjiaoyi.com) accessed on 10 January 2024
Carbon trading total volume
Carbon trading price
Empirical data of farmland carbon sinks projectUnit cost per hectareInstitute of Environment and Sustainable Development in Agriculture, Chinese
Academy of Agricultural
Sciences (http://www.ieda.org.cn/index.htm) accessed on 1 January 2024
Unit carbon absorptions per hectare
Table 2. The coefficient of crops.
CropCarbon Uptake Rate ( ca k )Water Content
( wc k )
Economic Coefficient ( HI k )
Rice0.4140.120.45
Soybean0.4500.130.34
Vegetables0.4500.900.60
Corn0.4710.130.40
Wheat0.4850.120.40
Table 3. The coefficient of carbon source of agricultural production.
Carbon SourceCoefficient
Fertilizer0.8956 kg·kg−1
Pesticide4.9341 kg·kg−1
Agricultural plastic film5.18 kg·kg−1
Agricultural diesel0.5927 kg·kg−1
Irrigation25 kg·hm−2
Plowing3.126 kg·hm−2
Table 4. The coefficient of different crops.
CropsEmission Coefficient of Greenhouse Gas (kg·hm−2)Carbon Conversion Coefficient (kg·kg−1)
Rice0.240298.00
Soybean0.770298.00
Vegetables4.210298.00
Corn2.532298.00
Wheat1.218298.00
Early rice1.43725.00
Late rice3.45025.00
Mid-season rice5.79625.00
Table 5. Validity test of the model.
YearFarmland Carbon Sinks
(Million Tons)
Economic Value of Carbon Sink
(Million CNY)
SimulationObservedErrorSimulationObservedError
20194.754.456.52%109.5899.929.71%
20204.654.581.70%136.45125.868.51%
20214.564.570.01%210.54195.827.51%
Average error 2.74% 8.58%
Table 6. The scenario settings.
FactorsIndexScenarioScenario Setting
Proportion of Government Investment (%)Proportion of Farmer Input (%)Carbon Price Change (%)Proportion of OF (%)Proportion of FOF (%)Proportion of NT (%)Proportion of MT (%)
Business as UsualBAU15253.825252525
PolicyGovernment investmentA110253.825252525
A225253.825252525
A340253.825252525
MarketMarket regulationB11525025252525
B21525125252525
B315251.425252525
Human interventionC115253025252525
C215253225252525
C315253525252525
Production management modeFarmers’ production factorsD115203.825252525
D215403.825252525
D315603.825252525
Farmland production meansE115253.8505000
E215253.8005050
Note: 1. Based on linear change in data from 2007 to 2021, we set the business-as-usual scenario (BAU). The A1–3 scenarios represent a change in the proportion of government investment. The B1–3 scenarios represent natural fluctuations in carbon prices. The C1–3 scenarios represent an artificial change in carbon prices. The D1–3 scenarios represent a change in farmers’ input. The E1–2 scenarios represent a change in production methods. 2. NT is no-tillage. MT is minimum tillage. OF is organic fertilization. FOF is fertilizer and organic fertilizer combined application.
Disclaimer/Publisher’s Note: The statements, opinions and data contained in all publications are solely those of the individual author(s) and contributor(s) and not of MDPI and/or the editor(s). MDPI and/or the editor(s) disclaim responsibility for any injury to people or property resulting from any ideas, methods, instructions or products referred to in the content.

