
Carbon Footprint of Milk Processing—Case Study of Polish Dairy

 , and
, and
Abstract
1. Introduction
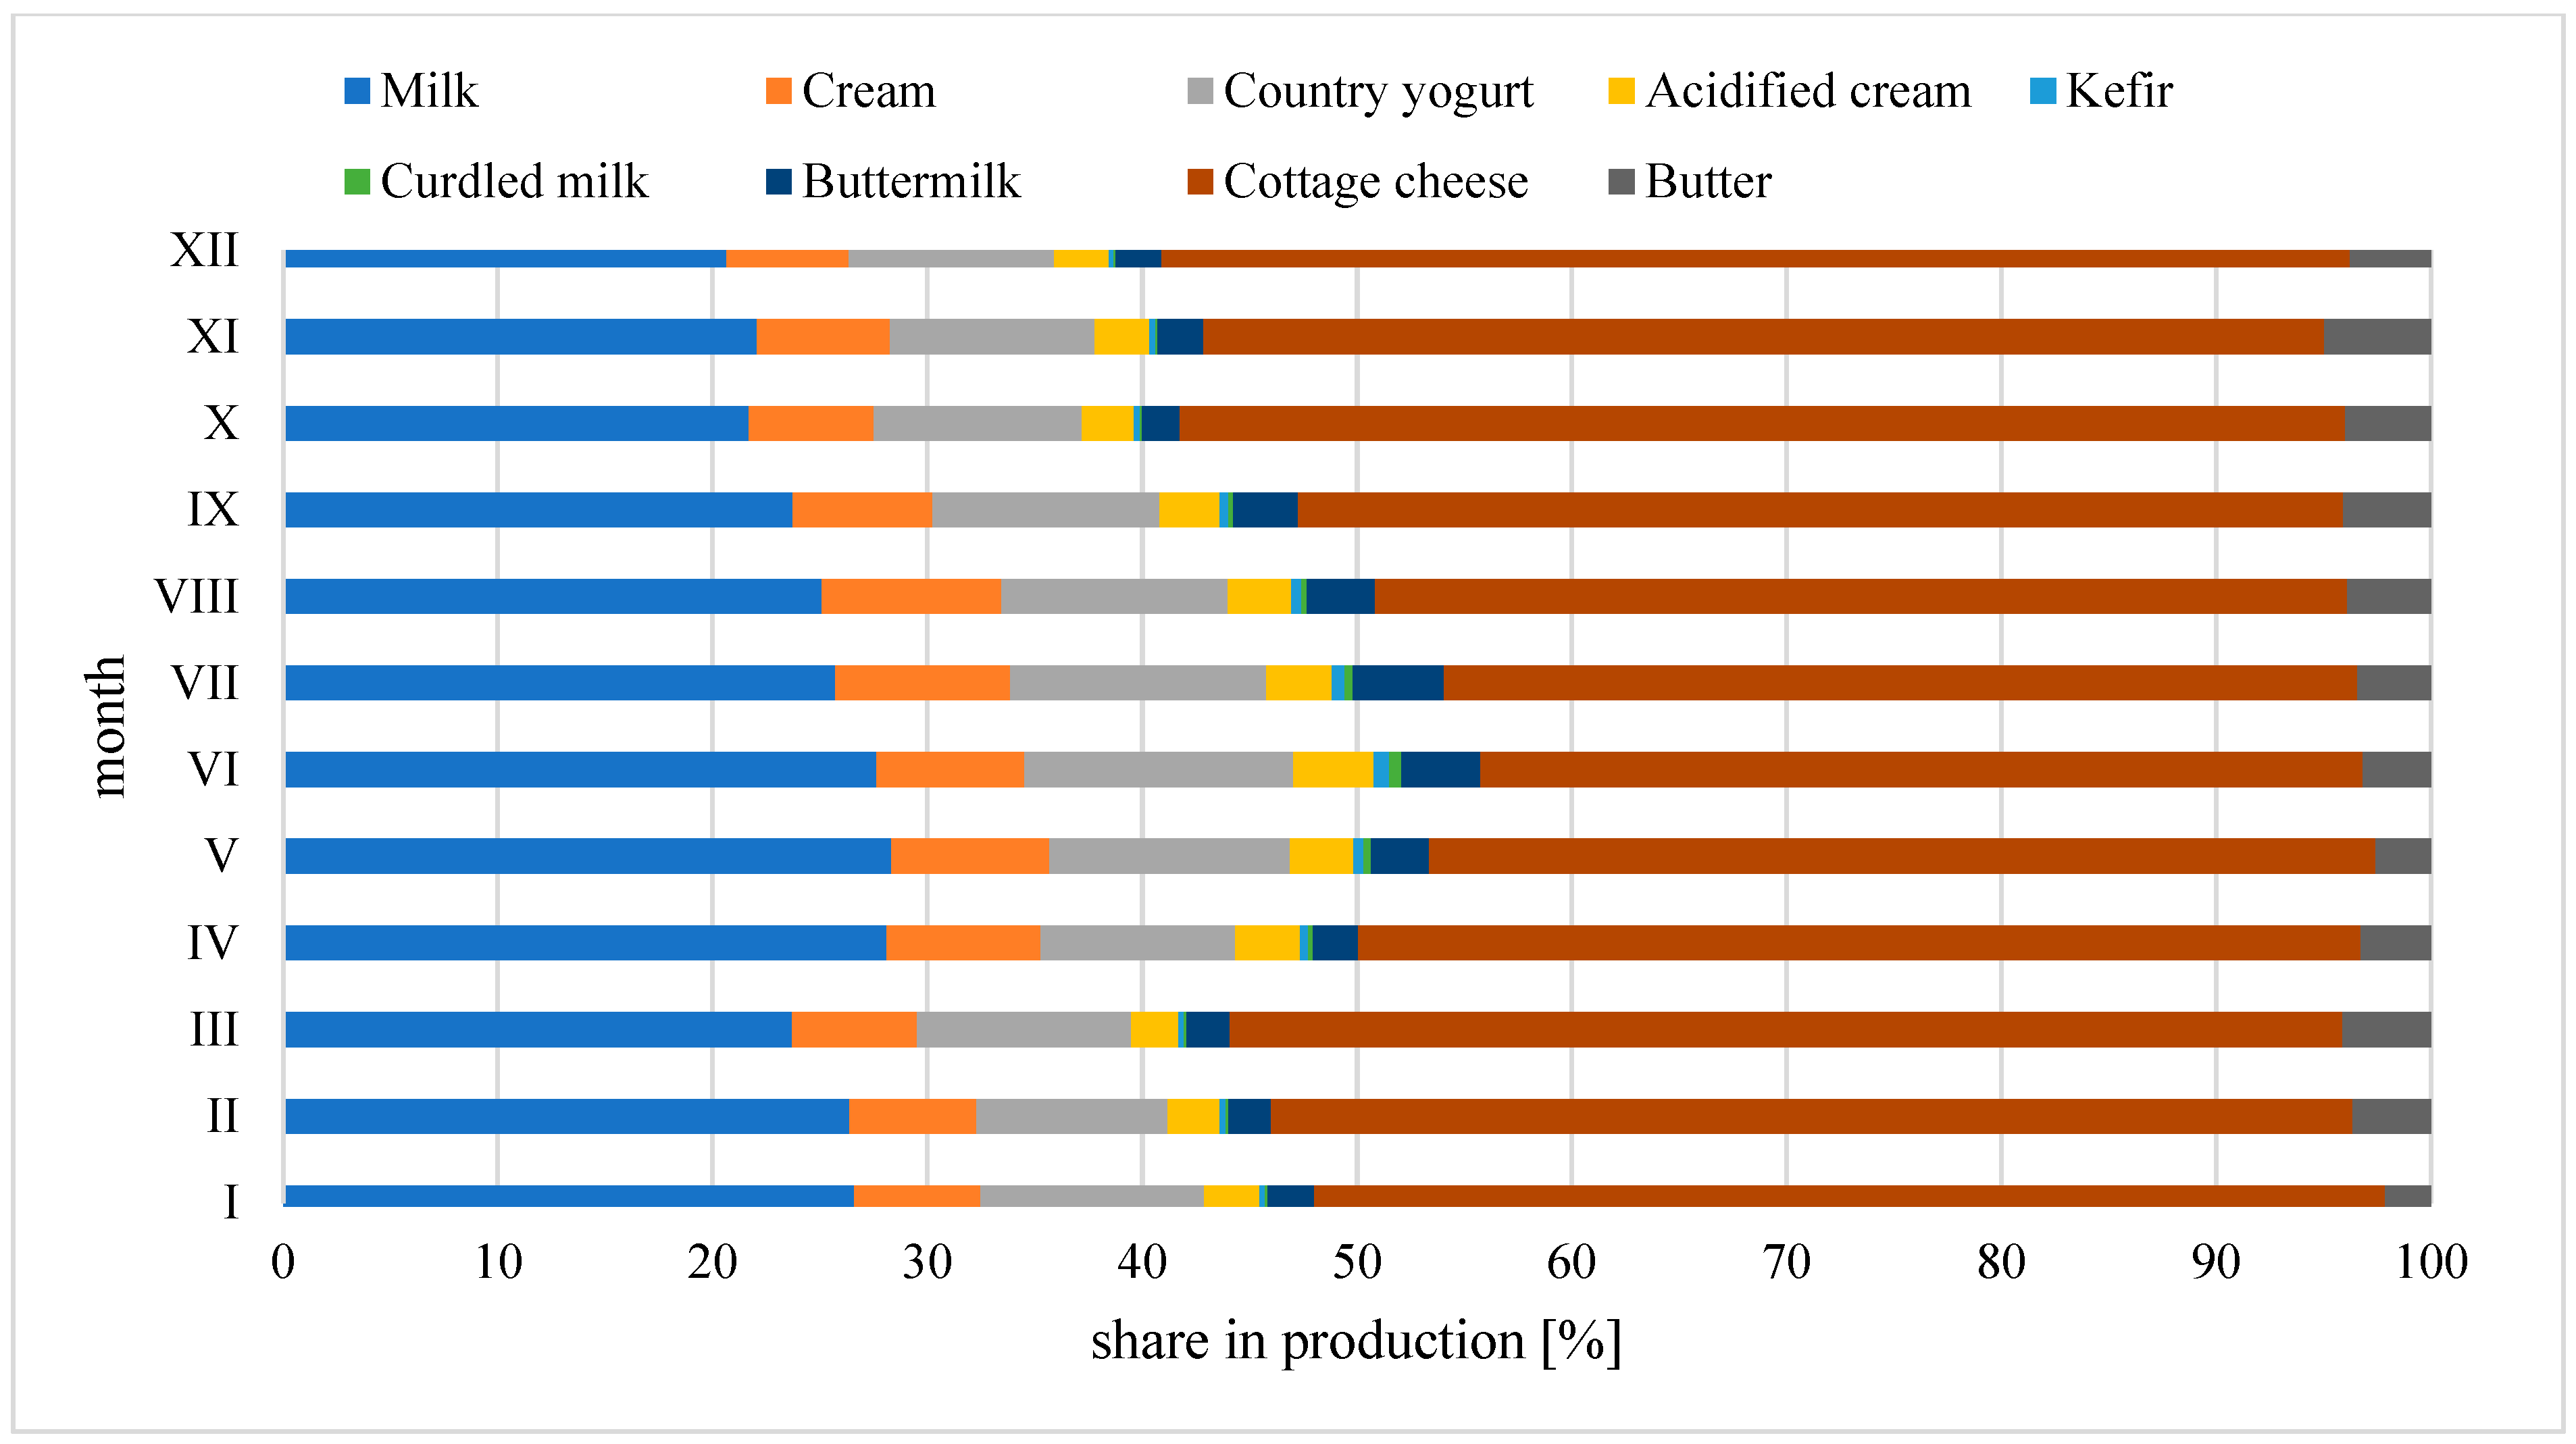
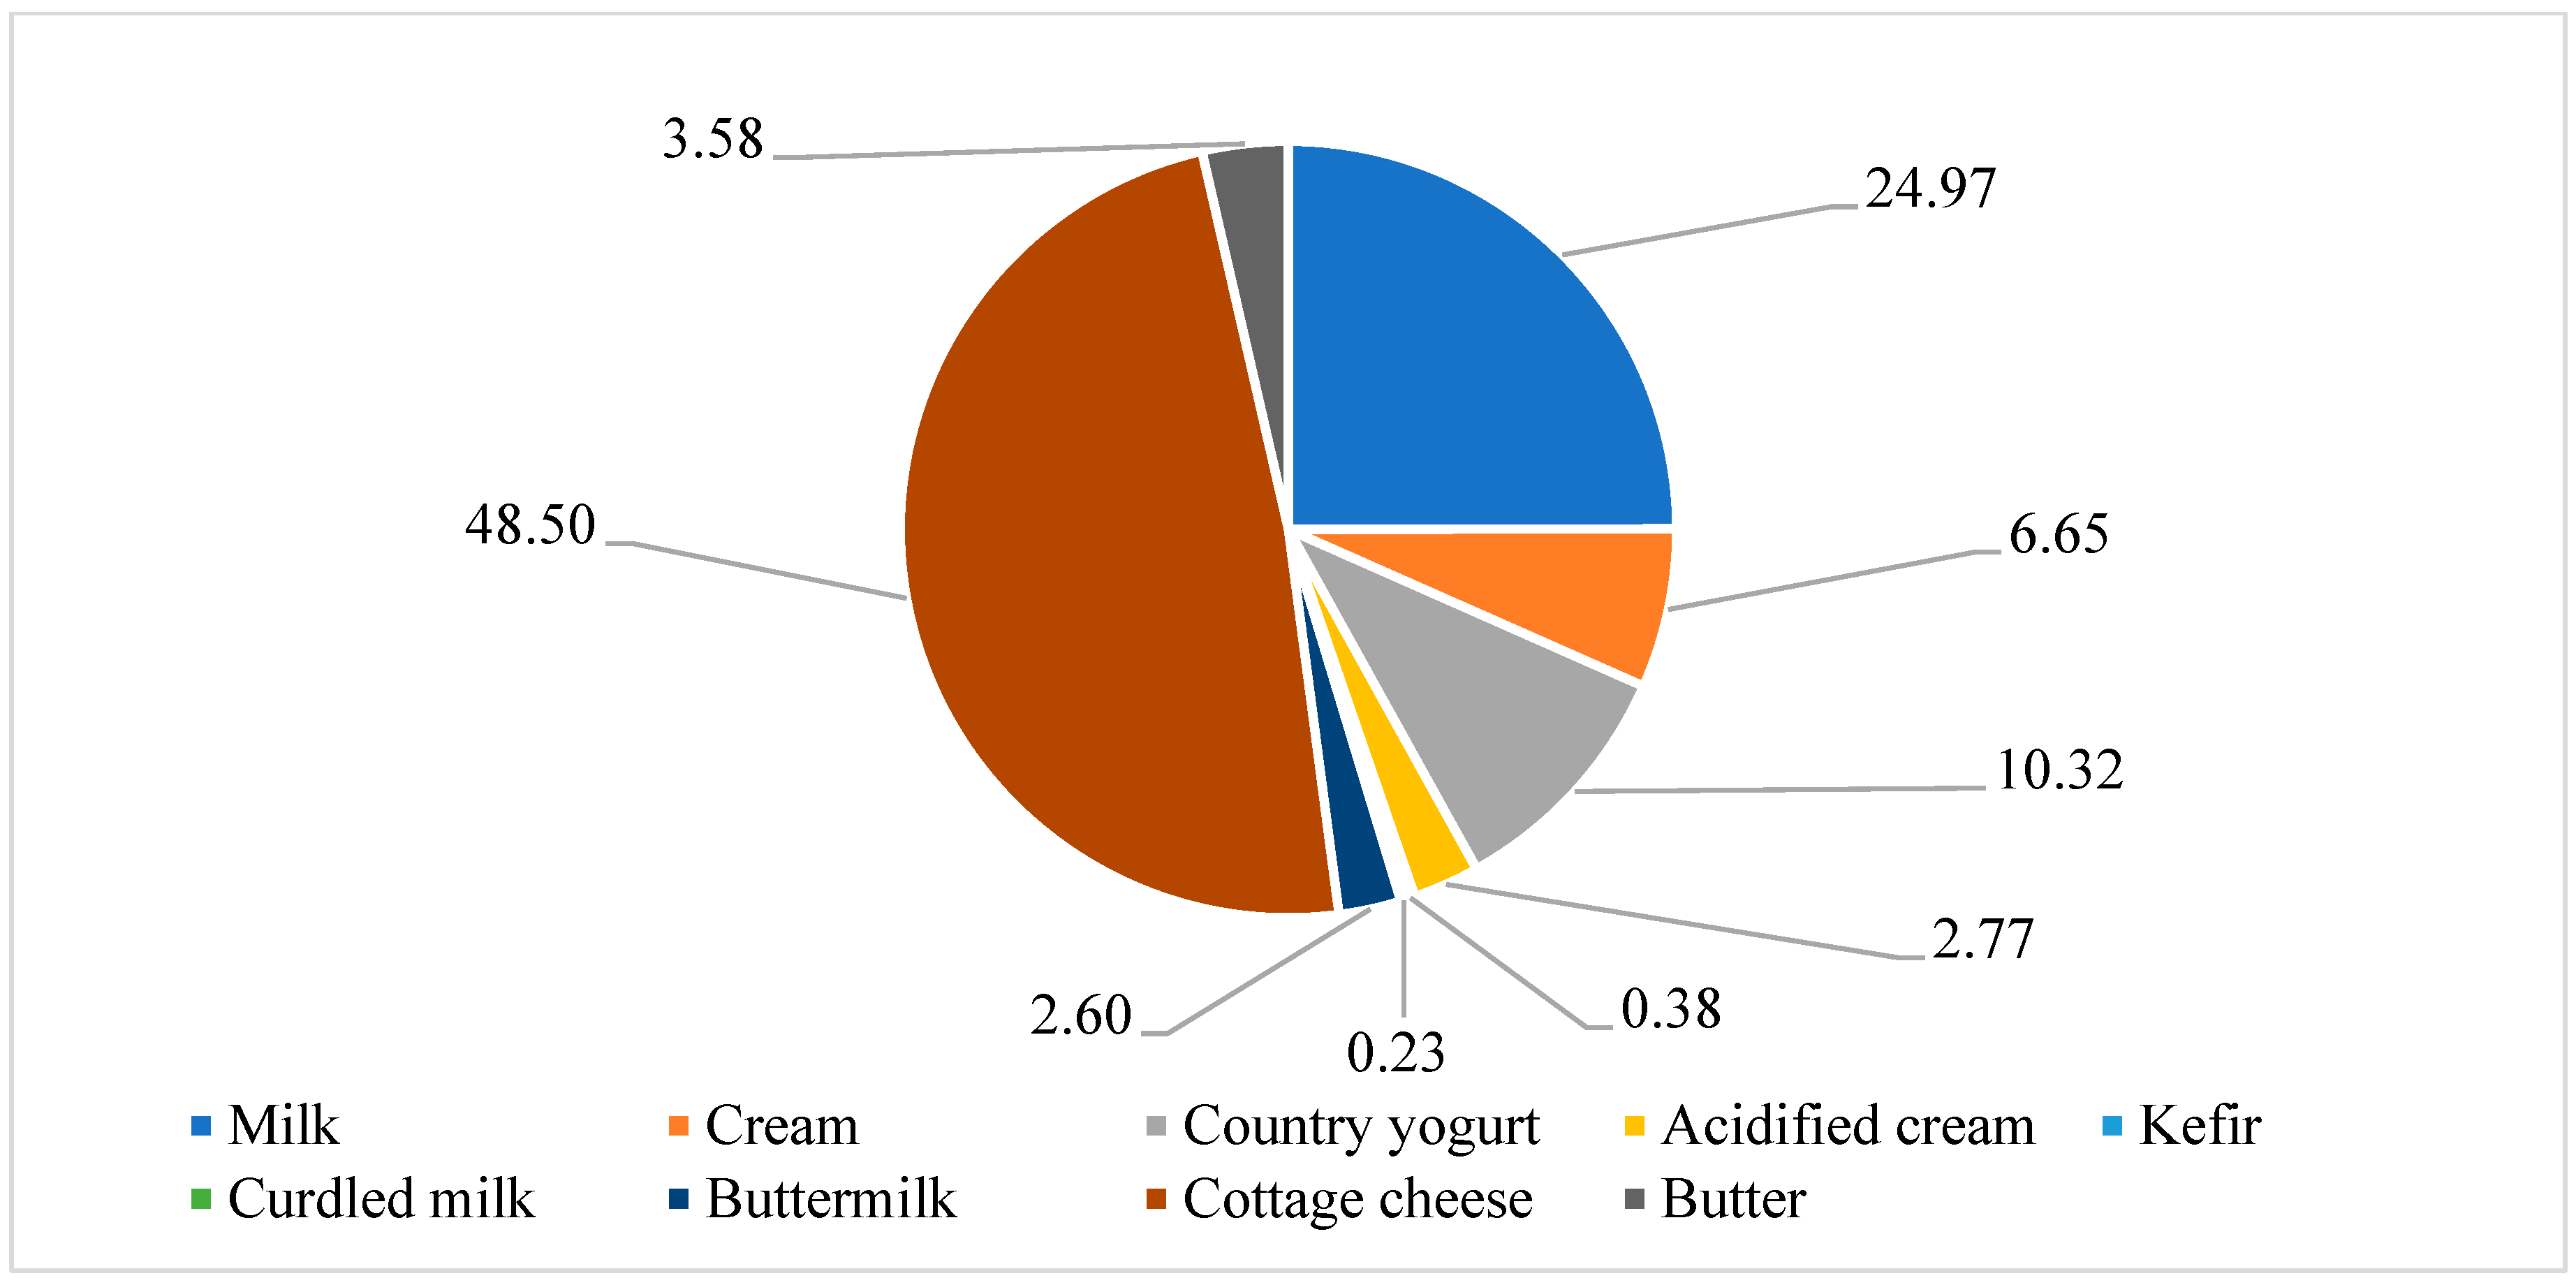
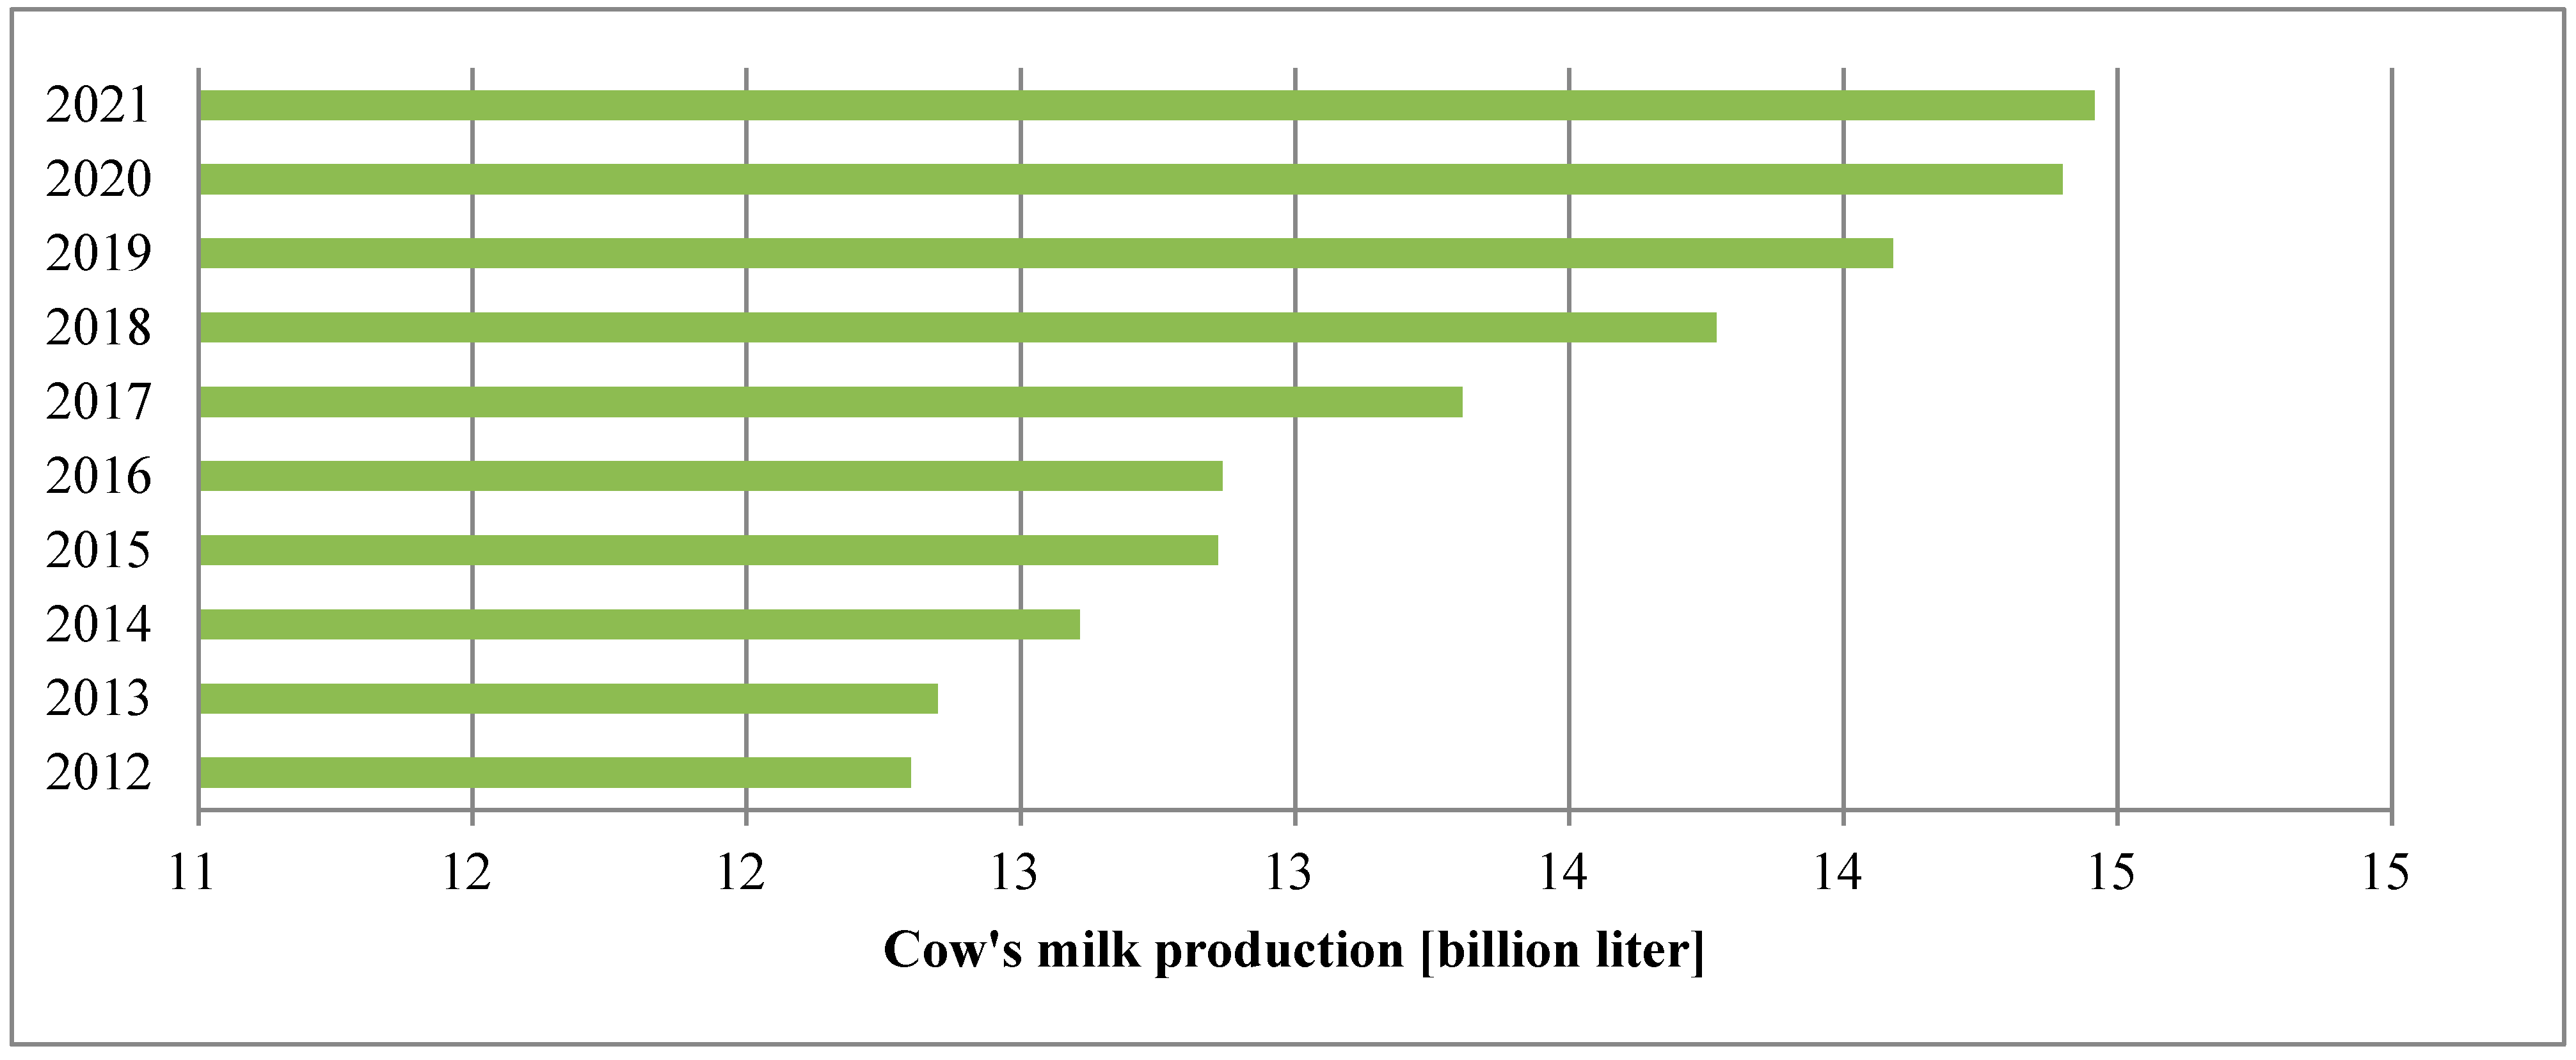
2. Research Material—Production of Milk and Milk Products in a Dairy in Poland
3. Methodology
- —is the equivalent emission volume [kg CO2eq];
- GHG—emission volume of a given greenhouse gas [kg];
- —GWP value of a given greenhouse gas [kg CO2eq/kg GHG];
- —carbon footprint of a product [kg CO2eq/kg product];
- —direct emission volume from the i-th source expressed in CO2eq [kg CO2eq/kg product];
- —indirect emission volume from the j-th source expressed in CO2eq [kg CO2eq/kg product].
- Transportation of raw material: transportation of milk to the diary;
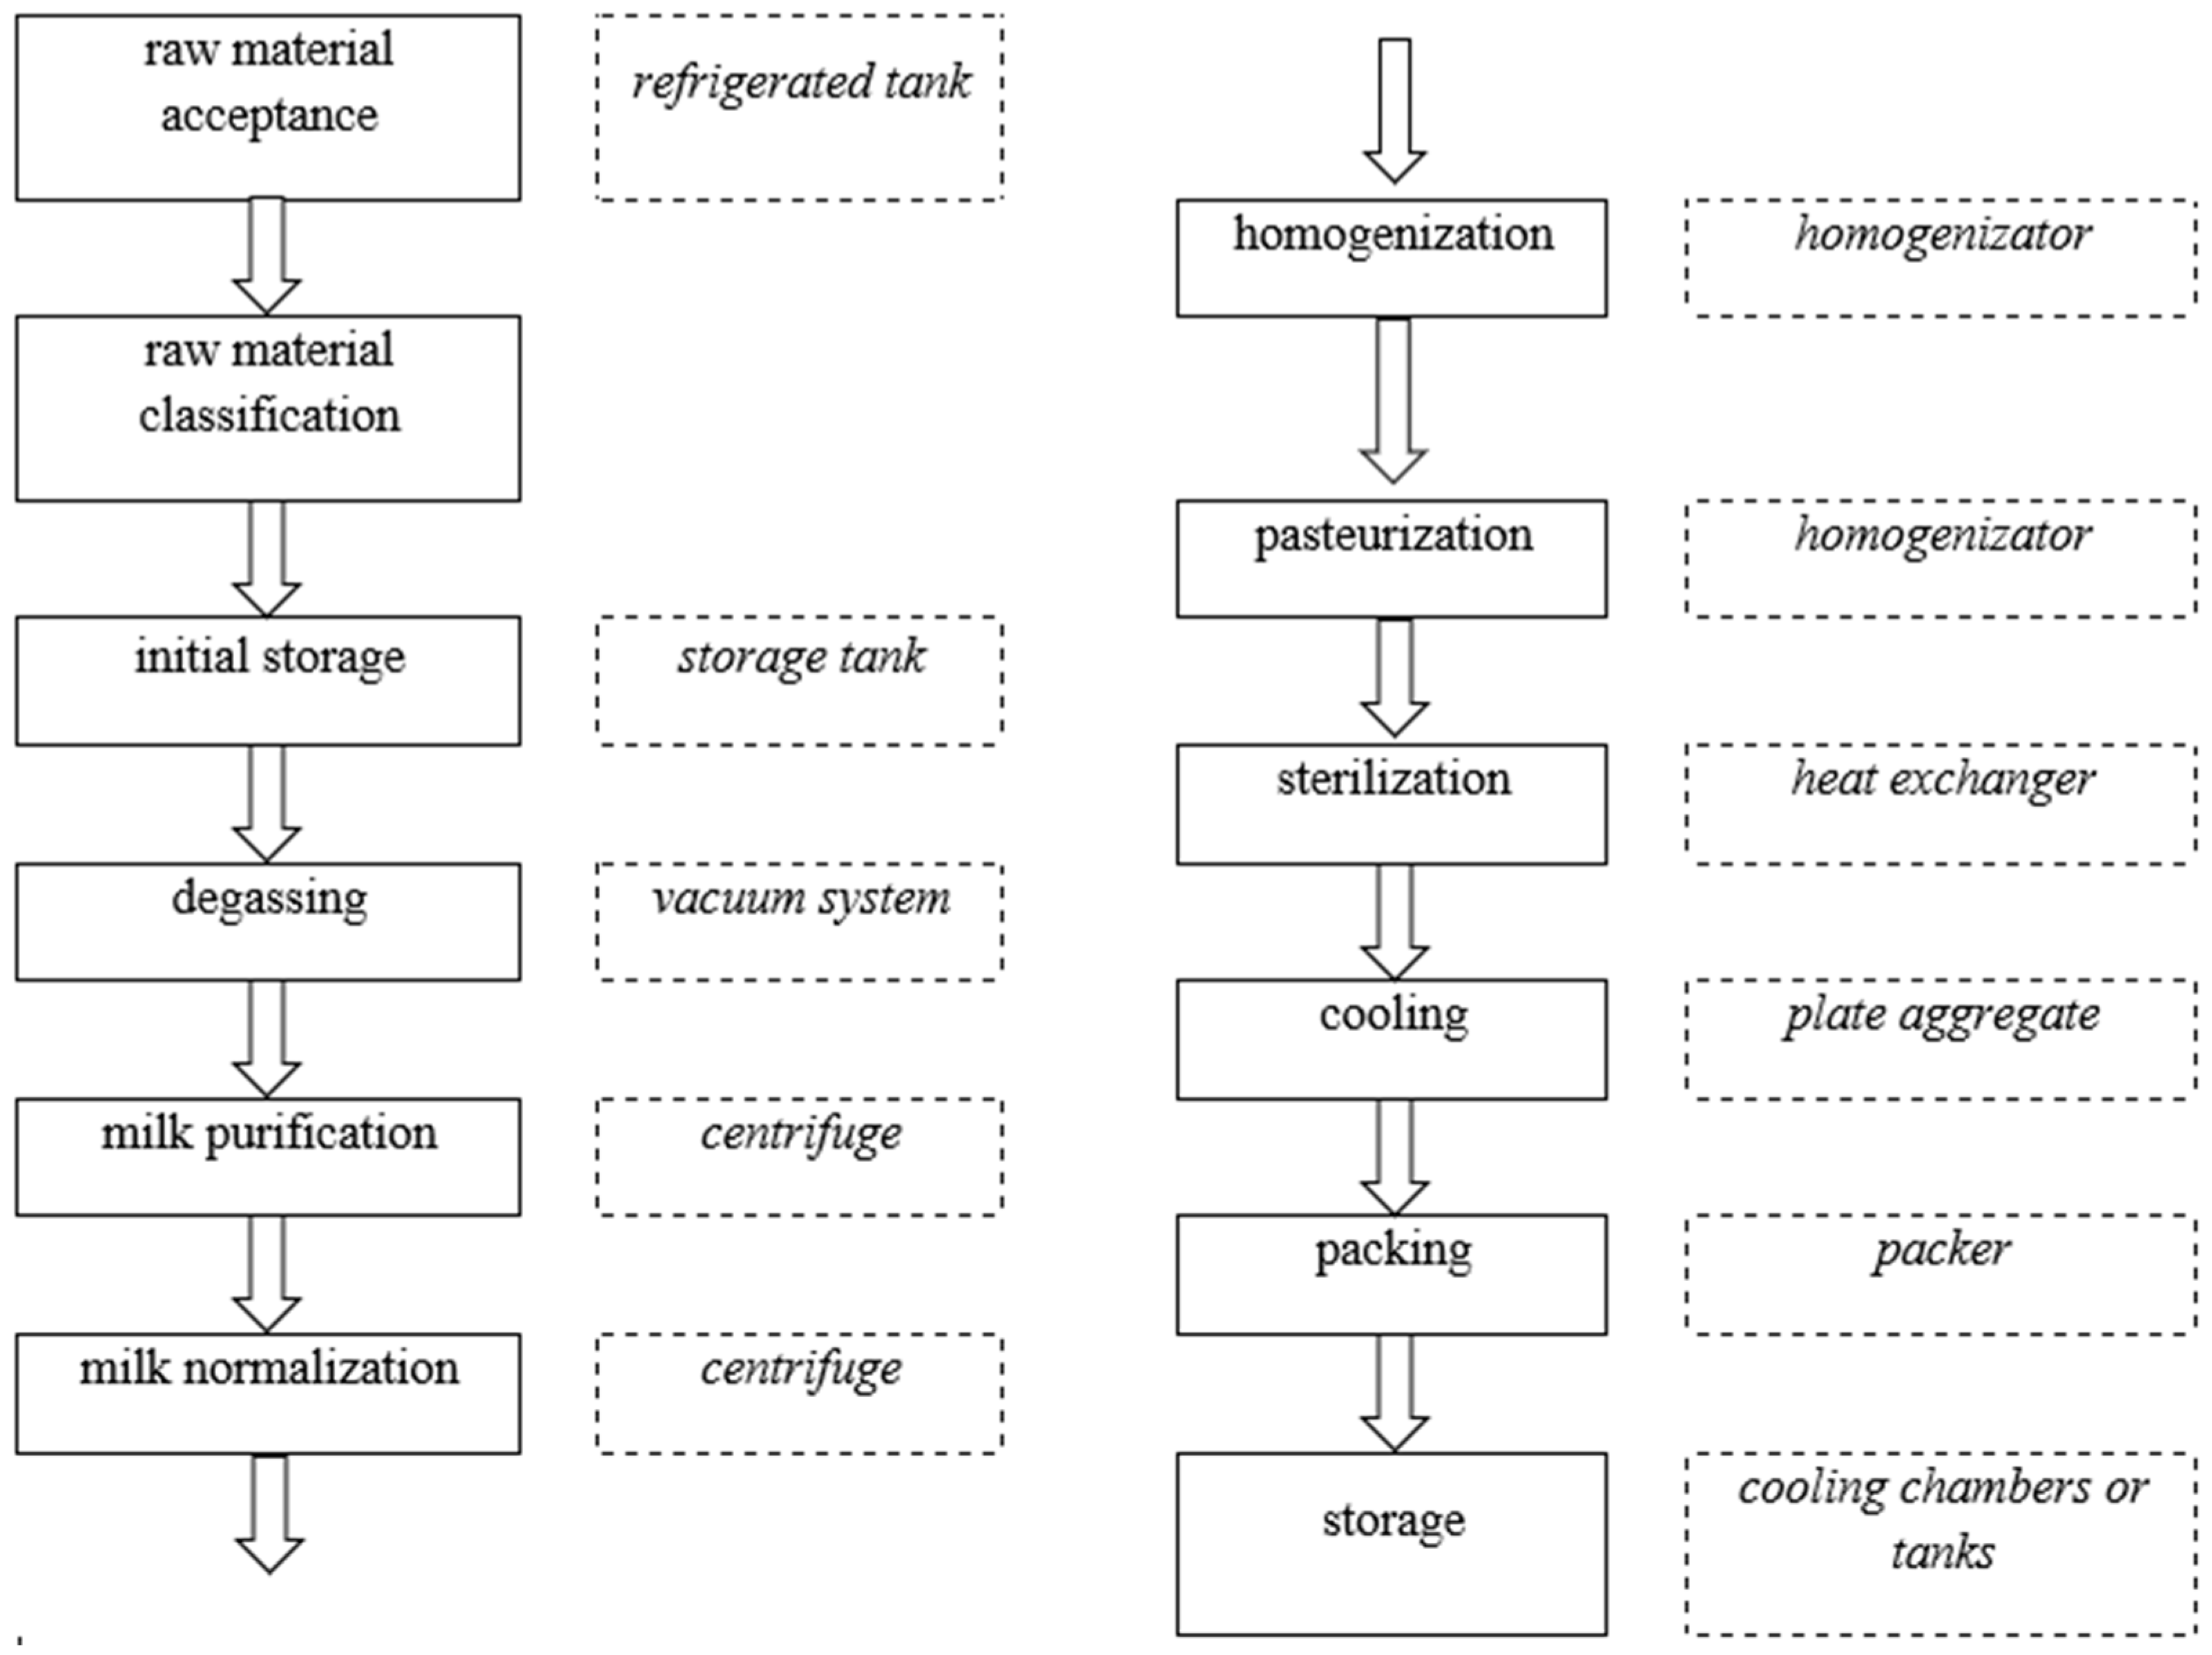
- Processing at the diary: the processing of milk into milk products;
- Delivery to the customer: transportation of milk products to points of sale.where
- —volume diesel [L];
- —parameter for diesel—emissions of GHG in CO2 equivalent value per diesel liter [kg CO2eq/L for diesel];
- —electricity consumption [kWh];
- —parameter for electricity—emissions of GHG in CO2 equivalent value per kWh [kg CO2eq/kWh];
- —volume LPG [kg];
- —parameter for LPG- emissions of GHG in CO2 equivalent value per LPG kg [kg CO2eq/kg for LPG];
- —natural gas consumption [kWh];
- —parameter for natural gas—emissions of GHG in CO2 equivalent value per kWh [kg CO2eq/kWh];
- —direct emission volume from diesel expressed in CO2eq [kg CO2eq];
- —direct emission volume from LPG expressed in CO2eq [kg CO2eq];
- —direct emission volume from natural gas expressed in CO2eq [kg CO2eq];
- —indirect emission volume from electricity expressed in CO2eq [kg CO2eq].
4. Results and Discussion
5. Conclusions
- It was found that in the analyzed plant, the average GHG emissions related to production came mainly from GHG emissions:
- -
- direct from combustion:
- natural gas (for heating rooms and water heating and generating process steam) is 36.86%,
- diesel oil (for road transport) is 12.47%,
- liquefied petroleum gas (LPG) (for powering forklifts) is 0.46%,
- -
- indirect (from electricity consumption) is 50.21%.
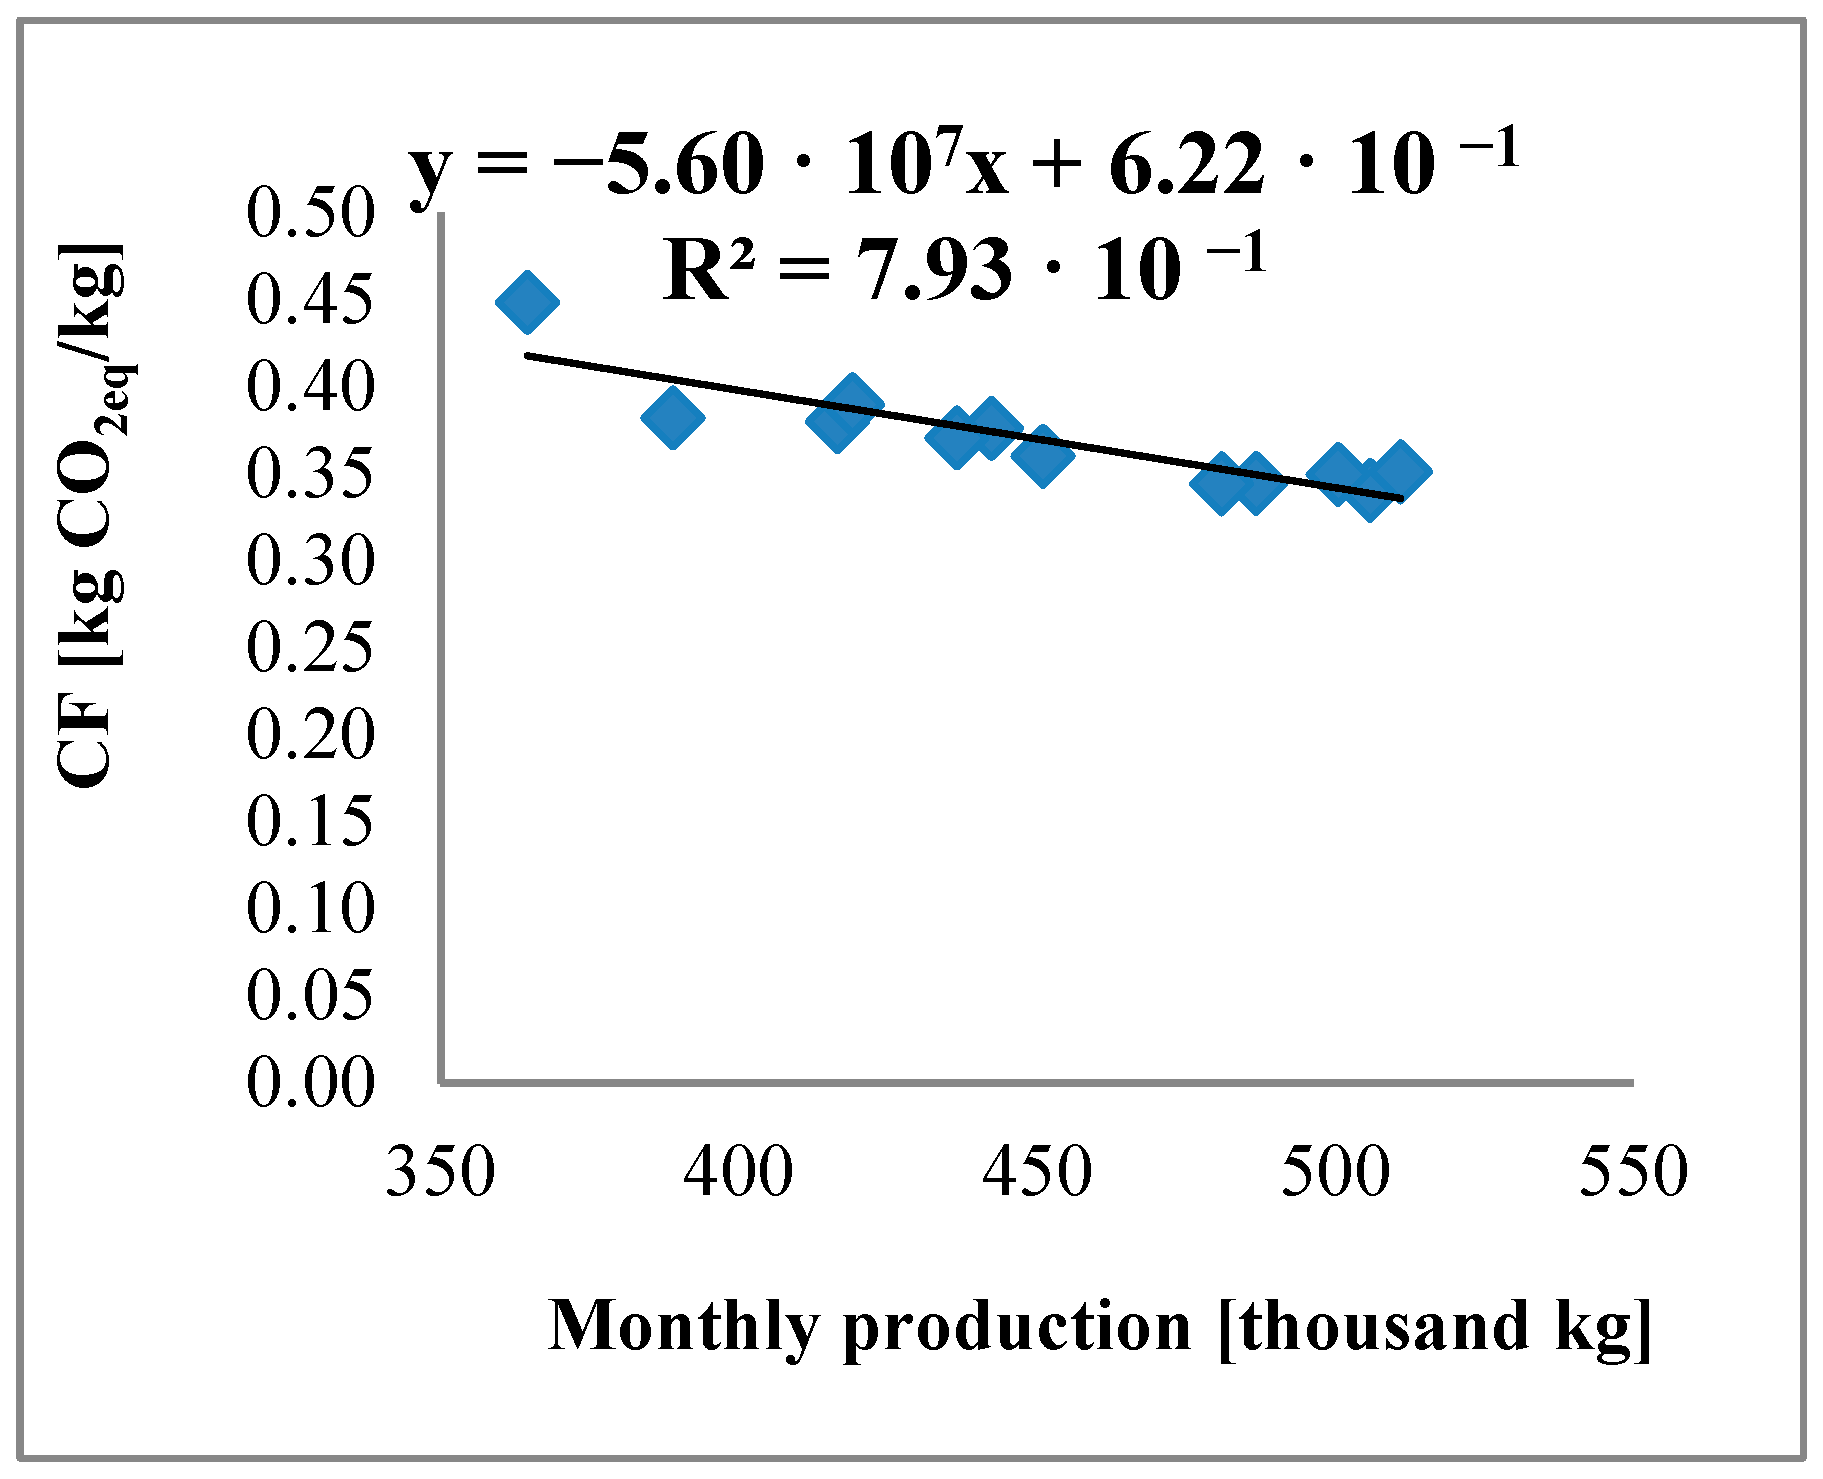
- The determined carbon footprint of production was 0.340–0.448 kg CO2eq/kg, and the average CFAV was 0.367 kg CO2eq/kg.
- A significant relationship was demonstrated between the carbon footprint and the monthly production volume, which allows for planning production in the context of sustainable development.
- An increase in the monthly production volume by about 12% results in a reduction in the carbon footprint by about 18%. However, in the case of planning sustainable production, the indicator on how a 1% increase in production reduces the carbon footprint equals about 1.5%.
- Reducing the carbon footprint is possible through the use of renewable energy sources (e.g., photovoltaic panels).
- -
- intestinal fermentation of cows (methane emissions),
- -
- milk processing (indirect emissions—energy consumption in processing plants),
- -
- refrigerated storage of dairy products (direct emissions of refrigerants, indirect emissions—energy consumption),
- -
- transportation of milk and dairy products (direct emissions from fuel combustion and refrigeration).
Author Contributions
Funding
Institutional Review Board Statement
Data Availability Statement
Conflicts of Interest
Appendix A

| Month | Production | Electricity | Natural Gas | LPG | ON |
|---|---|---|---|---|---|
| Unit | kg | kWh | kWh | L | L |
| January | 416,550 | 103,431.00 | 330,439.00 | 258.50 | 7688.60 |
| February | 388,967 | 94,428.00 | 320,237.00 | 258.50 | 7170.25 |
| March | 505,845 | 114,512.00 | 358,439.00 | 258.50 | 7997.51 |
| April | 450,982 | 112,652.00 | 315,728.00 | 258.50 | 7994.25 |
| May | 510,984 | 135,875.00 | 319,905.00 | 258.50 | 8100.79 |
| June | 500,502 | 145,840.00 | 272,973.00 | 258.50 | 7389.29 |
| July | 486,703 | 140,068.00 | 250,821.00 | 258.50 | 7808.44 |
| August | 442,342 | 139,888.00 | 248,449.00 | 258.50 | 7524.71 |
| September | 436,556 | 133,001.00 | 246,329.00 | 258.50 | 7735.92 |
| October | 480,893 | 121,623.00 | 301,624.00 | 258.50 | 7925.91 |
| November | 419,069 | 108,141.00 | 342,315.00 | 258.50 | 7498.10 |
| December | 364,519 | 104,303.00 | 348,140.00 | 258.50 | 8135.40 |
| Total | 5,403,912 | 1,453,762.00 | 3,655,399.00 | 3102.00 | 92,969.17 |
References
- Rodriguez, Z.; Lopez-Benavides, M.; Gentilini, M.B.; Ruegg, P.L. Impact of training dairy farm personnel on milking routine compliance, udder health, and milk quality. J. Dairy Sci. 2024, in press. [Google Scholar] [CrossRef] [PubMed]
- Ma, Z.; Gong, H.; Liu, B.; Mao, X. The Compositions of Milk Fat Globule Membrane Determine the Interfacial Behavior, Digestive Properties, and Bioactivities: Natural Versus Processed Forms. Trends Food Sci. Technol. 2024, 154, 104786. [Google Scholar] [CrossRef]
- Kostovska, R.; Horan, B.; Drouin, G.; Tobin, J.T.; O’Callaghan, T.F.; Kelly, A.L.; Gómez-Mascaraque, L.G. Multispecies pasture diet and cow breed impacts on milk composition and quality in a seasonal spring-calving dairy production system. J. Dairy Sci. 2024, 107, 10256–10267. [Google Scholar] [CrossRef] [PubMed]
- Yan, H.; Huang, W.; Zhao, X.; Ge, C.; Shen, Y.; Liu, L. Effect of fatty acid composition on the volatile compounds of pasteurized milk during low-temperature storage. Food Res. Int. 2024, 195, 114990. [Google Scholar] [CrossRef] [PubMed]
- Alam, M.; Rawat, M.; Das, R.; Das, D.; Kaur, R.; Sharma, P. Exploring the impact of processing and compositional factors on the improvement of quality of milk paneer: A comprehensive review. Int. Dairy J. 2024, 158, 106038. [Google Scholar] [CrossRef]
- Global Alliance for the Future of Food. 2023. Available online: https://futureoffood.org/insights/power-shift-why-we-need-to-wean-industrial-food-systems-off-fossil-fuels/ (accessed on 18 November 2024).
- The European Green Deal. Communication from the Commission to the European Parliament, the European Council, the Council, the European Economic and Social Committee and the Committee of the Regions. Brussels, 2020. Available online: https://eur-lex.europa.eu/legal-content/EN/TXT/PDF/?uri=CELEX:52020DC0021&from (accessed on 18 November 2024).
- Regulation (EU) 2021/1119 of the European Parliament and of the Council of 30 June 2021 establishing the framework for achieving climate neutrality and amending Regulations (EC) No 401/2009 and (EU) 2018/1999. OJL 2021, 243, 1–17.
- Communication from the Commission to the European Parliament, The European Council, The Council, The European Economic and Social Committee and the Committee of the Regions REPowerEU Plan, COM/2022/230. Available online: https://eur-lex.europa.eu/legal-content/EN/TXT/HTML/?uri=CELEX:52022DC0230 (accessed on 18 November 2024).
- Dida, M.F.; Garcia, S.C.; Gonzalez, L.A. Dietary concentrate supplementation increases milk production and reduces predicted greenhouse gas emission intensity in pasture-based commercial dairy farms. J. Dairy Sci. 2024, 107, 5639–5652. [Google Scholar] [CrossRef] [PubMed]
- Directive (EU) 2022/2464 of the European Parliament and of the Council of 14 December 2022 amending Regulation (EU) No 537/2014, Directive 2004/109/EC, Directive 2006/43/EC and Directive 2013/34/EU as regards corporate sustainability reporting. OJL 2022, 322, 15–80.
- Wróbel-Jędrzejewska, M.; Przybysz, Ł.; Włodarczyk, E. Carbon footprint analysis of sugar production in Poland. Food Bioprod. Process. 2024, 148, 88–94. [Google Scholar] [CrossRef]
- IDF (International Dairy Federation). General IDF Standard for Carbon Footprint in the Dairy Sector; Newsletter: Boise, ID, USA, 2022; ISSN 0250-5118. [Google Scholar]
- ISO 14040:2006; Environmental Management—Life Cycle Assessment—Requirements and Guidelines. International Organization for Standarization: Geneva, Switzerland, 2006. Available online: https://www.iso.org/obp/ui/#iso:std:iso:14040:ed-2:v1:en (accessed on 18 November 2024).
- ISO 14067:2018; Environmental Management—Carbon Foodprint of Products—Requirements and Guidelines for Quantification. International Organization for Standarization: Geneva, Switzerland, 2018.
- GHG Protocol. 2022. Available online: https://ghgprotocol.org/guidance-0 (accessed on 18 November 2024).
- The European Commision. Product Environmental Footprint Category Rules Guidance. Version 6.3. 2018. Available online: https://eplca.jrc.ec.europa.eu/permalink/PEFCR_guidance_v6.3-2.pdf (accessed on 18 November 2024).
- BSI. Specification for the Assessment of Life Cugle GHG Emissions of Foods and Services; PAS 2050:2011; BSI: London, UK, 2011. [Google Scholar]
- EDA. Product Environmental Foodprint Category Rules for Dairy Products. 2018. Available online: https://fil-idf.org/dairy-declaration/dairy-product-environmental-footprint-2018/ (accessed on 18 November 2024).
- FAO. Environmental Performance of Large Ruminant Supply Chains: Guidelines for Assessment; Livestock Environmental Assessment and Performance Partnership; FAO: Rome, Italy, 2016. [Google Scholar]
- EPD. Product Category Rulet. Dairy Products. Product Category Classification: UN CPC 0221, 2211, 2212, 2221, 2223, 2224, 2225. 2021. Available online: https://api.environdec.com/api/v1/EPDLibrary/Files/8df61262-db5d-4415-3a0c-08d98fadb225/Data (accessed on 18 November 2024).
- IPCC. Sixth Assessment Report; IPCC: Geneva, Switzerland, 2021. [Google Scholar]
- Global Dairy Platform. C-Sequ—Draft LCA Guidelines for Calculating Carbon Sequestrations in Cattle Productions Systems. 2021. Available online: https://globaldairyplatform.com/wp-content/uploads/2021/09/c-sequ-draft-guidelines-august-2021-1.pdf (accessed on 18 November 2024).
- Directive (EU) 2024/1760 of the European Parliament and of the Council of 13 June 2024 on corporate due diligence for sustainability and amending Directive (EU) 2019/1937 and Regulation (EU) 2023/2859. OJL 2024. Available online: http://data.europa.eu/eli/dir/2024/1760/oj (accessed on 18 November 2024).
- Wróbel-Jędrzejewska, M.; Włodarczyk, E.; Przybysz, Ł. Carbon Footprint of Flour Production in Poland. Sustainability 2024, 16, 4475. [Google Scholar] [CrossRef]
- Mazzetto, A.M.; Falconer, S.; Ledgard, S. Mapping the carbon footprint of milk production from cattle: A systematic review. J. Dairy Sci. 2022, 105, 9713–9725. [Google Scholar] [CrossRef]
- Sorley, M.; Casey, I.; Styles, D.; Merinoe, P.; Trindadef, H.; Mulhollandg, M.; Zafrah, C.R.; Keatingei, R.; Le Gallj, A.; O’Brienk, D.; et al. Factors influencing the carbon footprint of milk production on dairy farms with different feeding strategies in western Europe. J. Clean. Prod. 2024, 435, 140104. [Google Scholar] [CrossRef]
- O’Brien, D.; Capper, J.L.; Garnsworthy, P.C.; Grainger, C.; Shalloo, L. Open access under CC BY-NC-ND license. A case study of the carbon footprint of milk from high-performing confinement and grass-based dairy farms. J. Dairy Sci. 2013, 97, 1835–1851. [Google Scholar] [CrossRef] [PubMed]
- Léis, C.M.; Cherubini, E.; Ruviaro, C.F.; da Silva, V.P.; Lampert, V.d.N.; Spies, A.; Soares, S.R. Carbon footprint of milk production in Brazil: A comparative case study. Int. J. Life Cycle Assess. 2015, 20, 46–60. [Google Scholar] [CrossRef]
- Henriksson, M.; Flysjo, A.; Cederberg, C.; Swensson, C. Variation in carbon footprint of milk due to management differences between Swedish dairy farms. Animal 2011, 5, 1474–1484. [Google Scholar] [CrossRef]
- Ziarno, M.; Zaręba, D. Carbon Footprint: Carbon Footprint of Milk Production. Dairy Forum Trade 2024, 2, 122. (In Polish) [Google Scholar]
- Herron, J.; Hennessy, D.; Curran, T.; Moloney, A.; O’Brien, D. The simulated environmental impact of incorporating white clover into pasture-based dairy production systems. J. Dairy Sci. 2021, 104, 7902–7918. [Google Scholar] [CrossRef]
- ISO 14044; Environmental Management, Life Cycle Assessment—Requirements and Guidelines. International Organization for Standardization: Geneva, Switzerland, 2009. Available online: https://www.iso.org/obp/ui/#iso:std:iso:14044:ed-1:v1:en (accessed on 18 November 2024).
- Pirlo, G.; Carè, S. A Simplified Tool for Estimating Carbon Footprint of Dairy Cattle Milk. Ital. J. Anim. Sci. 2013, 12, 497–506. [Google Scholar] [CrossRef]
- Gollnow, S.; Lundie, S.; Moore, A.D.; McLaren, J.; Buuren, N.; Stahle, P.; Christie, K.; Thylmann, D.; Rehl, T. Carbon footprint of milk production from dairy cows in Australia. Int. Dairy J. 2014, 37, 31–38. [Google Scholar] [CrossRef]
- Morais, T.G.; Teixeira, R.F.; Rodrigues, N.R.; Domingos, T. Carbon footprint of milk from pasture-based dairy farms in Azores. Portugal. Sustain. 2018, 10, 3658. [Google Scholar] [CrossRef]
- Vergé, X.P.C.; Dyer, J.A.; Desjardins, R.L.; Worth, D. Greenhouse gas emissions from the Canadian dairy industry in 2001. Agric. Syst. 2007, 94, 683–693. [Google Scholar] [CrossRef]
- Casey, J.W.; Holden, N.M. Analysis of greenhouse gas emissions from the average Irish milk production system. Agric. Syst. 2005, 86, 97–114. [Google Scholar] [CrossRef]
- Laca, A.; Gómez, N.; Laca, A.; Díaz, M. Overview on GHG emissions of raw milk production and a comparison of milk and cheese carbon footprints of two different systems from northern Spain. Environ. Sci. Pollut. Res. 2020, 27, 1650–1666. [Google Scholar] [CrossRef] [PubMed]
- Ogino, A.; Ishida, M.; Ishikawa, T.; Ikeguchi, A.; Waki, M.; Yokoyama, H.; Tanaka, Y.; Hirooka, H. Environmental impacts of a Japanese dairy farming system using whole crop rice silage as evaluated by life cycle assessment. Anim. Sci. J. 2008, 79, 727–736. [Google Scholar] [CrossRef]
- Thomassen, M.A.; De Boer, I.J.M. Evaluation of indicators to assess the environmental impact of dairy production systems. Agric. Ecosyst. Environ. 2005, 111, 185–199. [Google Scholar] [CrossRef]
- Bieńkowski, J.; Jankowiak, J.; Dąbrowicz, R.; Holka, M. Regional differentiation of greenhouse gas (GHG) emissions from agriculture in Poland. In Book of Abstracts. XIIIth Congress of the European Society for Agronomy Debrecen, Debrecen, Hungary, 25–29 August 2014; 2014; pp. 425–426. [Google Scholar]
- Bieńkowski, J.; Janusz Jankowiak, J.; Holka, M.; Dąbrowicz, R. The need to determine the carbon footprint of agricultural production and the prospects for its application. Issues Agric. Consult. 2015, 2, 83–96. (In Polish) [Google Scholar]
- IPCC. Report on Climate Change 2023: The Physical Science Basis; IPCC: Geneva, Switzerland, 2023. [Google Scholar]
- Available online: https://www.gov.uk/government/publications/greenhouse-gas-reporting-conversion-factors-2023 (accessed on 18 November 2024).
- KOBiZE. National Centre for Emissions Management. Report: Emission factors of CO2, SO2, NOX, CO and Total Dust for Electricity Published in December 2023. 2023. Available online: https://www.kobize.pl/uploads/materialy/materialy_do_pobrania/wskazniki_emisyjnosci/Wskazniki_emisyjnosci_2022.pdf (accessed on 18 November 2024).
- Central Statistical Office. Production of Industrial Products; GUS: Warsaw, Poland, 2023. (In Polish) [Google Scholar]
- Central Statistical Office. Production of Industrial Products in 2017–2021; GUS: Warsaw, Poland, 2022. (In Polish) [Google Scholar]


| Study Characteristics (Region and Methodology) | CF Value | Factors of Influence on CF | Source |
|---|---|---|---|
| - in Italy - LatteGHG program | no data available | - milk production efficiency - herd size - manure management system | [34] |
| - in Australia - life cycle assessment | 1.11 kg CO2eq/kg (for 2009/2010) | - production practices - feeding system - manure management practices | [35] |
| - in the Azores archipelago - OpenLCA application—IPCC | 0.83 kg CO2eq/kg | - emissions from enteric fermentation - feed production - use of fertilizers (organic and mineral) | [36] |
| - in the southern region of Brazil - LCA SimaPro 7.3.3 software—ISO 14040: 2006 [14] and ISO 14044: 2006 standards [33] | 0.535 kgCO2eq/kg for a closed system, 0.778 kgCO2eq/kg for a semi-closed system, 0.738 kgCO2eq/kg for a pasture-based system | - livestock breeding system | [29] |
| - for the Canadian dairy industry in 2001 - Fossil Fuel for Farm Fieldwork Energy and Emissions model—IPCC | 1.0 kgCO2eq/kg | - breeding and production method | [37] |
| - in Ireland - life cycle assessment | 1.50 kgCO2eq/kg/year | - 49% enteric fermentation - 21% fertilizers - 13% concentrate feed - 11% manure management - 5% electricity and diesel consumption | [38] |
| - in northern Spain - life cycle assessment | 0.9–4.7 kgCO2eq/kg, 1.22 kgCO2eq/kg—semi-enclosed 0.99 kgCO2eq/kg—pasture farms | - by-products - livestock feed - electricity - diesel - cleaning elements - transportation, manure and slurry management - cattle feeding system | [39] |
| - in Japan - life cycle assessment | 0.972 kgCO2eq /kg | - feed production and feed transportation - animal management (including biological activity of the animal) - waste disposal - dairy cattle breeding system using rice silage | [40] |
| - in the Netherlands - life cycle assessment | 1.81 kgCO2eq/kg | - land use - energy consumption - farming system | [41] |
| Month | Natural Gas | LPG | ON | Electricity | Sum |
|---|---|---|---|---|---|
| January | 66,087.80 | 759.8 | 20,451.68 | 70,850 | 158,149.50 |
| February | 64,047.40 | 759.8 | 19,072.87 | 64,683 | 148,563.30 |
| March | 71,687.80 | 759.8 | 21,273.38 | 78,441 | 172,161.70 |
| April | 63,145.60 | 759.8 | 21,264.71 | 77,167 | 162,336.70 |
| May | 63,981.00 | 759.8 | 21,548.10 | 93,074 | 179,363.30 |
| June | 54,594.60 | 759.8 | 19,655.51 | 99,900 | 174,910.30 |
| July | 50,164.20 | 759.8 | 20,770.45 | 95,947 | 167,641.10 |
| August | 49,689.80 | 759.8 | 20,015.73 | 95,823 | 166,288.60 |
| September | 49,265.80 | 759.8 | 20,577.55 | 91,106 | 161,708.90 |
| October | 60,324.80 | 759.8 | 21,082.92 | 83,312 | 165,479.30 |
| November | 68,463.00 | 759.8 | 19,944.95 | 74,077 | 163,244.40 |
| December | 69,628.00 | 759.8 | 21,640.16 | 71,448 | 163,475.50 |
| Total | 731,079.80 | 9,117.90 | 247,298 | 995,827 | 1,983,322.70 |
| Month | Production of GHG Emissions from Electricity | Emissions from Renewable Energy Sources |
|---|---|---|
| January | 158,149.5 | 397.30 |
| February | 148,563.3 | 1043.94 |
| March | 172,161.7 | 1904.30 |
| April | 162,336.7 | 3211.28 |
| May | 179,363.3 | 5198.47 |
| June | 174,910.3 | 5076.54 |
| July | 167,641.1 | 5121.06 |
| August | 166,288.6 | 3776.41 |
| September | 161,708.9 | 3492.13 |
| October | 165,479.3 | 1363.15 |
| November | 163,244.4 | 782.27 |
| December | 163,475.5 | 292.50 |
| Total | 1,983,322.7 | 31,659.33 |
Disclaimer/Publisher’s Note: The statements, opinions and data contained in all publications are solely those of the individual author(s) and contributor(s) and not of MDPI and/or the editor(s). MDPI and/or the editor(s) disclaim responsibility for any injury to people or property resulting from any ideas, methods, instructions or products referred to in the content. |
© 2024 by the authors. Licensee MDPI, Basel, Switzerland. This article is an open access article distributed under the terms and conditions of the Creative Commons Attribution (CC BY) license (https://creativecommons.org/licenses/by/4.0/).
Share and Cite
Wróbel-Jędrzejewska, M.; Klepacka, A.M.; Włodarczyk, E.; Przybysz, Ł. Carbon Footprint of Milk Processing—Case Study of Polish Dairy. Agriculture 2025, 15, 62. https://doi.org/10.3390/agriculture15010062
Wróbel-Jędrzejewska M, Klepacka AM, Włodarczyk E, Przybysz Ł. Carbon Footprint of Milk Processing—Case Study of Polish Dairy. Agriculture. 2025; 15(1):62. https://doi.org/10.3390/agriculture15010062
Chicago/Turabian StyleWróbel-Jędrzejewska, Magdalena, Anna M. Klepacka, Ewelina Włodarczyk, and Łukasz Przybysz. 2025. "Carbon Footprint of Milk Processing—Case Study of Polish Dairy" Agriculture 15, no. 1: 62. https://doi.org/10.3390/agriculture15010062
APA StyleWróbel-Jędrzejewska, M., Klepacka, A. M., Włodarczyk, E., & Przybysz, Ł. (2025). Carbon Footprint of Milk Processing—Case Study of Polish Dairy. Agriculture, 15(1), 62. https://doi.org/10.3390/agriculture15010062