Article

Discrete Element Model of Oil Peony Seeds and the Calibration of Its Parameters

1
College of Agricultural Equipment Engineering, Henan University of Science and Technology, Luoyang 471003, China
2
Longmen Laboratory, Luoyang 471003, China
3
Henan Collaborative Creation Center for Advanced Manufacturing of Machinery and Equipment, Luoyang 471003, China
*
Author to whom correspondence should be addressed.
Agriculture 2024, 14(7), 1092; https://doi.org/10.3390/agriculture14071092
Submission received: 12 June 2024 / Revised: 4 July 2024 / Accepted: 4 July 2024 / Published: 6 July 2024
(This article belongs to the Section Agricultural Technology)

Abstract

:
Oil peony is an important oil crop that is primarily sown by using artificial methods at present. Its seeder encounters the problems of low efficiency of seeding that significantly limits the highly efficient mechanized production of high-quality peony oil. In this study, Fengdan white oil peony seeds were used as the research object and repose angle as the response value to establish a discrete element model (DEM) and parameter calibration. The range of parameters of oil peony seeds was first obtained through an experiment, and their repose angle was obtained by an inclinometer. A three-dimensional DEM of oil peony seeds was then established. The Plackett–Burman (PB) test was utilized to screen the parameters that had a significant influence on the repose angle, and the steepest ascent (SA) test was applied to determine their optimum range of testing. Following this, based on Box–Behnken (BBD) test results, a second-order regression model between the important parameters and the repose angle was constructed. Finally, the absolute minimum difference between simulated and measured repose angles was utilized as the objective of optimization to obtain the following optimum combination of parameters: The values of the seed–steel collision recovery coefficient (CRC), seed–seed static friction coefficient (SFC), seed–steel SFC, and seed–seed rolling friction coefficient (RFC) were 0.704, 0.324, 0.335, and 0.045, respectively. This optimal combination of parameters was confirmed through simulations, and the error between simulated and measured repose angles was only 0.67%, indicating that the calibrated DEM of oil peony seeds was reliable.

1. Introduction

China is the world’s largest consumer of edible oils but produces only about 40% of its national requirement. Oil peony is an excellent oil crop, the quality and efficiency of cultivation of which is important for ensuring China’s self-reliance in the production of edible oils [1,2,3,4,5,6,7]. At the same time, peony oil is as high as 92% in unsaturated fatty acid content, especially the alpha-linolenic acid content is over 42%, and is known as the world’s best cooking oil. However, the problems of a low efficiency of seeding encountered by the peony seeder hinder the highly efficient mechanized production of high-quality peony oil. The DEM of oil peony seeds can be used to investigate the mechanism of interaction between seeds during the seeding process to improve their quality and efficiency [8].
The DEM has been extensively used for modeling and simulation-based analyses of agricultural materials, such as wheat, rice, corn, and soybean, in recent years [9,10,11,12,13,14]. Bai et al. obtained the range of parameters of cotton seeds through experimental measurements and used the minimum errors in the stacking and resting angles of cotton seeds as the objectives of the NSGA-II optimization algorithm to obtain the best combination of DEM parameters [15]. Zhong et al. obtained the DEM parameters of sugarcane by the high-speed photography and inclined plane method, and the range of values of the RFC, SFC, and CRC [16]. Wang et al. established six models of sunflower seeds of varying precision by the polyhedron and multi-ball stuffing methods and obtained accurate parameters of the DEM of sunflower seeds by simulations to verify the repose angle [17]. Lu et al. proposed the ellipsoid modeling of wheat seeds and used the ellipsoid method and two multi-ball modeling methods to simulate and analyze their process of seeding. The results exhibited that the ellipsoid model had higher accuracy and stability compared to the multi-ball models [18]. Hu et al. established a DEM of cottonseed with a dynamic angle of reactivity as the test index [19]. Zhang et al. considered germinated American ginseng seeds as the object of research and calibrated their DEM parameters by the PB, SA, and BBD tests [20]. However, few studies in the literature have sought to establish DEM of oil peony seeds.
This study seeks to solve the problem of a lack of DEM parameters for the simulation-based optimization of the arrangement of the device for oil peony seeds. To this end, oil peony seeds were used as the object of research. The range of test values of their DEM parameters was obtained, their repose angle was measured, and these variables were used to establish a DEM. The calibration of DEM parameters was achieved through the PB, SA, and BBD tests. Following this, the minimization of the absolute difference between the simulated and measured repose angles was set as the final goal of optimization to obtain the best parameter combination of DEM. The accuracy of the calibrated DEM parameters was verified by contrasting simulated repose angles with measured ones. This can provide accurate DEM parameters for the optimal design of the arrangement device for oil peony seeds.

2. Materials and Methods

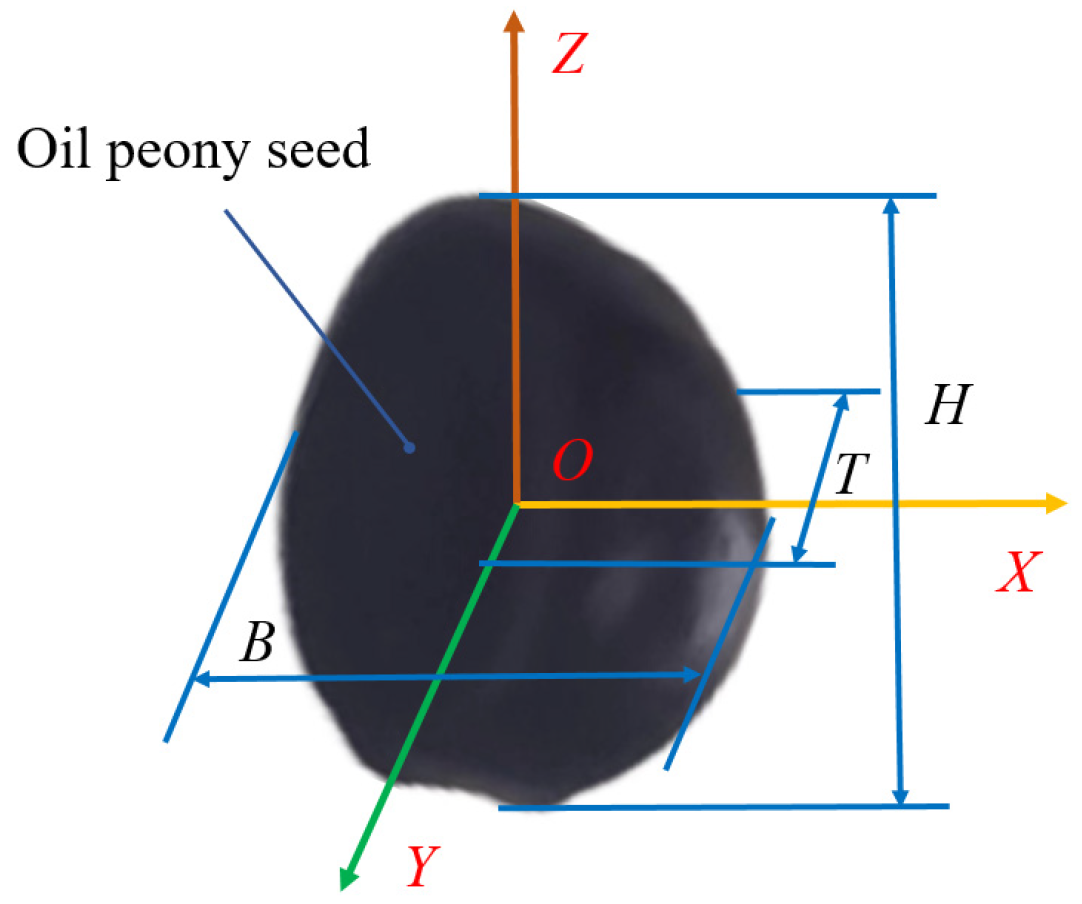
2.1. Geometric Parameters of Oil Peony Seeds

The Fengdan white oil peony seeds tested for this study were planted in Luoyang, in Henan Province of China. The results of manual screening showed that they were undamaged, had no mildew, and had a water content of 7.3%.
A Vernier caliper (STWC Co., Shanghai, China) with an accuracy of 0.02 mm was used to measure the 3D sizes (i.e., H, B, T) of the above seed randomly selected (Figure 1). The measurement was repeated 500 times. Owing to their complex shapes and different sizes, the geometric model of the peony seeds was simplified to represent only ellipsoidal and flat seeds based on their measured dimensions [21]. The ratio of ellipsoidal seeds to flat seeds was 19:6.

2.2. Thousand Particle Weight and Density Measurements

Three groups of oil peony seeds were randomly selected, with 1000 seeds in each group, and were subjected to three repeated tests by using a small electronic balance. The average measured weight was 198.20 g. Because part of each seed floated in the water, they were gathered with gauze, and their volume was determined through the drainage method by using a 1 L cylinder.

2.3. Elastic Modulus

Twenty ellipsoidal and flat oil peony seeds were randomly selected, and compressed by using the TA.XTC-16 texture analyzer (BosinTouch Co., Shanghai, China) [22]. The oil peony seeds were placed on the test platform of the texture analyzer, and their original dimensions along the direction of thickness were recorded for the compression test (Figure 2). A cylindrical probe with a radius of 10 mm was utilized to this end; its initial height was set to 10 mm, while its speeds of travel and loading were set to 0.5 mm/s and 0.25 mm/s, respectively. After loading, the probe speed movement and the pressure limit were 0.5 mm/s and 17,000 gf. The force–displacement data obtained during the compression test was utilized to calculate the elastic modulus of the seeds through Equation (1).
E = σ ε = F L Δ L S
In the above, E is the elastic modulus of the oil peony seeds, Pa; F is the external force applied to the oil peony seeds, Pa; L is the deformation-induced displacement of the oil peony seeds, m; Δ L is their initial length, m; and S is their cross-sectional area, m2.

2.4. Poisson’s Ratio

The compression test was carried out by using the cylindrical probe of the texture analyzer, and the Poisson ratio of the oil peony seeds was calculated [12]. Twenty oil peony seeds were randomly selected, and their transverse dimensions were recorded. Compression tests were carried out on seeds, respectively, and the test settings were the same as those detailed in Section 2.3. The axial and transverse sizes of the seeds after compression were used to calculate their Poisson’s ratio according to Equation (2).
μ = ε x ε y = Δ C C Δ H H
where μ is the Poisson’s ratio of the oil peony seeds, Δ C is their transverse deformation, m, C is their initial transverse dimension, m, Δ H is the axial deformation of the oil peony seeds, m, and H is their initial axial dimension, m.

2.5. Friction Coefficient

The friction coefficient of oil peony seeds was measured by the inclined plane method [23]. Seeds of similar thicknesses were selected and arranged densely on A4 printing paper to form a seed board (Figure 3). During the test, the seed was set on the device used to measure the friction coefficient (or was fixed on the seed plate on the device). The angle of inclination of the test platform was then gradually increased manually until the seed tended to slide (or roll) downward along the incline and then stopped moving. The angle θ of the test platform was subsequently recorded. Oil peony seeds are mainly divided into two categories with ellipsoidal and flat shapes, where the former are prone to rolling. To ensure the accuracy of the experimental data, 10 flat, randomly selected oil peony seeds were used for three repeated tests of the FSC, and ten ellipsoidal seeds were used for three repeated tests of RFC. The friction coefficient, calculated using Equation (3), was represented by its average value.
f = t a n θ
where f is the friction coefficient of oil peony seeds and θ is the angle of inclination of the inclined plane.

2.6. Collision Recovery Coefficient

The CRC from collisions between oil peony seeds and between seeds and contact material was determined by the vertical drop test (Figure 4) [24]. Coordinate paper was provided on the far left of the measuring device, with the vertical distance H between the seed hole and the contact material set at 300 mm. Fifty oil peony seeds were randomly selected for the measurements, which were taken by using a high-speed camera (Olympus Corporation, Tokyo, Japan) after the seeds had freely fallen in the seed hole and bounced off the contact material. Due to the irregularity of the outline of the oil peony seeds, we chose 20 seeds that had vertically sprung back up after collision and recorded their greatest height. According to its physical definition, the CRC between the peony seed and the contact material is the ratio of its relative velocity of separation after collision and its relative approaching velocity before collision [25,26,27]. Because the velocity of the contact material before and after the collision was zero, Equation (4) can be used to calculate the CRC.
ε = v v = h H
where ε is the collision recovery coefficient, H is its initial height, m, and h is the height to which the seed rebounded, m.

2.7. Repose Angle

Using an inclinometer (model DT-1) to measure the repose angle of oil peony seeds (Figure 5). The device was placed on a horizontal test bench. The lifting platform was placed inside the material tank, which was then filled with seeds. The handle was used to lift the lifting platform to the top of the material tank slowly and at a constant speed, such that the seeds left on the lifting platform formed a repose angle.
Three tests were conducted, and a high-speed camera was utilized to photograph images of the seed pile (Figure 6a). MATLAB was used to process the images in grayscale, binarize them (Figure 6b), extract their boundaries, and linearly fit them (Figure 6c) [28,29].

2.8. Model Construction and Simulation

Based on their measured average sizes, three-dimensional modeling software was utilized to establish representative three-dimensional models of the flat and ellipsoid oil peony seeds and applied the Hertz–Mindlin (no slip) contact model to build their DEM (Figure 7). Simulations of the ellipsoidal and flat seeds, at a ratio of 19:6, in the material tank were conducted, where the number of seeds was 10,000. When the particles of the seeds had attained a stable state, the disk-lifting platform was moved to the top of the material tank at a speed of 0.1 m/s along the Z-axis, and the seed particles on it fell under the action of gravity. The seeds that eventually remained on the platform created a stable repose angle (Figure 8).

3. Results and Discussion

3.1. Laboratory Test Results

Related parameters of oil peony seed use (Table 1) were measured in the third part of this study.

3.2. Plackett–Burman (PB) Test

Design-Expert 13 software was utilized to design the PB test. The repose angle was used as the test index, and parameters that had a significant influence on it were screened out [30]. Eight test parameters were selected in this experiment. Their ranges of values were chosen according to the results (Table 2). The scheme and results of the PB test (Table 3). Each group of simulations was repeated three times to obtain the average repose angle.
An analysis of the results of the PB test was provided (Table 4). It showed that M7 had an extremely significant influence on the repose angle. Parameters M4, M5, and M6 had a significant influence on it, whereas other parameters of the simulation did not significantly influence the repose angle. Therefore, only M4M7 were used for the SA and BBD tests.

3.3. Steepest Ascent (SA) Test

To further explore the realistic range of values of the important parameters (i.e., M4, M5, M6, and M7), the SA test was devised and carried out. The values of all non-significant parameters in the test were set to their averages. The design scheme and results of the SA test were listed (Table 5). They showed that the error between the simulated and measured repose angles was the smallest in test No. 2, indicating that the optimal ranges of values of M4, M5, M6, and M7 were 0.67–0.75, 0.29–0.375, 0.32–0.39, and 0.04–0.06, respectively. The follow-up BBD test was carried out by these ranges of values for the parameters.

3.4. Box–Behnken (BBD) Test

The BBD test was used to examine how the seed–steel CRC (M4), seed–seed SFC (M5), seed–steel SFC (M6), and seed–seed RFC (M7) affect the repose angle (θ). The coding table for the test factors was provided (Table 6), while the test design and results were presented (Table 7). Multiple regression analysis was performed on the obtained data to obtain the regression equation of test factors M4, M5, M6, and M7 with respect to test index θ:
θ = 332.73 + 642.55 M 4 + 20.47 M 5 + 401.72 M 6 + 2279.01 M 7 + 58.82 M 4 M 5 285.71 M 4 M 6     1687.50 M 4 M 7 + 134.45 M 5 M 6 + 705.88 M 5 M 7 785.71 M 6 M 7 341.15 M 4 2 198.39 M 5 2     261.90 M 6 2 9583.33 M 7 2
The variance analysis of the test results (Table 8) was apparent that M4, M5, M6, M7, M42, and M72 had extremely significant effects on the repose angle, M4M6, M4M7, M52, and M62 had significant effects on it, while M5M6, M5M7, and M6M7 had no significant influence on the repose angle. The regression model of fitting of the repose angle showed that the results were significant and fitted well with the model. The coefficient of determination R2 of the regression equation, revised coefficient, and variation coefficient were 0.9487, 0.8973, and 1.07%, respectively.

3.5. Interactive Effects Analysis of Regression Model

According to the results of the variance analysis (Table 8), the interaction terms M4M6 and M4M7 had a significant impact on the repose angle (p < 0.05). The response surfaces of interactions between M4M6 and M4M7 were drawn by using parameters other than the fixed interaction terms at the central level (Figure 9). The effect of interaction between these parameters is intuitively clear from it. When M5 and M7 were at the central level, the repose angle gradually increased with M4 and M6. When M5 and M6 were centered horizontally, the repose angle gradually increased with M4 and M7.

3.6. Parameter Optimization and Verification Test

To obtain the optimal combination of the test indices influencing oil peony seeds, the second-order regression model was optimized, and Equation (6) was obtained by eliminating the non-significant items in Equation (5). Following this, the objective function and the constraint function were established by using single-objective multi-parameter optimization based on the absolute minimum difference between simulated and measured repose angles as the final goal of optimization, as shown in Equation (7). The optimal parameter combination is as follows: M4, M5, M6, and M7 were 0.704, 0.324, 0.335, and 0.045, respectively. The mean values of the parameters that were not significant were utilized from the above tests (i.e., the Poisson’s ratio of seeds, the elastic modulus of seeds, seed–seed CRC, and seed–steel RFC was 0.30, 7.21 MPa, 0.70, and 0.053, respectively).
θ = 360.28 + 662.11 M 4 + 145.26 M 5 + 407.14 M 6 + 2234.79 M 7 285.71 M 4 M 6 1687.50 M 4 M 7      341.15 M 4 2 198.39 M 5 2 261.90 M 6 2 9583.33 M 7 2
min   | θ M 4 , M 5 , M 6 , M 7 30.3 | 0.67   M 4 0.75 0.29   M 5 0.375 0.32   M 6 0.39 0.4   M 7 0.6
The optimal parameter combination obtained above was simulated to verify its accuracy. The repose angles obtained in three repeated simulations were 30.1°, 30.5°, and 31°, with an average value of 30.5°. The error between the simulated (Figure 10b) and measured repose angles (Figure 10a) was only 0.67%, indicating that the parameters of the calibrated DEM were reliable.

4. Conclusions

In this paper, a DEM of oil peony seeds was developed, and the range of values of each of its parameters was obtained based on empirical measurements as well as the PB, SA, and BBD tests. The accuracy of the DEM was subsequently verified through verification tests. The following conclusions can be drawn:
(1)
The ranges of values of each parameter of oil peony seeds in measurements obtained in the test were as follows: The Poisson’s ratio was 0.21–0.42 (average, 0.3), elastic modulus was 6.1–13 MPa (average, 9.21 MPa), coefficient of recovery from seed–steel collision was 0.67–0.83 (average, 0.78), coefficient of static friction was 0.32–0.46 (average, 0.38), and coefficient of rolling friction was 0.04–0.07 (average, 0.053). The seed–seed recovery coefficient was 0.10–0.90 (average, 0.70), the coefficient of static friction was 0.29–0.46 (average, 0.36), and the coefficient of rolling friction was 0.04–0.08 (average 0.05);
(2)
The seed–steel CRC (M4), seed–seed SFC (M5), seed–steel SFC (M6), and seed–seed RFC (M7) significantly affect the repose angle of the oil peony seeds. The optimal parameter combination M4, M5, M6, and M7 was 0.704, 0.324, 0.335, and 0.045, respectively;
(3)
The results of tests to verify the optimum parameter combination yielded an error of only 0.67% between the simulated and the measured pose angles. This showed that values of the parameters of the proposed DEM of oil peony seeds were reliable, and that it can be used to simulate and optimize the design of the seed discharge device.

Author Contributions

Methodology, H.Z., K.L., Z.Q., S.W. and X.W.; software, H.Z., K.L. and Z.Q. Validation, H.Z., K.L. and Z.Q.; formal analysis, X.W., H.Z., S.W. and F.S.; investigation, H.Z., K.L., Z.Q. and S.W.; resources, X.W. and F.S.; data curation, H.Z., K.L. and Z.Q writing—original draft preparation, K.L. and Z.Q. Writing—review and editing, H.Z., S.W. and X.W.; visualization, H.Z. and K.L.; supervision, S.W. and X.W.; project administration, H.Z. and S.W.; funding acquisition, H.Z., X.W. and S.W. All authors have read and agreed to the published version of the manuscript.

Funding

Key Research and Development Project of Henan Province (grant number: 241111112700).

Institutional Review Board Statement

Not applicable.

Data Availability Statement

This article contains the data from this research report.

Conflicts of Interest

No conflicts of interest.

References

  1. Deng, R.; Gao, J.; Yi, J.; Liu, P. Peony seeds oil by-products: Chemistry and bioactivity. Ind. Crops Prod. 2022, 187, 115333. [Google Scholar] [CrossRef]
  2. Gao, L.-L.; Li, Y.-Q.; Wang, Z.-S.; Sun, G.-J.; Qi, X.-M.; Mo, H.-Z. Physicochemical characteristics and functionality of tree peony (Paeonia suffruticosa Andr.) seed protein. Food Chem. 2018, 240, 980–988. [Google Scholar] [CrossRef]
  3. Liu, P.; Zhang, Y.; Xu, Y.-F.; Zhu, X.-Y.; Xu, X.-F.; Chang, S.; Deng, R.-X. Three new monoterpene glycosides from oil peony seed cake. Ind. Crops Prod. 2018, 111, 371–378. [Google Scholar] [CrossRef]
  4. Su, J.; Ma, C.; Liu, C.; Gao, C.; Nie, R.; Wang, H. Hypolipidemic Activity of Peony Seed Oil Rich in α-Linolenic, is Mediated Through Inhibition of Lipogenesis and Upregulation of Fatty Acid β-Oxidation. J. Food Sci. 2016, 81, H1001–H1009. [Google Scholar] [CrossRef] [PubMed]
  5. Wang, H.; Xin, Y.; Ma, H.; Fang, P.; Li, C.; Wan, X.; He, Z.; Jia, J.; Ling, Z. Rapid detection of Chinese-specific peony seed oil by using confocal Raman spectroscopy and chemometrics. Food Chem. 2021, 362, 130041. [Google Scholar] [CrossRef]
  6. Wu, G.; Shen, Y.; Nie, R.; Li, P.; Jin, Q.; Zhang, H.; Wang, X. The bioactive compounds and cellular antioxidant activity of Herbaceous peony (Paeonia lactiflora Pall) seed oil from China. J. Food Sci. 2020, 85, 3815–3822. [Google Scholar] [CrossRef]
  7. Xiu, Y.; Wu, G.; Tang, W.; Peng, Z.; Bu, X.; Chao, L.; Yin, X.; Xiong, J.; Zhang, H.; Zhao, X.; et al. Oil biosynthesis and transcriptome profiles in developing endosperm and oil characteristic analyses in Paeonia ostii var. lishizhenii. J. Plant Physiol. 2018, 228, 121–133. [Google Scholar] [CrossRef]
  8. Liu, P.; Xu, Y.-F.; Gao, X.-D.; Zhu, X.-Y.; Du, M.-Z.; Wang, Y.-X.; Deng, R.-X.; Gao, J.-Y. Optimization of ultrasonic-assisted extraction of oil from the seed kernels and isolation of monoterpene glycosides from the oil residue of Paeonia lactiflora Pall. Ind. Crops Prod. 2017, 107, 260–270. [Google Scholar] [CrossRef]
  9. Aikins, K.A.; Ucgul, M.; Barr, J.B.; Awuah, E.; Antille, D.L.; Jensen, T.A.; Desbiolles, J.M.A. Review of Discrete Element Method Simulations of Soil Tillage and Furrow Opening. Agriculture 2023, 13, 541. [Google Scholar] [CrossRef]
  10. Chen, Z.; Yu, J.; Xue, D.; Wang, Y.; Zhang, Q.; Ren, L. An approach to and validation of maize-seed-assembly modelling based on the discrete element method. Powder Technol. 2018, 328, 167–183. [Google Scholar] [CrossRef]
  11. Cunha, R.N.; Santos, K.G.; Lima, R.N.; Duarte, C.R.; Barrozo, M.A.S. Repose angle of monoparticles and binary mixture: An experimental and simulation study. Powder Technol. 2016, 303, 203–211. [Google Scholar] [CrossRef]
  12. Li, G.; Li, H.; Li, X.; Gong, Z.; Yang, Q.; Huang, Y.; Fu, Z. Establishment and Calibration of Discrete Element Model for Buckwheat Seed Based on Static and Dynamic Verification Test. Agriculture 2023, 13, 1024. [Google Scholar] [CrossRef]
  13. Radvilaite, U.; Ramirez-Gomez, A.; Kacianauskas, R. Determining the shape of agricultural materials using spherical harmonics. Comput. Electron. Agric. 2016, 128, 160–171. [Google Scholar] [CrossRef]
  14. Zhou, L.; Yu, J.; Wang, Y.; Yan, D.; Yu, Y. A study on the modelling method of maize-seed particles based on the discrete element method. Powder Technol. 2020, 374, 353–376. [Google Scholar] [CrossRef]
  15. Bai, S.; Yuan, Y.; Niu, K.; Zhou, L.; Zhao, B.; Wei, L.; Liu, L.; Xiong, S.; Shi, Z.; Ma, Y.; et al. Simulation Parameter Calibration and Experimental Study of a Discrete Element Model of Cotton Precision Seed Metering. Agriculture 2022, 12, 870. [Google Scholar] [CrossRef]
  16. Zhong, J.-Q.; Tao, L.-M.; Li, S.-P.; Zhang, B.; Wang, J.-Y.; He, Y.-L. Determination and interpretation of parameters of double-bud sugarcane model based on discrete element. Comput. Electron. Agric. 2022, 203, 107428. [Google Scholar] [CrossRef]
  17. Wang, S.; Yu, Z.; Zhang, W.; Aorigele. Study on the modeling method of sunflower seed particles based on the discrete element method. Comput. Electron. Agric. 2022, 198, 107012. [Google Scholar] [CrossRef]
  18. Lu, C.; Gao, Z.; Li, H.; He, J.; Wang, Q.; Wei, X.; Wang, X.; Jiang, S.; Xu, J.; He, D.; et al. An ellipsoid modelling method for discrete element simulation of wheat seeds. Biosyst. Eng. 2023, 226, 1–15. [Google Scholar] [CrossRef]
  19. Hu, M.; Xia, J.; Zhou, Y.; Luo, C.; Zhou, M.; Liu, Z. Measurement and Calibration of the Discrete Element Parameters of Coated Delinted Cotton Seeds. Agriculture 2022, 12, 286. [Google Scholar] [CrossRef]
  20. Zhang, W.; Wang, F. Parameter calibration of American ginseng seeds for discrete element simulation. Int. J. Agric. Biol. Eng. 2022, 15, 16–22. [Google Scholar] [CrossRef]
  21. Yan, D.; Yu, J.; Wang, Y.; Zhou, L.; Sun, K.; Tian, Y. A Review of the Application of Discrete Element Method in Agricultural Engineering: A Case Study of Soybean. Processes 2022, 10, 1305. [Google Scholar] [CrossRef]
  22. Yan, D.; Yu, J.; Wang, Y.; Sun, K.; Zhou, L.; Tian, Y.; Zhang, N. Measurement and Calibration of DEM Parameters of Soybean Seed Particles. Agriculture 2022, 12, 1825. [Google Scholar] [CrossRef]
  23. Zheng, J.; Wang, L.; Wang, X.; Shi, Y.; Yang, Z. Parameter Calibration of Cabbages (Brassica oleracea L.) Based on the Discrete Element Method. Agriculture 2023, 13, 555. [Google Scholar] [CrossRef]
  24. Fu, H.; Yang, J.; Du, W.; Wang, W.; Liu, G.; Yang, Z. Determination of coefficient of restitution of fresh market apples caused by fruit-to-fruit collisions with a sliding method. Biosyst. Eng. 2022, 224, 183–196. [Google Scholar] [CrossRef]
  25. Zhou, B.; Zuo, Y.; Hou, L. Parameter Calibration of Xinjiang Paperbark Walnut Kernels by Discrete Element Simulation. Agriculture 2023, 13, 353. [Google Scholar] [CrossRef]
  26. Zhang, S.; Fu, J.; Zhang, R.; Zhang, Y.; Yuan, H. Experimental Study on the Mechanical Properties of Friction, Collision and Compression of Tiger Nut Tubers. Agriculture 2022, 12, 65. [Google Scholar] [CrossRef]
  27. Li, X.; Zhang, W.; Xu, S.; Ma, F.; Du, Z.; Ma, Y.; Liu, J. Calibration of Collision Recovery Coefficient of Corn Seeds Based on High-Speed Photography and Sound Waveform Analysis. Agriculture 2023, 13, 1677. [Google Scholar] [CrossRef]
  28. Liu, Y.; Mi, G.; Zhang, S.; Li, P.; Huang, Y. Determination of Discrete Element Modelling Parameters of Adzuki Bean Seeds. Agriculture 2022, 12, 626. [Google Scholar] [CrossRef]
  29. Li, H.; Zeng, R.; Niu, Z.; Zhang, J. A Calibration Method for Contact Parameters of Maize Kernels Based on the Discrete Element Method. Agriculture 2022, 12, 664. [Google Scholar] [CrossRef]
  30. Jiang, D.; Chen, X.; Yan, L.; Gou, H.; Yang, J.; Li, Y. Parameter Calibration of Discrete Element Model for Cotton Rootstalk-Soil Mixture at Harvest Stage in Xinjiang Cotton Field. Agriculture 2023, 13, 1344. [Google Scholar] [CrossRef]
Figure 1. Schematic diagram of three-dimensional sizes.
Agriculture 14 01092 g001
Figure 2. Compression test of oil peony seeds.
Agriculture 14 01092 g002
Figure 3. Determination of the friction coefficient. (a) Schematic diagram of the device used to measure the friction coefficient. (b) Photograph of the device. (c) Seed board.
Agriculture 14 01092 g003
Figure 4. Schematic diagram of recovery coefficient test principle.
Agriculture 14 01092 g004
Figure 5. Determination of the repose angle. (a) Test principle. (b) Actual test.
Agriculture 14 01092 g005
Figure 6. Measurement of the repose angle and image processing: (a) Photograph of seed pile; (b) binaries image; (c) curve fitted to a model.
Agriculture 14 01092 g006
Figure 7. The three-dimensional model used for simulations of the seed particles. (a) Flat oil peony seeds. (b) Ellipsoidal oil peony seeds.
Agriculture 14 01092 g007
Figure 8. The simulation process of the angle repose.
Agriculture 14 01092 g008
Figure 9. Response surface of the interaction between factors on the repose angle: (a) M4M6 interaction; (b) M4M7 interaction.
Agriculture 14 01092 g009
Figure 10. Test results: (a) Measured repose angle. (b) Simulated repose angle.
Agriculture 14 01092 g010
Table 1. Related parameters of oil peony seeds.
ParametersUnitValue
3D sizes of seed (H × B × T)mm8.92 × 7.15 × 6.22
Weight of seedg0.198
Volume of seedcm30.201
Poisson’s ratio of seed 0.3
Elastic modulus of seedMPa9.21 × 106
Seed–seed CRC 0.7
Seed–steel CRC 0.78
Seed–seed SFC 0.36
Seed–steel SFC 0.38
Seed–seed RFC 0.05
Seed–steel RFC 0.053
Repose Angle°30.3
Table 2. Parameters of PB test.
SymbolParametersUnitLow Level
(−1)
High Level
(+1)
M1Poisson’s ratio of seed 0.210.42
M2Elastic modulus of seedMPa6.1013.00
M3Seed–seed CRC 0.100.90
M4Seed–steel CRC 0.670.83
M5Seed–seed SFC 0.290.46
M6Seed–steel SFC 0.320.46
M7Seed–seed RFC 0.040.08
M8Seed–steel RFC 0.040.07
Table 3. Design and results of PB test.
No.M1M2M3M4M5M6M7M8Repose
Angle θ/°
10.2113.000.900.670.460.460.080.0437.6°
20.426.100.100.670.460.320.080.0737.1°
30.4213.000.100.830.460.460.040.0432.9°
40.426.100.900.830.460.320.040.0429.8°
50.216.100.100.830.290.460.080.0433.2°
60.4213.000.900.670.290.320.080.0434.2°
70.2113.000.900.830.290.320.040.0727.9°
80.2113.000.100.830.460.320.080.0734.5°
90.4213.000.100.670.290.460.040.0734.1°
100.216.100.900.670.460.460.040.0733.6°
110.426.100.900.830.290.460.080.0732.3°
120.216.100.100.670.290.320.040.0427.7°
Table 4. Analysis of the significance of parameters according to the PB test.
ParameterEffectSum of SquaresContribution/%p-ValueSignificance
M10.982.902.690.2205
M21.254.694.340.1447
M3−0.681.401.300.3622
M4−2.2815.6414.480.0372*
M52.6821.6020.000.0245*
M62.0813.0212.060.0468*
M73.8243.7040.460.0093**
M80.681.401.300.3622
Influence from low to high: *, **.
Table 5. Design and results of the SA test.
No.M4M5M6M7Repose Angle θ/°
10.670.290.320.0428.7°
20.710.33250.3550.0531.2°
30.750.3750.390.0634.5°
40.790.41750.4250.0736.3°
50.830.460.460.0838.1°
Table 6. Test factor codes for the BBD test.
CodesFactors
M4M5M6M7
−10.670.290.320.04
00.710.33250.3550.05
10.750.3750.390.06
Table 7. Design and results of BBD test.
No.M4M5M6M7Repose Angle (°)/θ
10.670.290.3550.0531°
20.750.290.3550.0529.9°
30.670.3750.3550.0531.4°
40.750.3750.3550.0530.7°
50.710.33250.320.0428.8°
60.710.33250.390.0430.8°
70.710.33250.320.0630.5°
80.710.33250.390.0631.4°
90.670.33250.3550.0428.8°
100.750.33250.3550.0429.7°
110.670.33250.3550.0631.7°
120.750.33250.3550.0629.9°
130.710.290.320.0529.5°
140.710.3750.320.0530.9°
150.710.290.390.0530.4°
160.710.3750.390.0532.6°
170.670.33250.320.0530.1°
180.750.33250.320.0530.3°
190.670.33250.390.0532°
200.750.33250.390.0530.6°
210.710.290.3550.0429.1°
220.710.3750.3550.0429.5°
230.710.290.3550.0630.5°
240.710.3750.3550.0632.1°
250.710.33250.3550.0531.8°
260.710.33250.3550.0531.6°
270.710.33250.3550.0531.4°
280.710.33250.3550.0531.4°
290.710.33250.3550.0531.8°
Table 8. Variance analysis of the results of the BBD test.
SourceSum of SquaresdfMean SquareF-Valuep-ValueSignificance
Model27.73141.9818.48<0.0001**
M41.2711.2711.820.0040**
M53.8513.8535.94<0.0001**
M64.9414.9446.09<0.0001**
M77.3617.3668.69<0.0001**
M4M50.40010.4000.37310.5511
M4M60.640010.64005.970.0284*
M4M71.8211.8217.000.0010*
M5M60.160010.16001.490.2420
M5M70.360010.36003.360.0882
M6M70.302510.30252.820.1152
M421.9311.9318.030.0008**
M520.832910.83297.770.0145*
M620.667710.66776.230.0257*
M725.9615.9655.57<0.0001**
Residual1.50140.1072
Lack of fit1.34100.13413.350.1275
Pure error0.160040.0400
Sum29.2328
Influence from low to high: *, **.
Disclaimer/Publisher’s Note: The statements, opinions and data contained in all publications are solely those of the individual author(s) and contributor(s) and not of MDPI and/or the editor(s). MDPI and/or the editor(s) disclaim responsibility for any injury to people or property resulting from any ideas, methods, instructions or products referred to in the content.

