Article

Brewers’ Spent Grain as an Alternative Plant Protein Component of Honey Bee Feed

1
Department of Bees Breeding, Institute of Animal Husbandry and Breeding, Wroclaw University of Environmental and Life Sciences, 38C Chelmonskiego St., 51-630 Wroclaw, Poland
2
Department of Animal Nutrition and Feed Science, Wroclaw University of Environmental and Life Sciences, 51-630 Wroclaw, Poland
*
Author to whom correspondence should be addressed.
Agriculture 2024, 14(6), 929; https://doi.org/10.3390/agriculture14060929
Submission received: 17 May 2024 / Revised: 10 June 2024 / Accepted: 10 June 2024 / Published: 12 June 2024
(This article belongs to the Special Issue Practices and Strategies for Sustainable Apiculture and Pollinators)

Abstract

:
Bee organisms need nutrients to function properly. Deficiencies of any nutrients decrease the condition and shorten the lifespan of insects. Moreover, protein deficiency decreases honey bee queen productivity and increases aggression in bee colonies. All of these aspects affect the efficiency and the economic aspect of beekeeping production. Limited access to sustainable feed sources for bee colonies during the season forces beekeepers to search for new sources of nutrients, particularly protein. The aim of this study was to investigate the potential use of brewers’ spent grain, which is a by-product of beer production, as a source of protein additive in bees’ diet. Two types of brewers’ spent grain were examined: that from light beer and that from dark porter beer. The spent grains, especially porter spent grains, improved the hemolymph protein content compared to bees fed with sugar cake without additives. It did not fully correspond to the protein levels obtained from bees fed cake with the addition of pollen, but it may be a substitute. The studies showed that brewers’ spent grain has the potential to be used as an alternative plant protein component of honey bee feed.

1. Introduction

Honey bees (Apis mellifera carnica L.), like other animals, need carbohydrates as energy components, protein as building components, and regulating components such as vitamins, mineral salts, and fiber. Deficiency of any of the nutrients negatively affects the proper functioning of bee organisms [1,2].
In recent years, a very important topic in the beekeeping world has been the nutrition of honey bees, especially in the context of meeting their protein needs. Pollen is the main source of nutrients (especially proteins, amino acids, and lipids) for honey bees. In the absence of pollen, other protein sources are commonly used in the production system to alleviate the negative effects of protein deprivation on honey bees. Dietary protein is a key nutritional component affecting the physiological state of honey bees, their protein reserves [3], and the levels of protein in their hemolymph [4,5]. Worker honey bees are particularly sensitive to deficiencies of various nutrients, which manifest as a decrease in their condition and a shortening of their lifespans [6]. Another effect of protein deficiency is a decrease in queen honey bee productivity and increased aggression in bee colonies [7,8,9]. In addition, low-protein nutrition contributes to a reduction of the activity of the pharyngeal glands that produce royal jelly, which is necessary for brood rearing [6,10]. The low activity of these glands causes a reduction of brood rearing and a decrease in the number of bee colonies. The first symptoms of nutritional deficiencies in honey bee colonies are the removal of drone broods and a limit on the laying of eggs by the queen. As a consequence, the bee colony becomes weaker, which directly affects its efficiency and the economic aspect of beekeeping production [11,12].
Recent changes in weather conditions have contributed to the imposition of flowering dates for some plants. This results in the limited access to sustainable feed sources for bee colonies throughout the season [13]. This situation forces beekeepers to intervene. The best sources of protein for bee colonies are pollen and bee bread, but the sale of these products provides additional income for the beekeeper [10,14]. In addition, they are difficult to store because they tend to lose their nutritional value with time, and in spring, when a high demand for protein occurs, problems in bee colonies arise. Therefore, different recipes for alternative food for bees have been developed based on the composition of honey and pollen, acceptability, palatability, and the digestibility of nutrients. As alternative sources of protein for bees, among others, soybean meal, pea steep, rice bran, brewers’ yeast, guar meal, skimmed milk powder, powdered egg yolk, casein, and fish meal have been tested [4,15,16,17,18,19,20,21]. However, giving bees soy flour or protein substitutes based on animal protein is not very profitable. Therefore, the search for alternative sources of acceptable plant protein is very important.
Several basic parameters of honey bee hemolymph are used to determine the suitability of a given feed material as a potential pollen substitute. The concentration of glucose in the honey bee’s hemolymph is one of the basic parameters characterizing the degree of nutrition of its body. Worker bees can accumulate small amounts of simple sugars in their fat body or muscles. Therefore, bees need a continuous supply of sugar, which circulates with the hemolymph throughout the body [22,23,24,25]. Energy materials, apart from carbohydrates, are fats. In the honey bee, triglycerides and cholesterol are detected in the hemolymph, and their levels are altered when a high dose of fat is supplied with the diet [26] or the bee is exposed to various stress factors [27,28]. For the proper functioning of worker honey bees, they also need protein, especially during intensive brood rearing. Determining the level of proteins in honey bee hemolymph is a good method of assessing the quality of the protein diet used [5,29,30].
Currently used protein substitutes are expensive or unavailable in many regions of the world. By contrast, brewers’ spent grain is a low-cost by-product of the beer brewing industry, with global production estimated at over 36 million tonnes per year. As a relatively cheap material with high contents of protein and fibre, it has found use as an animal feed, especially for cattle, poultry, pigs, and lambs. It is even found in the human diet as an optional ingredient, among others, in bakery products and pasta [31,32]. The chemical composition of brewers’ spent grain makes it promising as a potential protein additive in the honey bee diet, but its use in beekeeping has not been previously investigated. The aim of the study was to evaluate the usefulness of brewers’ spent grains as a substitute for pollen in honey bee nutrition.

2. Material and Methods

2.1. Preparation of Bee Feed

In the presented manuscript, three types of plant raw materials were used as potential protein components of bee feed: P—bee pollen, as a natural protein source; and two types of brewers’ spent grain: BL—a by-product obtained from the production of barley light beer, and BD—a by-product obtained from the production of porter, a strong barley beer. Selected plant protein sources were added to bee feed in a share of 10% or 20%. The control group (C) consisted of bees fed with sugar cake without protein additives. The pollen used in the experiment contained the following pollen: rapeseed (Brassica napus L. var. napus)—70%; plum (Prunus domestica L.)—17%; hawthorn (Crataegus monogyna Jacq L.)—9%; and other—4%.
Fresh brewers’ spent grain was dried in a laboratory dryer—Memmert UF110 plus (Memmert GmbH & Co KG, Schwabach, Germany)—with forced air circulation at a temperature of 70 °C. Dried brewers’ spent grain and bee pollen were ground in a centrifugal mill—Retsch ZM 200 (Retsch GmbH, Haan, Germany)—using a mesh with a 0.5 mm sieve size.
To prepare experimental bee feed, each protein component (BL, BD, or P) was mixed with powdered sugar in a 1:9 weight ratio (10%) or a 2:8 ratio (20%) and a small amount of water (about 15 mL per 100 g of bee feed).

2.2. Proximate Analysis

Both in the raw protein material (BL, BD, and P) and experimental mixtures (BL10%, BD10%, P10%, BL20%, BD20%, and P20%), the nutritional composition was determined in accordance with standard analytical methodologies [33]. The proximate analysis of materials was performed for the following variables: dry matter (DM, weight method, AOAC: 934.01); true protein (TP), as the difference between the crude protein (CP) and the soluble non-protein nitrogen fraction (NPN), with the use of a FOSS Tecator 2300 Kjeltec Analyzer Unit (FOSS Tecator, Hoganas, AB, Sweden) (Kjeldahl method, AOAC: 984.13); ether extract (EE, Soxhlet method, AOAC: 920.39 A), with the use of a BUCHI Extraction System B-811 (BÜCHI, Flawil, Switzerland); crude fiber (CF, Hanneberg and Stohmann method, AOAC: 978.10); and hemicellulose and cellulose (AOAC: 973.18), with the use of an ANKOM Fiber Analyzer (ANKOM Technology, Macedon, NY, USA) [33].
Bomb calorimetry with an isothermal water jacket (KL-10, Precyzja, Bydgoszcz, Poland) was used to determine the gross energy of samples.
The amino acid (AA) profile was determined with the use of an Amino Acids Analyzer AAA 400 (INGOS, Prague, Czech Republic) according to standard protocol (AOAC: 994.12) [33]. Tryptophan was determined using a spectrophotometer 2000 RS (Aqualytic, Dortmund, Germany) at a wavelength of 590 nm (AOAC: 988.15) [33]. Essential amino acid index (EAAI) was used to determine the value of protein sources (brewers’ spent grains and pollen). EAAI was calculated using the amino acid composition of the whole chicken egg protein [34]. The equation of Mitchell and Block [1946] was used to calculate the EAAs.
In order to determine the usefulness of brewers’ spent grain in honey bee nutrition, cage tests were carried out. The experiment was carried out on worker honey bees (Apis mellifera) with the use of sugar cake with the addition of 10% and 20% of the brewers’ spent grain or pollen. The prepared bee feed mixtures were sealed in plastic string bags, and each of them was weighed for further comparison. Their weight at the beginning was 30 ± 5 g. Then, small holes were made to enable the bees to take food and the bags were placed in the experimental cages with the honey bees. The experimental cages were kept in an incubator at 25 (±1) °C and 80% humidity.

2.3. Bees

Queens originating from the same mother-queen colony were inseminated with the semen of drones from the same father-queen colony. Queens were placed in isolators for 2 days with empty combs (435 × 300 mm) for egg laying. After 20 days of brood development, the combs were transferred to an incubator (temperature 34.4 ± 0.5 °C, relative humidity of 70 ± 5%) for emergence of the worker bees without the presence of the adult bees. All combs were transported at the same time and placed in the same incubator. Food (honey and pollen) was provided ad libitum for the first 24 h after the bees emerged.

2.4. Cage Test

The bees at age 24 h were randomly placed in cages, with 100 ± 5 bees per cage. The experiment was repeated 3 times. In total, each group consisted of 3 cages, n = 300 bees. From the moment they were placed in the cages, the bees were fed with experimental food and had constant access to water. The experiment lasted 7 days. During this time, daily mortality was monitored and dead individuals were removed from cages every day. On the 7th day of the experiment, hemolymph was collected, and bags with uneaten experimental food were weighed.

2.5. Hemolymph Collecting and Analysis

Ninety bees from each group (30 per cage) were used for analysis of enzyme activity and the level of nourishment of organisms’ biochemical markers. The bees were randomly picked from each cage and the hemolymph was collected by removing the antennae of live bees using sterile tweezers [35]. The samples were collected in 20 µL glass capillaries (end-to-end without anticoagulant). The capillaries were placed in 2 mL Eppendorf tubes filled with 150 µL milli-Q water; each tube contained 5 capillaries. Collected samples were pooled. Approx. 4 bees were needed to completely fill one capillary with hemolymph. The test tubes were cooled during the procedure and then transferred to −80 °C.

2.6. Enzyme Activity Analysis

For the activity of AST—aspartate transaminase, ALT—alanine aminotransferase, and ALP—alkaline phosphatase, we used standard methods described below.
The reagent compositions for AST, ALT, and ALP were as follows: AST: 2-Ketoglutarate (13 mmol/L), L Aspartate (220 mmol/L), LDH (1200 U/L), MDH (90 U/L), NADH (10 mmol/L), Tris buffer (88 mmol/L), and EDTA (5.0 mmol/L), pH 8.1; ALT: 2-ketoglutarate (13 mmol/L), L-alanine (440 mmol/L), NADH (0.10 mmol/L), LDH (1800 U/L), Tris buffer (97 mmol/L), and EDTA (50 mmol/L), pH 7.8; ALP: 2-amino-2-methyl-1-propanol (900 mmol/L), magnesium acetate (1.6 mmol/L), zinc sulfate (0.4 mmol/L), and HEDTA (2.0 mmol/L). For AST and ALT activity measurement, 100 µL of appropriate reagent solution was mixed with 10 µL of the hemolymph, vortexed for 3–5 s, and heated at 37˚C for 30 s. The absorbance was measured at four time points (0, 1, 2, and 3 min) after incubation at 340 nm. For ALP activity measurement, 100 µL of the reagent was mixed with 2 µL of hemolymph, vortexed for 3–5 s, and heated at 37 °C for 60 s. Then, 20 µL of 4-NPP (16.0 mmol/L) was added, and the reaction solution was vortexed for 3–5 s and heated at 37 °C for 60 s. The absorbance was measured at four time points (0, 1, 2, and 3 min) after incubation at 405 nm.
GGTP—gamma-glutamyl transpeptidase activity was determined using an ABX Pentra GGT CP assay kit (HORIBA ABX Diagnostics, Montpellier, France), according to the manufacturer’s recommendation. 10 µL of hemolymph was used in each analysis.

2.7. Non-Enzymatic Concentration of Selected Biochemical Markers in Bees’ Hemolymph

The level of biochemical markers was measured using dedicated kits from HORIBA ABX Diagnostics, France. Values in parentheses indicate the volume of hemolymph taken for the given analysis. All analyses were performed according to manufacturer’s recommendations. For the albumin level, we used ABX Pentra Albumin CP (2 µL hemolymph per analysis). For the urea level, we used ABX Pentra Urea CP (3 µL hemolymph per analysis). For the total cholesterol level, we used ABX Pentra Total Cholesterol (3 µL hemolymph per analysis). For the total protein level, we used ABX Pentra Total Protein (2 µL hemolymph per analysis). The concentrations of triglycerides and glucose were measured with the colorimetric method using Cormay mono tests (Lublin, Poland), according to the manufacturer’s procedure.

2.8. Data Evaluation

The data distribution in each group was tested using the Shapiro–Wilk test. The statistical significance of data within and between groups was first determined by the non-parametric Kruskal–Wallis test with Holm correction for multiple comparison using the package “agricolae” for “kruskal” function. For survival analysis, package “survival” was used to conduct the log-rank test. For all tests, RStudio and a significance level of α = 0.05 were used.

3. Results

Figure 1 presents the chemical composition and energy values of the raw materials used for the production of the experimental cakes for bees. Brewers’ spent grain from porter beer had a lower content of protein compared to brewers’ spent grain from light beer and bee pollen. On the other hand, both brewers’ spent grains show higher contents of crude fiber, hemicellulose, and cellulose than bee pollen (Figure 1A–C). They also had more dry matter than pollen (Figure 1D). Brewers’ spent grain from porter beer had a lower value of gross energy than brewers’ spent grain from light beer (Figure 1E).
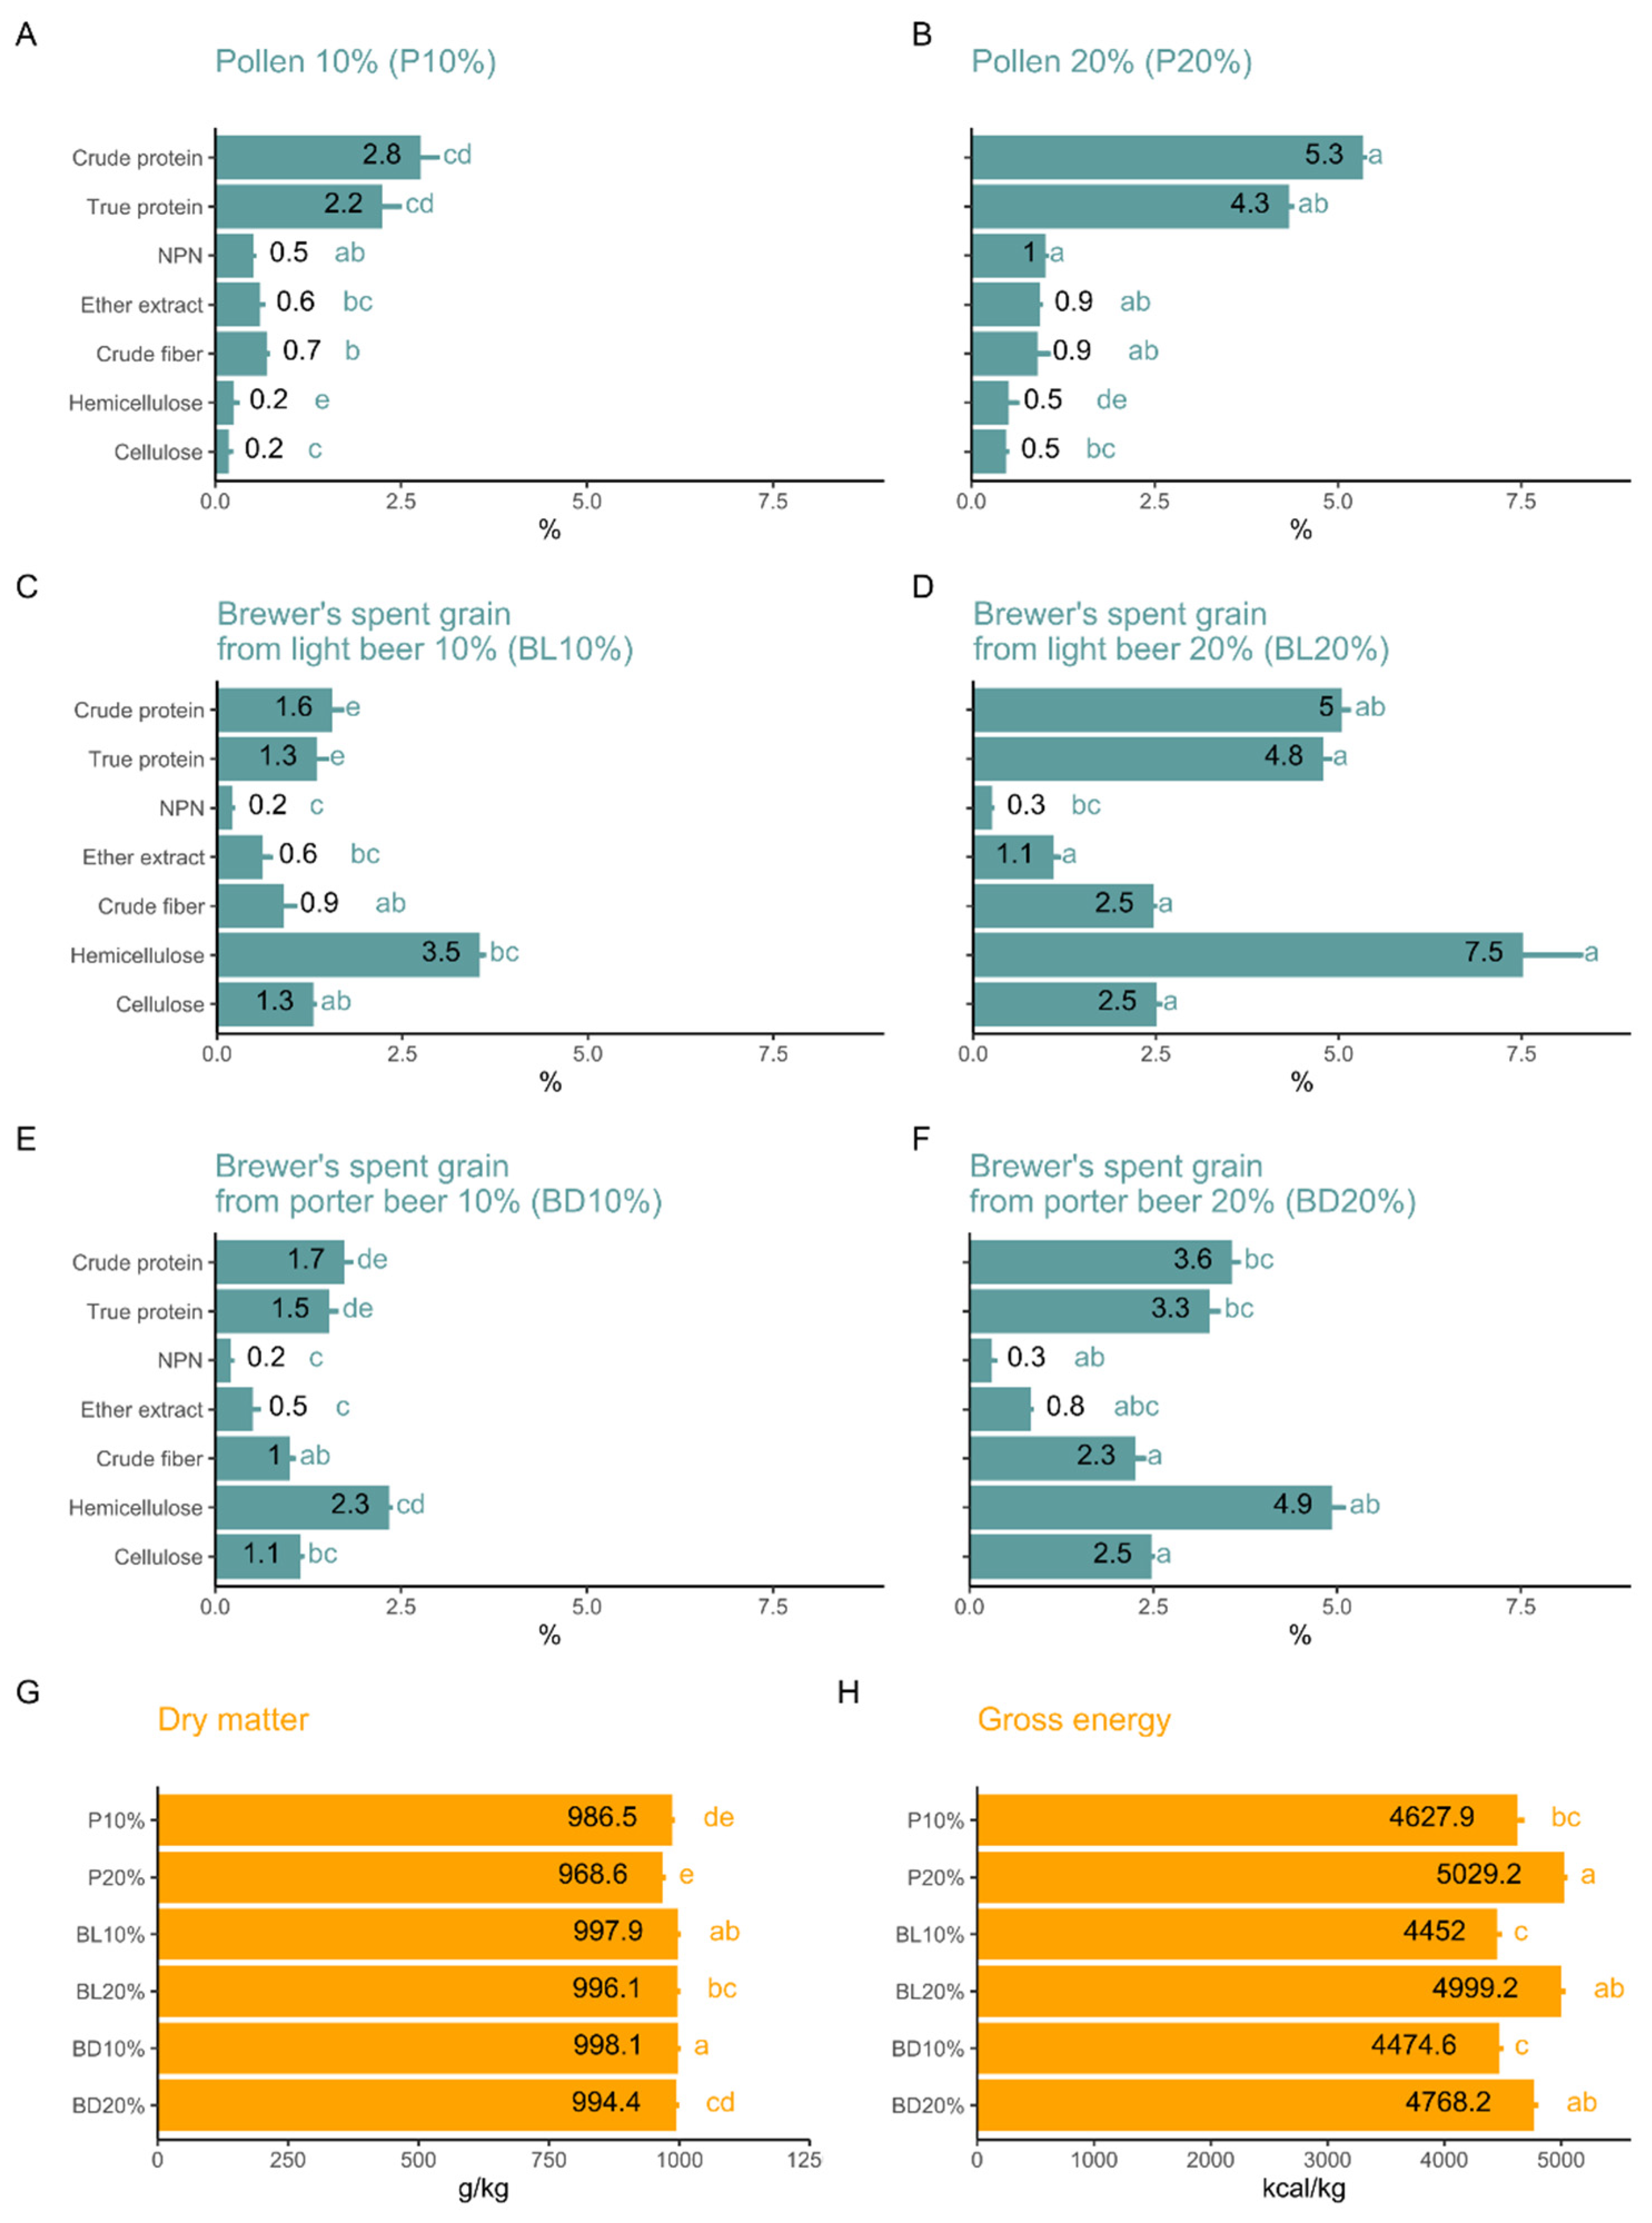
Figure 2 shows the chemical composition of the experimental cakes for bees. The Statistical differences between the experimental sugar cakes were found in all parameters of chemical composition. Experimental cakes with a 10% addition of brewers’ spent grain from light (BL10%) or porter beer (BD10%) did not differ statistically. It is interesting that the content of crude protein, true protein, NPN, and gross energy between cakes with 20% brewers’ spent grain from porter beer (BD20%) and with additives of 10% pollen (P10%) were not statistically different. Similarly, the concentration of crude protein and true protein, ether extract, and gross energy were not statistically different between BL20% and P20%. It suggests that the 20% of pollen in the cake for bees could be successfully replaced with a 20% addition of spent grain from light beer (BL20%).
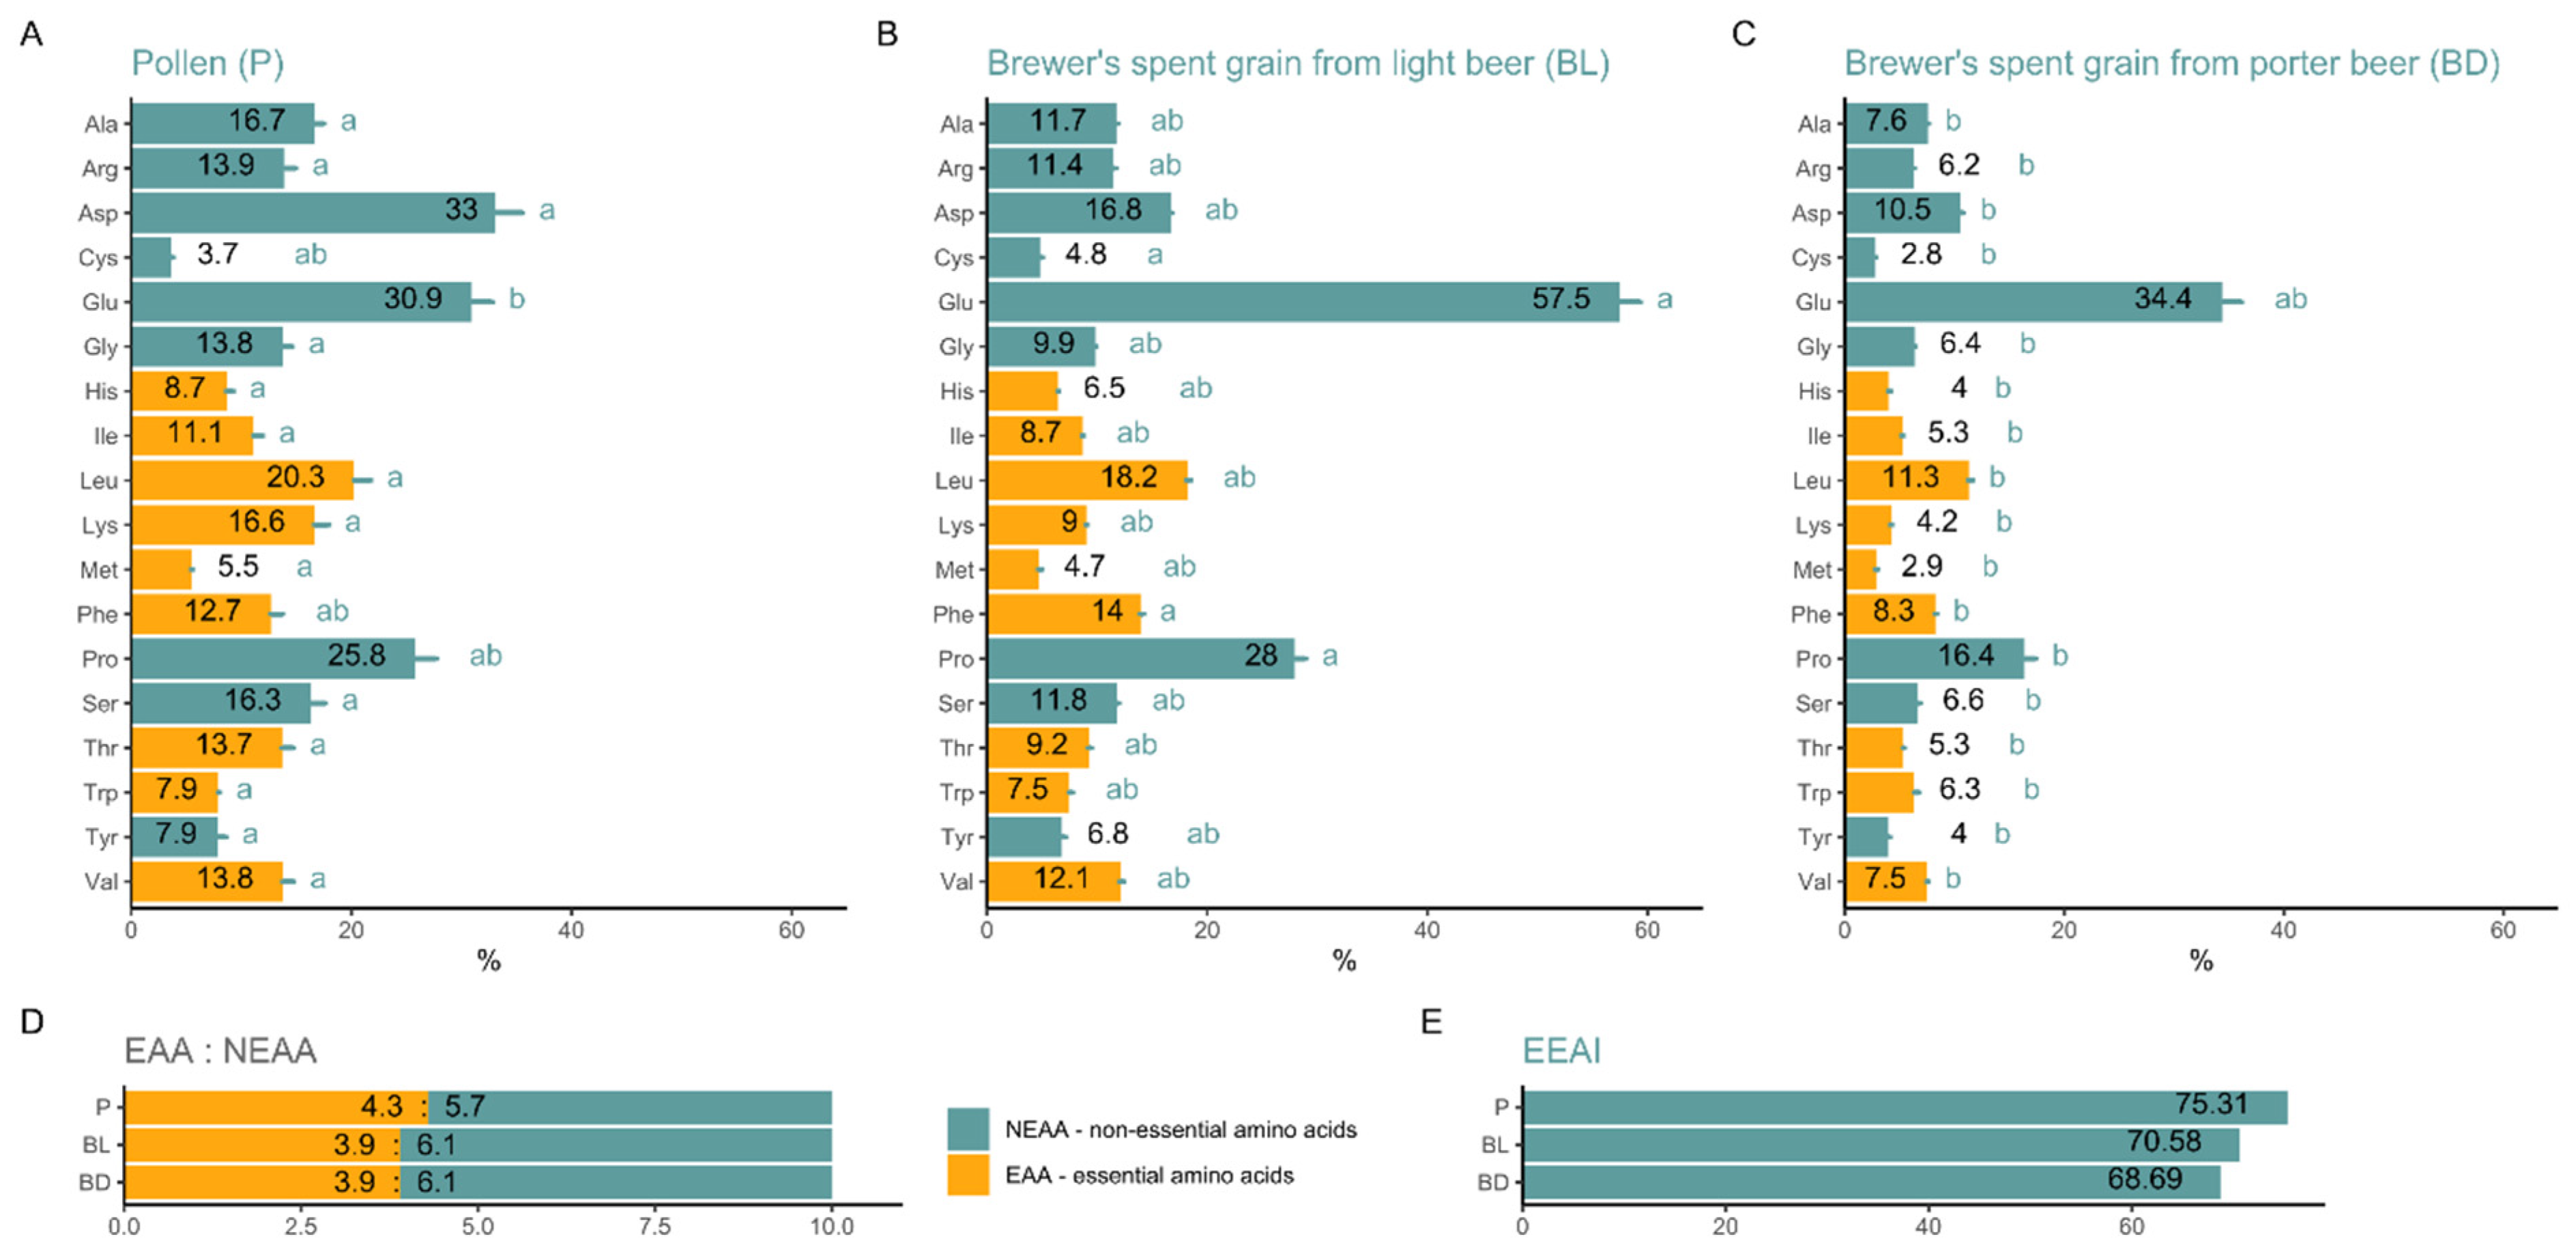
The results indicate different levels of amino acids in the tested raw materials. Despite the observed differences (Figure 3A–C), the essential amino acid index (EAAI) is very similar in all used protein sources (Figure 3E). Both brewers’ spent grains had a similar ratio of essential amino acids to non-essential amino acids (EAA:NEAA) (Figure 3D).
The statistically highest amount of bee sugar cake intake in total per cage was eaten by bees from the BD20%, P20%, and C groups, and the lowest weight of bee sugar cake was eaten by bees from the group P10% (Figure 4A). In terms of mean daily sugar intake per bee, which was calculated including data from mortality, the highest intake was observed in groups C, BD10%, and BD20%, while the lowest intake occurred in the BL20% group (Figure 4B).
The experimental diet had a significant impact on bee survival (Figure 5). Bees fed on a diet consisting of sugar cakes with 20% protein additives (groups: P20%, BL20%, and BD20%) had significantly higher survival compared to control. The highest mortality was observed in the P10% group. Interestingly, for every protein additive tested, groups with higher additive content (20%) had significantly higher survival compared to groups with lower content of protein additive (10%).
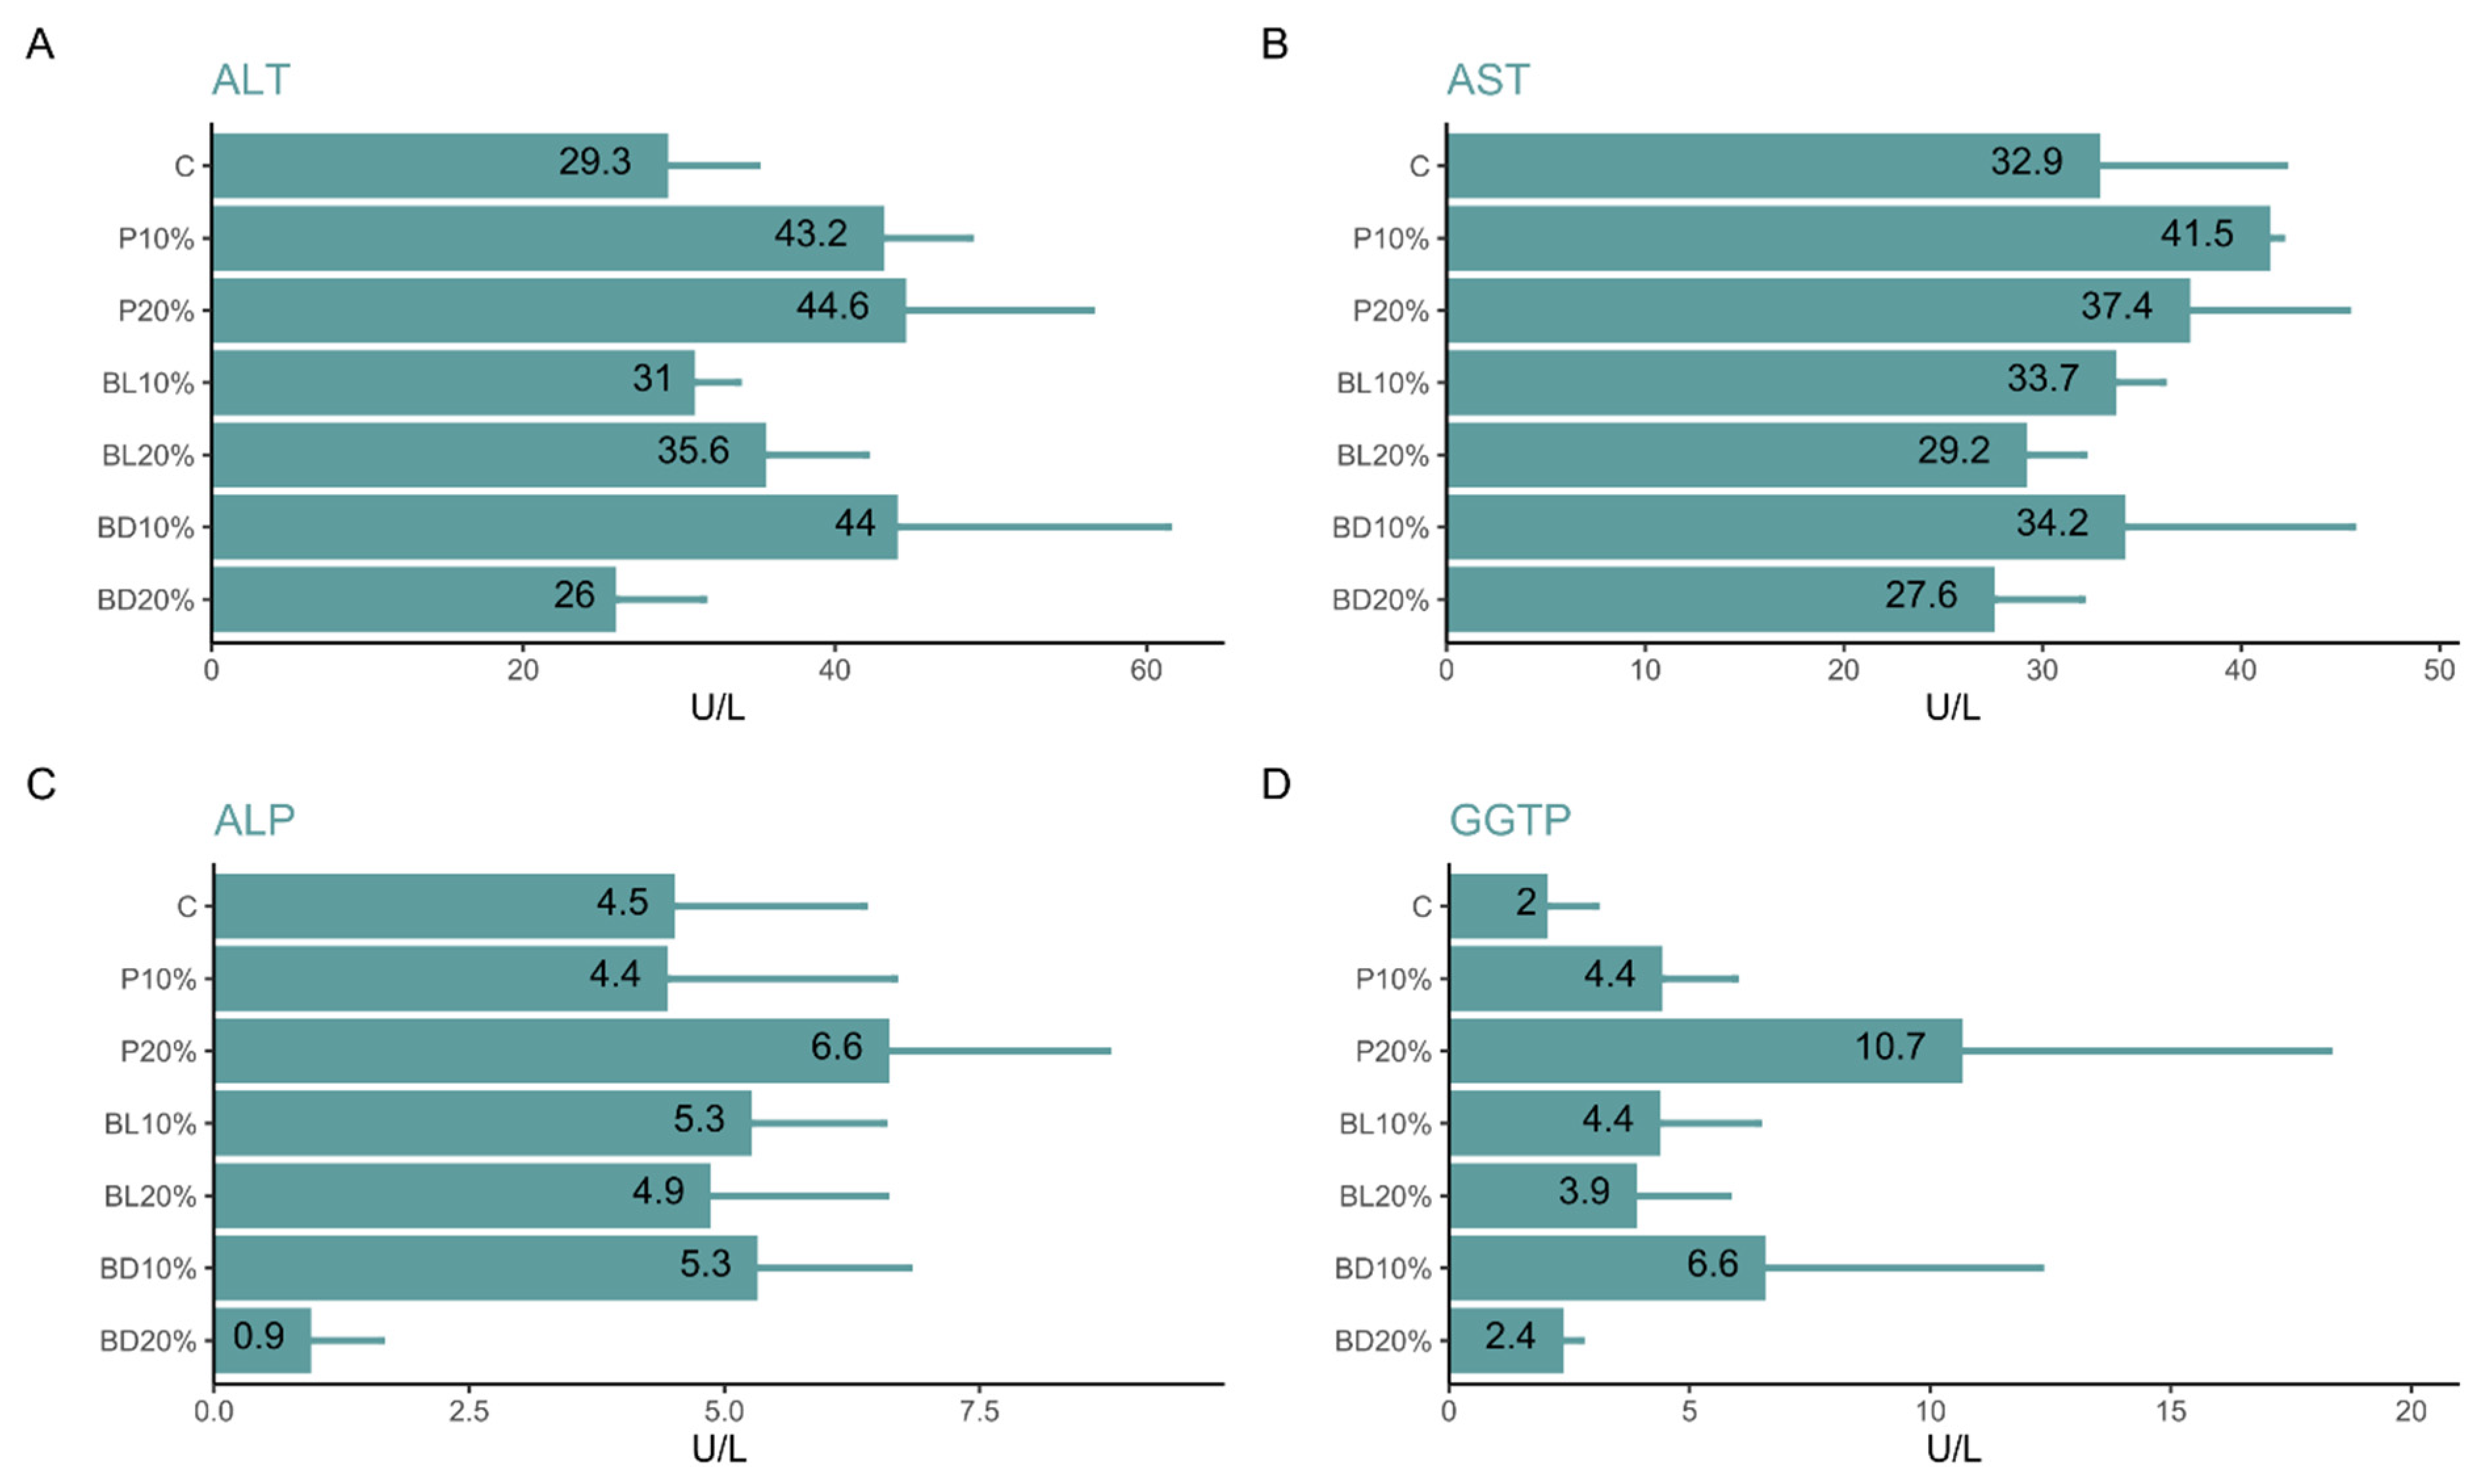
The enzyme activity in honey bee hemolymph is shown in Figure 6. BL10% and BD20% caused ALT activity on a similar level compared to control. In the case of BD, ALT activity depended on the concentration; BD10% showed much higher ALT activity compared to BD20%. High ALT activity was also observed in the P10% and P20% groups (Figure 6A). The lowest AST activity occurred in group BD20%, while the highest was observed in group P10% (Figure 6B). Group BD20% presented much lower ALP activity than all other groups. The value was more than four times lower than control and more than five times lower than the group with the diminished concentration of the same brewers’ spent grain—BD10%. The highest ALP activity was shown by group P20% (Figure 6C). All groups except BD20% presented higher activity of GTTP than the control. The highest value occurred in the P20% group—c.a. 5 times higher compared to the control (Figure 6D).
The levels of selected components in honey bee hemolymph are presented in Figure 7. Cholesterol concentration was the lowest in the BD20% group. The highest value was observed in the P20% group, while other groups had similar cholesterol levels as the control (Figure 7A). All groups had lower levels of triglycerides than the control, but the difference was most visible in the BD20% group, with the c.a. 2 times lower value (Figure 7B). Total protein concentration statistically significantly higher than control was presented by group P10%, while high values also occurred in groups P20% and BD10%. The BD20% group showed much lower total protein level than the BD10% group (Figure 7C). The highest, outstanding glucose concentration was observed in the BL10% group. All other groups had a lower concentration of glucose than control (Figure 7D). The level of urea seems to be higher in groups with higher amounts of protein additives (20%) than groups with lower amounts of them (10%). The most visible difference is in the case of BD, as the lowest level of urea reached the BD10% group, while the highest value was presented by group BD20% (Figure 7E). The highest levels of albumin were shown by groups P20% (c.a. 2 times higher than the control), BL10%, and P10%.

4. Discussion

In the presented study, the highest value of hemolymph protein was noted in the group with a natural source of protein—pollen (P10% and P20%)—and in BD10%. The high value of hemolymph protein in BD10% bees is connected with the value of hemolymph urea, which was considerably lower in BD10% compared to other experimental groups (including control). This was caused by low levels of NPN in the BD10% diet. This is also confirmed by the lowest content of aspartate and arginine in this material because these two amino acids are involved in the urea cycle [36]. An increase in the concentration of urea is observed in bees after contact with a stress factor, such as some toxins, and also diet supplementation [37,38,39]. A similar connection was expected in the BL10% group. However, it was not confirmed statistically. An additional confirmation of the relationship between the protein additives used and the level of protein in honey bees’ hemolymph is the amino acid composition of the tested materials. The brewers’ spent grain has a very similar amino acid composition to pollen. This is particularly evident when considering the index of essential amino acids (EAAI). This proves that the biological value of the protein contained in the protein supplements used is close to that of flower pollen. The confirmation of the nutritional value of different proteins varies and is governed by amino acid composition, ratios of essential amino acids, susceptibility to hydrolysis during digestion, source, and the effects of processing [40].
We found that a high level of hemolymph protein was connected with a higher value of cholesterol hemolymph (P10%, P20%, and BD10%). All these groups were characterized by a lower level of crude fiber in the diet, which suggests that the concentration of fiber in the diet regulates the protein-fat metabolism of the honey bee. A study by Jouni et al. (2002) also showed a relationship between the supply of cholesterol in food and the change in its concentration in the hemolymph of the tobacco hornworm (Manduca sexta L.) [41].
The basic biomarkers informing us about the detoxification state of honey bees are AST, ALT, and ALP. The high activities of these compounds in female honey bees signal their good condition, vitality, and immunity [42,43]. The highest levels of ALT were observed in the hemolymph of bees that received the BD10%, P10%, and P20% diets, and the highest levels of AST were observed in bees that received P10%. This suggests that a 10% addition of spent grains from porter production is a good replacement for a natural pollen-containing diet. On the other hand, the compound activities decreased in reaction to harmful factors, e.g., antibiotics, acaricides, Varroa destructor, pesticides, furfural, or 5-hydroxymethylfurfural [42,44]. Moreover, low activities of the enzymes in bees may cause changes in many metabolic cycles, such as the Krebs cycle, ATP synthesis, oxidative phosphorylation, and β-oxidation [39]. In the present study, the lowest level of these biomarkers was observed in the hemolymph of bees that received the BD20% diet. It may be caused by a higher concentration of hydroxymethylfurfural (HMF) in porter brewers’ spent grain. HMF is a chemical compound that is formed from carbohydrates under thermal or acid-catalyzed degradation conditions [45]. As reported by Hellwig and Henle (2020), the summed molar concentrations of the HMF precursors strongly predominate in roasted malts, such as darkly roasted chocolate malt, which is used in porter beer production. In the laboratory research, negative effects were observed after 15 to 30 days of exposure to HMF on bees; this caused an increase in the mortality of honey bee workers, and midgut cells died [44,46,47]. In our research, we saw changes in the detoxification activity of enzymes, especially in BD20%, which can prove HMF’s impact on honey bee organisms.

5. Conclusions

The search for alternative sources of protein in the diet of bees is a topical issue because deficiencies of this ingredient can weaken the bee colony. The spent grains, especially porter spent grains, improved the hemolymph protein content compared to bees fed with sugar cake without additives. It did not fully correspond to the protein levels obtained from bees fed cake with the addition of pollen, but it may be a substitute. Research into the possibilities of using different spent grains should continue, as our initial laboratory results are very promising. It would be particularly important to conduct field studies on bee colonies.

Author Contributions

P.M., E.B., N.B. and M.W. conceived this research and designed experiments; P.M. and M.W. participated in the design and interpretation of the data; P.M., E.B., N.B. and M.W. performed experiments and analysis. All authors have read and agreed to the published version of the manuscript.

Funding

This work was co-financed by the Department of Bees Breeding, Institute of Animal Husbandry and Breeding, project number B010/0002/24.

Institutional Review Board Statement

Not applicable.

Data Availability Statement

Data will be made available on reasonable request.

Conflicts of Interest

The authors declare that they have no conflicts of interest.

References

  1. Brodschneider, R.; Crailsheim, K. Nutrition and health in honey bees. Apidologie 2010, 41, 278–294. [Google Scholar] [CrossRef]
  2. Haydak, M.H. Honey Bee Nutrition. Annu. Rev. Entomol. 1970, 15, 143–156. [Google Scholar] [CrossRef]
  3. Basualdo, M.; Barragán, S.; Vanagas, L.; García, C.; Solana, H.; Rodríguez, E.; Bedascarrasbure, E. Conversion of high and low pollen protein diets into protein in worker honey bees (Apis mellifera L.). J. Econom. Entomol. 2013, 106, 1553–1558. [Google Scholar] [CrossRef] [PubMed]
  4. Morais, M.M.; Turcatto, A.P.; Francoy, T.M.; Gonçalves, L.S.; Cappelari, F.A.; De Jong, D. Evaluation of inexpensive pollen substitute diets through quantification of haemolymph proteins. J. Apic. Res. 2013, 52, 119–121. [Google Scholar] [CrossRef]
  5. De Jong, D.; da Silva, E.J.; Kevan, P.G.; Atkinson, J.L. Pollen substitutes increase honey bee haemolymph protein levels as much as or more than does pollen. J. Apic. Res. 2009, 48, 34–37. [Google Scholar] [CrossRef]
  6. Alqarni, A.S. Influence of some protein diets on the longevity and some physiological conditions of honeybee Apis mellifera L. workers. J. Biol. Sci. 2006, 6, 734–737. [Google Scholar] [CrossRef]
  7. Schmickl, T.; Crailsheim, K. How honeybees (Apis mellifera L.) change their broodcare behaviour in response to non-foraging conditions and poor pollen conditions. Behav. Ecol. Sociobiol. 2002, 51, 415–425. [Google Scholar] [CrossRef]
  8. Walton, A.; Dolezal, A.G.; Bakken, M.A.; Toth, A.L. Hungry for the queen: Honeybee nutritional environment affects worker pheromone response in a life stage-dependent manner. Funct. Ecol. 2018, 32, 2699–2706. [Google Scholar] [CrossRef]
  9. Wright, G.A.; Lillvis, J.L.; Bray, H.J.; Mustard, J.A. Physiological State Influences the Social Interactions of Two Honeybee Nest Mates. PLoS ONE 2012, 7, e32677. [Google Scholar] [CrossRef]
  10. Ellis, A.M.; Hayes, G.W., Jr. An evaluation of fresh versus fermented diets for honey bees (Apis mellifera). J. Apic. Res. 2009, 48, 215–216. [Google Scholar] [CrossRef]
  11. Schmickl, T.; Crailsheim, K. Cannibalism and early capping: Strategy of honeybee colonies in times of experimental pollen shortages. J. Comp. Physiol. A 2001, 187, 541–547. [Google Scholar] [CrossRef] [PubMed]
  12. Schmickl, T.; Crailsheim, K. Inner nest homeostasis in a changing environment with special emphasis on honey bee brood nursing and pollen supply. Apidologie 2004, 35, 249–263. [Google Scholar] [CrossRef]
  13. Prevéy, J.S. Climate change: Flowering time may be shifting in surprising ways. Curr. Biol. 2020, 30, R112–R114. [Google Scholar] [CrossRef] [PubMed]
  14. Vásquez, A.; Olofsson, T.C. The lactic acid bacteria involved in the production of bee pollen and bee bread. J. Apic. Res. 2009, 48, 189–195. [Google Scholar] [CrossRef]
  15. Abd El-Wahab, T.E.; Ghania, A.M.M.; Zidan, E.W. Assessment a new pollen supplement diet for honey bee colonies and their effects on some biological activities. Int. J. Agric. Technol. 2016, 12, 55–62. [Google Scholar]
  16. Dastouri, M.R.; Maheri-Sis, N.; Aghajanzadeh-Golshani, A.; Ebrahim-Nezhad, Y. The effect of replacement feeding of some protein sources with pollen on honey bee population and colony performance. J. Anim. Vet. Adv. 2007, 6, 1258–1261. [Google Scholar]
  17. Dodologlu, A.; Emsen, B. Effect of supplementary feeding on honey bee colony. J. Appl. Anim. Res. 2007, 32, 199–200. [Google Scholar] [CrossRef]
  18. Irandoust, H.; Ebadi, R. Nutritional effects of high protein feed on growth, development, Performance and overwintering of honey bee (Apis mellifera L.). Int. J. Adv. Biol. Biomed. Res. 2013, 1, 601–613. [Google Scholar]
  19. Kumari, I.; Kumar, R. Pollen Substitute Diet for Apis mellifera: Consumption and Effects on Colony Parameters in Sub-Tropical Himalaya. Indian J. Agric. Res. 2020, 54, 147–153. [Google Scholar] [CrossRef]
  20. Paray, B.A.; Kumari, I.; Hajam, Y.A.; Sharma, B.; Kumar, R.; Albeshr, M.F.; Farah, M.A.; Khan, J.M. Honeybee nutrition and pollen substitutes: A review. Saudi J. Biol. Sci. 2021, 28, 1167–1176. [Google Scholar] [CrossRef]
  21. Sihag, R.C.; Gupta, M. Development of an artificial pollen substitute/supplement diet to help tide the colonies of honeybee (Apis mellifera L.) over the dearth season. J. Apic. Sci. 2011, 55, 15–28. [Google Scholar]
  22. Blatt, J.; Roces, F. Haemolymph sugar levels in foraging honeybees (Apis mellifera carnica): Dependence on metabolic rate and in vivo measurement of maximal rates of trehalose synthesis. J. Exp. Biol. 2001, 204 Pt 15, 2709–2716. [Google Scholar] [CrossRef] [PubMed]
  23. Crailsheim, K. Intestinal transport of sugars in the honeybee (Apis mellifera L.). J. Insect Physiol. 1988, 34, 839–845. [Google Scholar] [CrossRef]
  24. Guler, A.; Ekinci, D.; Biyik, S.; Garipoglu, A.V.; Onder, H.; Kocaokutgen, H. Effects of Feeding Honey Bees (Hymenoptera: Apidae) With Industrial Sugars Produced by Plants Using Different Photosynthetic Cycles (Carbon C3 and C4) on the Colony Wintering Ability, Lifespan, and Forage Behavior. J. Econ. Entomol. 2018, 111, 2003–2010. [Google Scholar] [CrossRef] [PubMed]
  25. Sacktor, B. Regulation of intermediary metabolism, with special reference to the control mechanisms in insect flight muscle. Adv. Insect Physiol. 1970, 7, 267–347. [Google Scholar] [CrossRef]
  26. Wang, X.; Zhong, Z.; Chen, X.; Hong, Z.; Lin, W.; Mu, X.; Hu, X.; Zheng, H. High-Fat Diets with Differential Fatty Acids Induce Obesity and Perturb Gut Microbiota in Honey Bee. Int. J. Mol. Sci. 2021, 22, 834. [Google Scholar] [CrossRef] [PubMed]
  27. Bajda, M.; Łoś, A.; Merska, M. Effect of amphotericin B on the biochemical markers in the haemolymph of honey bees. Med. Weter. 2014, 70, 766–769. [Google Scholar]
  28. Migdał, P.; Murawska, A.; Bieńkowski, P.; Strachecka, A.; Roman, A. Effect of E-field at frequency 50 Hz on protein, glucose, and triglycerides concentration in honeybee hemolymph. Eur. Zool. J. 2021, 88, 1170–1176. [Google Scholar] [CrossRef]
  29. Chang, H.; Ding, G.; Jia, G.; Feng, M.; Huang, J. Hemolymph Metabolism Analysis of Honey Bee (Apis mellifera L.) Response to Different Bee Pollens. Insects 2023, 14, 37. [Google Scholar] [CrossRef]
  30. Cremonz, T.M.; De Jong, D.; Bitondi, M.M.G. Quantification of Hemolymph Proteins as a Fast Method for Testing Protein Diets for Honey Bees (Hymenoptera: Apidae). J. Econom. Entomol. 1998, 91, 1284–1289. [Google Scholar] [CrossRef]
  31. Mussatto, S.I. Brewer’s spent grain: A valuable feedstock for industrial applications. J. Sci. Food Agric. 2014, 94, 1264–1275. [Google Scholar] [CrossRef] [PubMed]
  32. Zeko-Pivač, A.; Tišma, M.; Žnidaršič-Plazl, P.; Kulisic, B.; Sakellaris, G.; Hao, J.; Planinić, M. The Potential of Brewer’s Spent Grain in the Circular Bioeconomy: State of the Art and Future Perspectives. Front. Bioeng. Biotechnol. 2022, 10, 870744. [Google Scholar] [CrossRef] [PubMed]
  33. AOAC International. Official Methods of Analysis of AOAC, 18th ed.; 4th Revision; AOAC: Gaithersburg, MD, USA, 2011. [Google Scholar]
  34. Oser, B.L. An Integrated Essential Amino Acid Index for Predicting the Biological Value of Proteins. In Amino Acid Nutrition; Albanese, A.A., Ed.; Academic Press: New York, NY, USA, 1959; pp. 295–311. [Google Scholar]
  35. Migdał, P.; Murawska, A.; Roman, A. A Modified Standardized Method to Extract and Store Insect Hemolymph with Use of a Glass Capillary. J. Apic. Sci. 2020, 64, 165–168. [Google Scholar] [CrossRef]
  36. Ghosh, S.; Meyer-Rochow, V.B.; Jung, C. Honey bees and their brood: A potentially valuable resource of food, worthy of greater appreciation and scientific attention. J. Ecol. Environ. 2021, 45, 31. [Google Scholar] [CrossRef]
  37. Migdał, P.; Murawska, A.; Berbeć, E.; Plotnik, M.; Skorus, A.; Latarowski, K. Selected Biochemical Markers Change after Oral Administration of Pesticide Mixtures in Honey Bees. Toxics 2022, 10, 590. [Google Scholar] [CrossRef] [PubMed]
  38. Şapcaliu, A.; Pavel, C.; Savu, V.; Cãuia, E.; Matei, M.; Rãdoi, I. Biochemical and cytological investigations on haemolymph of Apis mellifera carpathica bee in stressful conditions. Bull. Univ. Agric. Sci. Vet. Med. Cluj. Napoca. 2010, 67, 313–320. [Google Scholar]
  39. Skowronek, P.; Wójcik, Ł.; Strachecka, A. Cannabis extract has a positive–immunostimulating effect through proteolytic system and metabolic compounds of honey bee (Apis mellifera) workers. Animals 2021, 11, 2190. [Google Scholar] [CrossRef] [PubMed]
  40. Friedman, M. Nutritional value of proteins from different food sources. A review. J. Agric. Food Chem. 1996, 44, 6–29. [Google Scholar] [CrossRef]
  41. Jouni, Z.E.; Zamora, J.; Wells, M.A. Absorption and tissue distribution of cholesterol in Manduca sexta. Arch. Insect Biochem. Physiol. 2002, 49, 167–175. [Google Scholar] [CrossRef]
  42. Łoś, A.; Strachecka, A. Fast and cost-effective biochemical spectrophotometric analysis of solution of insect “blood” and body surface elution. Sensors 2018, 18, 1494. [Google Scholar] [CrossRef]
  43. Strachecka, A.; Olszewski, K.; Paleolog, J. Varroa treatment with bromfenvinphos markedly suppresses honeybee biochemical defence levels. Entomol. Exp. Appl. 2016, 160, 57–71. [Google Scholar] [CrossRef]
  44. Zirbes, L.; Nguyen, B.K.; de Graaf, D.C.; De Meulenaer, B.; Reybroeck, W.; Haubruge, E.; Saegerman, C. Hydroxymethylfurfural: A Possible Emergent Cause of Honey Bee Mortality? J. Agric. Food Chem. 2013, 61, 11865–11870. [Google Scholar] [CrossRef] [PubMed]
  45. Krainer, S.; Brodschneider, R.; Vollmann, J.; Crailsheim, K.; Riessberger-Gallé, U. Effect of hydroxymethylfurfural (HMF) on mortality of artificially reared honey bee larvae (Apis mellifera carnica). Ecotoxicology 2015, 25, 320–328. [Google Scholar] [CrossRef] [PubMed]
  46. Hellwig, M.; Henle, T. Maillard Reaction Products in Different Types of Brewing Malt. J. Agric. Food Chem. 2020, 68, 1427–14285. [Google Scholar] [CrossRef]
  47. Gregorc, A.; Jurišić, S.; Sampson, B. Hydroxymethylfurfural Affects Caged Honey Bees (Apis mellifera carnica). Diversity 2020, 12, 18. [Google Scholar] [CrossRef]
Figure 1. Chemical composition and energy values of bee pollen and brewers’ spent grains. (AC) Percentage of selected components in dry matter of tested raw materials; (D,E) dry matter content and gross energy value in tested raw materials (P—pollen, BL—brewers’ spent grain from light beer, and BP—brewers’ spent grain from porter beer). Columns present mean, error bars show SD, mean values are displayed as black numbers; letters on the right represent the result of Kruskal–Wallis test with Holm correction for multiple comparisons, α = 0.05, presence of the same letter in two groups means no statistical difference between them. Values were compared across rows in individual graphs for each parameter tested. For graphs (AC) test was performed for each component separately (P, BL, and BD) to check differences between them (in rowwise); the graphs (D,E) on Figure 1 presents separate results of Kruskal–Wallis test for each plot.
Agriculture 14 00929 g001
Figure 2. Chemical composition and energy value of sugar cakes with protein additives. (AF) Percentage of selected components in dry matter of tested sugar cakes; (G,H) dry matter content and gross energy value in tested sugar cakes (P—pollen, BL—brewers’ spent grain from light beer, and BP—brewers’ spent grain from porter beer; 10% and 20%—determines the content of protein additive in sugar cake). Columns present mean, error bars show SD, mean values are displayed as black numbers; letters on the right represent the result of Kruskal–Wallis test with Holm correction for multiple comparisons, α = 0.05, presence of the same letter in two groups means no statistical difference between them. Values were compared across rows in individual graphs for each parameter tested. For graphs (AF) on the Figure 2: test was performed for each component separately, but within all sugar cakes (P10%, P20%, BL10%, BL20%, BD10%, and BD20%) to check differences between them (in rowwise); the graphs (G,H) on the Figure 2 present results of Kruskal–Wallis test for dry matter and gross energy in each group.
Agriculture 14 00929 g002
Figure 3. Amino acid accumulation in brewers’ spent grain and pollen chosen as tested protein additive for sugar cake. (AC) Percentage of selected amino acids in protein of tested raw materials; columns present mean, error bars show SD, mean values are displayed as black numbers; letters on the right represent the result of Kruskal–Wallis test with Holm correction for multiple comparisons, α = 0.05, which was performed for each component separately, but within all protein additives (P, BL, and BD) (in rowwise), the same letter means no statistical difference between groups. Values were compared across rows in individual graphs for each parameter tested. The graph (D) the ratio between essential amino acids (EAA) and non-essential amino acids (NEAA) in raw materials. The graph (E) the value of essential amino acid index (EEAI) for tested raw materials (P—pollen, BL—brewers’ spent grain from light beer, and BP—brewers’ spent grain from porter beer).
Agriculture 14 00929 g003
Figure 4. The intake of sugar cakes with protein additives. (A) Mean total weight of sugar cake consumed by bees during 7 days of experiment; (B) mean daily sugar cake intake per bee. Columns present mean, error bars show SD, mean values are displayed as black numbers; letters on the right represent the result of Kruskal–Wallis test with Holm correction for multiple comparisons, α = 0.05, presence of the same letter in two groups means no statistical difference between them; group abbreviations: C—control sugar cake without any protein additive; P—pollen, BL—brewers’ spent grain from light beer, and BP—brewers’ spent grain from porter beer; 10% and 20%—determines the content of protein additive in sugar cake.
Agriculture 14 00929 g004
Figure 5. Honey bee survival rate during 6 days of being fed tested sugar cakes with protein additives. Group abbreviations: C—control sugar cake without any protein additive, P—pollen, BL—brewers’ spent grain from light beer, and BP—brewers’ spent grain from porter beer; 10% and 20%—determines the content of protein additive in sugar cake. Letters on the right represent the result of log-rank test, which was performed for each two groups, α = 0.05, presence of the same letter in two groups means no statistical difference between them.
Agriculture 14 00929 g005
Figure 6. Levels of enzyme activity in honey bee hemolymph collected after 6 days of applying experimental diet. (A) Alanine aminotransferase (ALT); (B) aspartate transaminase (AST); (C) alkaline phosphatase (ALP); (D) gamma-glutamyl transpeptidase (GGTP). Columns present mean, error bars show SD, mean values are displayed as black numbers; group abbreviations: C—control sugar cake without any protein additive; P—pollen, BL—brewers’ spent grain from light beer, and BP—brewers’ spent grain from porter beer; 10% and 20%—determines the content of protein additive in sugar cake.
Agriculture 14 00929 g006
Figure 7. Levels of selected components in honey bee hemolymph collected after 6 days of applying experimental diet. (A)—cholesterol concentration, (B)—triglycerides concentration, (C)—total protein concentration, (D)—glucose concentration, (E)—urea concentration, (F)—albumin concentration. Columns present mean, error bars show SD, mean values are displayed as black numbers. Letters on the right represent the result of Kruskal–Wallis test with Holm correction for multiple comparisons, α = 0.05, presence of the same letter in two groups means no statistical difference between them (differences were significant only in the case of total protein concentration—C). Group abbreviations: C—control sugar cake without any protein additive; P—pollen, BL—brewers’ spent grain from light beer, and BP—brewers’ spent grain from porter beer; 10% and 20%—determines the content of protein additive in sugar cake.
Agriculture 14 00929 g007
Disclaimer/Publisher’s Note: The statements, opinions and data contained in all publications are solely those of the individual author(s) and contributor(s) and not of MDPI and/or the editor(s). MDPI and/or the editor(s) disclaim responsibility for any injury to people or property resulting from any ideas, methods, instructions or products referred to in the content.