Abstract
The complex mechanical system of a rice combine harvester not only has various excitation sources, but also, the vibration transmission path between each working device and the vibration contribution characteristics to the frame are not clear, so it is difficult to perform a reduction vibration design for the sharp vibration of the rice combine harvester frame. Therefore, based on the comparison and improvement of multiple classical transfer path analysis methods, this paper analyzed the vibration transfer characteristics and transfer characteristics of each harvester by the discrete time matrix method and operating path method. In the Experimental section, through the vibration characteristic experiment firstly, this paper obtained the power spectrum variation and the most needed optimized path in the transmission path of each device under each operating condition. Secondly, through frame simulation analysis under the exciting force, we obtained the vibration damping areas that needs to be optimized. Finally, the damping optimization experiment connected with the vibration characteristic experiment, and the excitation force simulation analysis was performed. The results of the damping optimization experiment displayed that the maximum change value of the vibration acceleration of the cutting table decreased from 7.862 m·s−2 to 3.522 m·s−2, decreasing by 55.2%, and the peak amplitude of the multipoint test in the cab was 5.4, 5.3, 1.7 and 2.0 μm, respectively, which was significantly reduced, so the optimization effect was significant. This study provides theoretical support for the vibration reduction optimization of a rice combine harvester frame.
1. Introduction
During harvesting rice of a combine harvester, the cutting table, transportation equipment, vibration screen, threshing roller, fan and engine and so on should meet the various extremely complex movements in the design process [1,2,3]. However, due to the different functions of each device, the vibration characteristics and the exciting force produced by each device are also different [4,5]. The generation of vibrations will not only affect the normal work of each device but also makes the mechanical harvest loss rate and impurity content rate of the overall harvester higher and then affects the overall harvest efficiency and harvest quality of the harvester [6,7]. Furthermore, the further superposition of the vibration of each device may make the overall combined harvester produce stronger vibrations and cause machine resonance, which will cause the fatigue failure of the whole machine and will then seriously affect the working performance and service life of the combined harvester [8,9]. Adding to that, the strong vibration of each device will not only affect the driving experience of the driver in a rice combine harvester but also affect the physical and mental health of the driver in the high vibration environment for a long timer [10]. In recent years, with the gradual development to higher speeds and more efficient and higher intelligence of combine harvesters, it is extremely urgent to the vibration reduction optimization of combine harvesters to study the vibration transfer path and contribution characteristics [11,12].
At present, scholars at home and abroad carry out the excitation experiment to obtain the transfer function of working devices individually by disassembling the harvester cutter table, vibration screen, engine and other devices and structures to further study the vibration transfer characteristics of each device [13,14,15]. Also, some scholars, through the finite element method and the test modal technique, analyze the influence of external excitation on the dynamic characteristics of each device firstly. And then, the structure of each device of a combine harvester according to the mode vibration pattern of each device on the harvester is optimized. The result is that the vibration pattern and frequency of the devices are optimized and the resonance problem avoided [16,17]. In the vibration optimization design for rice harvesters of Zhang et al., they, based on the finite element analysis and the modal solution, reduced the vibration of the machine during operation and avoided the resonance of harvester devices by comparing the excitation frequency of the main vibration source and the natural frequency and vibration type of the threshing drum [18]. Combining the modal acoustic contribution calculations and using the numerical simulation technique can establish the regression equation to reveal the relationship between the indicators and the factors. Therefore, Tian et al. determined the comprehensive cutting performance index that meets the cutting table, though the vibration information of the cutter during the harvester is collected by the vibration recorder [19]. The mode analysis software method is also commonly used for finite element mode vibration and frequency analysis of harvester frames. Li et al. optimized the structure of a harvester frame by analyzing the natural frequency and the external excitation frequency of the harvester frame and made the mode frequencies of the first few lower orders of the frame avoid the external shock frequency range [20]. For the problem of the frame having resonance with the external excitation frequency, Lin et al. designed the frame using the multi-objective optimization method and improved the working stability of the harvester combined with the sensitivity analysis method by exploring the factors and order that affect the first order natural frequency and quality of the frame [21]. For the vibration problem between the rack and the seat, Zhang et al., through the measured frame vibration signals as the input excitation, simplified the model of the nonlinear damping system for the cab seat–human body following the actual structure of the cab. In addition, they used the genetic algorithm in multi-objective optimization and input the optimization results into the model to verify the optimized vibration reduction performance of the cab and seat for the front and rear [22]. Using the way of the integral calculation combining analytical calculations and numerical simulations method, Wu et al. acquired the conclusion that studying the vibration generation of the vibration transmission path was an important way to explore the vibration of the harvester [23]. The above research focused on the analysis of a single working device in the vibration excitation response, the vibration characteristics and the vibration reduction and noise reduction optimization and so on aspects, and these researchers optimized the vibration of the harvester by obtaining the vibration transfer characteristics of a single part to the whole machine in its working state. Although some scholars have studied the transmission characteristics of each component of the harvester, the focus is still on analyzing the transmission characteristics of a single component. It is rare to research the transmission characteristics and contribution characteristics of the whole machine excitation while the harvester devices are working.
Based on the equilibrium equation of the rice combine harvester and correlation analysis of the vibrational signals, this paper calculated the transfer matrix and analyzed the passing path for each device of the rice combine harvester by combining the discrete time matrix method with the OTPA analysis method. In addition, the sound pressure level distribution of different devices was obtained by carrying out the vibration characteristics of combined harvesters under field conditions and analyzing the power spectral density function and power spectrum of each operating device. In order to provide a theoretical basis for the whole machine vibration reduction treatment, the vibration transfer path and contribution characteristics of each device were explored in different working conditions. The vibration damping area to be optimized during the transmission process of each working device was obtained by the simulation analysis of the frame excitation force and vibration characteristic experiment. Finally, after damping optimization treatment of the obtained optimization area, the results of the vibration characteristics and vibration reduction optimization and vibration optimization were verified by comparing the vibration acceleration and amplitude of each device after vibration reduction processing and before processing.
2. Material and Methods
2.1. Research Method of Vibration Transmission
Combine harvester vibrations can be regarded as the result of the superposition and coupling of the excitation force generated by each excitation source through the vibration isolation element and the connection point of each working device along different transmission paths. The main steps of a system vibration transfer paths analysis include identifying the working load, acquiring the transfer function and contribution analysis known through Xu et al.’s cab vibration measurements under multiple working conditions and the vibration contribution characteristics research of the seat [24].
Operational Transfer Path Analysis is an accurate and effective method to diagnose the machine vibration and noise problem [25]. The product of the working load and the path frequency response function represents the path contribution in the TPA method, and the TPA method can further be divided into a single-reference TPA versus the multi-reference TPA method according to the number of incentive sources, which is shown in Figure 1.
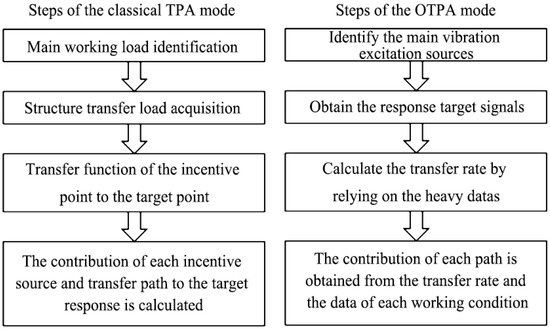
Figure 1.
A comparison of the OPA and OTPA analysis methods.
The OTPA method, which directly measures the vibration response data under the working conditions without the decoupling of the excitation source, is a rapid TPA method. Therefore, the testing method of OTPA is more efficient. Because the vibration of the whole machine can be regarded as a time-varying nonlinear multi-body vibration system, according to the field conditions of the combine harvester being complex and the external incentives changing over time, the OTPA method is more suitable for combine harvester transmission path analysis.
In the analysis of the harvester, if we assume that the harvester vibration system is linearly unchanged, the transmitted target response can be expressed as
In the formula, is the selected output response at the target point, is the selected input reference point response at the excitation source and is the transfer function corresponding to the path.
The transfer rate calculated only based on the working condition data will have errors due to the changes in the data of different working conditions of the combine, so the analysis results of the OTPA method are often not accurate. At the same time, because the vibration system of the harvester has time-varying nonlinear factors, it is necessary to combine the discrete time matrix method to optimize the calculation of the analysis transfer characteristics, so as to improve the accuracy of the results.
In the dynamic equations of the joint harvester, there are mainly unknown quantities, such as speed, acceleration and high-order items. If the free vibration of the whole multi-body system is regarded as a linear time-invariant system, the state vector meets
In the formula: z is the quantity in the physical coordinates, and Z is the quantity in the corresponding modal coordinates.
Due to the interactive superposition of the external excitation and the excitation force of the combined harvester, the kinetic equation of working devices needs to be linearized firstly to build the transfer matrix for each device. The linear function can represent the positional coordinates of the velocity and the acceleration :
In the formula: A, Bx, C and Dx are the simplification of the known functions at time ti−1. If the variables such as speed and acceleration are segmented with as the step size, the nonlinear equation can be expressed linearly in terms of the motion parameters.
Based on the Newmark-β method, is expanded by Taylor at through introducing γ and β as the correction parameters and reduced to the second derivative term:
The velocity term is expanded by Taylor with the same principle:
The solution can be obtained by calculating
In the step length time, both the velocity and the acceleration can be expressed linearly by the motion parameters in this condition. If γ is greater than 0.5 and β is greater than or equal to half of γ, the linear system is unconditionally stable, and the increasing of β will reduce the calculation accuracy.
Inspired by the principle of calculus, as long as the time step is small enough, the relationship between many physical parameters can always be considered to be approximately linear in the physical process corresponding to each time step of the time-varying system. Therefore, the linearization of the movement parameters by using the stepwise time integration method can be used to solve the steady-state response of the nonlinear system subsequently [26].
2.2. Analysis of the Vibration Transfer Characteristics
Since the complete machine is a nonlinear system, when the system motion parameters are subjected to a linear conversion, the space coordinate transformation also needs to be expressed by linearization when the transfer matrix of working devices is derived by regarding the harvester as a spatial combination. As shown in Figure 2, although the movement of each device is different, the movement of a working device is basically no more than three degrees of freedom. Therefore, the movement of each device on the harvester can be regarded as spatial movement under the device fixation.
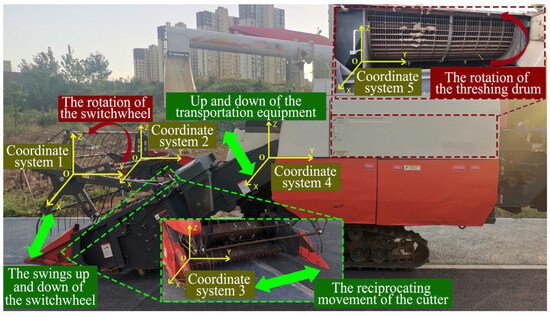
Figure 2.
Space coordinates and motion mode of the rice combine harvester.
During the linearization of the coordinate transformation matrix, the fixed point three degrees of freedom rotation can be realized by three times the rotation around three spatial fixed axes. Therefore, as shown in Figure 3, the principle of transforming the spatial coordinates of each device on the harvester is that the coordinate transformation matrix from connecting the system to the inertial system can be expressed by the trigonometric function of the angles of rotation, θx, θy and θz, which spin around the ix, iy and iz and are fixed around the space of the inertial coordinate system.
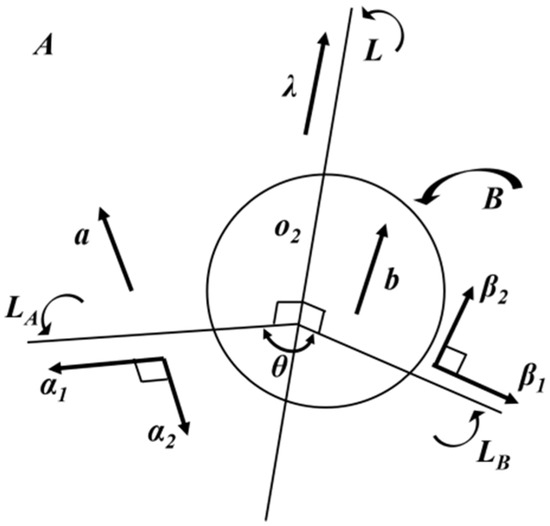
Figure 3.
Spatial coordinate conversion.
Complex motions in the multi-space coordinate system of each device were transformed into the motion of the spatial triaxial x-y-z inertial frame by the linearized coordinate transformation matrix. The triangular function form of the linearized coordinate transformation matrix is
In the formula:
| sr = sinθr | |||
| cr = cosθr | |||
| (r = x, y, z) |
The vibration transmission path of each device also needs to be analyzed when analyzing the vibration transfer characteristics of the harvester. As a complex multi-body system, the combine harvester has numerous incentive sources, and the vibration transmission paths of various incentives are also extremely complex. The cutting table, transportation equipment, threshing roller and engine device are the main devices that produce the vibration in the x-y-z three-axis transfer direction. In addition, different devices can transfer vibrations to each other through a chassis device frame or threshing device frame.
The vibration transmission path can be divided into five paths according to the device-level observation that each device corresponds to a vibration transmission path. Therefore, the vibration transmission path model as shown in Figure 4 of the rice combine harvester can be obtained.
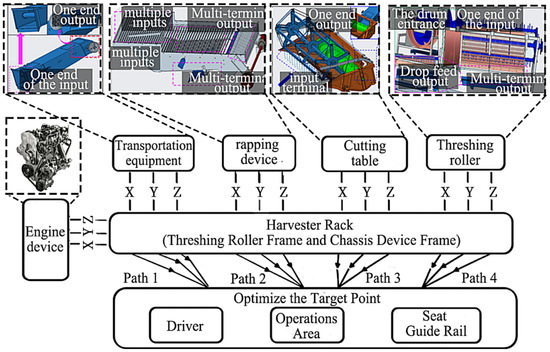
Figure 4.
The model of the rice combine harvester vibration transmission paths.
2.3. The Transfer Matrix of the Working Device
The discrete time transfer matrix method of the multi-body system, combining the transfer matrix of a linear multi-body system and the numerical integration methods, can utilize the rigid body dynamics equation established in the triaxial x-y-z inertial frame to derive the transfer equation and the transfer matrix of the system and the device following the way of stylization [27]. In addition, the derivation method of the discrete time transfer matrix method also needs to consider the input and output situations under the rigid body structure of each working device, as shown in Figure 5.
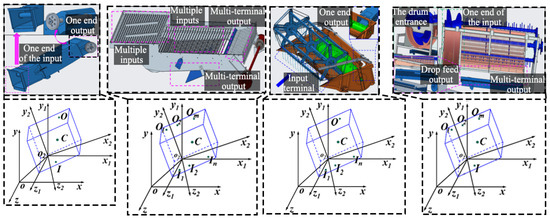
Figure 5.
Input and output types and spatial coordinate system of each working device.
The transfer matrix describes the physical connection between two devices (it can be an actual mechanical connection, such as a bolt, or a medium that transmits vibration, such as air or liquid, etc.), thus converting the vibration from one device on the harvester to the vibration from the other device. By calculating the transfer matrix between each device of the harvester, the frequency response characteristics of the system can be understood, which provides an important theoretical basis for optimizing the system design and improving the signal processing technology.
When analyzing the working mode of the main device of the combine harvester, as shown in Figure 5, each device is classified according to the input and output situations. For the slot device, the grain by the front slot cut sets beats the dragon feeding conveyor feeding port through the chain upward transportation. The grain is gathered into a feed inlet by collecting with a screw conveyor. Therefore, the grain can be seen as a whole at this time. When transported upward inside the transportation equipment, the grain can be regarded as a whole from feed inlet to discharge hole, because the grain does not disperse. Consequently, the transfer matrix of the transportation equipment is derived by regarding the transportation equipment as a spatially moving rigid body system of one end input and one end output.
Because a vibrating screen device has step-by-step input and step-by-step output, although the assumption that the load on the screen surface is evenly distributed, the vibration screening device distinguished from the transportation equipment with only unique input and output terminals is difficult to regard as a one-end input. Vibrating screen devices have multiple output terminals, because grains are not evenly distributed on the sieve face at the output end of the vibrating screen device.
Crops are firstly fed into the machine through the reel and then are cut by the cutter. Finally, crops are transported to the conveyor trough when they are gathered from the screw conveyor to the transportation equipment. Therefore, crops are fed in, and cutting can be seen as the input side, while the process of transporting can be seen as the output end. In conclusion, the cutting table can be regarded as a one-end input and one-end output system.
The crops are fed from transportation equipment to the input port of the threshing roller, and the front end of the threshing roller connects to the transportation equipment. Rice grains are detached in the threshing roller and then fall into the vibrating screen device under the threshing roller. Therefore, the threshing roller can also be regarded as a one-end input and one-end output system. The transfer matrix, as follows each working device of the combine harvester, can be obtained following the principle of spatial coordinate conversion and the above analysis:
The harvesting machine transfer matrix of each working unit can describe the harvester vibration transfer path up of a device connected to the next device vibration relationship, which will reap the vibration of the machine into a harvest machine to optimize the vibration system, and the vibration transfer provides an important theoretical basis.
2.4. Vibration Experiment of Each Device under Different Working Conditions
In order to study the vibration transmission of each device in the combine, the vibration characteristics of each device in the harvester should be measured first. The vibration characteristics of each device are obtained though the vibration detection of each device of the harvester. Therefore, the transfer characteristics of each device can be gained based on the vibration characteristics.
The vibration acceleration signals, as shown in Figure 6, under no-load and multiple working conditions of each device can be gathered though the experiment that used the DH5902 signals collector of DongHua (China, JangSu). The measuring parameters of the DH5902 signals collector are that the measuring range is from 30 to 300,000, the measurement accuracy is less than 0.05% ± 1 rpm, the number of pulses per turn is 1~4096 and the rotary axis ratio is 0.01~100.
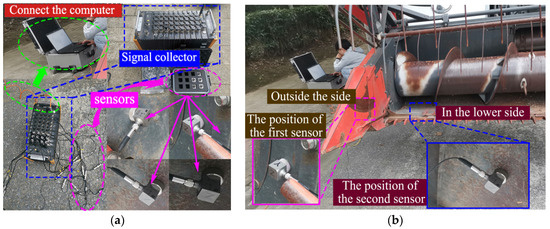
Figure 6.
Vibration test instrument and the processing of multi-working conditions. (a) No-load and multi-working condition test process. (b) Vibration test instrument.
To obtain the vibration signals of each device and study the transmission characteristics, four sensors are installed on two adjacent working devices of the harvester in the vibration measurement experiments. Each sensor can measure the acceleration of the x-y-z three axes of each device. Therefore, the vibration acceleration signals for twelve channels can be obtained through the vibration experiment in total. The vibration conditions of two devices are measured each time under different working conditions. Therefore, the vibration signals of each working device can be obtained under multiple working conditions.
The position of each measuring point and the direction of the device corresponding to the three axis channels of the sensor are shown in Table 1.

Table 1.
Measuring point locations and three axis channel directions of each sensor.
The vibration signals caused by the interaction between the rice grain and the device need to be regarded as fault signals in the processing of the obtained signals.
To distinguish the effective signals interval of the acceleration signals under this channel from the signals interval under the feed volume perturbation, follow-up data processing the need to choose a suitable smoothing factor following the mean of the vibration acceleration were obtained experimentally.
The vibration experiment obtained the vibration acceleration signals of the connection between the cutting table and transportation equipment firstly and then obtained the vibration acceleration signals of the connection between the transportation equipment and threshing roller. Finally, the strong vibration signals of the four measuring points on the threshing roller were obtained. To obtain the smooth curve of each signal, the signals need to be processed with noise reduction.
2.5. Analysis of the Device Vibration Contribution
The autocorrelation function can fully express the energy distribution of the statistical quantity and random vibration at each frequency point. In order to obtain the power spectral density, the autocorrelation function needs to be transformed by Fourier transformation. When the combine works, the total power of a group of signals is constant in both the time domain and frequency domain, so the power spectral density in a random process can be obtained.
The power spectrum is a tool to represent the energy distribution of the signal in the frequency domain, which can show the change in the vibration amplitude of the signal under different frequencies. Then, the attenuation divergence or power enhancement of the corresponding vibration energy signal is studied.
Pw(ejω) can be obtained after X[k] is calculated by fast Fourier transform of the N points to signal x[n]:
The relationship between the power spectrum Px(f) of the input signal and the power spectrum Py(f) of the output signal is as follows:
H(f) is the transfer matrix in the formula.
The sound pressure contribution level and power spectral density are two important indicators often used when analyzing the characteristics of signal or noise. The acoustic pressure contribution level and the power spectral density can build a connection based on the relation of the sound pressure level and the power, and the calculation formula of the sound pressure level is as follows:
In the formula, P is the measured sound pressure.
In order to obtain the vibration transmission characteristics of different working devices, it is necessary to further compare the sound pressure contribution of each device under different working conditions. In Matlab 2022b, the vibration data set is calculated and analyzed according to Formula (15) and other principles, so as to compare the transfer path contribution of each path of different working devices of the harvester.
2.6. Simulation Analysis of the Excitation Force Transfer of the Frame
The optimal position of damping is obtained by constructing a 3D model of the whole frame of the combine harvester. After structural decomposition, mesh division and constraint addition of the harvester frame, the static simulation analysis of the excited force of the frame was carried out to obtain the change in the model vector principal stress and the stress intensive distribution area. The distribution of the exciting force transfer was observed from the whole vector distribution of the frame, which provided support for the subsequent vibration transfer damping optimization experiments of each device. In the simulation analysis, the attributes of the frame material are shown in Table 2.
Table 2.
Main properties of the grain combine harvester frame material.
In order to balance the solution accuracy and computational efficiency, the way that the solid unit combines with the shell units is used in the simulation analysis. The frame model eventually formed 1,087,287 nodes and 426,533 units with a grid 12 mm in size.
The simulation still needs to add constraints and the harvesting machine structure vibration force, based on the measured vibration acceleration signal of each device of the exciting force. The stress range is obtained by way of the working device installation connection. The calculation method of the exciting force as shown in the following formula is
In the formula: m1 is the quality of the working device, a1 is the vibration acceleration and f0 is the external exciting force of the device.
According to the calculations, the resultant force of the threshing roller frame installation location, by gravity of the frame and exciting force when working, is 4450 N. Owing to only the forces of the rice granary side and cab having gravity being taken into consideration, the forces of rice granary side and cab are 3400 N and 2800 N. The resultant force of the engine device subjected to gravity and exciting force when working is 3081 N. According to the above analysis, the forces are added to the installation location of the threshing roller frame.
The resultant force of the threshing roller frame, subjected to the resultant external force of the cutting table and threshing roller, is 5175 N when the cutting device is acted on by the working vibration and gravity. The resultant force of the gravity and working vibration force at the threshing roller is 2194 N.
The frame of the rice combine harvester was split into the threshing roller frame and chassis frame. After adding materials, dividing grids and exciting force conditions, the harvester threshing cleaning frame and chassis frame can simulate the exciting force. The specific process is shown in Figure 7. Then, according to the simulation results of the frame excitation force transfer and vibration characteristic experiment, the main area of the frame damping and vibration reduction optimization of the rice harvester can be obtained.
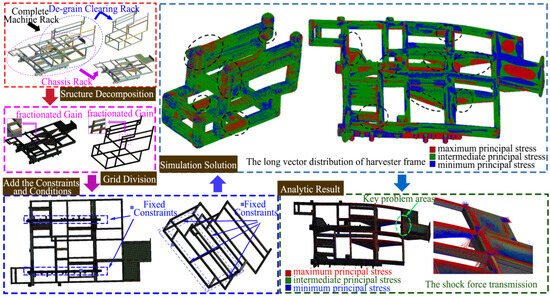
Figure 7.
Simulation analysis of the excitation force of the threshing roller frame and chassis frame.
2.7. Principle and Method of Damping Optimization
The vibration of the combine harvester has three basic vibration elements of the vibration source, transmission path and controlled objects. As shown in Figure 8, the measures for vibration reducing of three basic vibration elements include reducing vibrations in the vibration source, reducing vibrations between the vibration source and controlled objects in the transmission path and reducing vibrations by installing the power vibration isolator or improving the structural damping.
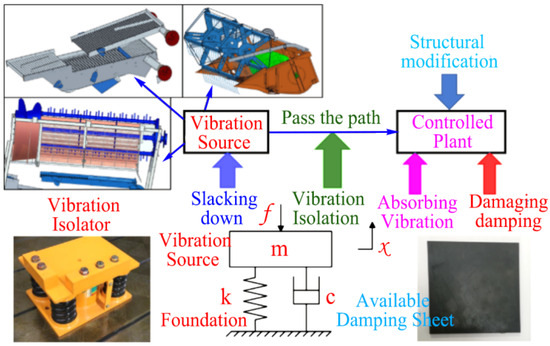
Figure 8.
Basic principle of the vibration control method.
Reducing vibrations should consider eliminating or reducing vibrations in the vibration source. Therefore, the way to arrange the vibration isolator between the vibration source and the installation node can eliminate or reduce the vibration transfer based on the principle of increasing the damping coefficient. However, rice combine harvesters have many uncontrollable vibration sources, such as the vibration of grounds, rice grain collision and device operation. Therefore, this way is complicated, because a vibration isolator needs to be installed before the complete machine assembly is completed or every device needs to be dismantled from the combine harvester.
The method of reducing the energy of the vibrations in the damaged layer of vibrating objects is damping vibration attenuation, shown in Figure 9. The frame of the rice combine harvester, which has many complex vibration sources, is multiple support beams composed of rectangular pipe profiles.
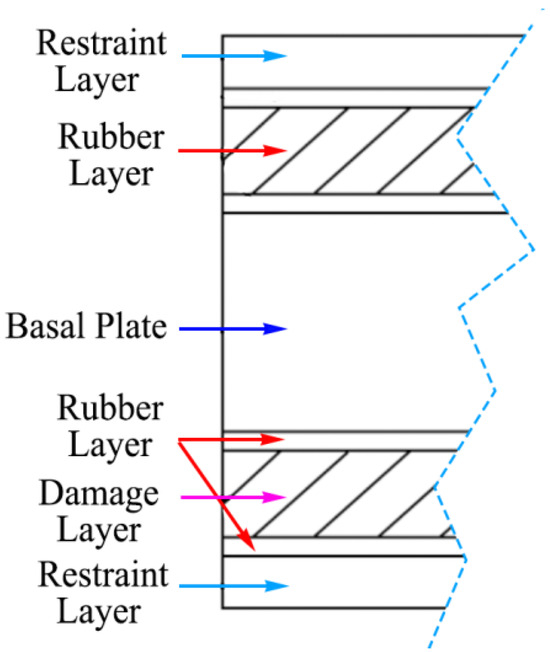
Figure 9.
Principle of constrained damping.
For a combine with multiple excitation sources, the frame consists of rectangular tube profiles forming a plurality of support beams. The damping performance of mechanical structures can be improved by additional damping materials, which is the main form of vibration reduction for beams, plates and shells [28].
2.8. Identification Method of the Vibration Reduction Path
Although the vibration phenomenon of the connection between the transportation equipment and the threshing roller is not strong, the transmission contribution quantity is notable. Therefore, the connection between the transportation equipment and the threshing roller is the main problem area of the vibration transmission. As shown in Figure 10, at the intersection of the support beams at the connection of each device of the chassis frame, the intersection of the threshing and cleaning frame conveying device with the transverse beam and the location of the transverse beam where the threshing drum device is installed is a more significant incentive transfer, which is the main optimization area of the vibration reduction path of the combine.
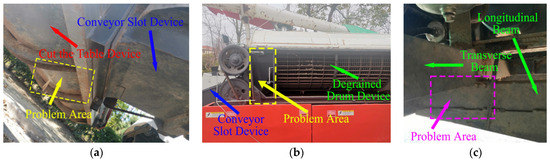
Figure 10.
The problem area of vibration transmission paths. (a) The problem area of the cutting table. (b) The problem area of the connection. (c) The problem area of the frame.
Rubber, as a viscoelastic polymer material, has reversible deformation when subjected to external forces. The energy of the external force is converted into internal energy by a rubber damping sheet. Therefore, the rubber damping sheet is used to optimize the frame damping characteristics and is installed along with covering the vibration reduction treatment on the main optimization areas, as shown in Figure 11.
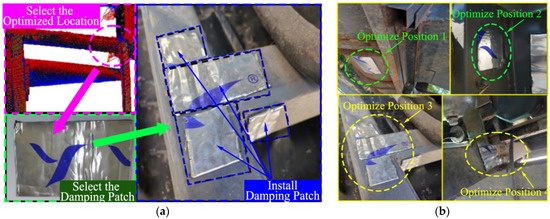
Figure 11.
The selection and optimized installation of damping sheets. (a) Damping sheets were installed according to the experimental results. (b) Transfer paths damping installation.
In order to reduce the vibration transmission between devices, it is also necessary to optimize the selected problem path of the vibration transmission by covering it with the same damping material according to the above damping optimization method. At the same time, a strong regional vibration transfer added damping materials to a harvester to reduce the vibration force of each device for the frame to reduce the vibration of the frame as a whole.
In order to compare the vibration characteristics and the vibration reduction results of each working device before and after adding the damping material, the vibration signals of each device and cab need to be measured again, as shown in Figure 12. In order to remeasure the vibration before and after the optimization of the harvester device and the cab, four measuring points are installed on the side plate and bottom plate from left to right, four measuring points are also installed on transportation equipment in a counter-clockwise direction and four measuring points are installed on the external plate and curb plate of connection position.
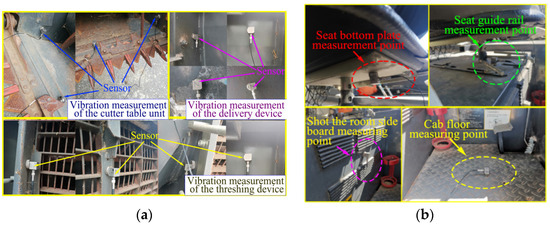
Figure 12.
Path optimization and the installation of the optimization measurement point. (a) Measurement positions of each device. (b) Measurement positions of the seat and cab.
The measuring positions of the seat and cab after optimization treatment are, respectively, the floor plate of the cab (measure point 1), the curb plate of the cab (measure point 2), the guide rail of the seat installation position (measure point 3) and the shot bottom plate of the seat (measure point 4).
3. Results and Discussion
3.1. Optimization Processing of the Vibration Signal
The vibration acceleration signal of each four measuring point channels of stronger vibrations can be obtained through the vibration experiment of one-quarter the cutting width, half the cutting width, the full cutting width and no-load working condition. Combine harvesters have vibrations of devices before harvesting, and the vibration impact will be produced through the interaction between rice grains and working devices with the rice grains in the working devices. Because of the vibration impact, the vibrations of the working devices are non-stationary. Therefore, the vibration response signals obtained through the vibration experiment are based on the external random excitation disturbance. The noise reduction smoothing curves of the cutting table, transportation equipment, threshing roller and the connection between transportation equipment and threshing roller are obtained through noise reduction. The noise reduction smoothing curve of the vibration strong channel is shown in Figure 13.
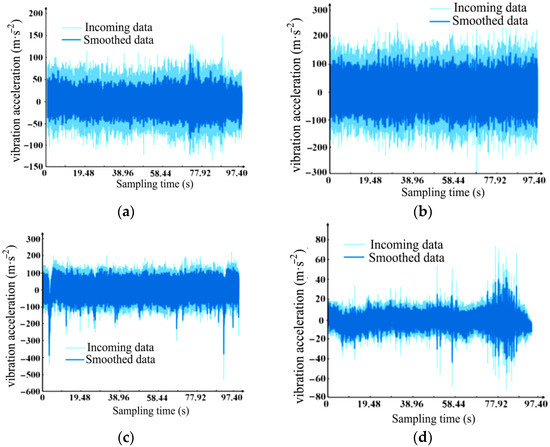
Figure 13.
Noise reduction smooth curve of the main working devices. (a) Noise reduction smoothing curve of the cutting table. (b) Noise reduction smoothing curve of the transportation equipment. (c) Noise reduction smoothing curve of the threshing roller. (d) Noise reduction smoothing curve of the connection between the transportation equipment and threshing roller.
The cutting machine and conveyor trough channel signal are put in a bigger difference interval, and the feed rate disturbance range is wide but joint with threshing roller channel vibration signal difference is smaller, so the conclusion that the perturbation interval of the feeding quantity being wider can be gained. The rice grain fed to the cutting table was not symmetrical because of the effect of the terrain and planting density. Therefore, the disturbance of the feeding quantity is more obvious. Because the feeding quantity is symmetrical after rice gain gathered into the transportation equipment, the noise reduction smooth curve of the connection between the transportation equipment and threshing roller is closer to the actual signal.
It is difficult to see the effective vibration signals of the channels, because the vibration signals under the different working conditions have large fluctuations. Therefore, to reduce the influence of sharp interference signal fluctuations on the signal analysis under external disturbances, as shown in Figure 14, effective excitation signals of every channel were obtained through enveloping the root mean square (RMS) value.
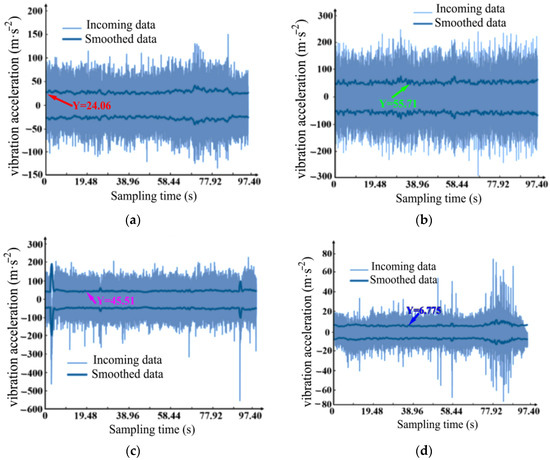
Figure 14.
RMS enveloping curve of the main working device. (a) The RMS enveloping curve of the cutting table. (b) The RMS enveloping curve of the transportation equipment. (c) The RMS enveloping curve of the threshing roller. (d) The RMS enveloping curve of the connection between the transportation equipment and threshing roller.
According to the results of the enveloping root, mean square (RMS) value, the main impact value of the cutting table’s vibration acceleration is 24.06 m/s2, the main impact value of the transportation equipment’s vibration acceleration is 55.71 m/s2, the main impact value of the threshing roller’s vibration acceleration is 45.51 m/s2 and the main impact value of the connection between transportation equipment and threshing roller is 6.775 m/s2.
3.2. Power Spectrum under Different Working Conditions
The power spectrum of the vibration signals needs to be analyzed to obtain the area of stronger vibrations. The signals of each device obtained by the test are imported into the Signal Analyzer of Matlab for the signal analysis. The sampling time resolution is 663, with a RBW reference frequency of 0.007820 × PI r/sample, after the abscissa of the normalized frequency and the ratio of the reference frequency. The result of the analysis, as shown in Figure 15, the abscissa is the ratio of the frequency normalized to the reference frequency, and the ordinate is the value of the power spectrum. In the figure, the positive values of the power spectrum represent a power increase, the negative values of the power spectrum represent the power decay and if there is a greater number of spectral lines under the same original signal frequency, then the corresponding energy of each spectral line is smaller.
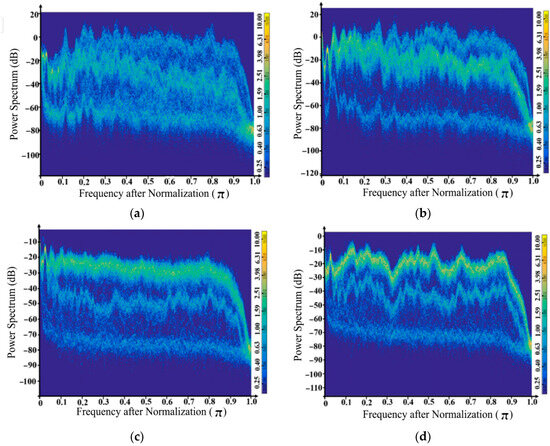
Figure 15.
The power spectrum of every working device under no-load. (a) Power spectrum of the cutting table. (b) Power spectrum of the transportation equipment. (c) Power spectrum of the connection between the transportation equipment and threshing roller. (d) Power spectrum of the threshing roller.
Because of the existence of the cutting reel, knife and screw conveyor, the vibration source of the cutting table is complicated, and the spectral lines are promiscuous, because vibrations are transmitted to other structures. Three obvious paths, corresponding to their own vibration excitation and excitation transmissions of adjacent devices posting to the devices, exist for the spectral lines of the transportation equipment and threshing roller because of fewer vibration sources. When unloaded, vibration excitation is mainly generated by rotating parts and reciprocating parts in each device. Each connecting plate bear vibration carrier and multiple source transmission interfere with each other between the sheets, and the energy transfer is divergent.
The vibration transmission of the working device tends to be stabilized in harvesting, because the working device is constantly filled with cereal grains. As shown in Figure 16, the power spectrum lines of each device no longer appear as disorderly phenomenon, because rice grains act as a carrier of energy dissipation during transmission. Due to massive sheet metals in the connection of the transportation equipment and the threshing roller, the power spectrum lines are more divergent.
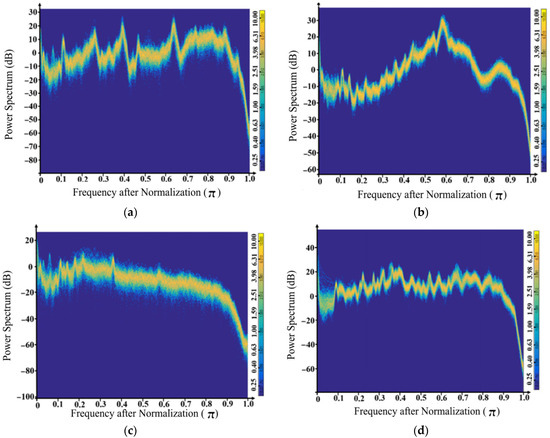
Figure 16.
The power spectrum of every working device under the working conditions. (a) Power spectrum of the cutting table. (b) Power spectrum of the transportation equipment. (c) Power spectrum of the connection between the transportation equipment and threshing roller. (d) Power spectrum of the threshing roller.
As can be seen from Figure 16, the spectral lines of the transportation equipment and the threshing roller are more concentrated. Therefore, the spectral lines corresponding to the vibration energy are also relatively more concentrated, and the decay divergence or power enhancement are also more obvious.
3.3. The Analysis of the Vibration Contribution Characteristics
For different working devices of the vibration transfer characteristics, further comparisons of each device under different working conditions in the Matlab calculations and analysis of the vibration data compare the harvesters of the paths of the working equipment of different transmission path contribution amounts.
The transportation contribution results of the response point channels and multiple working conditions are shown in Figure 17. The X1–X3 measuring points are located on the header device, the X4–X6 measuring points are located on the transportation equipment, the X7–X9 measuring points are located on the connection position of the transportation equipment and the threshing roller and the X10–X12 measuring points are located on the threshing roller.
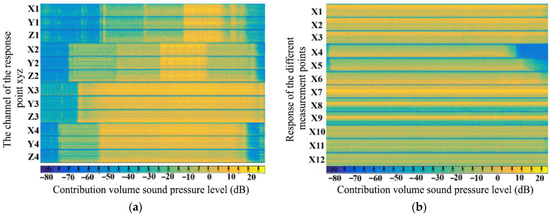
Figure 17.
Comparison of the response point channel contributions under multiple working conditions. (a) Comparison of the different channel contributions at the response points. (b) Comparison of the response contributions of different measurement points under multiple working conditions.
Comparing the transportation contributions of different working devices, the three channels of the same response point of the different working devices have the same sound pressure levels. In the conveying groove and drum coupling, the contribution amounts to the strongest sound pressure level at 25 dB for a long time and the weakest level at 20 dB. The cutting machine, transmission channel and threshing cylinder contributions to the sound pressure level are first shown enhancing the weakening trend, as the weakest sound pressure level is about 45 dB.
It can be seen from the comparison results that the three response points at the cutting table device contribute the highest sound pressure levels with small fluctuations, all of which are about 10 B. Different slot device response points contribute to the sound pressure level difference, weakening the trend overall. The sound pressure level of the X7 response point on the connection position is the highest and up to about 20 dB. According to the results of the sound pressure level distribution, the vibration contributes to the connection between the transportation equipment and threshing roller. These conclusions provide theoretical support for reducing the vibration of the harvester.
3.4. The Conclusion of the Combine Harvester Frame Simulation Analysis
The conclusion of the combine harvester frame simulation analysis can provide theoretical support for reducing the vibration of the harvester. The isometric vector distribution result of the frame excitation force is obtained based on the action of each excitation force. Therefore, the maximum principal stress distribution and key stress area of the combine harvester frame are shown in Figure 18.
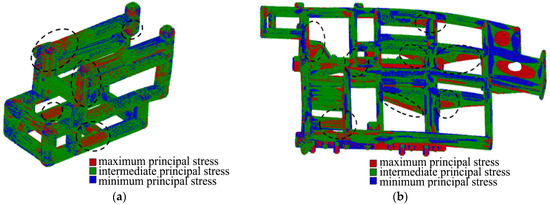
Figure 18.
Isometric vector distribution of the rice combine harvester frame excitation force. (a) Long vector distribution of the excitation force of the threshing and cleaning rack. (b) Equal length vector distribution of the chassis frame.
As shown in Figure 18, there are three areas of dense excitation force on the frame of the threshing roller. The first area is the connection position of the central installation beam of the threshing roller, the second area is the connection position between the cutting table and transportation equipment and the third area is the connection position installation beam of the threshing roller. The areas with a dense excitation force of the chassis frame are mainly located in the interchange area of the transverse and longitudinal beams. The corresponding acceleration change can be obtained by a change in the excitation force, so the transmission of the vibration can also be indirectly obtained by the transfer of the excitation force.
3.5. Vibration Characteristics Comparing the Damping Optimization Experiments
According to the damping optimization principle and the vibration characteristic analysis results, connected to the simulation results of the frame excitation force, the damping sheets installed on the corresponding location need to be optimized. Vibration amplitude curves of the channels with the most obvious changes in the vibration acceleration among the four measure points’ 12 channels of every device are obtained though FFT calculations. The results of the vibration amplitude of the devices before and after the damping optimization are shown in Figure 19 and Figure 20.
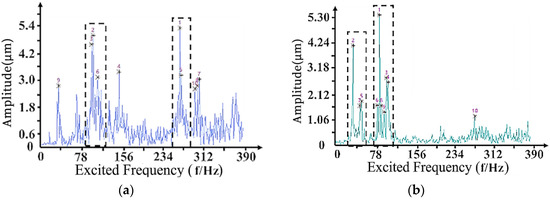
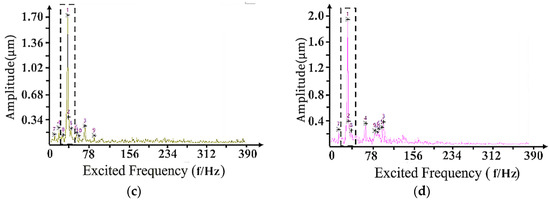
Figure 19.
Vibration amplitude before the damping optimization experiments. (a) The amplitude of measure point 1. (b) The amplitude of measure point 2. (c) The amplitude of measure point 3. (d) The amplitude of measure point 4.
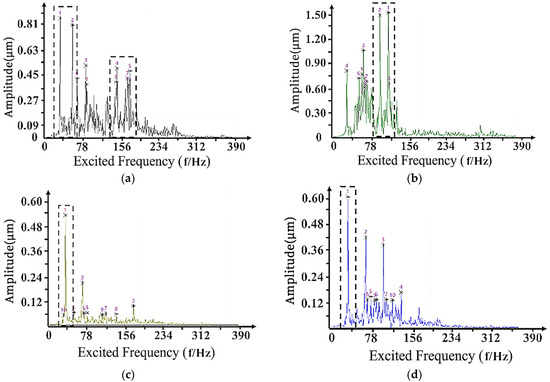
Figure 20.
Vibration amplitude after the damping optimization experiments. (a) The amplitude of measure point 1. (b) The amplitude of measure point 2. (c) The amplitude of measure point 3. (d) The amplitude of measure point 4.
As shown in Figure 19, the maximum amplitude occurs at point 1 with 5.482 μm, the excitation frequency is 268.6 Hz and the top ten peak points have multiple high-frequency amplitude. The minimum amplitude occurs at point 3 with the amplitude at 1.720 μm, the excitation frequency is 35.16 Hz and the peak points are mainly concentrated in the middle-band interval. The vibration amplitude curves after the damping optimization are shown in Figure 20, and the changes in the frequency range and amplitude of the major peak points can be obtained from the figure.
The vibration reduction of the cab can reflect the effect of the damping optimization on the vibration reduction of the frame, because cab is at the top of the frame. As shown in Figure 20, the amplitude of point 1 was weakened significantly, with the excitation frequency lowered to about 35–170 Hz, and the maximum amplitude appearing at point 2 was 1.571 μm, the excitation frequency 122.1 Hz. The minimum amplitude still occurred at measurement point 3 with the amplitude 0.052 μm, the excitation frequency 35.16 Hz and the excitation frequency interval did not change too much.
According to the comparison of Figure 19 and Figure 20, this is the conclusion: from the range of the y-axis interval, the amplitude of each point is significantly weakened, and the selected region is the excited frequency of a stronger amplitude. The amplitude distribution areas of measuring points 1 and 2 are obviously wide, but the amplitude is no longer apparent in the distribution areas after the damping optimization experiments, and the maximum amplitudes are significantly concentrated in the middle and low frequency intervals. The peaks from measure point 1 to the four test points are 5.4 μm, 5.3 μm, 1.7 μm and 2.0 μm, respectively, before the damping optimization experiments. After the optimization experiments, the peaks are significantly reduced to 0.81 μm, 1.5 μm, 0.6 μm and 0.6 μm.
In order to further clarify the damping situation of each device for damping optimization, the experiment also needs to compare the vibration acceleration situation of each device under each working condition, as shown in Figure 21.
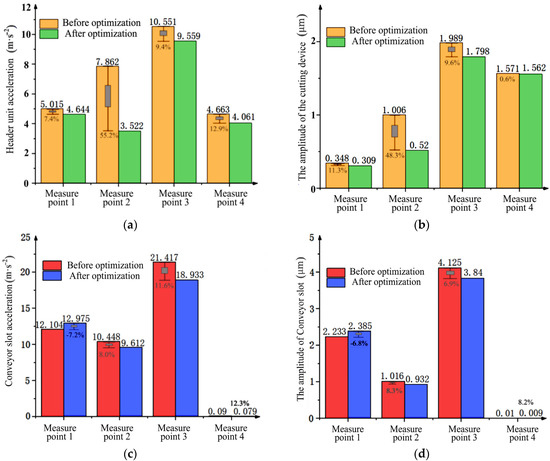
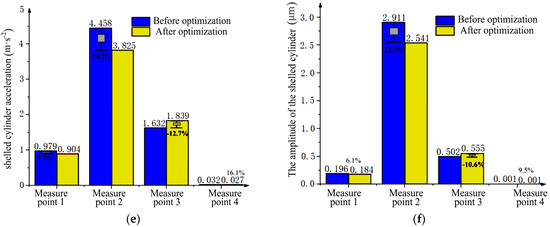
Figure 21.
Vibration characteristics changes of working devices before and after damping optimization. (a) Optimize the acceleration before and after the acceleration of the cutting table. (b) Cut optimized before and after amplitude. (c) Optimize the front and rear acceleration of the delivery tank. (d) Optimize the before and rear amplitude of the delivery tank. (e) Optimize the before and after acceleration. (f) Optimize the before and after amplitude of the threshing drum.
According to the comparison of the vibration acceleration and amplitude before and after the optimization of each device, the difference in acceleration change in the working conditions of half the cutting width and the full cutting width is higher. In the full cutting working condition, the vibration acceleration and amplitude of the cutting table both appeared weakened. Compared to the vibration accelerations and amplitudes of measure point 2 of the transportation equipment, measure points 1 and 3 of the threshing roller were enhanced to different degrees. Therefore, the damping optimization does not have the effect of global reduction vibration.
The maximum change of the vibration acceleration before and after optimization occurs at measuring point 2 of the cutting table, and the vibration acceleration decreased from 7.862 ms−2 to 3.522 ms−2 by 55.2%. The reason is that measuring point 2 is arranged in the bottom plate of the cutting table, and the bottom plate has a large area of damping sheets arranged near the feed inlet, so the vibration reduction effect is significant.
The difference value curve and percentage curve of the vibration acceleration and amplitude of each device before and after optimization were plotted as shown in Figure 22. Working conditions 1, 2 and 3 correspond to the quarter, half and full cutting working conditions, respectively. The 1–12 of abscissa indicate the four measuring points of the cutting table, the transportation equipment and the threshing roller, respectively. The horizontal coordinates 1–12 represent the four measuring points of the cutting table, conveying the trough and threshing drum, respectively.
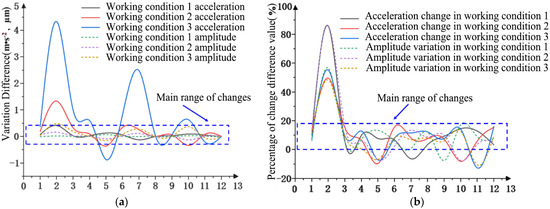
Figure 22.
Vibration acceleration change and amplitude change of each device before and after damping optimization. (a) The change difference of the three working conditions of each test point. (b) The percentage difference of the three working conditions of each test point.
Because measure point 2 is located on the damping sheets, the changes in the vibration signals are evident. The percentage of the change difference value is about 10% in measure point 2. If the influence of damping sheets at two measuring points on the vibration signal is excluded, the mean change is 6.56%. The amplitude change fluctuates a little, but the percentage of the change difference fluctuates significantly, and the change in vibration acceleration is not synchronized with the amplitude change. The reason is that the acceleration at the measurement point will change under the influence of the exciting vibration force, while the amplitude will change with the vibration transmission of the whole machine.
4. Conclusions
- (1)
- The transfer matrix is obtained by the discrete time matrix method, and the transfer path of the combine harvester can be analyzed by OTPA. Because each device is not decouped, crosstalk exists between excitation sources, and mutual coupling may occur between different transfer paths, which leads to the reduction of the OTPA method’s error. This method can efficiently calculate the transfer matrix of each device of the harvester and easily transform the nonlinear system of the whole machine, which is conducive to further research on the vibration transfer characteristics of the whole machine and each device of the harvester.
- (2)
- Through the experiment of vibration characteristics, the main influence values of the vibration acceleration of cutting table, conveying the trough and threshing drum, are 24.06 m/s2, 55.71 m/s2, 6.775 m/s2 and 45.51 m/s2, respectively. Through the analysis of the power spectrum and transmission contribution, it was found that the three response points at the cutting table device had the highest sound pressure levels, but the fluctuation was small, all of which were about 10 dB. The contribution sound pressure level at different response points of the conveyor trough device generally showed a weakening trend. Among them, the X7 response point at the connection between the conveyor groove and the threshing drum had the strongest sound pressure level, reaching about 20 dB. It can be concluded that the cutting device and transmission channel and the vibration of the threshing roller connection place are important contributions.
- (3)
- Through the simulation analysis of the exciting force transmission of the harvester, it is concluded that the main optimization areas are the intersection of the support beam at the connection of the chassis frame, the intersection of the threshing and cleaning frame conveying device and the transverse beam at the installation of the threshing drum device. By adding the damping patch in the main optimization area, the maximum vibration acceleration value of the measuring point in the front middle section of the side plate of the cutting table device decreased from 7.862 m·s−2 to 3.522 m·s−2, which was 55.2%. After damping optimization, the amplitude peaks of test points 1 to 4 in the front cab were 5.4 μm, 5.3 μm, 1.7 μm and 2.0 μm, respectively, which decreased significantly to 0.81 μm, 1.5 μm, 0.6 μm and 0.6 μm after optimization, indicating a significant optimization effect.
Author Contributions
Conceptualization, Z.T.; methodology, S.C. and H.D.; validation, G.W. and H.D.; formal analysis, S.C.; data curation, G.W. and H.D.; investigation, B.W. and H.D.; writing—original draft preparation, B.W. and H.D.; writing—review and editing, B.W. and H.D.; supervision, G.W. All authors have read and agreed to the published version of the manuscript.
Funding
This research work was supported by Key Laboratory of Modern Agricultural Equipment and Technology (Jiangsu University), Ministry of Education MAET202118, the Single Technology Research and Development Project of Jiangsu Agricultural Science and Technology Innovation Fund (CX(23)3032) and the Taizhou Science and Technology Support Plan (Agriculture) Project (TN202219), Key Laboratory of Modern Agricultural Equipment and Technology (Jiangsu University), Ministry of Education.
Institutional Review Board Statement
Not applicable.
Data Availability Statement
The data used to support the findings of this study are available from the corresponding author upon request.
Conflicts of Interest
The authors declare no conflicts of interest.
References
- Yuan, J.; Yang, J.; Wan, X.; Liao, Y.; Liao, Q. Design and Experiment of Cylinder Sieve Type Re-cleaning Device for Rape Combine Harvester. Trans. Chin. Soc. Agric. Mach. 2022, 53, 99–108. [Google Scholar] [CrossRef]
- Li, Y.; Xu, L.; Lv, L.; Shi, Y.; Yu, X. Study on Modeling Method of a Multi-Parameter Control System for Threshing and Cleaning Devices in the Grain Combine Harvester. Agriculture 2022, 12, 1483. [Google Scholar] [CrossRef]
- Guan, Z.; Mu, S.; Wu, C.; Chen, K.; Liao, Y.; Ding, Y.; Liao, Q. Steering kinematic analysis and experiment of tracked combine harvester working in paddy field. Trans. Chin. Soc. Agric. Eng. 2020, 36, 29–38. [Google Scholar] [CrossRef]
- Li, Y.; Tang, Z.; Ren, H.; Zhou, Y. Vibration Response of Combine Harvester Chassis Undergoing Multisource Excitation Force Distribution. Math. Probl. Eng. 2021, 2021, 8856094. [Google Scholar] [CrossRef]
- Chen, S.; Zhou, Y.; Tang, Z.; Lu, S. Modal vibration response of rice combine harvester frame under multi-source excitation. Biosyst. Eng. 2020, 194, 177–195. [Google Scholar] [CrossRef]
- Tang, H.; Xu, C.S.; Zhao, J.L.; Wang, J.W. Stripping mechanism and loss characteristics of a stripping-prior-to-cutting header for rice harvesting based on CFD-DEM simulations and bench experiments. Biosyst. Eng. 2023, 229, 116–136. [Google Scholar] [CrossRef]
- Ma, Z.; Wu, Z.; Li, Y.; Song, Z.; Yu, J.; Li, Y.; Xu, L. Study of the grain particle-conveying performance of a bionic non-smooth-structure screw conveyor. Biosyst. Eng. 2024, 238, 94–104. [Google Scholar] [CrossRef]
- Li, Y.; Liu, Y.; Ji, K.; Zhu, R. A Fault Diagnosis Method for a Differential Inverse Gearbox of a Crawler Combine Harvester Based on Order Analysis. Agriculture 2022, 12, 1300. [Google Scholar] [CrossRef]
- Feng, W.; Cui, J.; Li, P.; Cao, Z.; Li, Y.; Ding, X.; Zhan, X. Small Harvester Noise Reduction Design and Noise Source Analysis. Southwest China J. Agric. Sci. 2020, 33, 1081–1086. [Google Scholar] [CrossRef]
- Yang, R.; Shang, Y.; Xu, H.; Sun, X.; Liu, W.; Jiang, W.; Dong, J. Modal analyses and structure optimization of steering wheel assembly of grain combine harvester. J. Huazhong Agric. Univ. 2020, 39, 145–150. [Google Scholar] [CrossRef]
- Zhai, C.; Yang, S.; Wang, X.; Zhang, C.; Song, J. Status and Prospect of Intelligent Measurement and Control Technology for Agricultural Equipment. Trans. Chin. Soc. Agric. Mach. 2022, 53, 1–20. [Google Scholar] [CrossRef]
- Li, H.; Chen, L.; Zhang, Z. A Study on the Utilization Rate and Influencing Factors of Small Agricultural Machinery: Evidence from 10 Hilly and Mountainous Provinces in China. Agriculture 2023, 13, 51. [Google Scholar] [CrossRef]
- Tang, H.; Xu, C.S.; Zhao, J.L.; Wang, J.W. Formation and steady state characteristics of flow field effect in the header of a stripping prior to cutting combine harvester with CFD. Comput. Electron. Agric. 2023, 211, 107959. [Google Scholar] [CrossRef]
- Zhang, X.; Zhang, Y.; Shi, Z.; Ma, S.; Huang, S.; Cheng, J. Optimization and Experiment of Oil Sunflower Combined Harvester Cleaning Device. Trans. Chin. Soc. Agric. Mach. 2022, 53, 103–113. [Google Scholar]
- Ma, Z.; Zhang, Z.; Zhang, Z.; Song, Z.; Liu, Y.; Li, Y.; Xu, L. Durable Testing and Analysis of a Cleaning Sieve Based on Vibration and Strain Signals. Agriculture 2023, 13, 2232. [Google Scholar] [CrossRef]
- Tang, H.; Zhu, G.X.; Xu, W.L.; Xu, C.S.; Wang, J.W. Discrete element method simulation of rice grains impact fracture characteristics. Biosyst. Eng. 2024, 237, 50–70. [Google Scholar] [CrossRef]
- Qian, J.; Ma, S.; Xu, Y.; Li, W.; Huo, P.; Li, W. Design and test of sliding shear combined sugarcane basecutter. Trans. Chin. Soc. Agric. Eng. 2023, 39, 37–47. [Google Scholar] [CrossRef]
- Zhang, S.; Dai, F.; Zhao, W.; Tian, B.; Chen, B. Design and test of matching straw baling device for highland barley combine harvester. Acta Agric. Zhejiangensis 2020, 32, 1289–1301. [Google Scholar] [CrossRef]
- Tian, K.; Huang, J.; Zhang, B.; Ji, A.; Xu, Z. Study on the Impact of Cutting Platform Vibration on Stalk Cutting Quality in Industrial Hemp. Agriculture 2024, 14, 321. [Google Scholar] [CrossRef]
- Li, B.; Niu, G.; Liu, Y.; Sun, X.; Dong, Y.; Wang, S.; Wang, T. Vibration analysis and improvement for frame of 4JH-270 cotton rod crushing and returning machine. Agric. Res. Arid Areas 2021, 39, 257–265. [Google Scholar] [CrossRef]
- Lin, T.; Zhang, T.; Zhang, Y.; Yin, Y.; Deng, X.; Pang, Y.; Luo, S. Modal analysis and structural optimization design of small corn thresher frame. Agric. Res. Arid Areas 2022, 40, 277–284. [Google Scholar] [CrossRef]
- Zhang, X.; Sui, Z.; Li, Z.; Qin, Y.; Wang, Y.; Dong, D.; Zhao, J. Test and Optimization of Nonlinear Vibration Reduction Systems for Loader Cabs. China Mech. Eng. 2022, 33, 1529–1536. [Google Scholar]
- Wu, H.; Zhou, X.; Shi, C.; Zhang, Z. Flow-induced vibration analysis of hydropower plant under two transfer paths. Journal of Huazhong University of Science and Technology. Nat. Sci. 2020, 48, 104–109. [Google Scholar] [CrossRef]
- Xu, L.; Chai, X.; Gao, Z.; Li, Y.; Wang, Y. Experimental study on driver seat vibration characteristics of crawler-type combine harvester. Int. J. Agric. Biol. Eng. 2019, 12, 90–97. [Google Scholar] [CrossRef]
- Tang, Z.; Zhang, Z.; Chen, Z.; Pu, H.; Li, Y.; Xu, Z. Virtual Transfer Path Analysis of Vehicle Interior Noise and Vibration in Low Frequency. Automot. Eng. 2020, 42, 531–536,566. [Google Scholar] [CrossRef]
- Rui, X.; Wang, X.; Zhou, Q.; Zhang, J. Transfer matrix method for multibody systems (Rui method) and its applications. Sci. China-Technol. Sci. 2019, 62, 712–720. [Google Scholar] [CrossRef]
- Huang, Z.; Xu, P.; Huang, R.; Wei, D. Analysis on dynamic characteristics of the high-speed motor rotor system and its multi-objective optimization. J. Mach. Des. 2021, 38, 43–50. [Google Scholar] [CrossRef]
- Xu, K.; Chen, Z.; Sun, W. Optimization of position, size and thickness of viscoelastic damping patch for vibration reduction of a cylindrical shell structure. Compos. Struct. 2021, 276, 114573. [Google Scholar] [CrossRef]
Disclaimer/Publisher’s Note: The statements, opinions and data contained in all publications are solely those of the individual author(s) and contributor(s) and not of MDPI and/or the editor(s). MDPI and/or the editor(s) disclaim responsibility for any injury to people or property resulting from any ideas, methods, instructions or products referred to in the content. |
© 2024 by the authors. Licensee MDPI, Basel, Switzerland. This article is an open access article distributed under the terms and conditions of the Creative Commons Attribution (CC BY) license (https://creativecommons.org/licenses/by/4.0/).