Article

Soil-Specific Calibration Using Plate Compression Filling Technique and Monitoring Soil Biomass Degradation Based on Dielectric Properties

by
Hongjun Chen
1,2,3,
Muhammad Awais
1,3,
Linze Li
1,3,
Wei Zhang
1,3,
Mukhtar Iderawumi Abdulraheem
1,3,
Yani Xiong
1,3,
Vijaya Raghavan
4 and
Jiandong Hu
1,3,5,*
1
College of Mechanical and Electrical Engineering, Henan Agricultural University, Zhengzhou 450002, China
2
College of Mechanical Engineering, Anhui Science and Technology University, Chuzhou 233100, China
3
Henan International Joint Laboratory of Laser Technology in Agricultural Sciences, Zhengzhou 450002, China
4
Faculty of Agricultural and Environmental Sciences, McGill University, Montreal, QC H3A 0G4, Canada
5
State Key Laboratory of Wheat and Maize Crop Science, Zhengzhou 450002, China
*
Author to whom correspondence should be addressed.
Agriculture 2024, 14(5), 773; https://doi.org/10.3390/agriculture14050773
Submission received: 9 April 2024 / Revised: 14 May 2024 / Accepted: 16 May 2024 / Published: 17 May 2024
(This article belongs to the Section Agricultural Soils)

Abstract

:
Accurate estimation of soil water content (SWC) is crucial for effective irrigation management and maximizing crop yields. Although dielectric property-based SWC measurements are widely used, their accuracy is still affected by soil variability, soil–sensor contact, and other factors, making the development of convenient and accurate soil-specific calibration methods a major challenge. This study aims to propose a plate compression filling technique for soil-specific calibrations and to monitor the extent of soil biomass degradation using dielectric properties. Before and after biodegradation, dielectric measurements of quartz sand and silt loam were made at seven different water contents with three different filling techniques. A third-order polynomial fitting equation explaining the dependence of the dielectric constant on the volumetric water content was obtained using the least-squares method. The suggested plate compression filling method has a maximum mean bias error (MBE) of less than 0.5%, according to experimental results. Depending on the water content, silt loam’s dielectric characteristics change significantly before and after biodegradation. The best water content, measured in gravimetric units, to encourage the decomposition of biomass was discovered to be 24%. It has been demonstrated that the plate compression filling method serves as a simple, convenient, and accurate alternative to the uniform compaction method, while the dielectric method is a reliable indicator for evaluating biomass degradation. This exploration provides valuable insights into the complex relationship between SWC, biomass degradation, and soil dielectric properties.

1. Introduction

The soil water content (SWC), especially for topsoil above 35 cm, is of great importance for irrigation and crop growth due to its direct influence on plant health and water management [1,2]. Adequate SWC in the topsoil is essential for ensuring sufficient SWC for good plant growth throughout the growing season, making it a critical factor in irrigation management. Furthermore, SWC influences soil aeration status and the availability of nutrients to plants, further underlining its significance in crop growth and development [2,3]. Therefore, monitoring and managing SWC in the topsoil is fundamental for efficient irrigation scheduling, water conservation, and maximizing crop yield and economic benefits [4].
The dielectric method, which utilizes the significant difference in dielectric constant between the solid, liquid, and gas phases of the soil, has the advantage of high measurement accuracy, fast speed, and small soil disturbance and can be used for in situ SWC measurements. It has become one of the most commonly used methods for soil water measurement [5]. Dielectric-based sensors, such as frequency domain reflectometry (FDR), time domain reflectometry (TDR), capacitance, radar, or microwave techniques, widely use Topp model or factory calibration curves to transform measured dielectric constants into soil volumetric water content [6,7]. However, the transformational relationship between the dielectric constant and soil volumetric water content can be significantly affected by soil porosity, texture, density, temperature, and organic matter content [8,9,10]. In addition, changes in soil tillage regime, such as those due to straw return to the field, biomass degradation, fertilization, or lime treatment, may affect the accuracy of SWC estimates using sensors based on dielectric constants [11]. Therefore, the main challenge lies in the need for soil-specific calibrations to ensure accurate SWC estimation using dielectric property-based measurements.
The currently widely used soil-specific calibration methods mainly include three types: two-point calibration, multiple-point calibration, and machine learning-based calibration [12,13,14,15]. Two-point calibration is usually performed using completely dry and saturated soils for two-point anchoring, but practice has shown that its accuracy is greatly affected by soil texture and bulk density [7,14,16,17]. Multiple-point calibration is currently the most accurate method, but its complex procedures and challenges in obtaining different water contents soil samples at the same dry density affect calibration efficiency and accuracy [7,18]. Machine learning approaches have also been explored, but their accuracy remains insufficient [15,18]. Therefore, based on the existing multi-point calibration method, improving its cumbersome calibration steps can further increase the calibration efficiency.
The amount of water in the soil and the properties of the soil pore system directly impact microbial activity [19,20]. Adequate water is crucial for microbial activity, as it allows microorganisms to break down complex organic compounds into simpler forms [21]. High levels of SWC can affect biomass degradation in several ways, including reduced oxygen availability, nutrient availability, temperature, and microbial community composition [22,23]. Excess soil water can also hinder biomass degradation by creating anaerobic conditions, limiting the activity of aerobic decomposers. In waterlogged soils with poor drainage, oxygen availability decreases, leading to anaerobic decomposition processes dominated by facultative or obligate anaerobes [24]. However, extremely dry conditions can impede biomass degradation as a result of limited microbial activity. Hence, an optimal range of SWC is essential for efficient biomass degradation. It ensures that microorganisms can obtain sufficient water for metabolic processes while maintaining aerobic conditions conducive to decomposition. In addition, research has shown that the properties of the soil pore system, such as water-filled pore space, pore size distribution, and water retention curves, play a significant role in the degradation rates of organic substances [25,26].
In evaluating the relationship between SWC and microbial activity, two widely used indicators to characterize SWC are the gravimetric SWC and the saturation ratio. Gravimetric SWC, defined as the ratio of water mass to the mass of dry soil, offers the advantage of accurate measurement using techniques such as thermogravimetry [5,27]. The saturation ratio is defined as the ratio of the volume of water in the soil to the volume of voids in the soil. The term “saturation” refers to the state in which the pore spaces of the soil are completely filled with water, resulting in a maximum water-holding capacity. The optimal SWC for microbial activity has been found to be at 0.59 ± 0.03 times saturation, highlighting the importance of maintaining appropriate water levels to support microbial processes [28].
In addition, biomass degradation can significantly affect soil’s dielectric properties. As organic matter (OM) decomposes, it can alter the water-holding capacity of the soil and the polarizability of water, subsequently affecting the dielectric constant of soil [29,30,31,32]. Ankenbauer et al. [29] have shown that soil water retention, particularly saturated water content, is strongly dependent on OM content. Investigations by Czachor et al. [33] have demonstrated that soil OM can alter the surface properties of mineral phases by altering the surface tension on the mineral surface, thereby affecting the soil water retention curve. The influence of OM on the polarizability of water can be attributed to changes in the bound water/free water fraction caused by OM [30,34], as well as changes in soil aggregates induced by OM [31]. Based on the polarizability of water in soil, soil water can be classified into constitution water (including crystalline water), bound water, and free water. Among these, constitution water contributes the least to the soil’s dielectric constant, as its dipoles cannot rotate or orient in an electric field. Bound water, which consists of the first few layers of water molecules adjacent to soil solid particles, is primarily influenced by specific surface area and may have a dielectric constant ranging from 9 to 37 [34]. Free water exhibits the highest polarizability, with a dielectric constant of approximately 80 [35]. Changes in the OM content lead to variations in the bound/free water fraction in the soil, which in turn alter the overall polarizability of water in the soil. Additionally, OM can influence soil particle aggregation through different mechanisms and at different scales [31]. The formation of aggregates, on the one hand, modifies the specific surface area of the soil and, on the other hand, affects the connectivity of the soil pores and thus has a significant effect on the soil dielectric constant.
Considering the close relationship between the soil dielectric properties and SWC, as well as the impact of soil biomass degradation on SWC, we propose the idea of evaluating soil biomass degradation based on soil dielectric properties. In this study, we mixed pre-treated crop stalks into the soil and added varying water contents to simulate different soil moisture conditions, thereby assessing the feasibility of using dielectric methods to monitor soil biomass degradation. Crop stalks are composed of cellulose (40–50%), hemicelluloses (25–35%), and lignin (15–20%) in an intricate structure where the components are rigidly associated through non-covalent bonds and covalent cross-linkages, as shown in Figure 1 [26,36,37]. Under suitable temperature and moisture conditions, microorganisms proliferate and use their unique enzyme systems to decompose the organic components in crop residues. This process leads to the generation of new organic compounds and humus, thereby changing the amount of constitutional water in the soil, which in turn affects its dielectric constant.
In summary, the main challenges in accurately estimating the SWC using dielectric property-based measurements stem from the soil–sensor contact and the influence of soil texture, porosity, organic matter content, and biomass degradation on soil dielectric properties. Simultaneously, changes in SWC significantly affect the physical decomposition of biomass, altering its surface area, pore structure, and accessibility to microbial enzymes. Presenting these factors, we propose the following hypothesis: under constant soil texture, porosity, and organic matter content, studying the impact of biomass degradation on soil dielectric properties at specific water content may serve as an indicator of the degree of soil biomass degradation. The objectives of this study are as follows: (1) propose a flat plate compression filling method designed for soil-specific calibration and evaluate the accuracy of this method compared with loose filling and uniform compaction layered filling, based on experimental data of dielectric measurement of silt loam and quartz sand; (2) derive a third-order polynomial fitting equation that depicts the Kaθv relationship between silt loam and quartz sand using the least square method; (3) monitor the extent of soil biomass degradation using dielectric properties, and discuss the optimal SWC for maximum biomass degradation.

2. Materials and Methods
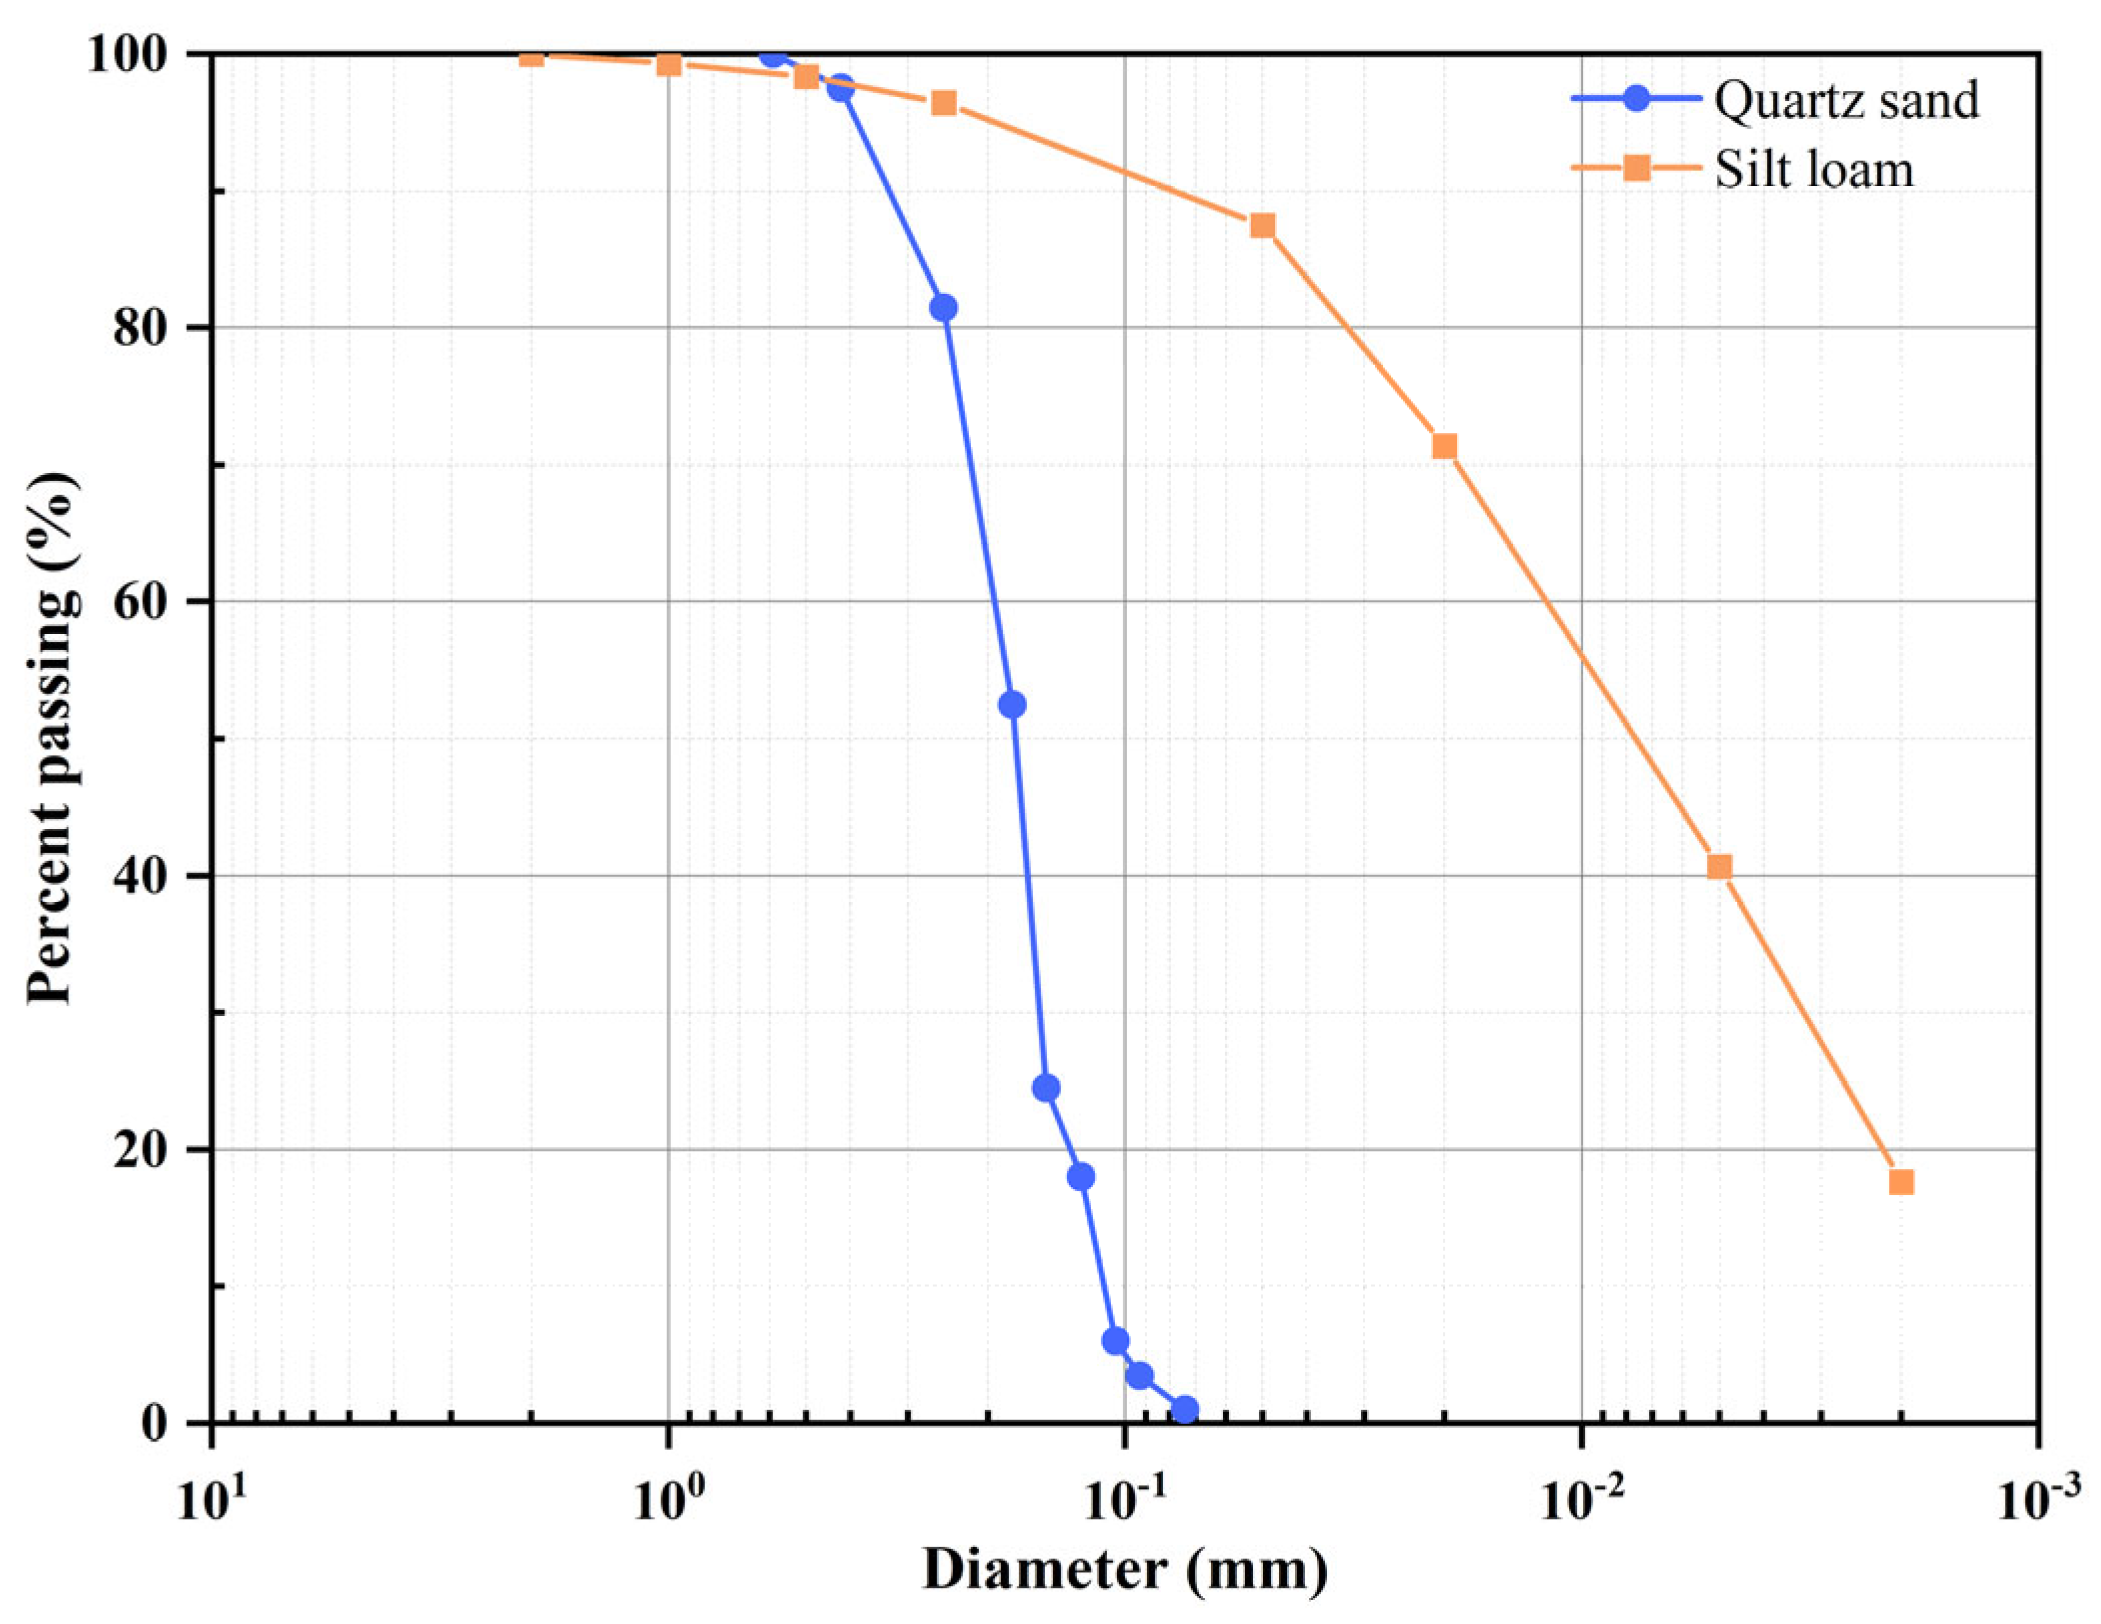
2.1. Soil Sampling

The soil samples utilized in this study were extracted from the 0 to 10 cm top layer of silt loam soil on a farm in Zhengzhou, Henan Province, China. High-purity quartz sand with a silica content greater than 99.7% and an iron and aluminum oxide content of approximately 0.3% was designated as the comparison material. Particle density for each sample was determined using the pycnometer method [38,39]. Furthermore, the initial organic content was ascertained by employing wet oxidation methods [39]. Lastly, the particle size distribution of quartz sand and silt loam soil particles larger than 0.25 mm was analyzed by the sieving method, and silt loam soil particles smaller than 0.25 mm were measured by the pipette method [40] based on Stokes’ law. Table 1 provides a comprehensive overview of the measured properties pertinent to all soils incorporated in this investigation.
The particle size distribution of silt loam and quartz sand is illustrated in Figure 2, based on the measurements obtained from the sieving and pipette methods. The particle size distribution is relatively uniform for silt loam, while quartz sand has a dominant particle size concentration in the range of 0.1 mm to 0.25 mm. According to ASTM D2487, the quartz sand used in this study falls into the category of poorly graded sand [41].

2.2. Preparation of Soil Samples

Before sample preparation, the silt loam underwent sieving using a 2 mm sieve. Subsequently, a specific quantity of silt loam and quartz sand were individually placed into an electric constant-temperature blast drying oven set to 105 °C for a 24 h drying period. Following the drying process, the soil was allowed to return to room temperature before undergoing further treatment. The wheat straw (WS) was collected from a local farm and was dried, cut, and sieved into 0.1 to 0.5 cm segments. Before the utilization, the WS was soaked in 5 g/L Alpha-D-Glucose solution for a basic pretreatment strategy to enhance the biodegradability of the WS, improve its integration with the soil matrix, and increase the availability of nutrients for the microbial community, ultimately facilitating the degradation and utilization of the organic biomass [42]. Later on, the WS was dried before mixing with an already prepared silt loam sample in a w/w% ratio of 20%. After mixing, the particle density of the soil sample changed. Consequently, the dry density of silt loam mixed with WS was measured to be 2.07 Mg m−3 by the pycnometer method.
A specific amount of tap water was added to the silt loam sample mixed with WS and stirred thoroughly to achieve a uniform water distribution within the soil sample. Initially, a portion of the prepared sample was collected using a core cutter (100 cm3) and dried at 105 °C for 24 h to determine the gravimetric water content, which was then utilized to calculate the volumetric water content and the dry bulk density of the prepared soil samples. Following this, soil samples were dispensed into graduated PVC cylindrical containers, each 120 mm in diameter and 150 mm in height, using three distinct methods as follows:
(1)
Loose filling: The soil sample is gently poured into the PVC container without any compaction;
(2)
Uniform compaction by layer (compaction state 1): After each layer of soil sample was added, a flat plate was positioned over the soil sample and then gently tapped with a rubber hammer to ensure the absence of visible air gaps and significant density variations within the test material;
(3)
Flat plate compression filling (compaction state 2): The entire soil sample was poured into a PVC container, which was then shaken to eliminate some excess pores in the soil sample. After placing a flat plate over the soil sample, a certain pressure was administered and maintained to ensure that the sample attained the same dry bulk density as in method (2).
This process resulted in the preparation of seven silt loam samples with varying water content, which were followed by the preparation of seven quartz sand samples with distinct water content using a similar method, with the exception that WS was not added to the quartz sand samples. The gravimetric water content and dry bulk density of the prepared silt loam and quartz sand samples, measured using the core cutter method [8,9,43], are depicted in Table 2. Subsequently, the prepared soil samples and quartz sand samples were wrapped in plastic and positioned in a biological incubator set at a temperature of 23 ± 1 °C for 168 h to facilitate any potential differences in biodegradability. To maintain air pressure equilibrium within the sample, several small holes were pierced in the plastic wrap using a needle, ensuring that they were not too large to prevent excessive water evaporation. After the incubation period (i.e., after biomass degradation), one part of each soil sample was mixed with five parts of distilled water. Then, soil solutions were used to detect any biological oxidation entities of biomass, such as carboxylic acids. More specifically, following the standard protocol established by Karicheva et al. [44], short-chain volatile carboxylic acids (SCVCAs) were measured for soil solutions by using an ion-exchange chromatography (ICS-5000, Dionex, Sunnyvale, CA, USA).

2.3. Measurements of the Apparent Dielectric Constant

The apparent dielectric constant of soil samples under different water content was measured using a time domain reflectometer (MiniTrase, 6050X3, purchased from Soil Moisture Equipment Corp. in Santa Barbara, CA, USA). A custom-made two-rod stainless steel waveguide probe with a length of 100 mm, a diameter of 6 mm, and a center-to-center spacing of 50 mm was used. When the electromagnetic wave propagates back and forth along the waveguide probe, the propagation speed is affected by the apparent dielectric constant of the porous medium around the probe. The acquired reflected waveforms, including tangential fitting, are automatically analyzed by the MiniTrase built-in software 6.1.6 to determine the start and end times of the reflection. In turn, the obtained transmission time information provides the key for calculating the volumetric water content θv of porous media.
To verify the reproducibility of the TDR measurements, for each soil sample the probe was inserted vertically in three different locations and the TDR readings were taken separately. Dielectric measurements were performed before and after biodegradation on each prepared sample. The first set of dielectric measurements was conducted immediately after the sample was prepared. Subsequently, after 168 h of biodegradation, a second set of dielectric measurements was performed.
In summary, 2 types of soil (quartz sand and silty loam), were used in this study. For each type of soil, 7 samples with varying water content were prepared and subsequently filled using 3 distinct methods. In total, 42 samples were obtained for further analysis and investigation. Dielectric measurements were performed on each sample before and after biomass degradation, with 3 repetitions per sample, resulting in a total of 252 TDR readings.

2.4. Data Processing and Analysis

As detailed in Section 2.3, the waveform analysis in MiniTrase TDR is automatically performed using the double tangent analysis method. It derives the apparent dielectric constant Ka from a single measurement and computes and presents the volumetric water content corresponding to Ka based on the factory calibration curve integrated within MiniTrase. However, the factory calibration does not incorporate the inherent electromagnetic characteristics of individual soils, necessitating further verification of its measurement accuracy.
The classical general empirical formula describing the relationship between the volumetric water content θv of porous media and the measured apparent dielectric constant Ka is the third-order polynomial calibration curve given by Topp, Davis, and Annan [6]:
K a = 3.03 + 0.093 θ v + 0.0146 θ v 2 7.67 × 10 5 θ v 3
where Ka is the apparent dielectric constant of soil, and θv is the soil volumetric water content (%).
In this study, to enhance the accuracy of the measurements and effectively monitor the impact of biodegradation on SWC measurements using the dielectric method, the adopted calibration equations are based on the form of the Topp equation, using the dielectric constants to derive the following calibration equations:
K a = a + b θ v + c θ v 2 d θ v 3
where a, b, c, and d are fitting coefficients.
In assessing the performance of the measurement data and derived calibration equations within this study, metrics such as mean bias error (MBE), root mean square error (RMSE), coefficient of determination (R2), and coefficient of variation (CV) were employed.
M B E = i = 1 n P r e d i O b s i n
R M S E = i = 1 n ( P r e d i O b s i ) 2 n
R 2 = 1 i = 1 n ( P r e d i O b s i ) 2 i = 1 n ( O b s ¯ O b s i ) 2
C V = 1 n i = 1 n ( O b s i O b s ¯ ) 2 O b s ¯
where P r e d i represents the i t h predicted value of the modeled parameter, O b s i signifies the corresponding observed value, O b s ¯ represents the mean observed value, while n represents the total number of distinct observed–predicted value pairs. MBE indicates under- and overestimation by the model. RMSE is expressed in the same units as the estimated parameter, and proximity to 0 signifies superior performance. R2 ranges between 0 and 1, where values nearer to 0 suggest a minimal correlation and values closer to 1 indicate a stronger correlation [7]. CV is used to assess the degree of dispersion between a set of measurements, with larger values indicating greater dispersion in the data.

3. Results and Discussion

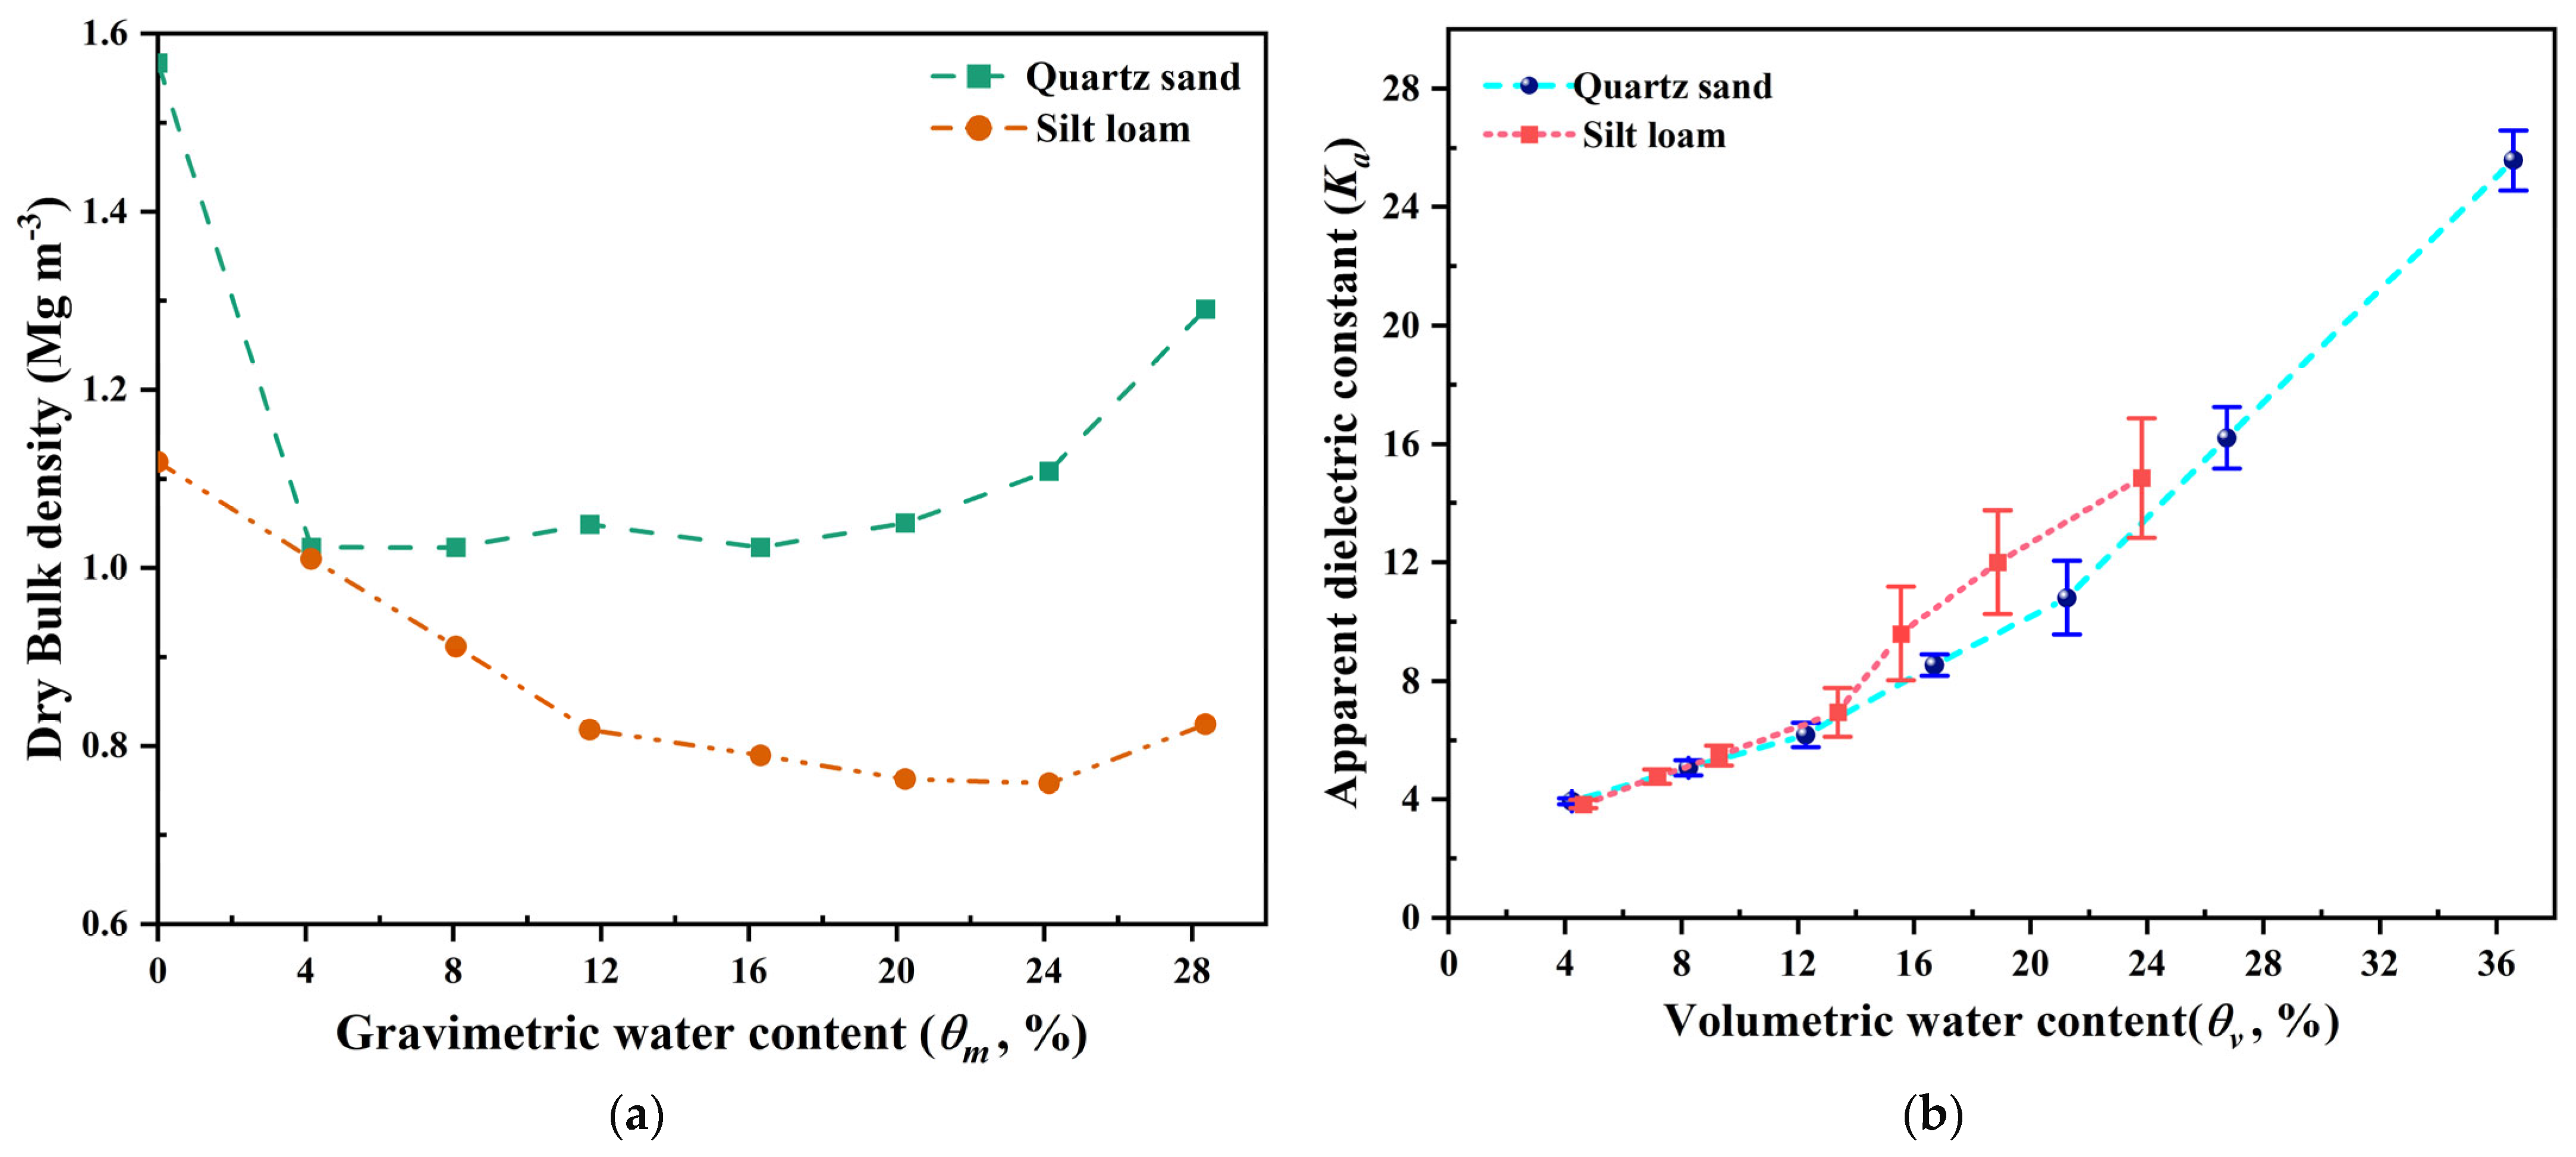
3.1. Variation of Dry Bulk Density and Dielectric Constant of Samples under Loose Filling Conditions

The dry bulk density of quartz sand and silt loam samples with varying gravimetric water contents under loose filling conditions is illustrated in Figure 3a. Note that the ‘dry bulk density’ discussed in this study is obtained by subtracting the weight of water from the weight of wet soil and then dividing it by the volume of the soil sample. The dry quartz sand exhibits a dry bulk density of 1.57 Mg m−3, while the dry bulk density of quartz sand with 4% to 20% water content experiences slight fluctuations around 1.03 Mg m−3, signifying the evident volume expansion of the utilized quartz sand after the water combination. After water content exceeds 20% by weight, the dry bulk density of quartz sand begins to increase with increasing water content. Although the employed quartz sand lacks any “clay particles”, its particles are concentrated around 0.1 mm (Figure 2), characterizing fine particle size, thus underscoring its expansion capacity following water agitation.
Separated from the rapid reduction in dry bulk density observed in quartz sand, the dry bulk density of clay loam gradually decreases with increasing water content. With a water content of 24%, the dry bulk density reaches a minimum value of 0.76 Mg m−3, followed by an increase as the water content increases. The observed changes in the dry bulk density relative to the water content reveal that, unlike unperturbed soils, the dry bulk density of topsoil in arable land varies under the influence of tillage and dry and wet variability [30]. Moreover, the preferred water content corresponding to tillage to enhance soil aeration ranges from 12% to 24%, which is because the dry bulk density of soil within this water content range is the lowest, as shown in Figure 3a.
Since the dielectric constant is correlated with the volumetric water content, the gravimetric water content listed in Table 2 is transformed into volumetric water content using the dry bulk density shown in Figure 3a. The dielectric constant of quartz sand and silt loam samples with varying volumetric water contents under loose filling conditions is illustrated in Figure 3b. Note that the error bars in the figure represent the standard deviations. At low volumetric water content levels (quartz sand below 20% and silt loam below 15%), the dielectric constant exhibits minimal dispersion, evident from the error bars in Figure 3b.
As the volumetric water content progressively increases, the discreteness of the dielectric constant undergoes a sudden elevation, and the corresponding CV exceeds 10%. This indicates that accurately determining medium to high water content values is infeasible when the probe is inserted vertically into a loosely packed sample. This issue may arise from loose filling, potentially resulting in a small gap between the probe rod and the soil after insertion. The TDR waveform is highly susceptible to variations in the air gap between the rod and the soil [45]. Previous studies [46,47] have similarly noted that the presence of an air gap can cause measurement inaccuracies. In addition, soil heterogeneity caused by loosely packed samples can also lead to significant measurement errors. As a result, loose packing is not suitable for soil-specific calibration of vertically inserted probes.

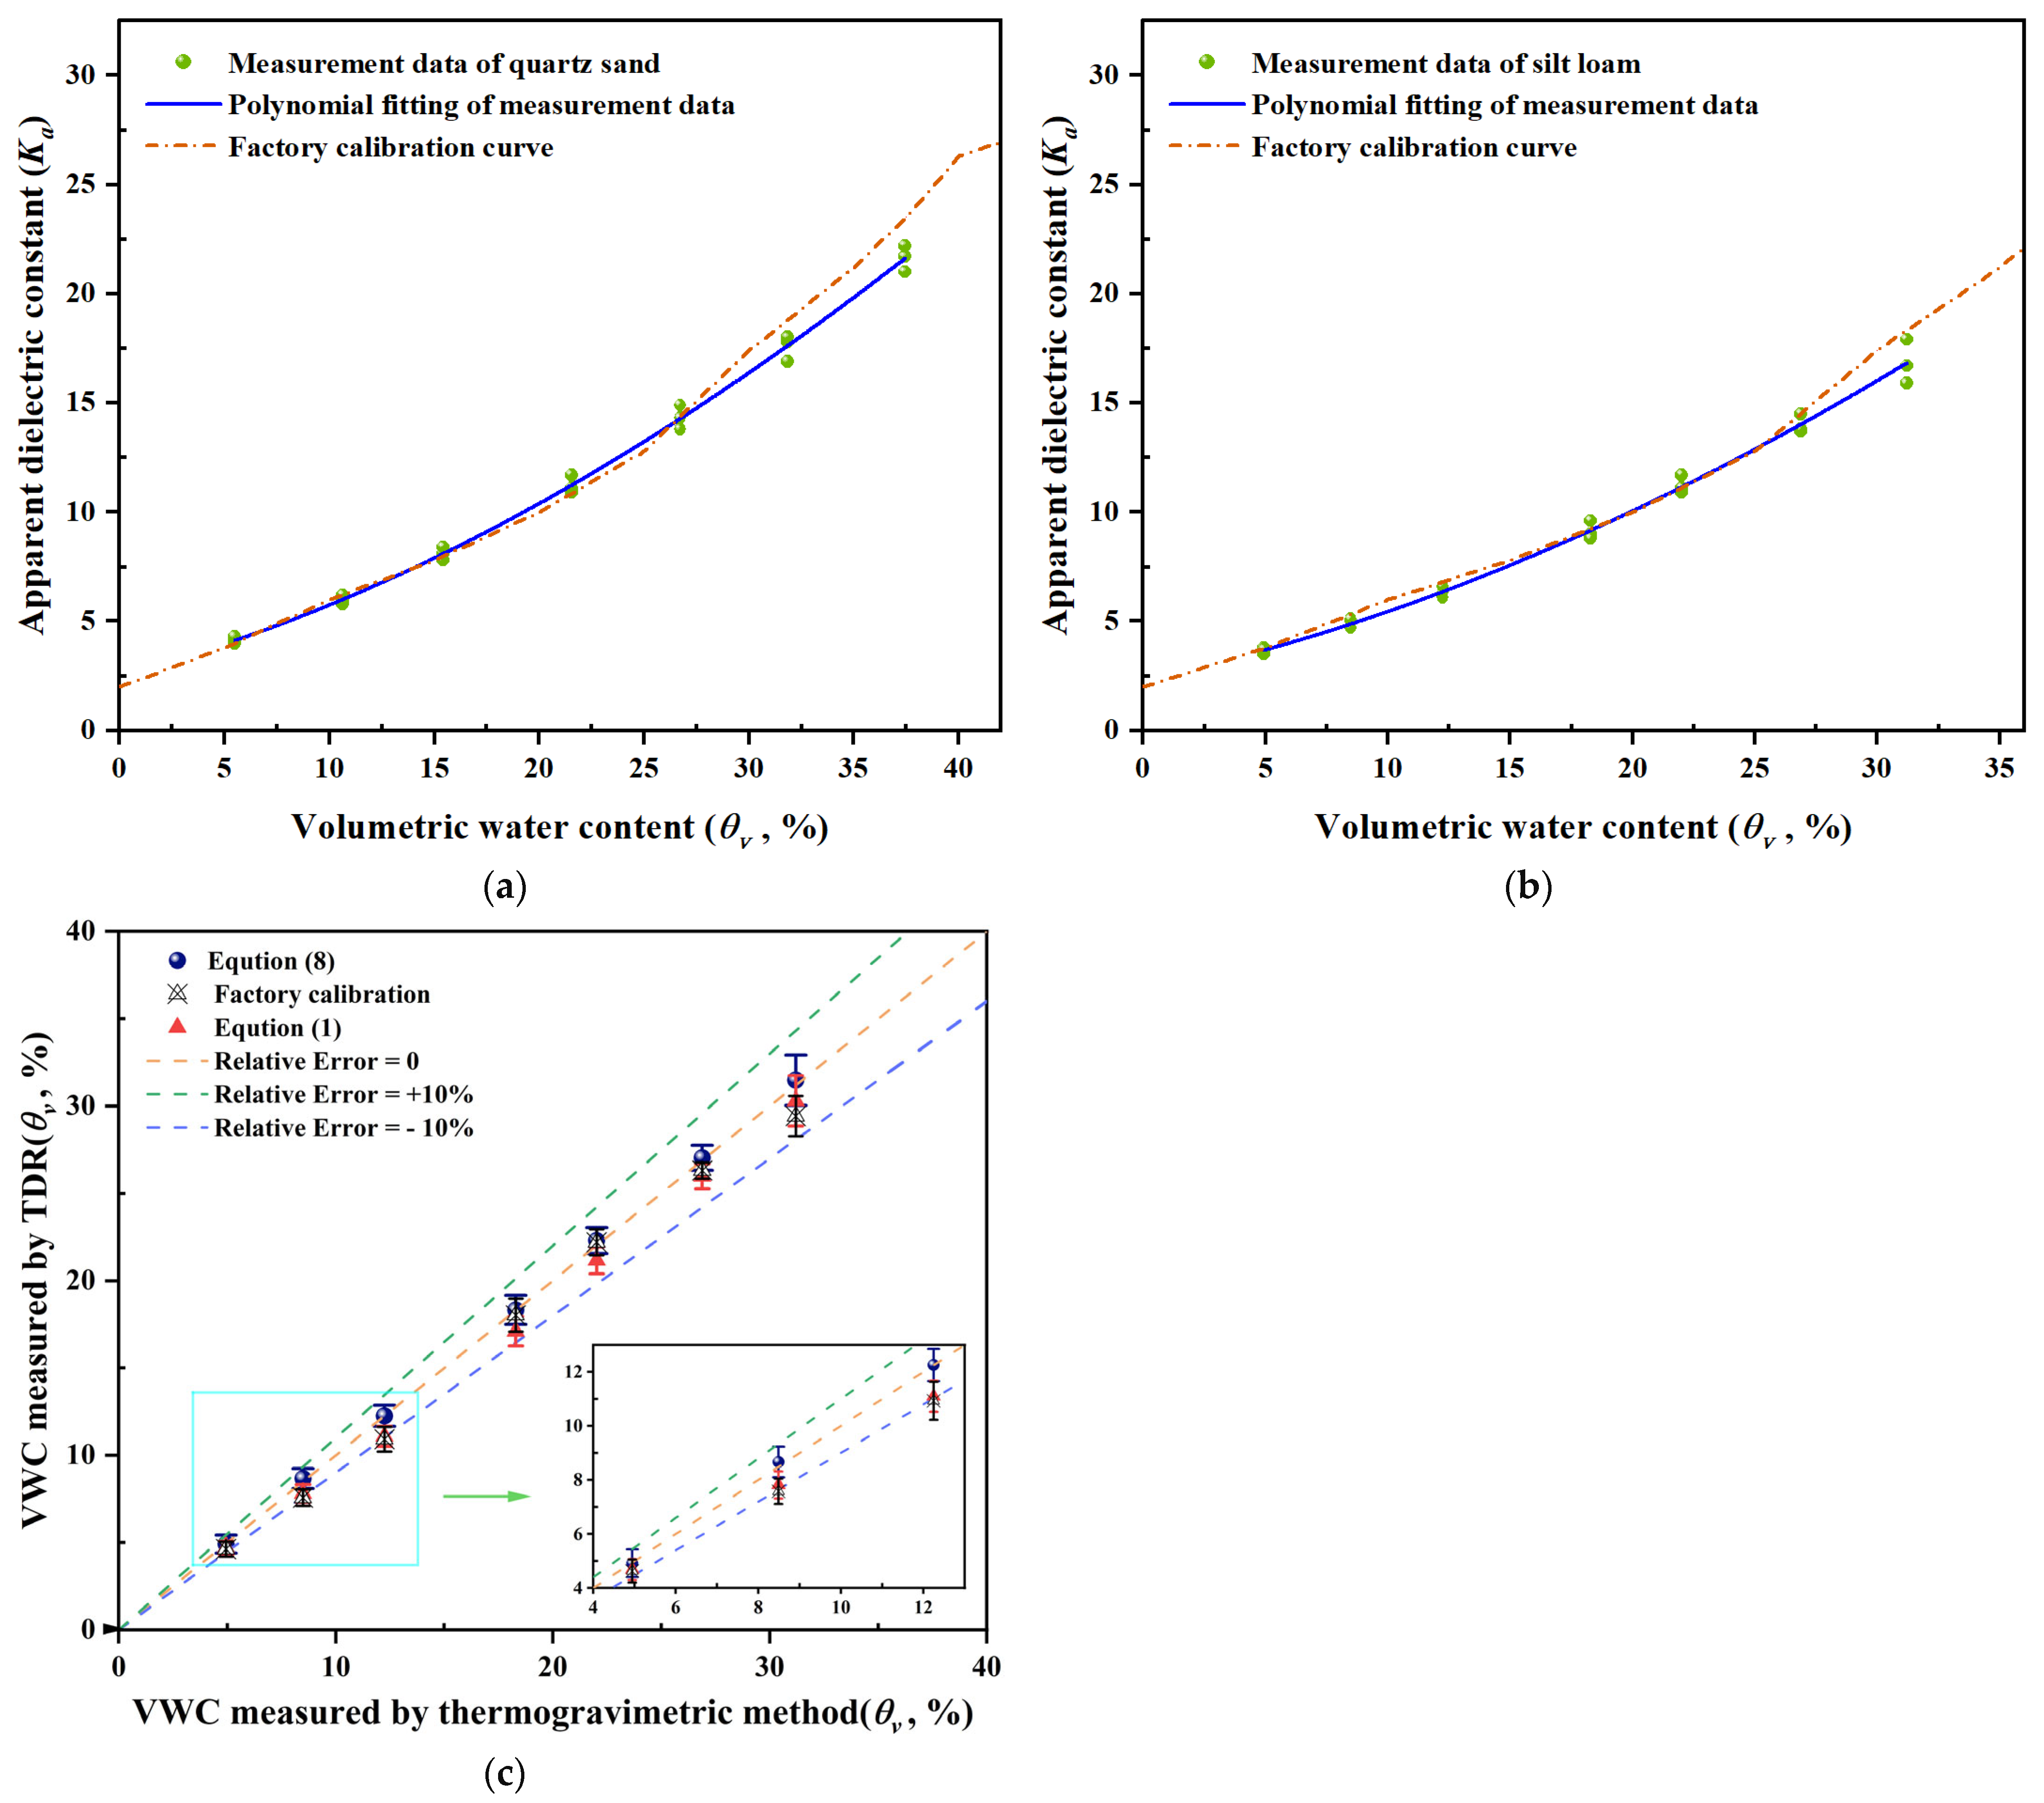
3.2. Developing Soil-Specific Calibration Equation Using Compression Filling Method

The built-in software of MiniTrase utilizes the propagation time of electromagnetic waves along the probe to calculate the corresponding dielectric constant. Subsequently, it determines the volumetric water content based on the factory calibration curve. To address concerns about the accuracy of the factory calibration, specific calibration curves for quartz sand and silt loam were derived using data from the water content measured by thermogravimetry and the dielectric constant output by MiniTrase, using a least-squares method. The calibration equation for quartz sand obtained from the fit is as follows:
K a = 2.573 + 0.240 θ v + 0.008 θ v 2 2.20 × 10 5 θ v 3
The coefficient of determination R2 = 0.996 and the RMSE = 0.158. The specific calibration curve for silt loam obtained from the fit is as follows:
K a = 2.339 + 0.232 θ v + 0.008 θ v 2 2.30 × 10 5 θ v 3
The coefficient of determination R2 = 0.992 and the RMSE = 0.200. The fitted calibration curves are depicted in Figure 4a,b, respectively, with the fitted curves represented by solid lines and the factory calibration curves by short dash–dot lines. In contrast to the measurement results of loose filling, as depicted in Figure 3b, the dielectric constant values of soil samples filled using method (3) exhibit lower dispersion, with the CV for the dielectric constants of all seven groups of silt loam being less than 6%, and for quartz sand being less than 4%. This suggests the effective removal of the probe insertion gap effect through plate compression. When the volumetric water content is below 27% for quartz sand and below 25% for silt loam, the error of the factory calibration only slightly exceeds that of the soil-specific calibration. As the water content continues to increase, the factory calibration curve and the soil-specific calibration curve rapidly diverge.
To assess the accuracy of the calibration curve obtained using method (3), dielectric measurements were conducted on samples filled using method (2). The comparison of the measurement results of the volumetric water content of silt loam obtained by thermogravimetry and the dielectric method is shown in Figure 4c. The volumetric water content from the dielectric method is derived from Equations (1) and (8) and the factory calibration curve, respectively. In general, following specific calibration, there is a significant improvement in the accuracy of measuring soil volumetric water content by the dielectric method, with the MBE of seven groups of measured values being less than 0.5%, while the maximum MBE for factory calibration and Equation (1) is −1.78% and −1.19%, respectively. Among the seven groups of measured values, factory calibration underestimates the water content of silt loam in six groups.
In comparison, all seven groups of water content are consistently underestimated by Equation (1). This can be observed from the placement of the triangle symbols in Figure 4c, which are all positioned below the reference line with a relative error of 0%. This indicates a systematic underestimation of water content by Equation (1). It may be due to the fact that Equation (1) is primarily applicable to mineral soil [48,49], whereas the silt loam used in this study added 20% WS, resulting in high organic matter content and low dry bulk density. Moreover, previously, it has been well established that incorporating higher amounts of WS (6000 kg/ha and 9000 kg/ha) into the soil can significantly increase soil organic carbon (SOC) levels, leading to a major reduction in soil bulk density [50].
The high accuracy of specific calibration on the soil sample prepared by method (2) indicates that despite uneven filling density in the sample obtained by method (3), its calibration accuracy is very close to that of the uniform filling method (2). Previous studies have also shown that soil-specific calibration can dramatically improve the accuracy of SWC determinations, with errors well below 0.05 m3/m3 over the entire SWC range and depth [39,51,52]. Method (2) is one of the three widely used calibration methods for soil-specific calibration [7]. Therefore, when the probe is vertically inserted, the method (3) adopted in this study serves as a simple and convenient alternative method for uniform compaction by layer.

3.3. Biomass Degradation

Appropriate SWC is essential for maintaining stable microbial habitats, preserving soil microbial community diversity and quantity, and facilitating microbial metabolic activity and growth [26]. However, the metabolic activity of microbial flora is also reliant on soil aeration and gas content [53]. As described in Section 2.2, small holes were punctured in the plastic package using needles to facilitate oxygen supply for microbial degradation and to maintain air pressure balance inside and outside the soil sample, which unfortunately led to water evaporation. Therefore, evaluating the degree of water evaporation and its impact on the experimental results is necessary. Water evaporation was found to be less than 0.3% for each quartz sand sample by comparing the water content variations before and after incubation in quartz sand with different water contents. Given that these quartz sand samples share the same initial water content and culture conditions as the silt loam, it is reasonable to assume that water evaporation was also minimal for each silt loam sample, and therefore, the effects of water evaporation were not considered in the subsequent analysis.
The WS biomass degradation was observed after 168 h of hydraulic retention time (HRT). All seven silt loam samples prepared and sequentially analyzed before were assessed for evidence of biomass degradation, volumetric water contents, and short-chain volatile carboxylic acids (SCVCAs) as biomass degradation products [54,55]. Moreover, Figure 5 illustrates the differences in volumetric water contents of the samples when processed for biodegradation. As the gravimetric water content of soil samples gradually increases from 4% to 24%, it was observed that the water content consumed by biodegradation gradually increases, and the water availability becomes more favorable, allowing microorganisms to thrive and consume more water through their metabolic processes [56]. Samples with a GWC of 24% (the corresponding saturation ratio is 0.54) have been observed as the best fit for biomass degradation because they followed the maximum volumetric water content reduction among all other samples. This reflects an ideal environment for biomass degradation, enhanced microbial action, an increase in soil porosity, and an overall decrease in volumetric water contents. Note that in comparison to Franzluebbers [28], the optimal saturation ratio for SWC related to microbial activity, as obtained in our study, is slightly lower. The difference could be attributed to variations in soil organic matter content, treatment methods, and duration of cultivation.
Based on the findings of the current study, the reduction in the volumetric water content can be explained from the following several perspectives:
(1)
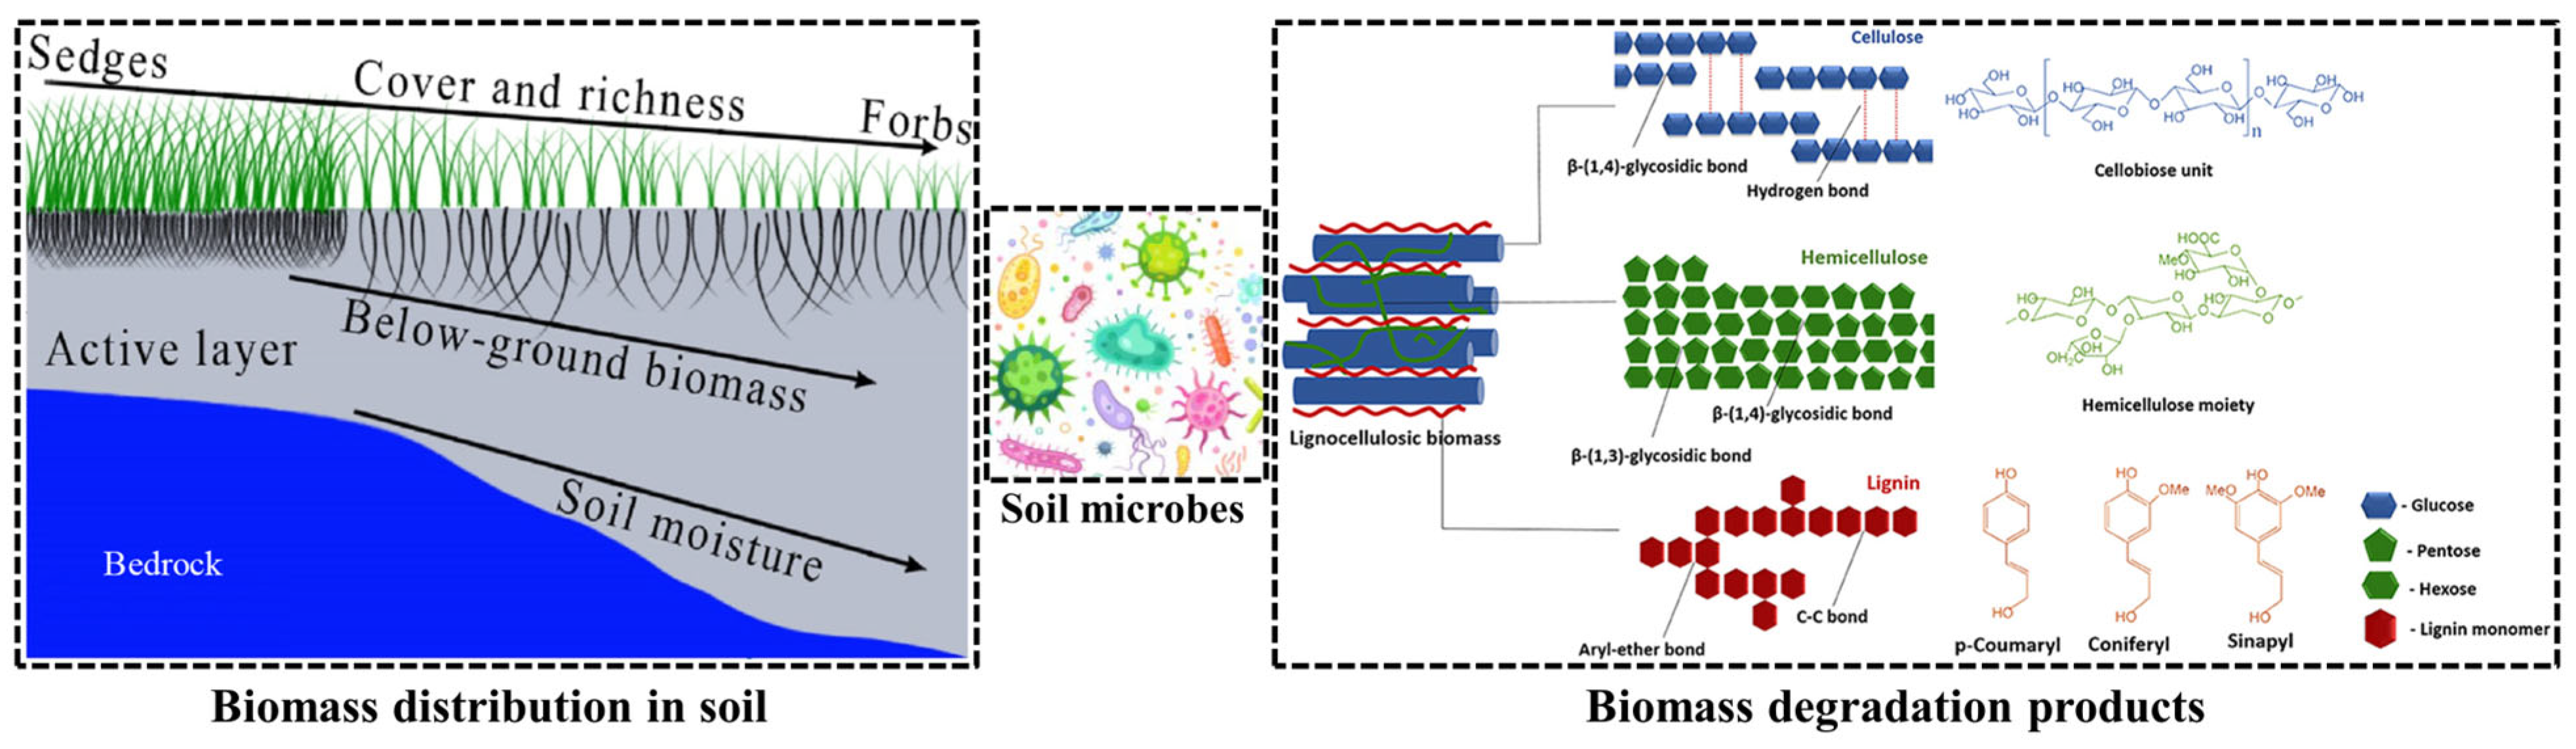
The degradation of biomass leads to the conversion of a portion of soil water into constitution water or crystalline water, where constitution water exists in the form of H+, (OH)-, (H3O)+, while crystalline water refers to neutral water molecules occupying specific positions within mineral lattices. This occurs through changes in the formation of organic hydrates and/or the mineral molecular structure, thereby consuming a portion of water in the soil samples [35]. More specifically, organic matter is broken down into smaller organic molecules via hydrolysis reactions [57]. These reactions can involve the action of enzymes that break down water molecules and bind them to organic substances, resulting in the formation of constitution water. After microbial decomposition in the soil, organic matter further undergoes biotransformation processes to produce inorganic material, which may lead to the formation of crystalline water [58];
(2)
Interactions between organic molecules produced during biomass degradation and water molecules alter the distribution and arrangement of water in the soil, resulting in the conversion of some free water into bound water [30]. This results in a reduction in the overall polarizability of the water, which is reflected in the measured decrease in the dielectric constant;
(3)
Biomass degradation affects soil grain aggregation through various mechanisms and at different scales [31]. This, in turn, affects the specific surface area of the soil and the connectivity of the soil pores, significantly affecting the soil dielectric constant. More specifically, the decomposition products of organic matter, the binding effects of organic matter, and metabolic byproducts of microbial activity all play a significant role in the formation of soil aggregates during soil biomass degradation.
Please note that Equation (8) is used to calculate the volumetric water content before and after biomass degradation, and the change in volumetric water content is a result of the change in dielectric constant. Considering the significant magnitude of the dielectric constant variation, we have compared it with results from some related literature. Szyplowska et al. [30] investigated the relationship between organic matter content, volumetric water content, and dielectric constant. Calibration curves of soil volumetric water content versus dielectric constant obtained in the study reveal that soils with different organic matter content exhibit different dielectric constants ranging from 0 to 3 for the same volumetric water content condition, which is in line with our findings. Silva et al. [39], Owenier et al. [35], and Negron-Juarez et al. [59] have shown that when calculating the volumetric water content of soils with high organic matter content using the Topp equation, errors can sometimes reach 0.2 m3/m3, indicating that the differences in dielectric constant are greater than the values obtained in our study. It should be emphasized that the differences in soil volumetric water content obtained from Figure 5 are not solely affected by changes in organic matter content due to biomass degradation but rather the combined effect of the three aforementioned factors.
In addition, the detected SCVCAs also promote the use of water content for biomass degradation and subsequent oxidation of biomass to SCVCAs. In soil biomass degradation, microorganisms break down complex organic matter into simpler inorganic compounds or small organic molecules, and SCVCAs are an important product of this process [57]. The SCVCAs maximum production was also reported for the samples having 24% of GWCs. Therefore, it can be well established that the biomass degradation was well supported in samples with 24% GWC [60]. A noticeable reduction in water content consumed by biodegradation was observed when the gravimetric water content increased from 24% to 28%. This decline may be attributed to the impact of high water content on the oxygenation conditions necessary for biodegradation. However, in further wet soils, the reduced gas diffusion can lead to low oxygen levels, which can restrict the biodegradation process under oxic (aerobic) conditions [61]. In conclusion, the correlation between the volumetric water content measured by the dielectric method and the measurement results of SCVCAs suggests that employing the dielectric method to measure the volumetric water content of soil samples before and after biodegradation serves as a reliable indicator for evaluating biodegradation.

4. Conclusions

This study aims to propose a plate compression filling technique for soil-specific calibrations and to monitor the extent of soil biomass degradation using dielectric properties. Dielectric measurements of silt loam and quartz sand were conducted at seven different water contents using three different filling methods before and after biodegradation. By comparing and analyzing the results of 252 dielectric measurements, the following conclusions can be drawn:
  • Soil samples have shown variable levels of expansion in relation to water content when there is loose filling. Following probe insertion, this expansion creates a tiny space between the probe rod and the soil, which could cause the measured dielectric constant’s coefficient of variation (CV) to rise above 10%. Consequently, the loose packaging is not suitable for soil-specific calibration when the probe is inserted vertically;
  • After plate compression filling, the dispersion of the measured dielectric constants of soil samples decreased significantly, with their CV values all measuring less than 6%. A third-order polynomial fitting equation explaining the dependency of the dielectric constant on the volumetric water content was found by applying the least-squares method. The suggested plate compression filling approach produced a mean bias error (MBE) of less than 0.5%, according to the findings of the dielectric measurements; in contrast, the maximum MBE associated with factory calibration and Equation (1) was −1.78% and −1.19%, respectively. These findings indicate that the plate compression filling method serves as an effective, simple, and accurate alternative to the uniform compaction method;
  • By studying the impact of biomass degradation on soil dielectric properties at specific water content, it was concluded that a gravimetric water content of 24% (the corresponding saturation ratio is 0.54) was most effective in promoting biomass degradation. The SCVCAs maximum production was also reported for the samples having 24% of gravimetric water content. The correlation between the volumetric water content difference measured by the dielectric method and the measurement results of SCVCAs suggests that employing the dielectric method to measure the volumetric water content of soil samples before and after biodegradation serves as a reliable indicator for evaluating biodegradation.
This investigation offers insightful information about the intricate connection between soil dielectric characteristics, biomass degradation, and SWC. The link between biodegradation and soil dielectric constant under the effect of temperature, porosity, texture, and other factors, however, requires more investigation.

Author Contributions

Conceptualization, J.H. and H.C.; methodology, H.C. and M.A.; software, H.C. and L.L.; validation, H.C., W.Z. and M.I.A.; formal analysis, H.C. and M.A.; investigation, H.C. and Y.X.; resources, J.H.; data curation, H.C.; writing—original draft preparation, H.C. and M.A.; writing—review and editing, H.C., J.H. and M.A; visualization, H.C.; supervision, J.H. and V.R.; project administration, J.H. and H.C.; funding acquisition, J.H. All authors have read and agreed to the published version of the manuscript.

Funding

This research was funded by the National Natural Science Foundation of China, grant number 32071890, the Henan Center for Outstanding Overseas Scientists, grant number GZS2021007, and the National Laboratory Project, grant number SKL2023ZZ09.

Institutional Review Board Statement

Not applicable.

Data Availability Statement

All data generated or analyzed during this study are included in this published article.

Conflicts of Interest

The authors declare no conflicts of interest.

References

  1. Abdulraheem, M.I.; Chen, H.; Li, L.; Moshood, A.Y.; Zhang, W.; Xiong, Y.; Zhang, Y.; Taiwo, L.B.; Farooque, A.A.; Hu, J. Recent Advances in Dielectric Properties-Based Soil Water Content Measurements. Remote Sens. 2024, 16, 1328. [Google Scholar] [CrossRef]
  2. Zhao, Y.; Song, J.; Cheng, K.; Liu, Z.; Yang, F. Migration and remediation of typical contaminants in soil and groundwater: A state of art review. Land Degrad. Dev. 2024, 35, 2700–2715. [Google Scholar] [CrossRef]
  3. Zhao, Y.; Wang, H.; Song, B.; Xue, P.; Zhang, W.; Peth, S.; Lee Hill, R.; Horn, R. Characterizing uncertainty in process-based hydraulic modeling, exemplified in a semiarid Inner Mongolia steppe. Geoderma 2023, 440, 116713. [Google Scholar] [CrossRef]
  4. Bwambale, E.; Abagale, F.K.; Anornu, G.K. Smart irrigation monitoring and control strategies for improving water use efficiency in precision agriculture: A review. Agric. Water Manag. 2022, 260, 107324. [Google Scholar] [CrossRef]
  5. He, H.; Aogu, K.; Li, M.; Xu, J.; Sheng, W.; Jones, S.B.; Gonzalez-Teruel, J.D.; Robinson, D.A.; Horton, R.; Bristow, K.; et al. A review of time domain reflectometry (TDR) applications in porous media. In Advances in Agronomy; Sparks, D.L., Ed.; Academic Press: Cambridge, MA, USA, 2021; Volume 168, pp. 83–155. [Google Scholar]
  6. Topp, G.C.; Davis, J.L.; Annan, A.P. Electromagnetic determination of soil water content: Measurements in coaxial transmission lines. Water Resour. Res. 1980, 16, 574–582. [Google Scholar] [CrossRef]
  7. Kargas, G.; Soulis, K.X. Performance evaluation of a recently developed soil water content, dielectric permittivity, and bulk electrical conductivity electromagnetic sensor. Agric. Water Manag. 2019, 213, 568–579. [Google Scholar] [CrossRef]
  8. Tian, Z.C.; Lu, Y.L.; Ren, T.S.; Horton, R.; Heitman, J.L. Improved thermo-time domain reflectometry method for continuous in-situ determination of soil bulk density. Soil Tillage Res. 2018, 178, 118–129. [Google Scholar] [CrossRef]
  9. Zhang, M.H.; Tian, Z.C.; Zhu, Q.; Chen, J.Z. In-situ assessment of soil shrinkage and swelling behavior and hydro-thermal regimes with a thermo-time domain reflectometry technique. Soil Tillage Res. 2023, 227, 105617. [Google Scholar] [CrossRef]
  10. Chanzy, A.; Gaudu, J.-C.; Marloie, O. Correcting the Temperature Influence on Soil Capacitance Sensors Using Diurnal Temperature and Water Content Cycles. Sensors 2012, 12, 9773–9790. [Google Scholar] [CrossRef]
  11. Xiao, Q.L.; Zhao, W.H.; Ju, C.Y.; Peng, K.; Yuan, M.; Tan, Q.Z.; He, R.; Huang, M.B. Effects of Different Tillage Depths on Soil Physical Properties and the Growth and Yield of Tobacco in the Mountainous Chongqing Region of China. Agriculture 2024, 14, 276. [Google Scholar] [CrossRef]
  12. Li, B.; Wang, C.; Gu, X.; Zhou, X.; Ma, M.; Li, L.; Feng, Z.; Ding, T.; Li, X.; Jiang, T.; et al. Accuracy calibration and evaluation of capacitance-based soil moisture sensors for a variety of soil properties. Agric. Water Manag. 2022, 273, 107913. [Google Scholar] [CrossRef]
  13. Gasch, C.K.; Brown, D.J.; Brooks, E.S.; Yourek, M.; Poggio, M.; Cobos, D.R.; Campbell, C.S. A pragmatic, automated approach for retroactive calibration of soil moisture sensors using a two-step, soil-specific correction. Comput. Electron. Agric. 2017, 137, 29–40. [Google Scholar] [CrossRef]
  14. Pečan, U.; Kastelec, D.; Pintar, M. Evaluation of Default, Soil-Specific, and Clay Content Correction Calibration Functions for Dielectric Sensors in Soils with Differing Properties. J. Irrig. Drain. Eng. 2022, 148, 04022016. [Google Scholar] [CrossRef]
  15. Wan, H.Y.; Qi, H.W.; Shang, S.H. Estimating soil water and salt contents from field measurements with time domain reflectometry using machine learning algorithms. Agric. Water Manag. 2023, 285, 108364. [Google Scholar] [CrossRef]
  16. Yu, X.; Drnevich, V.P. Soil water content and dry density by time domain reflectometry. J. Geotech. Geoenviron. 2004, 130, 922–934. [Google Scholar] [CrossRef]
  17. Robinson, D.A.; Jones, S.B.; Blonquist, J.M.; Friedman, S.P. A physically derived water content/permittivity calibration model for coarse-textured, layered soils. Soil Sci. Soc. Am. J. 2005, 69, 1372–1378. [Google Scholar] [CrossRef]
  18. Mane, S.; Das, N.; Singh, G.; Cosh, M.; Dong, Y. Advancements in dielectric soil moisture sensor Calibration: A comprehensive review of methods and techniques. Comput. Electron. Agric. 2024, 218, 108686. [Google Scholar] [CrossRef]
  19. Veach, A.M.; Zeglin, L.H. Historical Drought Affects Microbial Population Dynamics and Activity During Soil Drying and Re-Wet. Microb. Ecol. 2020, 79, 662–674. [Google Scholar] [CrossRef]
  20. Yang, X.; Zhang, K.; Chang, T.; Shaghaleh, H.; Qi, Z.; Zhang, J.; Ye, H.; Hamoud, Y.A. Interactive Effects of Microbial Fertilizer and Soil Salinity on the Hydraulic Properties of Salt-Affected Soil. Plants 2024, 13, 473. [Google Scholar] [CrossRef]
  21. Wang, Q.; Shi, L.; Zhao, X.; Fan, J. Effects of Biomass and Soil Water Content Distribution on Cosmic Ray Neutron Probe Measurement. Water 2023, 15, 2766. [Google Scholar] [CrossRef]
  22. Zhu, G.; Yong, L.; Zhao, X.; Liu, Y.; Zhang, Z.; Xu, Y.; Sun, Z.; Sang, L.; Wang, L. Evaporation, infiltration and storage of soil water in different vegetation zones in the Qilian Mountains: A stable isotope perspective. Hydrol. Earth Syst. Sci. 2022, 26, 3771–3784. [Google Scholar] [CrossRef]
  23. Dai, H.; Liu, Y.; Guadagnini, A.; Yuan, S.; Yang, J.; Ye, M. Comparative Assessment of Two Global Sensitivity Approaches Considering Model and Parameter Uncertainty. Water Resour. Res. 2024, 60, e2023WR036096. [Google Scholar] [CrossRef]
  24. Ahmed, S.; Hu, J.D.; Naqvi, S.; Zhang, Y.Y.; Li, L.Z.; Iderawumi, A.M. Molecular communication network and its applications in crop sciences. Planta 2022, 255, 128. [Google Scholar] [CrossRef] [PubMed]
  25. Patel, K.F.; Fansler, S.J.; Campbell, T.P.; Bond-Lamberty, B.; Smith, A.P.; RoyChowdhury, T.; McCue, L.A.; Varga, T.; Bailey, V.L. Soil texture and environmental conditions influence the biogeochemical responses of soils to drought and flooding. Commun. Earth Environ. 2021, 2, 127. [Google Scholar] [CrossRef]
  26. Jin, X.Y.; Jin, H.J.; Wu, X.D.; Luo, D.L.; Yu, S.; Li, X.Y.; He, R.X.; Wang, Q.F.; Knops, J.M.H. Permafrost Degradation Leads to Biomass and Species Richness Decreases on the Northeastern Qinghai-Tibet Plateau. Plants 2020, 9, 1453. [Google Scholar] [CrossRef]
  27. Thring, L.M.; Boddice, D.; Metje, N.; Curioni, G.; Chapman, D.N.; Pring, L. Factors affecting soil permittivity and proposals to obtain gravimetric water content from time domain reflectometry measurements. Can. Geotech. J. 2014, 51, 1303–1317. [Google Scholar] [CrossRef]
  28. Franzluebbers, A.J. Holding water with capacity to target porosity. Agric. Environ. Lett. 2020, 5, e20029. [Google Scholar] [CrossRef]
  29. Ankenbauer, K.J.; Loheide, S.P. The effects of soil organic matter on soil water retention and plant water use in a meadow of the Sierra Nevada, CA. Hydrol. Process. 2017, 31, 891–901. [Google Scholar] [CrossRef]
  30. Szyplowska, A.; Lewandowski, A.; Yagihara, S.; Saito, H.; Furuhata, K.; Szerement, J.; Kafarski, M.; Wilczek, A.; Majcher, J.; Woszczyk, A.; et al. Dielectric models for moisture determination of soils with variable organic matter content. Geoderma 2021, 401, 115288. [Google Scholar] [CrossRef]
  31. Regelink, I.C.; Stoof, C.R.; Rousseva, S.; Weng, L.P.; Lair, G.J.; Kram, P.; Nikolaidis, N.P.; Kercheva, M.; Banwart, S.; Comans, R.N.J. Linkages between aggregate formation, porosity and soil chemical properties. Geoderma 2015, 247, 24–37. [Google Scholar] [CrossRef]
  32. Blonquist, J.M., Jr.; Jones, S.B.; Lebron, I.; Robinson, D.A. Microstructural and phase configurational effects determining water content: Dielectric relationships of aggregated porous media. Water Resour. Res. 2006, 42, 1–13. [Google Scholar] [CrossRef]
  33. Czachor, H.; Doerr, S.H.; Lichner, L. Water retention of repellent and subcritical repellent soils: New insights from model and experimental investigations. J. Hydrol. 2010, 380, 104–111. [Google Scholar] [CrossRef]
  34. Orangi, A.; Narsilio, G.A.; Wang, Y.H.; Ryu, D. Experimental investigation of dry density effects on dielectric properties of soil–water mixtures with different specific surface areas. Acta Geotech. 2020, 15, 1153–1172. [Google Scholar] [CrossRef]
  35. Owenier, F.; Hornung, J.; Hinderer, M. Substrate-sensitive relationships of dielectric permittivity and water content: Implications for moisture sounding. Near Surf. Geophys. 2018, 16, 128–152. [Google Scholar] [CrossRef]
  36. Benatti, A.L.T.; Polizeli, M. Lignocellulolytic Biocatalysts: The Main Players Involved in Multiple Biotechnological Processes for Biomass Valorization. Microorganisms 2023, 11, 162. [Google Scholar] [CrossRef]
  37. Baruah, J.; Nath, B.K.; Sharma, R.; Kumar, S.; Deka, R.C.; Baruah, D.C.; Kalita, E. Recent Trends in the Pretreatment of Lignocellulosic Biomass for Value-Added Products. Front. Energy Res. 2018, 6, 141. [Google Scholar] [CrossRef]
  38. Viana, M.; Jouannin, P.; Pontier, C.; Chulia, D. About pycnometric density measurements. Talanta 2002, 57, 583–593. [Google Scholar] [CrossRef]
  39. Silva, B.P.C.; Tassinari, D.; Silva, M.L.N.; Silva, B.M.; Curi, N.; da Rocha, H.R. Nonlinear models for soil moisture sensor calibration in tropical mountainous soils. Sci. Agric. 2022, 79, 1–11. [Google Scholar] [CrossRef]
  40. Peng, W.; Lu, Y.L.; Xie, X.T.; Ren, T.S.; Horton, R. An Improved Thermo-TDR Technique for Monitoring Soil Thermal Properties, Water Content, Bulk Density, and Porosity. Vadose Zone J. 2019, 18, 1–9. [Google Scholar] [CrossRef]
  41. Jung, S.; Drnevich, V.P.; Abou Najm, M.R. New Methodology for Density and Water Content by Time Domain Reflectometry. J. Geotech. Geoenviron. 2013, 139, 659–670. [Google Scholar] [CrossRef]
  42. Kim, J.S.; Lee, Y.Y.; Kim, T.H. A review on alkaline pretreatment technology for bioconversion of lignocellulosic biomass. Bioresour. Technol. 2016, 199, 42–48. [Google Scholar] [CrossRef] [PubMed]
  43. Daniels, L.W. The Nature and Properties of Soils, 15th ed.; Pearson: London, UK, 2016; Volume 80, p. 1428. [Google Scholar]
  44. Karicheva, E.; Guseva, N.; Kambalina, M. Determination of water-soluble forms of oxalic and formic acids in soils by ion chromatography. IOP Conf. Ser. Earth Environ. Sci. 2016, 33, 012006. [Google Scholar] [CrossRef]
  45. Zhang, Z.; Liu, L.; Huang, M.; Chen, F.; Niu, J.; Liu, M. Feasibility of soil erosion measurement using time domain reflectometry. CATENA 2022, 218, 106571. [Google Scholar] [CrossRef]
  46. Wilson, T.B.; Kochendorfer, J.; Diamond, H.J.; Meyers, T.P.; Hall, M.; French, B.; Myles, L.; Saylor, R.D. A field evaluation of the SoilVUE10 soil moisture sensor. Vadose Zone J. 2023, 22, e20241. [Google Scholar] [CrossRef]
  47. Rasheed, M.W.; Tang, J.L.; Sarwar, A.; Shah, S.; Saddique, N.; Khan, M.U.; Khan, M.I.; Nawaz, S.; Shamshiri, R.R.; Aziz, M.; et al. Soil Moisture Measuring Techniques and Factors Affecting the Moisture Dynamics: A Comprehensive Review. Sustainability 2022, 14, 11538. [Google Scholar] [CrossRef]
  48. Shimobe, S.; Spagnoli, G. Relationship between dielectric constant of soils with clay content and dry unit weight. Environ. Geotech. 2021, 8, 134–147. [Google Scholar] [CrossRef]
  49. Majcher, J.; Kafarski, M.; Wilczek, A.; Szyplowska, A.; Lewandowski, A.; Woszczyk, A.; Skierucha, W. Application of a dagger probe for soil dielectric permittivity measurement by TDR. Measurement 2021, 178, 109368. [Google Scholar] [CrossRef]
  50. Zhang, H.; Liu, Q.; Liu, S.; Li, J.; Geng, J.; Wang, L. Key soil properties influencing infiltration capacity after long-term straw incorporation in a wheat (Triticum aestivum L.)–maize (Zea mays L.) rotation system. Agric. Ecosyst. Environ. 2023, 344, 108301. [Google Scholar] [CrossRef]
  51. Zawilski, B.M.; Granouillac, F.; Claverie, N.; Lemaire, B.; Brut, A.; Tallec, T. Calculation of soil water content using dielectric-permittivity-basedsensors—Benefits of soil-specific calibration. Geosci. Instrum. Methods Data Syst. 2023, 12, 45–56. [Google Scholar] [CrossRef]
  52. Lekshmi, S.U.S.; Singh, D.N.; Baghini, M.S. A critical review of soil moisture measurement. Measurement 2014, 54, 92–105. [Google Scholar] [CrossRef]
  53. Cui, J.P.; Tan, F. PLSR-Based Assessment of Soil Respiration Rate Changes under Aerated Irrigation in Relation to Soil Environmental Factors. Agriculture 2023, 13, 68. [Google Scholar] [CrossRef]
  54. Kashyap, P.; Brzezinska, M.; Keller, N.; Ruppert, A.M. Influence of Impurities in the Chemical Processing Chain of Biomass on the Catalytic Valorisation of Cellulose towards γ-Valerolactone. Catalysts 2024, 14, 141. [Google Scholar] [CrossRef]
  55. Rahim, A.F.A.; Kutty, S.R.M.; Ezechi, E.H. Volatile Fatty Acids Production through Degradation of Biomass by Anaerobic Digestion (Mesophilic and Thermophilic). Appl. Mech. Mater. 2014, 567, 172–176. [Google Scholar] [CrossRef]
  56. Wirsching, J.; Pagel, H.; Ditterich, F.; Uksa, M.; Werneburg, M.; Zwiener, C.; Berner, D.; Kandeler, E.; Poll, C. Biodegradation of Pesticides at the Limit: Kinetics and Microbial Substrate Use at Low Concentrations. Front. Microbiol. 2020, 11, 2107. [Google Scholar] [CrossRef] [PubMed]
  57. Lehmann, J.; Kleber, M. The contentious nature of soil organic matter. Nature 2015, 528, 60–68. [Google Scholar] [CrossRef] [PubMed]
  58. Whitman, T.; Pepe-Ranney, C.; Enders, A.; Koechli, C.; Campbell, A.; Buckley, D.H.; Lehmann, J. Dynamics of microbial community composition and soil organic carbon mineralization in soil following addition of pyrogenic and fresh organic matter. ISME J. 2016, 10, 2918–2930. [Google Scholar] [CrossRef] [PubMed]
  59. Negron-Juarez, R.; Ferreira, S.J.F.; Mota, M.C.; Faybishenko, B.; Monteiro, M.T.F.; Candido, L.A.; Ribeiro, R.P.; de Oliveira, R.C.; de Araujo, A.C.; Warren, J.M.; et al. Calibration, measurement, and characterization of soil moisture dynamics in a central Amazonian tropical forest. Vadose Zone J. 2020, 19, e20070. [Google Scholar] [CrossRef]
  60. Lee, S.H.; Ji, W.; Kang, D.M.; Kim, M.S. Effect of soil water content on heavy mineral oil biodegradation in soil. J. Soils Sediments 2018, 18, 983–991. [Google Scholar] [CrossRef]
  61. Troquet, J.; Larroche, C.; Dussap, C.-G. Evidence for the occurrence of an oxygen limitation during soil bioremediation by solid-state fermentation. Biochem. Eng. J. 2003, 13, 103–112. [Google Scholar] [CrossRef]
Figure 1. Degradation of the bedrock soil layer with a thin active layer changes the soil water and nutrient regimes within the active layer, leading to microbial biomass degradation in the soil environment [26,36,37].
Agriculture 14 00773 g001
Figure 2. Particle size distribution of silt loam soil and quartz sand.
Agriculture 14 00773 g002
Figure 3. Results of dry bulk density and dielectric measurements under loose filling conditions. (a) The dry bulk density under different gravimetric water content conditions; (b) The dielectric constant under different volumetric water content conditions. Note that the error bars in the figure represent the standard deviations. The volumetric water content is calculated based on the gravimetric water content in Table 2 and the dry bulk density in Figure 3a.
Agriculture 14 00773 g003
Figure 4. Soil-specific calibration curves obtained by the compression filling method. (a) The calibration curve for quartz sand using method (3); (b) The calibration curve for silt loam using method (3); (c) Comparison of thermogravimetric and dielectric methods for measuring volumetric water content in layered uniformly compacted silt loam samples (method (2)). The volumetric water content of the dielectric method is obtained from Equations (1) and (8) and the factory calibration curve, respectively.
Agriculture 14 00773 g004
Figure 5. Comparison of volumetric water content before and after biomass degradation along with short-chain volatile carboxylic acids (SCVCAs) analysis.
Agriculture 14 00773 g005
Table 1. Characteristics of the soil samples used in this study.
Soil NameClay
g kg−1
Silt
g kg−1
Sand
g kg−1
Texture *OM
g kg−1
Particle Density
ρ s , Mg m−3
Dry Bulk Density
ρ b , Mg m−3
Total Porosity
ϕ , m3 m−3
Silt loam 176.3 537.6 286.1 silt loam 12.3 2.63 1.12 0.574
Quartz sand 0 0 100 sand 0 2.65 1.57 0.408
* The texture class according to USDA.
Table 2. The gravimetric water content and dry bulk density of the prepared silt loam and quartz sand samples.
Soil Name θ m 1
%
θ m 2
%
θ m 3
%
θ m 4
%
θ m 5
%
θ m 6
%
θ m 7
%
Dry Bulk Density *
ρ b , Mg m−3
Silt loam 4.58 7.86 11.34 16.94 20.39 24.90 28.89 1.08
Quartz sand 4.15 8.07 11.69 16.32 20.24 24.13 28.36 1.32
* The dry bulk density refers to the dry bulk density used to prepare samples in compaction states 1 and 2. θ m represents the gravimetric soil water content, defined as the percentage of water mass to dry soil mass. By utilizing the gravimetric water content of the soil and the corresponding dry bulk density, the volumetric water content θ v of the soil sample can be calculated using the formula θ v = θ m ρ b / ρ w , where ρ w is the density of water.
Disclaimer/Publisher’s Note: The statements, opinions and data contained in all publications are solely those of the individual author(s) and contributor(s) and not of MDPI and/or the editor(s). MDPI and/or the editor(s) disclaim responsibility for any injury to people or property resulting from any ideas, methods, instructions or products referred to in the content.

