Article

Nectar Production and Three Main Sugars in Nectar of Salvia pratensis and Salvia glutinosa in Correlation with Abiotic Factors

1
University Botanic Gardens Ljubljana, Biotechnical Faculty, University of Ljubljana, Ižanska 15, 1000 Ljubljana, Slovenia
2
Department of Analytical Chemistry, National Institute of Chemistry, Hajdrihova 19, P.O. Box 660, 1001 Ljubljana, Slovenia
*
Authors to whom correspondence should be addressed.
Agriculture 2024, 14(5), 668; https://doi.org/10.3390/agriculture14050668
Submission received: 19 March 2024 / Revised: 19 April 2024 / Accepted: 23 April 2024 / Published: 25 April 2024
(This article belongs to the Section Agricultural Product Quality and Safety)

Abstract

:
Floral nectar is mainly a reward in the form of food for pollinators. Its composition plays an important role when pollinators choose their food. Several studies have shown that the popularity of flowers with nectar is influenced by the concentration and ratio of sugars. Here, we present the nectar chemical composition with regard to three main sugars and their concentrations in correlation with abiotic factors for the plant species Salvia pratensis L. and Salvia glutinosa L. through their 2023 flowering season. We sampled nectar using microcapillaries at three different times during the day on sites in nature. Our results show that nectar production in both species is the highest at around 12 a.m. The abiotic factor that affects nectar production in both species is the soil temperature, while UVB radiation does not influence nectar production. Air temperature and air humidity affect the nectar production of S. glutinosa, while soil humidity affects nectar production in S. pratensis. The most represented sugar in S. glutinosa nectar is sucrose, while S. pratensis nectar has more glucose and fructose. Our results show that UVB radiation has an effect on the sucrose level, although it does not have any direct effect on nectar productivity.

1. Introduction

Plants provide food for pollinators mainly in the form of nectar and pollen, while pollination occurs when pollinators transfer the pollen that sticks to their bodies to the stigma of a flower [1,2,3,4]. Nectar primarily serves to attract pollinators, as it provides a source of nutrients for them [4,5,6]. In addition, several other roles have been attributed to nectar’s secondary metabolites in the last few decades [4,6,7,8]. Nepi et al. [4], for example, assumed that nectar is something that plants use to manipulate pollinators’ behavior for their own benefit.
The role of nectaries and nectar was unknown for a long time. Firstly, it was thought that nectaries secrete excess fluid, but it later became clear that they have an important role in insect pollination [3,6,9]. Nectar, which supplies pollinators mainly with sugars as a source of energy, is produced in specialized glands called nectaries [6,7,10]. The nectaries are located either inside or outside the flowers (extra-floral nectaries) [6,7,9]. Nectaries inside flowers can produce from less than 1 µL up to 1 mL of nectar, depending on the parenchyma volume. It is interesting that when flowers are star-shaped, the nectaries are arranged in the same manner [9]. Nectaries can be of different shapes and sizes. They can be located on the surface of reproductive parts of the flower, they can be a new outgrowth, or they can be hidden in certain organs, like the perianth [3,11,12]. Nectaries consist of three parts: an epidermis, specialized parenchyma, and a vascular system. The parenchyma contains solutes, and the vascular system allows water to reach the parenchyma. The solution (nectar) is then secreted on the epidermis [6,13].
Nectar contains 30–90% water, up to 70% sugars, nitrogen compounds, organic acids, pigments, essential oils, vitamins, minerals, lipids, phenols, and terpenoids [7,14]. Nectar also contains other compounds that affect the nutritive role of nectar, like alkaloids, non-protein amino acids, antioxidants, and other secondary compounds [6,15,16,17]. It was discovered that the most common secondary compounds (alkaloids, glycosides, and phenolic substances) may make the nectar addictive to pollinators and/or have a repellent effect [8,15,16]. Nectar can contain different amounts of water. More concentrated nectars are more difficult to drink for the pollinators; therefore, the nectar concentration is limited to a certain level. Nectar from flowers visited by insects is more concentrated and has a lower percentage of water than the nectar from flowers pollinated by birds. But even insects will not eat very concentrated nectar when it is too viscous and too hard to suck [7].
Although the chemical composition of nectar varies between different plant taxa, similarities can also be found between unrelated species [7,18]. On the other hand, the composition and concentration of nectar can vary within a species, among populations, or even between individual plants or flowers on one plant [17,19]. The nectar quantity variability in flowers of the same plant can be influenced by their position in the inflorescence, the size of the inflorescences, differences in the microclimate of the individual flowers (for example, the shady or sunny side), differences in the flower age, differences in flowers that have a male or female phase, and differences in pollinator visits. Nectar diversity, especially for nectar production in different populations of one species, is primarily due to the influence of environmental factors [20,21]. The flowering phase also has a big impact on the concentration. But it is not always necessary that nectar production stops when sepals fall. Sometimes, nectar in this phase has an even higher sugar concentration [9].
When studying the quantitative and qualitative characteristics of nectar, we must be aware that larger flowers do not always have a high nectar content. That is why the success of a nectar sampling technique can be influenced by the flower morphology, nectar characteristics, sampling system, insect visits, and abiotic factors [7,22,23,24,25,26]. Variations in the nectar composition and concentration can be affected by external factors. The factors that have the greatest impact on nectar quality and production include the air humidity and temperature; the time of day; evaporation, particularly for more open flowers; and the nutrient content in the soil [7,22,24,25,27]. When nectar is exposed to rain, it can become diluted; therefore, some plants have different morphological structures or ways to protect the nectar against dilution. Hairs, hydrophobic surfaces of the flower, and narrower areas protect flowers against rain. Despite this protection, moisture can still affect the flower, resulting in lower nectar concentrations [26,28]. On the other hand, water loss from nectar via evaporation is minimal and has a cooling effect, lowering the temperature of the nectar [27]. In drought conditions, less available water results in a reduced amount of secreted nectar [7,29]. The temperature affects photosynthesis and, consequently, also nectar production [30,31]. Nectar production is lower at a lower temperature, which applies to most species, but nectar production can also become lower at higher temperatures. The optimal conditions for nectar secretion in individual plant species are not yet known, as they are quite diverse, but it is known that plant species in warmer environments tolerate higher temperatures more easily [32]. The impact of UVB radiation is not yet well understood. Higher UVB radiation affects nectar secretion differently for each plant species, so its effects are difficult to generalize [21,33].
The most notable chemical components in nectar are sugars; among them, the most common sugars found in nectar are the disaccharide sucrose and the monosaccharides fructose and glucose. Monosaccharides are produced either from sucrose from the phloem sap or by synthesis within the nectaries with transglucosidase and transfructosidase [6,7,34]. Nectar can also contain lower concentrations of other monosaccharides such as mannose, arabinose, and xylose; disaccharides such as maltose and melibiose; and even rarer oligosaccharides such as raffinose, stachyose, and melezitose, as well as the sugar alcohol sorbitol [7,35]. Based on the ratio of glucose, fructose, and sucrose, nectar can be divided into four basic types: sucrose-dominant, sucrose-rich, hexose-rich, and hexose-dominant [7,31]. Percival [36] studied nectar sugars in many angiosperms. In her study, she found that the flower shape could also influence the nectar composition. Plants with deep and tubular flowers produce sucrose-dominant nectar, while plants with less deep flowers have either glucose- or sucrose-dominant nectar.
The period of nectar secretion usually corresponds to the pollination phase, which is associated with an effective reproductive strategy [4,5,26]. The nectar chemistry can influence which pollinators visit the flowers. Pollinators can choose nectar based on the sugar composition, concentration, and quantity. An example of this is the honey bee, which prefers to collect nectar with a 30–50% sugar content [37,38]. Moths, hummingbirds, and butterflies prefer nectar with high sucrose content, while flies and bats prefer nectar with high glucose and fructose contents [7]. Kim et al. [39] also mentioned that the nectar concentration in flowers pollinated by bees is higher than that in flowers pollinated by hummingbirds or butterflies. The main reason for this is in their drinking techniques. Bees are viscous dippers, while hummingbirds and butterflies are suction feeders [10]. Nectar provides pollinators with not only sugars and amino acids but also vitamins, minerals, lipids, and water, as well as secondary metabolites that enable self-healing or function as deterrents [4,7,8].
Considering that the nectar composition affects the preferences of specific pollinators and the developmental stages of insects, our research examined the composition of sugars in the nectar of two Salvia species: Salvia pratensis L. and Salvia glutinosa L. Both species are known to be visited by different pollinators [5,40,41]. The reason for this is in the morphology of their flowers, their nectar, and their pollen content [5,41]. The main pollinator species is the honey bee, Apis mellifera L. [42,43]. We analyzed the sugar nectar composition in relation to environmental factors such as the soil and air temperature, soil and air humidity, and UVB radiation. S. pratensis is abundant as a food source during the spring/summer season and S. glutinosa is abundant during the autumn season for different pollinators. Both species are also among the most common species in Slovenia. By understanding the sugar composition of the nectar of these plants, we can then determine how it influences the development of insect individuals. Additionally, we can assess the impact of selected environmental factors on the nectar composition. With climate change, knowing the influence of environmental factors on the secretion and composition of nectar can provide us with important predictions about how this will also affect the diet of pollinators and, consequently, their survival and species diversity.

2. Materials and Methods

2.1. Researched Plant Species

We examined the nectar of the two Salvia species that are most common in Slovenia. S. pratensis is a late spring/summer-flowering species and S. glutinosa is a late summer/autumn-flowering species. Both species are autochthonous in Slovenia. Both species are also known to attract various pollinators, especially bees. S. pratensis grows on dry meadows and along roads; S. glutinosa grows in forests and on forest edges [44,45].
The flowers of the genus Salvia are bisexual and form in inflorescences. Flowers have an upper and lower labium. Nectar is found in the narrowed part of the flower [44,45,46]. Lamiaceae are known to have more nectar compared to other families [47]. Their nectaries are placed around the reproductive parts. This placement enables protection against too-rapid nectar evaporation and against nectar dilution in the case of rain [29].

2.2. Sampling Locations

Slovenia is in Europe and borders four neighboring countries: Italy, Croatia, Hungary, and Austria. It lies at the crossroads of the Alpine, Dinaric, Pannonian, and Mediterranean worlds. It has a transitional climate; it combines alpine, continental, and Mediterranean climates. Most of Slovenia is otherwise characterized by a moderate continental climate. We sampled the nectar of both species at two locations. S. pratensis was sampled on meadows and S. glutinosa on woodland edges. S. pratensis was present on a meadow and woodland edge in Škofljica, Slovenia, whereas S. glutinosa was present on a meadow and a woodland edge in Šentvid, Ljubljana, Slovenia. The nectar of S. pratensis was sampled in May and June 2023, and the nectar from S. glutinosa was sampled in August of 2023. Šentvid is on the north side of Ljubljana, the capital of Slovenia. Škofljica is a small village located south of Ljubljana. In the year of sampling, the annual rainfall amount was high, around 1866 mm. The average temperature per month from May to August was a minimum of 15.9 °C in May and a maximum of 22.7 °C in July [48].

2.3. Nectar Sampling

2.3.1. Flower Protection

Due to frequent flower visits by pollinators, it is important to protect the sampled flowers in advance to prevent pollinators from accessing the nectar. Various materials can be used for protection, such as veils, gauze, or netting [19,35]. We protected our flowers with netting one day before sampling by wrapping individual inflorescences. Since rainfall also affects nectar production [23], we intentionally sampled during rain-free periods to avoid overly diluted nectar.

2.3.2. Nectar Collection

Nectar was sampled at three different times within one day, at 9:00, 12:00, and 15:00, for each species over four days in one month. We always selected flowers in the same stage of flowering. The most common and straightforward technique for determining the sugar content in nectar in the field is using a refractometer. The refractometer provides the sugar concentration in the nectar, but this method only determines the sugar content, without performing further analysis. Therefore, we opted for a different method that would enable us to do so. We used the microcapillary sampling method, where nectar is drawn up using capillary action [49]. This way, we did not damage the flowers, and there was less contamination with pollen. Due to this sampling method, we were able to sample the same flowers multiple times (throughout the day). We used 1 µL microcapillaries (Vitrex Medical, Herlev, Denmark) for sampling. For each plant species, we collected 4 samples at each chosen time, so together we performed 48 samplings for each species, which included 16 different specimens. We always placed the entire inflorescence of one specimen into one sample. Latex gloves were worn when handling the micropipettes. The microcapillaries containing collected nectar were centrifuged and stored in a freezer at −20 °C until further analysis.

2.3.3. Nectar Quantity

The quantity of collected nectar was determined by measuring the height of the nectar in the capillary. After sucking out the nectar from the inflorescence, we measured the height of the nectar in the microcapillary on-site. Since we knew the volume of the microcapillary tube, we could calculate the volume of collected nectar from a single flower on-site as well.

2.3.4. Measurement of Abiotic Factors

For each location, date, and time, we also measured abiotic factors. We measured the air and soil temperature, air and soil humidity, and UVB radiation. Soil parameters were measured at a depth of 7 cm (the length of the sensors of the measuring instrument), and air parameters were measured at the height of the inflorescence of the sampled species. For measuring soil humidity and temperature, we used a JXBS-3001-SCY-PT device (JXCT, Weihai, China); for air humidity and temperature, we used an MX2302A device (Onset HOBO®, Bourne, MA, USA); and for measuring UVB radiation, we used a Digital Ultraviolet Radiometer, serial number 07564 (Solarmeter, Glenside, PA, USA). Since the devices measured relative humidity, we converted the relative humidity data to absolute humidity.

2.4. Nectar Analysis

2.4.1. Sample and Standard Solutions

Stock solutions of sugars (sucrose, glucose, and fructose; Merck Millipore, Darmstadt, Germany) were prepared by dissolving 100 mg of each sugar in 10 mL of deionized water (MilliQ, Merck Millipore). The stock solutions were then combined and diluted to obtain a working standard solution of 1 mg/mL for each sugar. Frozen nectar samples were thawed and transferred to vials for further analysis. Nectar samples were dissolved in 150 µL of water per sample in a 2 mL centrifuge tube. Centrifuged samples were then placed in a centrifuge three times for 1 min each. After the final centrifugation (3 min), the supernatant was transferred to an HPLC vial.

2.4.2. Sugar Analysis

Properly diluted nectar samples were analyzed with a Vanquish (Thermo Scientific, San Jose, CA, USA) UHPLC system coupled with a charged-aerosol detector (CAD) and Chromeleon 7.2 SR4 data acquisition software (Thermo Scientific). The separation column was Nucleogel Sugar Ca with dimensions of 300 mm × 6.5 mm i.d. (Macherey-Nagel, Düren, Germany) with the temperature set at 90 °C. The mobile phase was water, under isocratic conditions and a flow rate at 0.7 mL/min. The CAD detector source temperature was 90 °C. The analysis run time was 13 min. Sample vials were thermostatted at 10 °C. The flush solvent was water. The injection volumes were 5 µL and 15 µL for standard and sample solutions, respectively.

2.5. Statistical Analysis

For concentration calculations, we used Excel 2010. The calculation was performed using the external standard method (calibration solutions). In Excel, chromatographic peak areas were used as a parameter for concentration calculations, which were linearly proportional to the concentration of each compound (analyte). Basic statistical analyses were performed in Microsoft Excel 2010, whereas for the Spearman correlation coefficient between single abiotic factors and nectar quantities from the two species, we used Statistica 8.0 software (Statsoft Inc., Tulsa, OK, USA), in which we then calculated Spearman’s correlation coefficient at p < 0.05. Additionally, we calculated the statistical difference between sampling hours in a single sampling day at p < 0.05 using the same software. We used one-way ANOVA and a post hoc Bonferroni test to analyze the difference in nectar quantity between sampling hours.

3. Results

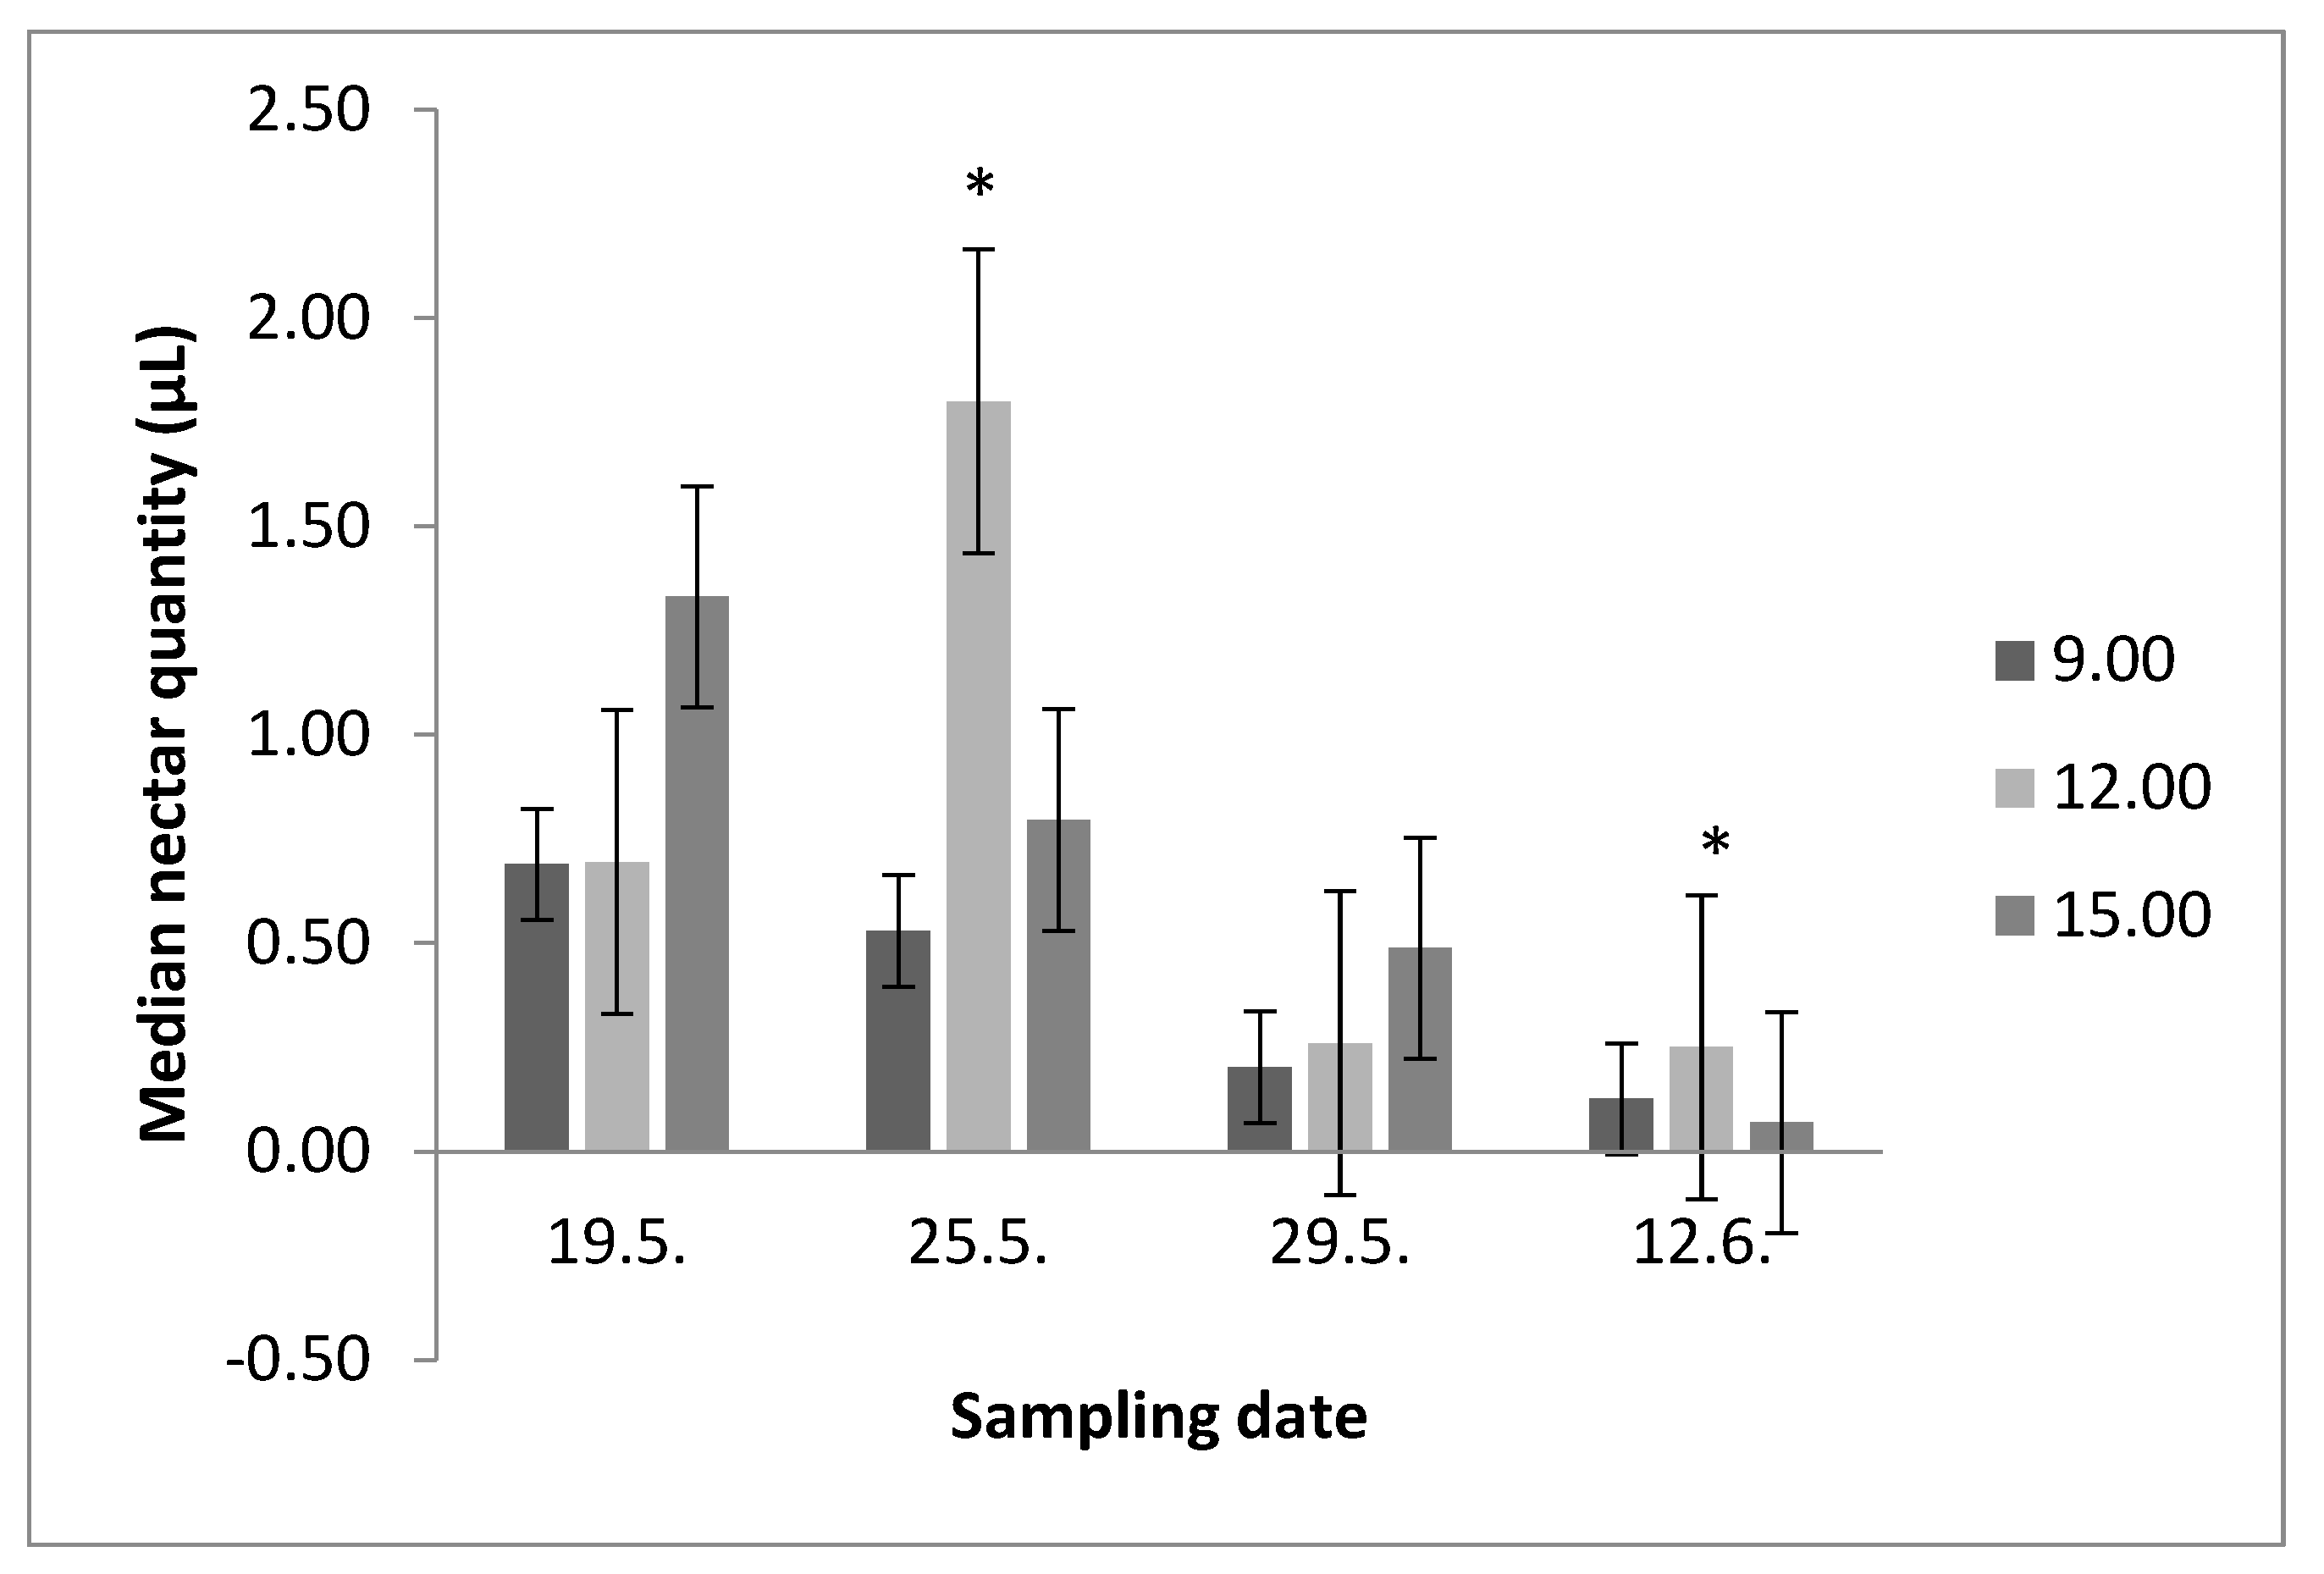
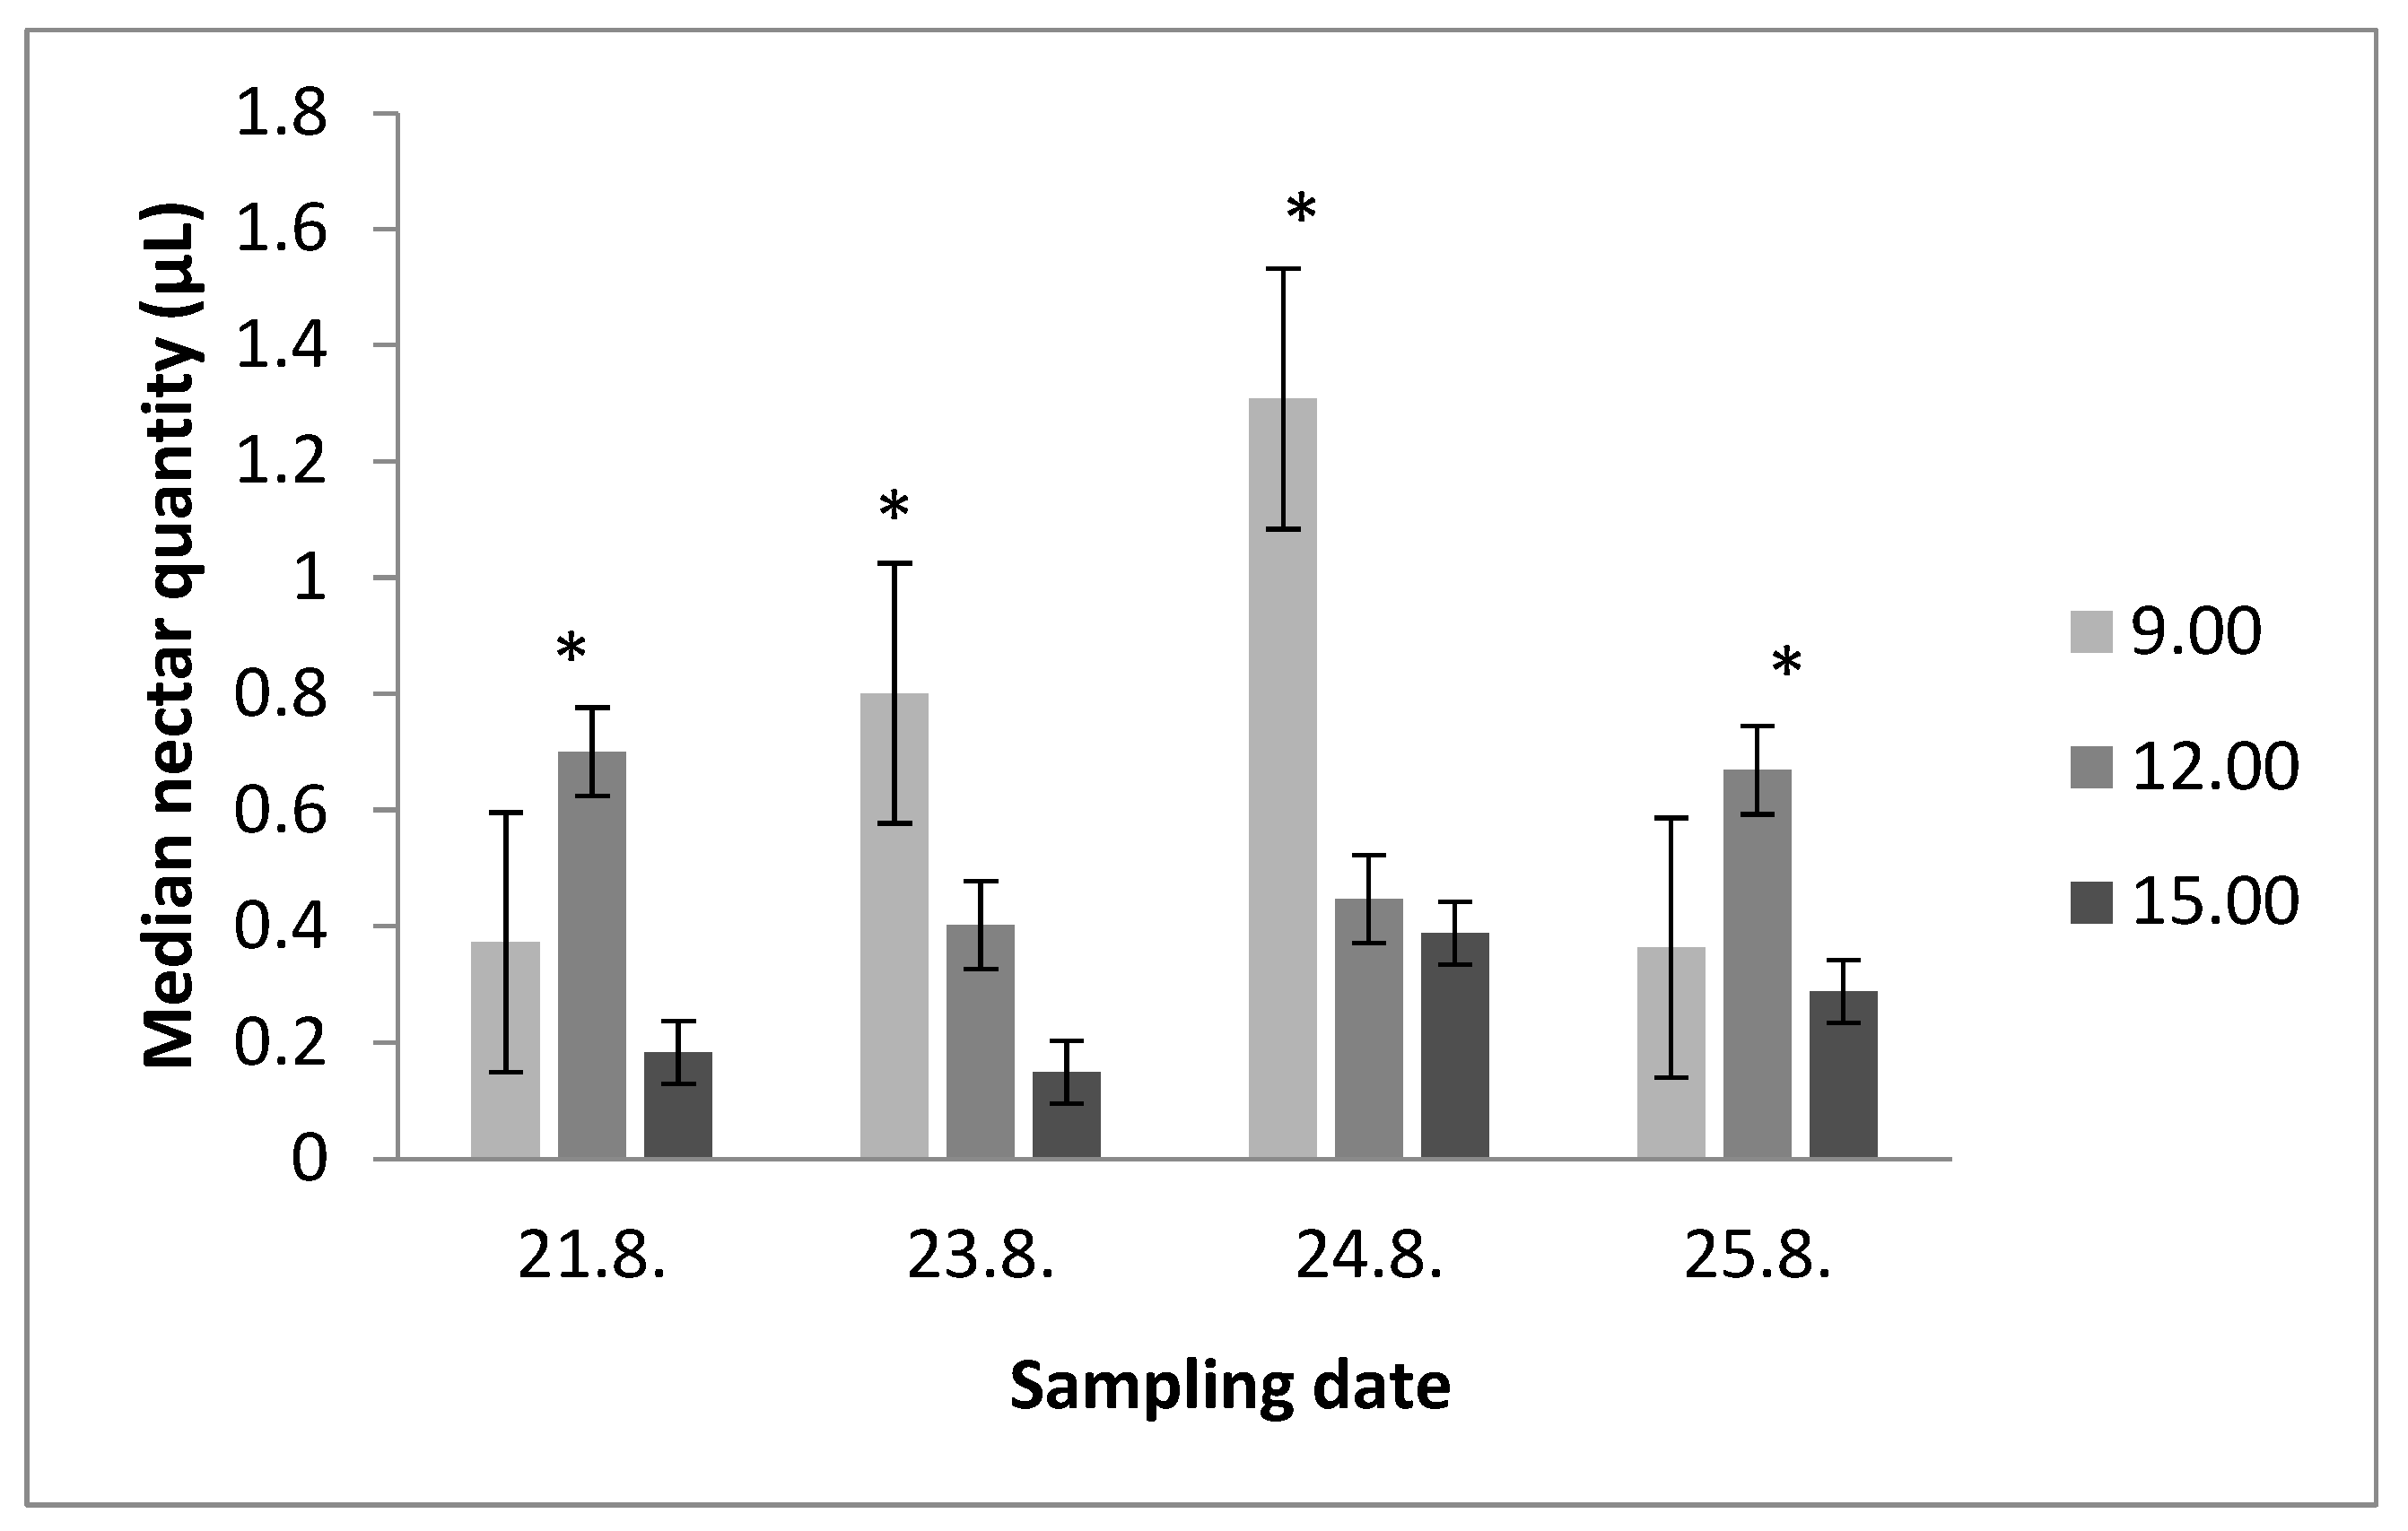
3.1. Nectar Secretion throughout the Day

When studying the nectar secretion patterns in S. glutinosa (Figure 1), our results showed that nectar production on 21 August was statistically significantly higher at 12:00 than at 9:00 and 15:00, but there were no statistically significant differences between 9:00 and 15:00. On 23 August, nectar production was statistically significantly higher at 9:00 than at 15:00, but there were no statistically significant differences between the nectar quantities at 9:00 and 12:00 or 12:00 and 15:00. Nectar production on 24 August was statistically significantly higher at 9:00 than at 12:00 and 15:00. The difference in nectar production at 12:00 and 15:00 was not statistically significant. For 25 August, the analysis showed that nectar production was statistically significantly higher at 12:00 than at 15:00, but there were no statistically significant differences between 9:00 and 12:00 or 9:00 and 15:00.
When studying the nectar secretion patterns in S. pratensis (Figure 2), our results showed no significant differences for 19 May. On 25 May, nectar production was statistically significantly higher at 12:00 and lower at 9:00. There were also no statistically significant differences for 29 May. On 12 June, there was a statistically significant difference between 12:00 and 15:00, because nectar production was higher at 12:00.

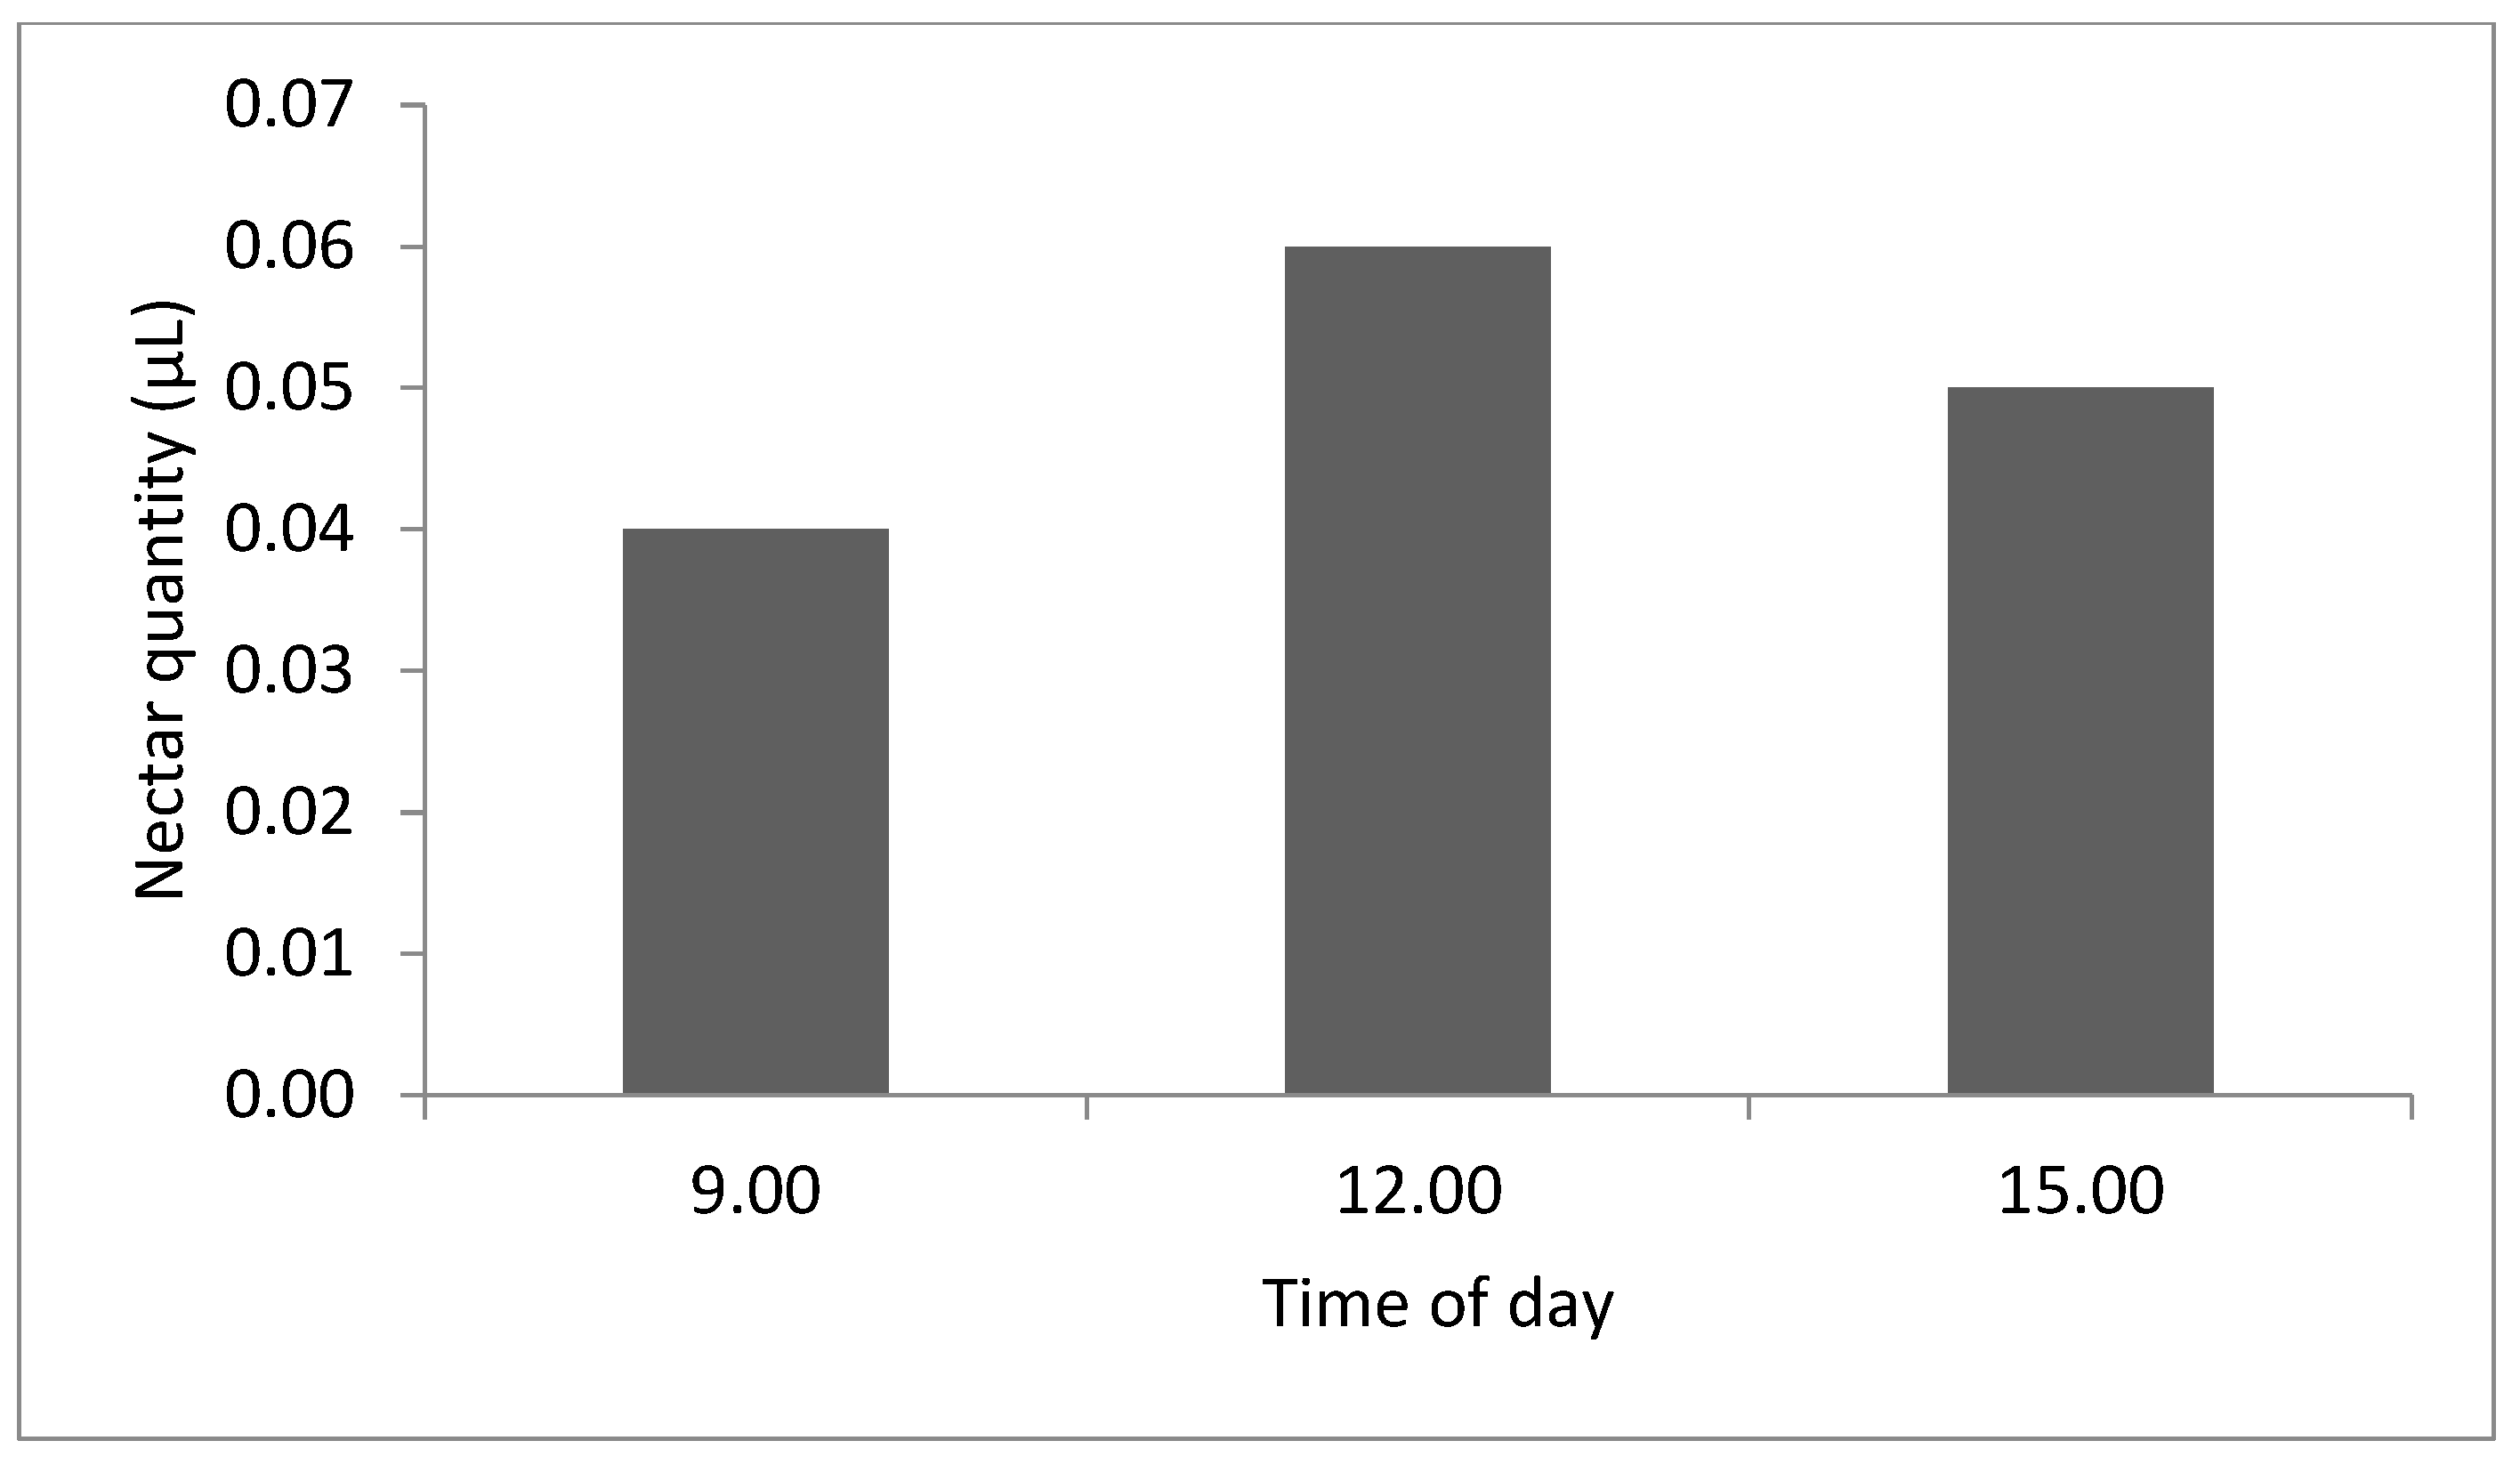
3.2. Average Nectar Production throughout the Day

To obtain knowledge about the nectar secretion patterns of Salvia species, we calculated the average nectar production throughout the day for S. glutinosa (Figure 3) and S. pratensis (Figure 4). By calculating the cumulative medians for 9:00, 12:00, and 15:00 on all nectar sampling days, the results showed that nectar production was highest at 12:00 for both species. The nectar production was lowest at 15:00 in S. glutinosa and at 9:00 for S. pratensis. Although there are differences in the figures, using statistics, we found different results. For S. glutinosa, there was statistically significantly less nectar at 15:00 than at 12:00, while S. pratensis showed no statistically significant differences.

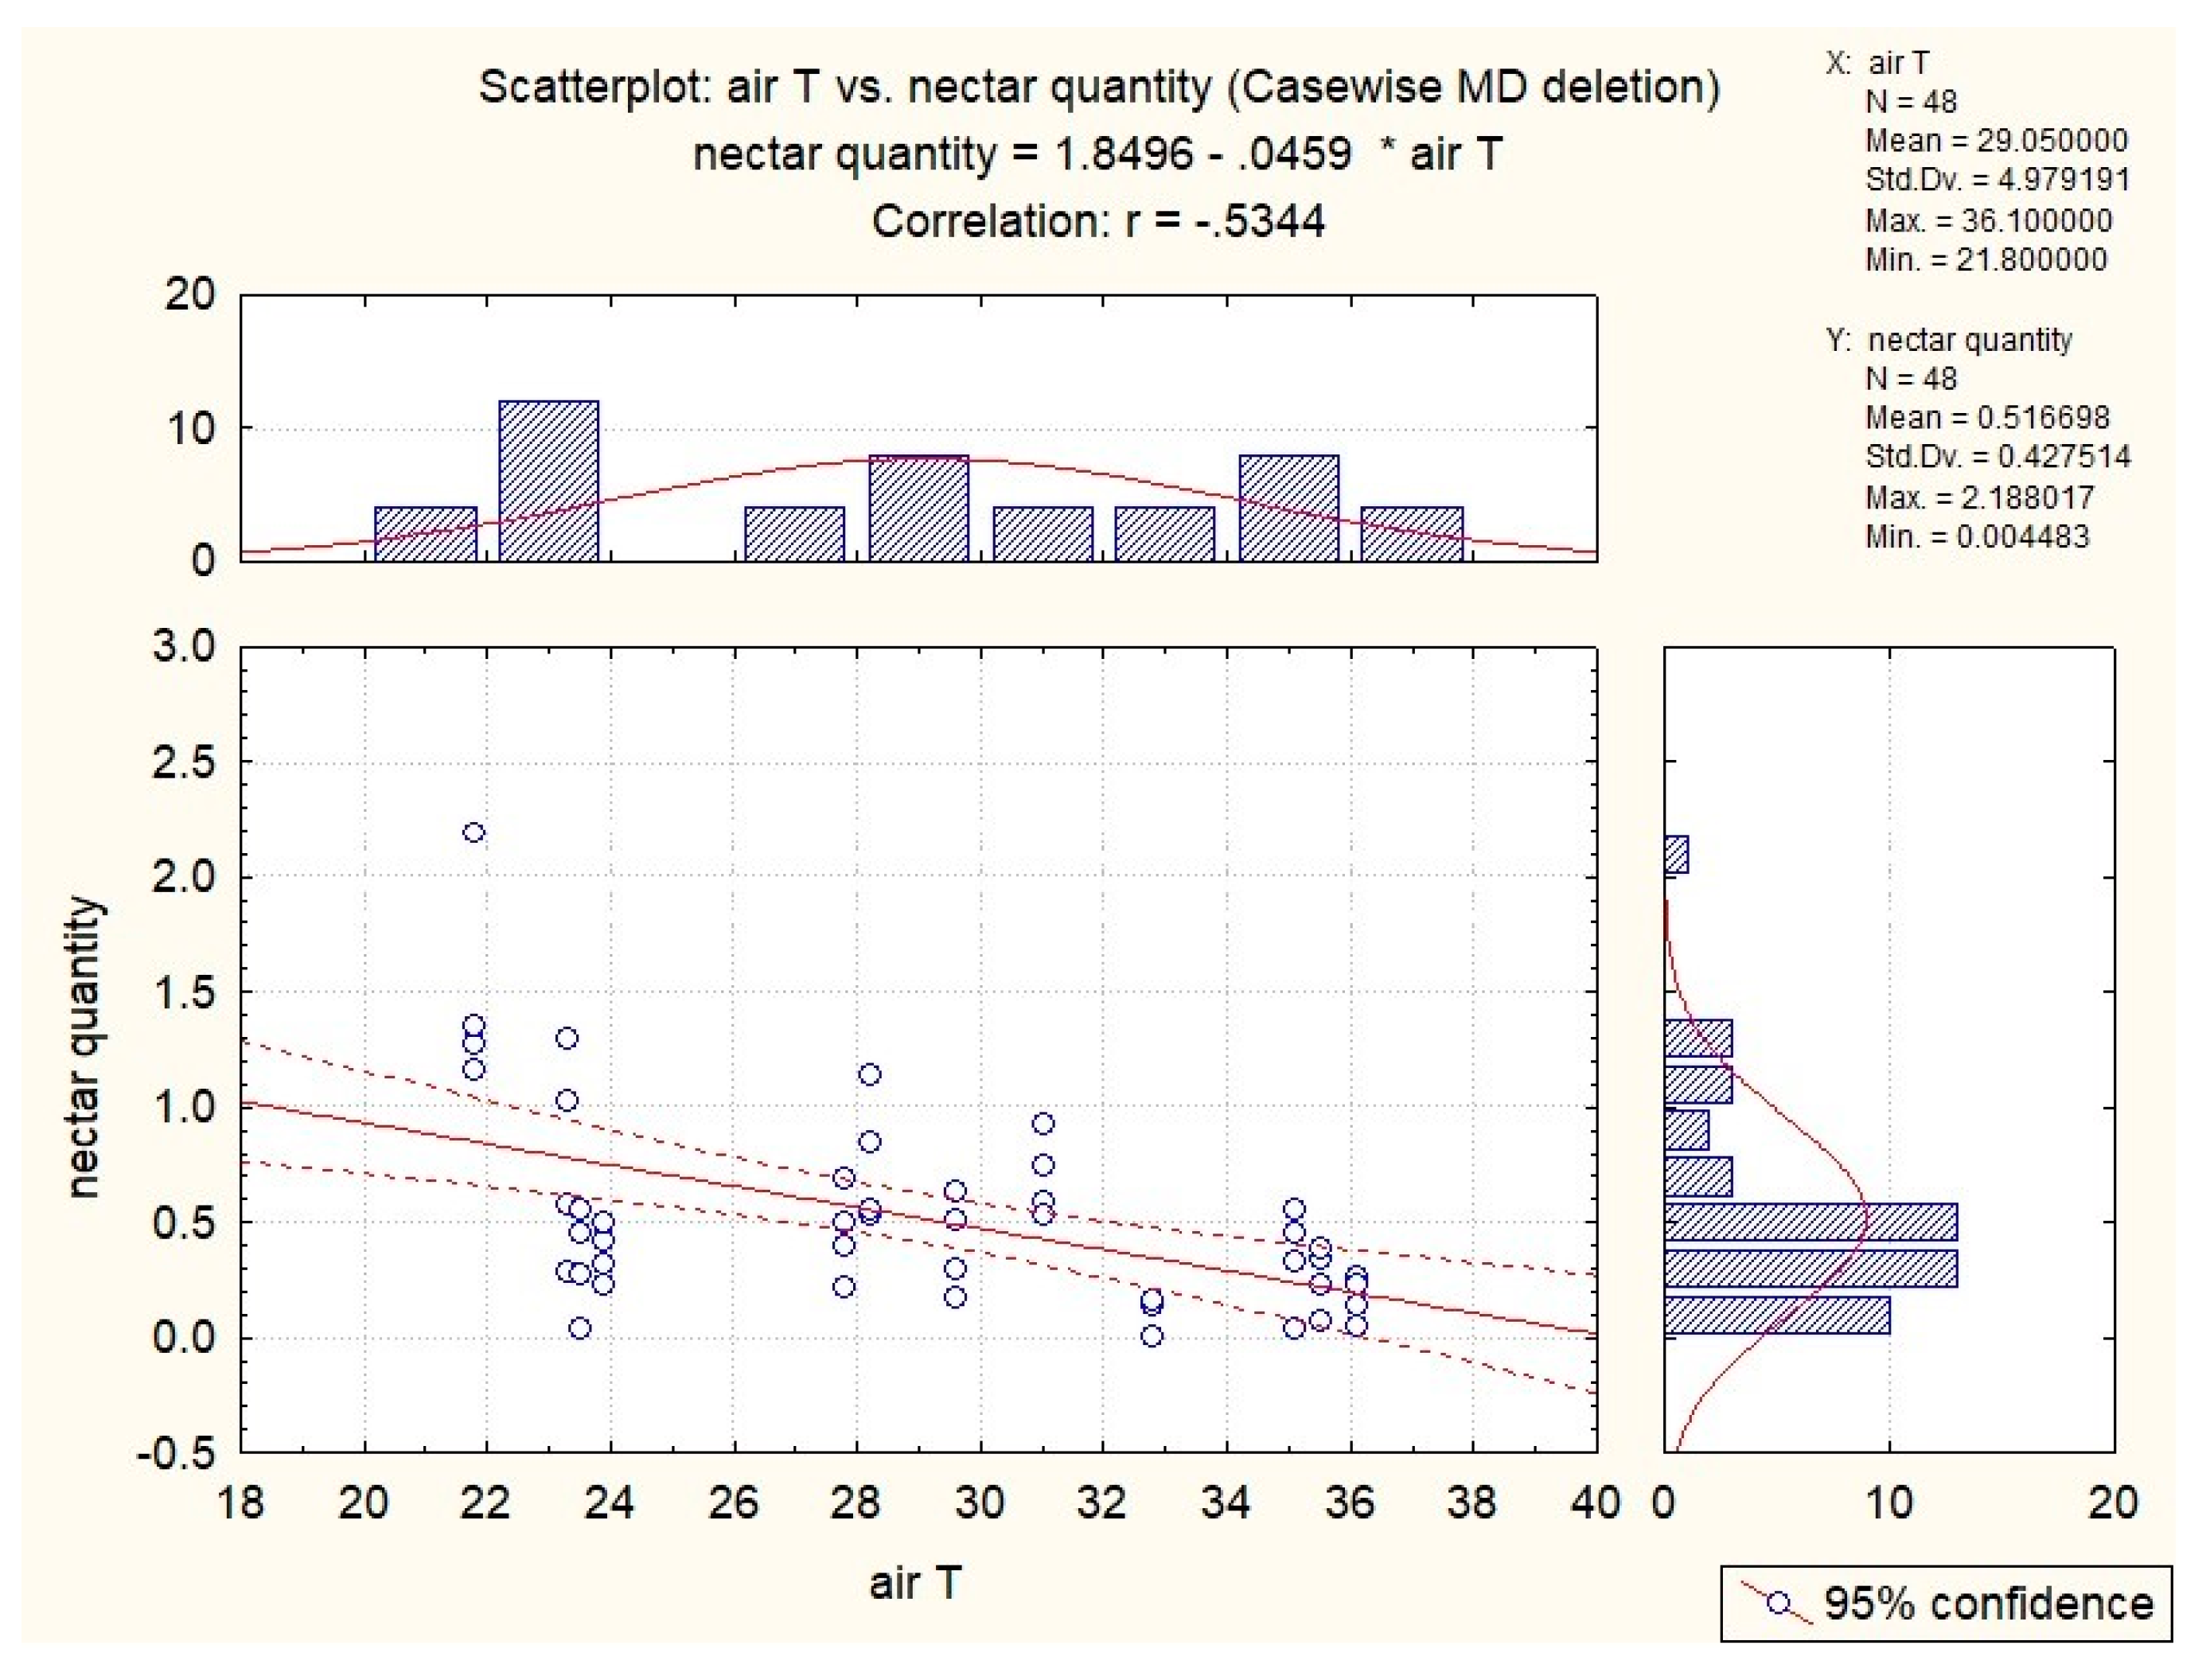
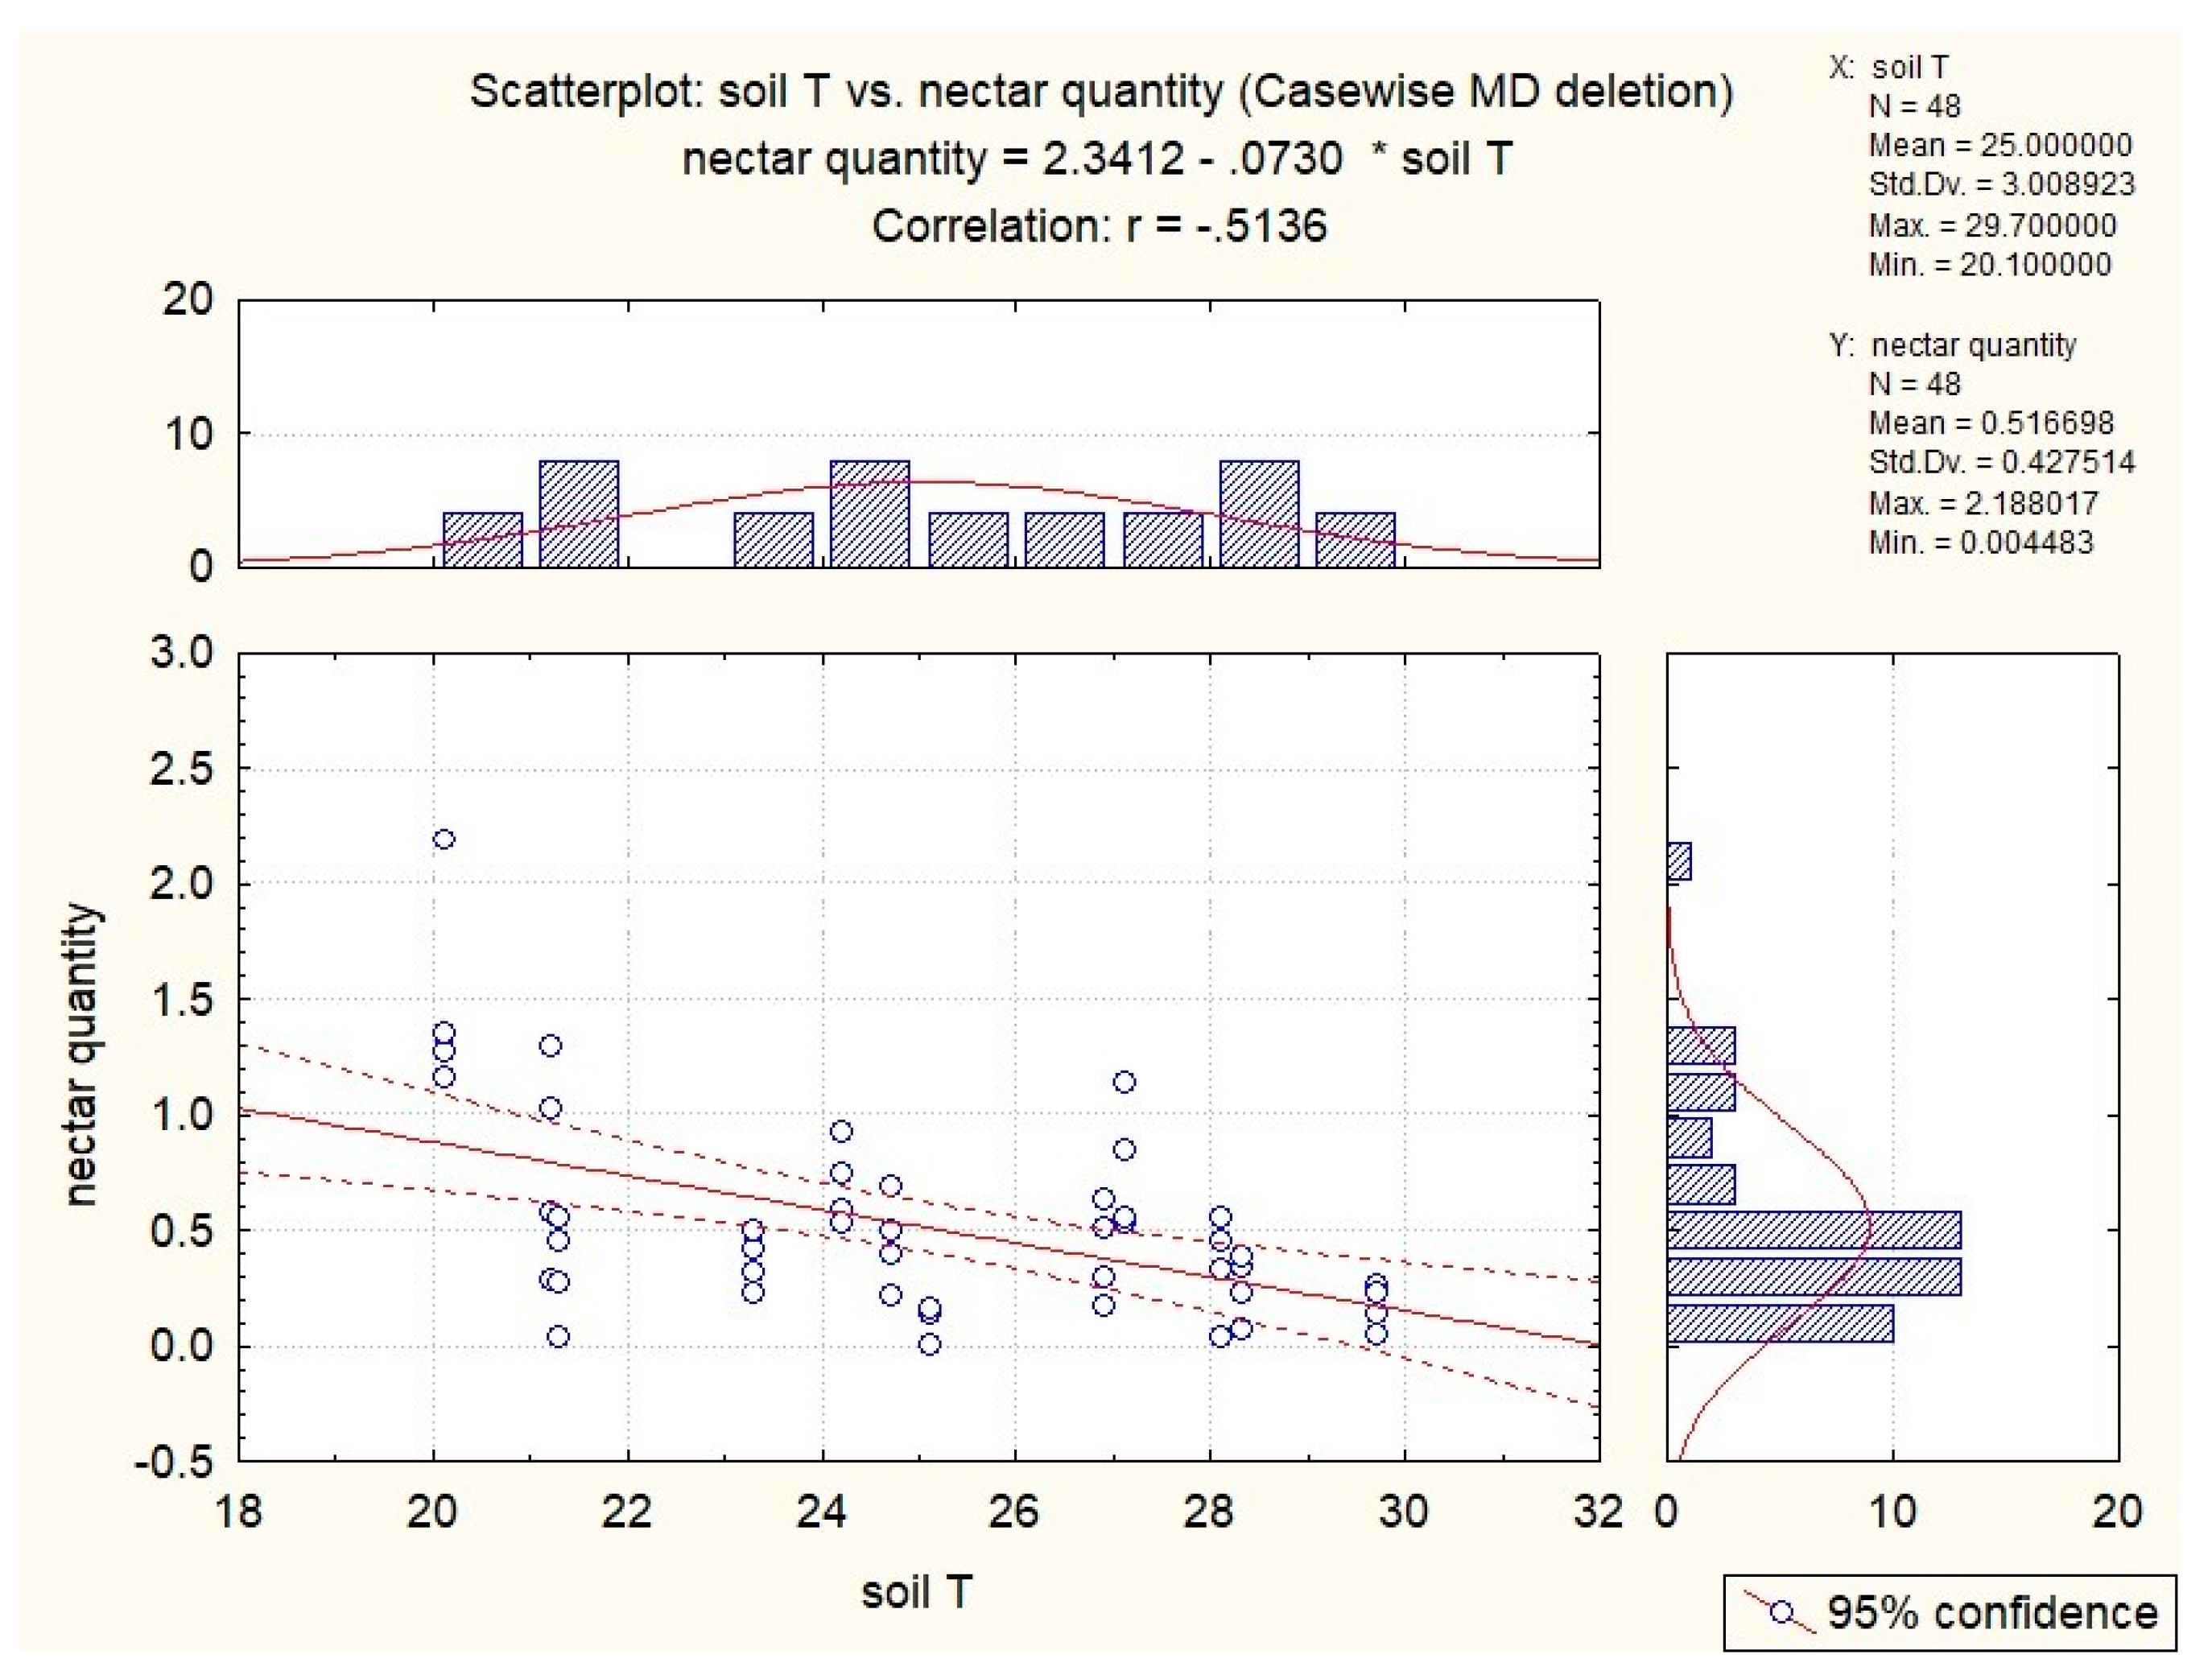
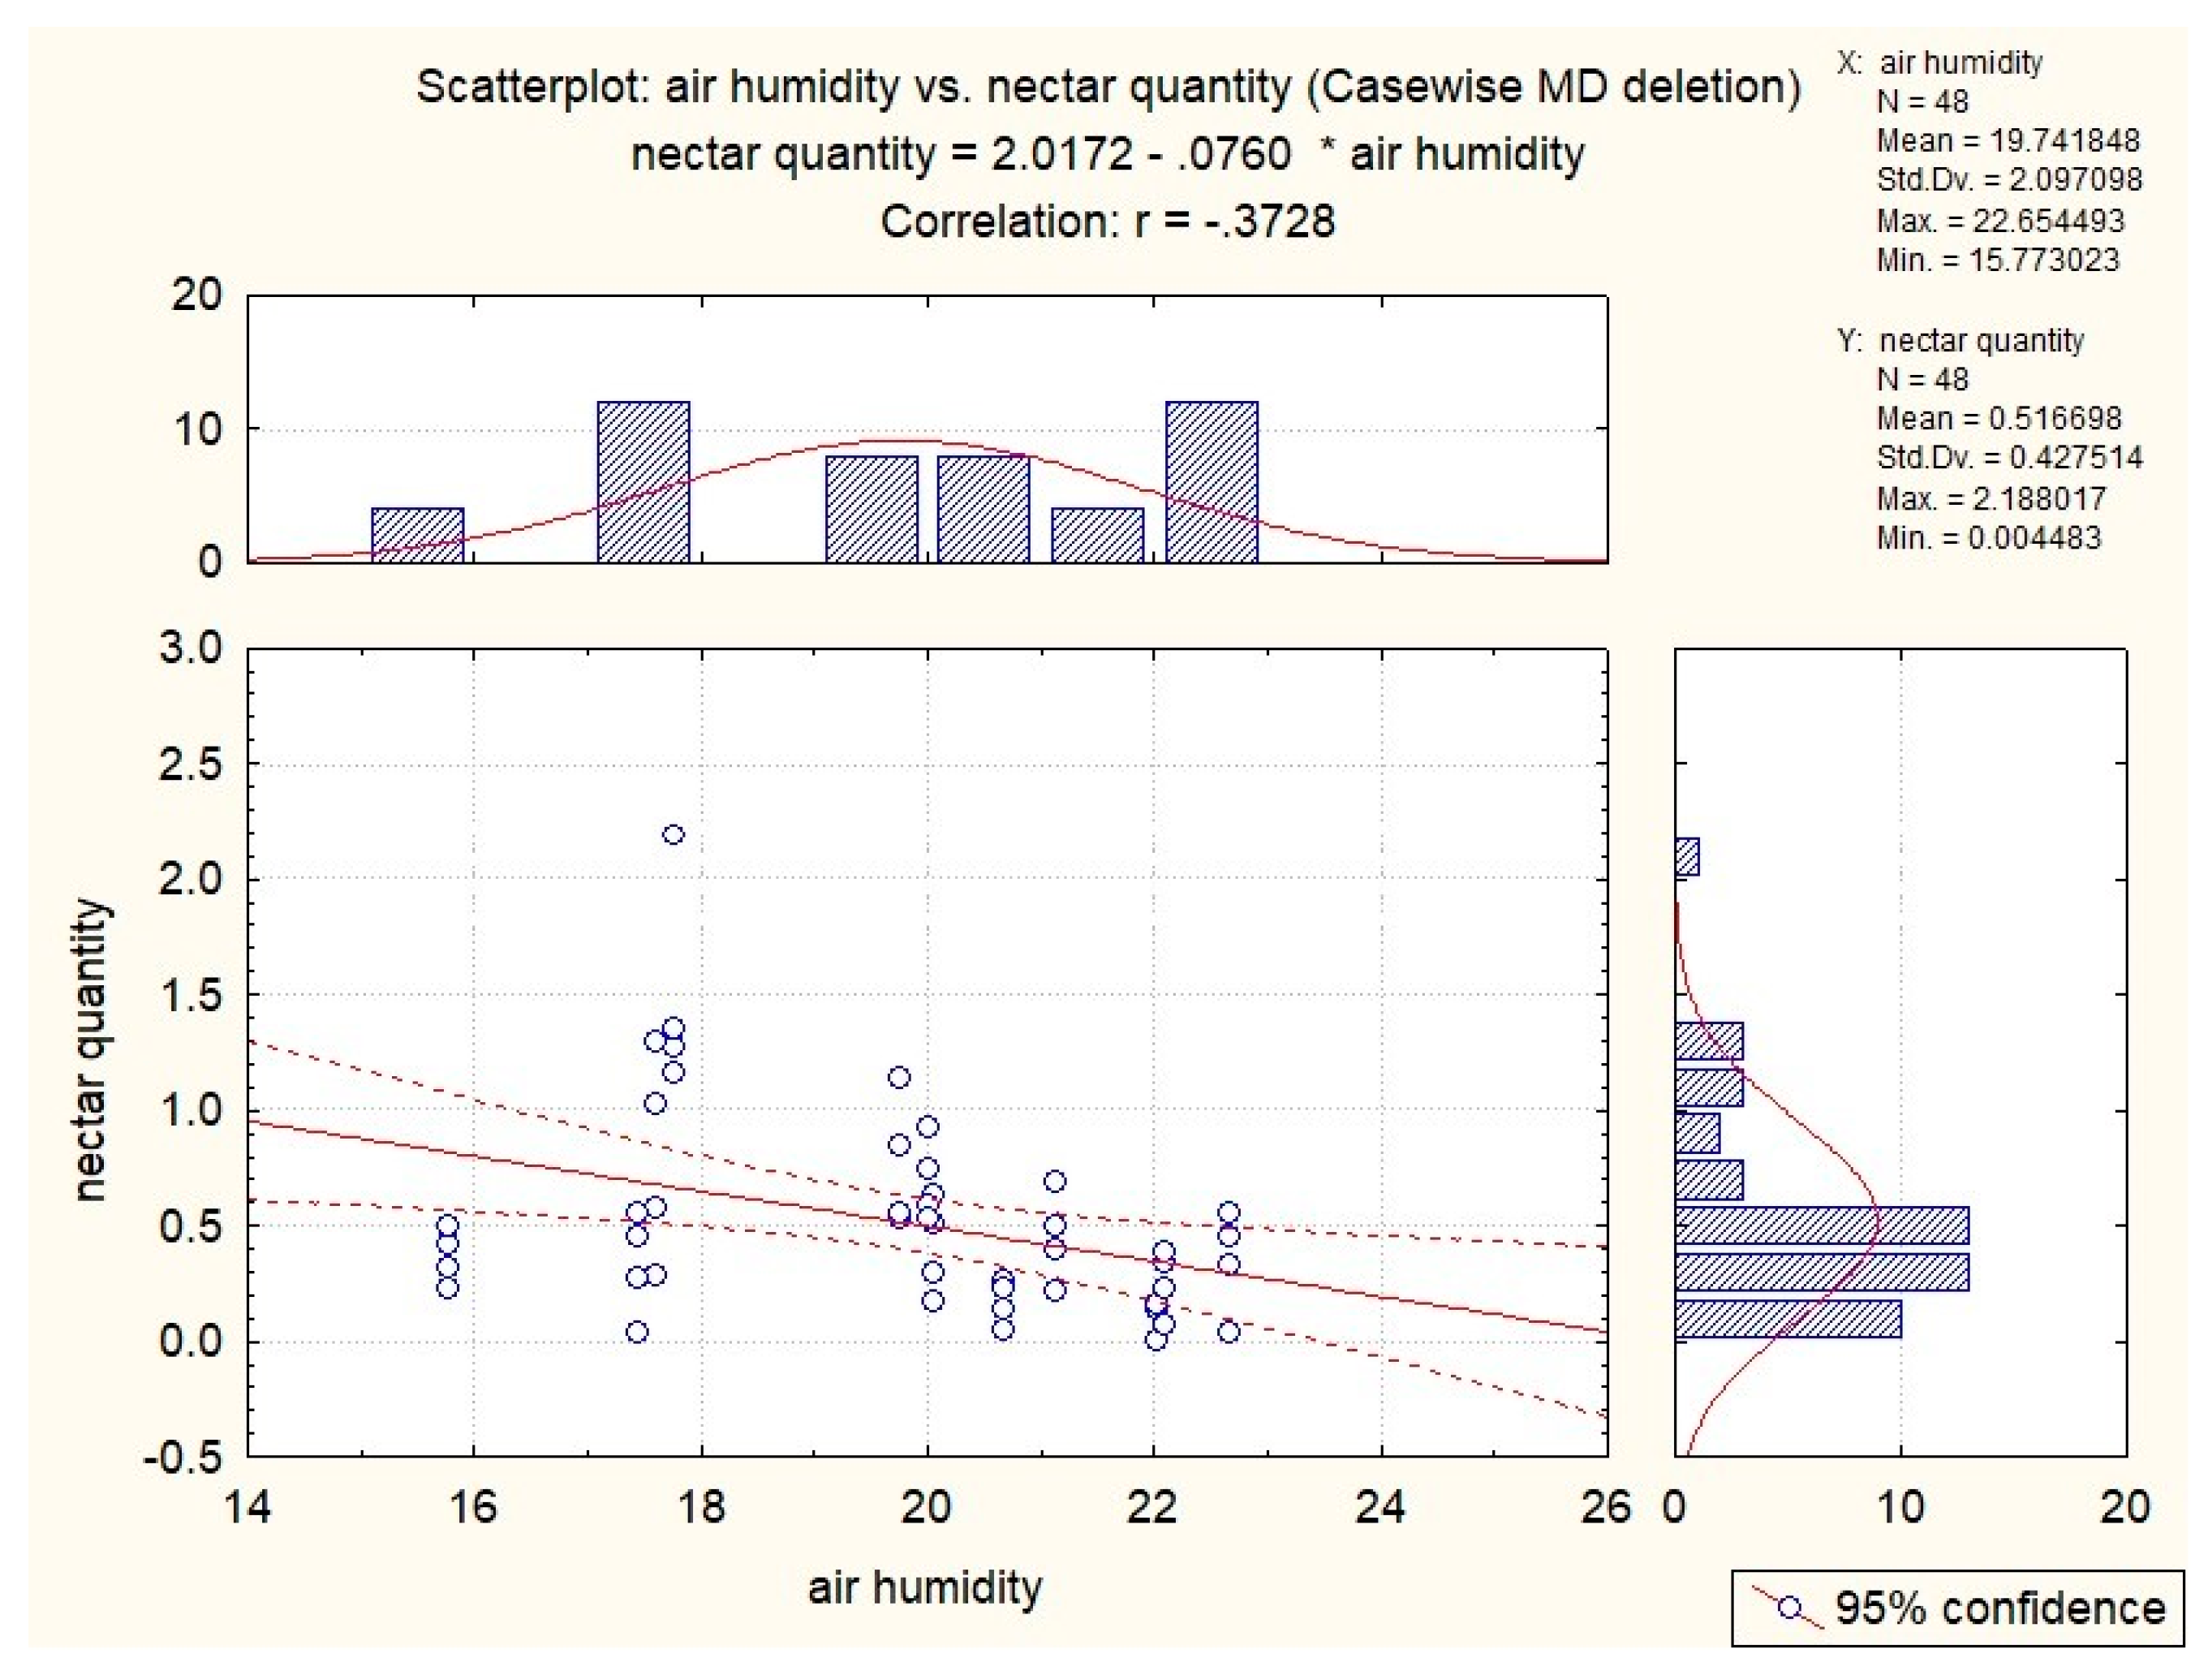
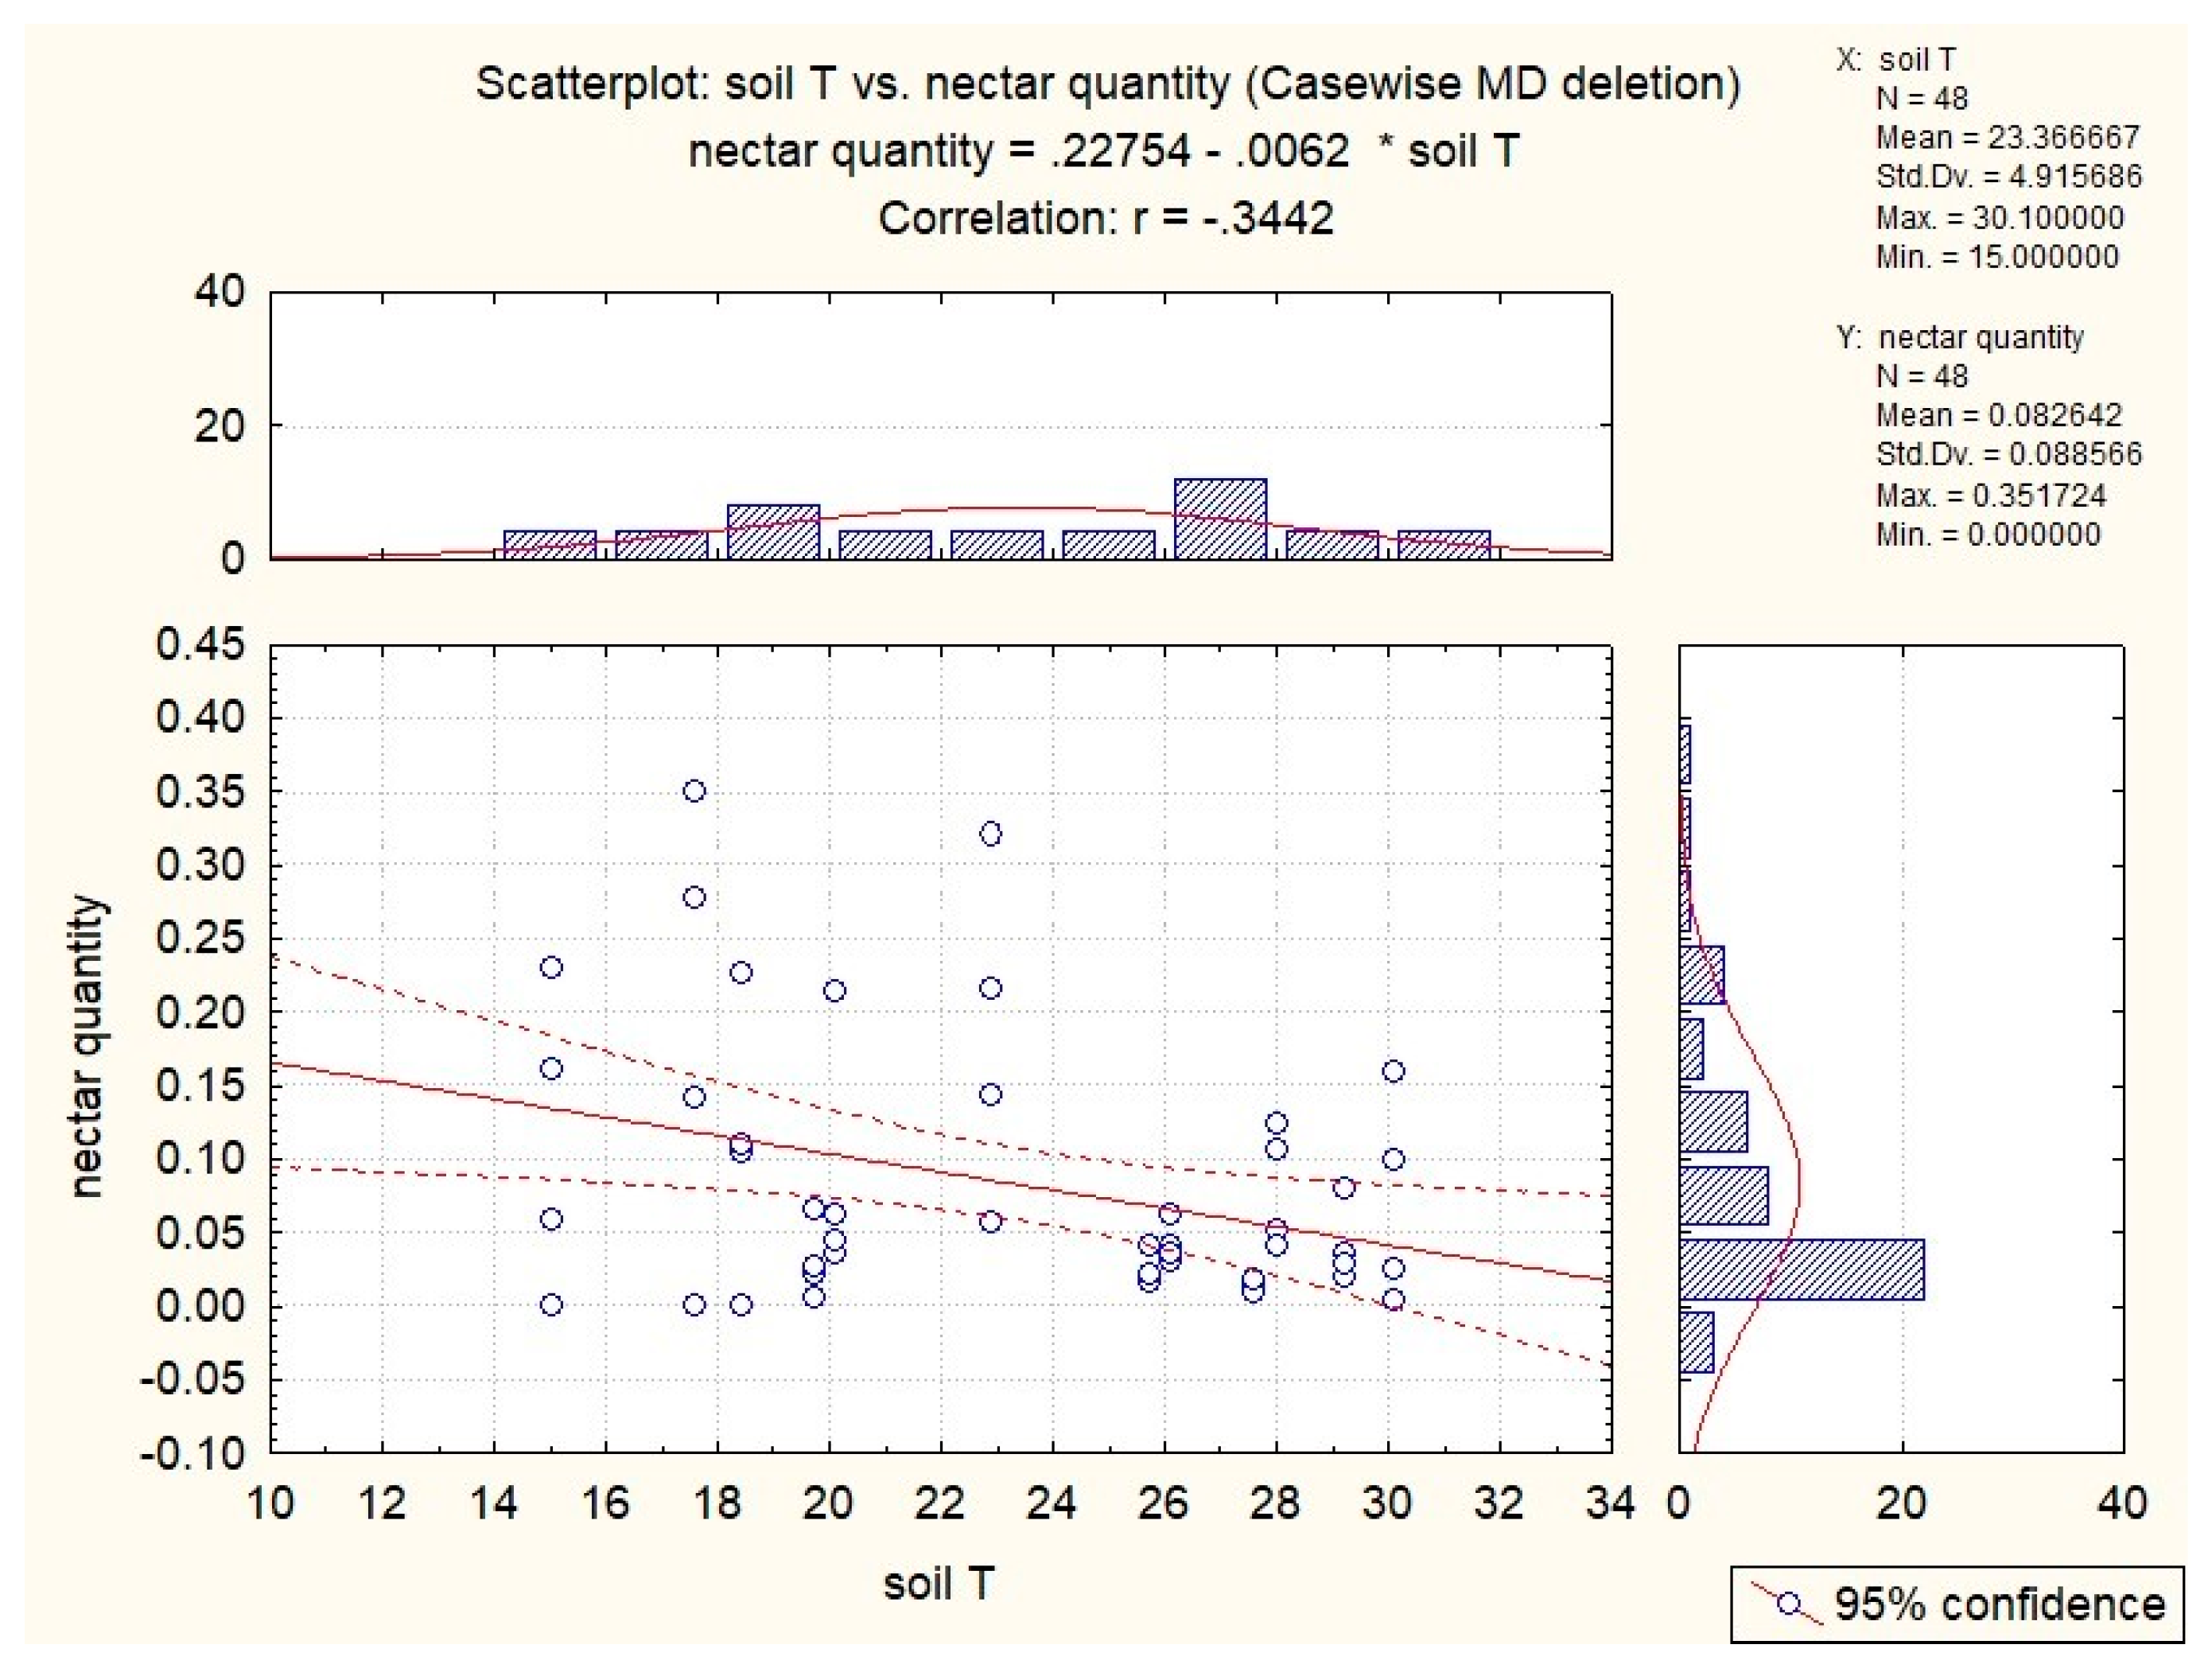
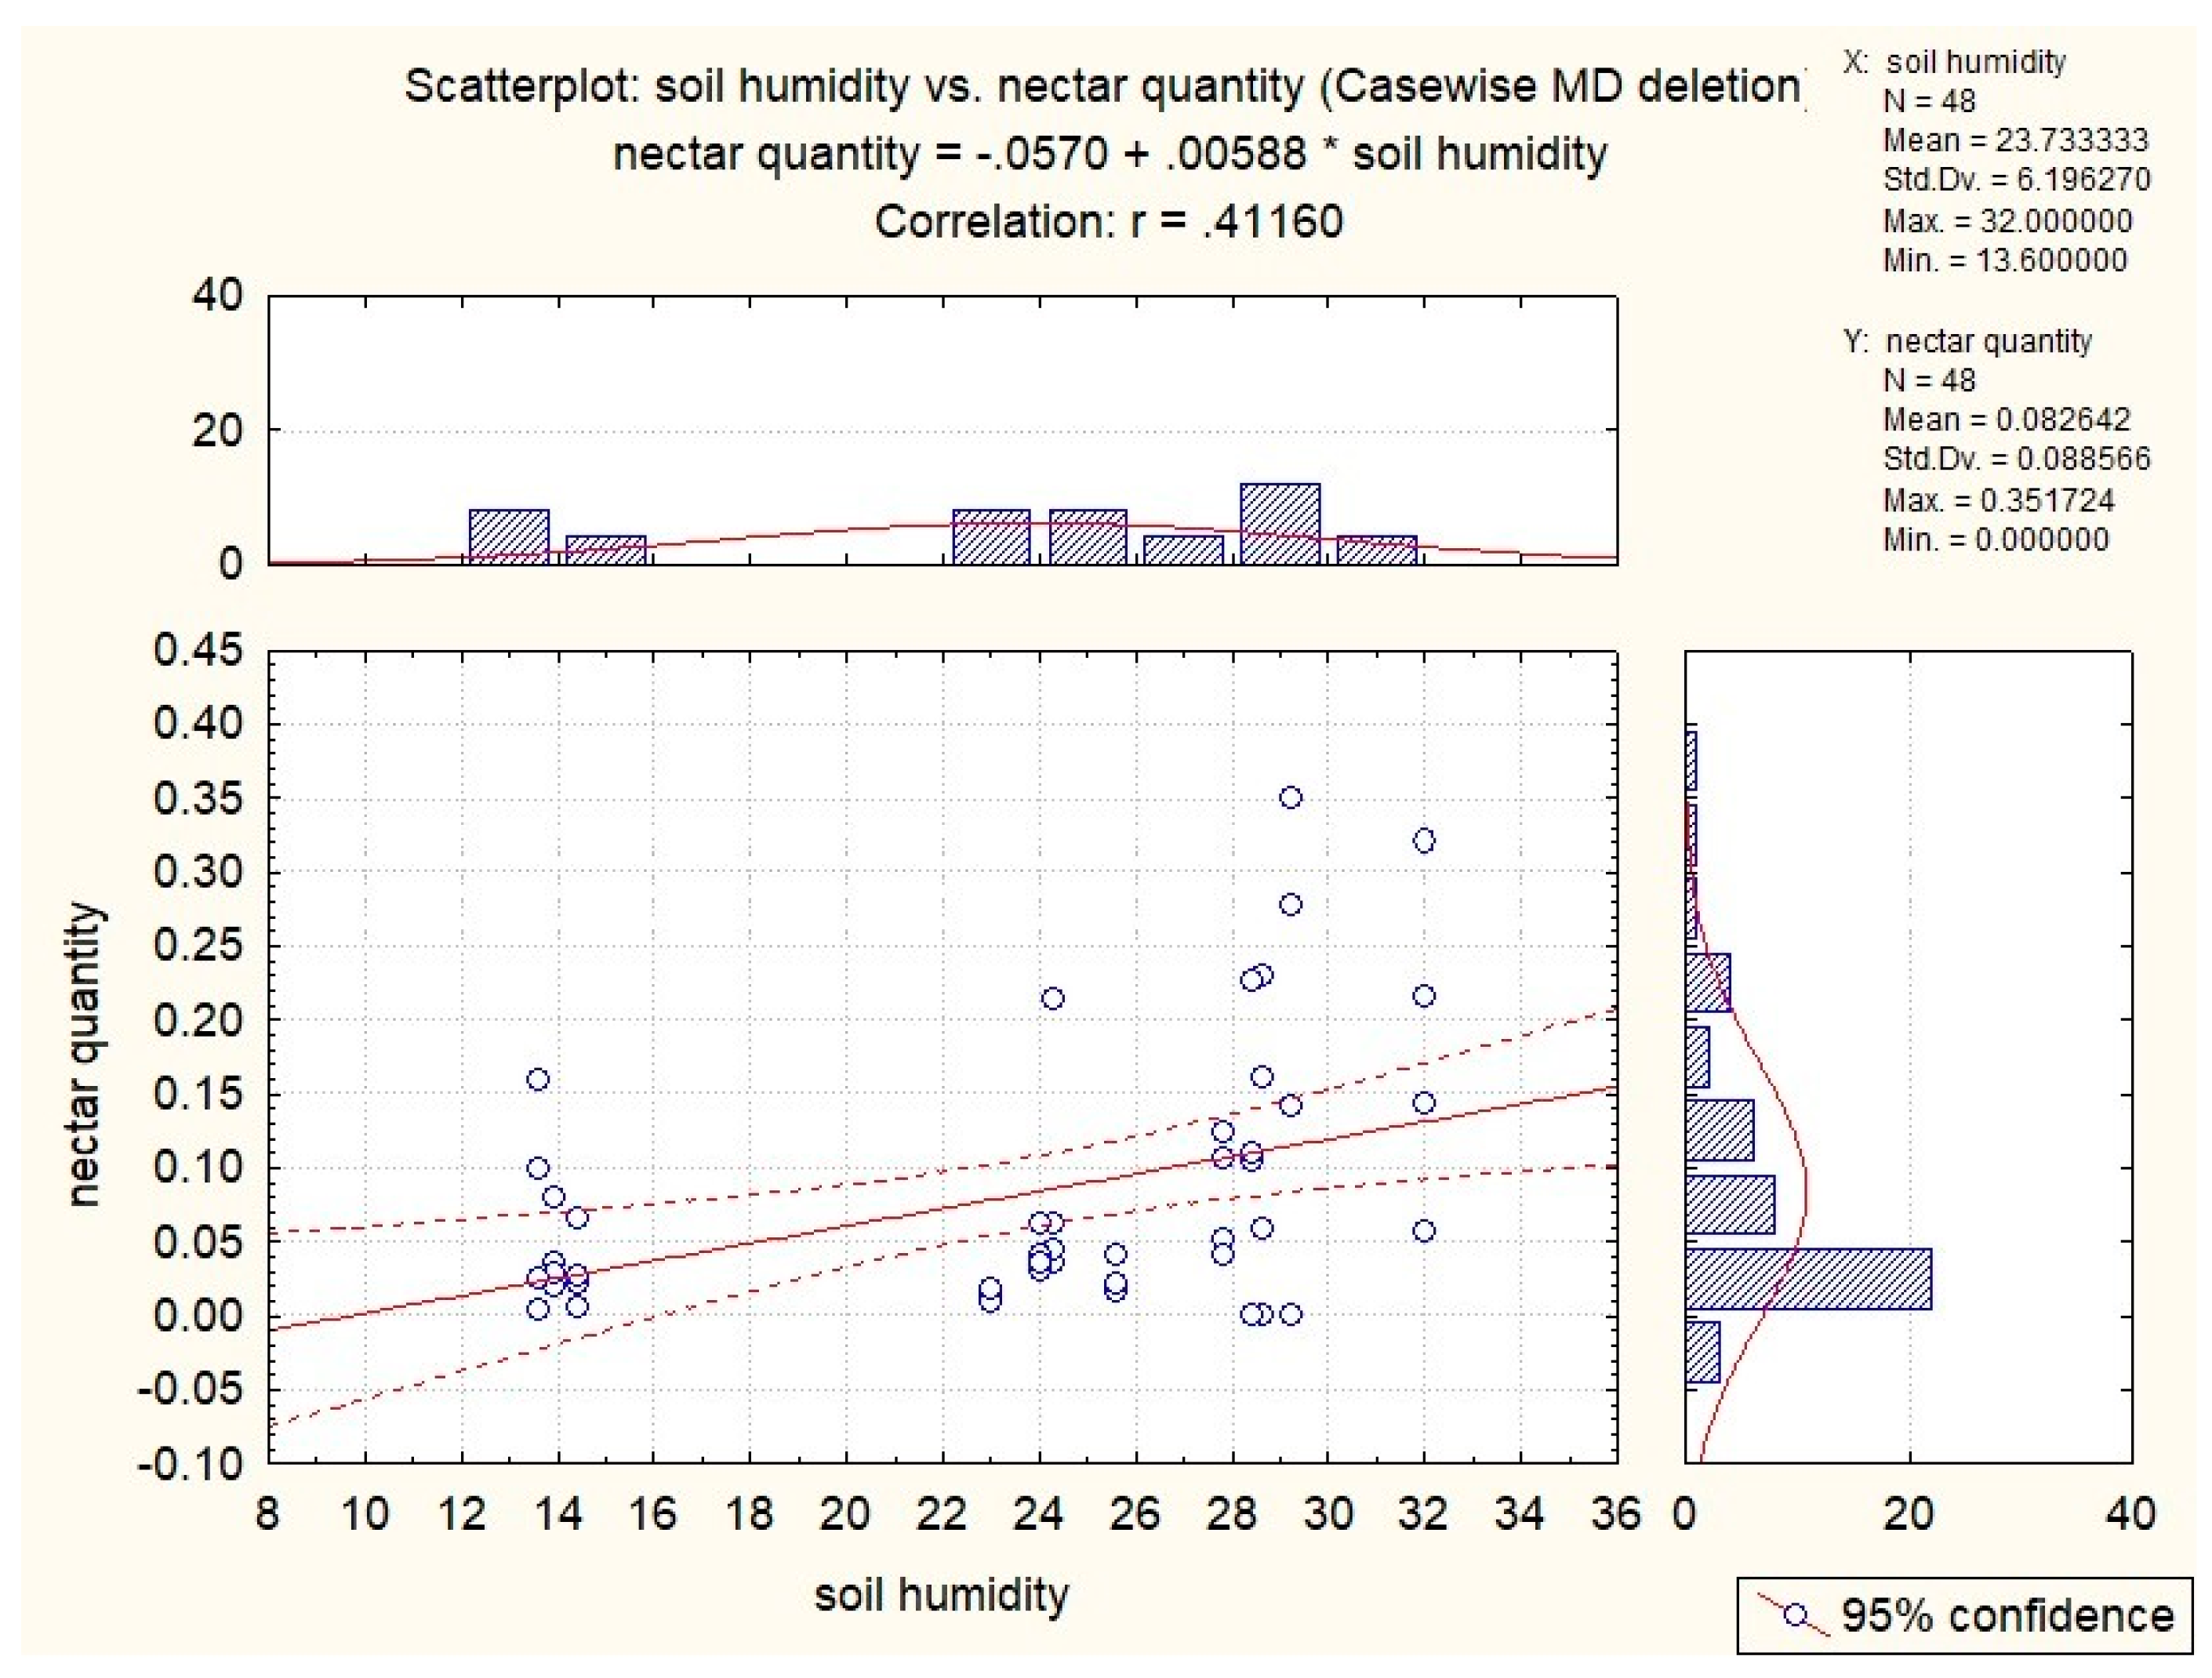
3.3. Influence of Abiotic Factors on Nectar Production

By measuring abiotic factors (air temperature, air humidity, soil temperature, soil humidity, and UVB radiation), we obtained results on how they influence nectar production. We calculated Spearman’s correlation coefficient for each of the factors (Table 1). The negative Spearman’s correlation coefficient for S. glutinosa shows that with increasing air temperature, there was a decrease in nectar production (Figure 5). We also obtained negative Spearman’s correlation coefficients for soil temperature (Figure 6) and air humidity (Figure 7), but we did not obtain any correlations for UVB radiation and soil humidity. Spearman’s correlation coefficient was 0.51 for air temperature and soil temperature, which shows that these factors are moderately correlated to nectar production, while Spearman’s correlation coefficient for air humidity and nectar production was 0.37, which means a weak-to-modest correlation.
Even though we found that the air and soil temperature and air humidity affected nectar secretion in S. glutinosa, our results for S. pratensis showed that soil temperature (Figure 8) and humidity (Figure 9) affected nectar production. The negative Spearman’s correlation coefficient for S. pratensis (Figure 8) shows that an increased soil temperature resulted in decreased nectar production, which is probably connected with soil drought. We obtained a positive Spearman’s correlation coefficient (Figure 9) for nectar production and soil humidity, which means that higher soil humidity is associated with higher nectar production. The value of 0.41 means that there is a moderate correlation. The other abiotic factors did not show any correlations.

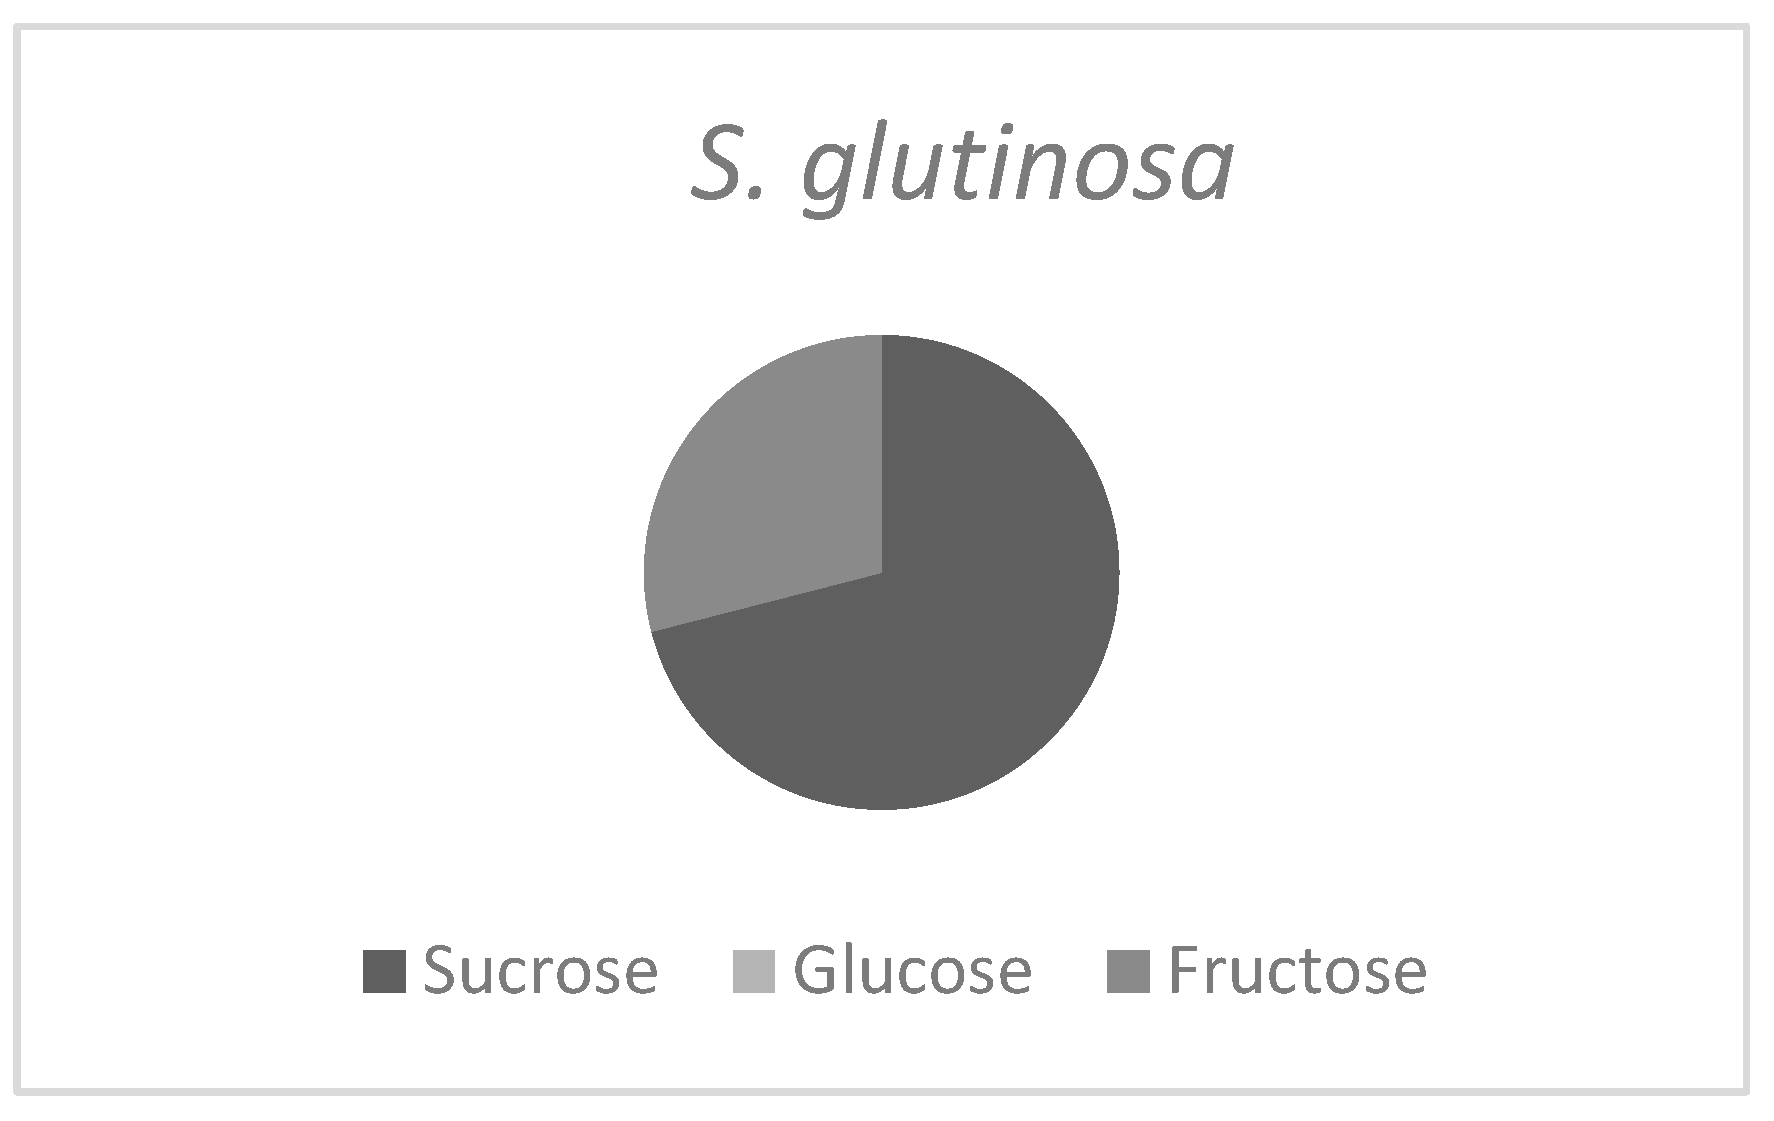
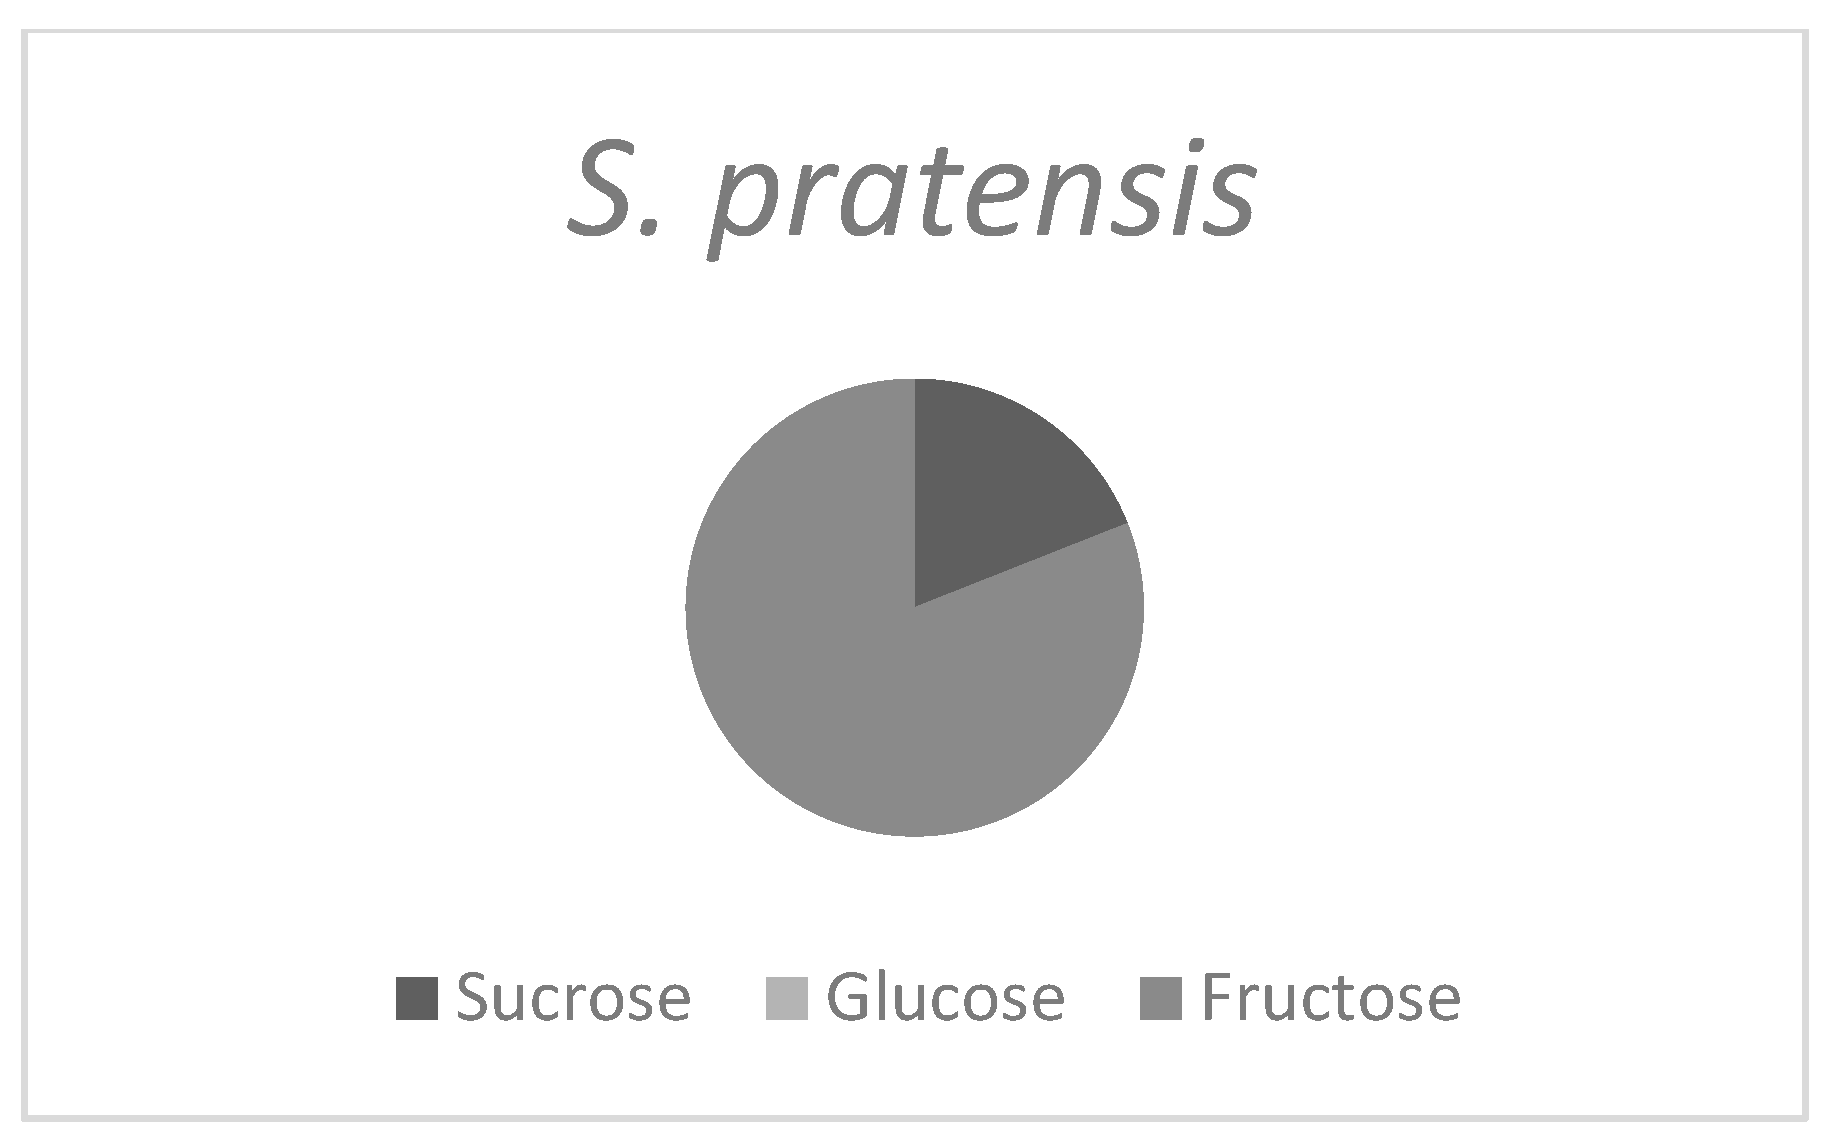
3.4. Ratio of Three Main Sugars in Salvia Nectar Samples

In the analysis of the three main sugars (sucrose, glucose, and fructose) in the nectar of S. glutinosa (Figure 10) and S. pratensis (Figure 11), we discovered that the dominant sugar in the 48 nectar samples from S. glutinosa was sucrose (71%); S. pratensis had a higher percentage of hexose, which means that it contained more fructose (81%), whereas the percentage of sucrose (19%) was lower. In all samples from both species, glucose was never the main sugar.

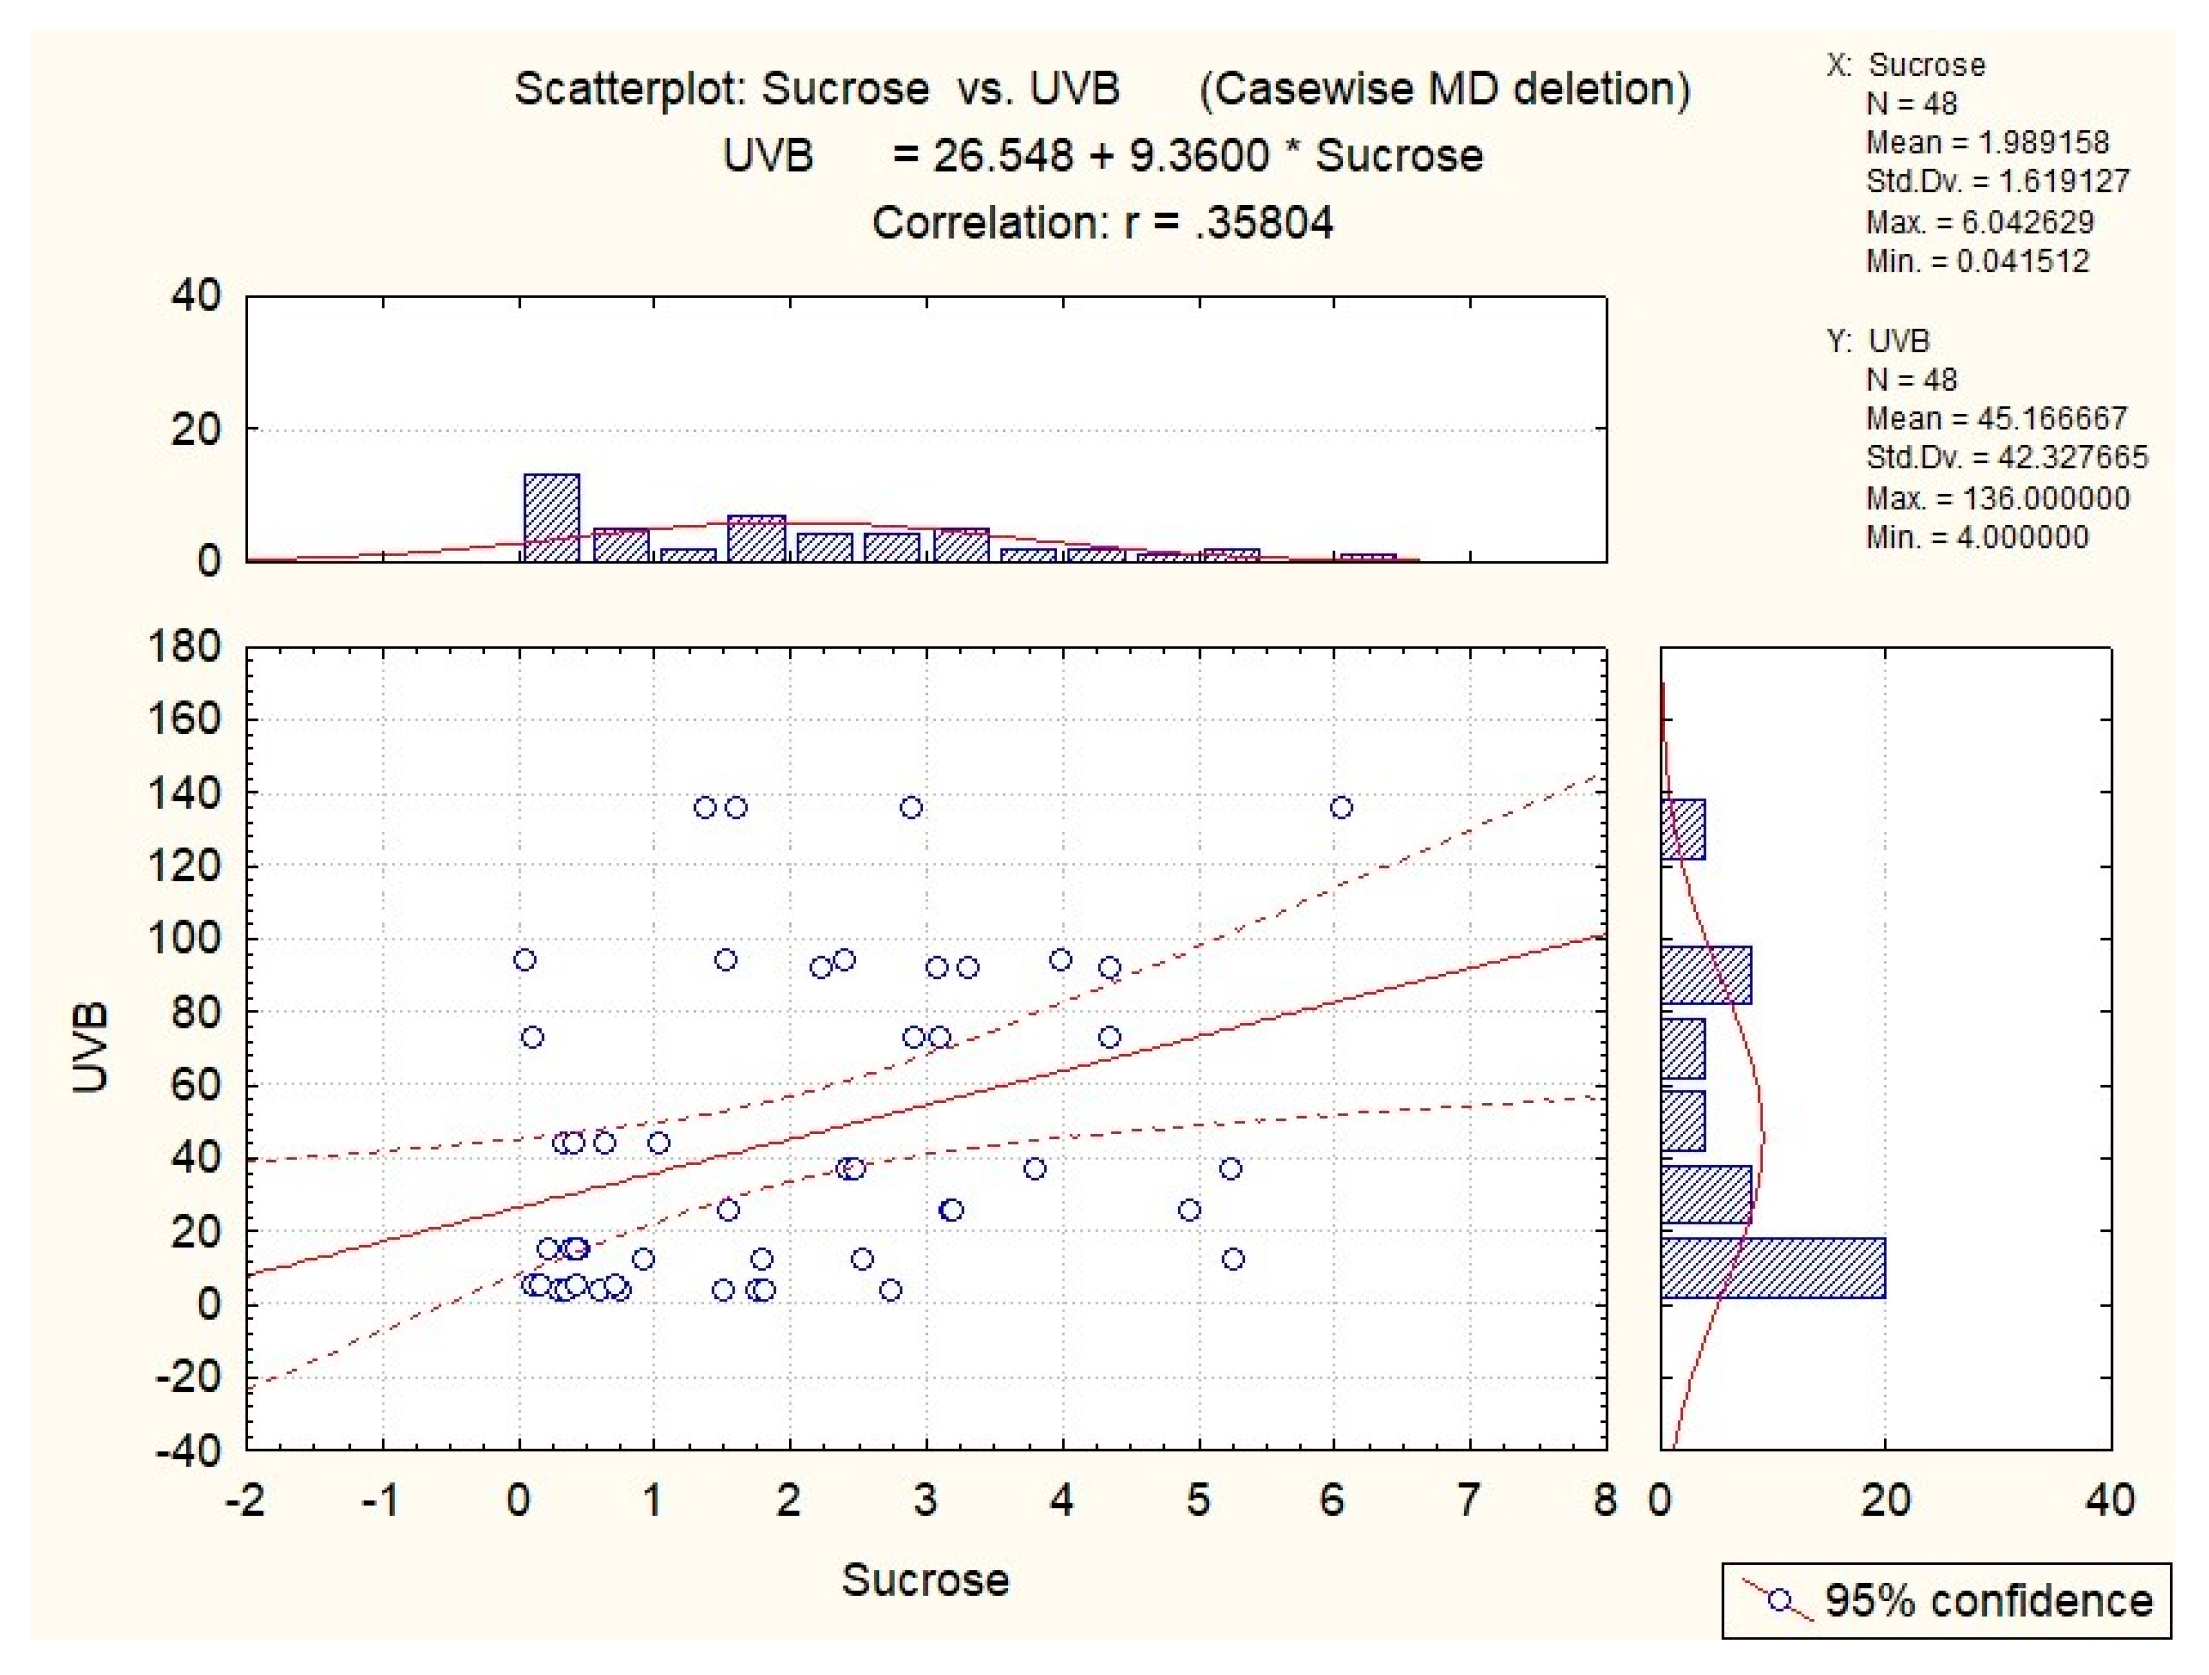
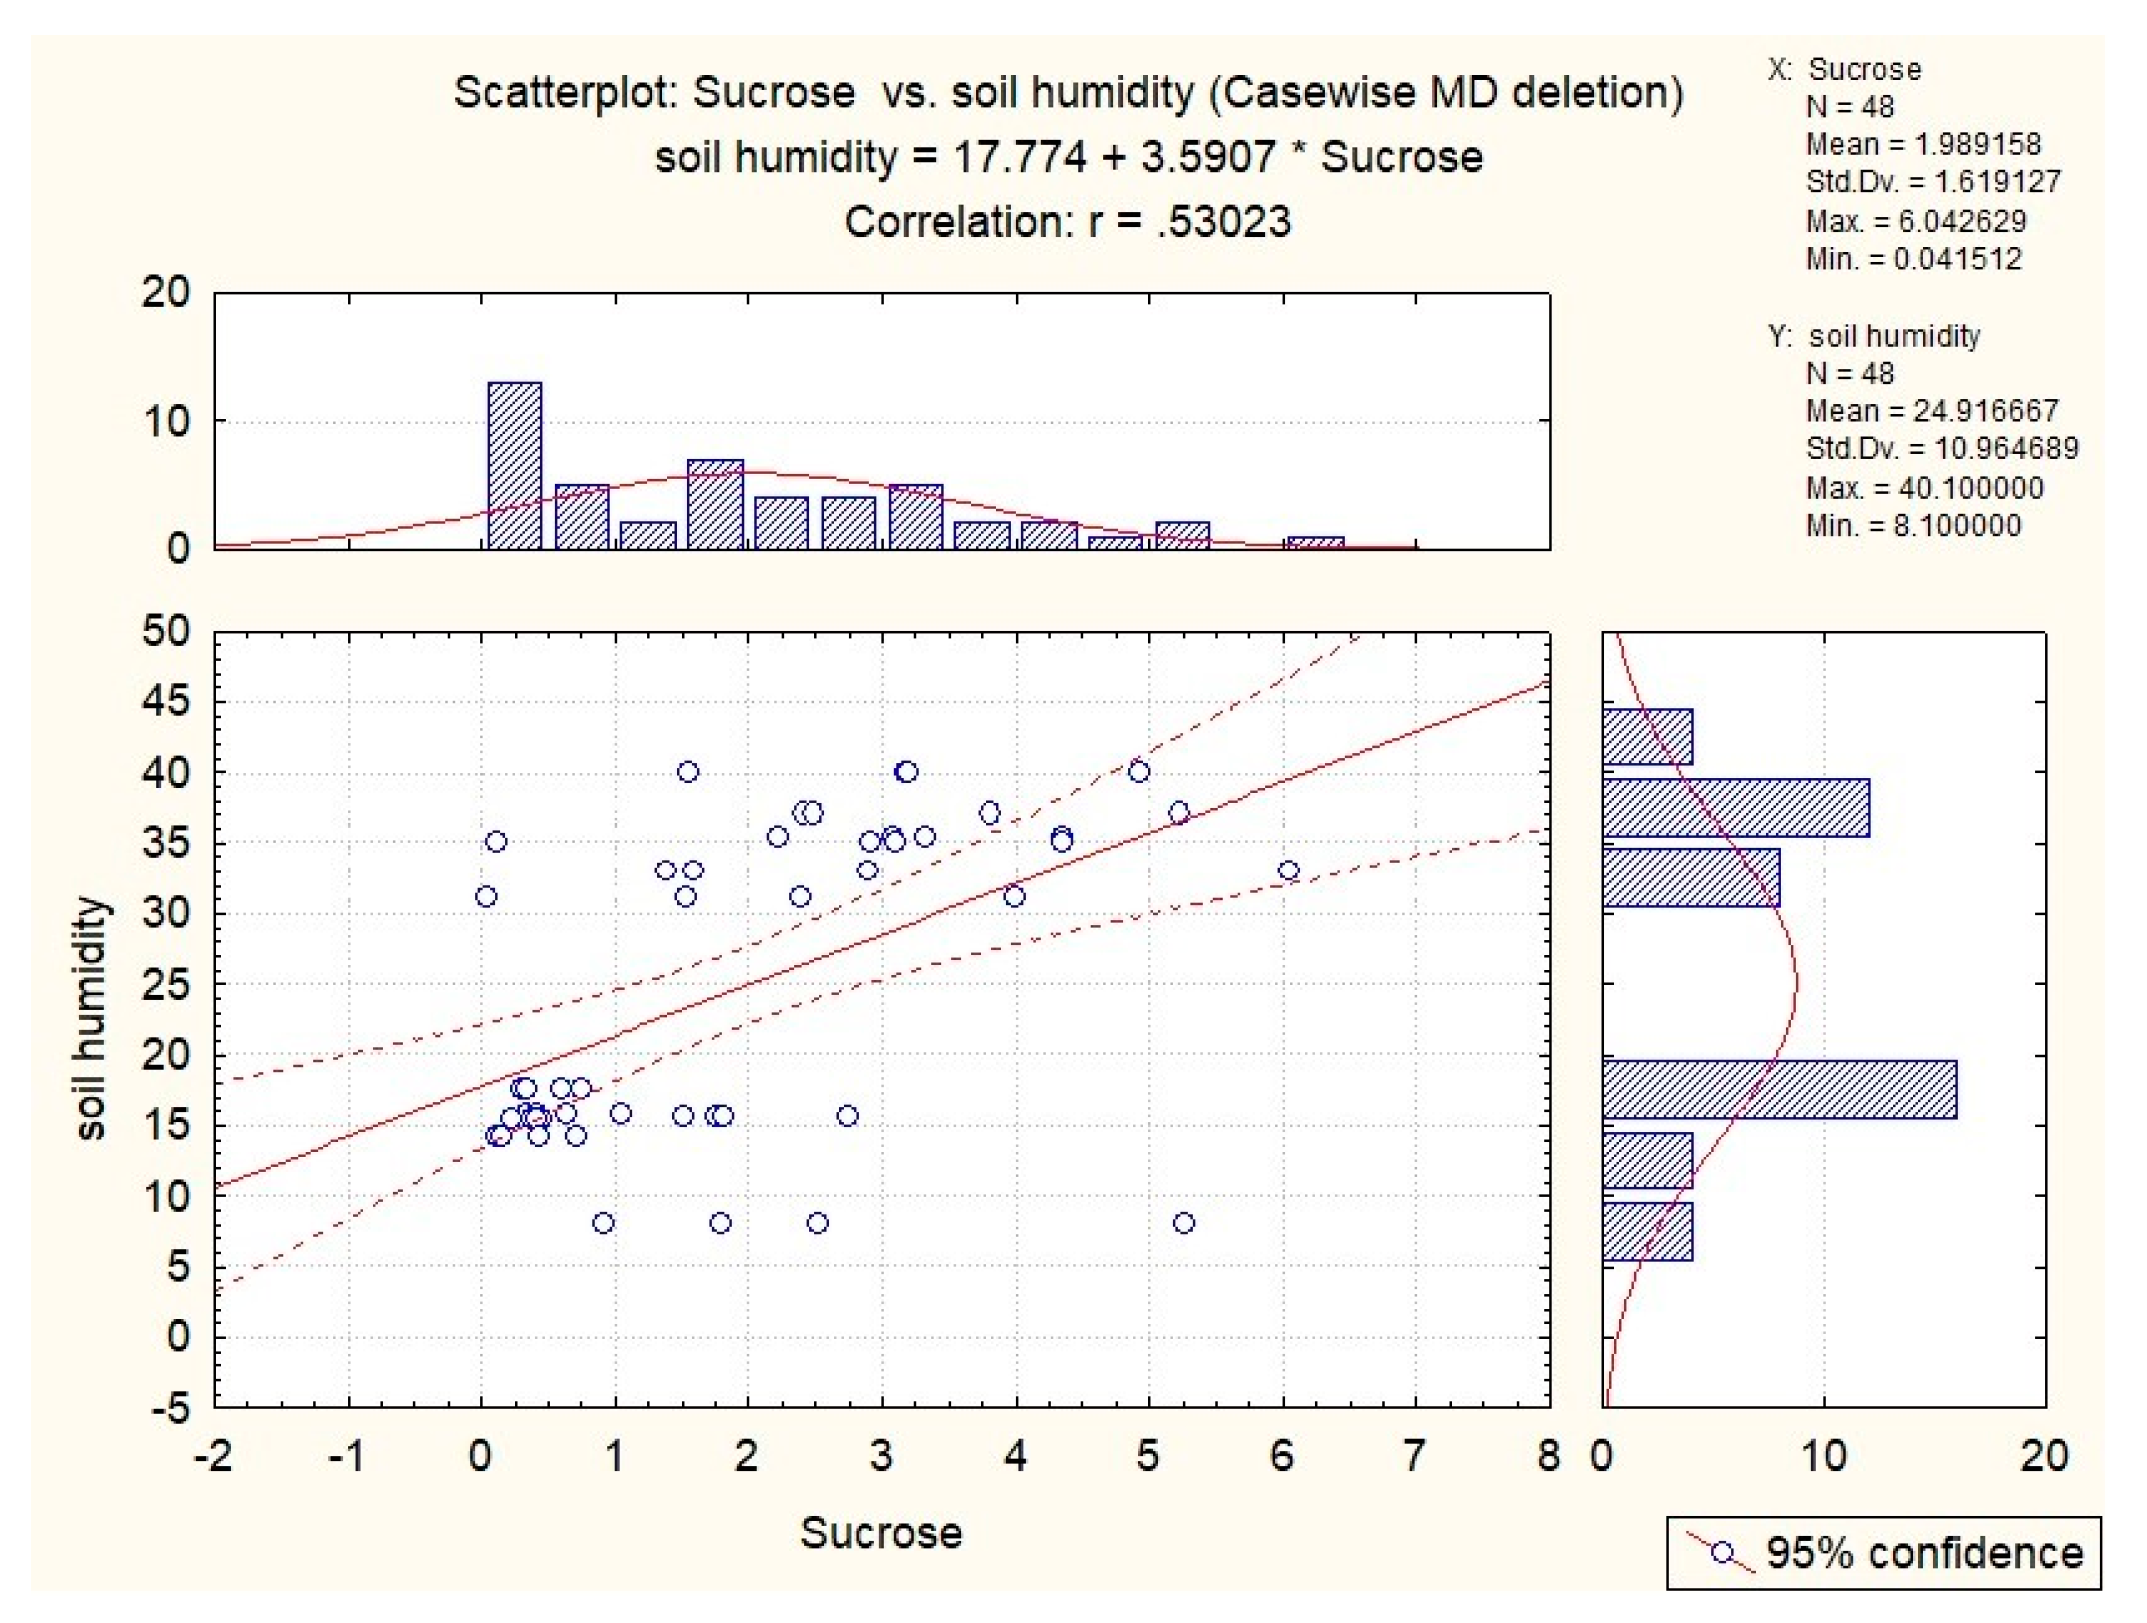
3.5. Influence of Abiotic Factors on Sugar Concentrations in S. pratensis Nectar

By measuring the abiotic factors (air temperature, air humidity, soil temperature, soil humidity, and UVB radiation) and calculating the Spearman’s correlation coefficients, we obtained results on their influence on the nectar sugar concentrations (Table 2). We obtained positive Spearman’s correlation coefficients for the effects of UVB (Figure 12) and air temperature (Figure 13) on the amount of sucrose in nectar, which means that the higher the UVB radiation and air temperature, the higher the amount of sucrose in the nectar; however, we did not find any other correlations. The Spearman’s correlation coefficient value (>0.35) means that there was a low correlation, which would be difficult to confirm.

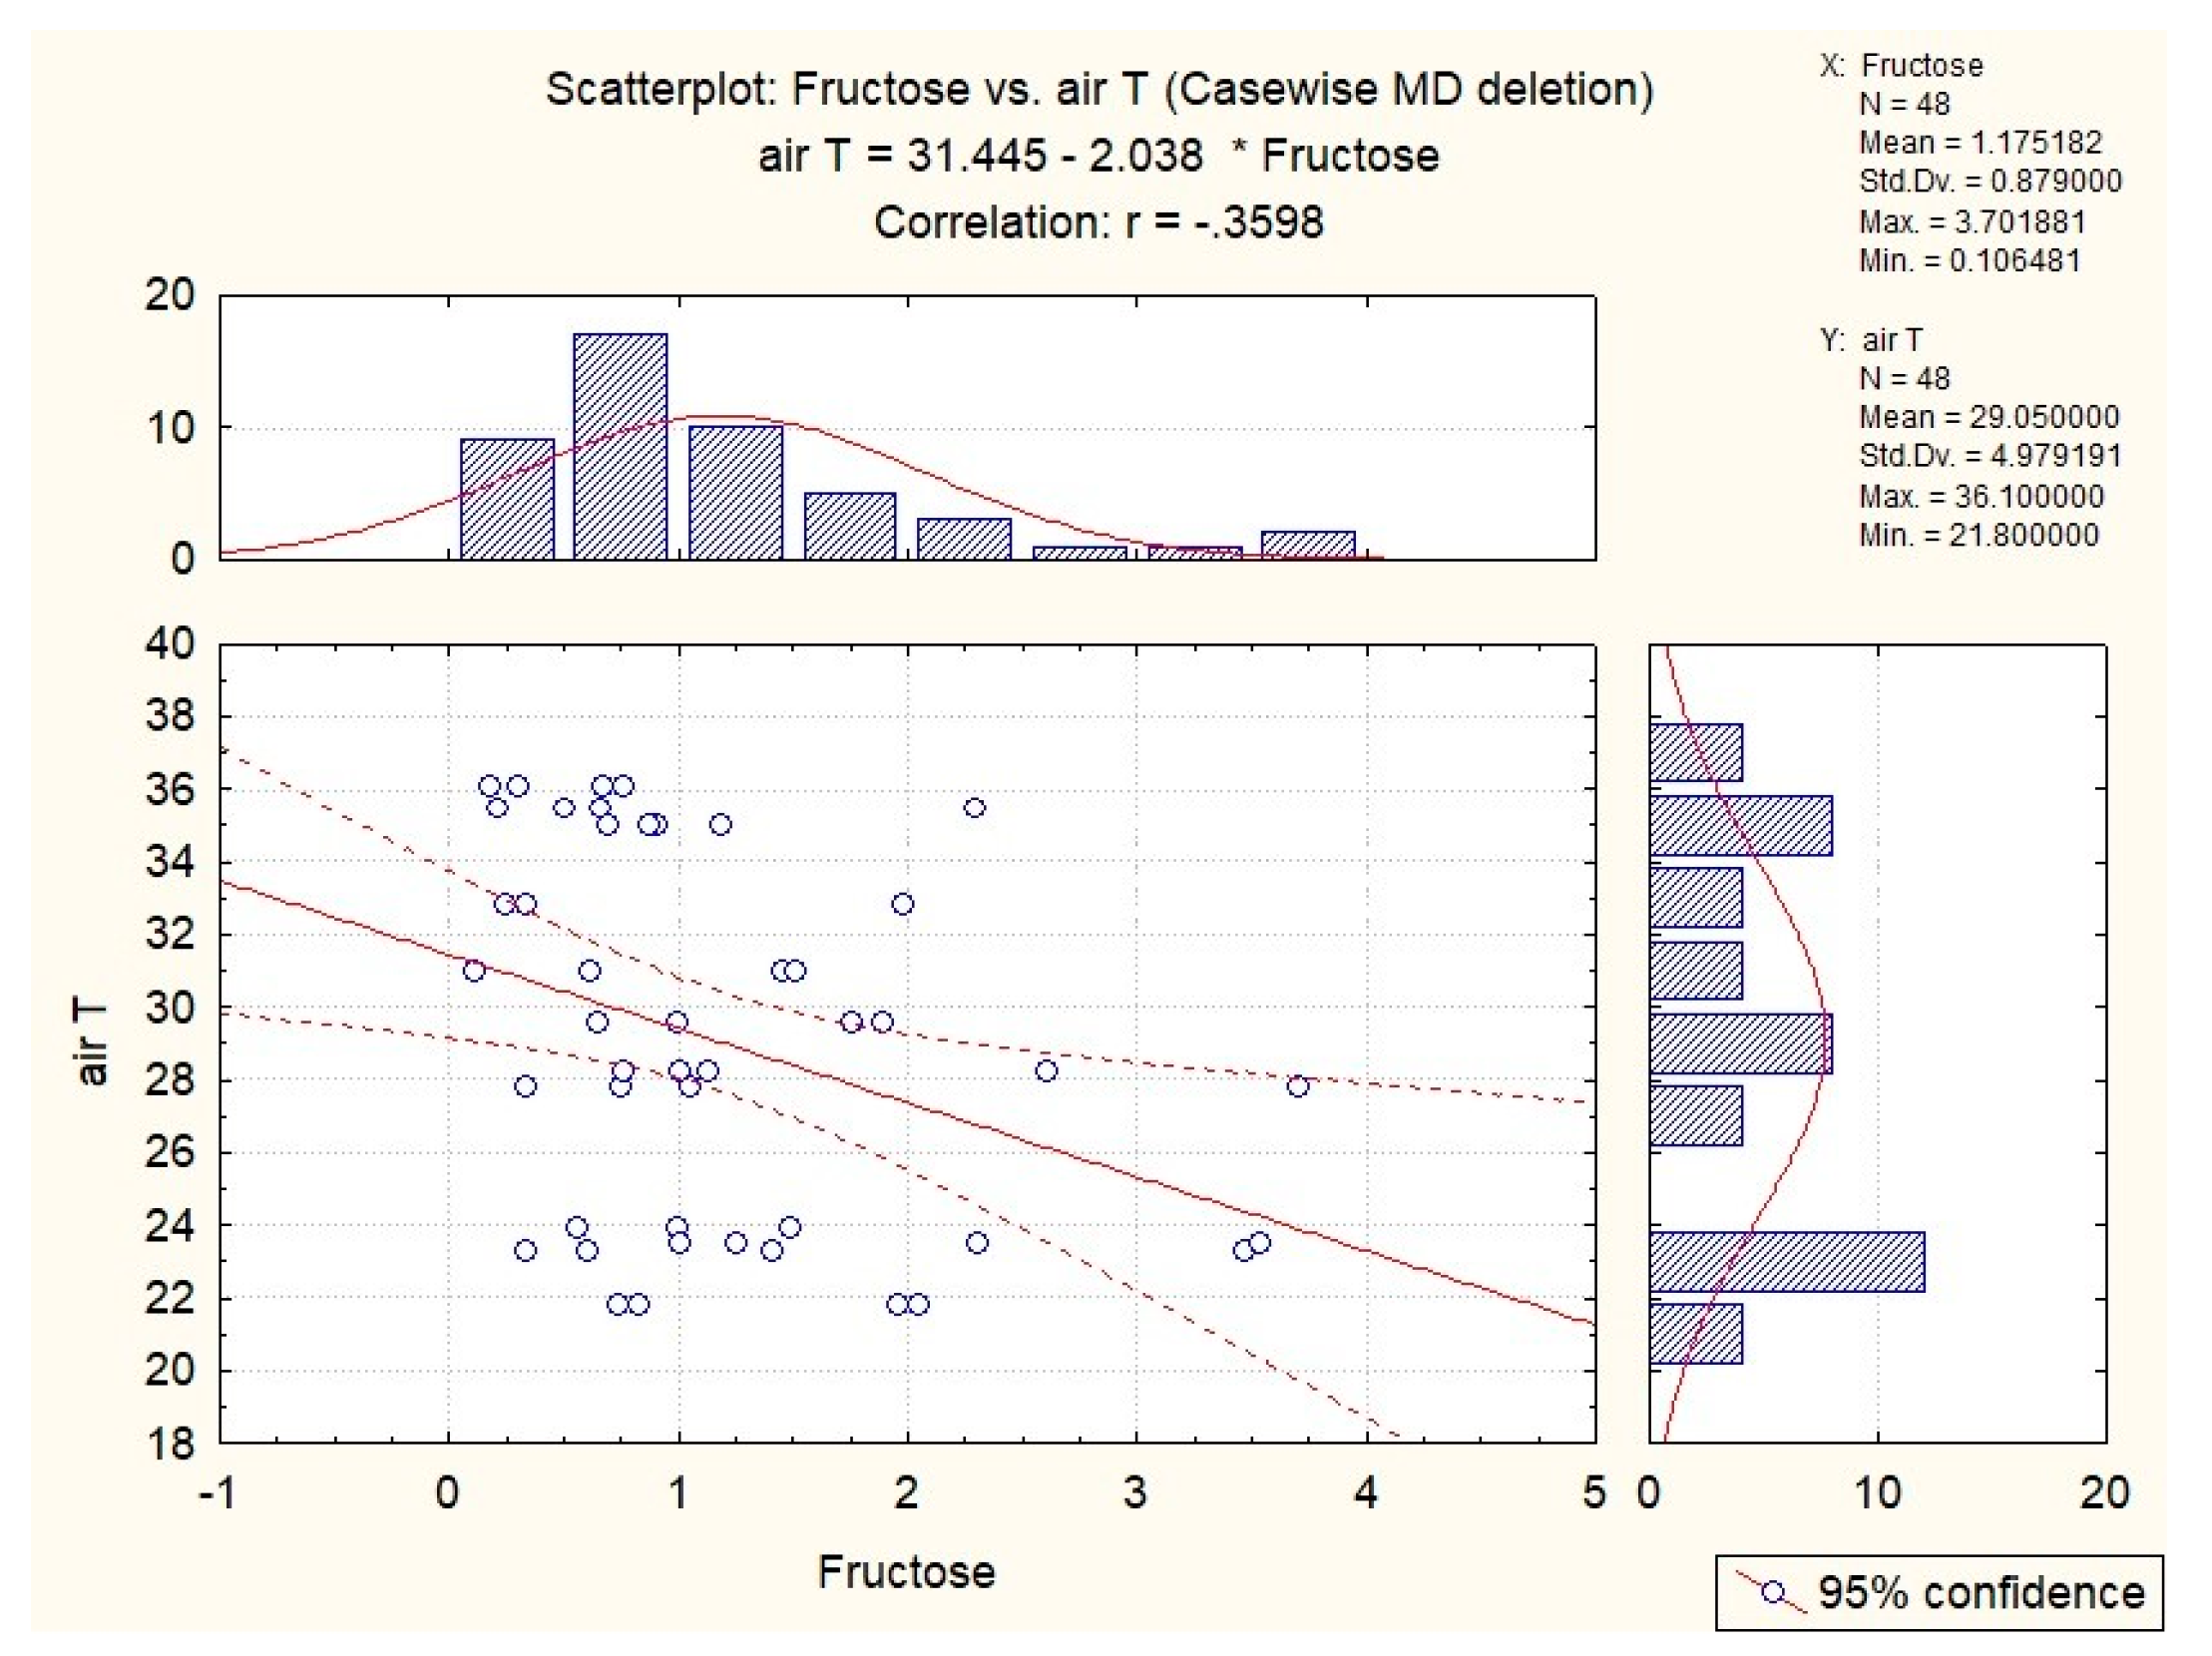
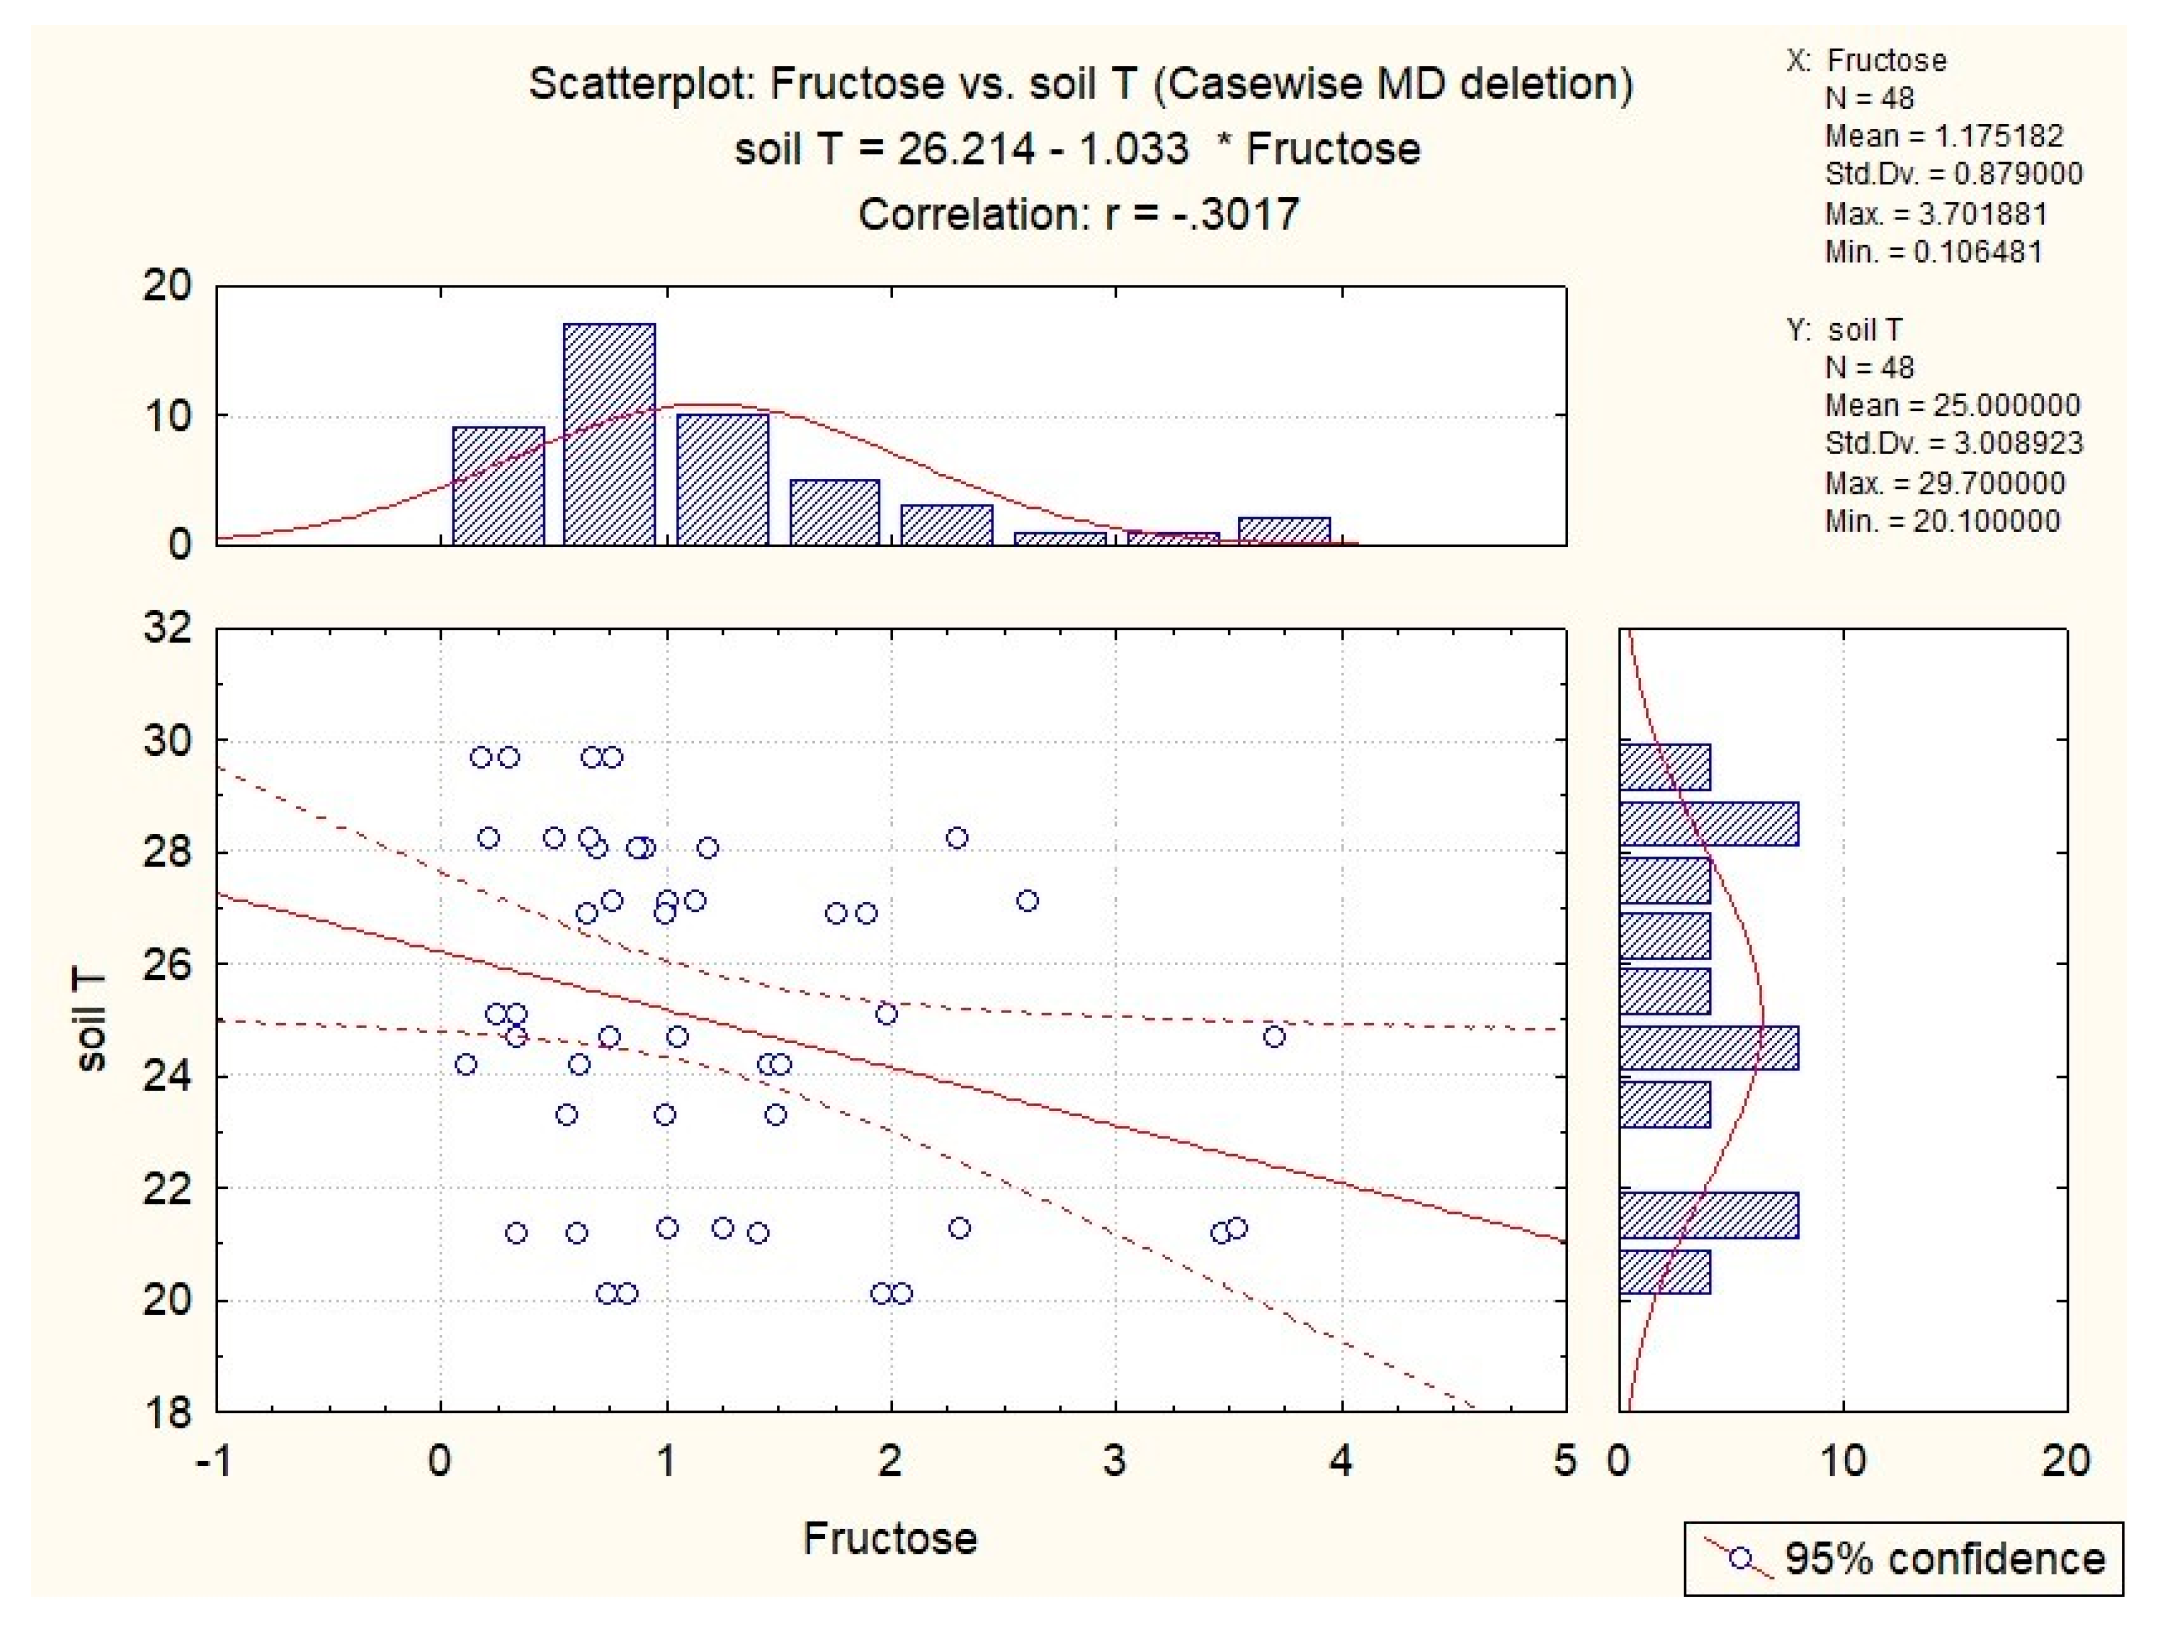
3.6. Influence of Abiotic Factors on Sugar Concentrations in S. glutinosa Nectar

The same measurements of abiotic factors were also performed for S. glutinosa, and we also calculated the Spearman’s correlation coefficients (Table 3). We obtained positive Spearman’s correlation coefficients for the effects of UVB radiation (Figure 14) and soil humidity (Figure 15) on the amount of sucrose in nectar, which means that the higher the UVB radiation and soil humidity, the higher the amount of sucrose in the nectar; however, we did not find any other correlations. The Spearman’s correlation coefficient value (0.36<) means that there was a low correlation with UVB radiation, but a high correlation was observed for soil humidity. We obtained negative Spearman’s correlation coefficients for the effects of air temperature (Figure 16) and soil temperature (Figure 17) on fructose, which means that the higher the temperature, the lower the fructose level. Since the Spearman’s correlation coefficient value was 0.36, these correlations are difficult to confirm.

4. Discussion

Nectar is the main food for pollinators as it provides them with nutrients and is produced in specialized glands—nectaries [1,2,3,4,5,6,7,10]. Nectaries can be located inside or outside of flowers [6,7,9]. In our research, we focused on nectar from the floral nectaries of two Salvia species: S. glutinosa and S. pratensis. Salvia species are part of the Lamiaceae family [44]. In general, the nectary consists of three parts: an epidermis, specialized parenchyma, and a vascular system. Nectar in the Lamiaceae family is secreted through modified stomata in epidermal cells. The quantity and position of these modified stomata may differ across species within the family. The size of the nectary is supposed to be related to the size of the flower, which affects the secreted nectar; however, for the Lamiaceae family, it has been proven that the number of stomata does not affect the secretion of nectar [41].
The nectar quantity variability in flowers of the same plant can be influenced by the different positions of each flower, their age, and pollinator visits, but mainly by microclimatic factors [20,21]. Abiotic factors and the time of the day have a high impact on nectar production [22,23,24,26,27,28]. Our results show that nectar production was highest at 12:00 for both species, which coincides with the results of Kradolfer and Erhardt [20,21], who found that S. pratensis nectar secretion was highest from 10:00 to 12:00. Our results were also similar to those of other research [24,28,29,48]. A possible reason as to why nectar production in S. pratensis was higher at 15:00 than at 9:00 is that we collected some samples when the temperature in the morning was not optimal for this species, since it was too cold (13 °C). Nevertheless, the highest nectar production was at 12:00. S. pratensis is a summer species and probably has optimum nectar production in warmer conditions [39,41]. It has been established that nectar production is lower in the afternoon than in the morning [24,28,32]. For the species S. glutinosa, nectar production was lowest at 15:00. Our results also show that the nectar productivity of S. pratensis and S. glutinosa is different. S. glutinosa has higher nectar productivity. The reason for this might be in the flower size—S. glutinosa has bigger flowers—and in better abiotic conditions. As mentioned before, S. pratensis is a summer species and prefers higher temperatures [44].
As already mentioned, abiotic factors also influence nectar secretion [7,22,23,24,25,26,27,31]. When the air and soil temperature increase, S. glutinosa nectar production decreases. It has been established that nectar production is generally higher at a higher temperature, but not always; S. glutinosa is usually more of a shade-tolerant plant, and it prefers lower temperatures [44]. Usually, plants in warmer environments tolerate higher temperatures more easily [32]. We collected samples in summer when the temperature was high; as previous research has shown, hot weather can affect the available water, which causes lower nectar production [7,32]. On the days when we collected samples from S. glutinosa, the air humidity increased throughout the day. We assume that our results regarding the effect of higher air humidity on nectar production relate to the late hour (15:00) and not so much to humidity. In other research, UVB radiation [21] did not have any effect; our conclusions are the same.
When the soil temperature increases, nectar production in S. pratensis decreases, which is probably connected with soil drought. Petanidou [29] explained that species from warmer climates usually secrete more nectar in higher temperatures; on some days, the temperatures were high [49], so this could be the reason, since the temperature went even above 30 °C. In this species, soil humidity affected nectar production, which is in line with other research suggesting that the higher the soil humidity, the higher the nectar production [22].
Nectar contains water, sugars, nitrogen compounds, organic acids, pigments, essential oils, vitamins, minerals, lipids, phenols and terpenoids, alkaloids, non-protein amino acids, antioxidants, and other secondary compounds [6,7,8,14,15,16,17]. The composition of nectar can vary within a species, among populations, or even between individual plants or flowers on the same specimen [17,19]. Sugars are a source of energy for pollinators [6,7,10]. The most common sugars found in nectar are sucrose, fructose, and glucose. Based on the ratio of glucose, fructose, and sucrose, nectar can be divided into four basic types: sucrose-dominant, sucrose-rich, hexose-rich, and hexose-dominant [7,31]. Based on our results, S. glutinosa has more sucrose than fructose and glucose, while S. pratensis has a higher percentage of hexoses, which means that it has more glucose and fructose. Previous research suggests that species from the Lamiaceae family are sucrose-dominant [29,32]. Based on our results, we can confirm that this holds true for S. glutinosa but not for S. pratensis. Kradolfer in Erhardt [32], who researched nectar only in S. pratensis, also claimed that it is sucrose dominant. The reason for the deviations in the results for S. pratensis could be that sucrose decomposes into glucose and fructose because of the presence of enzymes like invertase, which catalyzes the hydrolysis of sucrose into its constituent sugars, glucose, and fructose [7,34]. Another reason could be the presence of microbes. In addition to environmental factors, the microbes transferred from flower to flower by pollinators can also affect the nectar composition. Yeasts increase the total sugar concentration and the percentage of fructose, while the percentage of sucrose is decreased [14,27,50].
Besides sucrose being the predominant sugar in the nectar of S. glutinosa [29,32], research [29] has also revealed that sucrose is generally the predominant sugar in Salvia spp. in the Mediterranean basin, known for its hot climate; the sucrose level possibly correlates with higher overall UVB levels during the flowering period of this species. Our research data indicate a tight correlation between UVB radiation and sucrose levels for both S. pratensis and S. glutinosa. Other factors, like soil humidity, also affect sucrose levels, but the latter are most likely the result of overall higher nectar production rates under these conditions. Fructose levels, on the contrary, are negatively correlated with air and soil temperatures. There is, however, another possible indirect positive correlation between sucrose levels and UVB radiation; during nectar field sampling under higher UVB levels, there is inevitably less of a presence of microbiota on plant surfaces. Therefore, there is also a lower presence of hydrolytic enzymes for the breakdown of sucrose into its components [7,34].
Bees need nectar to provide energy for foraging [51]. Honey bees, as the main Salvia pollinators, are most active in warmer conditions and at lower humidity [52,53]. They are also more active earlier in the day and less so in the evening [52]. Our results show that Salvia species have the highest nectar production at warmer temperatures and earlier in the day, which can be connected with the coevolution of plants (our research object—Salvia) and bees. On the other hand, bees do not like higher humidity [53], although our research showed that the nectar quantity also increased at higher air and soil humidity. The nectar concentration can also affect pollinator visits. More dilute nectar is more attractive to honey bees [54]. Other researchers [55,56] discovered that bees prefer high-sucrose nectars. Our results show that S. glutinosa nectar is sucrose-dominant, but we cannot confirm that S. pratensis nectar is the same.

5. Conclusions

As nectar represents the main food source for pollinators, it is important to expand our knowledge about nectar production and its quality in the field. It is established that abiotic factors such as soil temperature and humidity and air temperature and humidity have an effect on nectar production. For UVB radiation, it is still not known whether there is any effect. The effect of these factors differs from one species to another, which we can also confirm for our investigated species S. pratensis and S. glutinosa. The soil temperature and humidity influenced S. pratensis nectar production, while the air humidity and temperature and soil temperature had an effect on S. glutinosa nectar. Based on our results, UVB radiation did not seem to have any effect on nectar productivity. Sugar, as the main substance in nectar, is a source of energy for pollinators. The main sugar in the nectar of S. glutinosa is sucrose, while the main sugars of S. pratensis are hexoses—glucose and fructose. Even though UVB radiation did not seem to influence nectar productivity, it had a noteworthy effect on the sucrose concentration.
In the context of climate change, research on nectar production in selected plant species can contribute to a better understanding and projections for the future in terms of the food safety of pollinating insects and, therefore, the safety of the human food chain.

Author Contributions

Methodology, K.M. and M.K.; formal analysis, K.M. and B.R.; data curation, K.M.; writing—original draft preparation, K.M.; writing—review and editing, B.R., J.B. and M.K. All authors have read and agreed to the published version of the manuscript.

Funding

This research received no external funding.

Data Availability Statement

The original data presented in the study are openly available in the repository of University Botanic Gardens Ljubljana, Biotechnical faculty.

Conflicts of Interest

The authors declare no conflicts of interest.

References

  1. Buchmann, S.L.; Naphan, G.P. The Forgotten Pollinators; Island Press: Washington, DC, USA, 1997; 292p. [Google Scholar]
  2. Saunders, M.E. Insect pollinators collect pollen from wind-pollinated plants: Implications for pollination ecology and sustainable agriculture. Insect Conserv. Divers. 2017, 11, 13–31. [Google Scholar] [CrossRef]
  3. Knuth, P. Handbook of Flower Pollination Based upon Herman’s Muller Work, the Fertilisation of Flowers by Insects; The Clarendon Press: Oxford, UK, 1906; 383p. [Google Scholar]
  4. Nepi, M.; Grasso, D.A.; Mancuso, S. Nectar in plant–insect mutualistic relationships: From food reward to partner manipulation. Front. Plant Sci. 2018, 9, 10–63. [Google Scholar] [CrossRef] [PubMed]
  5. Kulloli, S.K.; Chandore, A.; Aitawade, M.M. Nectar dynamics and pollination studies in three species of Lamiaceae. Curr. Sci. 2011, 100, 509–516. [Google Scholar]
  6. Roy, R.; Schmitt, A.J.; Thomas, J.B.; Carter, C.J. Rewiew: Nectar biology: From molecules to ecosystems. Plant Sci. 2017, 262, 148–164. [Google Scholar] [CrossRef] [PubMed]
  7. Nicolson, S.W.; Thornburg, R.W. Nectar chemistry. In Nectaries and Nectar; Nicolson, S., Nepi, M., Pacini, E., Eds.; Springer: New York, NY, USA, 2007; pp. 215–263. [Google Scholar]
  8. Ballantyne, G.; Wilmer, P. Nectar theft and floral ant-repellence: A link between nectar volume and ant-repellent traits? PLoS ONE 2012, 7, e43869. [Google Scholar] [CrossRef] [PubMed]
  9. Pacini, E.; Nicolson, S.W. Introduction. In Nectaries and Nectar; Nicolson, S., Nepi, M., Pacini, E., Eds.; Springer: New York, NY, USA, 2007. [Google Scholar]
  10. Baker, G.; Baker, I. Amino-acids in nectar and their evolutionary significance. Nature 1973, 241, 543–545. [Google Scholar] [CrossRef]
  11. Nepi, M. Nectary structure and ultrastructure. In Nectaries and Nectar; Nicolson, S., Nepi, M., Pacini, E., Eds.; Springer: New York, NY, USA, 2007. [Google Scholar]
  12. Nikolić, T. Morfologija biljaka—Razvoj, građa i uloga biljnih tkiva, organa i organskih sustava; Alfa d.d.: Zagreb, Croatia, 2017. [Google Scholar]
  13. Pacini, E.; Nepi, M.; Vesprini, J.L. Nectar biodiversity: A short review. Plant Syst. Evol. 2003, 238, 7–21. [Google Scholar] [CrossRef]
  14. Pozo, M.I.; Lievens, B.; Jacquemyn, H. Impact of microorganisms on nectar chemistry, pollinator attraction and plant fitness. In Nectar: Production, Chemical Composition and Benefits to Animals and Plants; Peck, R.L., Ed.; Nova Science Publishers Inc.: New York, NY, USA, 2015; pp. 1–45. [Google Scholar]
  15. Irwin, R.E.; Cook, D.; Richardson, L.L.; Manson, J.S.; Gardner, D.R. Secondary compounds in floral rewards of toxic rangeland plants: Impacts on pollinators. J. Agric. Food Chem. 2014, 62, 7335–7344. [Google Scholar] [CrossRef] [PubMed]
  16. Hagler, J.R.; Buchmann, S.L. Honeybee (Hymenoptera: Apidae) foraging responses to phenolic-rich nectars. J. Kans. Entomol. Soc. 1993, 66, 223–230. [Google Scholar]
  17. Palmer-Young, E.C.; Farrell, I.W.; Adler, L.S.; Milano, N.J.; Egan, P.A.; Junker, R.R.; Irwin, R.E.; Stevenson, P.C. Chemistry of floral rewards: Intra- and interspecific variability of nectar and pollen secondary metabolites across taxa. Ecol. Monogr. 2019, 89, e01335. [Google Scholar] [CrossRef]
  18. Chalcoff, V.R.; Aizen, M.A.; Galetto, L. Nectar concentration and composition of 26 species from the temperate forest of South America. Ann. Bot. 2006, 97, 413–421. [Google Scholar] [CrossRef] [PubMed]
  19. Lanza, J.; Smith, G.C.; Sack, S.; Cash, A. Variation in nectar volume and composition of Impatiens capensis at the individual, plant, and population levels. Oecologia 1995, 102, 113–119. [Google Scholar] [CrossRef] [PubMed]
  20. Leiss, K.A.; Klinkhamer, P.G.L. Genotype by environment interactions in the nectar production of Echium vulgare. Funct. Ecol. 2005, 19, 454–459. [Google Scholar] [CrossRef]
  21. Pacini, E.; Nepi, M. Nectar production and presentation. In Nectaries and Nectar; Nicolson, S., Nepi, M., Pacini, E., Eds.; Springer: New York, NY, USA, 2007. [Google Scholar]
  22. Corbet, S.A. Nectar sugar content: Estimating standing crop and secretion rate in the field. Apidologie 2003, 34, 1–10. [Google Scholar] [CrossRef]
  23. Morrant, D.S.; Schumann, R.; Petit, S. Field methods for sampling and storing nectar from flowers with low nectar volumes. Ann. Bot. 2008, 103, 533–542. [Google Scholar] [CrossRef] [PubMed]
  24. Mačukanović Jocić, M.; Duletić-Laušević, S.; Jocic, G. Nectar production in three melliferous species of Lamiaceae in natural and experimental conditions. Acta Vet. 2004, 54, 475–487. [Google Scholar]
  25. Cardoza, Y.J.; Harris, G.K.; Grozinger, C.M. Effects of soil quality enhancement on pollinator-plant interactions. Psyche J. Entomol. 2012, 2012, 581458. [Google Scholar] [CrossRef]
  26. Corbet, S.A. Pollination and the weather. Isr. J. Bot. 1990, 39, 13–30. [Google Scholar]
  27. Corbet, S.A.; Willmer, P.G.; Beament, J.W.L.; Unwin, D.M.; Prys-Jones, O.E. Post-secretory determinants of sugar concentration in nectar. Plant Cell Environ. 1979, 2, 293–308. [Google Scholar] [CrossRef]
  28. Mačukanović-Jocić, M.; Djurdjević, L. Influence of microclimatic conditions on nectar exudation in Glechoma hirsuta. Arch. Biol. Sci. 2005, 57, 119–126. [Google Scholar] [CrossRef]
  29. Petanidou, T. Sugars in Mediterranean Floral Nectars: An Ecological and Evolutionary Approach. J. Chem. Ecol. 2005, 31, 1065–1087. [Google Scholar] [CrossRef]
  30. Búrquez, A.; Corbet, S.A. Do flowers reabsorb nectar? Funct. Ecol. 1991, 5, 369–379. [Google Scholar] [CrossRef]
  31. Búrquez, A.; Corbet, S.A. Dynamics of production and exploitation of nectar: Lessons from Impatiens glandulifera Royle. In Nectary Biology; Bahadur, B., Ed.; Dattsons: Nagpur, India, 1998; pp. 130–152. [Google Scholar]
  32. Kradolfer, U.; Erhardt, A. Nectar secretion patterns in Salvia pratensis L. (Lamiaceae). Flora 1995, 190, 229–235. [Google Scholar] [CrossRef]
  33. Sampson, B.J.; Cane, J.H. Impact of enhanced ultraviolet-B radiation on flower, pollen, and nectar production. Am. J. Bot. 1999, 86, 108–114. [Google Scholar] [CrossRef]
  34. Bertazzini, M.; Forlani, G. Intraspecific variability of floral nectar volume and composition in rapeseed (Brassica napus L. var. oleifera). Front. Plant Sci. 2016, 7, 288. [Google Scholar] [CrossRef]
  35. Kostryco, M.; Chwil, M. Nectar abundance and nectar composition in selected Rubus idaeus L. varieties. Agriculture 2022, 12, 1132. [Google Scholar] [CrossRef]
  36. Percival, M.S. Types of nectar in angiosperms. New Phytol. 1961, 60, 235–281. [Google Scholar] [CrossRef]
  37. Schondube, J.E.; Martınez del Rio, C. Concentration-dependent sugar preferences in nectar-feeding birds: Mechanisms and consequences. Funct. Ecol. 2003, 17, 445–453. [Google Scholar] [CrossRef]
  38. Scheiner, R.; Page, R.E.; Erber, J. Sucrose responsiveness and behavioral plasticity in honey bees (Apis mellifera). Apidologie 2004, 35, 133–142. [Google Scholar] [CrossRef]
  39. Kim, W.; Gilet, T.; Bush, J.W.M. Optimal concentrations in nectar feeding. Proc. Natl. Acad. Sci. USA 2011, 108, 16618–16621. [Google Scholar] [CrossRef]
  40. Ravnjak, B.; Bavcon, J.; Božič, J. Avtohtone Medovite Rastline; Botanični vrt Univerze v Ljubljani, Oddelek za biologijo, Biotehniška fakulteta = University Botanic Gardens Ljubljana, Department of Biology, Biotechnical Faculty: Ljubljana, Slovenia, 2020; 285p. [Google Scholar]
  41. Weryszko-Chmielweska, E. Ecological features of flowers including nectary structure of chosen species from Lamiaceae family. Fitoterapia 2000, 69, 191–192. [Google Scholar]
  42. Celep, F.; Atalay, Z.; Dikmen, F.; Doǧan, M.; Sytsma, K.J.; Claßen-Bockhoff, R. Pollination Ecology, Specialization, and Genetic Isolation in Sympatric Bee-Pollinated Salvia (Lamiaceae). Int. J. Plant Species 2020, 181, 800–811. [Google Scholar] [CrossRef]
  43. Drew, B. Evolution, Pollination Biology, and Species Richness of Salvia (Lamiaceae). Int. J. Plant Sci. 2020, 181, 767–769. [Google Scholar] [CrossRef]
  44. Martinčič, A.; Wraber, T.; Jogan, N.; Podobnik, A.; Turk, B.; Vreš, B.; Ravnik, V.; Frajman, B.; Strgulc Krajšek, S.; Trčak, B.; et al. Mala flora Slovenije: Ključ za določanje praprotnic in semenk; Tehniška založba Slovenije: Ljubljana, Slovenia, 2007; 967p. [Google Scholar]
  45. Bavcon, J.; Ravnjak, B. Travniška kadulja (Salvia pratensis L.) v Sloveniji; Biotehniška fakulteta: Ljubljana, Slovenia, 2014. [Google Scholar]
  46. Reith, M.; Baumann, G.; Claßen-Bockoff, R.; Speck, T. New Insights into the Functional Morphology of the Lever Mechanism of Salvia pratensis (Lamiaceae). Ann. Bot. 2007, 100, 393–400. [Google Scholar] [CrossRef]
  47. Petanidou, T.; Goethals, V.; Smets, E. Nectary structure of Labiatae in relation to their nectar secretion and characteristics in a Mediterranean shrub community: Does flowering time matter? Plant Syst. Evol. 2000, 225, 103–118. [Google Scholar] [CrossRef]
  48. ARSO [Agencija Republike Slovenije za Okolje]. Available online: https://www.arso.gov.si/ (accessed on 15 February 2024).
  49. McKenna, M.A.; Thomson, J.D. A technique for sampling and measuring small amounts of floral nectar. Ecology 1988, 69, 1306–1307. [Google Scholar] [CrossRef]
  50. Herrera, C.M.; Garcia, I.M.; Perez, R. Invisible floral larcenies: Microbial communities degrade floral nectar of bumble bee-pollinated plants. Ecology 2008, 89, 2369–2376. [Google Scholar] [CrossRef] [PubMed]
  51. Vaudo, A.D.; Tooker, J.F.; Grozinger, C.M.; Patch, H.M. Bee nutrition and floral resource restoration. Curr. Opin. Insect. Sci. 2015, 10, 133–141. [Google Scholar] [CrossRef]
  52. Karbassioon, A.; Stanley, D.A. Exploring relationships between time of day and pollinator activity in the context of pesticide use. Basic Appl. Ecol. 2023, 72, 74–81. [Google Scholar] [CrossRef]
  53. Karbassioon, A.; Yearlsey, J.; Dirilgen, T.; Hodge, S.; Stout, J.C.; Stanley, D.A. Responses in honeybee and bumblebee activity to changes in weather conditions. Oecologia 2023, 201, 689–701. [Google Scholar] [CrossRef] [PubMed]
  54. Willmer, P. Pollination and Floral Ecology; Princeton University Press: Princeton, NJ, USA, 2011. [Google Scholar]
  55. Baker, H.G.; Baker, I. Floral nectar sugar constituents in relation to pollinator type. In Handbook of Experimental Pollination Ecology; Jones, C.E., Little, R.J., Van Nostrand, R., Eds.; Scientific and Academic Editions: Rosemead, CA, USA, 1983; pp. 117–141. [Google Scholar]
  56. Petanidou, T. Ecological and evolutionary aspects of oral nectars in Mediterranean habitats. In Nectaries and Nectar; Nicolson, S.W., Nepi, M., Pacini, E., Eds.; Springer: Dordrecht, The Netherlands, 2007; pp. 343–377. [Google Scholar]
Figure 1. Nectar production throughout each day in one flower of S. glutinosa. The sign * means columns that are statistically different from other columns.
Agriculture 14 00668 g001
Figure 2. Nectar production throughout each day in one flower of S. pratensis. The sign * means columns that are statistically different from other columns.
Agriculture 14 00668 g002
Figure 3. Average nectar production of S. glutinosa flowers at 9:00, 12:00, and 15:00.
Agriculture 14 00668 g003
Figure 4. Average nectar production of S. pratensis flowers at 9:00, 12:00, and 15:00.
Agriculture 14 00668 g004
Figure 5. Relationship between nectar production (µL) in S. glutinosa and air temperature (°C).
Agriculture 14 00668 g005
Figure 6. Relationship between nectar production (µL) in S. glutinosa and soil temperature (°C).
Agriculture 14 00668 g006
Figure 7. Relationship between nectar production (µL) in S. glutinosa and air humidity (g/m3).
Agriculture 14 00668 g007
Figure 8. Relationship between nectar production (µL) in S. pratensis and soil temperature (°C).
Agriculture 14 00668 g008
Figure 9. Relationship between nectar production (µL) in S. pratensis and soil humidity (%).
Agriculture 14 00668 g009
Figure 10. Ratio of sucrose, glucose, and fructose in nectar samples from S. glutinosa, where can be seen that the ratio of glucose is zero.
Agriculture 14 00668 g010
Figure 11. Ratio of sucrose, glucose, and fructose in nectar samples from S. pratensis, where can be seen that the ratio of glucose is zero.
Agriculture 14 00668 g011
Figure 12. Relationship between sucrose (mg/mL) in nectar from S. pratensis and UVB radiation (µW/cm2).
Agriculture 14 00668 g012
Figure 13. Relationship between sucrose (mg/mL) in nectar from S. pratensis and air temperature (°C).
Agriculture 14 00668 g013
Figure 14. Relationship between sucrose (mg/mL) in nectar from S. glutinosa and UVB radiation (µW/cm2).
Agriculture 14 00668 g014
Figure 15. Relationship between sucrose (mg/mL) in nectar from S. glutinosa and soil humidity (%).
Agriculture 14 00668 g015
Figure 16. Relationship between fructose (mg/mL) in nectar from S. glutinosa and air temperature (°C).
Agriculture 14 00668 g016
Figure 17. Relationship between fructose (mg/mL) in nectar from S. glutinosa and soil temperature (°C).
Agriculture 14 00668 g017
Table 1. Spearman’s coefficients for the influence of abiotic factors on nectar production in S. glutinosa and S. pratensis. Sign x means there is no correlation.
UVB (µW/cm2)Air T (°C)Soil T (°C)Air AH (g/m3) Soil RH (%)
S. glutinosax−0.53−0.51−0.37x
S. pratensisxx−0.34x0.41
Table 2. Spearman’s coefficients for the influence of abiotic factors on the three main sugars in nectar from S. pratensis. Sign x means there is no correlation.
UVB (µW/cm2)Air T (°C)Soil T (°C)Air AH (g/m3)Soil RH (%)
sucrose0.350.31xxx
fructosexxxxx
glucose xxxxx
Table 3. Spearman’s coefficients for the influence of abiotic factors on the three main sugars in nectar from S. glutinosa. Sign x means there is no correlation.
UVB (µW/cm2)Air T (°C)Soil T (°C)Air AH (g/m3)Soil RH (%)
sucrose0.36xxx0.53
fructosex−0.36−0.30xx
glucosexxxxx
Disclaimer/Publisher’s Note: The statements, opinions and data contained in all publications are solely those of the individual author(s) and contributor(s) and not of MDPI and/or the editor(s). MDPI and/or the editor(s) disclaim responsibility for any injury to people or property resulting from any ideas, methods, instructions or products referred to in the content.

