Article

Combined Transcriptome and Proteome Analysis Reveals the Molecular Mechanism by Which ZmPDI Improves Salt Resistance in Rice (Oryza sativa)

1
The National Forestry and Grassland Administration Engineering Research Center for Germplasm Innovation and Utilization of Warm-Season Turfgrasses, Jiangsu Key Laboratory for the Research and Utilization of Plant Resources, Institute of Botany, Jiangsu Province and Chinese Academy of Sciences (Nanjing Botanical Garden Mem. Sun Yat-Sen), Nanjing 210014, China
2
Jiangsu Coastal Area Institute of Agricultural Sciences, Yancheng 224000, China
3
College of Animal Science and Technology, Yangzhou University, Yangzhou 225009, China
*
Author to whom correspondence should be addressed.
Agriculture 2024, 14(4), 615; https://doi.org/10.3390/agriculture14040615
Submission received: 6 March 2024 / Revised: 11 April 2024 / Accepted: 12 April 2024 / Published: 15 April 2024
(This article belongs to the Special Issue Gene Expression and Molecular Effects in Plants under Abiotic Stress)

Abstract

:
As one of the most salt-tolerant grasses, characterizing salt-tolerance genes of Zoysia matrella [L.] Merr. not only broaden the theoretical information of salt tolerance, but also provide new salt-resistant genetic resources for crop breeding. The salt-inducible protein disulfide isomerase (ZmPDI) of Zoysia matrella [L.] Merr. was proved to enhance salt tolerance in homologous overexpression transgenic plants. In order to evaluate its potential application in crops, we conducted the salt tolerance evaluation in heterologous overexpression transgenic rice (OX-ZmPDI), Wild-type (WT) rice, and LOC_Os11g09280 (OsPDI, homologous gene of ZmPDI in rice) knock-out rice generated by CRISPR-Cas9 system (CR-OsPDI). Our findings revealed that OX-ZmPDI rice was higher and exhibited longer main root length, more proline (Pro) and malondialdehyde (MDA), and higher peroxidase (POD) activity than WT control after salt treatment, while CR-OsPDI resulted in contrary phenotypes. These results indicated that ZmPDI can significantly enhance the salt tolerance in rice, whereas loss-of-function of OsPDI reduces the salt tolerance. To further investigate these differences at the molecular level, we collected roots from OX-ZmPDI transgenic, CR-OsPDI transgenic, and wild-type (WT) plants at 0 and 24 h after salt treatment for RNA-seq and data-independent acquisition (DIA) proteome sequencing. Combined analysis of the transcriptome and proteome revealed that ZmPDI has the potential to enhance the salt tolerance of rice by modulating the expression of laccase-6, zingipain-2, WIP3, FKBP65, AKR4C10, GBSSII, Pho1, and TRXf1. Those results provided new information for the molecular regulation mechanism by which ZmPDI improves salt tolerance, and prove the potential of ZmPDI for application in crop breeding.

1. Introduction

Salinization of soil is a global environmental stress that affects approximately 800 million hectares of land, limiting plant growth, crop quantality and quality, as well as hindering the sustainable development of local economics [1]. Salt stress disrupts various physiological processes in plants including osmotic and ionic equilibrium, protein synthesis, photosynthesis, energy and lipid metabolism, all of which result in plant growth limitation, leaf senescence, yield decrease, and even plant mortality [2]. Salt stress tolerance is a complicated process with multiple genes and pathways involved, such as hormonal regulation, signal transduction, photosynthesis pathway, and osmoregulation [1]. Therefore, it is crucial to identify genes that enhance salt tolerance and elucidate the underlying mechanisms.
Grass plays a pivotal role in landscaping, serving as a crucial measure against soil erosion and also providing recreational spaces for leisure and relaxation. Furthermore, certain grass species exhibit remarkable resilience to various abiotic and biotic stresses when compared to numerous crops [3]. Zoysia matrella [L.] Merr. is widely acknowledged as one of the most salt-tolerant grasses [4,5]. The study of the salt-tolerance mechanism and discovery and functional analysis of important salt-tolerance genes in Zoysia matrella [L.] Merr., can provide theoretical information for the understanding of salt resistance, and offer new salt-resistant genetic resources for crop breeding.
Several pieces of research about the salt tolerance of Zoysia species have been conducted. Du et al. cloned a ZjNHX1 from Zoysia japonica L, which acts as a vacuolar Na+/H+ antiporter and plays a crucial role in salt tolerance and ion balance in Zoysia japonica [6]. ZjZFN1, found in Zoysia japonica, was observed to be induced by salt, cold, or ABA treatment. It is assumed that ZjZFN1 may affect the accumulation of reactive oxygen species (ROS) and regulate the transcription of genes related to salinity response [7]. Teng et al. [8], demonstrated that ZjGRP (Glycine-rich RNA-binding proteins) in Zoysia japonica was strongly activated by the treatment of NaCl, ABA, MeJA, and SA. Overexpression of ZjGRP in Arabidopsis resulted in reduced germination rate and seedling growth as well as decreased salinity tolerance. Overexpression of ZjGRP also led to lower expression levels of superoxide dismutase (SOD), and peroxidases (POD) under salinity stress compared to control plants. In an effort to enhance the breeding efficiency for salt-tolerant Zoysiagrass (Zoysia japonica), Guo et al. [9] using the 120 F1 progenies from Z105 (salt tolerant) and Z061 (salt sensitive), constructed a genetic linkage map and identified two quantitative trait loci associated with salt-tolerance. By utilizing a full-length cDNA expression library in yeast cells, Chen et al. [10] identified 16 potential genes involved in Zoysia matrella salt-tolerance mechanisms, involving ion regulation, osmotic adjustment, protein folding/modification, RNA metabolism, and mitochondrial membrane translocase pathways. With the advancement of next-generation sequencing, some researchers have attempted to explore the complete mechanism of salt tolerance by transcriptome, proteome, and metabolome. Xie et al. [11], were the first to report the transcriptome data of Zoysia grass under NaCl-treatment and control. Their finding indicated that various families of transcription factors such as AP2/ERF, MYB, WRKY, NAC, bHLH, and bZIP participate in regulating salt tolerance during the early stage. Genes that were related to ABA, JA, SA, calcium Ion (Ca2+) signaling, and ROS scavenging were also discovered. Similarly, Wang et al. [12], conducted a comparative analysis of the transcriptomes from different time points (0 h, 1 h, 24 h, and 72 h) and different tissues (leaves and roots) under salt treatment between Zoysia japonica Steud. Z004 (salt sensitive) and Z011 (salt tolerant). GO and KEGG analyses revealed that key differentially expressed genes (DEGs) involved in responding to salts stress belonged to auxin and ABA signal transduction pathways as well as WRKY and bHLH transcription factor families and the DUF family. However, the precise mechanism of some salt-tolerant genes in Zoysia species is limited [12].
Protein disulfide isomerase (PDI) belongs to the thioredoxin superfamily of redox proteins. PDI exhibits three catalytic activities, including thiol-disulfide oxireductase, disulfide isomerase, and redox-dependent chaperone activities. It plays diverse roles in various processes by facilitating disulfide formation (oxidation), breakage (reduction), and rearrangement (isomerization) [13,14]. The understanding of PDI’s function in plants is relatively limited compared to mammalian PDIs. AtPDI8 in Arabidopsis has been identified as a transmembrane protein located in the endoplasmic reticulum with thiol-disulfide oxidase activity. It contributes to the production of disulfide bonds through cysteine oxidation [15]. Arabidopsis AtPDI1 participates in the response to abiotic stresses by engaging in thiol-disulfide exchange reactions. Abiotic stresses and exogenous abscisic acid strongly induce AtPDI1 expression. Compared with WT, overexpression of AtPDI1 enhances seedlings’ tolerance to abiotic stresses, while knockdown mutant (pdi1) displays increased sensitivity to abiotic stresses [16,17]. Arabidopsis AtPDI11 was demonstrated to possess oxidoreductase activity in vitro [18]. Arabidopsis overexpressing AtCYO1 exhibits delayed dark-induced senescence [19]. 32 PDI genes were identified in Chinese cabbage (Brassica rapa ssp. pekinensis), among which, 24 BrPDI genes were up-regulated under salt and drought stress conditions, while 14 BrPDIs were up-regulated by biotic stress. Additionally, cold stress induces 10 BrPDIs and ABA stress triggers 9 BrPDIs [20].
In previous research, the PDI of Zoysia matrella [L.] Merr., which encodes a protein-disulfide isomerase, was identified via yeast cDNA library screening and was significantly up-regulated by salt stress [10]. Homologous overexpression of ZmPDI has been found to enhance resistance against salinity stress in Zoysia matrella [L.] Merr. [21]. To gain deeper insights into the role played by ZmPDI in crops, we conducted an assessment of the salinity tolerance levels of ZmPDI-overexpressing, WT, and OsPDI knockout (CR-OsPDI) rice. To further understand the molecular mechanism by which ZmPDI improves salt tolerance in rice, we analyzed gene ontology (GO) and Kyoto Encyclopedia of Genes and Genomes (KEGG) pathways of differentially expressed genes (DEGs) and differentially expressed proteins (DEPs) before and after salt treatment, and identified several potential target genes of ZmPDI by combined analysis of transcriptome and proteome.

2. Materials and Methods

2.1. ZmPDI Genetic Heterologous Transformation

The overexpression vector pCambia1305.2-ZmPDI containing the resistance gene Hyg was obtained from Wang et al. [22]. The gRNA target sequence (TCAGGAATACAAGGGCCCG) of the homologous gene OsPDI (LOC_Os11g09280) in rice was synthesized in oligodimers and subsequently inserted into the pYLCRISPR/Cas9-MH vector. The pCambia1305.2-ZmPDI and pYLCRISPR/Cas9-MH-LOC_Os11g09280 were transformed into rice “Nipponbare” via the agrobacterium-mediated method by BIOGLE GeneTech (Hangzhou Biogle Co., Ltd., Hangzhou, China). The overexpression transgenic plants were detected by primers Hyg-F/R (Supplementary Table S1), while the knock-out transgenic plants were detected by primers LOC_Os11g09280-F/R (Supplementary Table S1). The OsActin (GenBank: XM_015774830.2) was used as a housekeeping gene.

2.2. Salt Treatment and Physiological Index Measurement

The transgenic plants of the third generation were selected by geminating seeds in water containing 100 mg/L hygromycin at 30 °C for 3 days. After that, the successful geminating seeds with hygromycin resistance were transplanted into a greenhouse with natural conditions in August in Nanjing. Three OX-ZmPDI transgenic lines (OX1, 3, and 7), 3 OsPDI knock-out transgenic lines (CR2, 3, and 8), and wild-type plants were cultured in a tray (height 4.7 cm, length 4.8 cm, and width 4.8 cm, ×50) filled with cultural substrate. After growing for 10 days, plants were treated with 100 mM NaCl for 2 days, followed by 150 mM NaCl for 2 days. Afterward, plants were treated with 200 mM NaCl for 15 days. The material was treated with 1 L water with 200 mM NaCl per tray every 3 days. The controls were irrigated at the same time with 1 L of water. Three biological replicates with at least five individual plants of each line were performed. The transgenic plants were collected, observed, and measured before and after salt treatment, respectively. The data of each line were analyzed by a One Way ANOVA.
After salt treatments, we collected the plants and subsequently rinsed their roots three times using ddH2O. The plant heights and root lengths were measured. The total contents of MDA and POD activity were measured and calculated using Micro Malondialdehyde (MDA) Assay Kit (BC0025, Beijing Solarbio Science & Technology Co., Ltd., Beijing, China) and Micro Peroxidase (POD) Assay Kit (BC0095, Beijing Solarbio Science & Technology Co., Ltd., Beijing, China) according to the manufacturer’s instructions. Three biological replicates were tested, and data was subjected to statistical analysis using SPSS statistical software 18.0 (t-test) (SPSS Inc., Chicago, IL, USA). The data of each line were analyzed by a One Way ANOVA.

2.3. RNA-Seq

The roots of OX-ZmPDI transgenic Line 1, knockout CR-OsPDI transgenic Line 8, and wild-type (WT) plants were collected at 0 and 24 h after salt treatment. Each sample at those time points contained three biological replicates and each biological replicate was collected from more than three individual plants. All samples were flash-frozen in liquid nitrogen and stored at −80 °C. A total of 18 RNA samples were extracted to generate 18 cDNA libraries, which were subsequently sequenced on an Illumina HiSeq 2500 platform by Novogene (Novogene Co., Ltd., Tianjin, China). The raw datasets can be accessed in the NCBI repository https://submit.ncbi.nlm.nih.gov/subs/sra/SUB14286942/ (accessed on 4 March 2024). Clean reads were obtained by removing adaptor sequences, ambiguous ‘N’ bases, low-quality reads with padj < 10, and fragments shorter than 20 bp. The transcriptome of OX-ZmPDI transgenic plants, OsPDI knock-out transgenic plants, and wild-type plants were assembled via Hisat2 (v2.0.5) [23] with the Oryza. sativa genome as a reference (https://www.ncbi.nlm.nih.gov/genome/?term=IRGSP-1.0, accessed on 10 September 2019). FPKM (fragment per kilobase of transcript per million mapped reads) values [24] were calculated to assess the expression abundance of genes, and the identification of differentially expressed gene (DEG) was performed by DESeq2 software (1.16.1) [25]) and selected with a |log2(FoldChange)| > 1 and padj < 0.05.

2.4. Tandem Mass Tag-Based Protein Quantification

For tandem mass tag-based (TMT) proteomics analysis, root samples were obtained from the OX-ZmPDI transgenic Line 1, knockout CR-OsPDI transgenic Line 8, and wild-type (WT) plants at 0 and 24 h after salt treatment. Each sample was preserved in liquid, and then lysed by lysis buffer (100 mM NH4HCO3 (pH 8.0), 6 M Urea, 0.2% SDS) and cracked by ultrasonication for 5 min on ice. The lysate was centrifuged at 12,000× g for 15 min at 4 °C to collect the supernatant, and the supernatant was reduced with 10 mM dithiothreitol (DTT) for 1 h at 56 °C, and alkylated with 20 µL 0.5 M iodoacetamide for 1 h in the dark at room temperature. After that, each sample was mixed thoroughly with 4 times the volume of precooled acetone and incubated at −20 °C for at least 2 h. The precipitation of each sample was collected by centrifuging at 12,000× g for 15 min at 4 °C and washed twice with cold acetone, subsequently dissolved by dissolution buffer containing 0.1 M triethylammonium bicarbonate (TEAB, pH 8.5) and 6 M urea. The protein concentration of each sample was determined using a BCA protein assay kit (Beyotime Biotechnology, Shanghai, China), and a 2 μg protein sample from each sample was analyzed by 12% SDS-PAGE gel electrophoresis.
The protein samples were digested using trypsin with a trypsin-to-protein mass ratio of 1:50, and incubated overnight at 37 °C. Subsequently, the peptides were desalted using the Strata X C18 column (Phenomenex, Torrance, CA, USA), vacuum freeze-dried, and thoroughly dissolved with 0.5 M TEAB. The peptides were labeled using the TMT kit instructions (TMT 10 plex™ Isobaric Label Reagent Set, Thermo Fisher Scientific, Waltham, MA, USA). The tryptic peptides were fractionated into fractions using an EASY-nLC™ 1200 UHPLC system (Thermo Fisher Scientific, Waltham, MA, USA) with a C18 Nano-Trap column (2 cm × 75 μm, 3 μm) and separated in an analytical column (15 cm × 150 μm, 1.9 μm). The separated peptides were analyzed by Q Exactive HF-X mass spectrometer (Thermo Fisher, Waltham, MA, USA). Full scan ranges from m/z 350 to 1500 with a resolution of 60,000 (at m/z 200). The top 40 precursors of the highest abundant in the full scan were fragmented by higher energy collisional dissociation (HCD) and analyzed in MS/MS.
The resulting spectra from each fraction were searched separately against Oryza. sativa genome (https://www.ncbi.nlm.nih.gov/genome/?term=IRGSP-1.0, accessed on 10 September 2019) database by the search engines: Proteome Discoverer 2.2 (PD 2.2, Thermo). The identified protein was further filtered by retaining the Peptide Spectrum Matches with >99% credibility and proteins contain at least 1 unique peptide with FDR no higher than 1.0%. Reporter Quantification (TMT 10-plex) was used for TMT quantification. The protein quantitation results were statistically analyzed by the Mann-Whitney Test, to identify proteins that exhibited significant differences between salt-treated samples and control samples. Differentially expressed proteins (DEPs) were identified as those with p-value < 0.05 and |log2FC| ≥ 1.2.

2.5. Bioinformatics Analysis and qRT-PCR Validation

The functions of DEGs and DEPs were annotated in the GO (Gene Ontology), KEGG (Kyoto Encyclopedia of Genes and Genomes), and Clusters of Orthologous Groups of proteins (COG) databases. The significantly enriched GO functional categories and KEGG pathways of DEGs and DEPs were identified via clusterProfiler R package (3.3.4) [26] with padj < 0.05 and Interproscan 5 software (http://code.google.com/p/interproscan/, accessed on 10 September 2019) [27] with a p-value < 0.05, respectively.
Five DEGs were selected randomly to assess the reliability of transcriptomic data. The primers of these 5 genes were designed by Primer Premier 5.0 software and listed in Supplementary Table S1. The qRT-PCR validation was performed with three biological replicates per sample on the ABI 7300 system. The OsActin gene was used as an internal control [28]. The relative transcriptional levels were calculated using the 2−ΔΔCt method [11].

3. Results

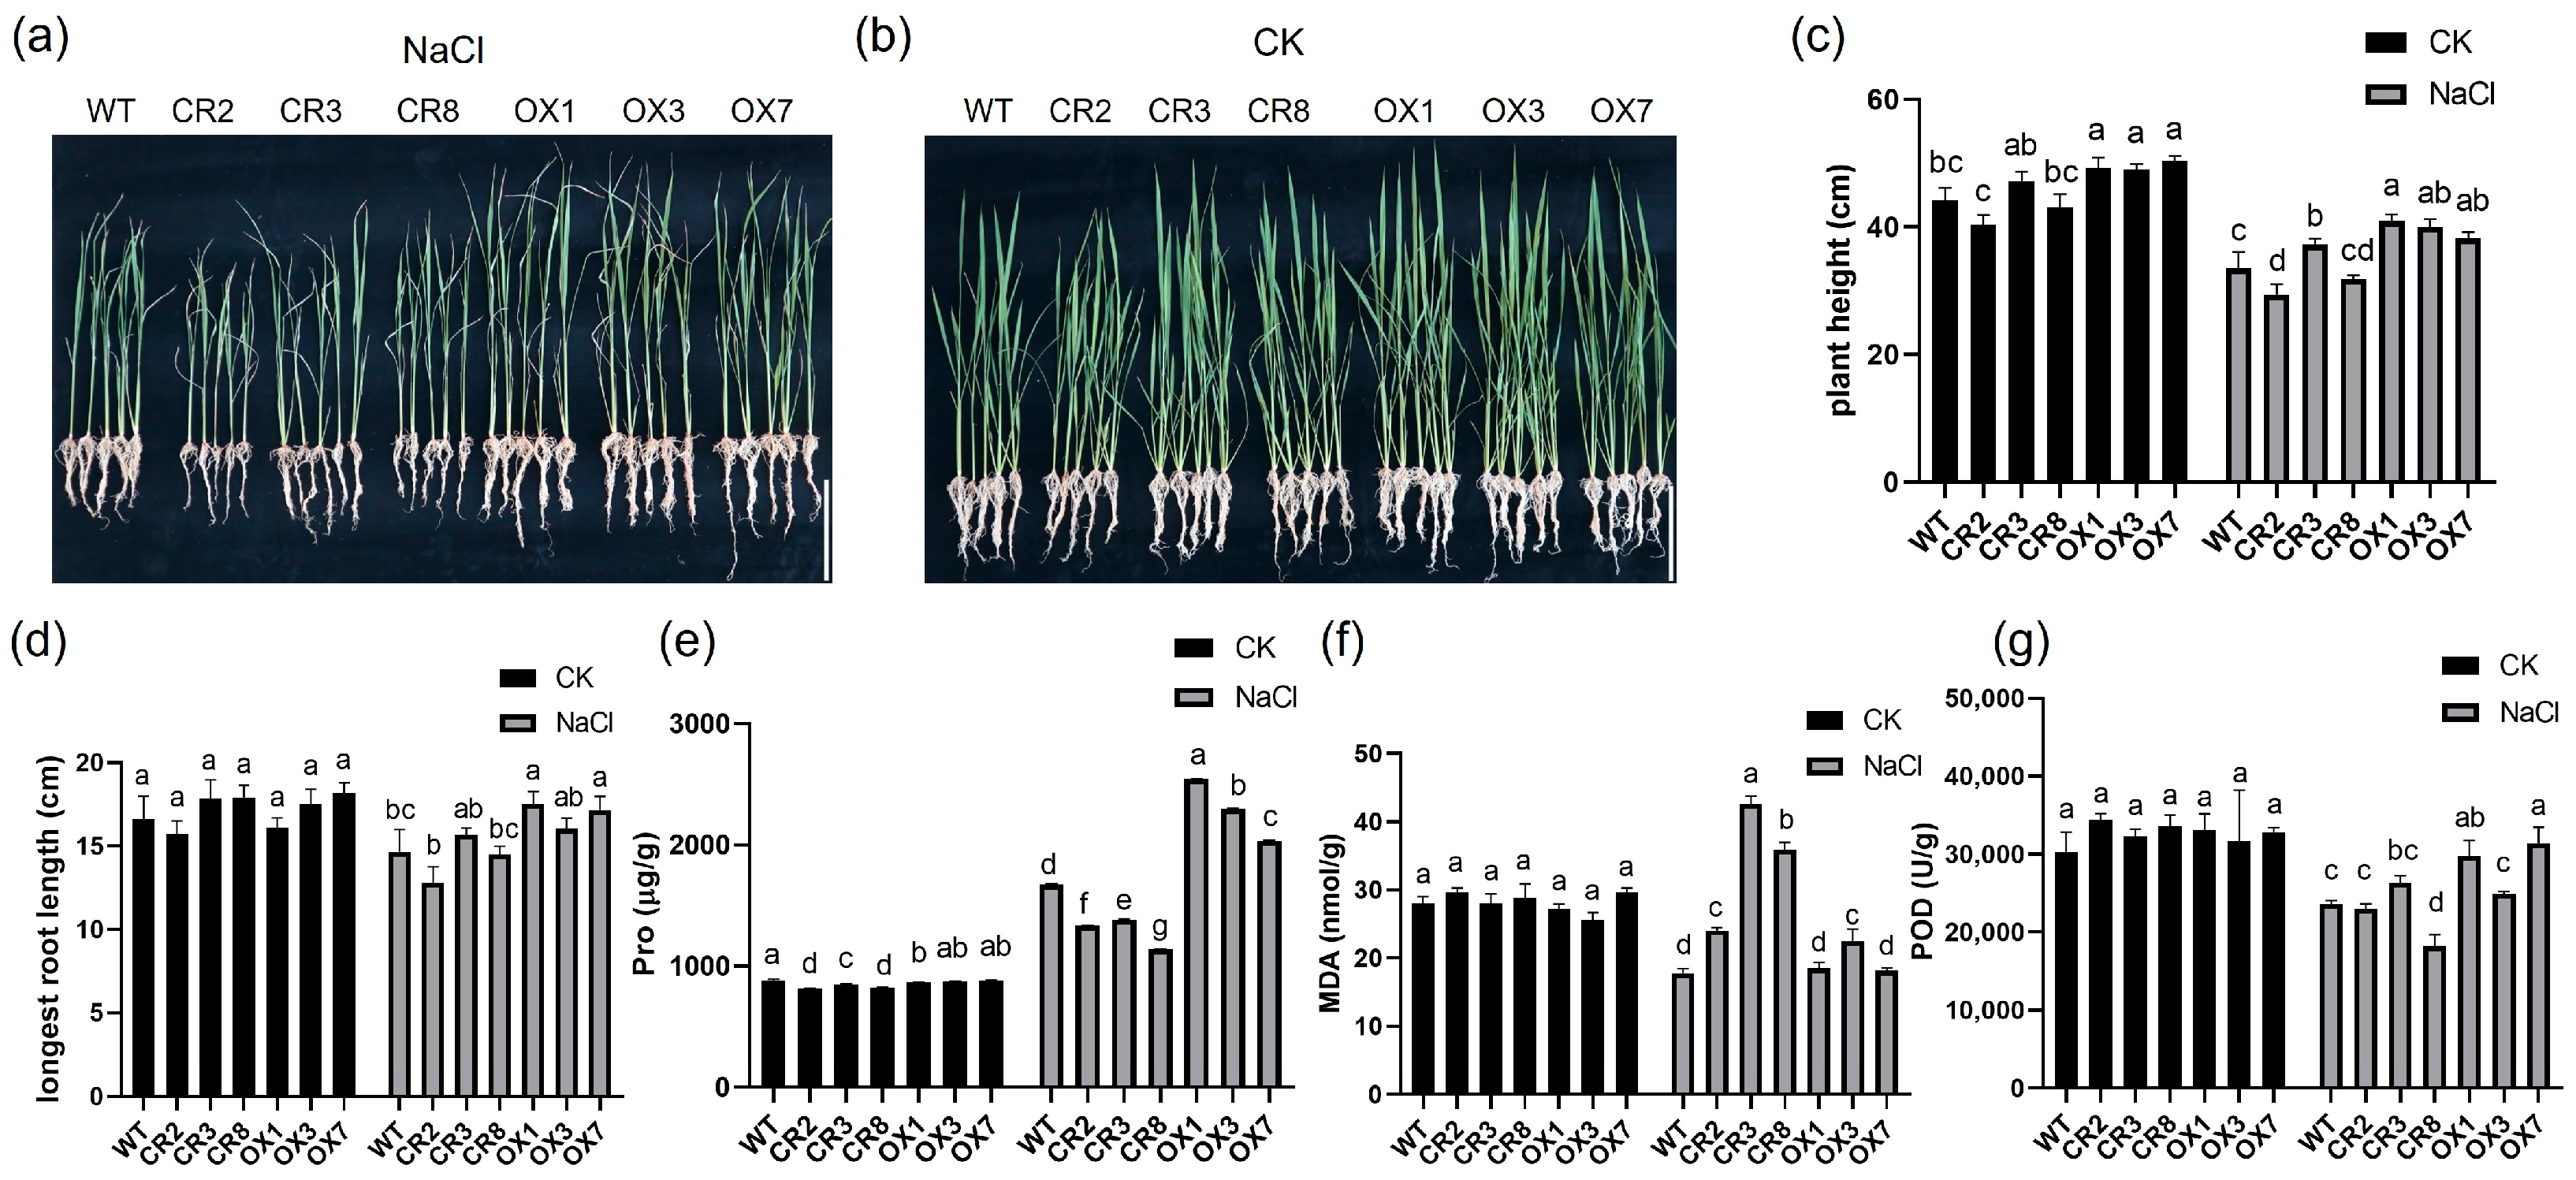
3.1. The Physiological Response of the Transgenic Plants and WT to Salt Stress

Several ZmPDI-overexpressing transgenic plant lines and OsPDI knock-out transgenic plant lines were obtained and determined by PCR to be positive for corresponding gene modification. Mutation of the target site in OsPDI knock-out transgenic plant lines were ascertained by sequencing (Supplementary Figure S1). Three overexpressing transgenic lines (OX-1, OX-3, and OX-7), three knock-out transgenic lines (CR2, CR3, and CR8), and wild type (WT) were selected to be used in the measurement of salt tolerance. After 200 mM NaCl treatment for 15 days, the leaf tips became dry and withered, and the situation of OsPDI knock-out transgenic plant lines were more severe than WT, whereas the situation of ZmPDI-overexpressing transgenic plant lines were less severe than WT. The OsPDI knock-out transgenic plant lines were lower than WT, whereas the ZmPDI-overexpressing transgenic plant lines were higher than WT. The main root length of WT was shorter than that of ZmPDI-overexpressing transgenic plant lines and longer than that of OsPDI knock-out transgenic plant lines. Under the control condition, the differences between OsPDI knock-out transgenic plant lines, ZmPDI-overexpressing transgenic plant lines and WT were not distinguished (Figure 1a–d).
After salt treatment, there was an increase in proline (Pro) content in all plants. However, ZmPDI-overexpressing transgenic plants exhibited higher Pro content as compared to WT, whereas OsPDI knock-out transgenic plants displayed lower Pro content than that of WT plants (Figure 1e). The MDA content of OsPDI knock-out rice was much higher than that of WT and ZmPDI-overexpressing transgenic plants (Figure 1f). We also detected the POD activity of ZmPDI-overexpressing rice, OsPDI knock-out rice, and WT rice before and after salt treatment, respectively. The results suggested that before salt treatment, the POD activity in ZmPDI-overexpressing rice, OsPDI knock-out rice, and WT range from 30,000–35,000 U/g, and there is no POD activity difference among them. After the salt treatment, the POD activity in all plants decreased, but the POD activity in ZmPDI-overexpressing rice was higher than that in WT and OsPDI knock-out rice (Figure 1g). These findings suggested that overexpression of ZmPDI improved the tolerance of rice to salt stress.

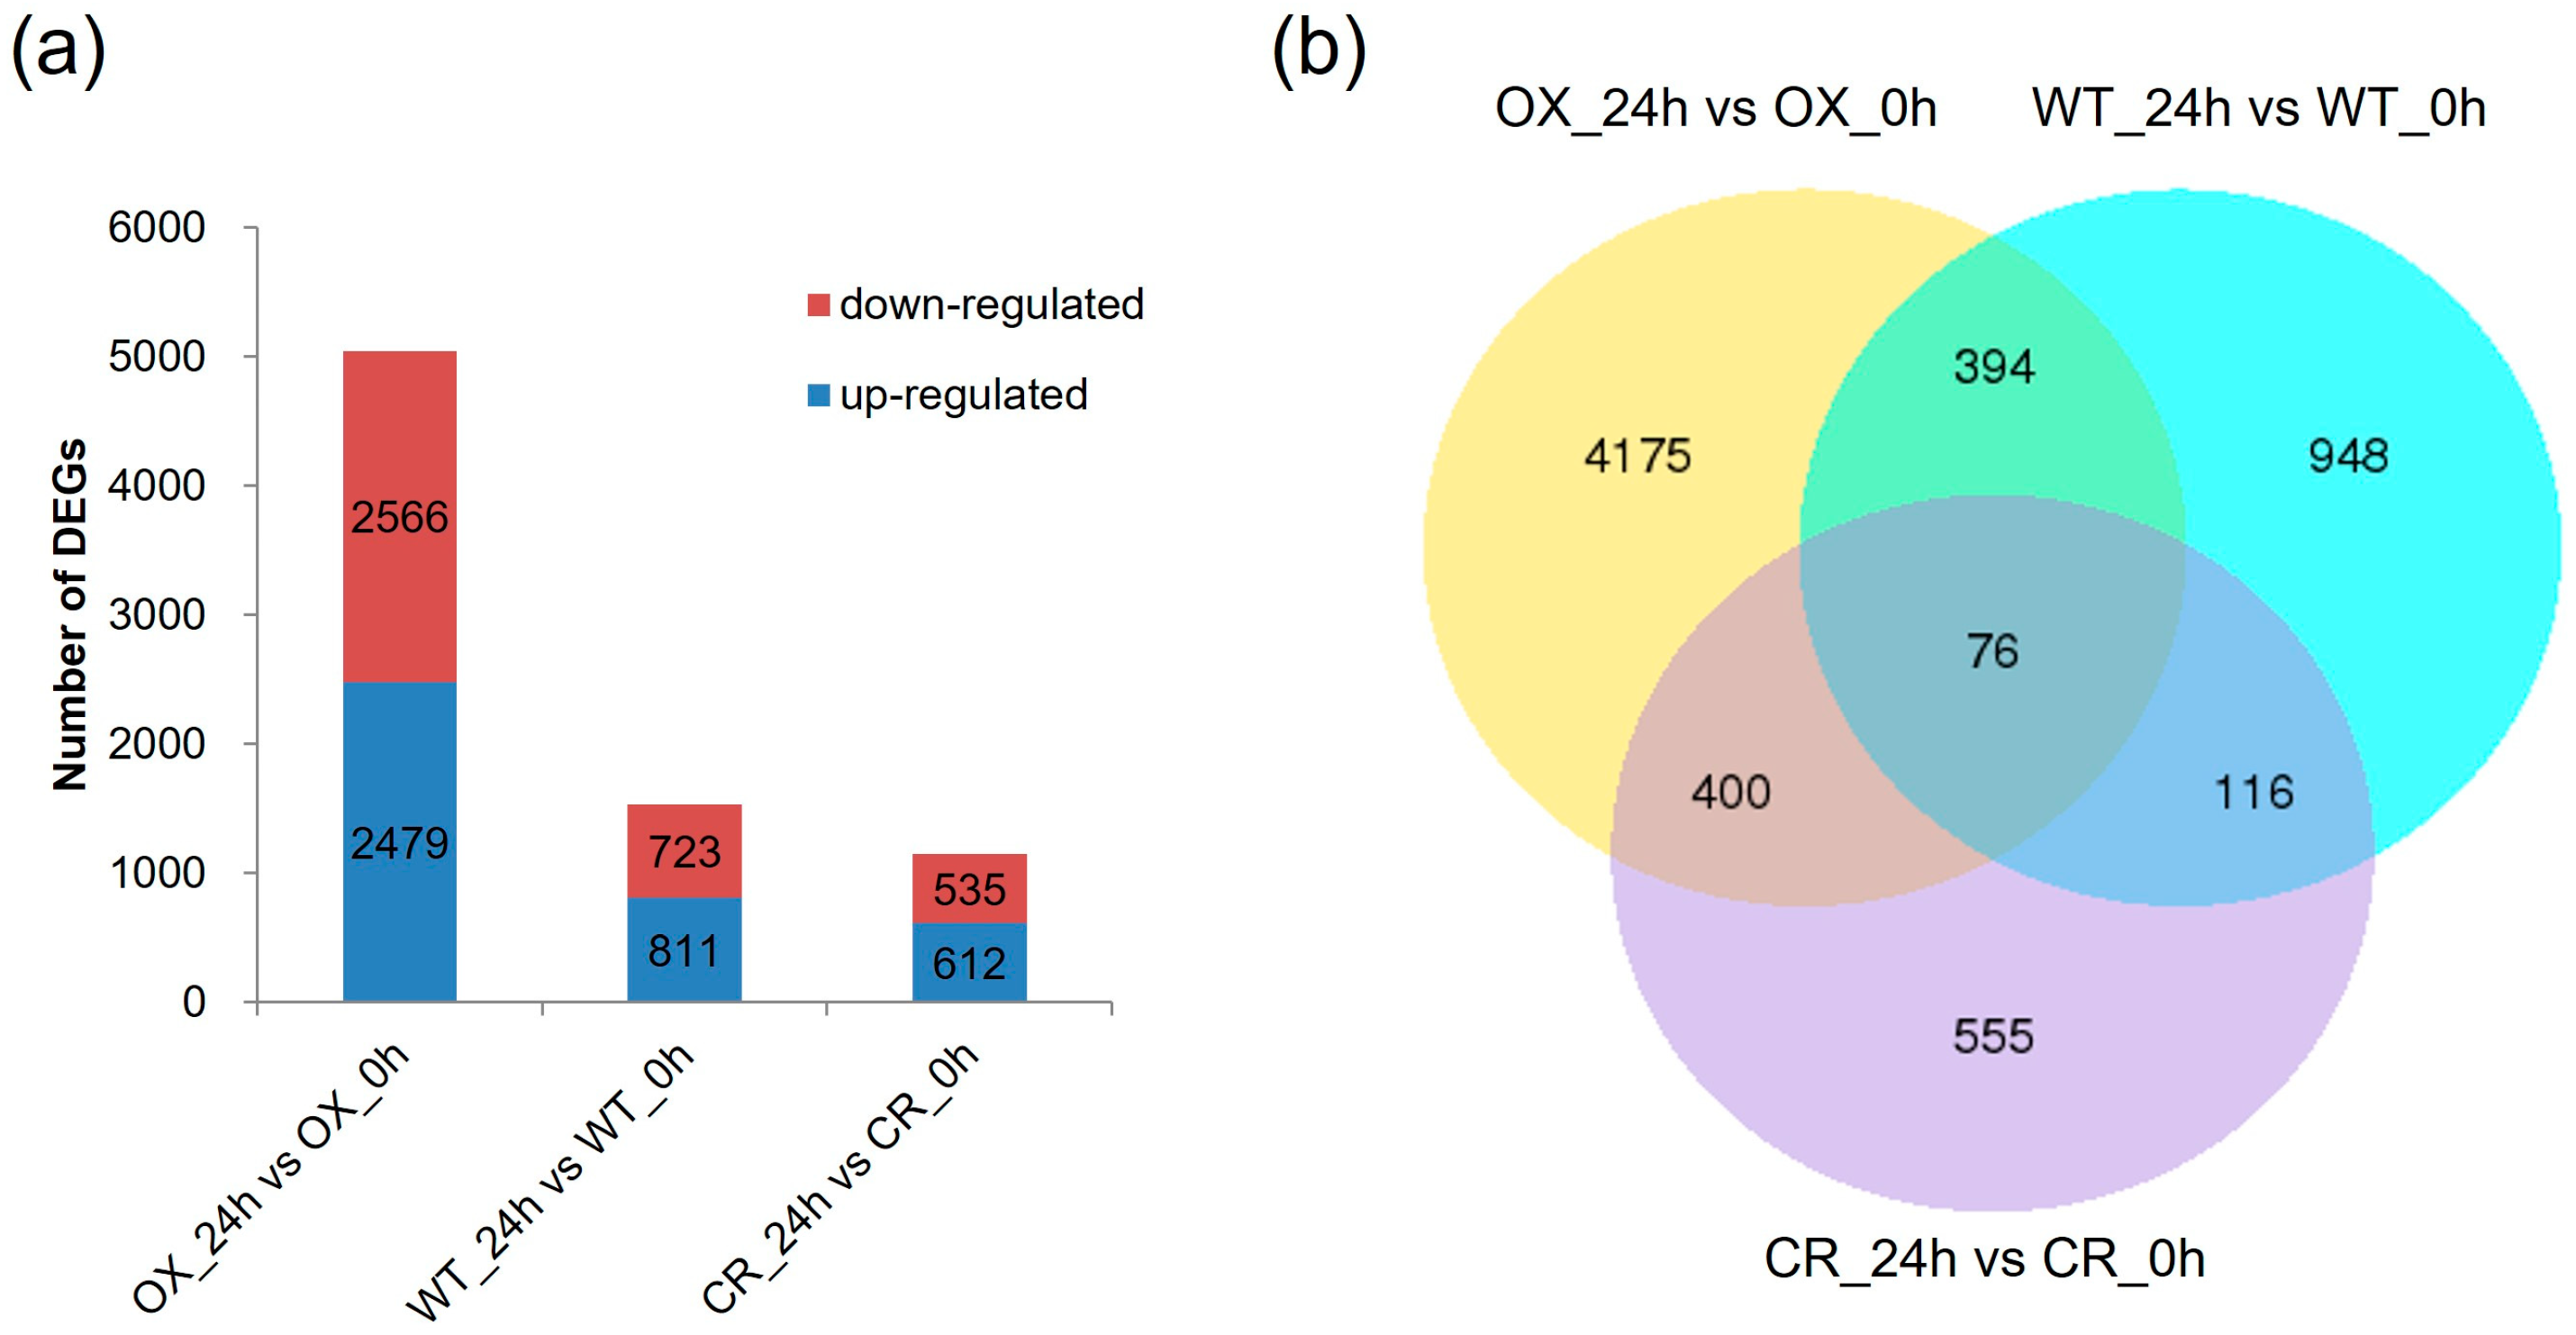
3.2. Transcriptome Sequencing of the ZmPDI-Overexpressing Rice, OSPDI Knock-Out Rice, and WT Rice

Previous results showed that treating with salt for 24 h is a crucial time [12]. So, we collected root samples from OsPDI knock-out rice, ZmPDI-overexpressing rice, and WT rice for RNA-seq and proteome analysis at 0 h and 24 h after exposure to 200 mM NaCl. A total of 18 samples were sequenced using the HiSeq™ 2000 sequencing platform. 9.5 billons reads were obtained, of which 9.3 (98%) billons were confirmed as clean reads. Reads with Base Q > 30 range from 93.75% to 94.36% (Supplementary Table S2). We mapped the reads to the rice genomes (https://www.ncbi.nlm.nih.gov/genome/?term=IRGSP-1.0, accessed on 10 September 2019) as references via Hisat2 (v2.0.5) software [23]. About 93.02% to 96.91% of clean reads can map to the rice genome, and 91.2–95.24% of clean reads can map to the unique site of the rice genome. In addition, multiple-mapped reads constituted 1.5–2.16% of the total clean reads, and splice-mapped reads constituted 24.8–30.84% of the total clean reads (Supplementary Table S3). Furthermore, most of the total clean reads were mapped to exons (92.47–93%), followed by introns (3.28–4%) and intergenic regions (2.65–3.47%) in the reference genome (Supplementary Table S4).
To verify the reliability of transcriptome analysis, we employed real-time PCR analysis to validate the expression levels of five randomly selected genes in rice. For example, the expression level of gene 4352829 in ZmPDI-overexpressing rice was 2.1 times that in WT rice, while the expression level of gene 9266373 in ZmPDI-overexpressing rice was 2.9 times that in WT rice. The expression levels of gene 4328687, 4326077, and 4326565 in OsPDI knock-out rice were 1.9, 2.2, and 2.1 times those in WT rice (Supplementary Figure S2). The results demonstrated a consistent correlation between the real-time PCR results and transcriptome analysis, affirming the reliability of the transcriptome analysis results. After salt treatment, 1534 genes (811 up-regulated and 723 down-regulated), 5045 genes (2479 up-regulated and 2566 down-regulated) and 1147 genes (612 up-regulated and 535 down-regulated) were differently expressed significantly in WT_24h vs. WT_0h, OX_24h vs. OX_0h, CR_24h vs. CR_0h comparisons, respectively (Figure 2a). The number of up-regulated genes was comparable to that of down-regulated genes in all three comparisons. In addition, there were 470, 192, and 476 DEGs shared in OX_24h vs. OX_0h and WT_24h vs. WT_0h, CR_24h vs. CR_0h and WT_24h vs. WT_0h, and OX_24h vs. OX_0h and CR_24h vs. CR_0h, respectively (Figure 2b). Transcription factor analysis showed that the top 3 transcription factor families, that DEGs belonged to, were basic/helix-loop-helix (bHLH), AP2/ERF, and WRKY transcription factor families (Supplementary Figure S3).

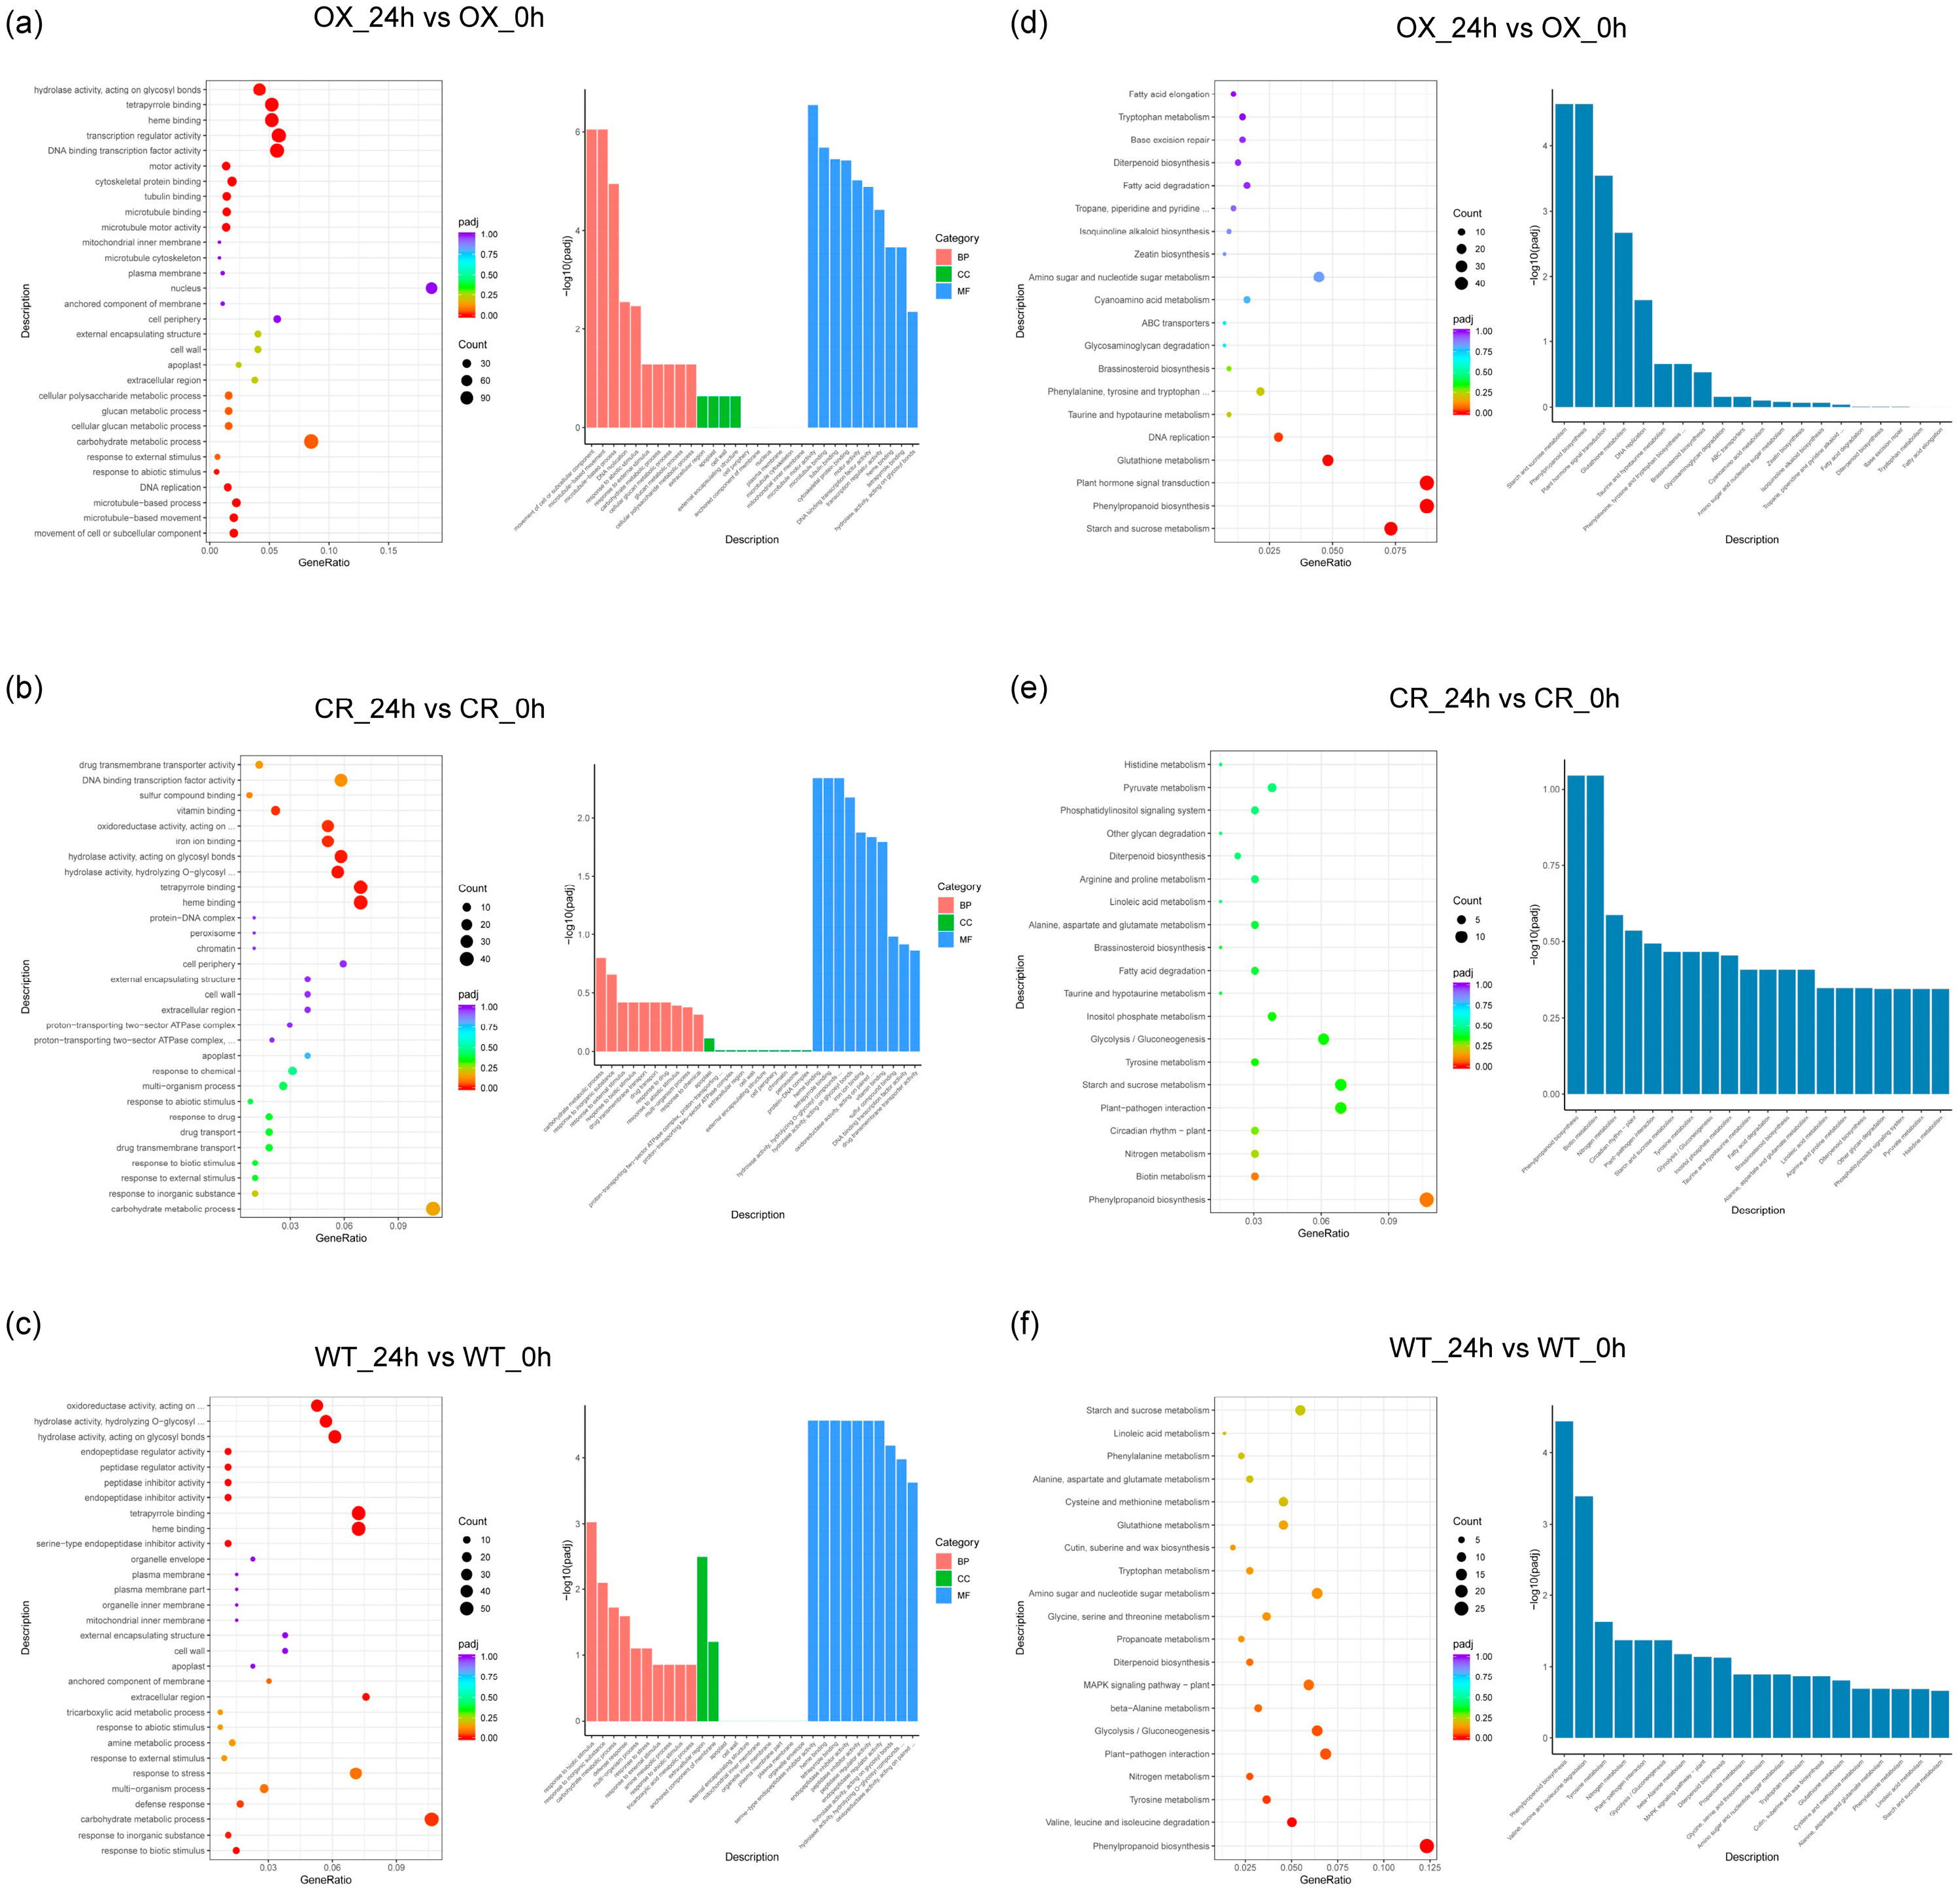
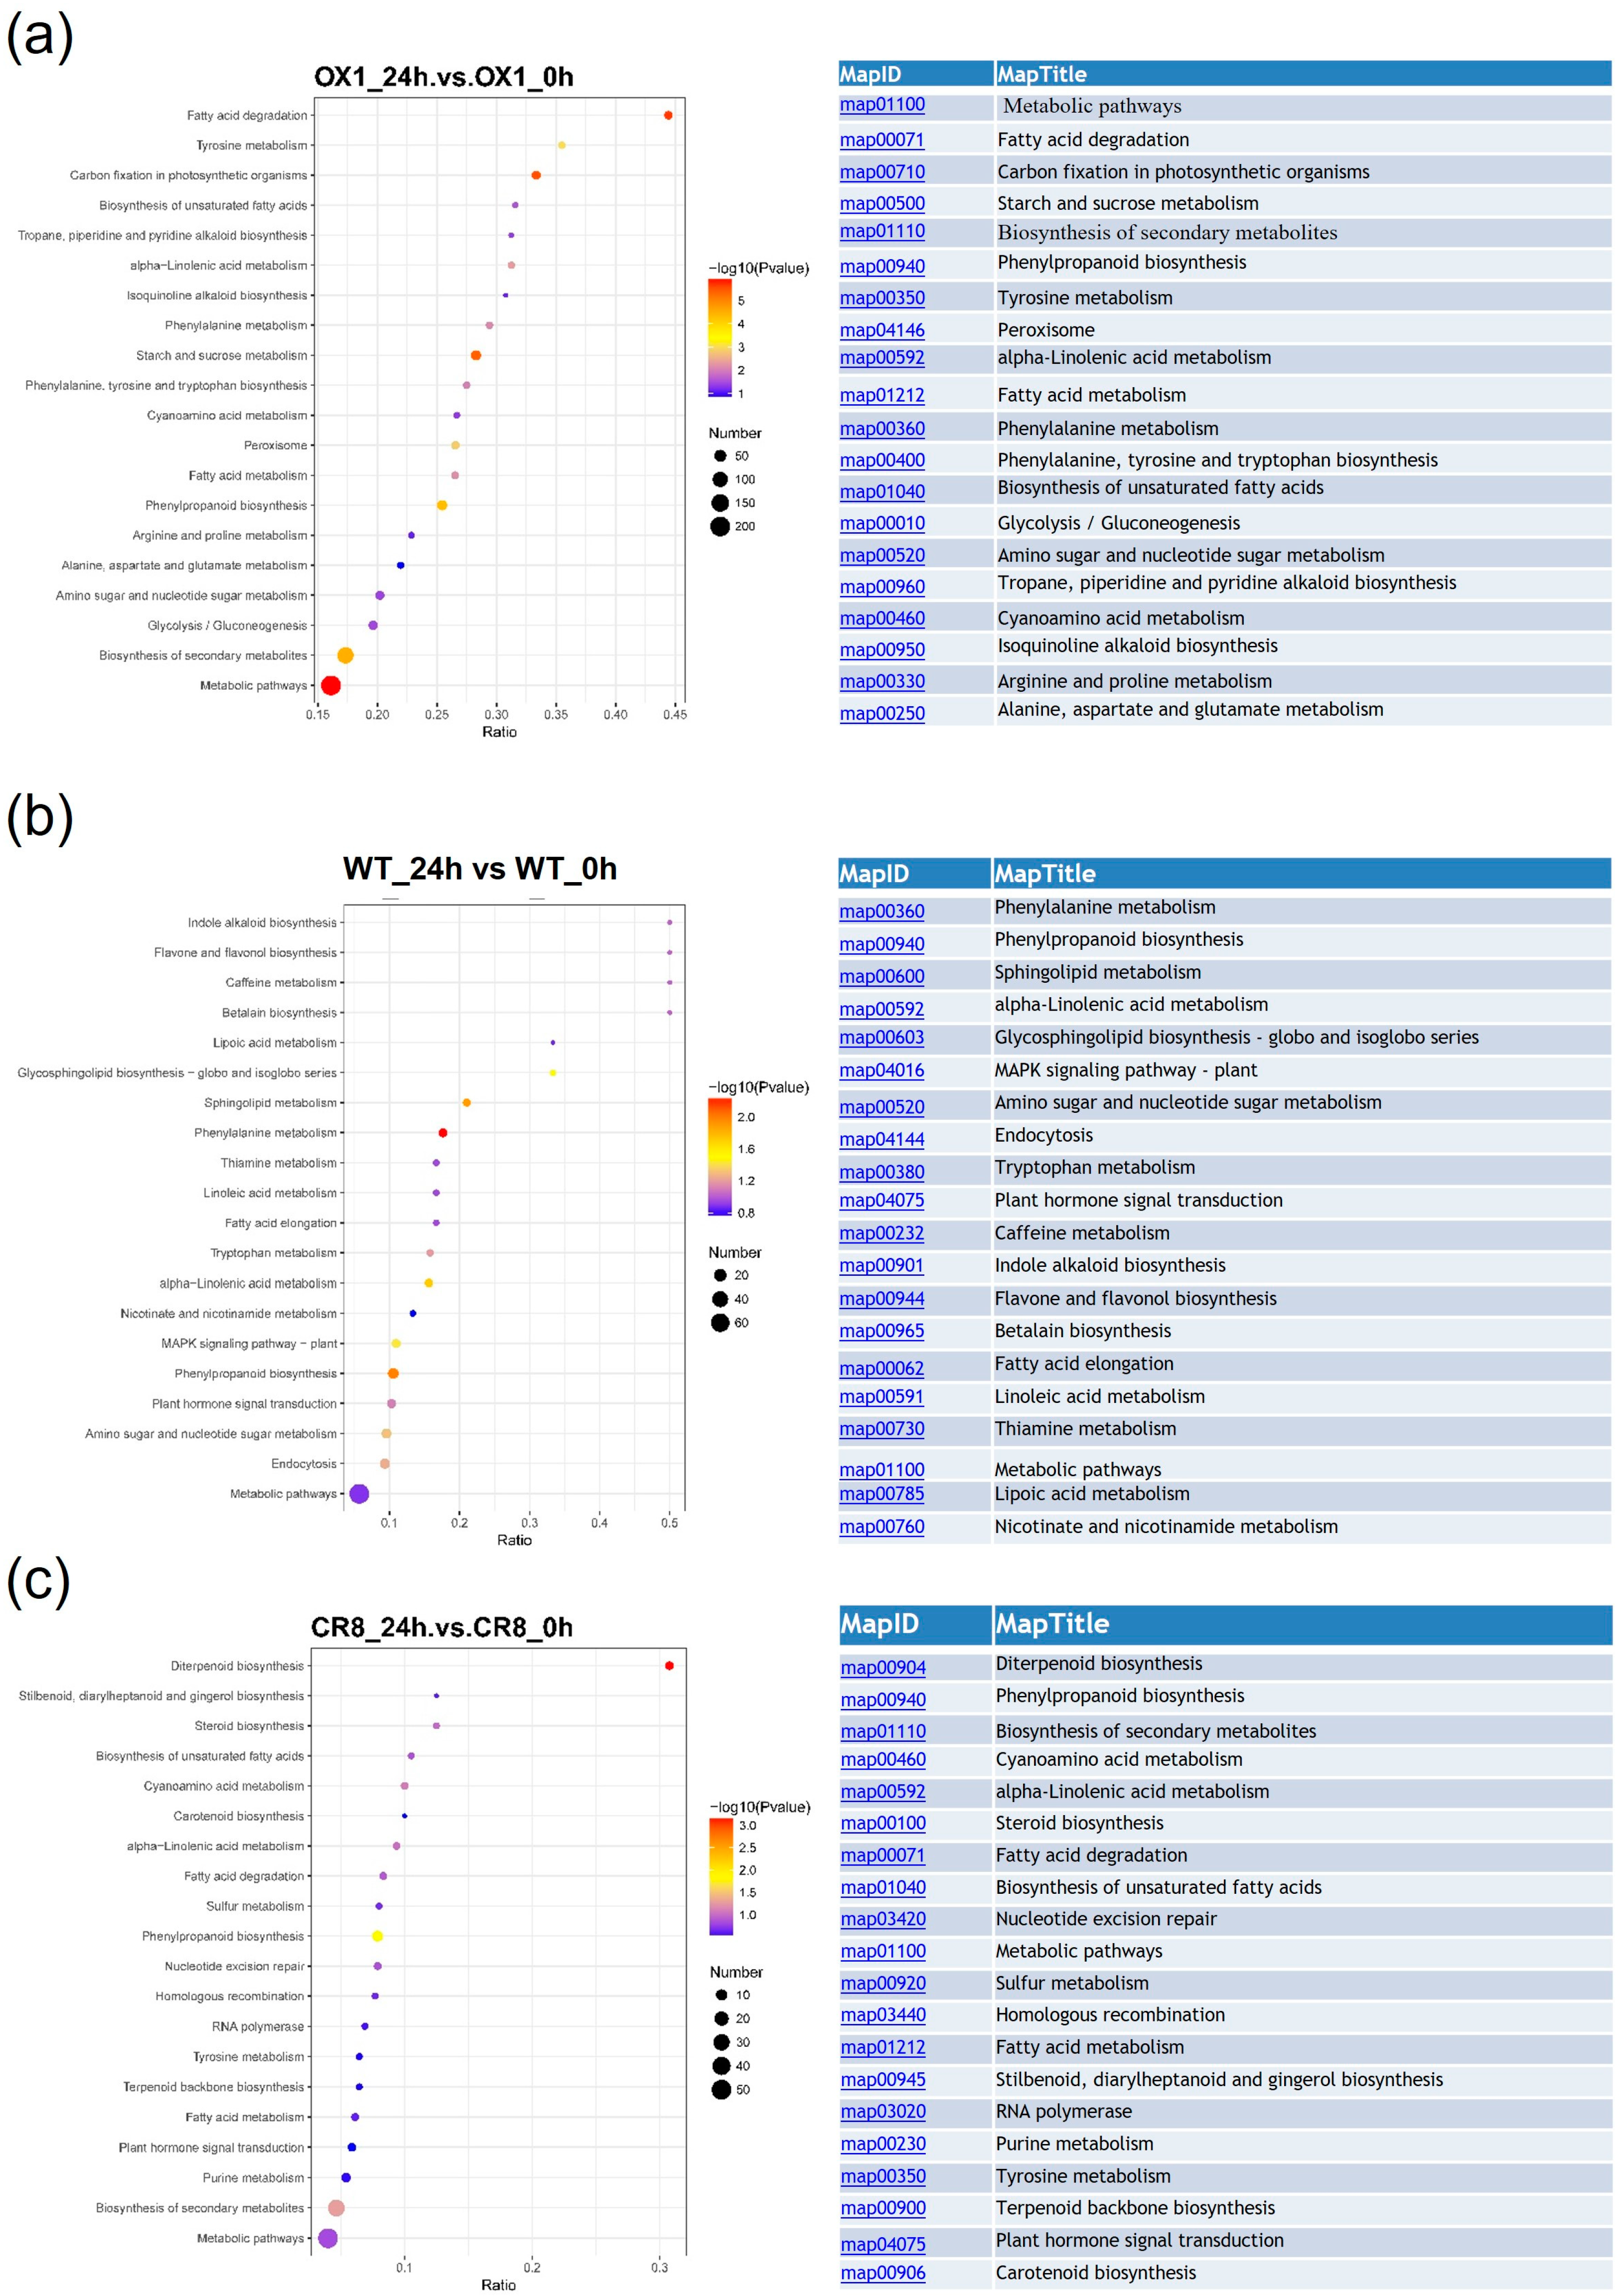
3.3. GO and KEGG Analysis of DEGs in ZmPDI-Overexpressing Rice, OsPDI Knock-Out Rice, and WT Rice in Response to Salt Stress

To functionally characterize DEGs, we utilized clusterprofiler software R package (3.3.4) to assign GO terms and identify significant GO classifications for each comparison (padj < 0.05). Thirty, 18, and 7 GO terms were significantly enriched in OX_24h vs. OX_0h, WT_24h vs. WT_0h, and CR_24h vs. CR_0h comparison, respectively. Five GO were common in OX_24h vs. OX_0h, CR_24h vs. CR_0h and WT_24h vs. WT_0h comparisons: ‘heme binding’ (GO:0020037), ‘tetrapyrrole binding’ (GO:0046906), ‘hydrolase activity, hydrolyzing O-glycosyl compounds’ (GO:0004553), ‘hydrolase activity, acting on glycosyl bonds’ (GO:0016798) and ‘oxidoreductase activity, acting on paired donors, with incorporation or reduction of molecular oxygen’ (GO:0016705). There were 12 and 25 unique GO terms in OX_24h vs. OX_0h and WT_24h vs. WT_0h comparison, respectively. Among the 25 unique GO terms in OX_24h vs. OX_0h comparison, 4 were relative to stress response: ‘peroxidase activity’ (GO:0004601), ‘oxidoreductase activity, acting on peroxide as acceptor’ (GO:0016684), ‘antioxidant activity’ (GO:0016209) and ‘response to abiotic stimulus’ (GO:0009628). These results indicated that the overexpression of ZmPDI can trigger more genes which involved in stress response. Eight cell wall-related GO terms and 6 unique GO terms that were involved in the gene transcription process were found to be enriched only in OX_24h vs. OX_0h comparison, but not in CR_24h vs. CR_0h or WT_24h vs. WT_0h comparison. (Figure 3a–c and Supplementary Table S5).
Among the top 20 KEGG pathways in OX_24h vs. OX_0h, CR_24h vs. CR_0h, and WT_24h vs. WT_0h comparison, most of them (16, 16, and 17 of 20 in OX_24h vs. OX_0h, CR_24h vs. CR_0h and WT_24h vs. WT_0h comparison, respectively) were related to metabolism. Only 3 pathways were common in OX_24h vs. OX_0h, CR_24h vs. CR_0h, and WT_24h vs. WT_0h comparison: ‘Starch and sucrose metabolism’ (osa00500), ‘Phenylpropanoid biosynthesis’ (osa00940) and ‘Diterpenoid biosynthesis’ (osa00904); while 6 pathways were shared in CR_24h vs. CR_0h and WT_24h vs. WT_0h comparison; and 3 pathways were shared in OX_24h vs. OX_0h and WT_24h vs. WT_0h comparison. The remaining 4 KEGG pathways were unique in OX_24h vs. OX_0h comparison: ‘Plant hormone signal transduction’ (osa04075), ‘DNA replication’ (osa03030), ‘ABC transporters’ (osa02010) and ‘Base excision repair’ (osa03410). However, not all the remaining 3 or 4 KEGG pathways in WT_24h vs. WT_0h or CR_24h vs. CR_0h comparison were unique (Figure 3d–f and Supplementary Table S6).

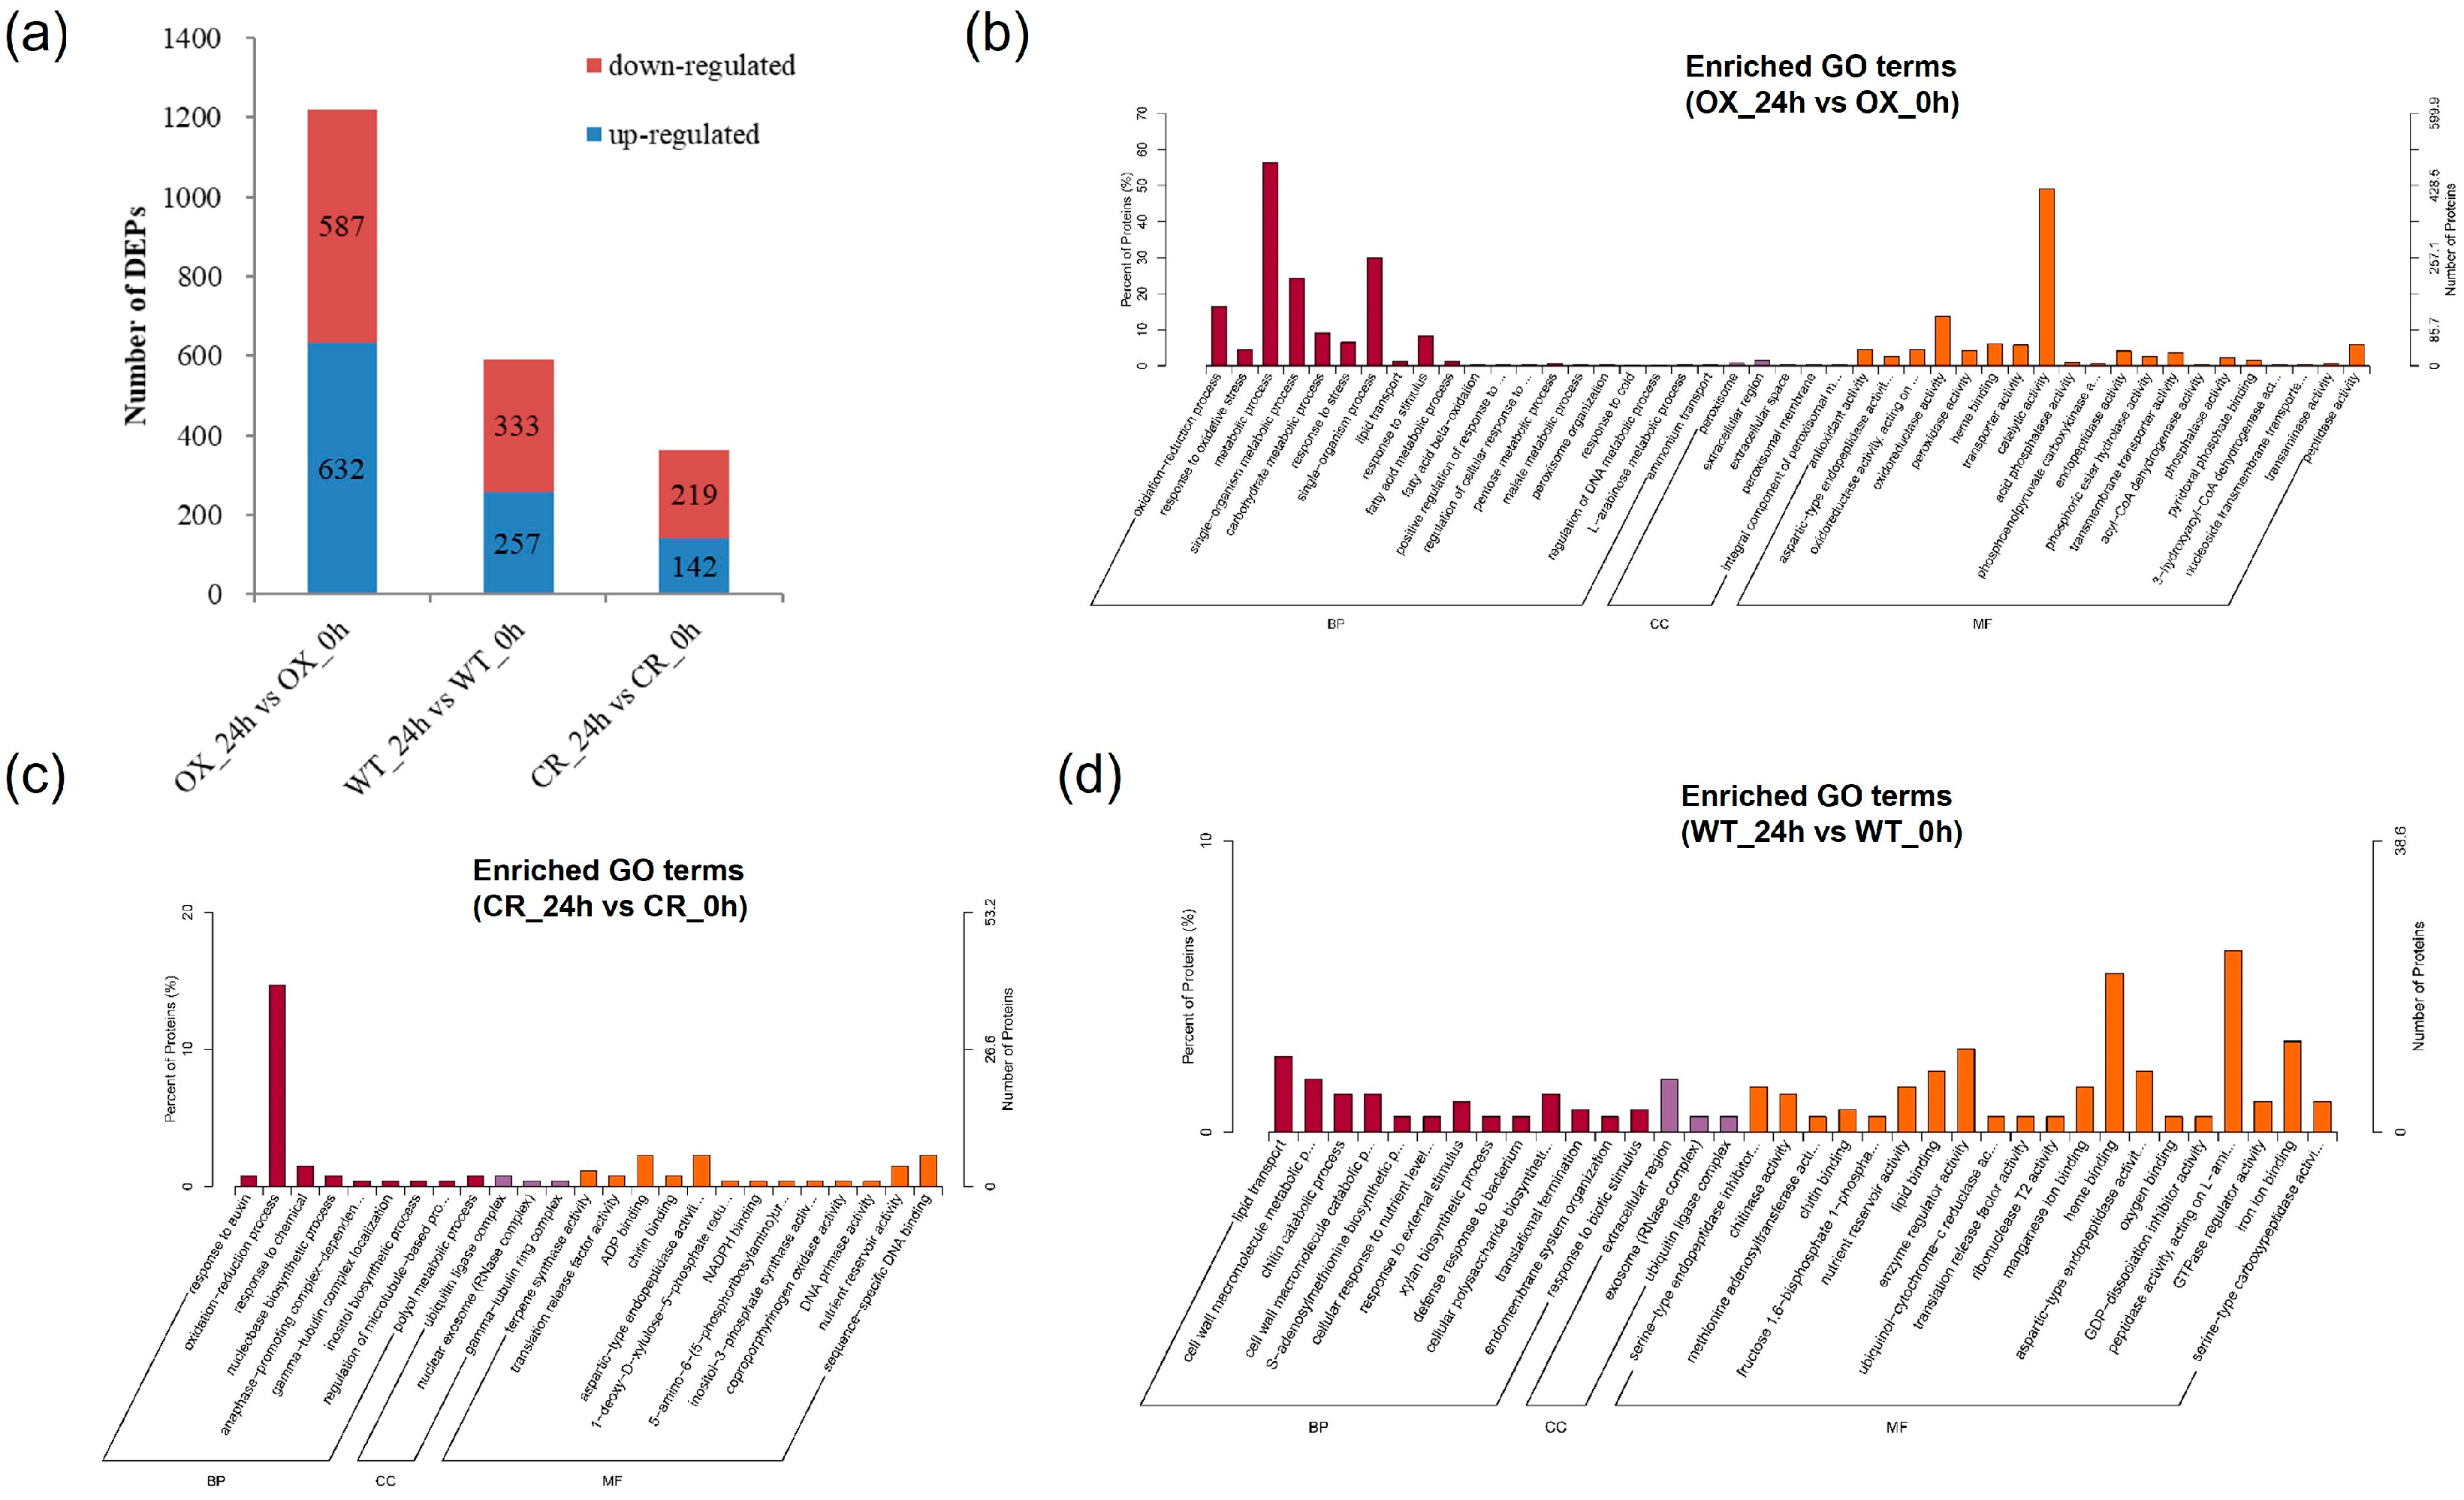
3.4. Proteome Sequencing of the ZmPDI-Overexpressing Rice, OSPDI Knock-Out Rice and WT

For future analysis of the mechanism by which ZmPDI is involved in the response to salt stress, we conducted proteome sequencing of the ZmPDI-overexpressing rice, OsPDI knock-out rice, and WT rice before and after salt treatment. A total of 9520 proteins were identified, with 9516 (99.9%) being annotated to at least one of the GO, KEGG, IPR, and COG libraries (Supplementary Figure S4).
Using the screening criterion of fold-change ≥ 1.2/fold-change ≤ 0.83 and a p-value ≤ 0.05, there were 632 up-regulated proteins and 587 down-regulated proteins in OX_24h vs. OX_0h comparison. Two hundred and fifty seven and 333 proteins were respectively up-regulated and down-regulated in the WT_24h vs. WT_0h comparison; 142 up-regulated proteins and 219 down-regulated proteins were identified in the CR_24h vs. CR_0h comparison (Figure 4a, Supplementary Figure S5 and Supplementary Table S7). The OX_24h vs. OX_0h comparison has the most DEPs, followed by WT_24h vs. WT_0h comparison and CR_24h vs. CR_0h comparison. The number of up-regulated proteins was comparative to that of down-regulated proteins in all three comparisons (Figure 4a). Half of the DEPs in the 3 comparisons were located in the cell membrane, cytoplasm, and nucleus (Supplementary Figure S6).

3.5. GO and KEGG Analysis of Different Expression Proteins in ZmPDI-Overexpressing Rice, OsPDI Knock-Out Rice, and WT in Response to Salt Stress

To provide further insights into the functional changes after salt treatment, the differentially expressed proteins in each comparison were assigned to gene ontology (GO) annotation for functional categories analysis. In the WT_24h vs. WT_0h comparison, the DEPs were enriched into 36 GO terms significantly (p-value ≤ 0.05), and 13, 20, and 3 terms were classified into BP (Biological Process, BP), MF (Molecular Function, MF), and CC (Cellular Component, CC) subcategories, respectively. DEPs were enriched into 25 GO groups in CR_24h vs. CR_0h comparison (p-value ≤ 0.05); 9, 13, and 3 terms of which belonged to BP, MF, and CC subcategories, respectively. While DEPs were enriched significantly into 84 GO groups in OX_24h vs. OX_0h comparison (p-value ≤ 0.05), 34, 45, and 5 terms were classified into BP, MF, and CC subcategories, respectively (Figure 4b–d).
Among the top 20 GO terms in each comparison, only 4 GO terms in the OX_24h vs. OX_0h comparison were shared with the other two comparisons. Among the 16 unique GO terms, 3 GO terms were related to stress: ‘response to oxidative stress’ (GO:0006979), ‘response to stress’ (GO:0006950), and ‘response to stimulus’ (GO:0050896); 6 GO terms were related to oxidoreductase activity or catalytic activity: ‘antioxidant activity’ (GO:0016209), ‘oxidoreductase activity, acting on peroxide as acceptor’ (GO:0016684), ‘oxidoreductase activity’ (GO:0016491), ‘peroxidase activity’ (GO:0004601), ‘catalytic activity’ (GO:0003824) and ‘heme binding’ (GO:0020037); 6 GO terms were related to metabolic process: ‘single-organism metabolic process’ (GO:0044710), ‘metabolic process’ (GO:0008152), ‘carbohydrate metabolic process’ (GO:0005975), ‘acid phosphatase activity’ (GO:0003993), ‘phosphoenolpyruvate carboxykinase activity’ (GO:0004611) and ‘endopeptidase activity’ (GO:0004175) (Figure 4b–d and Supplementary Table S8). We also analyzed all the significantly enriched GO terms in OX_24h vs. OX_0h (84 GO terms), CR_24h vs. CR_0h (25 GO terms), and WT_24h vs. WT_0h (35 GO terms) comparison. Among the 76 unique GO terms in the OX_24h vs. OX_0h comparison, 15 GO terms were involved in the major ROS-scavenging mechanisms through which plants can scavenge the harmful ROS induced by stress. Thirty-four GO terms were related to the energy metabolism process and 7 unique GO terms were related to ‘transporter activity’ or ‘transporter’ (Figure 4 and Supplementary Table S9).
The DEPs in OX_24h vs. OX_0h, CR_24h vs. CR_0h, and WT_24h vs. WT_0h after salt treatment were mapped to KEGG pathways of Oryza sativa. The DEPs in OX_24h vs. OX_0h, CR_24h vs. CR_0h, and WT_24h vs. WT_0h comparison were involved in 74, 47, and 61 KEGG pathways, respectively. Comparing the top 20 KEGG pathways in OX_24h vs. OX_0h, CR_24h vs. CR_0h and WT_24h vs. WT_0h comparison, 3 KEGG pathways were common in those three comparisons; 2 other KEGG pathways were shared among OX_24h vs. OX_0h and WT_24h vs. WT_0h comparison; while 1 KEGG pathways (except the 3 common KEGG pathways) were shared in CR_24h vs. CR_0h and WT_24h vs. WT_0h comparison. Three out of 9 unique KEGG pathways in OX_24h vs. OX_0h comparison were involved in carbohydrate metabolism: ‘Carbon fixation in photosynthetic organisms’ (map00710), ‘Starch and sucrose metabolism’ (map00500) and ‘Glycolysis/Gluconeogenesis’ (map00010), 3 unique KEGG pathways were related to amino acid metabolism: ‘Phenylalanine, tyrosine and tryptophan biosynthesis’ (map00400), ‘Arginine and proline metabolism’ (map00330) and ‘Alanine, aspartate and glutamate metabolism’ (map00250); the remaining 3 KEGG pathways were ‘Peroxisome’ (map04146), ‘Tropane, piperidine and pyridine alkaloid biosynthesis’ (map00960) and ‘Isoquinoline alkaloid biosynthesis’ (map00950). Except for ‘Tropane, piperidine, and pyridine alkaloid biosynthesis’ (map00960) and ‘Isoquinoline alkaloid biosynthesis’ (map00950), these KEGG pathways were all significantly enriched (Figure 5 and Supplementary Table S10).

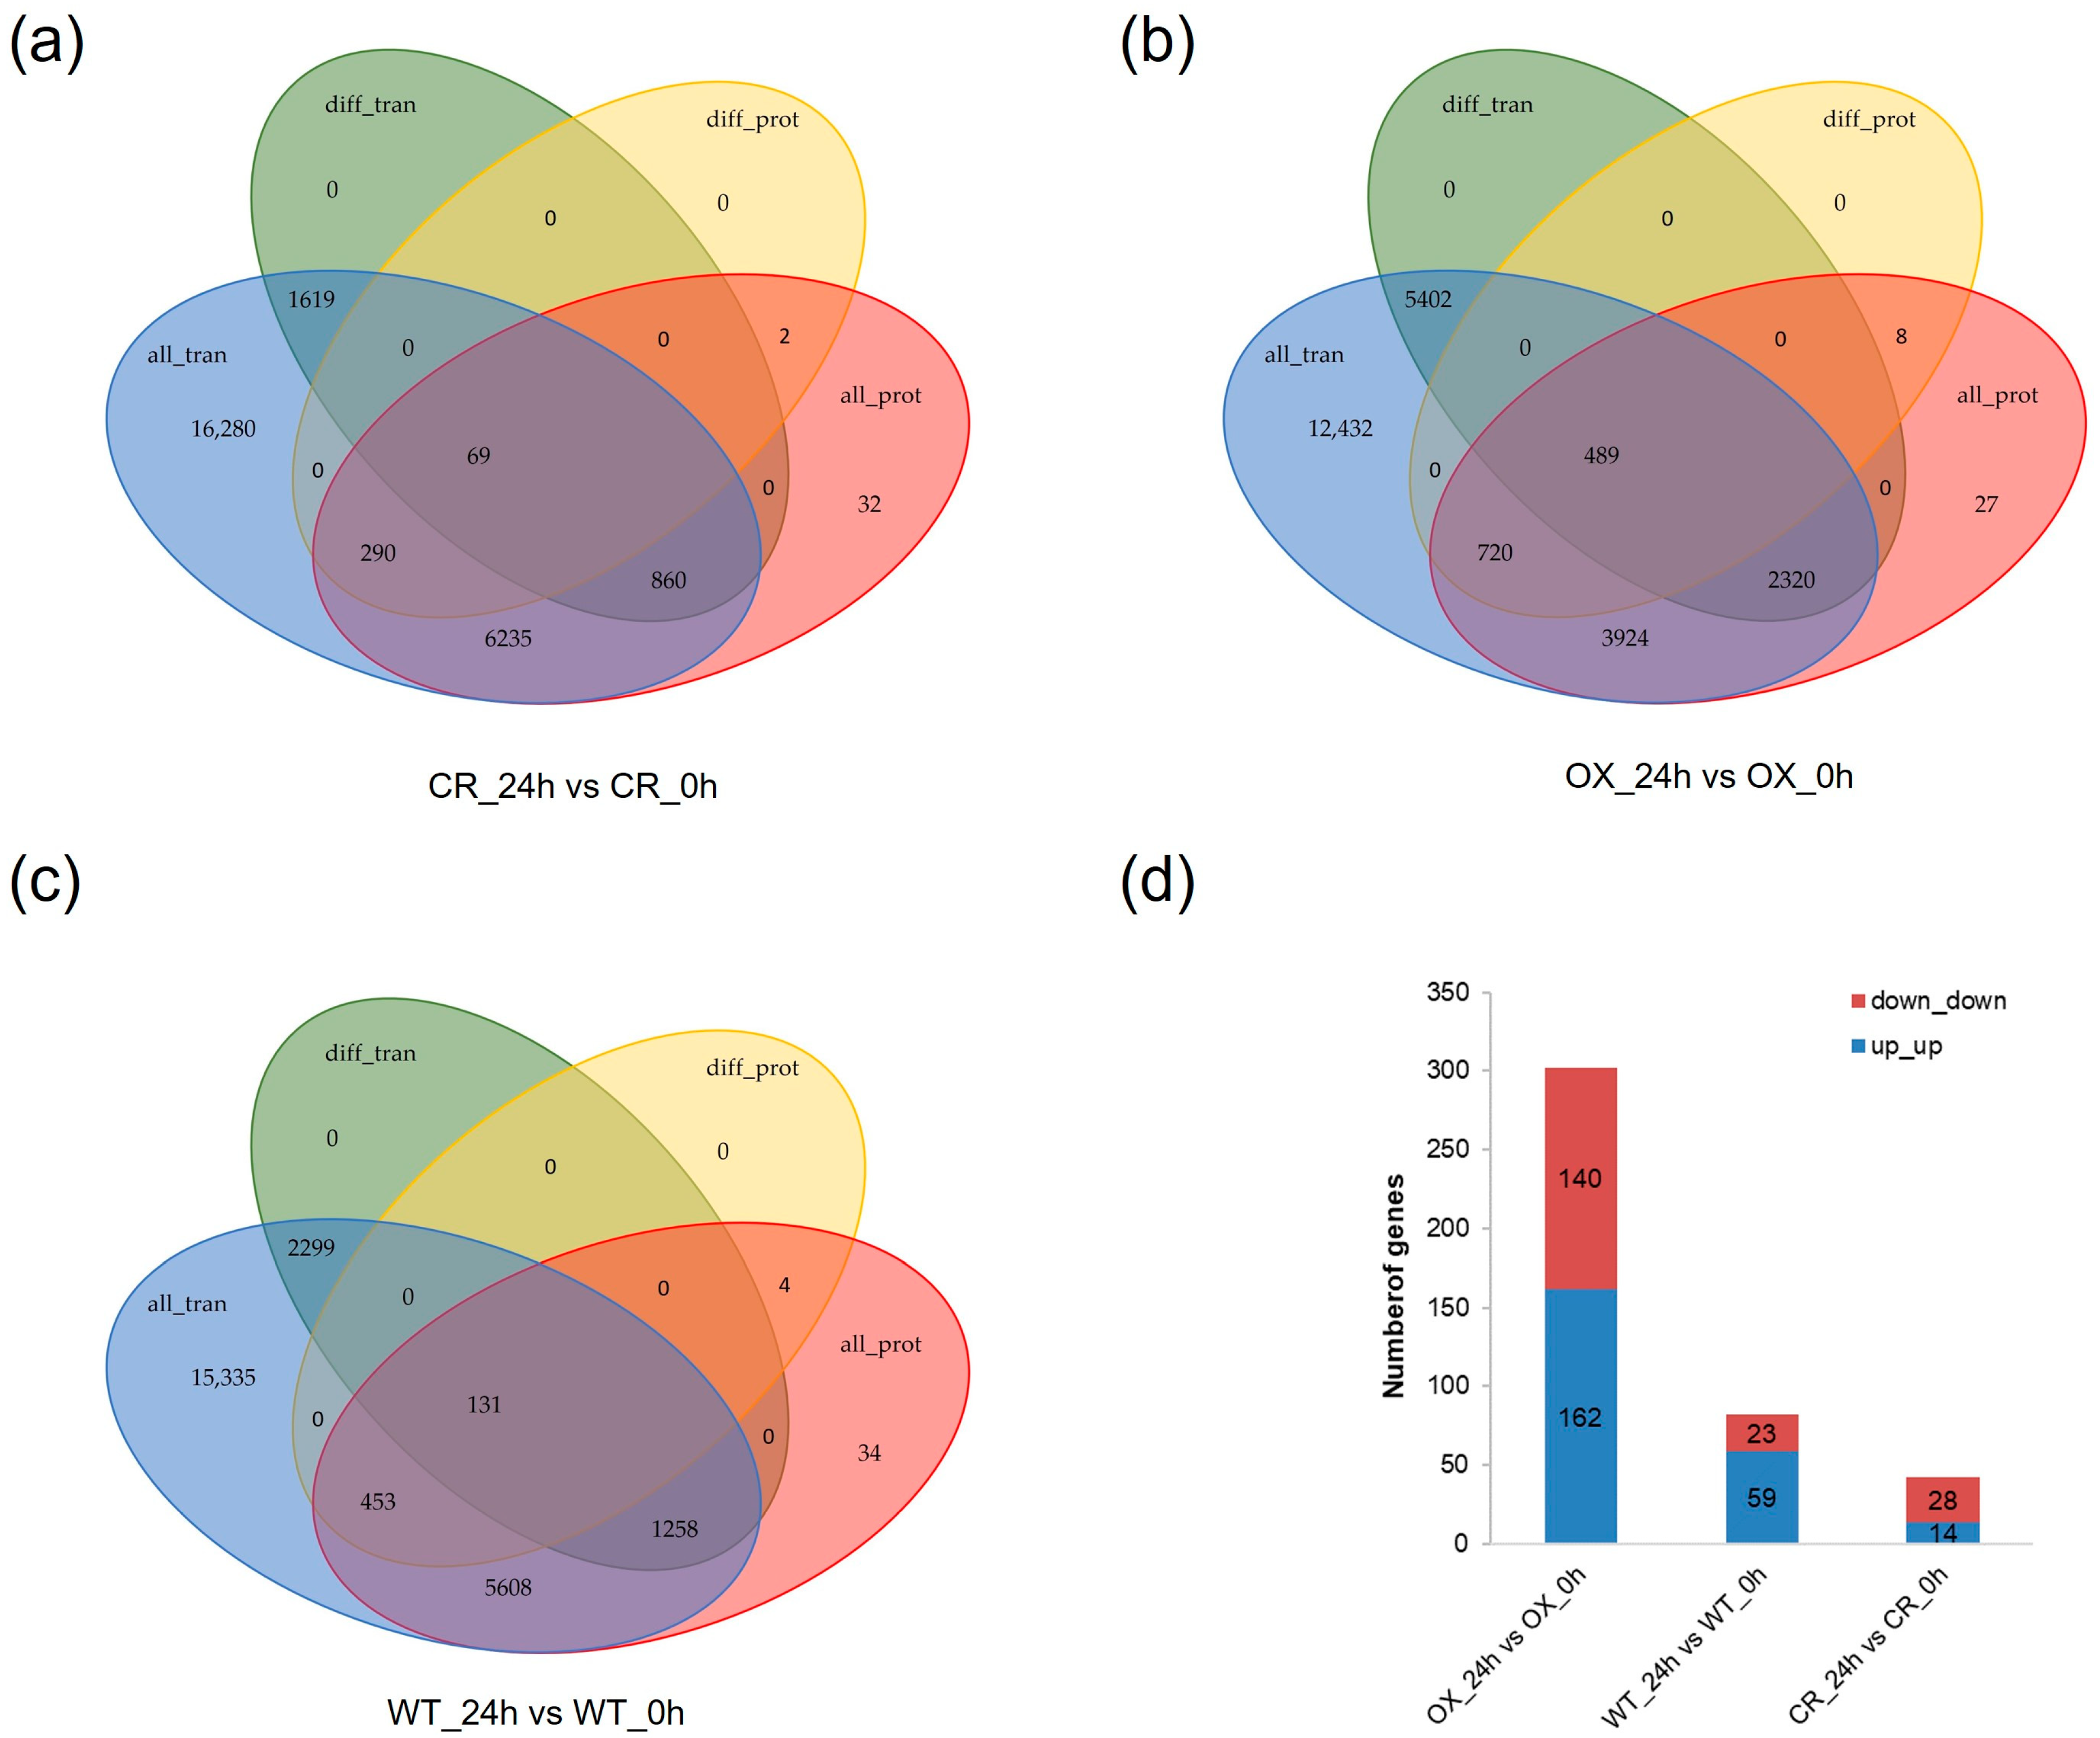
3.6. Combination Analysis of Transcriptome and Proteome Sequencing

In the OX_24h vs. OX_0h comparison, the number of genes that showed significant expression difference both in transcriptional and translational levels was 489, much more than those in the other two comparisons (Figure 6a–c). Genes with consistent tendency at RNA and protein level in 3 comparisons were selected for the combined analysis. Three hundred and two (162 were up_up, 140 were down_down), 82 (59 were up_up, 23 were down_down) and 42 (14 were up_up, 28 were down_down) showed the same regulation pattern at transcriptional and translational level in OX_24h vs. OX_0h, WT_24h vs. WT_0h and CR_24h vs. CR_0h comparison, respectively (Figure 6d and Supplementary Table S11). The number of genes with an up_up regulation pattern in OX_24h vs. OX_0h and WT_24h vs. WT_0h is more than that with a down_down regulation pattern, but in CR_24h vs. CR_0h, the results were opposite (Figure 6d and Supplementary Table S11). In OX_24h vs. OX_0h, these 302 genes were enriched into 21 GO terms and 16 KEGG pathways. In WT_24h vs. WT_0h, these 82 genes were enriched into 18 GO terms and 12 KEGG pathways. While in CR_24h vs. CR_0h, these 42 genes were enriched into 8 GO terms and 5 KEGG pathways (Supplementary Figure S7 and Supplementary Table S11).
In total, 377 DEGs (p-value < 0.05) were selected from the OX_24h vs. OX_0h and WT_24h vs. WT_0h comparisons, including 192 DEGs had consistent expression trends in their RNA levels and protein levels. We set a selection criterion of |log2[FC(OX_24h/OX_0h)/FC(CK_24h/CK_0h)]| > 1 and scanned the 192 DEGs selected from the OX_24h vs. OX_0h and WT_24h vs. WT_0h comparisons. Eighty-three DEGs were selected due to the significant differences between OX_24h vs. OX_0h and WT_24h vs. WT_0h comparisons at the RNA or proteome levels, including 8 DEGs significantly different both at the RNA and proteome levels (Supplementary Table S12).
One hundred and twenty-two DEGs (p-value < 0.05) were selected from the CR_24h vs. CR_0h and WT_24h vs. WT_0h comparisons, among which 61 DEGs had consistent expression trends in their RNA levels and protein levels. With the condition |log2[FC(OX_24h/OX_0h)/FC(WT_24h/WT_0h)]| > 1, 61 DEGs selected above were scanned, 24 DEGs showed significant differences between CR_24h vs. CR_0h and WT_24h vs. WT_0h comparisons, but none of them was significantly different both at the RNA and proteome levels (Supplementary Table S13). So, the 8 DEGs showed significant differences between OX_24h vs. OX_0h and WT_24h vs. WT_0h comparison may be the putative targets of ZmPDI.
Among the 8 DEGs significantly different, both at the RNA and proteome levels between OX_24h vs. OX_0h and WT_24h vs. WT_0h comparisons, 4 (4334171, 4338987, 4343010, and 107276064) had consistent trends in OX_24h vs. OX_0h and WT_24h vs. WT_0h comparisons, including 3 (4334171, 4338987 and 4343010) were down-regulated and 1 (107276064) was upregulated; while the other 4 DEGs showed inconsistent trends, including 3 (4324320, 4327925 and 4350821) were down-regulated in OX_24h vs. OX_0h comparisons and up-regulated in WT_24h vs. WT_0h comparisons, and the other 1 (107276446) showed the opposite trends (Table 1).

4. Discussion

4.1. Overexpression of ZmPDI Can Enhance the Salt Tolerance of Rice, While Loss-of-Function of OsPDI in Rice Leads to Reduced Salt Tolerance

It was verified that heterologous expression of ZmPDI in yeast and homologous expression of ZmPDI in Z. matrella can enhance salt tolerance [10,21]. However, whether such enhancement can be further verified in other species is uncertain. In this study, compared with WT, overexpression of ZmPDI in rice improved the salt tolerance significantly with higher plant height and longer roots, while loss-of-function of OsPDI reduced salt tolerance with lower plant height and shorter roots. Malondialdehyde (MDA) is the main product of membrane lipid peroxidation under salt stress, and its content reflects the degree of cell membrane damage [29]. Under salt stress, the MDA content in OsPDI knock-out rice plants was higher than that in WT and ZmPDI-overexpressing rice. Salt stress induces multiple constraints on plants and inhibits plant growth, even leading to plant death. The first one is osmotic stress, which compromises plants’ water take-up ability. To deal with the osmotic stress, plants accumulate compatible osmolytes such as proline, hydroxyproline, glycine betaine, sugars, and polyamines [30,31,32], of which proline is the dominant osmotic compatible solute under salt stress [33]. Furthermore, proline also takes part in stabilizing proteins and membrane structures, and the ROS scavenger process [34]. In our study, the proline accumulation in ZmPDI-overexpressing rice was higher than that in WT, and proline accumulation in OsPDI knock-out rice plants was less than that in WT under salt stress, indicating that overexpression of ZmPDI increased salt tolerance by accumulating more proline.
Oxidative stress is another consequence of salt stress. Reactive oxygen species (ROS), resulting from oxygen activation, act as signal molecules to regulate multiple biological at low concentrations [2], but lead to damage in the cytoplasmic membrane, irreversible dysfunction of metabolic, cell death [35], and protein oxidation [36] at high concentrations. Plants have evolved both enzymatic (for example superoxide dismutases, (SOD), catalases (CAT), and peroxidases (POX, POD)) and non-enzymatic (low molecular mass antioxidants like ascorbate (ASC) and reduced glutathione (GSH)) mechanisms for ROS scavenging. As one of the ROS-scavenging enzymes, POD plays a role in enhancing the salt tolerance of plants by eliminating excess ROS [37]. Under salt stress, the POD content of ZmPDI-overexpressing rice was higher than that of WT and OsPDI knock-out rice, suggesting that increased POD content may be another way to enhance salt tolerance in ZmPDI-overexpressing rice. These findings indicated that ZmPDI enhances the salt tolerance of plants by adjusting osmotic balance and reducing oxidative stress.

4.2. ZmPDI May Enhance Salt Tolerance in Rice by Regulating Laccase-6, Zingipain-2, WIP3, FKBP65, AKR4C10, GBSSII, Pho1, and TRXf1

Plant laccases play a crucial role in the process of lignification by facilitating the oxidating of monolignols to polymerization into dehydrogenation polymers (DHPs). This process is essential for the normal differentiation and function of specific cell types [38]. The expression of OsLACs can be induced by multiple factors, including hormones, salt, drought, and heavy metal stresses. It was reported that salt stress induced the expression of OsLAC7 and OsLAC19 in tolerant japonica rice agami [39]. Four, 12, 22, 26, 27, 28, and 49 LAC genes in Physcomitrella patens, Amborella trichopoda, Zea mays, Ricinus communis, Vitis vinifera, Triticum aestivum, and Glycine max were identified, both soybean and maize LACs exhibit response to different external abiotic and biotic stressors [40]. Previous results indicated that miR857 represses the expression of AtLAC7 posttranscriptionally, negatively regulating laccase activity. Compared with the wild type Arabidopsis, knocking down of miR857 resulted in increased AtLAC7 expression, higher lignin content in secondary xylem cells, further tightly arranged cells, larger cell diameter of the secondary xylem, and thicker secondary cell wall in the stems [41]. It was demonstrated that overexpression of ZmLACCASE9 (ZmLAC9), or knockout of its upstream negatively regulation genes: MIR408a or MIR408b, increased the accumulation of lignin, thickened the walls of pavement cells, and improved salt tolerance of maize [42]. In this study, Oslaccase-6 (107276446) was up-regulated in OX_24h vs. OX_0h, but down-regulated in WT_24h vs. WT_0h both at protein and RNA levels, these findings suggested that ZmPDI may enhance resistance to salt stress by inducing the Oslaccase-6 level to affect the morphology of xylem.
Zingipain-2 (107276064) putative encodes a cysteine protease but was not included as a member of the papain-like cysteine proteases (PLCPs) family ((peptidase subfamily C1A)) of rice in the previous research [43]. Based on the high similarity between zingipain-2 and members of OsPLCPs (similarity: 58.28% with OsCP26, 54.89% with OsCP31, 59.23% with OsCP32) and the consistency of two conserved domains: inhibitor I29 domain (aa:44-100) and the peptidase C1A domain (aa:133-352) (http://www.ebi.ac.uk/merops/, accessed on 22, February, 2024), we proposed that zingipain-2 is one of the Peptidase subfamily C1A members. Moreover, zingipain-2 located between OsCP26 and OsCP32 at chromosome 9 and OsCP26/OsCP31/OsCP32 were considered as tandem duplicates, so we considered zingipain-2/OsCP26/OsCP31/OsCP32 as tandem duplicates [43]. Papain-like cysteine proteases play a role in multiple physiological processes such as tapetal programmed cell death (PCD) [44,45], biotic stress [46,47], abiotic stresses [48], and seed germination [49,50,51], male organ development [52,53,54,55]. For salt stress, certain PLCPs have been found to participate in the response to salt and osmotic stress, for example, AtRD21A and AtRD19A in Arabidopsis [56], Cyp15a in pea [57], TaCP in wheat [58]. Almost half of OsCPs in rice were up-regulated and only OsCP32 was down-regulated [43], most CaPLCPs in pepper [59] were up-regulated by salt stress. However, only a few researches studied the mechanism of PLCPs involved in salt stress. Overexpression of CaCP34 increased pepper’s resistance to leaf senescence induced by salt and osmotic stress by regulating the antioxidant system [59]. CaCP15 negatively regulates salt and osmotic stress resistance in pepper by reducing the ROS-scavenging enzyme activities [60]. CaCP34 and CaCP15 in pepper regulate the salt tolerance, although in inverse trends, but both in ROS scavenging-related pathways. zingipain-2 was up-regulated both in OX_24h vs. OX_0h and WT_24h vs. WT_0h, both at protein and RNA level, but the up-regulation degree in OX_24h vs. OX_0h was higher than WT_24h vs. WT_0h, indicating that zingipain-2 is a positive regulator in salt stress, and ZmPDI may enhance salt tolerance by up-regulating zingipain-2.
FK506 binding proteins (FKBPs) gene family is an import group of peptidyl-prolyl isomerases, play roles in protein folding processes, and is involved in vital processes in a broad range of organisms, such as viruses, bacteria, fungi, plants, and animals [61,62]. The FKBPs form large protein families (23 isoforms in Arabidopsis thaliana [63], 24 in maize [64], and 29 in Oryza sativa [65]), and play roles in cell signaling, stress response, photosynthesis, and gene transcription. Some FKBPs are vital for plant physiology while others seem to be functionally redundant. The function of FKBPs exhibited diversity and complexity [66]. The salt stress response has been observed only in a limited number of FKBPs, with their mechanisms remain poorly elucidated. PaFKBP12 in Polytrichastrum alpinum (alpine haircap moss) was proved to be involved in development and stress responses, its expression was induced by heat and abscisic acid. Transgenic Arabidopsis with PaFKBP12 ectopic expression displayed improved resistance to salt and drought stresses [67]. The overexpression of the thermophilic microalga Scenedesmus FKBP12 (Sce.FKBP12) in E. coli enhanced the tolerance to heat and salt stress [68]. OsFKBP12 negatively regulated both biotic and abiotic stress responses by interacting with an ancient unconventional G-Protein, OsYchF1, and ectopic expression of OsFKBP12 in Arabidopsis increased salt sensitivity, while Atfkbp12 mutants exhibited higher salt tolerance [69]. ROF1 plays a crucial role in the osmotic/salt stress responses during Arabidopsis thaliana germinating through a phosphatidylinositol-phosphate related protein quality control pathway by interacting with phosphatidylinositol-3-phosphate [PI(3)P] and phosphatidylinositol-3,5-bisphosphate [PI(3,5)P2]. Plants over-expressing ROF1 (WSROF1OE, AT3G25230), exhibited increased germination under salt stress, while rof1() knock out mutants and double mutants of ROF1 ROF2 (WSrof1()/2()) showed reduced germination under salt stress [70]. During heat stress response, although with high homology (85%), ROF1 and ROF2 play antagonistic role. ROF1 enhances the transcription activity of HsfA2, while ROF2 abrogates this activity, when co-expressed with ROF1. This result was in accordance with the phenotype observed in ROF1 over expressor plants and rof2 silenced plants: rof2 silenced plants increases thermotolerance similar to ROF1 overexpressors plants. A module was proposed in which ROF2 transcribed by HsfA2, contributes to acquired thermotolerance through its interaction with ROF1 and negatively modulates HsfA2 in a feedback mechanism [71]. Similarly, mammalian FKBP52 and FKBP51 (homologues of ROF1/ROF2), which share 75% sequence identity, were found to possess different functions [72,73]. In addition to thermotolerance, several findings indicated that HsfA2 participates in multiple stress responses. For example, Hsf was demonstrated to be related to oxidative stress [74]. HsfA1b was proved to participate in regulating the expression of APX2, which encodes an important cytosolic ascorbate peroxidase that can eliminate hydrogen peroxide in the cytosol [75], and HsfA4a has been identified as a potential sensor molecule involved in the perception of H2O2 in plants [76]. AtHsfA2 plays a vital role in oxidative stress responses [77]. High-level overexpression of the Arabidopsis HsfA2 gene leads to increased salt/osmotic stress tolerance and promotes callus growth [78]. In the OX_24h vs. OX_0h comparison in this study, FKBP65, a peptidyl-prolyl cis-trans isomerase encoded by FKBP65 (4327925) was down-regulated significantly both at protein and RNA level, but not in WT_24h vs. WT_0h and CR_24h vs. CR_0h comparison. Based on these, we boldly proposed that overexpression ZmPDI down-regulates peptidyl-prolyl cis-trans isomerase FKBP65, resulting in increased HsfA2, and then enhancing the salt tolerance.
The chitinases in plants are typically characterized by their endochitinase activity, which cleaves the chitin randomly [79]. Because chitin, the substrate of chitinase, is the main component of many fungal walls. Chitinases are frequently regarded as pathogenesis-related (PR) proteins, and their activity can be triggered by biotic stress, such as fungal, bacterial, and viral infections, and also by abiotic stress, such as wounding, salicylic acid, ethylene, auxins, and cytokinins, heavy metal, heat shock, UV light, salts and plant cell wall components [79,80,81,82]. Ectopic expression of a sugarcane chitinase gene, ScChi, promoted the growth of E. coli cells under NaCl, CuCl2, CdCl2 and ZnSO4 treatments [83]. Overexpression of pschit33, pschit42, and pschit33 X 42 from T. harzianum strain CECT2413 conferred transgenic tobacco with increased resistance to salt, Cu, and Cd stress. [84]. RNA-seq method profile revealed a significant up-regulation of Chitinase DEGs in Vicia faba salt-tolerance variety Y134 under salt treatment during the seed germination stage [85]. PR-3 and PR-4, two proteins that possess endochitinase activities in Arabidopsis, were reported to have contrary functions during seed germination. Under high salt stress, the pr-3 mutant exhibited an obvious decrease in the rate of seed germination. Similarly, PR4 overexpression transgenic seeds also displayed a significant reduction in germination percentage. Conversely, the rate of seed germination of pr-4 mutant was found to be marginally higher than that of control seeds when exposed to high NaCl [86]. Some chitinases in Ammopiptanthus nanus, such as EVM0022783, EVM0020238, and EVM0003645, exhibit significant upregulation in response to low temperature and osmotic pressure [87]. In this study, WIP3 (4350821), which was homologous to pathogenesis-related 4 in Arabidopsis, PR-4 type protein in grapevine, and chitinase33 in maize, was down-regulated significantly both at protein and RNA level in OX_24h vs. OX_0h comparison, but not in WT_24h vs. WT_0h and CR_24h vs. CR_0h comparison, indicated WIP3 is a negative factor of salt tolerance.
Suppression of the expression of GBSSI and GBSSII by salt stress resulted in the inhibition of granule-bound starch synthase (GBSS) activity and led to decreased starch content in rice leaves [88]. The salt-tolerant rice cultivar Pokkali, showed a notable increase in starch concentration under salt stress when compared to the salt-sensitive cultivar KDML 105 [89]. The transgenic OsCam1–1 over-expressing KDML105 rice exhibited a significant reduction in starch levels and improved maintenance of sucrose levels by up-regulating starch degradation genes and down-regulating several genes related to starch biosynthesis pathways [90]. Sucrose, can be cleaved to generate ADP-glucose or UDP-glucose, and is involved in starch polymerization [91], as well as in salt response by acting as an important compatible osmolyte [30]. The starch plastidial phosphorylase (Pho1) was reported to interact with OsDpe1 to form a protein complex and plays a vital role in the initiation of starch synthesis and the maturation of starch granules in developing rice seeds. The absence of Pho1 resulted in the accumulation of smaller starch granules and alterations in the amylopectin structure within rice endosperm [92,93]. STA4 encodes a plastidial phosphorylase, a mutation in STA4 led to significantly reduced starch content, causing an atypically shaped granules with structurally altered amylopectin and a high amylose content in the unicellular green alga Chlamydomonas reinhardtii [94]. Therefore, the starch plastidial phosphorylase (Pho1) may be involved in the salt response process by modulating the starch synthesis.
Calvin cycle is the essential process of photosynthetic carbon fixation in the chloroplast, generating glyceraldehyde-3-phosphate (G-3-P). G-3-P can be utilized for the synthesis of hexose sugars and subsequent production of starch. Thioredoxin F (Trx f1-2) is one of five types (Trx f, m, x, y, and z) Trx enzymes in chloroplasts. Trx F specifically or preferentially modulates the activity of all redox-sensitive enzymes involved in Calvin cycle, including 3-phosphoglycerate kinase (PGK), FBPase, sedoheptulose-1,7-bisphosphatase (SBPase), glyceraldehyde-3-phosphate dehydrogenase (GAPDH), and phosphoribulokinase (PRK) [95,96,97,98,99,100]. The introduction of TrxF1 enhanced enzymatic activity and promoted the growth of complemented strains of SBP/FBPase mutant strains [101]. Several TRXfs were reported to be down-regulated by salt stress. For example, TRXf expressing Arabidopsis thaliana exhibited a subtle inclination towards reduced expression in the response process to almost all stress, including salt stress [102]. Longer (3 days) periods of salt stress down-regulated the expression of TRXf in the leaves and roots of pea, whereas shorter periods (1 day) of salt stress up-regulated TRXf in the pea leaves [103]. Under a longer period (12 days) of salt stress, the expressions of PRXs and TRXf decreased in tomato leaves, although the protein level of TRXf was triggered by both salt and melatonin [104]. Loss-of-function of OsPDI rice mutant T3612 exhibited decreased activity of plastidial phosphorylase and pullulanase, along with an increase in soluble starch synthase I and ADP-glucose pyrophosphorylase, as well as small-size grains with a floury endosperm. However, the salt tolerance valuation of T3612 has not been conducted [105]. In our research, OsPho1 (plastidial phosphorylase 1) (4334171) and OsGBSSII (granule-bound starch synthase 1b) (4343010) were down-regulated after salt treatment in 3 comparisons, and their downregulation was more obvious in OX_24h vs. OX_0h comparison. TRXf1 (4324320) was down-regulated after salt treatment in OX_24h vs. OX_0h comparison but was slightly up-regulated in WT_24h vs. WT_0h and CR_24h vs. CR_0h comparisons. These results indicated that ZmPDI may suppress the OsPho1, TRXf1, and OsGBSSII activity and, therefore, suppress the starch synthesis to improve salt tolerance, but the mechanism remains unclear.
Aldo-keto reductase-domain (PF00248) containing proteins (AKRs), belongs to the oxidoreduction enzyme superfamilies that catalyze NAD(P)(H)-dependent reduction of various substrates. Owing to the broad substrate specificity, AKRs play a crucial role in various cellular processes, such as response to various electrophilic, osmotic, and oxidative stress, defending against the harmful effects of lipid peroxidation through the antioxidant pathway, and participating in the polyol pathway [106,107,108]. AKRs in all phyla are classified into multiple families (≥40% identity) and subfamilies (≥60% identity) [109]. Among them, the AKR4 family is exclusive to plants and associated with diverse functions such as detoxification of reactive aldehydes/ketones and xenobiotics and biosynthesis of isoflavonoids, morphine, cocaine, ascorbic acid, and metal chelators [106,107]. Many AKR4 genes exhibit inducibility under stress conditions and their overexpression confers tolerance against diverse stresses in transgenic plants [107].
It was reported that AKR4C members are involved in response to various environmental stress [110,111,112]. For instance, AKR4C1 enhanced desiccation tolerance in barley embryos [113]. AKR4C2 expression in Bromegrass cell cultures was induced by freezing tolerance [114]. AKR4C3 may be involved in protecting dormant seeds from damage caused by desiccation in wild oat seeds [115]. AKR4C4 from Xerophyta viscose, conferred desiccation intolerant mutant Escherichia coli strain with tolerance to water loss [116]. The AKR4C5 and AKR4C6 in Digitalis purpurea can metabolize steroids and sugars [117]. AKR4C8, AKR4C9, AKR4C10, and AKR4C11 in Arabidopsis, were reported to detoxify reactive aldehydes generated during stresses [110,111]. Enhanced freezing tolerance and regenerative capacity were observed in transgenic barley expressing the Arabidopsis AKR4C9 gene [112]. AKR4C14, AKR4C15, and OsI_04426 from the rice cultivar KDML105 were capable of metabolizing methylglyoxal (MG) and malondialdehyde (MDA) [118,119,120]. In our study, AKR4C10 (4338987) was down-regulated after salt treatment in 3 comparisons, its downregulation was more obvious in the OX_24h vs. OX_0h comparison. This result is contrary to the results in previous reports. The alignment of AKR4C10 and other AKR4C members showed many differences between the N-terminal AKR4C10 and other AKR4C members (Supplementary Figure S8), indicating that AKR4C10 may function quite differently from other known AKR4C members.

5. Conclusions

Our study proved that ZmPDI overexpression can significantly enhance the salt tolerance in rice, while loss-of-function of OsPDI reduces the salt tolerance. The combined analysis of the transcriptome and proteome revealed that ZmPDI may enhance the salt tolerance of rice by modulating laccase-6, zingipain-2, WIP3, FKBP65, AKR4C10, GBSSII, Pho1, and TRXf1. This study provides fundamental information for the molecular regulation mechanism by which ZmPDI improves salt tolerance.

Supplementary Materials

The following supporting information can be downloaded at: https://www.mdpi.com/article/10.3390/agriculture14040615/s1, Figure S1: Mutations of the target site in OsPDI knock-out transgenic plants; Figure S2: The relative expression levels of 5 random selected genes detected by qRT-PCR; Figure S3: TFs of DEGs in OX_24h vs. OX_0h (a), WT_24h vs. WT_0h (b) and CR_24h vs. CR_0h (c) comparison; Figure S4: GO (a), KEGG (b), IRP (c) and COG (d) annotation of identified proteins, and venn diagram of them; Figure S5: The volcano map of DEPs in DEGs in WT_24h vs. WT_0h (a), OX_24h vs. OX_0h (b), and CR_24h vs. CR_0h (c)comparison; Figure S6: The subcellular location of DEPs in WT_24h vs. WT_0h (a), OX_24h vs. OX_0h (b), and CR_24h vs. CR_0h (c) comparison; Figure S7: The enriched GO terms (a) and KEGG pathways (b) of DEGs with consistent tendency at RNA and protein level in 3 comparisons; Figure S8: The alignment result of AKR4C10 and several known AKR4C members. Table S1: Primers used in this study; Table S2: Summary of RNA-seq results; Table S3: Summary of the unique-mapped, multiple-mapped, and splice-mapped clean reads in RNA-seq results; Table S4: Summary of clean reads in RNA-seq results that mapped to exons, introns and intergenic regions of rice genome; Table S5: The significantly enriched GO terms of DEGs in 3 comparisons; Table S6: The significantly enriched KEGG pathways of DEGs in 3 comparisons; Table S7: The DEPs in 3 comparisons; Table S8: Top 20 enriched GO terms of DEPs in 3 comparisons; Table S9: All enriched GO terms of DEPs in 3 comparisons; Table S10: Top 20 enriched KEGG pathways of DEPs in 3 comparisons; Table S11: DEGs with same tendence at RNA and protein level in 3 comparisons and enriched GO terms and KEGG pathways; Table S12: DEGs with different regulation pattern in OX_24h vs. OX_0h and WT_24h vs. WT_0h; Table S13: DEGs with different regulation pattern in CR_24h vs. CR_0h and WT_24h vs. WT_0h.

Author Contributions

Conceptualization, R.C., J.W. and K.W.; methodology, R.C., J.W., K.W., Q.S., D.H. and L.L.; software, R.C., J.W., D.L., J.C. and K.W.; validation, H.G., J.Z., J.C. and J.L.; formal analysis, D.H., H.G., J.L., R.C., J.Z., J.C. and J.W.; investigation, R.C., J.W., Q.S. and K.W.; resources, J.C., J.L. and H.G.; data curation, R.C., J.W., D.H. and K.W.; writing—original draft preparation, R.C., J.W. and K.W.; writing—review and editing, R.C., J.W., H.G., J.L. and K.W.; visualization, R.C., J.W., K.W. and Q.S.; supervision, H.G., J.Z., J.C. and J.L.; project administration, H.G., J.Z., J.C. and J.L.; funding acquisition, R.C., D.H., H.G. and L.L. All authors have read and agreed to the published version of the manuscript.

Funding

This research was funded by the National Natural Science Foundation of China (Grant No. 32101429, 32102424 and 31672195), Natural Science Foundation of Jiangsu Province (Grant No. BK20200288 and BK20210162), the Program for Key Research and Development, Jiangsu, China (Grant No. BE2023356), the Jiangsu Provincial Double-Innovation Doctor Program (Grant No. JSSCBS20221643), and the Jiangsu Institute of Botany Talent Fund (Grant No. JIBTF202210).

Institutional Review Board Statement

Not applicable.

Data Availability Statement

The datasets presented in this study can be found in online repositories. The names of the repository/repositories and accession number(s) can be found in the article/Supplementary material.

Conflicts of Interest

The authors declare no conflicts of interest. The funders had no role in the design of the study; in the collection, analyses, or interpretation of data; in the writing of the manuscript; or in the decision to publish the results.

References

  1. Muchate, N.S.; Nikalje, G.C.; Rajurkar, N.S.; Suprasanna, P.; Nikam, T.D. Plant salt stress: Adaptive responses, tolerance mechanism and bioengineering for salt tolerance. Bot. Rev. 2016, 82, 371–406. [Google Scholar] [CrossRef]
  2. Zhao, C.; Zhang, H.; Song, C.; Zhu, J.K.; Shabala, S. Mechanisms of Plant Responses and Adaptation to Soil Salinity. Innovation 2020, 1, 100017. [Google Scholar] [CrossRef]
  3. Shi, H.; Ye, T.; Chan, Z. Comparative proteomic and physiological analyses reveal the protective effect of exogenous polyamines in the bermudagrass (Cynodon dactylon) response to salt and drought stresses. J. Proteome Res. 2013, 12, 4951–4964. [Google Scholar] [CrossRef]
  4. Li, S.; Chen, J.; Guo, H.; Zong, J.; Zhang, F.; Chu, X.; Jiang, Q.; Ding, W.; Liu, J. Salinity tolerance evaluation of Zoysia turfgrass germplasm. Acta Pratacult. Sin. 2012, 4, 43–51. [Google Scholar]
  5. Marcum, K.B.; Murdoch, C.L. Salinity tolerance mechanisms of six C4 turfgrasses. J. Am. Soc. Hortic. Sci. 1994, 119, 779–784. [Google Scholar] [CrossRef]
  6. Du, Y.; Hei, Q.; Liu, Y.; Zhang, H.; Xu, K.; Xia, T. Isolation and characterization of a putative vacuolar Na+/H+ antiporter gene from Zoysia japonica L. J. Plant Biol. 2010, 53, 251–258. [Google Scholar] [CrossRef]
  7. Teng, K.; Tan, P.; Guo, W.; Yue, Y.; Fan, X.; Wu, J. Heterologous expression of a novel Zoysia japonica C2H2 Zinc finger gene, ZjZFN1, improved salt tolerance in Arabidopsis. Front. Plant Sci. 2018, 9, 1159. [Google Scholar] [CrossRef]
  8. Teng, K.; Tan, P.; Xiao, G.; Han, L.; Chang, Z.; Chao, Y. Heterologous expression of a novel Zoysia japonica salt-induced glycine-rich RNA-binding protein gene, ZjGRP, caused salt sensitivity in Arabidopsis. Plant Cell Rep. 2017, 36, 179–191. [Google Scholar] [CrossRef]
  9. Guo, H.; Ding, W.; Chen, J.; Chen, X.; Zheng, Y.; Wang, Z.; Liu, J. Genetic linkage map construction and QTL mapping of salt tolerance traits in Zoysiagrass (Zoysia japonica). PLoS ONE 2014, 9, e107249. [Google Scholar] [CrossRef]
  10. Chen, Y.; Zong, J.; Tan, Z.; Li, L.; Hu, B.; Chen, C.; Chen, J.; Liu, J. Systematic mining of salt-tolerant genes in halophyte-Zoysia matrella through cDNA expression library screening. Plant Physiol. Biochem. 2015, 89, 44–52. [Google Scholar] [CrossRef]
  11. Xie, Q.; Niu, J.; Xu, X.; Xu, L.; Zhang, Y.; Fan, B.; Liang, X.; Zhang, L.; Yin, S.; Han, L. De novo assembly of the Japanese lawngrass (Zoysia japonica Steud.) root transcriptome and identification of candidate unigenes related to early responses under salt stress. Front. Plant Sci. 2015, 6, 610. [Google Scholar]
  12. Wang, J.; An, C.; Guo, H.; Yang, X.; Chen, J.; Zong, J.; Li, J.; Liu, J. Physiological and transcriptomic analyses reveal the mechanisms underlying the salt tolerance of Zoysia japonica Steud. BMC Plant Biol. 2020, 20, 114. [Google Scholar] [CrossRef]
  13. Ali Khan, H.; Mutus, B. Protein disulfide isomerase a multifunctional protein with multiple physiological roles. Front. Chem. 2014, 2, 70. [Google Scholar] [CrossRef]
  14. Wang, L.; Yu, J.; Wang, C.C. Protein disulfide isomerase is regulated in multiple ways: Consequences for conformation, activities, and pathophysiological functions. BioEssays 2020, 43, e2000147. [Google Scholar] [CrossRef]
  15. Yuen, C.Y.L.; Shek, R.; Kang, B.-H.; Matsumoto, K.; Cho, E.J.; Christopher, D.A. Arabidopsis protein disulfide isomerase-8 is a type I endoplasmic reticulum transmembrane protein with thiol-disulfide oxidase activity. BMC Plant Biol. 2016, 16, 181. [Google Scholar] [CrossRef]
  16. Lu, Y.; Yuan, L.; Zhou, Z.; Wang, M.; Wang, X.; Zhang, S.; Sun, Q. The thiol-disulfide exchange activity of AtPDI1 is involved in the response to abiotic stresses. BMC Plant Biol. 2021, 21, 557. [Google Scholar] [CrossRef]
  17. Zhang, Z.; Liu, X.; Li, R.; Yuan, L.; Dai, Y.; Wang, X. Identification and functional analysis of a protein disulfide isomerase (AtPDI1) in Arabidopsis thaliana. Front. Plant Sci. 2018, 9, 913. [Google Scholar] [CrossRef]
  18. Fan, F.; Zhang, Y.; Wang, S.; Han, Y.; Wang, L.; Lu, D. Characterization of the oxidative protein folding activity of a unique plant oxidoreductase, Arabidopsis protein disulfide isomerase-11. Biochem. Biophy. Res. Commun. 2018, 495, 1041–1047. [Google Scholar] [CrossRef]
  19. Tominaga, J.; Nakahara, Y.; Horikawa, D.; Tanaka, A.; Kondo, M.; Kamei, Y.; Takami, T.; Sakamoto, W.; Unno, K.; Sakamoto, A.; et al. Overexpression of the protein disulfide isomerase AtCYO1 in chloroplasts slows dark-induced senescence in Arabidopsis. BMC Plant Biol 2018, 18, 80. [Google Scholar] [CrossRef]
  20. Kayum, M.A.; Park, J.-I.; Nath, U.K.; Saha, G.; Biswas, M.K.; Kim, H.-T.; Nou, I.-S. Genome-wide characterization and expression profiling of PDI family gene reveals function as abiotic and biotic stress tolerance in Chinese cabbage (Brassica rapa ssp. pekinensis). BMC Genomics. 2017, 18, 885. [Google Scholar] [CrossRef]
  21. Ming, Q.; Wang, K.; Wang, J.; Liu, J.; Li, X.; Wei, P.; Guo, H.; Chen, J.; Zong, J. The combination of RNA-seq transcriptomics and data-independent acquisition proteomics reveals the mechanisms underlying enhanced salt tolerance by the ZmPDI gene in Zoysia matrella [L.] Merr. Front. Plant Sci. 2022, 13, 970651. [Google Scholar] [CrossRef]
  22. Wang, K.; Wang, Y.; Qu, A.; Wang, R.; Guo, H.; Li, X.; She, J.; Zong, J.; Li, J.; Liu, J. Establishment of genetic transformation system for Zoysia matrella. Chin. J. Tropical Crops. 2020, 41, 1566–1573. [Google Scholar]
  23. Kim, D.; Langmead, B.; Salzberg, S.L. HISAT: A fast spliced aligner with low memory requirements. Nat. Methods 2015, 12, 357–360. [Google Scholar] [CrossRef]
  24. Garber, M.; Grabherr, M.G.; Guttman, M.; Trapnell, C. Computational methods for transcriptome annotation and quantification using RNA-seq. Nat. Methods 2011, 8, 469–477. [Google Scholar] [CrossRef]
  25. Love, M.I.; Huber, W.; Anders, S. Moderated estimation of fold change and dispersion for RNA-seq data with DESeq2. Genome Biol. 2014, 15, 550. [Google Scholar] [CrossRef]
  26. Yu, G.; Wang, L.G.; Han, Y.; He, Q.Y. ClusterProfiler: An R Package for comparing biological themes among gene clusters. OMICS 2012, 16, 284–287. [Google Scholar] [CrossRef]
  27. Jones, P.; Binns, D.; Chang, H.Y.; Fraser, M.; Li, W.; McAnulla, C.; McWilliam, H.; Maslen, J.; Mitchell, A.; Nuka, G.; et al. InterProScan 5: Genome-scale protein function classification. Bioinformatics 2014, 30, 1236–1240. [Google Scholar] [CrossRef]
  28. Yang, Y.; Xiong, J.; Chen, R.; Fu, G.; Chen, T.; Tao, L. Excessive nitrate enhances cadmium (Cd) uptake by up-regulating the expression of OsIRT1 in rice (Oryza sativa). Environ. Exp. Bot. 2016, 122, 141–149. [Google Scholar] [CrossRef]
  29. Liang, W.; Ma, X.; Wan, P.; Liu, L. Plant salt-tolerance mechanism: A review. Biochem. Biophy. Res. Commun. 2018, 495, 286–291. [Google Scholar] [CrossRef]
  30. Pommerrenig, B.; Papini-Terzi, F.S.; Sauer, N. Differential regulation of sorbitol and sucrose loading into the phloem of plantago major in response to salt stress. Plant Physiol. 2007, 144, 1029–1038. [Google Scholar] [CrossRef] [PubMed]
  31. Henry, C.; Bledsoe, S.W.; Griffiths, C.A.; Kollman, A.; Paul, M.J.; Sakr, S.; Lagrimini, L.M. Differential role for trehalose metabolism in salt-stressed maize. Plant Physiol. 2015, 169, 1072–1089. [Google Scholar] [CrossRef] [PubMed]
  32. Munns, R. Comparative physiology of salt and water stress. Plant Cell Environ. 2002, 25, 239–250. [Google Scholar] [CrossRef] [PubMed]
  33. Mansour, M.M.F.; Ali, E.F. Evaluation of proline functions in saline conditions. Phytochemistry 2017, 140, 52–68. [Google Scholar] [CrossRef] [PubMed]
  34. Verbruggen, N.; Hermans, C. Proline accumulation in plants: A review. Amino Acids 2008, 35, 753–759. [Google Scholar] [CrossRef] [PubMed]
  35. Dhindsa, R.S.; Plumb-Dhiiidsa, P.L.; Reid, D.M. Leaf senescence and lipid peroxidation: Effects of some phytohormones, and scavengers of free radicals and singlet oxygen. Physiol. Plantarum. 1982, 56, 453–457. [Google Scholar] [CrossRef]
  36. Stadtman, E.R. Protein oxidation and aging. Science 1992, 257, 1220–1224. [Google Scholar] [CrossRef] [PubMed]
  37. Vaidyanathan, H.; Sivakumar, P.; Chakrabarty, R.; Thomas, G. Scavenging of reactive oxygen species in NaCl-stressed rice (Oryza sativa L.)—Differential response in salt-tolerant and sensitive varieties. Plant Sci. 2003, 165, 1411–1418. [Google Scholar] [CrossRef]
  38. Barros, J.; Serk, H.; Granlund, I.; Pesquet, E. The cell biology of lignification in higher plants. Ann. Bot. 2015, 115, 1053–1074. [Google Scholar] [CrossRef]
  39. Liu, Q.; Luo, L.; Wang, X.; Shen, Z.; Zheng, L. Comprehensive analysis of rice laccase gene (OsLAC) family and ectopic expression of OsLAC10 enhances tolerance to copper stress in Arabidopsis. Int. J. Mol. Sci. 2017, 18, 209. [Google Scholar] [CrossRef]
  40. Liu, M.; Dong, H.; Wang, M.; Liu, Q. Evolutionary divergence of function and expression of laccase genes in plants. J. Genet. 2020, 99, 23. [Google Scholar] [CrossRef]
  41. Zhao, Y.; Lin, S.; Qiu, Z.; Cao, D.; Wen, J.; Deng, X.; Wang, X.; Lin, J.; Li, X. MicroRNA857 is involved in the regulation of secondary growth of vascular tissues in Arabidopsis. Plant Physiol. 2015, 169, 2539–2552. [Google Scholar] [CrossRef]
  42. Qin, R.; Hu, Y.; Chen, H.; Du, Q.; Yang, J.; Li, W.X. MicroRNA408 negatively regulates salt tolerance by affecting secondary cell wall development in maize. Plant Physiol. 2023, 192, 1569–1583. [Google Scholar] [CrossRef]
  43. Wang, W.; Zhou, X.M.; Xiong, H.X.; Mao, W.Y.; Zhao, P.; Sun, M.X. Papain-like and legumain-like proteases in rice: Genome-wide identification, comprehensive gene feature characterization and expression analysis. BMC Plant Biol. 2018, 18, 87. [Google Scholar] [CrossRef] [PubMed]
  44. Han, J.; Li, H.; Yin, B.; Zhang, Y.; Liu, Y.; Cheng, Z.; Liu, D.; Lu, H. The papain-like cysteine protease CEP1 is involved in programmed cell death and secondary wall thickening during xylem development in Arabidopsis. J. Exp. Bot. 2019, 70, 205–215. [Google Scholar] [CrossRef]
  45. Shukla, P.; Gautam, R.; Singh, N.K.; Ahmed, I.; Kirti, P.B. A proteomic study of cysteine protease induced cell death in anthers of male sterile tobacco transgenic plants. Physiol. Mol. Biol. Plants 2019, 25, 1073–1082. [Google Scholar] [CrossRef]
  46. Niño, M.C.; Kang, K.K.; Cho, Y.-G. Genome-wide transcriptional response of papain-like cysteine protease-mediated resistance against Xanthomonas oryzae pv. oryzae in rice. Plant Cell Rep. 2020, 39, 457–472. [Google Scholar] [CrossRef] [PubMed]
  47. Pechan, T.; Ye, L.; Chang, Y.M.; Mitra, A.; Lin, L.; Davis, F.M.; Williams, W.P.; Luthe, D.S. A unique 33-kD cysteine proteinase accumulates in response to larval feeding in maize genotypes resistant to fall armyworm and other Lepidoptera. Plant Cell 2000, 12, 1031–1040. [Google Scholar] [CrossRef] [PubMed]
  48. Khanna-Chopra, R.; Srivalli, B.; Ahlawat, Y.S. Drought induces many forms of cysteine proteases not observed during natural senescence. Biochem. Biophy. Res. Commun. 1999, 255, 324–327. [Google Scholar] [CrossRef]
  49. Lu, H.; Chandrasekar, B.; Oeljeklaus, J.; Misas-Villamil, J.C.; Wang, Z.; Shindo, T.; Bogyo, M.; Kaiser, M.; Van der Hoorn, R.A.L. Subfamily-specific fluorescent probes for cysteine proteases display dynamic protease activities during seed germination. Plant Physiol. 2015, 168, 1462–1475. [Google Scholar] [CrossRef]
  50. Martinez, M.; Cambra, I.; Carrillo, L.; Diaz-Mendoza, M.; Diaz, I. Characterization of the entire cystatin gene family in barley and their target cathepsin L-like cysteine-proteases, partners in the hordein mobilization during seed germination. Plant Physiol. 2009, 151, 1531–1545. [Google Scholar] [CrossRef]
  51. Kiyosaki, T.; Matsumoto, I.; Asakura, T.; Funaki, J.; Kuroda, M.; Misaka, T.; Arai, S.; Abe, K. Gliadain, a gibberellin-inducible cysteine proteinase occurring in germinating seeds of wheat, Triticum aestivum L., specifically digests gliadin and is regulated by intrinsic cystatins. FEBS J. 2007, 274, 1908–1917. [Google Scholar] [CrossRef]
  52. Zhang, X.M.; Wang, Y.; Lv, X.M.; Li, H.; Sun, P.; Lu, H.; Li, F.L. NtCP56, a new cysteine protease in Nicotiana tabacum L., involved in pollen grain development. J. Exp. Bot. 2009, 60, 1569–1577. [Google Scholar] [CrossRef] [PubMed]
  53. Zhang, D.; Liu, D.; Lv, X.; Wang, Y.; Xun, Z.; Liu, Z.; Li, F.; Lu, H. The cysteine protease CEP1, a key executor involved in tapetal programmed cell death, regulates pollen development in Arabidopsis. Plant Cell 2014, 26, 2939–2961. [Google Scholar] [CrossRef]
  54. Li, N.; Zhang, D.S.; Liu, H.S.; Yin, C.S.; Li, X.-X.; Liang, W.Q.; Yuan, Z.; Xu, B.; Chu, H.W.; Wang, J.; et al. The rice tapetum degeneration retardation gene is required for tapetum degradation and anther development. Plant Cell 2006, 18, 2999–3014. [Google Scholar] [CrossRef]
  55. Li, Y.; Suen, D.F.; Huang, C.Y.; Kung, S.Y.; Huang, A.H.C. The maize tapetum employs diverse mechanisms to synthesize and store proteins and flavonoids and transfer them to the pollen surface. Plant Physiol. 2012, 158, 1548–1561. [Google Scholar] [CrossRef]
  56. Koizumi, M.; Yamaguchi-Shinozaki, K.; Tsuji, H.; Shinozaki, K. Structure and expression of two genes that encode distinct drought-inducible cysteine proteinases in Arabidopsis thaliana. Gene 1993, 129, 175–182. [Google Scholar] [CrossRef] [PubMed]
  57. Jones, J.T.; Mullet, J.E. A salt- and dehydration-inducible pea gene, Cyp15a, encodes a cell-wall protein with sequence similarity to cysteine proteases. Plant Mol. Biol. 1995, 28, 1055–1065. [Google Scholar] [CrossRef]
  58. Zang, Q.W.; Wang, C.X.; Li, X.Y.; Guo, Z.A.; Jing, R.L.; Zhao, J.; Chang, X.P. Isolation and characterization of a gene encoding a polyethylene glycol-induced cysteine protease in common wheat. J. Biosci. 2010, 35, 379–388. [Google Scholar] [CrossRef]
  59. Zhou, L.; Li, M.; Du, Q.; Yang, S.; Li, J.; Fan, Y.; Mao, K.; Zhang, J.; Xiao, H.; Wang, J. Genome-wide identification of PLCPs in pepper and the functional characterization of CaCP34 in resistance to salt- and osmotic-induced leaf senescence. Sci. Horticult. 2023, 309, 111624. [Google Scholar] [CrossRef]
  60. Zhou, L.; Yang, S.; Chen, C.; Li, M.; Du, Q.; Wang, J.; Yin, Y.; Xiao, H. CaCP15 gene negatively regulates salt and osmotic stress responses in Capsicum annuum L. Genes 2023, 14, 1409. [Google Scholar] [CrossRef]
  61. Vasudevan, D.; Gopalan, G.; Kumar, A.; Garcia, V.J.; Luan, S.; Swaminathan, K. Plant immunophilins: A review of their structure-function relationship. Biochim. Biophys. Acta 2015, 1850, 2145–2158. [Google Scholar] [CrossRef]
  62. Yang, D.; Li, Y.; Zhu, M.; Cui, R.; Gao, J.; Shu, Y.; Lu, X.; Zhang, H.; Zhang, K. Genome-wide identification and expression analysis of the cucumber FKBP gene family in response to abiotic and biotic stresses. Genes 2023, 14, 2006. [Google Scholar] [CrossRef]
  63. He, Z.; Li, L.; Luan, S. Immunophilins and parvulins. superfamily of peptidyl prolyl isomerases in Arabidopsis. Plant Physiol. 2004, 134, 1248–1267. [Google Scholar] [CrossRef]
  64. Yu, Y.; Zhang, H.; Li, W.; Mu, C.; Zhang, F.; Wang, L.; Meng, Z. Genome-wide analysis and environmental response profiling of the FK506-binding protein gene family in maize (Zea mays L.). Gene 2012, 498, 212–222. [Google Scholar] [CrossRef]
  65. Gollan, P.J.; Bhave, M. Genome-wide analysis of genes encoding FK506-binding proteins in rice. Plant Mol. Biol. 2010, 72, 1–16. [Google Scholar] [CrossRef]
  66. Gollan, P.J.; Bhave, M.; Aro, E.M. The FKBP families of higher plants: Exploring the structures and functions of protein interaction specialists. FEBS Lett. 2012, 586, 3539–3547. [Google Scholar] [CrossRef]
  67. Alavilli, H.; Lee, H.; Park, M.; Yun, D.J.; Lee, B.-H. Enhanced multiple stress tolerance in Arabidopsis by overexpression of the polar moss peptidyl prolyl isomerase FKBP12 gene. Plant Cell Rep. 2017, 37, 453–465. [Google Scholar] [CrossRef]
  68. Subin, C.S.; Pradeep, M.A.; Vijayan, K.K. FKBP-type peptidyl-prolyl cis-trans isomerase from thermophilic microalga, Scenedesmus sp.: Molecular characterisation and demonstration of acquired salinity and thermotolerance in E. coli by recombinant expression. J. Appl. Phycol. 2016, 28, 3307–3315. [Google Scholar] [CrossRef]
  69. Cheung, M.Y.; Auyeung, W.-K.; Li, K.P.; Lam, H.M. A rice immunophilin homolog, OsFKBP12, is a negative regulator of both biotic and abiotic stress responses. Int. J. Mol. Sci. 2020, 21, 8791. [Google Scholar] [CrossRef]
  70. Yang, H.; Karali, D.; Oxley, D.; Runions, J.; Ktistakis, N.; Farmaki, T. The Arabidopsis thaliana immunophilin ROF1 directly interacts with PI(3)P and PI(3,5)P2 and affects germination under osmotic stress. PLoS ONE 2012, 7, e48241. [Google Scholar]
  71. Meiri, D.; Tazat, K.; Cohen-Peer, R.; Farchi-Pisanty, O.; Aviezer-Hagai, K.; Avni, A.; Breiman, A. Involvement of Arabidopsis ROF2 (FKBP65) in thermotolerance. Plant Mol. Biol. 2009, 72, 191–203. [Google Scholar] [CrossRef]
  72. Smith, D.F.; Toft, D.O. Minireview: The intersection of steroid receptors with molecular chaperones: Observations and questions. Mol. Endocrinol. 2008, 22, 2229–2240. [Google Scholar] [CrossRef]
  73. Pratt, W.B.; Toft, D.O. Steroid receptor interactions with heat shock protein and immunophilin chaperones. Endocr. Rev. 1997, 18, 306–360. [Google Scholar]
  74. Miller, G.A.D.; Mittler, R.O.N. Could heat shock transcription factors function as hydrogen peroxide sensors in plants? Ann. Bot. 2006, 98, 279–288. [Google Scholar] [CrossRef]
  75. Panchuk, I.I.; Volkov, R.A.; Schöffl, F. Heat stress- and heat shock transcription factor-dependent expression and activity of ascorbate peroxidase in Arabidopsis. Plant Physiol. 2002, 129, 838–853. [Google Scholar] [CrossRef]
  76. Davletova, S.; Rizhsky, L.; Liang, H.; Shengqiang, Z.; Oliver, D.J.; Coutu, J.; Shulaev, V.; Schlauch, K.; Mittler, R. Cytosolic ascorbate peroxidase 1 is a central component of the reactive oxygen gene network of Arabidopsis. Plant Cell 2005, 17, 268–281. [Google Scholar] [CrossRef]
  77. Li, C.; Chen, Q.; Gao, X.; Qi, B.; Chen, N.; Xu, S.; Chen, J.; Wang, X. AtHsfA2 modulates expression of stress responsive genes and enhances tolerance to heat and oxidative stress in Arabidopsis. Sci. China Ser. C 2005, 48, 540–550. [Google Scholar] [CrossRef]
  78. Ogawa, D.; Yamaguchi, K.; Nishiuchi, T. High-level overexpression of the Arabidopsis HsfA2 gene confers not only increased themotolerance but also salt/osmotic stress tolerance and enhanced callus growth. J. Exp. Bot. 2007, 58, 3373–3383. [Google Scholar] [CrossRef]
  79. Vaghela, B.; Vashi, R.; Rajput, K.; Joshi, R. Plant chitinases and their role in plant defense: A comprehensive review. Enzyme Microl. Technol. 2022, 159, 110055. [Google Scholar] [CrossRef]
  80. Bravo, J.M.; Campo, S.; Murillo, I.; Coca, M.I.; Segundo, B.S. Fungus- and wound-induced accumulation of mRNA containing a class II chitinase of the pathogenesis-related protein 4 (PR-4) family of maize. Plant Mol. Biol. 2003, 52, 745–759. [Google Scholar] [CrossRef]
  81. Bokmaa, E.; Barends, T.; Terwisscha van Scheltingab, A.C.; Dijkstrab, B.W.; Beintema, J.J. Enzyme kinetics of hevamine, a chitinase from the rubber tree Hevea brasiliensis. FEBS Lett. 2000, 478, 119–122. [Google Scholar] [CrossRef] [PubMed]
  82. Passarinho, P.A.; de Vries, S.C. Arabidopsis chitinases: A genomic survey. Arab. Book 2002, 1, e0023. [Google Scholar] [CrossRef] [PubMed]
  83. Su, Y.; Xu, L.; Fu, Z.; Yang, Y.; Guo, J.; Wang, S.; Que, Y. ScChi, encoding an acidic class III chitinase of sugarcane, confers positive responses to biotic and abiotic stresses in sugarcane. Int. J. Mol. Sci. 2014, 15, 2738–2760. [Google Scholar] [CrossRef] [PubMed]
  84. Dana, M.d.l.M.; Pintor-Toro, J.A.; Cubero, B. Transgenic tobacco plants overexpressing chitinases of fungal origin show enhanced resistance to biotic and abiotic stress agents. Plant Physiol. 2006, 142, 722–730. [Google Scholar] [CrossRef] [PubMed]
  85. Yang, F.; Chen, H.; Liu, C.; Li, L.; Liu, L.; Han, X.; Wan, Z.; Sha, A. Transcriptome profile analysis of two Vicia faba cultivars with contrasting salinity tolerance during seed germination. Sci. Rep. 2020, 10, 7250. [Google Scholar] [CrossRef] [PubMed]
  86. Seo, P.J.; Lee, A.K.; Xiang, F.; Park, C.M. Molecular and functional profiling of Arabidopsis pathogenesis-related genes: Insights into their roles in salt response of seed germination. Plant Cell Physiol. 2008, 49, 334–344. [Google Scholar] [CrossRef] [PubMed]
  87. Cao, Y.; Wang, Y.; Li, Z.; Shi, W.; Gao, F.; Zhou, Y.; Zhang, G.; Feng, J. Genome-wide identification and expression analyses of the chitinases under cold and osmotic stress in Ammopiptanthus nanus. Genes 2019, 10, 472. [Google Scholar] [CrossRef]
  88. Chen, H.J.; Chen, J.Y.; Wang, S.J. Molecular regulation of starch accumulation in rice seedling leaves in response to salt stress. Acta Physiol. Plant. 2007, 30, 135–142. [Google Scholar] [CrossRef]
  89. Pattanagul, W.; Thitisaksakul, M. Effect of salinity stress on growth and carbohydrate metabolism in three rice (Oryza sativa L.) cultivars differing in salinity tolerance. Indian J. Exp. Biol. 2008, 46, 736–742. [Google Scholar]
  90. Yuenyong, W.; Chinpongpanich, A.; Comai, L.; Chadchawan, S.; Buaboocha, T. Downstream components of the calmodulin signaling pathway in the rice salt stress response revealed by transcriptome profiling and target identification. BMC Plant Biol. 2018, 18, 335. [Google Scholar] [CrossRef]
  91. Baroja-Fernández, E.; Francisco José Muñoz, T.S.; Rodríguez-López, M.; Akazawa, T.; Pozueta-Romero, J. Sucrose synthase catalyzes the de novo production of ADPglucose linked to starch biosynthesis in heterotrophic tissues of plants. Plant Cell Physiol. 2003, 44, 500–509. [Google Scholar] [CrossRef] [PubMed]
  92. Hwang, S.K.; Koper, K.; Satoh, H.; Okita, T.W. Rice endosperm starch phosphorylase (Pho1) assembles with disproportionating enzyme (Dpe1) to form a protein complex that enhances synthesis of malto-oligosaccharides. J. Biol. Chem. 2016, 291, 19994–20007. [Google Scholar] [CrossRef] [PubMed]
  93. Satoh, H.; Shibahara, K.; Tokunaga, T.; Nishi, A.; Tasaki, M.; Hwang, S.K.; Okita, T.W.; Kaneko, N.; Fujita, N.; Yoshida, M.; et al. Mutation of the plastidial alpha-glucan phosphorylase gene in rice affects the synthesis and structure of starch in the endosperm. Plant Cell 2008, 20, 1833–1849. [Google Scholar] [CrossRef] [PubMed]
  94. Dauvillee, D.; Chochois, V.; Steup, M.; Haebel, S.; Eckermann, N.; Ritte, G.; Ral, J.P.; Colleoni, C.; Hicks, G.; Wattebled, F.; et al. Plastidial phosphorylase is required for normal starch synthesis in Chlamydomonas reinhardtii. Plant J. 2006, 48, 274–285. [Google Scholar] [CrossRef] [PubMed]
  95. Lemaire, S.D.; Michelet, L.; Zaffagnini, M.; Massot, V.; Issakidis-Bourguet, E. Thioredoxins in chloroplasts. Curr. Genet. 2007, 51, 343–365. [Google Scholar] [CrossRef] [PubMed]
  96. Balsera, M.; Uberegui, E.; Schürmann, P.; Buchanan, B.B. Evolutionary development of redox regulation in chloroplasts. Antioxid. Redox. Sign. 2014, 21, 1327–1355. [Google Scholar] [CrossRef] [PubMed]
  97. Michelet, L.; Zaffagnini, M.; Morisse, S.; Sparla, F.; Perez-Perez, M.E.; Francia, F.; Danon, A.; Marchand, C.H.; Fermani, S.; Trost, P.; et al. Redox regulation of the Calvin-Benson cycle: Something old, something new. Front. Plant Sci. 2013, 4, 470. [Google Scholar] [CrossRef] [PubMed]
  98. Lemaire, S.D.; Tedesco, D.; Crozet, P.; Michelet, L.; Fermani, S.; Zaffagnini, M.; Henri, J. Crystal structure of chloroplastic thioredoxin f2 from Chlamydomonas reinhardtii reveals distinct surface properties. Antioxidants 2018, 7, 171. [Google Scholar] [CrossRef]
  99. Née, G.; Zaffagnini, M.; Trost, P.; Issakidis-Bourguet, E. Redox regulation of chloroplastic glucose-6-phosphate dehydrogenase: A new role for f-type thioredoxin. FEBS Lett. 2009, 583, 2827–2832. [Google Scholar] [CrossRef]
  100. Kang, Z.; Qin, T.; Zhao, Z. Thioredoxins and thioredoxin reductase in chloroplasts: A review. Gene 2019, 706, 32–42. [Google Scholar] [CrossRef]
  101. Garcia-Canas, R.; Florencio, F.J.; Lopez-Maury, L. Back to the future: Transplanting the chloroplast TrxF-FBPase-SBPase redox system to cyanobacteria. Front. Plant Sci. 2022, 13, 1052019. [Google Scholar] [CrossRef] [PubMed]
  102. Belin, C.; Bashandy, T.; Cela, J.; Delorme-Hinoux, V.; Riondet, C.; Reichheld, J.P. A comprehensive study of thiol reduction gene expression under stress conditions in Arabidopsis thaliana. Plant Cell Environ. 2015, 38, 299–314. [Google Scholar] [CrossRef]
  103. Fernandez-Trijueque, J.; Barajas-Lopez Jde, D.; Chueca, A.; Cazalis, R.; Sahrawy, M.; Serrato, A.J. Plastid thioredoxins f and m are related to the developing and salinity response of post-germinating seeds of Pisum sativum. Plant Sci 2012, 188–189, 82–88. [Google Scholar] [CrossRef] [PubMed]
  104. Zhou, X.; Zhao, H.; Cao, K.; Hu, L.; Du, T.; Baluska, F.; Zou, Z. Beneficial roles of melatonin on redox regulation of photosynthetic electron transport and synthesis of D1 protein in tomato seedlings under salt stress. Front. Plant Sci. 2016, 7, 1823. [Google Scholar] [CrossRef]
  105. Han, X.; Wang, Y.; Liu, X.; Jiang, L.; Ren, Y.; Liu, F.; Peng, C.; Li, J.; Jin, X.; Wu, F.; et al. The failure to express a protein disulphide isomerase-like protein results in a floury endosperm and an endoplasmic reticulum stress response in rice. J. Exp. Bot. 2012, 63, 121–130. [Google Scholar] [CrossRef]
  106. Krishnamurthy, P.; Pothiraj, R.; Suthanthiram, B.; Somasundaram, S.M.; Subbaraya, U. Phylogenomic classification and synteny network analyses deciphered the evolutionary landscape of aldo-keto reductase (AKR) gene superfamily in the plant kingdom. Gene 2022, 816, 146169. [Google Scholar] [CrossRef]
  107. Sengupta, D.; Naik, D.; Reddy, A.R. Plant aldo-keto reductases (AKRs) as multi-tasking soldiers involved in diverse plant metabolic processes and stress defense: A structure-function update. J. Plant Physiol. 2015, 179, 40–55. [Google Scholar] [CrossRef] [PubMed]
  108. Yu, J.; Sun, H.; Zhang, J.; Hou, Y.; Zhang, T.; Kang, J.; Wang, Z.; Yang, Q.; Long, R. Analysis of aldo-keto reductase gene family and their responses to salt, drought, and abscisic acid stresses in Medicago truncatula. Int. J. Mol. Sci. 2020, 21, 754. [Google Scholar] [CrossRef]
  109. Penning, T.M. The aldo-keto reductases (AKRs): Overview. Chem. Biol. Interact. 2015, 234, 236–246. [Google Scholar] [CrossRef]
  110. Simpson, P.J.; Tantitadapitak, C.; Reed, A.M.; Mather, O.C.; Bunce, C.M.; White, S.A.; Ride, J.P. Characterization of two novel aldo-keto reductases from Arabidopsis: Expression patterns, broad substrate specificity, and an open active-site structure suggest a role in toxicant metabolism following stress. J. Mol. Biol. 2009, 392, 465–480. [Google Scholar] [CrossRef]
  111. Saito, R.; Shimakawa, G.; Nishi, A.; Iwamoto, T.; Sakamoto, K.; Yamamoto, H.; Amako, K.; Makino, A.; Miyake, C. Functional analysis of the AKR4C subfamily of Arabidopsis thaliana: Model structures, substrate specificity, acrolein toxicity, and responses to light and [CO2]. Biosci. Biotech. Bioch. 2014, 77, 2038–2045. [Google Scholar] [CrossRef]
  112. Éva, C.; Zelenyánszki, H.; Tömösközi-Farkas, R.; Tamás, L. Transgenic barley expressing the Arabidopsis AKR4C9 aldo-keto reductase enzyme exhibits enhanced freezing tolerance and regenerative capacity. S. Afr. J. Bot. 2014, 93, 179–184. [Google Scholar] [CrossRef]
  113. Bartels, D.; Engelhardt, K.; Roncarati, R.; Schneider, K.; Rotter, M.; Salamini, F. An ABA and GA modulated gene expressed in the barley embryo encodes an aldose reductase related protein. EMBO J. 1991, 10, 1037–1043. [Google Scholar] [CrossRef]
  114. Lee, S.P.; Chen, T.H.H. Molecular cloning of abscisic acid-responsive mRNAs expressed during the induction of freezing tolerance in bromegrass (Bromus inermis Leyss) suspension culture. Plant Physiol. 1993, 101, 1089–1096. [Google Scholar] [CrossRef] [PubMed]
  115. Li, B.; Foley, M.E. Cloning and characterization of differentially expressed genes in imbibed dormant and afterripened Avena fatua embryos. Plant Mol. Biol. 1995, 29, 823–831. [Google Scholar] [CrossRef]
  116. Mundree, S.G.; Whittaker, A.; Thomson, J.A.; Farrant, J.M. An aldose reductase homolog from the resurrection plant Xerophyta viscosa Baker. Planta 2000, 211, 693–700. [Google Scholar] [CrossRef] [PubMed]
  117. Gavidia, I.; Perez-Bermudez, P.; Seitz, H.U. Cloning and expression of two novel aldo-keto reductases from Digitalis purpurea leaves. Eur. J. Biochem. 2002, 269, 2842–2850. [Google Scholar] [CrossRef]
  118. Songsiriritthigul, C.; Narawongsanont, R.; Tantitadapitak, C.; Guan, H.H.; Chen, C.J. Structure-function study of AKR4C14, an aldo-keto reductase from Thai jasmine rice (Oryza sativa L. ssp. indica cv. KDML105). Acta Crystallogr. Sect. D Struct. Biol. 2020, 76, 472–483. [Google Scholar] [CrossRef]
  119. Narawongsanont, R.; Kabinpong, S.; Auiyawong, B.; Tantitadapitak, C. Cloning and characterization of AKR4C14, a rice aldo-keto reductase, from Thai Jasmine rice. Protein J. 2012, 31, 35–42. [Google Scholar] [CrossRef]
  120. Auiyawong, B.; Narawongsanont, R.; Tantitadapitak, C. Characterization of AKR4C15, a novel member of aldo-keto reductase, in comparison with other rice AKR(s). Protein J. 2017, 36, 257–269. [Google Scholar] [CrossRef]
Figure 1. Phenotypic and physiological responses to salt stress in OX-ZmPDI transgenic plants, OsPDI knock-out transgenic plants, and Wild Type plants. OX-ZmPDI transgenic plants, OsPDI knock-out transgenic plants, and Wild Type plants were exposed to 200 mM NaCl (a) and control (CK) treatments (b) for 15 days. The plant height (c), main root length (d), proline contents (e), malondialdehyde (MDA) contents (f), and peroxidase (POD) activity (g) of OX-ZmPDI transgenic plants, OsPDI knock-out transgenic plants and Wild Type plants after NaCl and CK treatments for 15 days. Values are presented as the mean ± SE. At least 5 individual plants of each line were measured in (c,d). Three replicates per line were performed in (eg), and each replicate consisted of at least 3 individual plants. The data of each line were analyzed by One Way ANOVA. Letters above the bars indicate significant differences between the respective values (p < 0.05). CR2, 3, and 8 indicate three OsPDI knock-out transgenic lines, OX1, 3, and 7 indicate OX-ZmPDI transgenic lines, and WT indicates wild-type plants.
Agriculture 14 00615 g001
Figure 2. The DEGs in WT_24h vs. WT_0h, OX_24h vs. OX_0h, and CR_24h vs. CR_0h comparison. (a) number of DEGs in each comparison; (b) the number of common DEGs between each two comparisons. CR indicates OsPDI knock-out transgenic lines, OX indicates OX-ZmPDI transgenic lines, and WT indicates wild-type plants.
Agriculture 14 00615 g002
Figure 3. The 30 GO terms (ac) and top 20 KEGG pathways (df) of DEGs in OX_24h vs. OX_0h (a,d), CR_24h vs. CR_0h (b,e) and WT_24h vs. WT_0h (c,f) comparison. CR indicates OsPDI knock-out transgenic lines, OX indicates OX-ZmPDI transgenic lines, and WT indicates wild-type plants.
Agriculture 14 00615 g003
Figure 4. The number of DEPs (a) and enriched GO terms of DEPs in OX_24h vs. OX_0h (b) and CR_24h vs. CR_0h (c) and WT_24h vs. WT_0h (d) comparison. CR indicates OsPDI knock-out transgenic lines, OX indicates OX-ZmPDI transgenic lines, and WT indicates wild-type plants.
Agriculture 14 00615 g004
Figure 5. The enriched top 20 KEGG pathways of DEPs in OX_24h vs. OX_0h (a) and WT_24h vs. WT_0h (b) and CR_24h vs. CR_0h (c) comparison. CR indicates OsPDI knock-out transgenic lines, OX indicates OX-ZmPDI transgenic lines, and WT indicates wild-type plants.
Agriculture 14 00615 g005
Figure 6. Combined analysis (ac) DEGs both at RNA and protein level. (d) DEGs with a consistent tendency at RNA and protein levels. CR indicates OsPDI knock-out transgenic lines, OX indicates OX-ZmPDI transgenic lines, and WT indicates wild-type plants.
Agriculture 14 00615 g006
Table 1. Information of 8 selected putative target genes.
GeneIDProteinIDRNA-seqProteome
log2
FC(WT_24h/0h)
log2
FC(OX_24h/0h)
log2
FC(CR_24h/0h)
log2
[FC(OX_24h/0h)/FC(CK_24h/0h)]
log2
[FC(CR_24h/0h)/FC(CK_24h/0h)]
log2
FC(WT_24h/0h)
log2
FC(OX_24h/0h)
log2
FC(CR_24h/0h)
log2
[FC(OX_24h/0h)/FC(CK_24h/0h)]
log2
[FC(CR_24h/0h)/FC(CK_24h/0h)]
Gene NameDescription
4324320XP_015616604.10.3001627−0.966663−0.633929656−1.26683−0.934090.312297−0.719090.05656−1.03139−0.25574TRXf1thioredoxin F, chloroplastic-like
4327925XP_015621254.10.3169881−1.860921−1.994143945−2.17791−2.311130.13762−1.00638−0.37458−1.144−0.5122FKBP46peptidyl-prolyl cis-trans isomerase FKBP65
4334171XP_015631420.1−0.215354−1.722303−0.804273692−1.50695−0.58892−0.05071−1.05794−0.24896−1.00723−0.19824OsPho1alpha-1,4 glucan phosphorylase L isozyme, chloroplastic/amyloplastic
4338987XP_015640121.1−0.519035−2.5592270.140924626−2.040190.65996−0.07701−1.15113−0.29747−1.07412−0.22046AKR4C10aldo-keto reductase family 4 member C10
4343010XP_015647210.1−0.304685−2.5592330.501779613−2.254550.806465−0.76549−1.77274−0.80999−1.00725−0.0445OsGBSSIIgranule-bound starch synthase 1b, chloroplastic/amyloplastic
4350821XP_015615550.12.9533801−0.1389913.573679797−3.092370.62030.674683−0.42430.373637−1.09898−0.30105WIP3Wound-induced protein precursor
107276064XP_015611357.12.07996843.31141532.2124477161.2314470.1324790.3142341.5515380.6111571.2373040.296923zingipain-2putative cysteine proteinase
107276446XP_015621471.1−0.9113791.12119040.4721689072.0325691.383548−0.039911.381661−0.324391.421576−0.28448Oslaccase-6laccase-6
Disclaimer/Publisher’s Note: The statements, opinions and data contained in all publications are solely those of the individual author(s) and contributor(s) and not of MDPI and/or the editor(s). MDPI and/or the editor(s) disclaim responsibility for any injury to people or property resulting from any ideas, methods, instructions or products referred to in the content.

