

How Competitive Is the Agriculture in European Union Member States? An Assessment of Changes over the Past Decade


Abstract
1. Introduction
2. Materials and Methods
3. Results and Discussion
4. Conclusions
Author Contributions
Funding
Institutional Review Board Statement
Data Availability Statement
Conflicts of Interest
References
- Campi, M.; Dueñas, M.; Fagiolo, G. How do countries specialize in agricultural production? A complex network analysis of the global agricultural product space. Environ. Res. Lett. 2020, 15, 124006. [Google Scholar] [CrossRef]
- OECD. Farmland Conversion: The Spatial Dimension of Agricultural and Land Use Policies; OECD Publishing: Paris, France, 2009. [Google Scholar] [CrossRef]
- Pawlak, K.; Kołodziejczak, M. The role of agriculture in ensuring food security in developing countries: Considerations in the context of the problem of sustainable food production. Sustainability 2020, 12, 5488. [Google Scholar] [CrossRef]
- Baer-Nawrocka, A. The role of agriculture in the national economy of EU countries. J. Agribus. Rural Dev. 2016, 42, 501–510. [Google Scholar] [CrossRef]
- Tłuczak, A. Diversity of the selected elements of agricultural potential in the European Union countries. Agric. Econ. 2020, 66, 260–268. [Google Scholar] [CrossRef]
- Nowak, A.; Różańska-Boczula, M. The competitiveness of agriculture in EU Member States according to the competitiveness pyramid model. Agriculture 2022, 12, 28. [Google Scholar] [CrossRef]
- Borlea, S.N.; Lucuț Capraș, I. Theoretical and statistical arguments of the differentiated effect of the Common Agricultural Policy in the EU countries. Ann. Univ. Apulensis-Ser. Oeconomica 2023, 25, 53–67. [Google Scholar] [CrossRef]
- Aday, S.; Aday, M.S. Impact of COVID-19 on the food supply chain. Food Qual. Saf. 2020, 4, 167–180. [Google Scholar] [CrossRef]
- Timpanaro, G.; Scuderi, A.; Guarnaccia, P.; Foti, V.T. Will recent world events shift policy-makers’ focus from sustainable agriculture to intensive and competitive agriculture? Heliyon 2023, 9, e17991. [Google Scholar] [CrossRef] [PubMed]
- Boix-Fayos, C.; de Vente, J. Challenges and potential pathways towards sustainable agriculture within the European Green Deal. Agric. Syst. 2023, 207, 103634. [Google Scholar] [CrossRef]
- Neuenfeldt, S.; Gocht, A.; Heckelei, T.; Ciaian, P. Explaining farm structural change in the European agriculture: A novel analytical framework. Eur. Rev. Agric. Econ. 2019, 46, 713–768. [Google Scholar] [CrossRef]
- Gołaś, Z.J. Convergence of labour productivity in agriculture of the European Union. Probl. Agric. Econ. 2019, 358, 22–43. [Google Scholar] [CrossRef]
- Rusielik, R. Agricultural efficiency and its components in European Union countries between 2009–2019. Analysis using aggregate Färe-Primont productivity indices. Ann. Pol. Assoc. Agric. Agribus. Econ. 2021, 23, 87–102. [Google Scholar] [CrossRef]
- Jarosz-Angowska, A.; Angowski, M.; Kakol, M.; Nowak, A.; Różańska-Boczula, M. Agricultural competitive potential and competitive position in the international trade of agricultural and food products in the European Union. Eur. Res. Stud. J. 2020, 23, 779–803. [Google Scholar] [CrossRef] [PubMed]
- Łukiewska, K. Changes in the competitive position of the food industry in the European Union member states. Forum Sci. Oeconomia 2019, 7, 71–86. [Google Scholar] [CrossRef]
- Jabkowski, D. Conditions for the competitiveness of the agricultural sector in the EU, Japan, Canada, Vietnam, and Mercosur Countries. Probl. Agric. Econ. 2023, 374, 42–61. [Google Scholar] [CrossRef]
- Keogh, M.; Tomlinson, A.; Henry, M. Assessing the Competitiveness of Australian Agriculture; No 15/054; Rural Industries Research and Development Corporation Publication: Canberra Australia, 2015. [Google Scholar]
- Van Dung, B.; Van Thuy, H.T.; Dieu, A.H.T.; Thuy, L.H.T.T. Concepts of agri-competitiveness in theoretical and empirical researches. J. Dev. Res. 2020, 4, 24–33. [Google Scholar] [CrossRef]
- Voinescua, R.; Moisoiu, C. Competitiveness, theoretical and policy approaches. Towards a more competitive EU. Procedia Econ. Financ. 2015, 22, 512–521. [Google Scholar] [CrossRef]
- Nowak, A.; Kamińska, A. Agricultural competitiveness: The case of the European Union countries. Agric. Econ. 2016, 62, 507–516. [Google Scholar] [CrossRef]
- Hauka, A.; Rivža, B. Common Agricultural Policy (CAP)–For increasing EU competitiveness in global market. In Proceedings of the 25th Congress Nordic View to Sustainable Rural Development, Riga, Latvia, 16–18 June 2015; pp. 451–456. [Google Scholar]
- European Commission. Approved 28 CAP Strategic Plans (2023–2027). Summary Overview for 27 Member States. Facts and Figures. Available online: https://agriculture.ec.europa.eu/document/download/7b3a0485-c335-4e1b-a53a-9fe3733ca48f_en?filename=approved-28-cap-strategic-plans-2023-27.pdf (accessed on 21 January 2024).
- OECD. Policies for the Future of Farming and Food in the European Union; OECD Agriculture and Food Policy Reviews; OECD Publishing: Paris, France, 2023. [Google Scholar] [CrossRef]
- Horák, I. The Competitiveness Outlook of the European Agriculture with the New Green Deal Policy. MENDELU Working Papers in Business and Economics 78. Mendel University in Brno. 2022. Available online: http://ftp.mendelu.cz/RePEc/men/wpaper/78_2022.pdf (accessed on 21 January 2024).
- Beck, M.; Van Bunnen, P.; Bodart, S.; Münch, A.; Gorny, H.; Badouix, M. Research for AGRI Committee–Rural Areas-Levels of Support and Impact on Competitiveness of Farms; European Parliament, Policy Department for Structural and Cohesion Policies: Brussels, Belgium, 2024. [Google Scholar]
- Juchniewicz, M. Food producers’ competitiveness gap in Poland on the European Union market. Acta Sci. Pol. Oeconomia 2017, 16, 65–75. [Google Scholar] [CrossRef]
- Pawlak, K.; Poczta, W. Competitiveness of Polish agriculture in the context of globalization and economic integration–Competitive potential and position. Probl. Agric. Econ. 2020, 4, 86–107. [Google Scholar] [CrossRef]
- Pawlak, K.; Smutka, L.; Kotyza, P. Agricultural potential of the EU countries: How far are they from the USA? Agriculture 2021, 11, 282. [Google Scholar] [CrossRef]
- Baráth, L.; Fertő, I. Productivity and convergence in European Agriculture. J. Agric. Econ. 2016, 68, 228–248. [Google Scholar] [CrossRef]
- Rodzinka, J.; Skica, T.; Pomianek, T. Productivity and Competitiveness of the Agricultural Sector in Poland. Yearb. Antitrust Regul. Stud. 2021, 14, 139–158. [Google Scholar] [CrossRef]
- Matkovski, B.; Kalaš, B.; Zekić, S. Agri-food competitiveness in South East Europe. Outlook Agric. 2019, 48, 326–335. [Google Scholar] [CrossRef]
- Andrei, J.V.; Popescu, G.H.; Nica, E.; Chivu, L. The impact of agricultural performance on foreign trade concentration and competitiveness: Empirical evidence from Romanian agriculture. J. Bus. Econ. Manag. 2020, 21, 317–343. [Google Scholar] [CrossRef]
- Matkovski, B.; Zekić, S.; Đokić, D.; Jurjević, Ž.; Đurić, I. Export competitiveness of agri-food sector during the EU Integration process: Evidence from the Western Balkans. Foods 2022, 11, 10. [Google Scholar] [CrossRef]
- Zieliński, M.; Ziętara, W. Competitiveness of Polish and German farms specialized in field crops. J. Agribus. Rural Dev. 2019, 3, 281–290. [Google Scholar] [CrossRef]
- Nedelcu, A.; Murărasu, I.C.; Bulgaru, I.A. The competitiveness of the Romanian agri-food sector in comparison with European countries. Rom. Econ. Bus. 2023, 26, 101–106. [Google Scholar] [CrossRef]
- Coca, O.; Creangă, D.; Viziteu, S.; Brumă, I.S.; Stefan, G. Analysis of the Determinants of Agriculture Performance at the European Union Level. Agriculture 2023, 13, 616. [Google Scholar] [CrossRef]
- Hoang, V.V. Investigating the agricultural competitiveness of ASEAN countries. J. Econ. Stud. 2020, 47, 307–332. [Google Scholar] [CrossRef]
- García-Agüero, A.-I.; Terán-Yépez, E.; Batlles-delaFuente, A.; Belmonte-Ureña, L.J.; Camacho-Ferre, F. Intellectual and cognitive structures of the agricultural competitiveness research under climate change and structural transformation. Oeconomia Copernic. 2023, 14, 1175–1209. [Google Scholar] [CrossRef]
- Nugroho, A.D.; Prasada, I.Y.; Lakner, Z. Comparing the effect of climate change on agricultural competitiveness in developing and developed countries. J. Clean. Prod. 2023, 406, 137139. [Google Scholar] [CrossRef]
- Jambor, A.; Babu, S. (Eds.) Strategies for increasing competitiveness of agriculture. In Competitiveness of Global Agriculture; Policy Lessons for Food Security; Springer: Cham, Switzerland, 2016; pp. 151–171. [Google Scholar] [CrossRef]
- Czyżewski, B. Resource productivity in Polish agriculture: Towards the paradigm of sustainable development. Econ. Stud. 2012, 2, 165–188. [Google Scholar]
- Jarosz-Angowska, A.; Kasztelan, A.; Kołodziej, E. The evaluation of the competitive potential and performance of the agricultural sector in the EU countries based on a synthetic index. Optimum. Econ. Stud. 2022, 3, 103–119. [Google Scholar] [CrossRef]
- Xiao, Q.; Reed, M. Export and production growth: Evidence from three major wheat exporters of Australia. Can. United States. Appl. Econ. 2007, 39, 309–319. [Google Scholar]
- Kryszak, Ł. Income convergence in the agricultural sector in the context of the European Union’s Common Agricultural Policy. Ann. Pol. Assoc. Agric. Agribus. Econ. 2020, 22, 140–152. [Google Scholar] [CrossRef]
- Kijek, A.; Kijek, T.; Nowak, A. Club convergence of labour productivity in agriculture: Evidence from EU countries. Agric. Econ. 2020, 66, 391–401. [Google Scholar] [CrossRef]
- Ball, V.E.; Butault, J.P.; Juan, C.S.; Mora, R. Productivity and international competitiveness of agriculture in the European Union and the United States. Agric. Econ. 2010, 41, 611–627. [Google Scholar] [CrossRef]
- Cheptea, A.; Huchet, M. The competitiveness of French agri-food exports: A methodological and comparative approach. In Proceedings of the 2018—AAEA Annual Meeting, Agricultural and Applied Economics Association (AAEA), Washington, DC, USA, 5–7 August 2018. [Google Scholar] [CrossRef]
- Carraresi, L.; Banterle, A. The agri-food competitive performance in the EU countries: A fifteen years retrospective. In Proceedings of the 6th International European Forum on System Dynamics and Innovation in Food Networks. International Center for Food Chain and Network Research, Innsbruck-Igls, Austria, 18–22 February 2013; pp. 238–250. [Google Scholar]
- Megyesiova, S. Production, employment and productivity of agricultural sector in the European Union. Bulg. J. Agric. Sci. 2021, 27, 846–858. [Google Scholar]
- Stevens, J.P. Applied Multivariate Statistics for the Social Sciences, 2nd ed.; Erlbaum: Hillsdale, NJ, USA, 1992. [Google Scholar]
- Jakšić, S.; Erjavec, N.; Cota, B. Export and Total Factor Productivity of EU New Member States. Croat. Oper. Res. Rev. 2020, 11, 263–273. [Google Scholar] [CrossRef]
- Rumankova, L.; Kuzmenko, E.; Benesova, I.; Smutka, L. Selected EU countries crop trade competitiveness from the perspective of the Czech Republic. Agriculture 2022, 12, 127. [Google Scholar] [CrossRef]
- Latruffe, L. Competitiveness, Productivity and Efficiency in the Agricultural and Agri-Food Sectors; OECD Food, Agriculture and Fisheries Papers, No. 30; OECD Publishing: Paris, France, 2010. [Google Scholar] [CrossRef]
- Dimovski, J.; Krstić, B.; Radivojević, V. Ensuring the improvement of agricultural competitiveness through the human resource development. Agric. Econ. 2022, 69, 1017–1029. [Google Scholar] [CrossRef]


| Indicator Symbol | Indicator Name (Unit of Measure) | Stimulant/ Destimulant |
|---|---|---|
| X1 | Share of the member state in the EU’s agricultural output (%) at constant prices (2010 = 100) | S |
| X2 | Land productivity (value of agricultural output per 1 ha of utilised agricultural area (UAA) (EUR/ha) | S |
| X3 | Labour productivity (GVA per 1 Annual Work Unit (AWU) (EUR/AWU) | S |
| X4 | Number of workers per 100 ha of UAA (AWU/100 ha) | D |
| X5 | Capital productivity (value of agricultural output/cost of intermediate consumption) (EUR) | S |
| X6 | Area under organic farming (% of UAA) | S |
| X7 | Percentage of agricultural workers (%) | D |
| X8 | Share of the country in the EU’s exports of products from group 0 according to SITC classification for food and live animals (%) (intra and extra) | S |
| X9 | Agricultural entrepreneurial income compared to average wages in the whole economy (based on EUR/hour worked) | S |
| X10 | Ratio: Farmers < 35 years old/farmers > 55 years old | S |
| Symbol of the Variable | M | SD | Me | Min. | Max. | S. | ACV |
|---|---|---|---|---|---|---|---|
| 2012 | |||||||
| X1 | 3.70 | 5.20 | 1.77 | 0.03 | 20.00 | 1.97 | 140.39% |
| X2 | 2723.77 | 2902.98 | 1712.31 | 576.44 | 13,284.80 | 2.57 | 106.58% |
| X3 | 18,381.89 | 17,108.52 | 12,669.98 | 2925.65 | 64,399.54 | 1.58 | 93.07% |
| X4 | 7.99 | 8.27 | 4.59 | 1.97 | 42.45 | 3.04 | 103.49% |
| X5 | 1.56 | 0.27 | 1.55 | 1.05 | 2.21 | 0.64 | 17.45% |
| X6 | 6.61 | 4.80 | 5.51 | 0.32 | 18.62 | 0.92 | 72.61% |
| X7 | 6.69 | 6.52 | 4.20 | 1.00 | 30.60 | 2.26 | 97.51% |
| X8 | 3.70 | 5.01 | 1.19 | 0.06 | 17.28 | 1.70 | 135.37% |
| X9 | 71.33 | 48.52 | 59.73 | 16.22 | 242.86 | 2.37 | 68.03% |
| X10 | 0.15 | 0.11 | 0.12 | 0.04 | 0.52 | 2.08 | 70.67% |
| 2021 | |||||||
| X1 | 3.70 | 4.92 | 1.82 | 0.03 | 17.77 | 1.76 | 132.84% |
| X2 | 2986.86 | 3007.90 | 1980.43 | 653.94 | 14,398.07 | 2.63 | 100.70% |
| X3 | 26,547.78 | 30,412.12 | 15,888.81 | 5109.09 | 141,006.92 | 2.65 | 114.56% |
| X4 | 7.15 | 9.47 | 3.82 | 1.71 | 50.33 | 3.93 | 132.39% |
| X5 | 1.60 | 0.26 | 1.57 | 1.18 | 2.25 | 0.80 | 15.95% |
| X6 | 10.62 | 6.63 | 9.67 | 0.61 | 25.69 | 0.56 | 62.43% |
| X7 | 5.12 | 4.73 | 3.40 | 0.80 | 21.40 | 2.16 | 92.41% |
| X8 | 3.70 | 4.80 | 1.42 | 0.06 | 17.21 | 1.59 | 129.54% |
| X9 | 76.28 | 44.21 | 68.17 | 14.70 | 193.59 | 1.11 | 57.95% |
| X10 | 0.14 | 0.09 | 0.11 | 0.03 | 0.41 | 1.35 | 62.64% |
| Average for 2012–2021 | |||||||
| X1 | 3.70 | 5.03 | 1.80 | 0.03 | 18.93 | 1.86 | 135.68% |
| X2 | 2874.78 | 2953.67 | 1860.02 | 624.76 | 13,968.23 | 2.64 | 102.74% |
| X3 | 22,665.94 | 22,183.89 | 13,875.77 | 4981.98 | 92,773.72 | 1.94 | 97.87% |
| X4 | 7.53 | 8.51 | 4.55 | 1.96 | 44.67 | 3.45 | 113.14% |
| X5 | 1.61 | 0.26 | 1.59 | 1.20 | 2.22 | 0.70 | 16.04% |
| X6 | 8.25 | 5.58 | 7.26 | 0.36 | 22.21 | 0.91 | 67.65% |
| X7 | 5.84 | 5.50 | 3.77 | 0.88 | 25.23 | 2.20 | 94.13% |
| X8 | 3.70 | 4.94 | 1.22 | 0.07 | 17.59 | 1.68 | 133.46% |
| X9 | 68.27 | 37.61 | 57.14 | 19.25 | 177.94 | 1.54 | 55.09% |
| X10 | 0.14 | 0.09 | 0.11 | 0.03 | 0.41 | 1.73 | 64.21% |
| Ranking | 2012 | 2021 | Up/Down in the Ranking Compared with 2012 | ||
|---|---|---|---|---|---|
| Country | Wi | Country | Wi | ||
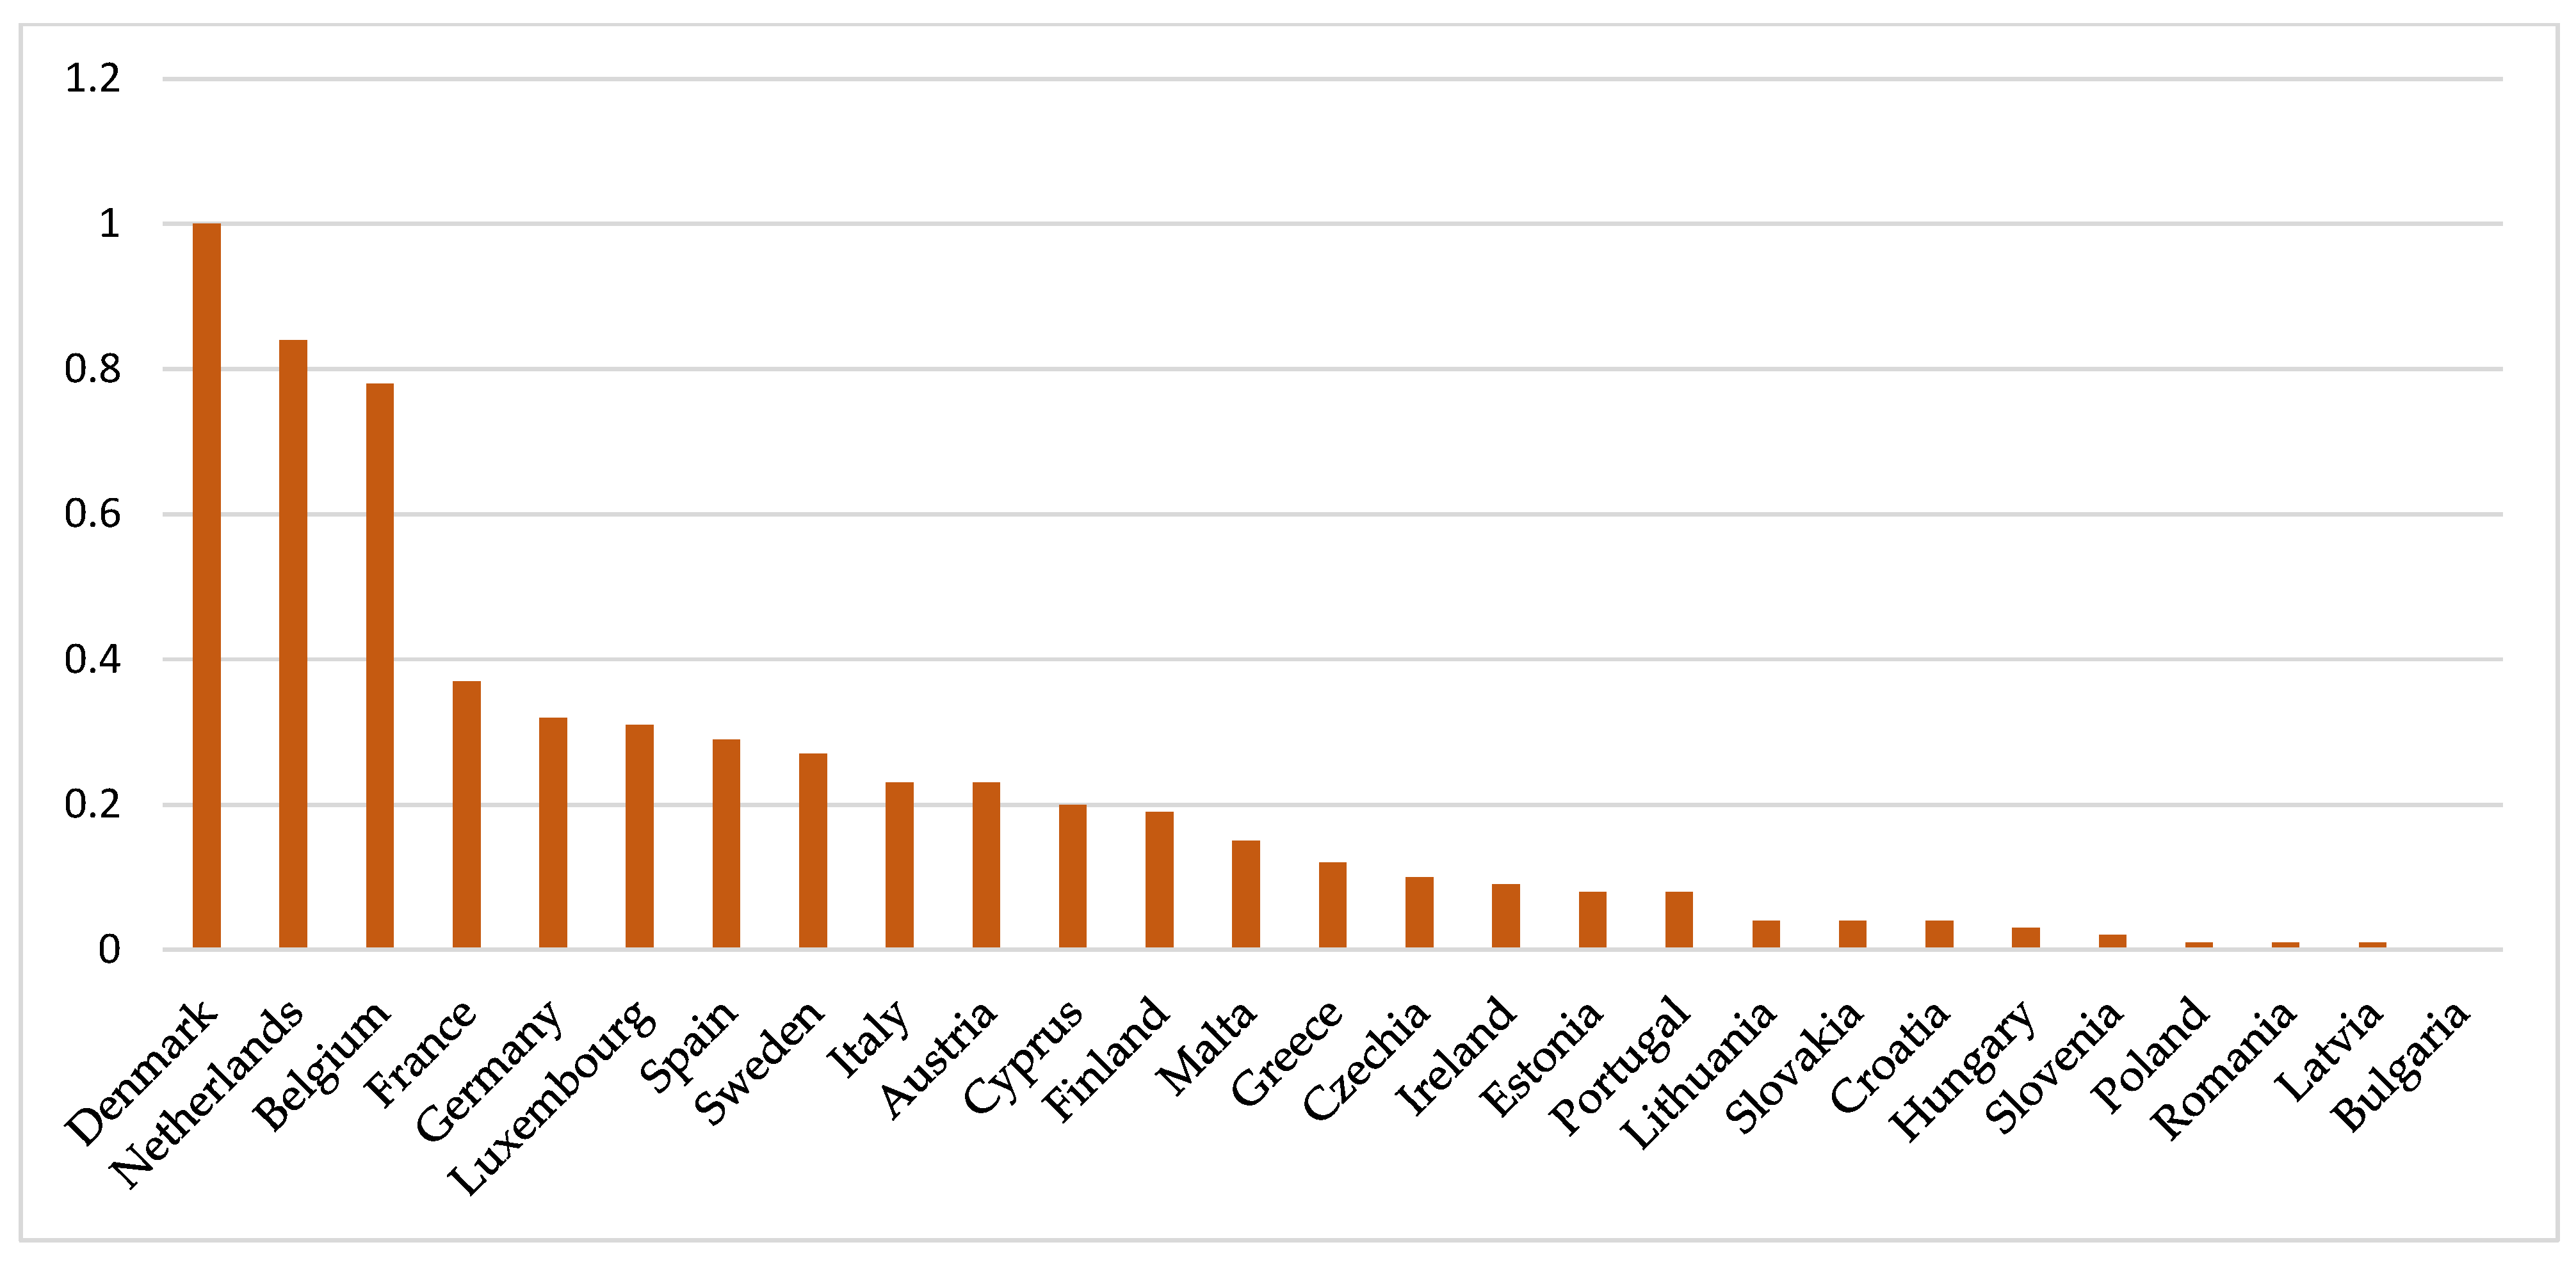
| 1 | The Netherlands | 1.00 | Denmark | 1.00 | +1 |
| 2 | Denmark | 0.88 | Belgium | 0.67 | +1 |
| 3 | Belgium | 0.64 | The Netherlands | 0.55 | −2 |
| 4 | France | 0.44 | Germany | 0.23 | +1 |
| 5 | Germany | 0.41 | France | 0.23 | −1 |
| 6 | Luxembourg | 0.35 | Luxembourg | 0.22 | = |
| 7 | Sweden | 0.33 | Spain | 0.20 | +2 |
| 8 | Italy | 0.32 | Finland | 0.17 | +6 |
| 9 | Spain | 0.30 | Sweden | 0.17 | −2 |
| 10 | Austria | 0.28 | Italy | 0.15 | −2 |
| 11 | Cyprus | 0.25 | Austria | 0.15 | −1 |
| 12 | Malta | 0.24 | Cyprus | 0.10 | −1 |
| 13 | Greece | 0.17 | Greece | 0.08 | = |
| 14 | Finland | 0.17 | Ireland | 0.08 | +4 |
| 15 | Estonia | 0.14 | Czechia | 0.07 | +1 |
| 16 | Czechia | 0.10 | Malta | 0.07 | −4 |
| 17 | Portugal | 0.09 | Portugal | 0.06 | = |
| 18 | Ireland | 0.09 | Lithuania | 0.04 | +1 |
| 19 | Lithuania | 0.07 | Slovakia | 0.03 | +5 |
| 20 | Croatia | 0.05 | Croatia | 0.02 | = |
| 21 | Slovenia | 0.04 | Hungary | 0.02 | +1 |
| 22 | Hungary | 0.03 | Estonia | 0.02 | −7 |
| 23 | Poland | 0.03 | Bulgaria | 0.01 | +4 |
| 24 | Slovakia | 0.02 | Romania | 0.01 | +1 |
| 25 | Romania | 0.01 | Poland | <0.01 | −2 |
| 26 | Latvia | <0.01 | Latvia | <0.01 | = |
| 27 | Bulgaria | 0.00 | Slovenia | 0.00 | −6 |
| Country | Indicators |
|---|---|
| Austria | X1, X2, X3, X8, X9 |
| Belgium | X1, X6, X9 |
| Bulgaria | X1, X2, X3, X6, X7, X8 |
| Croatia | X1, X2, X3, X6, X7, X8, X9 |
| Cyprus | X1, X3, X6, X8 |
| Czechia | X1, X2, X3, X8 |
| Denmark | X1, X8, X9 |
| Estonia | X1, X2, X3, X8 |
| Finland | X1, X2, X8, X9 |
| France | X2, X6 |
| Germany | X6, X9 |
| Greece | X1, X2, X3, X6, X7, X8 |
| Hungary | X1, X2, X3, X6, X8 |
| Ireland | X1, X2, X3, X6, X8, X9 |
| Italy | X3, X9 |
| Latvia | X1, X2, X3, X7, X8, X9 |
| Lithuania | X1, X2, X3, X6, X7, X8, X9 |
| Luxembourg | X1, X2, X6, X8, X9 |
| Malta | X1, X3, X6, X8, X9 |
| The Netherlands | X6, X9 |
| Poland | X2, X3, X6, X7, X9 |
| Portugal | X1, X2, X3, X7, X8 |
| Romania | X2, X3, X6, X7, X8, X9 |
| Slovakia | X1, X2, X3, X8 |
| Slovenia | X1, X2, X3, X7, X8, X9 |
| Spain | X2, X8 |
| Sweden | X1, X2, X8, X9 |
| Indicator | Factor | |||
|---|---|---|---|---|
| 1 | 2 | 3 | 4 | |
| X1 | 0.947 | |||
| X8 | 0.896 | |||
| X4 | 0.809 | |||
| X6 | 0.729 | |||
| X2 | −0.584 | 0.572 | ||
| X10 | 0.784 | |||
| X5 | −0.686 | |||
| X9 | 0.506 | −0.529 | ||
| X7 | 0.815 | |||
| X3 | 0.758 | |||
| Indicator | Factor | ||
|---|---|---|---|
| 1 | 2 | 3 | |
| X1 | 0.916 | ||
| X8 | 0.863 | ||
| X4 | 0.734 | ||
| X10 | 0.732 | ||
| X6 | 0.678 | ||
| X5 | 0.457 | −0.520 | |
| X7 | 0.916 | ||
| X3 | 0.656 | ||
| Indicator | Factor | ||
|---|---|---|---|
| 1 | 2 | 3 | |
| X1 | 0.918 | ||
| X8 | 0.898 | ||
| X6 | 0.759 | ||
| X4 | 0.744 | ||
| X10 | 0.700 | ||
| X7 | 0.909 | ||
| X3 | 0.663 | ||
Disclaimer/Publisher’s Note: The statements, opinions and data contained in all publications are solely those of the individual author(s) and contributor(s) and not of MDPI and/or the editor(s). MDPI and/or the editor(s) disclaim responsibility for any injury to people or property resulting from any ideas, methods, instructions or products referred to in the content. |
© 2024 by the authors. Licensee MDPI, Basel, Switzerland. This article is an open access article distributed under the terms and conditions of the Creative Commons Attribution (CC BY) license (https://creativecommons.org/licenses/by/4.0/).
Share and Cite
Nowak, A.; Zakrzewska, A. How Competitive Is the Agriculture in European Union Member States? An Assessment of Changes over the Past Decade. Agriculture 2024, 14, 612. https://doi.org/10.3390/agriculture14040612
Nowak A, Zakrzewska A. How Competitive Is the Agriculture in European Union Member States? An Assessment of Changes over the Past Decade. Agriculture. 2024; 14(4):612. https://doi.org/10.3390/agriculture14040612
Chicago/Turabian StyleNowak, Anna, and Aneta Zakrzewska. 2024. "How Competitive Is the Agriculture in European Union Member States? An Assessment of Changes over the Past Decade" Agriculture 14, no. 4: 612. https://doi.org/10.3390/agriculture14040612
APA StyleNowak, A., & Zakrzewska, A. (2024). How Competitive Is the Agriculture in European Union Member States? An Assessment of Changes over the Past Decade. Agriculture, 14(4), 612. https://doi.org/10.3390/agriculture14040612