Article

LoRa Communication Quality Optimization on Agriculture Based on the PHY Anti-Frame Loss Mechanism

1
College of Electronic Engineering (College of Artificial Intelligence), South China Agricultural University, Guangzhou 510642, China
2
Division of Citrus Machinery, China Agriculture Research System, Guangzhou 510642, China
3
Guangdong Engineering Research Center for Monitoring Agricultural Information, Guangzhou 510642, China
*
Author to whom correspondence should be addressed.
Agriculture 2024, 14(3), 460; https://doi.org/10.3390/agriculture14030460
Submission received: 11 January 2024 / Revised: 4 March 2024 / Accepted: 8 March 2024 / Published: 12 March 2024
(This article belongs to the Section Digital Agriculture)

Abstract

:
Agricultural environments are usually characterized by height differences and tree shading, which pose challenges for communication in smart agriculture. This study focuses on optimizing the packet loss rate and power consumption of LoRa’s practical communication quality. The research includes the investigation of the PHY anti-frame loss mechanism, encompassing PHY frame loss detection and the response mechanism between gateways and nodes. By implementing a closed loop for transmission and reception, the study enhances the communication network’s resistance to interference and security. Theoretical performance calculations for the SX1278 radio frequency chip were conducted under different parameters to determine the optimal energy efficiency, reducing unnecessary energy waste. An experimental assessment of the packet loss rate was conducted to validate the practical efficacy of the research findings. The results show that the LoRa communication with the anti-frame loss mechanism and the optimal energy ratio parameter exhibits an adequate performance. In the presence of strong and weak interferences, the reception rates are maximally improved by 37.8% and 53.4%, with effective distances of 250 m and 600 m, corresponding to enhancements of 100 m and 400 m, respectively. This research effectively reduces LoRa energy consumption, mitigates packet loss, and extends communication distances, providing insights for wireless transmission in agricultural contexts.

1. Introduction

In natural agriculture, farmers spend considerable time learning about the condition of their crops and monitoring them. In smart agriculture, the data monitoring of crops is the basis for digital farm management. Therefore, a long-time, long-distance, and stable communication system is a necessary component of smart agriculture. In agricultural environments characterized by significant spatial and temporal variability, the complexity and variability of environmental factors pose challenges to wireless communication. The quality of wireless signals is influenced by the interplay of the terrain and vegetation density. When deploying large-area wireless sensor nodes in agricultural environments settings, electromagnetic waves naturally create numerous asymmetric links and shadow-fading patterns during wireless propagation. This often results in frequent, uncontrolled packet loss occurrences, rendering the communication quality of links unreliable, and the lifespan of sensor nodes is directly affected by this [1,2].
H Klaina et al. [3] evaluated a variety of LPWAN scenarios for farmland, demonstrating that LoRa shows a great potential for agriculture. While LoRa technology offers advantages such as long-range deployment capabilities and cost-effectiveness compared to other technologies [4,5,6,7], it exhibits instability in performance under varying interference intensities. For instance, Yousuf et al. [7] conducted LoRa experiments aimed at maximizing coverage and throughput. They found a 90% acceptance rate within 7.5 km in open spaces, but the average acceptance rate dropped below 50% in environments with strong interference. Li et al. [8] conducted LoRa communication experiments in grassland, achieving an over 95% acceptance rate at a 1 km range. However, the acceptance rate notably declined in environments with height differences. Deng et al. [9] developed a soil monitoring system featuring a mobile LoRa gateway, achieving a 90% acceptance rate by reducing the distance between the gateway and the node. Similarly, Bravo-Arrabal et al. [10] designed a mobile LoRa gateway urban communication system, which improved acceptance rates by moving the gateway within a limited range. Nevertheless, achieving a better communication quality for nodes situated at longer distances remained challenging. In addition, we believe that both data recovery and improved reception rates are parallel and effective means of improving communication stability. Yazdani et al. [11] proposed a method to recover LoRa data efficiently, which helped to improve data integrity, but the recoverability of the data was unstable, and receiving the data as completely as possible in complex environments is a prerequisite for recovering the data.
In light of these challenges, there is a pressing need to enhance the suitability of LoRa technology for complex environments, focusing on improving communication stability and reducing energy consumption. The current research in the field of LoRa primarily focuses on communication networks. LoRaWAN defines the open systems interconnection (OSI) physical layer (PHY) and media access control (MAC) layer. At the PHY, LoRaWAN operates within unlicensed frequency bands below 1 GHz, utilizing a proprietary spread spectrum modulation scheme derived from chirp spread spectrum modulation (CSS). This modulation scheme significantly enhances the link budget and immunity to in-band interference, as noted by Sinha et al. [12,13] and Sanchez-Iborra et al. [14]. At the MAC layer, LoRaWAN defines three types of terminal devices: classes A, B, and C. Class A terminals use the ALOHA protocol to upload data on demand. Class B is based on class A and adds a specified time to open the receive window. Class C terminals keep the receive window open all the time and only close it briefly when sending. In addition, another core of LoRaWAN, the ADR (adaptive data rate) algorithm, can dynamically manage the communication rate and power of all the nodes in the network, so that each node can find a balance between the success rate of communication as well as power consumption.
LoRaWAN’s protocols and ADR at the MAC layer are universal in improving communication quality but still lack targeted optimization for agricultural environments. One critical challenge persists in the realm of LoRa optimization: the existing PHYs exclusively employ forward error correction [15]. This leads to two issues: the inability to trace lost content during the transmission process and the incapacity of LoRa’s forward error correction to recover lost content [15]. More specifically, lost data can affect the proper functioning of digital agricultural systems, such as irrigation systems. This study aims to address these challenges through the introduction of a PHY anti-frame loss mechanism.
Power management is a critical consideration in the context of internet of things (IoTs) applications in agriculture [16,17], and it serves as a primary constraint for sensors and communication nodes [18]. Given that many of these devices cannot access a centralized power grid [19], the energy consumption in wireless sensor networks is predominantly attributed to transceivers or radios. Consequently, optimizing data transmission becomes imperative for minimizing the overall energy consumption and extending network longevity [20]. Sudha et al. [21] successfully addressed the issue of power consumption in wireless sensor networks by introducing modifications to the medium access control (MAC) layer, resulting in an impressive 10% reduction in energy usage. Similarly, Premsankar et al. [22] achieved an 8% reduction in energy consumption by fine-tuning the parameters of each LoRa node through an integer linear programing model. This study conducted theoretical performance calculations on the LoRa chip with different parameters to identify the optimal energy efficiency parameters, thereby reducing unnecessary energy consumption.
This paper explores strategies for mitigating packet loss and declining energy consumption in LoRa communication. We introduce a PHY anti-frame loss mechanism to bolster communication robustness in intricate environments, thereby reducing packet loss rates. To further validate the practicality of the anti-frame loss mechanism, we conduct theoretical calculations on energy consumption ratios. The results indicate that the minimum requirements are theoretically sufficient for communication. Through experimentation, we demonstrate that communication stability arises from the anti-frame loss mechanism, rather than solely relying on ample performance parameters, thereby substantiating its practical significance. Furthermore, the experiments confirm that the anti-frame loss mechanism enhances reception rates and extends effective communication distances. The tangible impact of the anti-frame loss mechanism implies that improving communication quality is no longer solely dependent on enhancing the performance parameters.

2. Materials and Methods

2.1. PHY Anti-Frame Loss Mechanism

2.1.1. PHY Frame Loss Detection Mechanism

LoRa’s PHY data contain three components: the leading code, the optional header, and the data payload. The preamble is used to keep the receiver synchronized with the incoming data stream. The payload is a variable field and is the main bearer of the transceiver content. The SX1278 is configured with a 256-byte RAM data cache that can only be accessed through the LoRa mode. By default, when the device is powered up, half of the available memory is used for the Rx, and the other half is used for the Tx, i.e., 128 bytes for each transceiver. Therefore, the length of the payload is set to a maximum of 128 bytes.
The payload of LoRa is significantly short compared to other means of IoT communication [23]. For longer data transmissions, LoRa often needs to divide the data into multiple sub-packets. Consequently, two types of anomalies may occur during the transmission of a long data stream: partial data loss in sub-packets, where the cyclic redundancy check (CRC) can detect but not resolve the loss, or complete loss of sub-packets with no means of detection. In LoRa’s continuous receive mode, if the CRC is invalid, the register discards the data packet, rendering it impossible to retrieve valid data from the FIFO data buffer. Therefore, even if the CRC detects data loss, it serves only as a notification to the receiving end and does not resolve the issue of data loss.
Hence, data integrity in LoRa is heavily reliant on the stability of the reception process. In the context of the IoT, where the continuous flow of information between multiple parties is crucial, any disruptions in data transmission can lead to systemic bottlenecks. Given the significance of uninterrupted data flow and considering the two reception anomalies mentioned earlier, the following design modifications are proposed for the payload of the packet in the PHY:
Table 1 illustrates the structure of the node-reported data frame, which comprises the following components: function code, device address, destination address, number of payload bytes, data payload, and an internal CRC code. The function code includes the transmission, retransmission, and completion of the transmission. The device address corresponds to the sender’s address, the destination address corresponds to the receiver’s address, and the payload byte count is equal to the length of the complete data packet. To distinguish between the CRC used for packets and that used for data frames, we refer to the CRC within the data frame as the “internal CRC”, while the CRC for packets is termed the “external CRC”.
The length of the data payload within the data frame here can be customized. Typically, most sensors generate data payloads of 12 bytes in length [24], and accordingly, 12 bytes are allocated for the data payload in the frame. The answer data frame includes the function code, device address, destination address, and CRC validation code. The node-reported data frame spans a length of 20 bytes, and the answer data frame measures 7 bytes. Considering China’s restrictions on LoRa network configuration, with a single transmission lasting no more than 1 s, a data frame of 20 bytes meets this requirement.
For long data, an approach involving multiple successive reports is adopted. In this context, essential components of the sub-packets include the function code, device address, and target address. The relationship between the number of transmissions Trx and the data length is defined by Equation (1):
T r x = l e n g t h P a y l o a d 12 15 + 1
The first sub-packet differs from others in that its data frame includes a function code, device address, target address, payload length, data payload (12 bytes), and internal CRC. Subsequent data frames lack payload length and internal CRC, with each data payload being 15 bytes.
The enhanced transmit data frame offers several notable advantages:
  • The internal CRC enables devices to detect the integrity of the transmission and reception of long data.
  • Enhanced information security: By incorporating additional factors, such as function codes, device addresses, and destination addresses, the data frames contribute to improved information security. The absence of a decoding format for data frames prevents unauthorized access to the information within them. Furthermore, each packet cannot be individually decoded; only complete packets are subject to decoding.
  • It facilitates tracing the origin of the received data, enabling the identification of malicious or unknown data sources.
  • The CRC checksum can be privately designed, allowing for customization to further bolster its security and verification capabilities. This adaptability provides an additional layer of data integrity and security.
In the specific experiment outlined in this study, the following protocol was used:
The function code 0 × 02 was designated for sending data to the receiving end. The response function code was 0 × fb. The transmitting end’s address was set as 0 × 01, while the receiving end’s address was 0 × 02. As an example, the HEX code of the message sent by the transmitting end was 02 01 02 08 01 02 03 04 05 06 07 08 A4 B7. Conversely, the HEX code of the message responded to by the receiving end was fb 02 01 90 13. When the receiving end received a data packet, it first confirmed the validity of the external CRC to verify the integrity of the individual data packet. Conversely, an invalid external CRC indicated partial data loss. After decoding, the confirmation of the internal CRC’s validity ensured the complete reception of the overall data packet; an invalid internal CRC indicated complete packet loss. The dual CRC checks allowed for a comprehensive detection of both types of reception anomalies. The detailed workflow will be explained within the frame loss prevention mechanism.

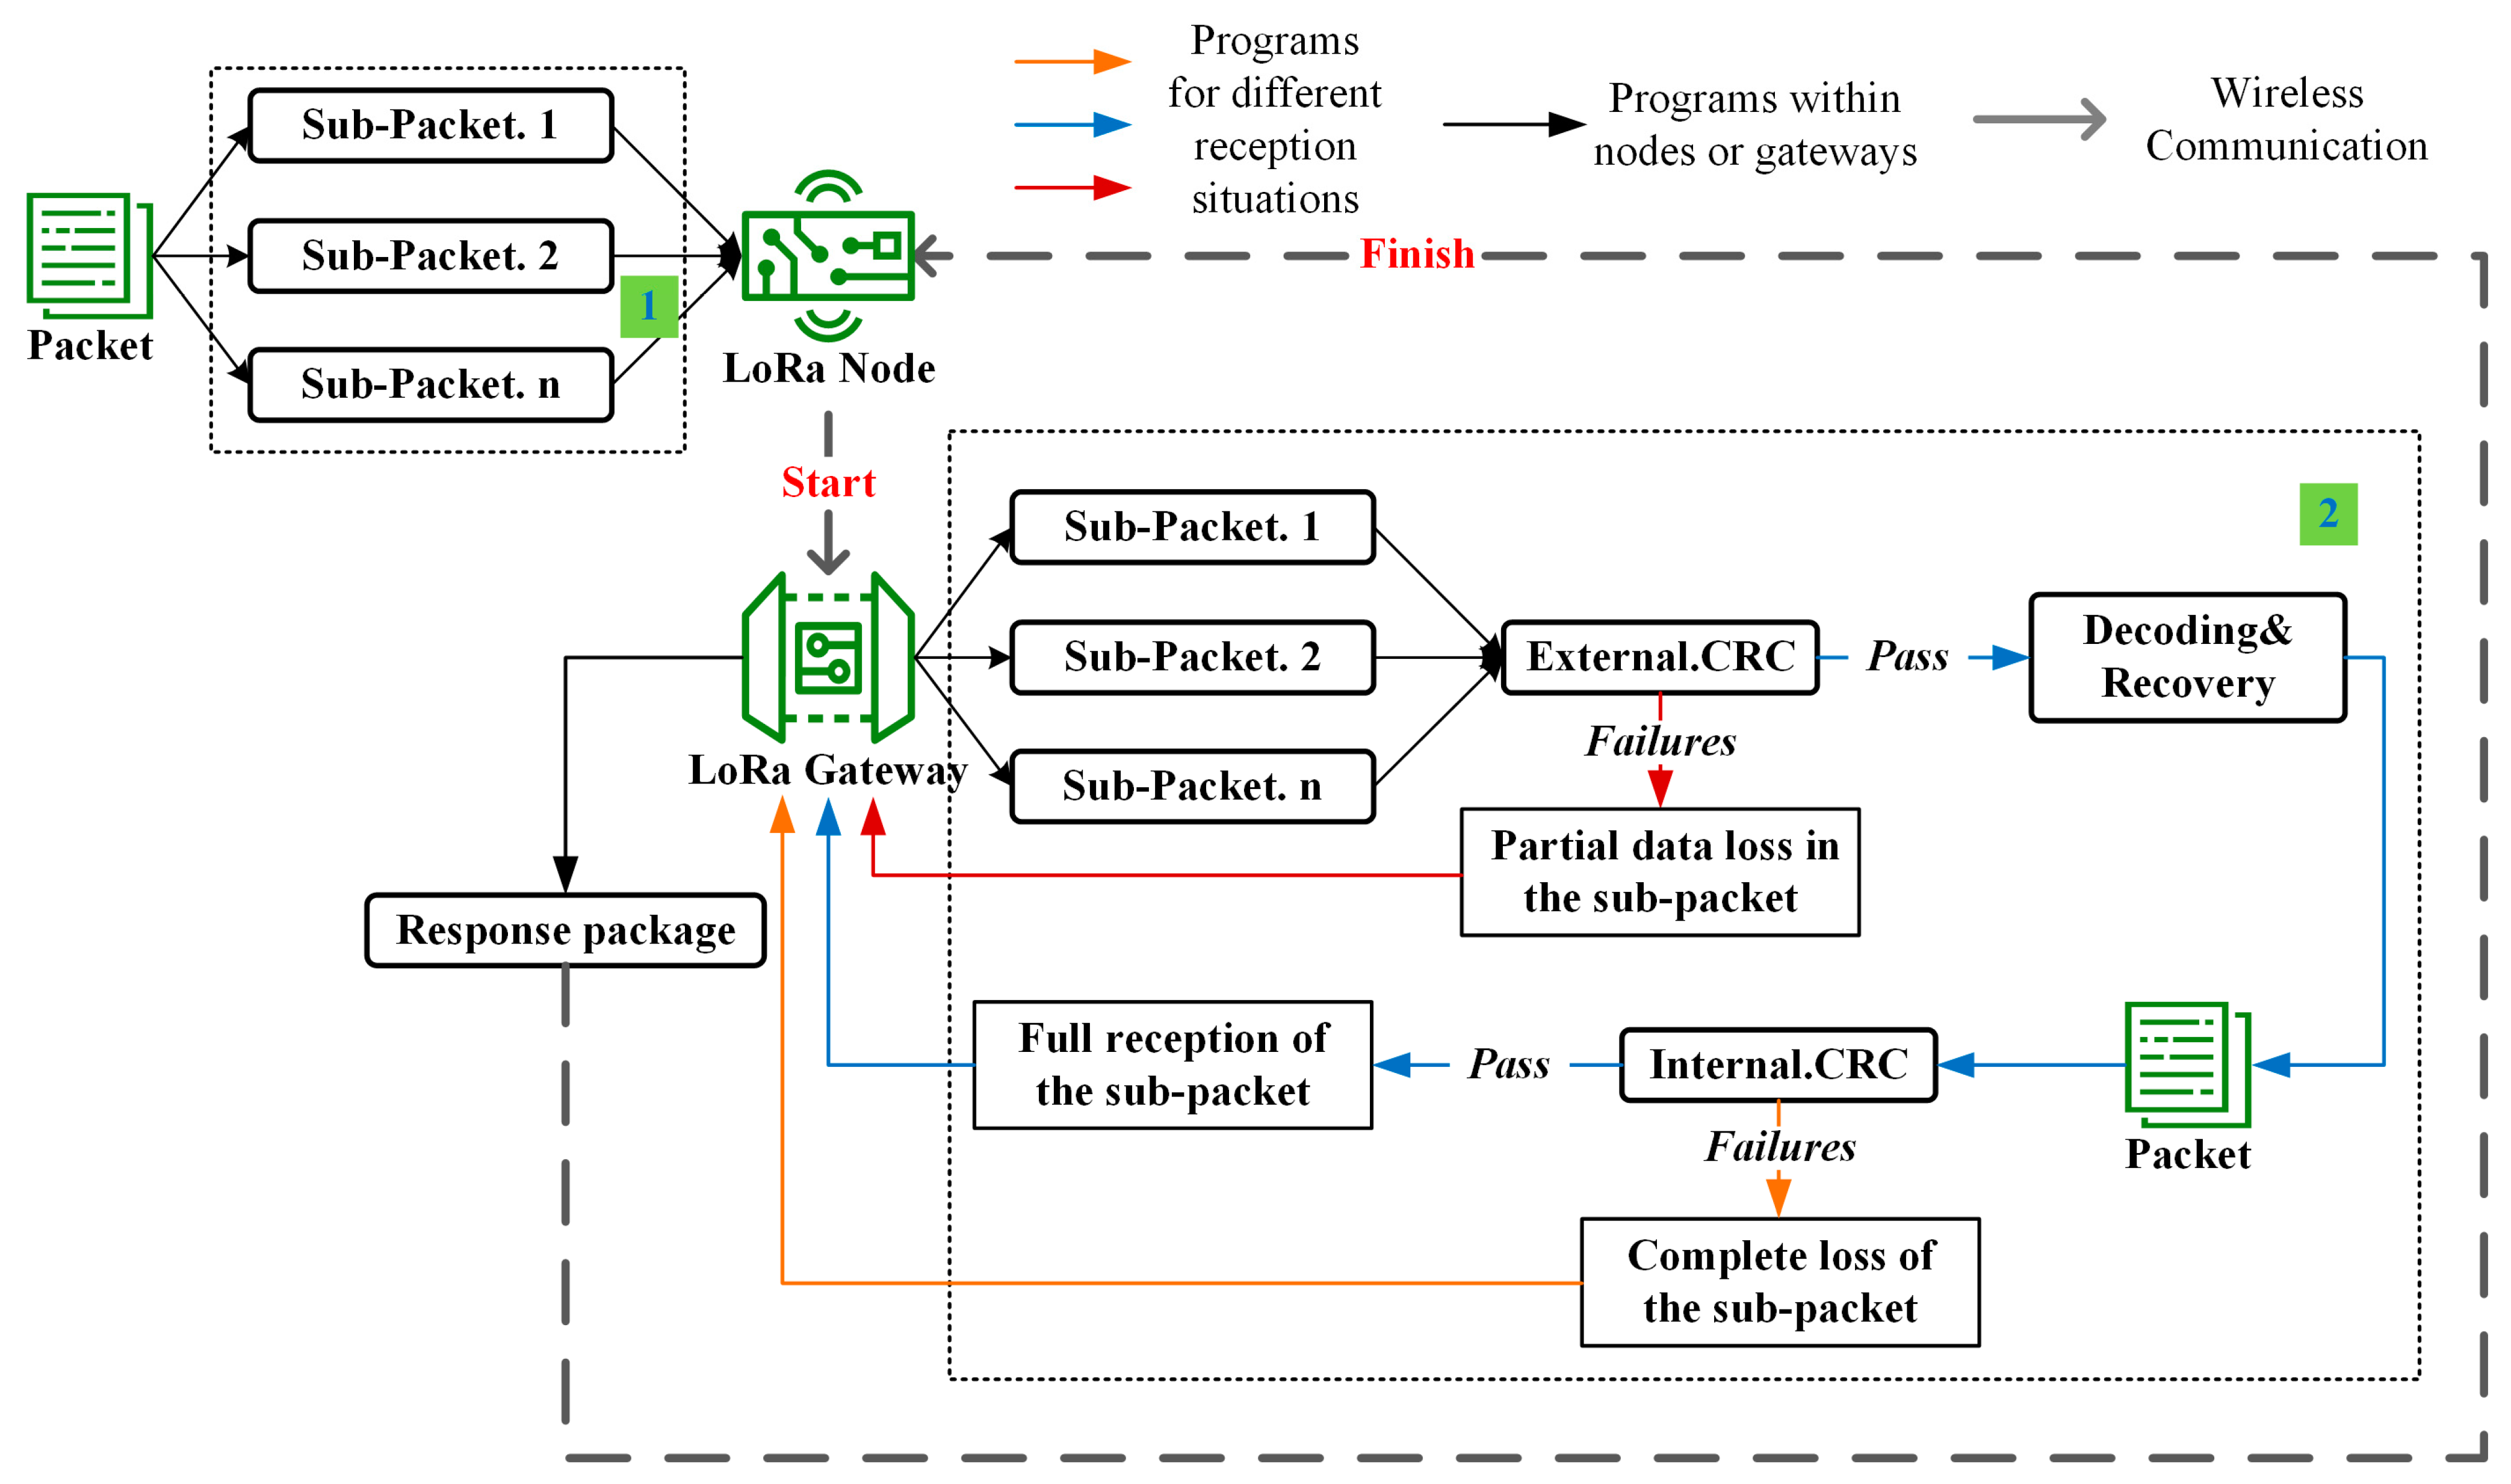
2.1.2. Anti-Frame Loss Mechanism

Based on the PHY frame loss detection mechanism to address both types of reception anomalies and to maintain the integrity and fluidity of data flow, specific designs were implemented for the communication mechanism between the nodes and gateways. To accommodate the varying lengths of the transmitted and received contents, the following designs were all tailored for long data (data length greater than 12 bytes), enhancing the adaptability of this mechanism. It is worth noting that this mechanism does not conflict with LoRaWAN’s classes A, B, and C and can be appropriately adapted to be applied to different modes of operation. The key purpose of this mechanism is to ensure the integrity of the data transfer.
Figure 1 shows the complete process of the PYH anti-frame loss mechanism.
(1)
Before the node is ready to upload, the long data are segmented and encapsulated into multiple sub-packets for multiple transmissions (Dashed Figure 1).
(2)
The node sequentially sends the sub-packets, and upon receiving each data packet, the gateway parses the address. When a new address is encountered, the timer is launched or refreshed. The timer duration is set based on the number of times each device address needs to be reported. In the case of using Trx as the transmission information, any loss or miscalculation by the gateway could result in timing errors. In this study, the timer was set to 100 ms. The frame loss detection mechanism was activated (Dashed Figure 2).
(3)
The external CRC is self-verified by the gateway upon receiving the sub-packets. If the CRC is invalid, the packet is discarded. At this point, it is unknown which device address’s data packets were discarded. Additionally, if the external CRC of a packet is lost, it will still pass the external CRC verification, but the gateway cannot verify the integrity of its internal data frame. Hence, an internal CRC is needed to check for packets discarded by the gateway, complete packet loss, or incomplete data. The gateway remains in the continuous receive mode, receiving packets until the timer expires, parsing the contents of each device address, and concatenating them into new data packets.
(4)
After the timer expires, the internal CRC verification for each new data packet is initiated. If it fails, the gateway clears the cache for that device address. After all internal CRC verifications, the gateway switches to the transmit mode, sending acknowledgment frames for successful reception or retransmission to each device address. After sending, it switches back to the continuous receive mode, waiting for re-reception.
(5)
After the sending is complete, the node switches to the receive mode, initiating a timer (with a duration greater than three times the gateway timer). If there is no acknowledgment or a retransmission acknowledgment frame is received, the node retransmits the data packet. Due to the half-duplex nature of LoRa communication, the scenario of multiple nodes engaging in random transmission and reception was not considered. In such situations, where multiple nodes engage in random transmission, the gateway may remain in the continuous receive mode, preventing it from responding to the nodes.
(6)
Steps (1)–(5) are repeated until the node successfully receives acknowledgment frames, concluding the current round of transmission.

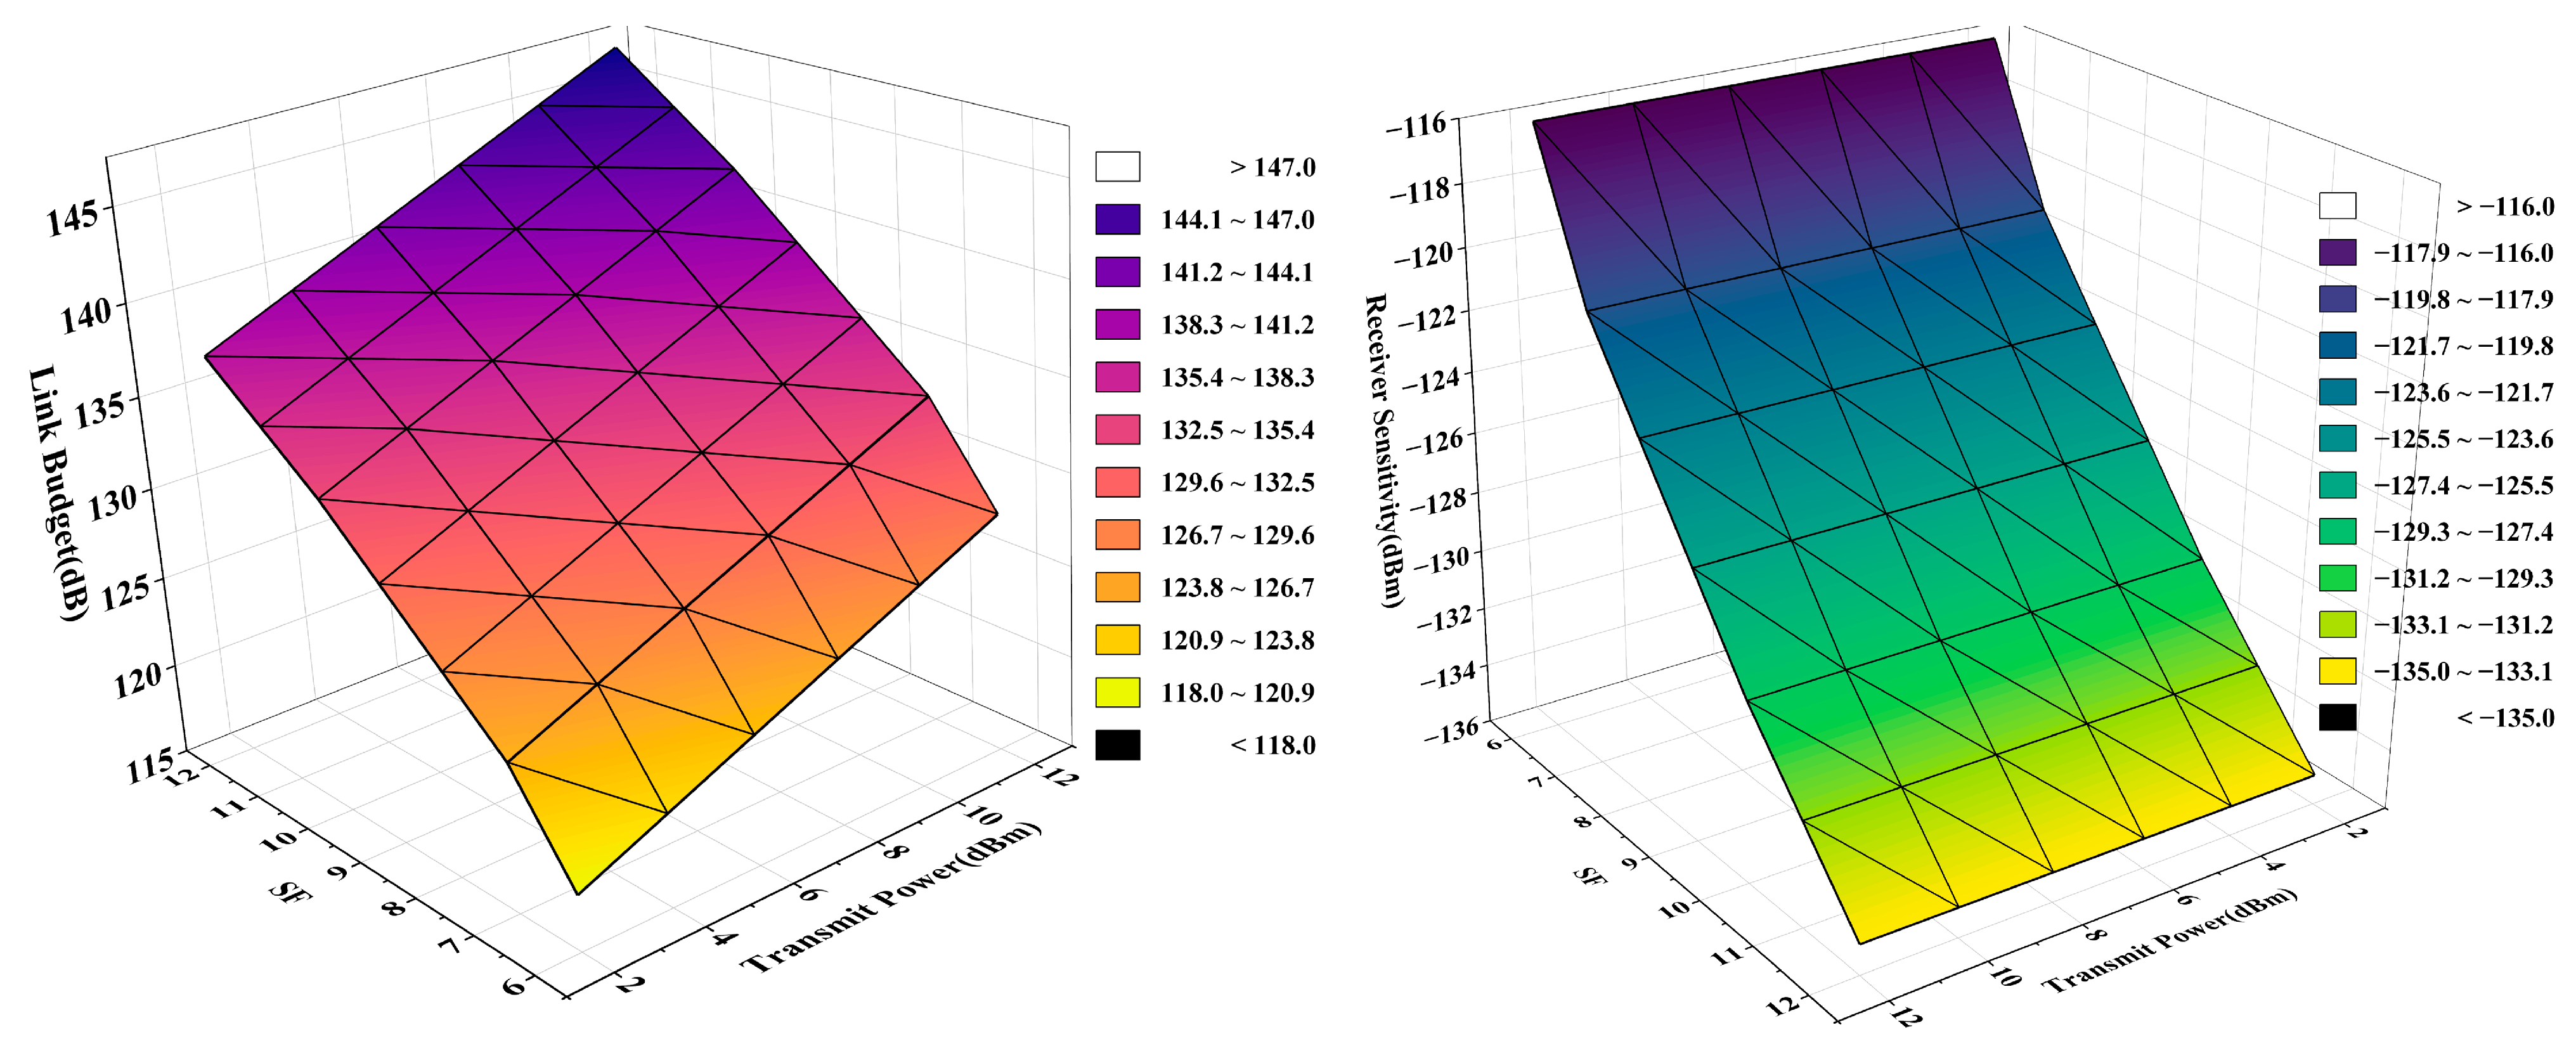
2.2. Theoretical Performance Calculation of LoRa

The objective of the theoretical performance calculation of LoRa is to identify parameters with a higher energy efficiency ratio to reduce unnecessary energy wastage and to identify the minimum feasible parameters under ideal conditions. Similar to the ADR, while ensuring reception rates, a lower power consumption is achieved by adjusting the performance parameters. However, distinctively, more extreme adjustments to the parameters were made through theoretical calculations specific to agricultural communication environments. Communication in agriculture can be affected by topography, vegetation density, etc., and requires a larger link budget; so, it is difficult to achieve a stable communication using the basic LoRa with parameters obtained from theoretical calculations, which were conducted to verify that the stable communication quality in the experiments came from the anti-frame loss mechanism rather than sufficient performance parameters.
The calculation results primarily encompass three aspects: time performance, energy consumption performance, and radio frequency (RF) performance. The time performance includes the time on air, reception time, and equivalent bit rate, providing an evaluation of LoRa’s communication speed. The energy consumption performance involves transmit consumption, receive consumption, and overall daily consumption, offering an assessment of LoRa’s energy efficiency. The RF performance includes the link budget and receive sensitivity, providing an evaluation of LoRa’s communication stability in specific environments. In the assessment of the RF performance, we compared the calculated theoretical performance with the link loss for an actual communication distance of 1 km to verify whether the theoretical performance meets the practical application requirements. The energy efficiency depends on both the time performance and RF performance, while the actual energy consumption is determined by the energy consumption performance.
The PHY settings include the spreading factor (SF), bandwidth (BW), and coding rate (CR) [24,25]. The CR was chosen to be a minimum of 4/5 to reduce the energy consumption. The BW was set to 125 kHz in accordance with the requirements for multiple nodes and the operating frequency range. Other parameters included a leading code length of 6, an implicit header, an operating band of 470 MHz, and a payload length of 20 bytes. The theoretical performance calculation was conducted using Semtech’s LoRa Calculator (Version 0.0.1.0), with the following main independent variables:
  • SF: Experimental range from 6 to 12 (7 levels).
  • TP: Considering communication range requirements of 500 m or more, TP ranges from 2 to 12 dBm (6 levels).
Other parameters included a CR (coding rate) of 4/5, BW (bandwidth) of 125 kHz, preamble length of 6, implicit header, operating frequency band of 470 MHz, and payload length of 20 bytes.

2.3. Multi-Node Parallel Packet Loss Rate Experiment under Strong and Weak Interferences

2.3.1. Packet Loss Rate: Experimental Materials and Methods

The experimental location was the Linjiang Ribbon Park near Haixinsha, Guangzhou, and eight nodes were synchronized for the transmitting and receiving experiments to evaluate the real performance of multi-node parallel communication. The transceiver interval, omnidirectional antenna gain, and communication distance were used as the independent variables. Two types of experiments included strong and weak interferenced. Using the SecureCRT SSH client on a computer to log in to the console control of the LoRa gateway, the tests were conducted with different time intervals (basic LoRa, 500 ms, 1000 ms, 1500 ms, and 2000 ms). For each scenario, 500 packets were sent to LoRa nodes, and upon reception, the nodes sent acknowledgment data back to the LoRa gateway. The entire process was repeated three times, and the average number of data packets received by the gateway was calculated across the three tests.
Applying the maximum energy efficiency ratio parameters and PHY frame loss prevention mechanism to the self-designed gateway and nodes, practical tests were conducted with the following experimental objectives:
(1)
Validation of the PHY anti-frame loss mechanism’s impact on the reception rates under the maximum energy efficiency ratio parameters and assessing whether its actual performance meets real-world application needs: Premsankar et al. [21] conducted transmission experiments in a 500 m × 500 m urban area, showing an 8% improvement in reception rates compared to the existing technologies. The overall reception rates were mainly concentrated within the range of [80%, 90%], with the highest reception rate close to 93%. This study considered reception rates above 85% as a good communication quality and the distance with reception rates above 85% as the effective distance.
(2)
Determination of the optimal transmission and reception interval for different distances: The transmission and reception interval length determines the number of times the PHY frame loss prevention mechanism operates. One interval ensures the smooth transmission of one data packet. For example, in this experiment, a complete transmission and reception cycle took 150 ms (the gateway opened a timer for 100 ms after sending, and responding to the node took 50 ms). Therefore, with a 500 ms interval, there were a maximum of 4 opportunities for transmission and reception. Larger intervals mean more operations of the frame loss prevention mechanism.
(3)
Evaluation of the omnidirectional antenna gain effects and optimal selection of the omnidirectional antenna power: The antenna power is a direct factor influencing the link budget and power consumption. The experiment aimed to assess the gain effects of different omnidirectional antennas and determine the optimal choice for the omnidirectional antenna power.
Based on the maximum energy efficiency ratio, the parameters for the SX1278 were configured as follows:
SF: Set to 6. TP: Set to 2 dBm. These settings were complemented by the other parameters as specified in the theoretical performance calculation.
The communication band for the LoRa node’s wireless local area network (WLAN) was established within the 470–510 MHz range. The LoRa WLAN communication channel consisted of both the uplink and downlink channels, utilizing a heterodyne frequency approach to avoid packet conflicts [26], as detailed in Table 2. The per-channel bandwidth of LoRa WLAN was 125 KHz, where a space of 75 KHz was reserved for isolating the neighboring channels and preventing the signals of neighboring channels from interfering with each other. The gateway was developed based on the embedded Linux and the nodes were subjected to embedded development based on STM32L151C8T6A, with the C language as the main language for functional development.
For hardware, SX1278 was selected for the gateway and node fabrication. As shown in Figure 2a, the gateway includes a SX1278 LoRa transceiver circuit, MT762NN SOC master control circuit, power supply module, etc. Among them, the SOC master control circuit was used to process all the information of the gateway, including running the anti-frame loss mechanism, node entry, CAD monitoring, decoding, and the storing of the transceiver information. As shown in Figure 2b, the node includes a LoRa transceiver circuit, STM32L151C8T6A master control circuit, power supply module, sensor communication circuit, etc. The master control circuit was used to process the information from the sensors and the gateway, package the information, control the sending and receiving of the node, run the anti-frame loss mechanism, etc. The sensor communication circuit was used to connect sensors with different interfaces and protocols, read data to the sensors, and supply power. It is worth mentioning that the experimental gateway adopts a single-channel reception mode with a single LoRa receiver circuit and CAD channel detection to show the role of the anti-frame loss mechanism as much as possible. The gateway in real applications can be designed as a multi-channel gateway to obtain a higher performance.
Some of the test materials are shown in Figure 2c. The overall list is provided below:
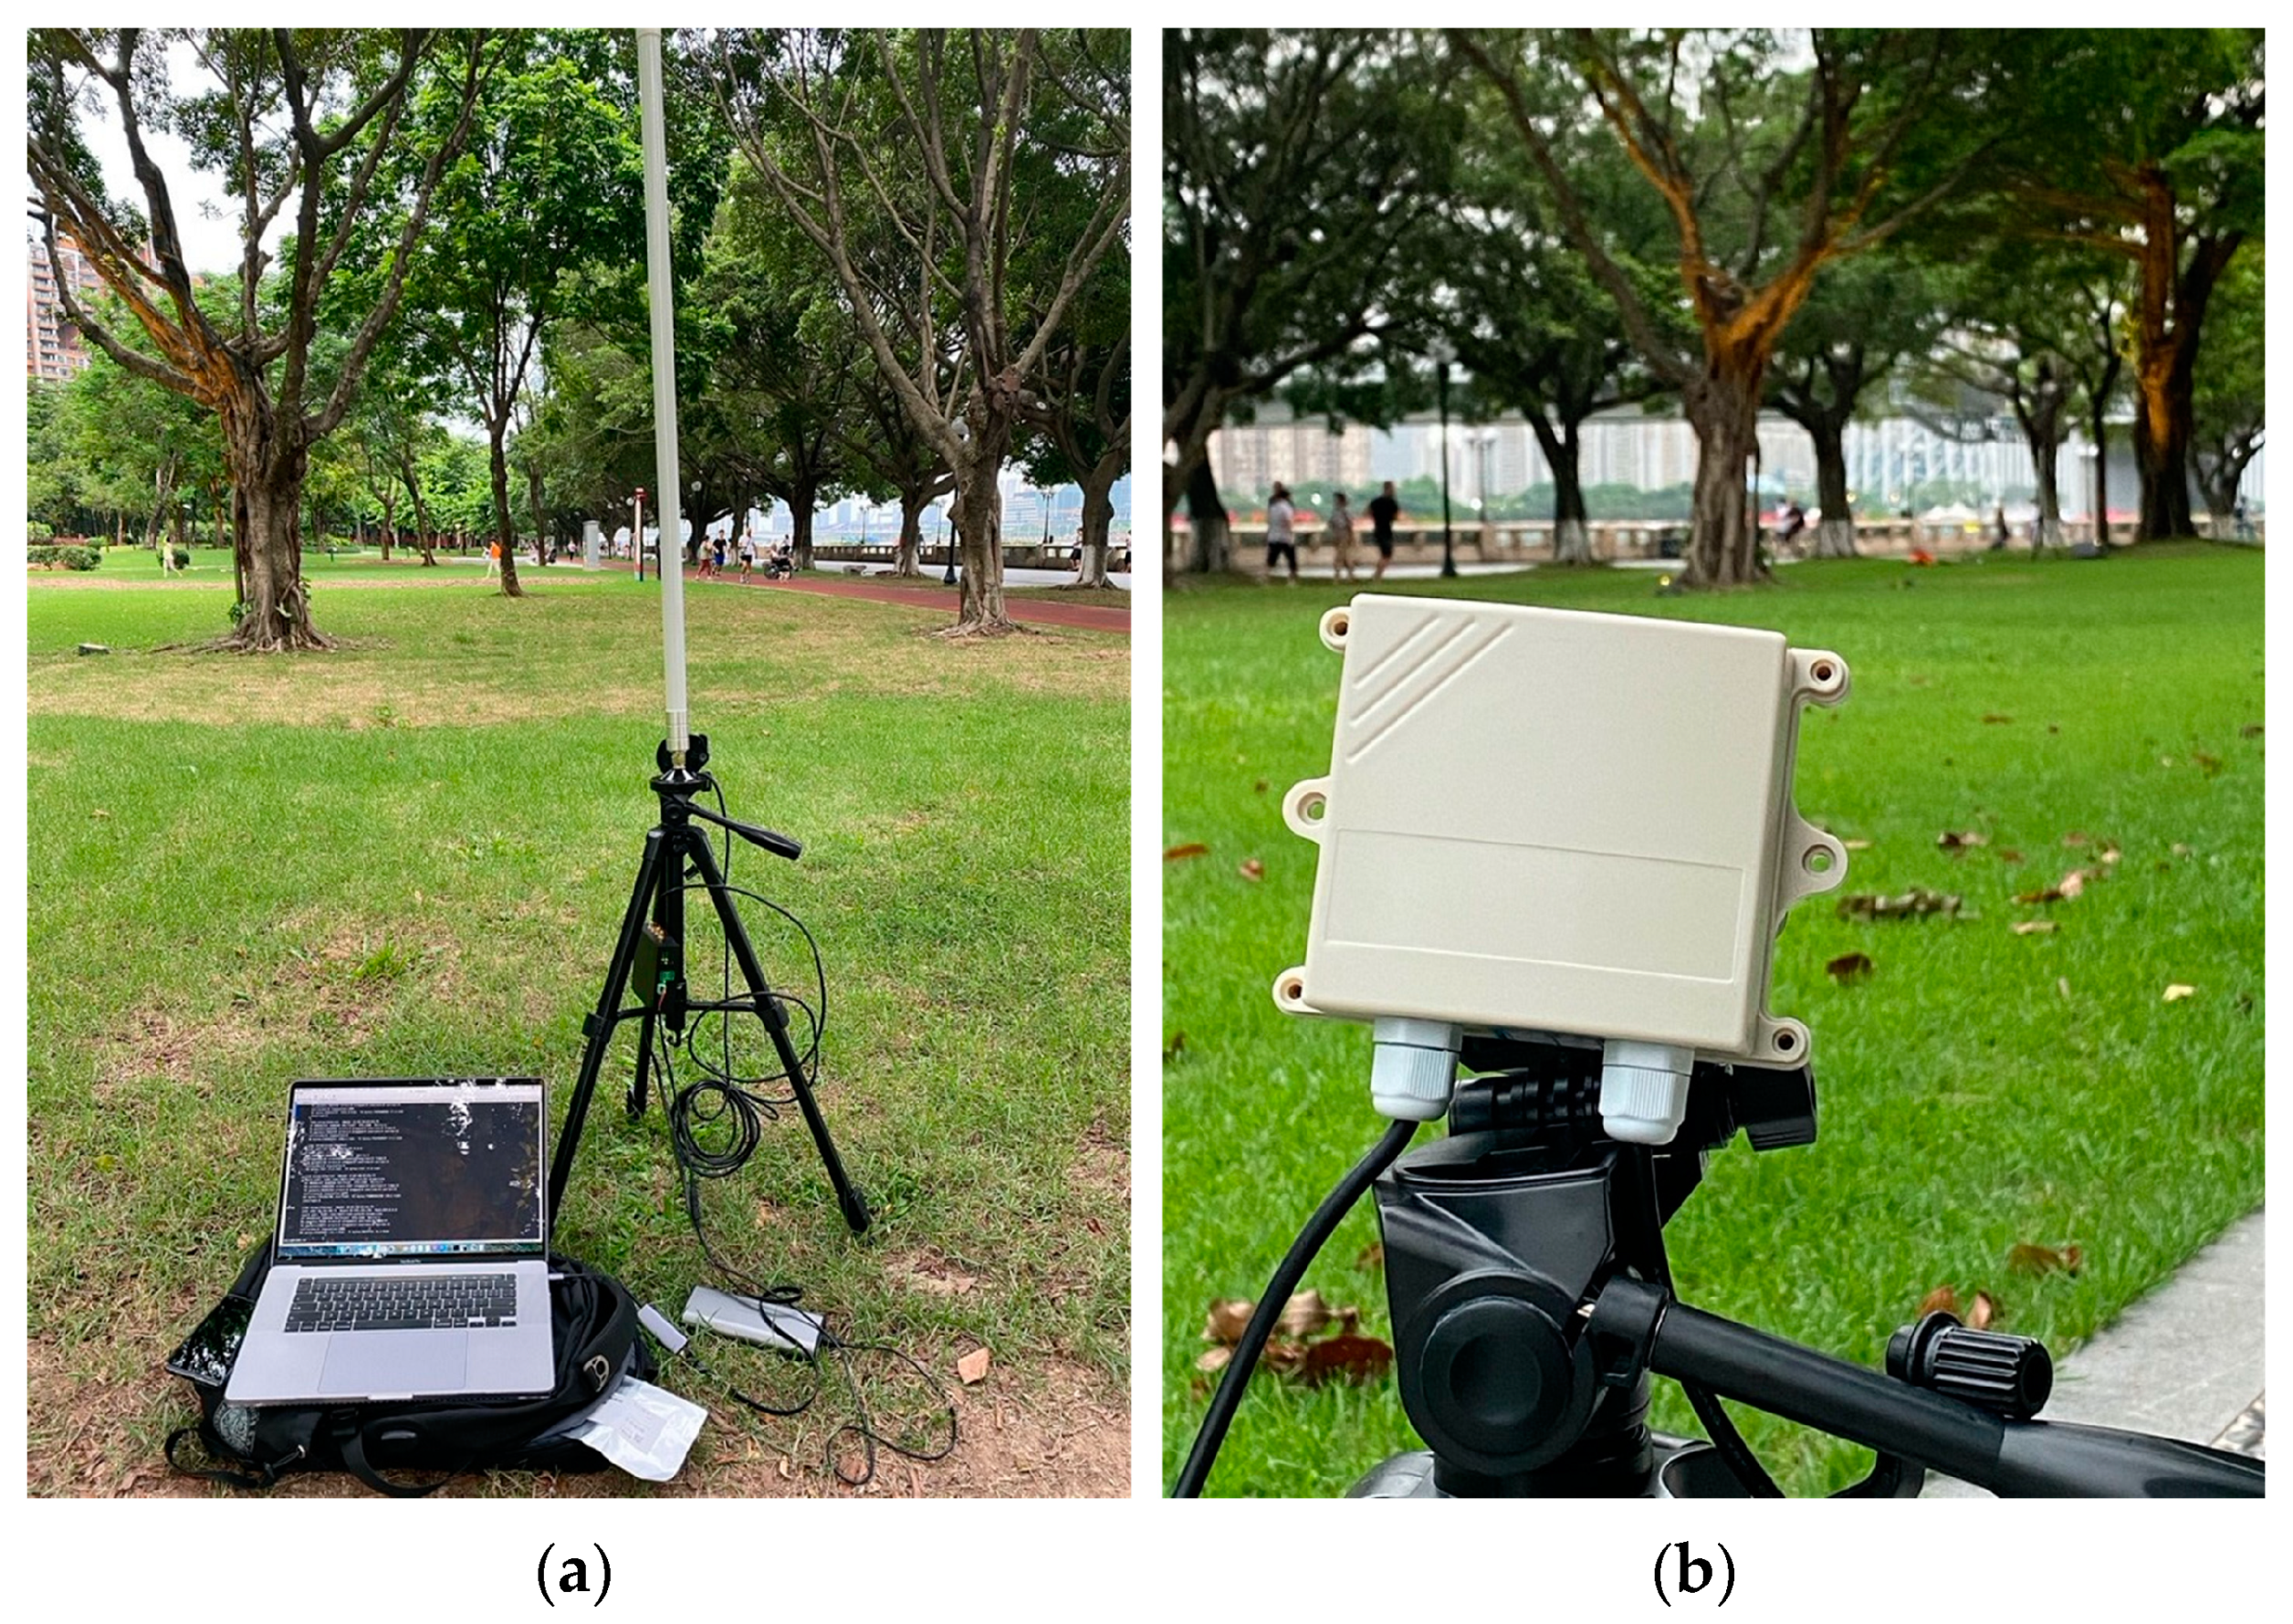
  • Eight LoRa pressure collection nodes with 1 dBi soft FPC omnidirectional antennas installed;
  • A 1 × 3 dBi 470–510 MHz omnidirectional antenna; 1 × 6 dBi 470–510 MHz omnidirectional antenna; and 1 × 8 dBi 470–510 MHz omnidirectional antenna;
  • One suction cup omnidirectional antenna base with a 3 m feed line;
  • One PC with the SecureCRT software (Version 8.7.3);
  • One long RJ45 twisted pair network cable of 1 m;
  • A 3.7 V 18.5 Wh lithium battery pack (8);
  • Mobile power supply with QC3.0 support and 12 V 1 A output;
  • Two tripods;
  • Other cables.
In Figure 3a, the LoRa gateway is positioned at the starting coordinates (Figure 4 or Figure 5, starting point), and various omnidirectional antennas with gains of 3 dBi, 6 dBi, and 8 dBi are utilized. The base of each omnidirectional antenna is 1 m above the ground.
In Figure 3b, the LoRa nodes are arranged with tripods at specified target distances. They are equipped with built-in 1 dBi omnidirectional antennas and are positioned 1 m above the ground.

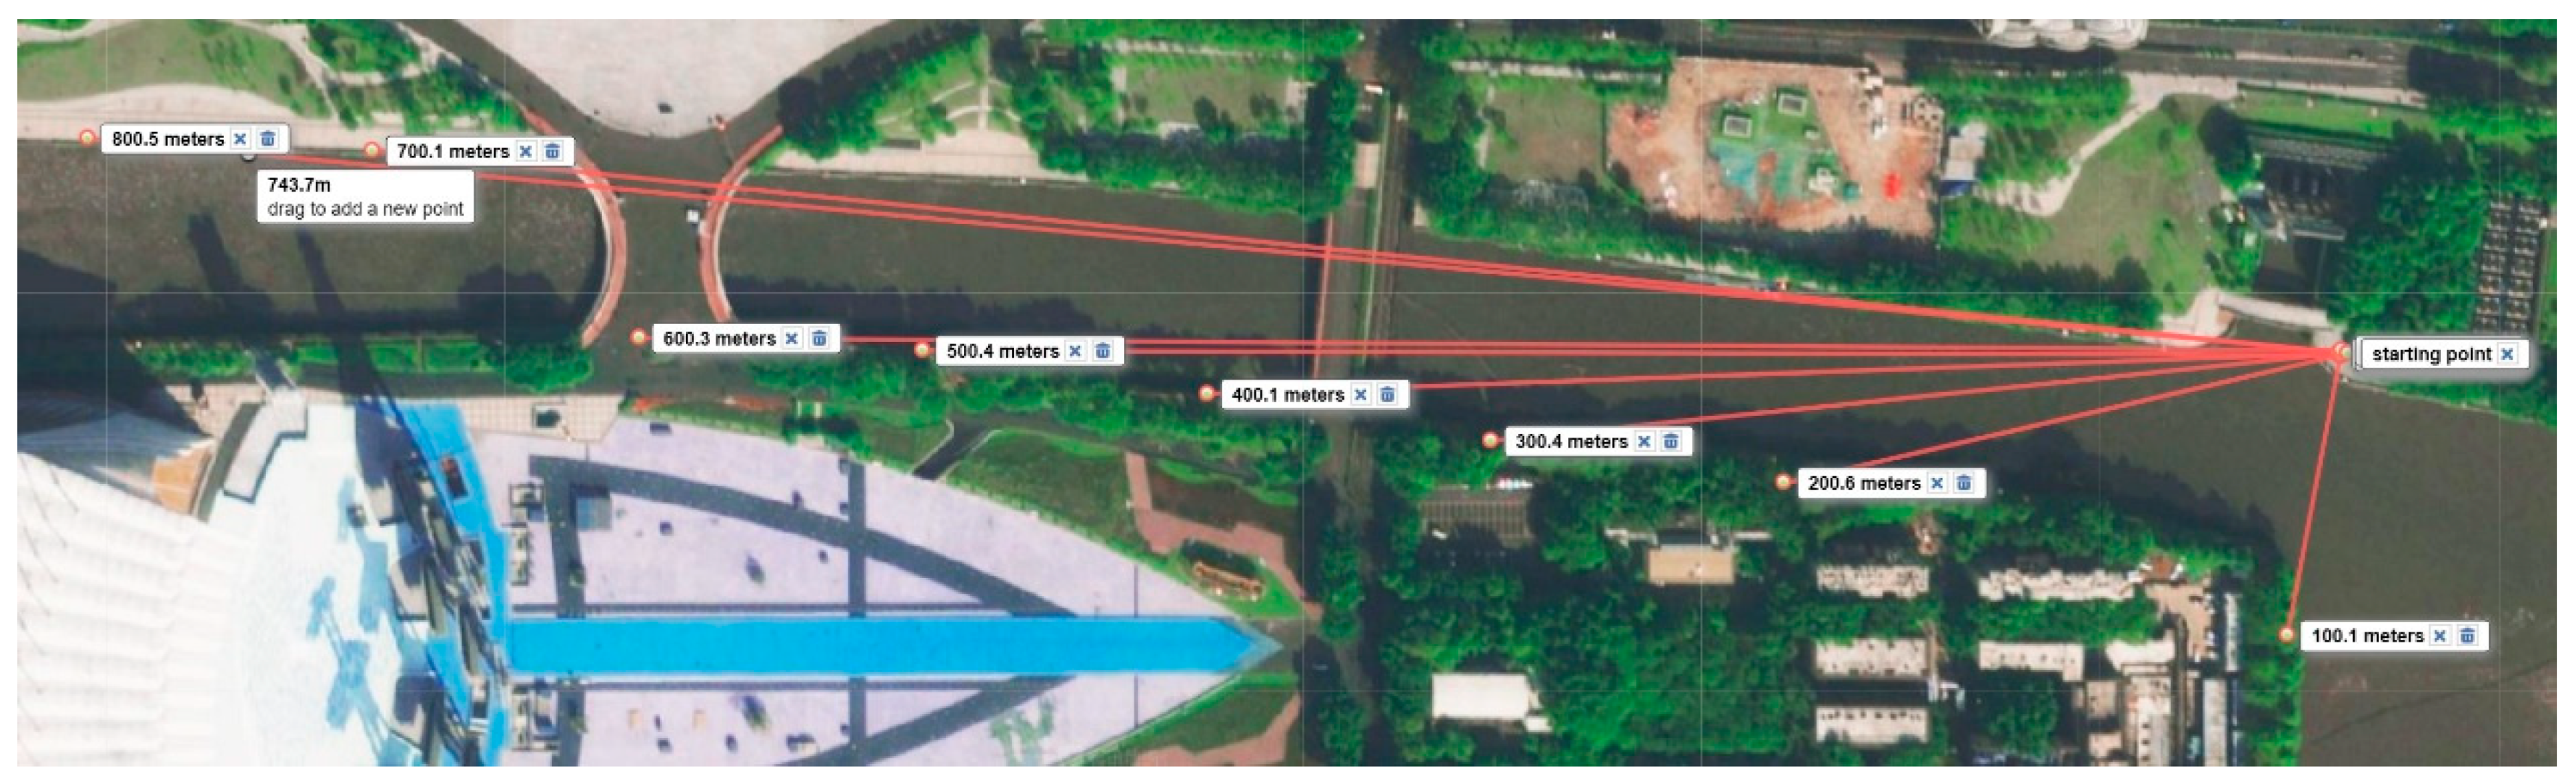
2.3.2. Strong Interference Packet Loss Rate: Experimental Location

The strong interference experiment was conducted in the woods of Linjiang Belt Park, where the trees are about 3 m apart and 2.5 m high, with more pedestrians, and located in the center of Tianhe District, Guangzhou City, where there are numerous trees and other wireless signals with strong interference [20]. The specific location is shown in Figure 4, where LoRa nodes are arranged using tripods at the coordinates of 50 m, 100 m, 150 m, 200 m, 250 m, 300 m, 350 m, and 400 m.

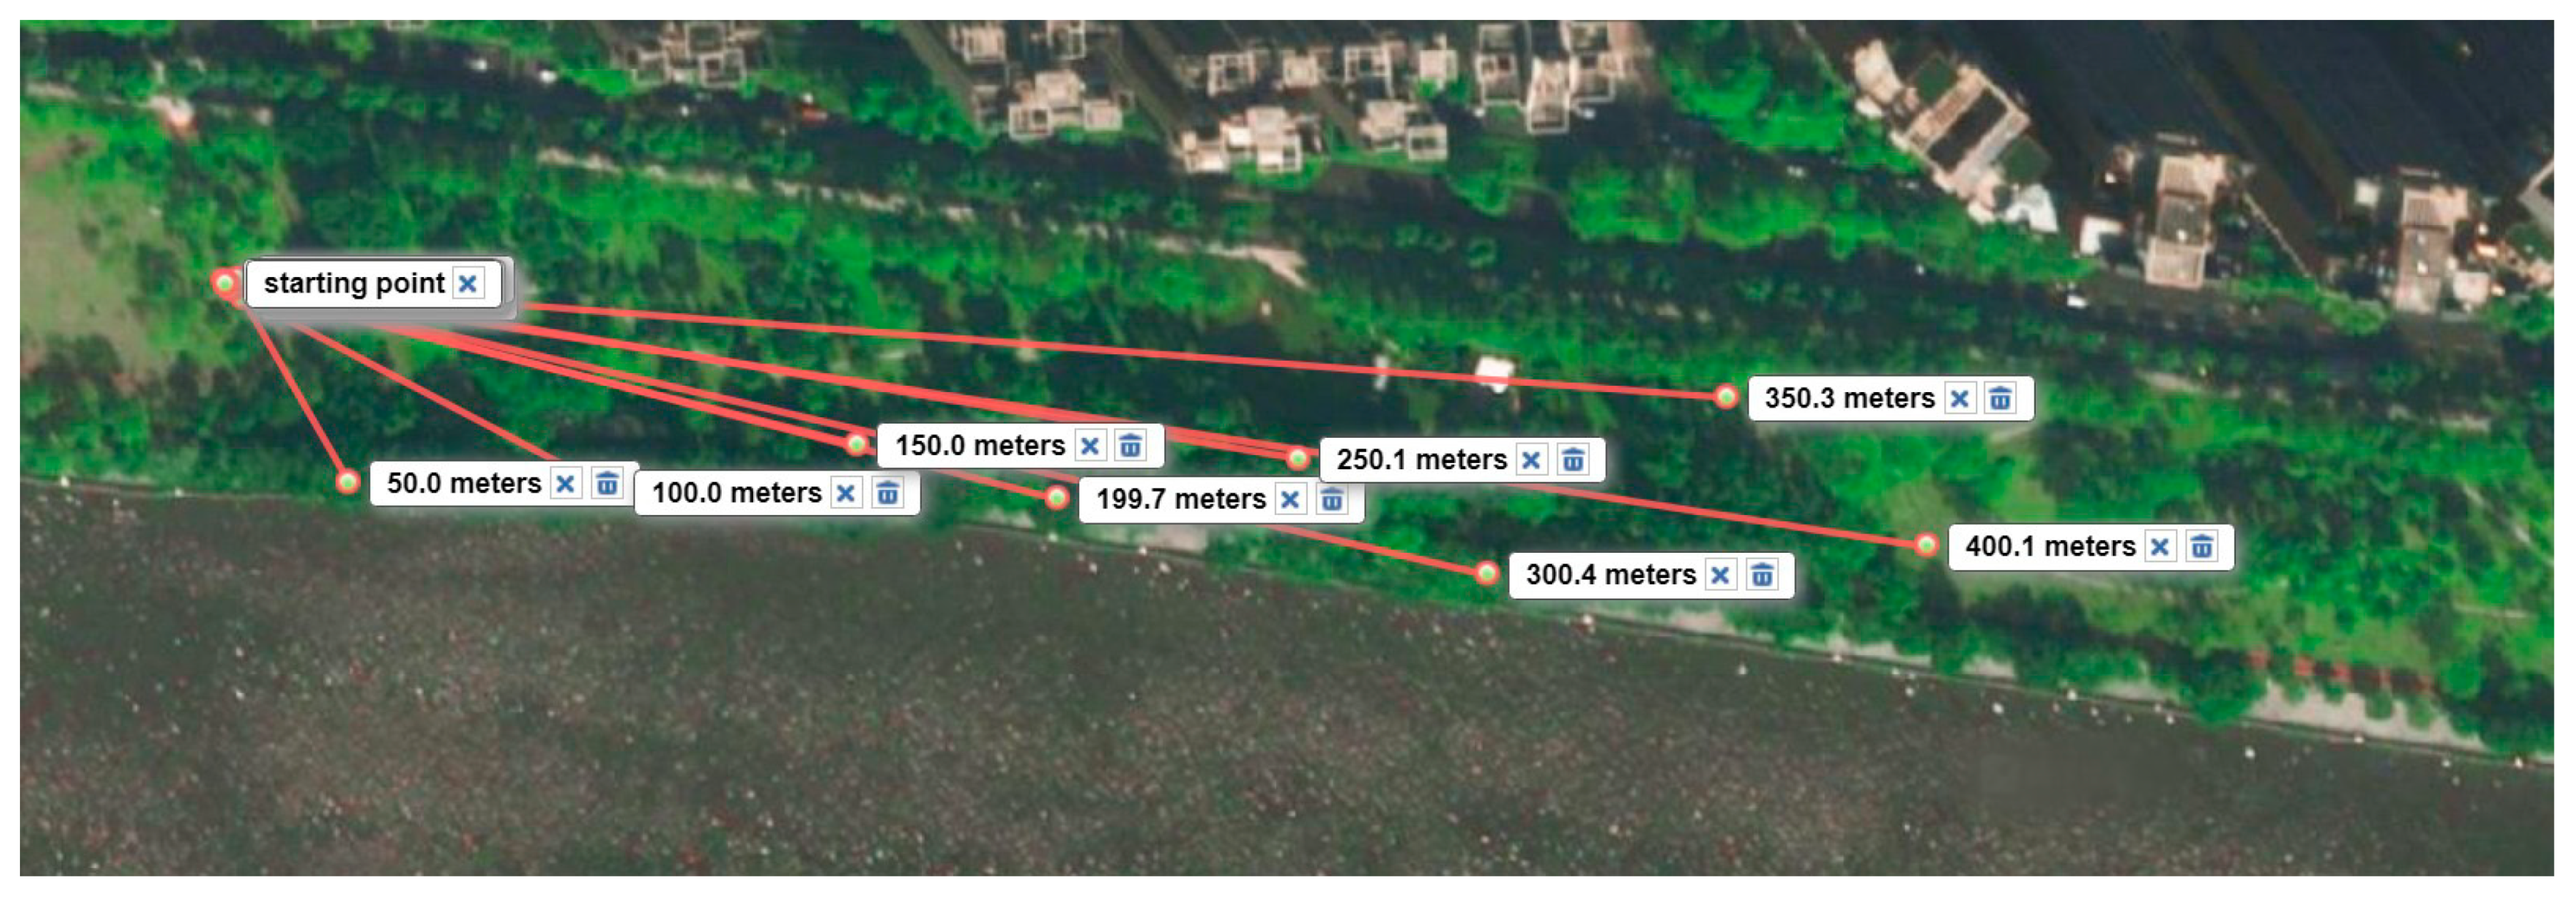
2.3.3. Weak Interference Packet Loss Rate: Experimental Location

The low interference experiments were conducted at the Pearl River boundary on the periphery of the Linjiang Belt Park, where the communication space is above the Pearl River with no obstructions and less interference from other wireless signals. The specific location is shown in Figure 5. LoRa nodes were arranged at 100 m, 200 m, 300 m, 400 m, 500 m, 600 m, 700 m, and 800 m from the starting point using tripods.

3. Results and Discussion

3.1. LoRa Performance Simulation Experiment

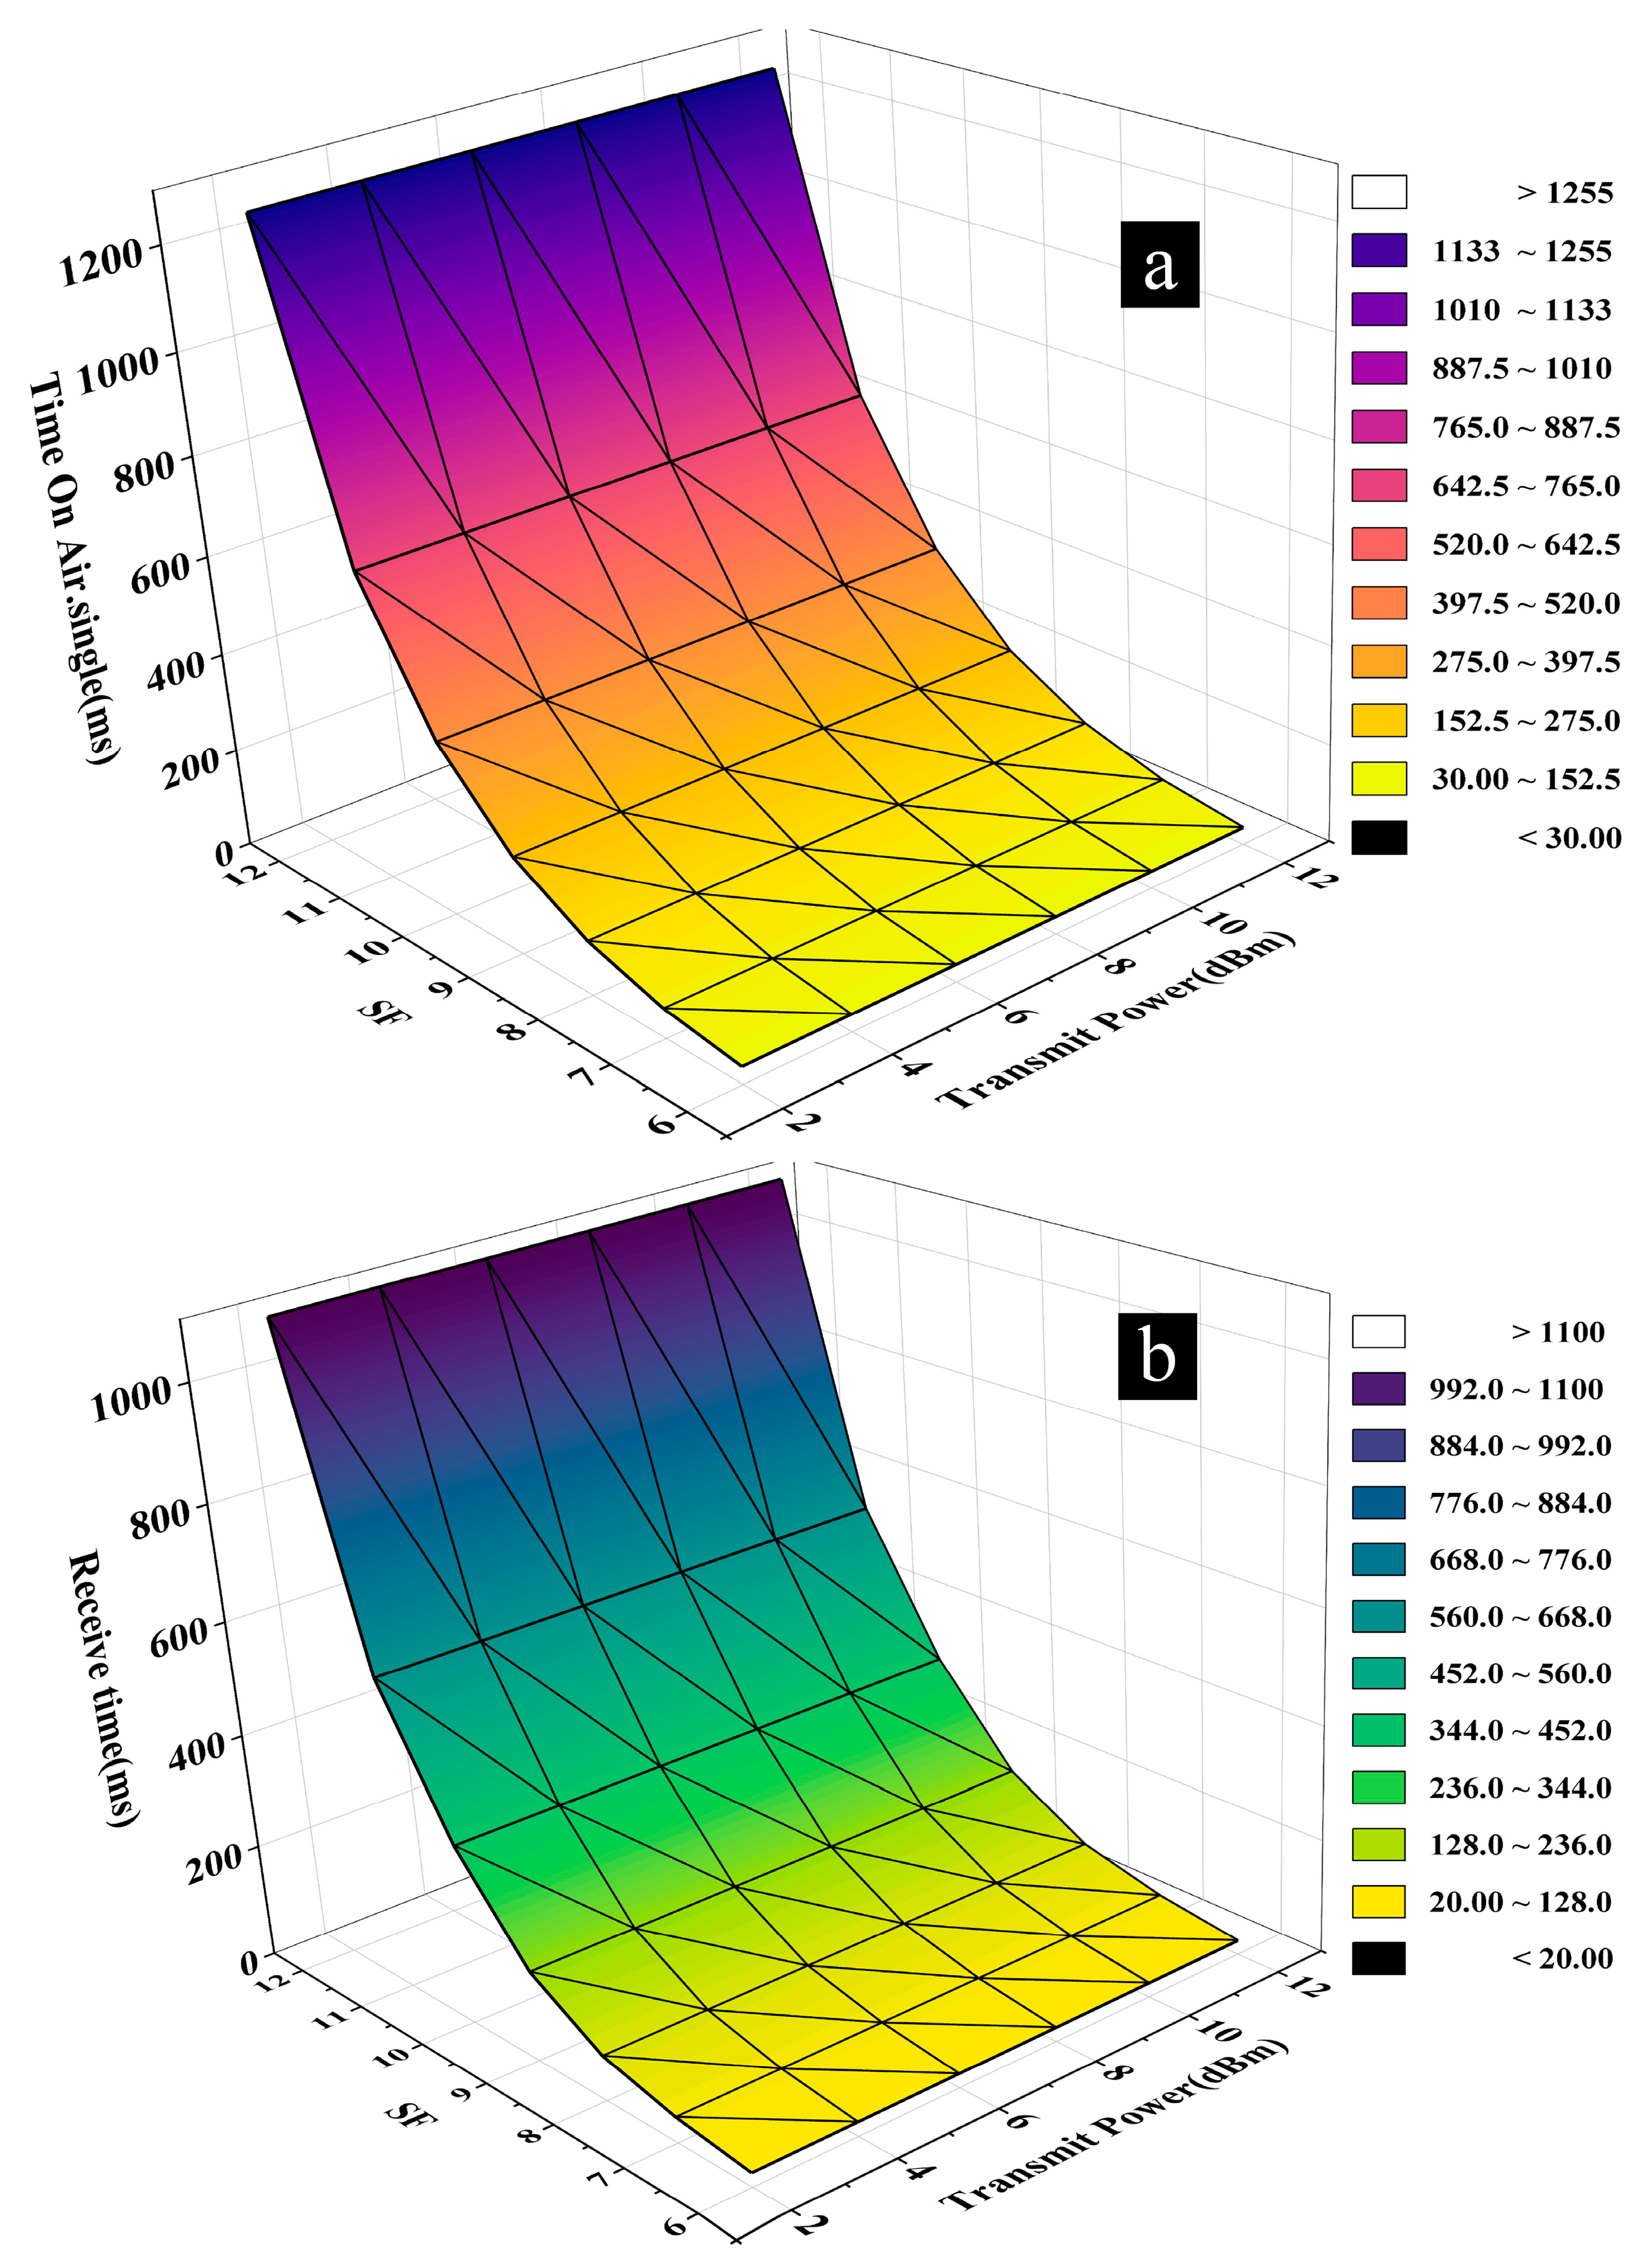
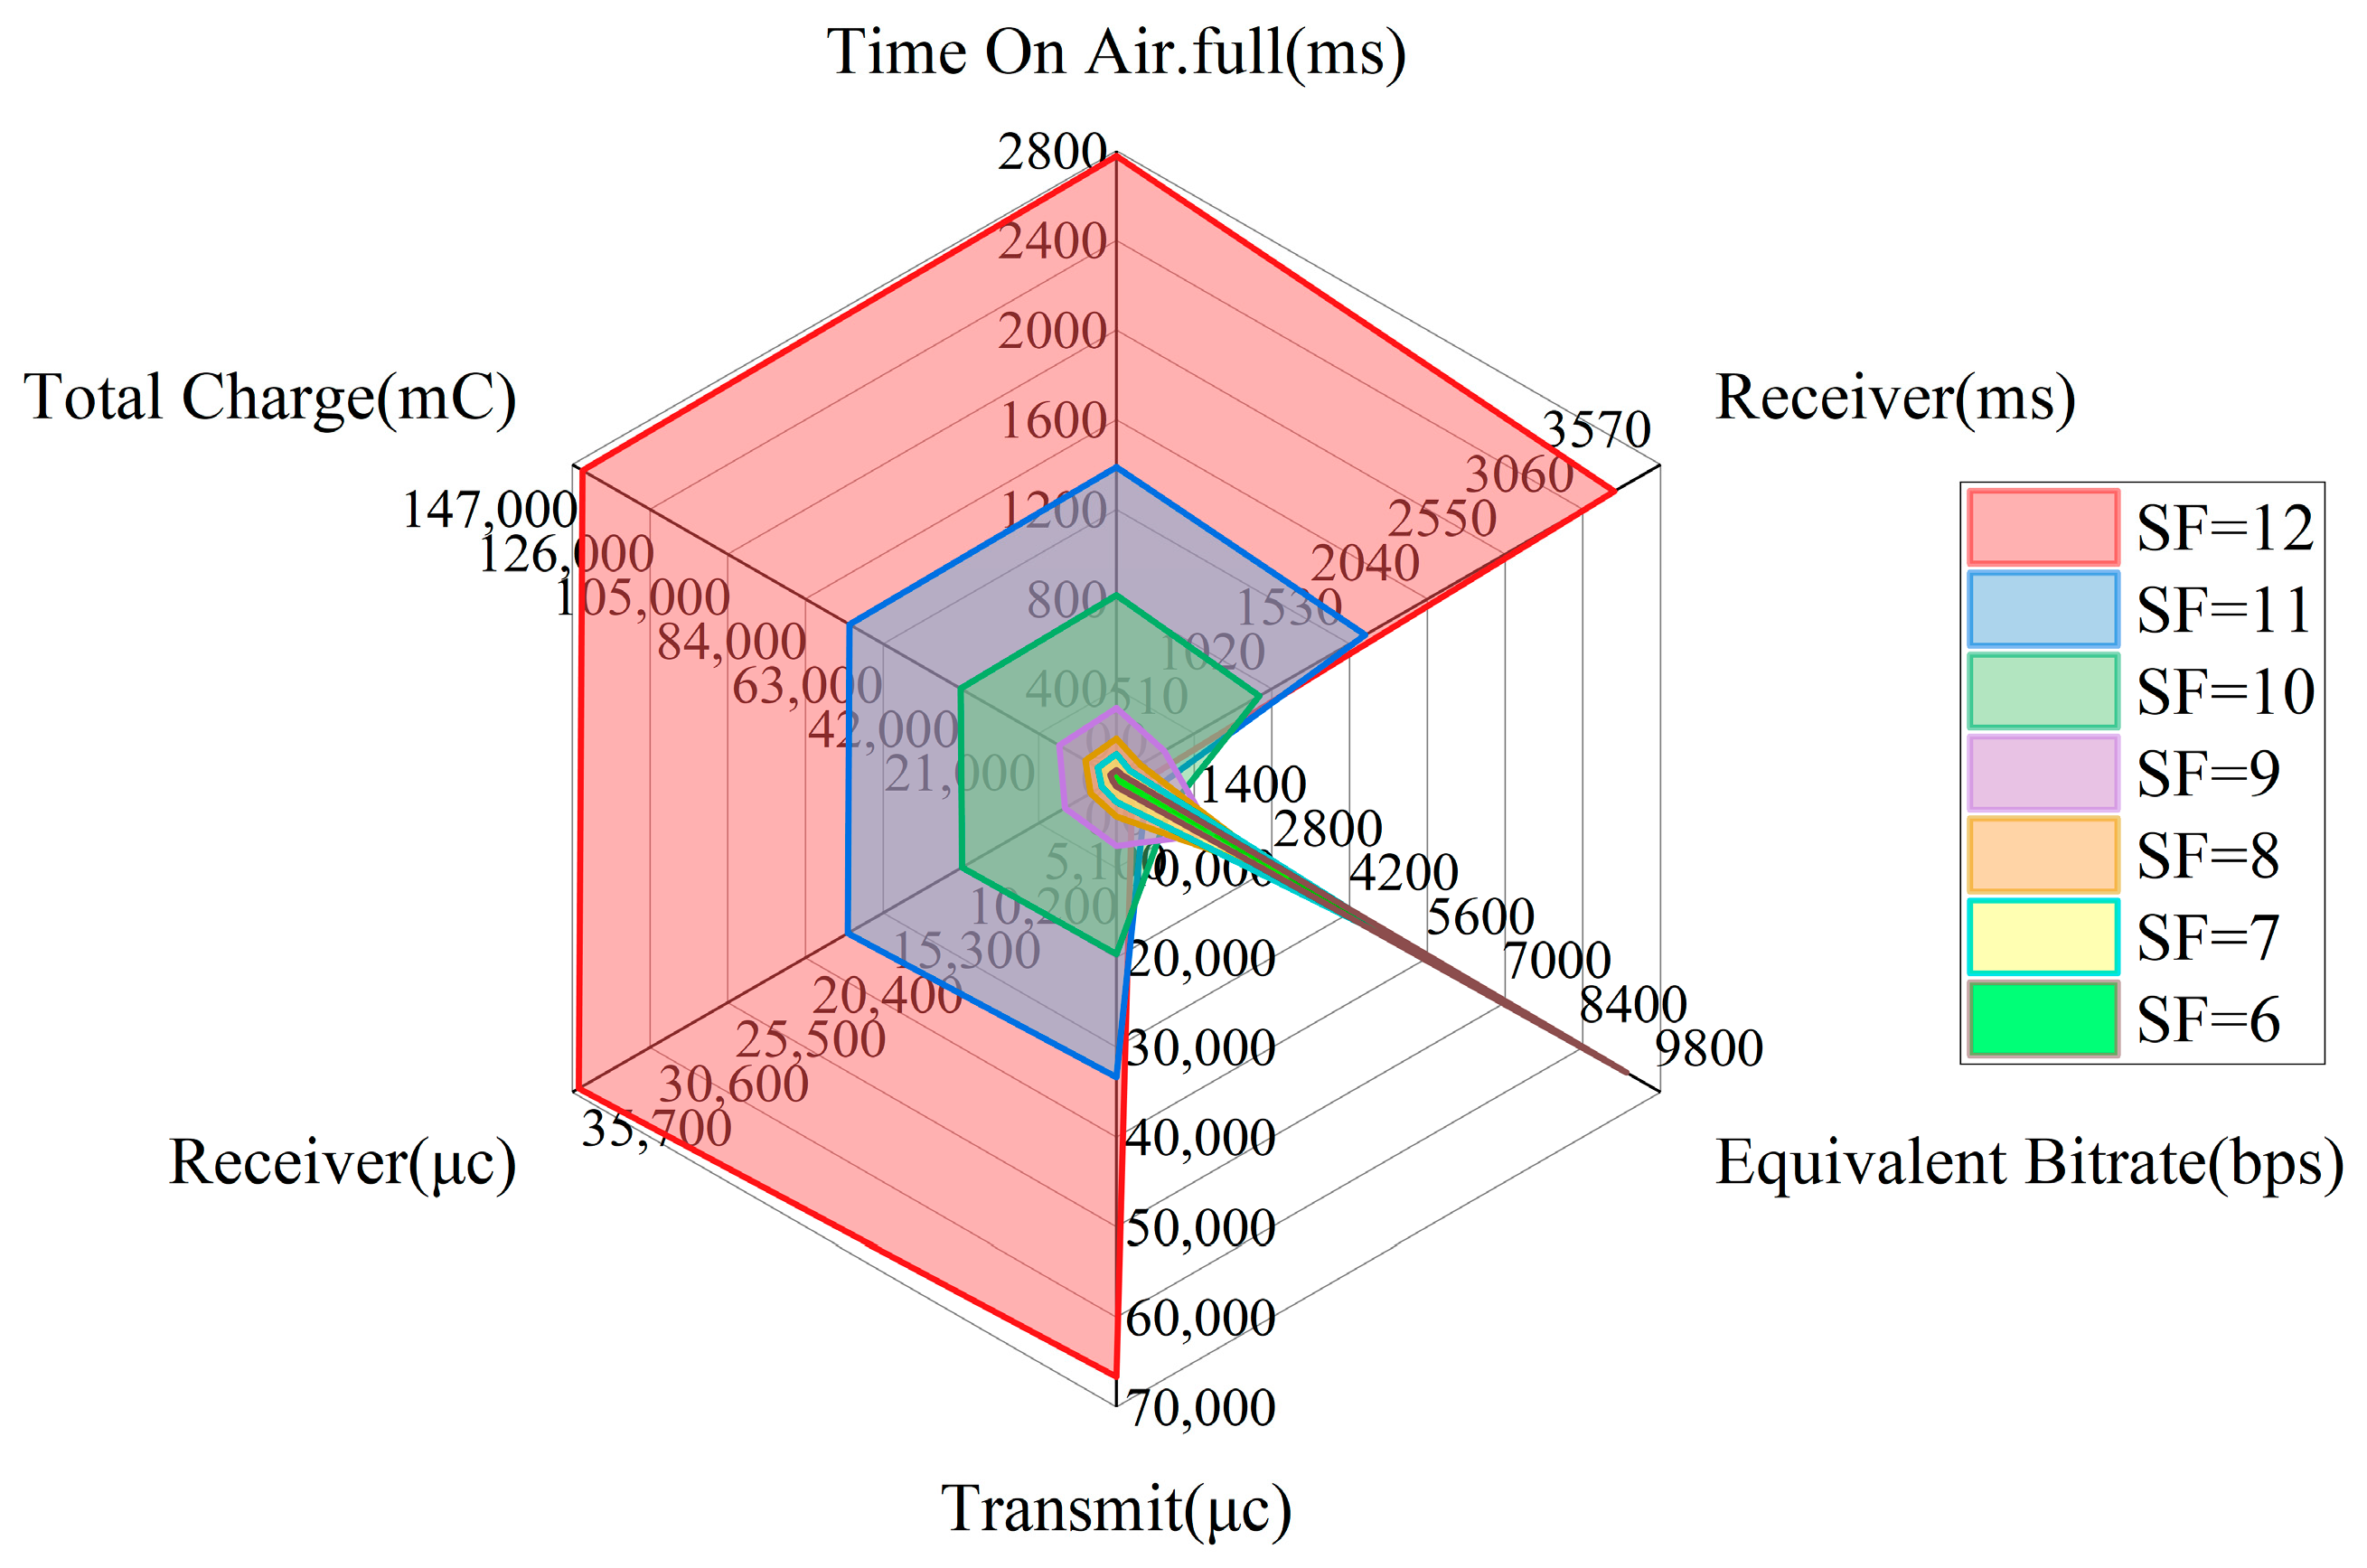
3.1.1. Time Performance

The relationship between the time on air TOA and the symbolic period Tsym is shown in Equation (2):
T O A = T s y m × SymbNb
The relationship among Tsym, SF, and BW is shown in Equation (3):
T s y m = 2 S F BW
In the case of a 12-byte data payload, implicit header, and low data rate mode with a coding rate (CR) of 4/5, the calculation for SymbNb is expressed by Equation (4):
SymbNb = 8 + max ( ceil ( 96 4 S F + 24 4 ( S F 2 ) ) × 5 , 0 )
Therefore, as depicted in Figure 6a, TOA is only affected by SF when BW is fixed. TOA exhibits an exponential growth concerning SF. For instance, SF = 12 results in a maximum TOA of 1253.38 ms, while SF = 6 corresponds to a minimum TOA of 34.94 ms, representing a substantial difference of 34.87 times. On average, each increase in the SF level leads to an 81.82% growth in TOA. It is important to note that longer TOA durations increase the likelihood of frame drops, making it advisable to select parameters with smaller SF values for a reduced TOA.
In Figure 6b, the reception time is associated with the LoRa spread spectrum modulation technology and is solely influenced by SF, exhibiting an exponential growth. SF = 12 yields a maximum receive time of 1097.7 ms, whereas SF = 6 results in a minimum receive time of 24.8 ms, representing a significant difference of 43.26 times. On average, each SF level increase leads to an 88.44% growth in the receive time. Longer reception times also correlate with a higher probability of frame loss; so, smaller SF values should be chosen to mitigate this risk.
In Figure 6c, please note that the horizontal axis of this graph is reversed compared to the previous two graphs. The equivalent bit rate is exclusively affected by SF, with larger SF values resulting in smaller equivalent bit rates. SF = 12 is associated with a minimum equivalent bit rate of 292.97 bps, while SF = 6 corresponds to a maximum equivalent bit rate of 9375 bps, representing a nearly 32-fold difference. On average, each SF level increase leads to a 43.86% decrease in the equivalent bit rate. Overall, the results suggest that the time performance is independent of TP and primarily influenced by SF, with a negative correlation between the time performance and SF. Smaller SF values are preferred to optimize time-related metrics in LoRa communication.

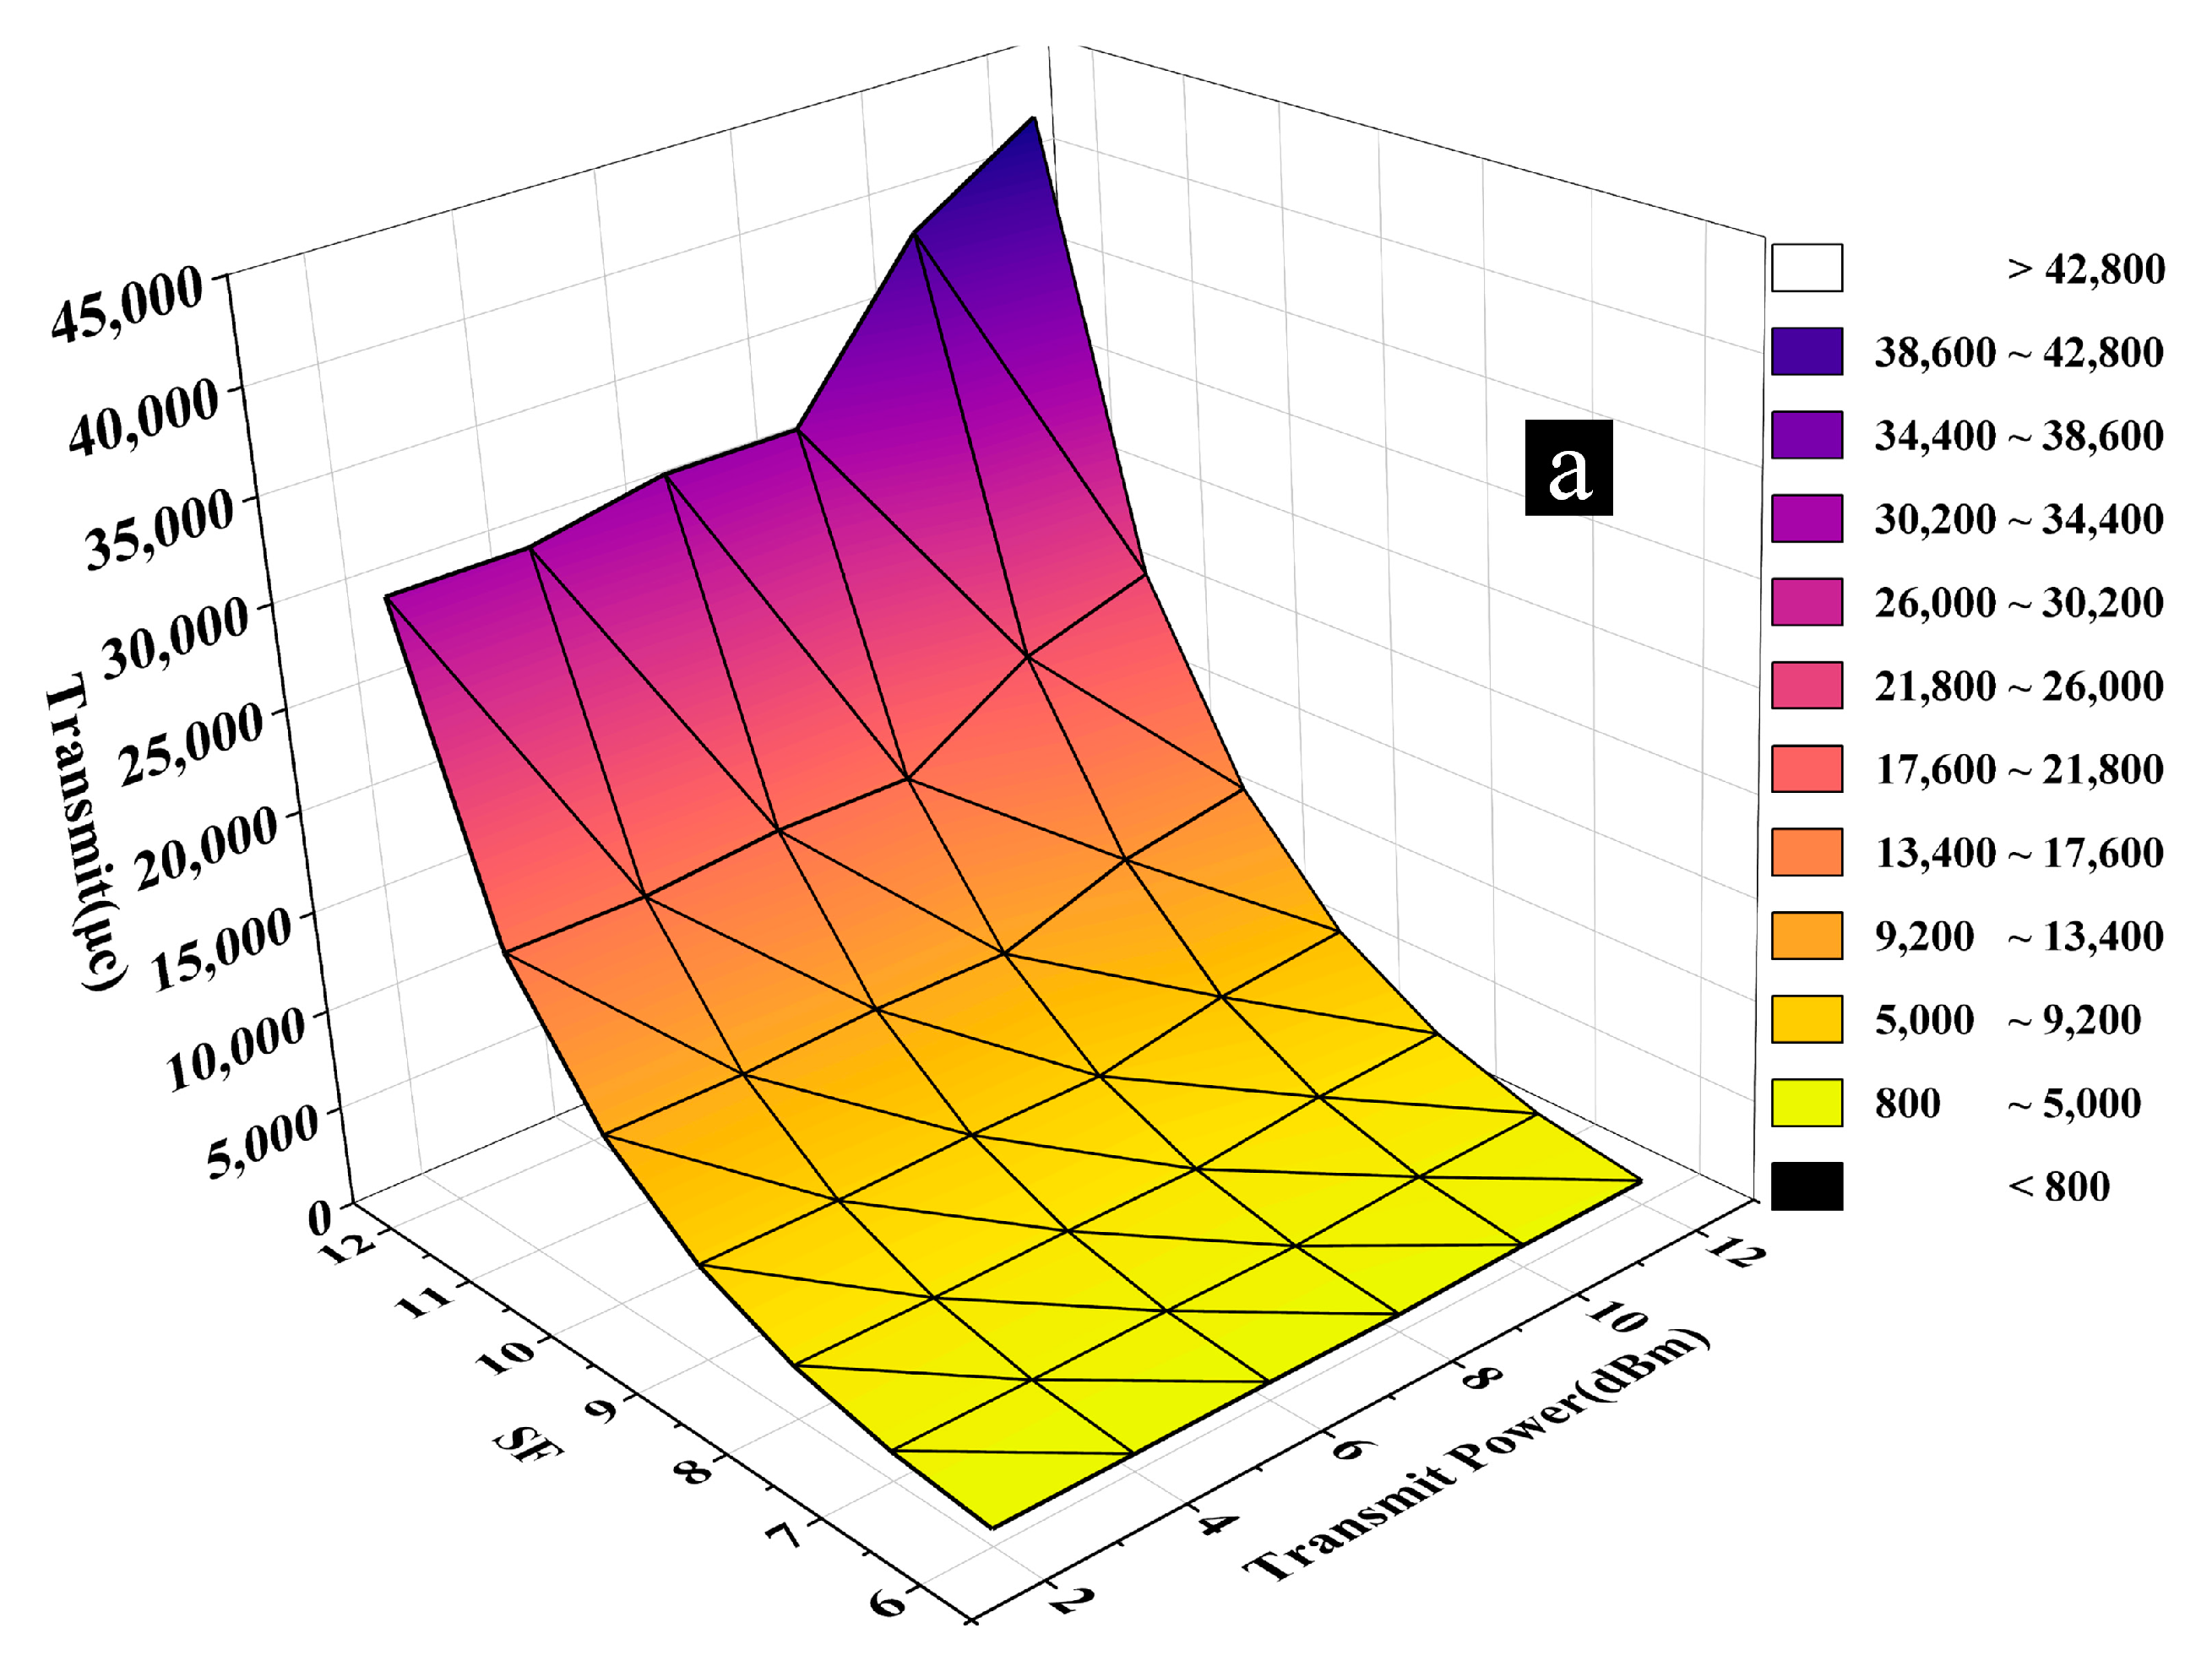
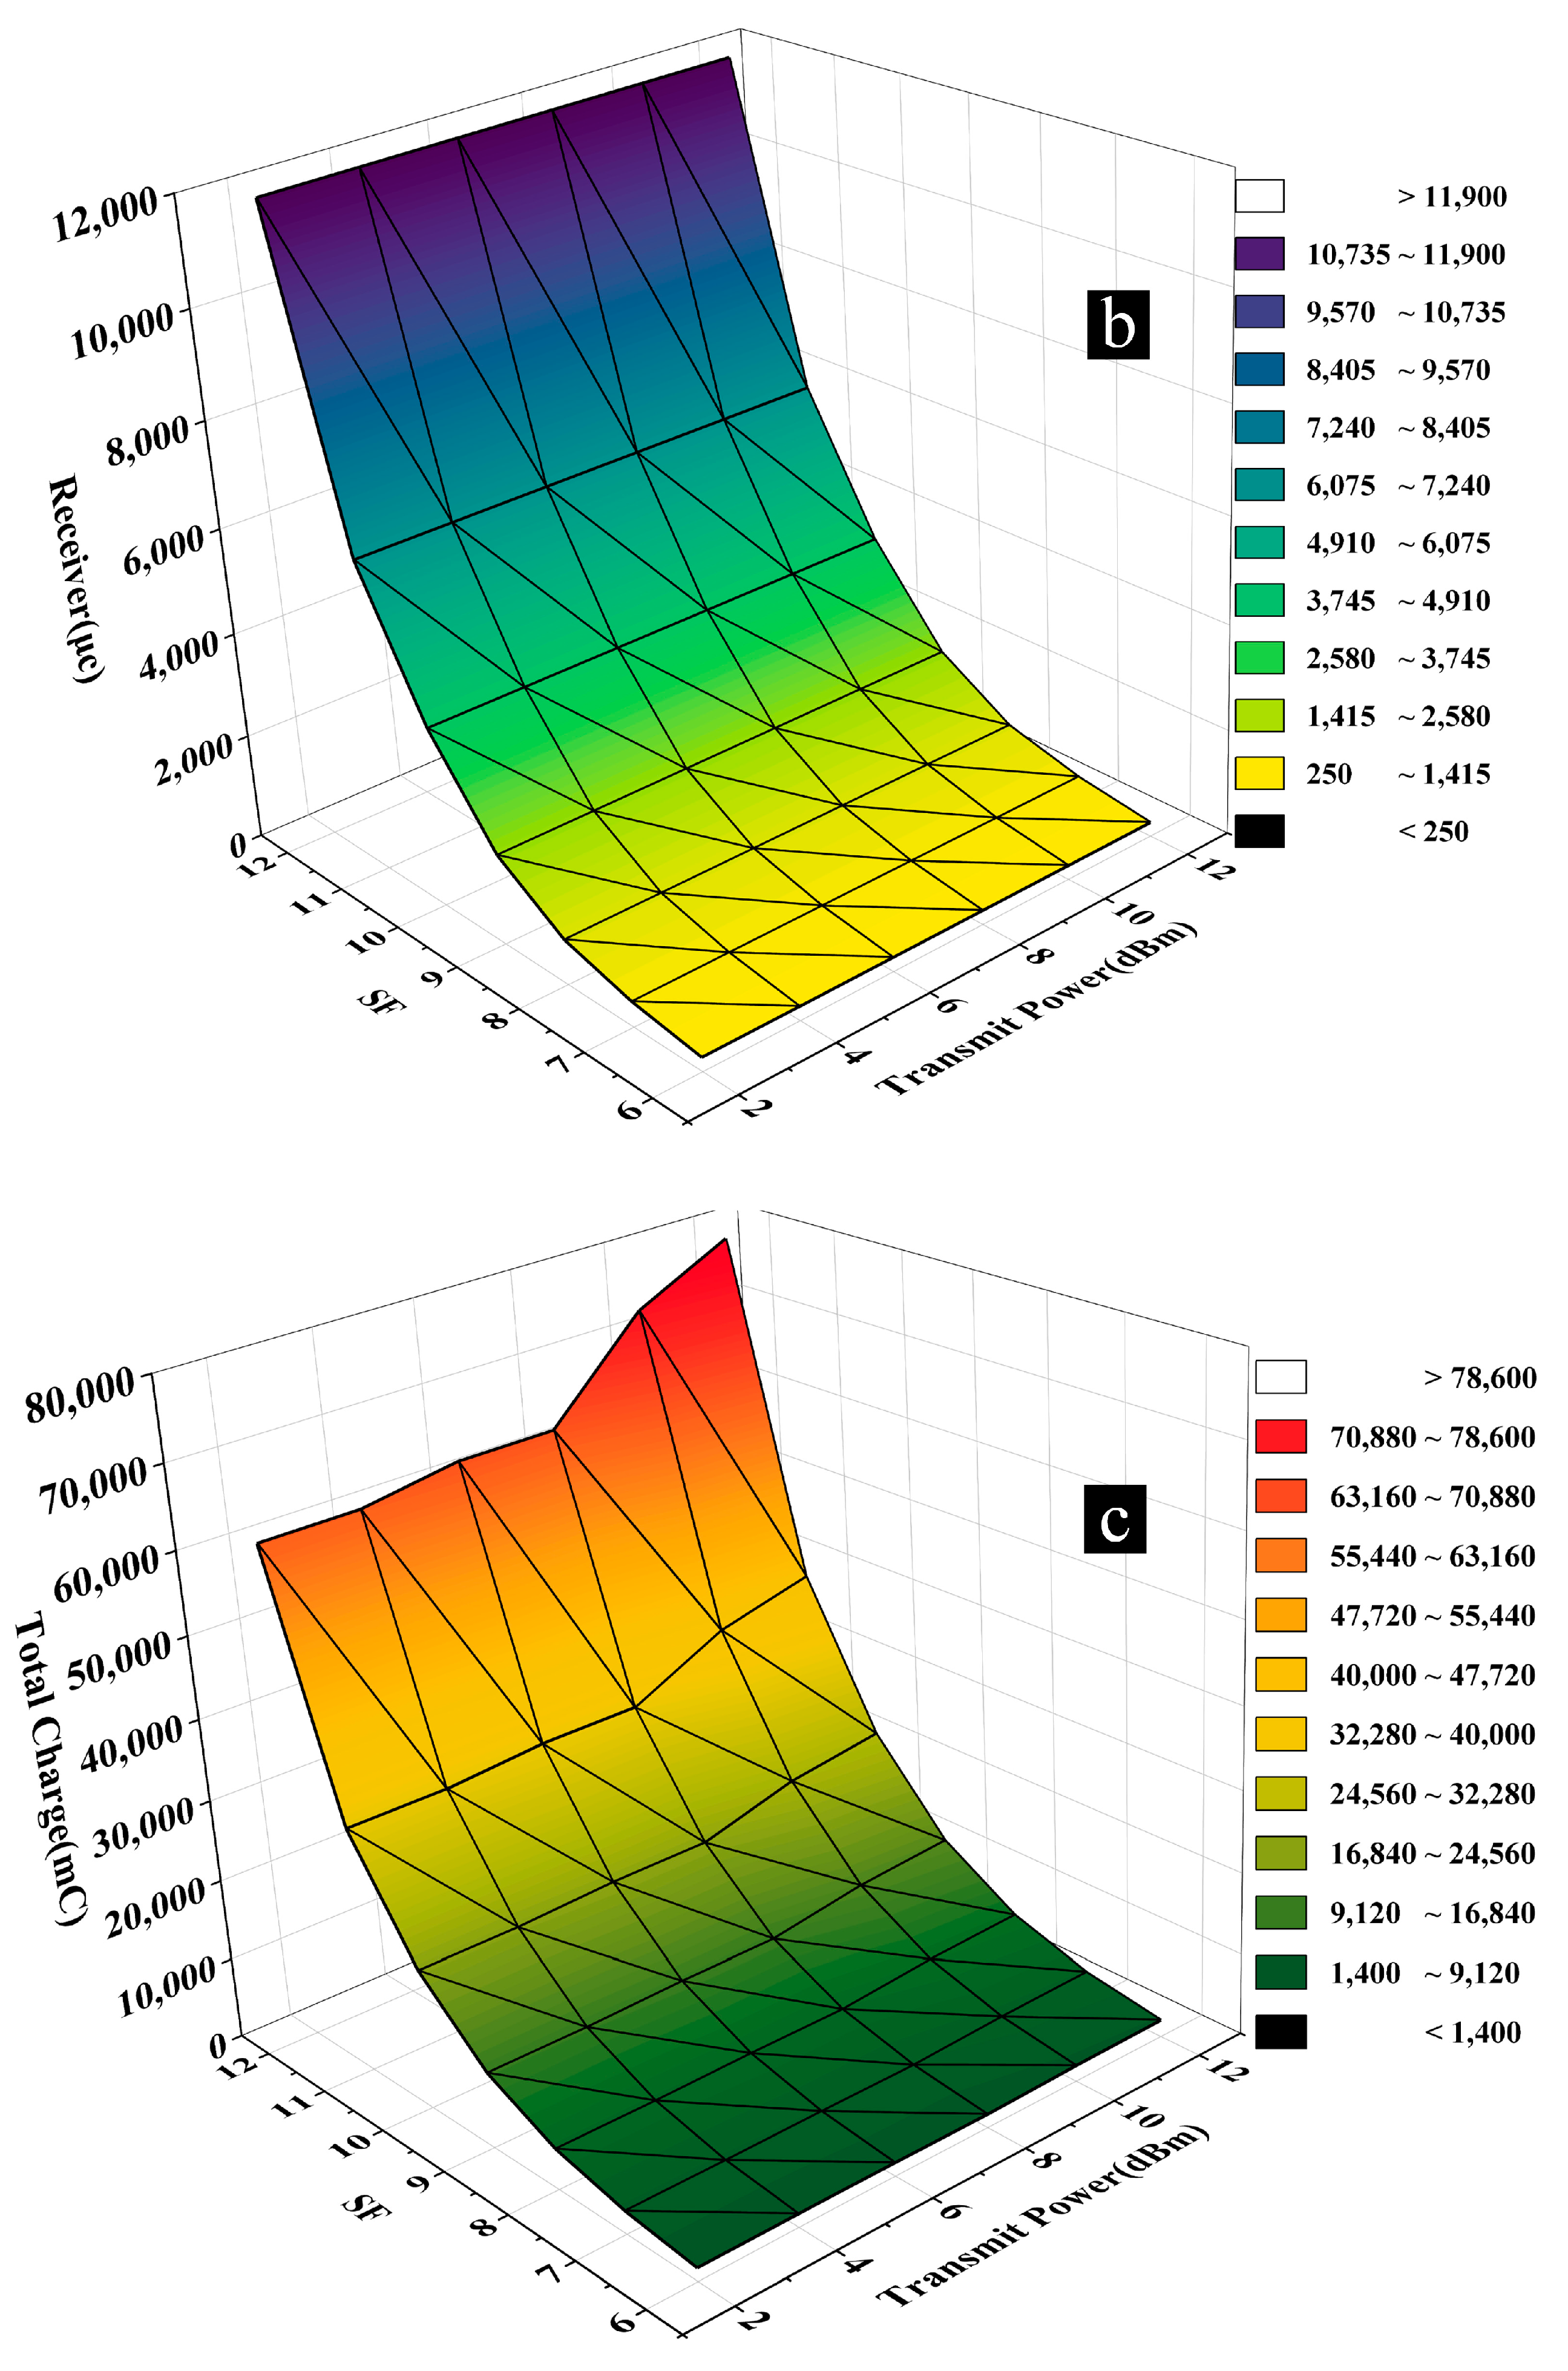
3.1.2. Energy Consumption Performance

As indicated in Figure 7a,c, TP exhibits a positive correlation with both single transmission consumption and single-day consumption in LoRa communication. Additionally, it is observed that the impact of TP becomes more pronounced with a larger SF. Under the same SF, the maximum difference in single consumption caused by different TPs is 41.66%. At the same TP, each level of SF increases the energy consumption by an average of 30.62%. At TP = 12, the single transmission energy consumption values of SF = 6 and SF = 12 are 1275.1 μc versus 31,473.7 μc, which is nearly a 25-fold difference, and the difference in the single-day energy consumption is nearly 49-fold. In addition, as indicated in Figure 7b, TP does not affect the reception consumption. Therefore, for the energy consumption performance, SF is the main influencing factor.

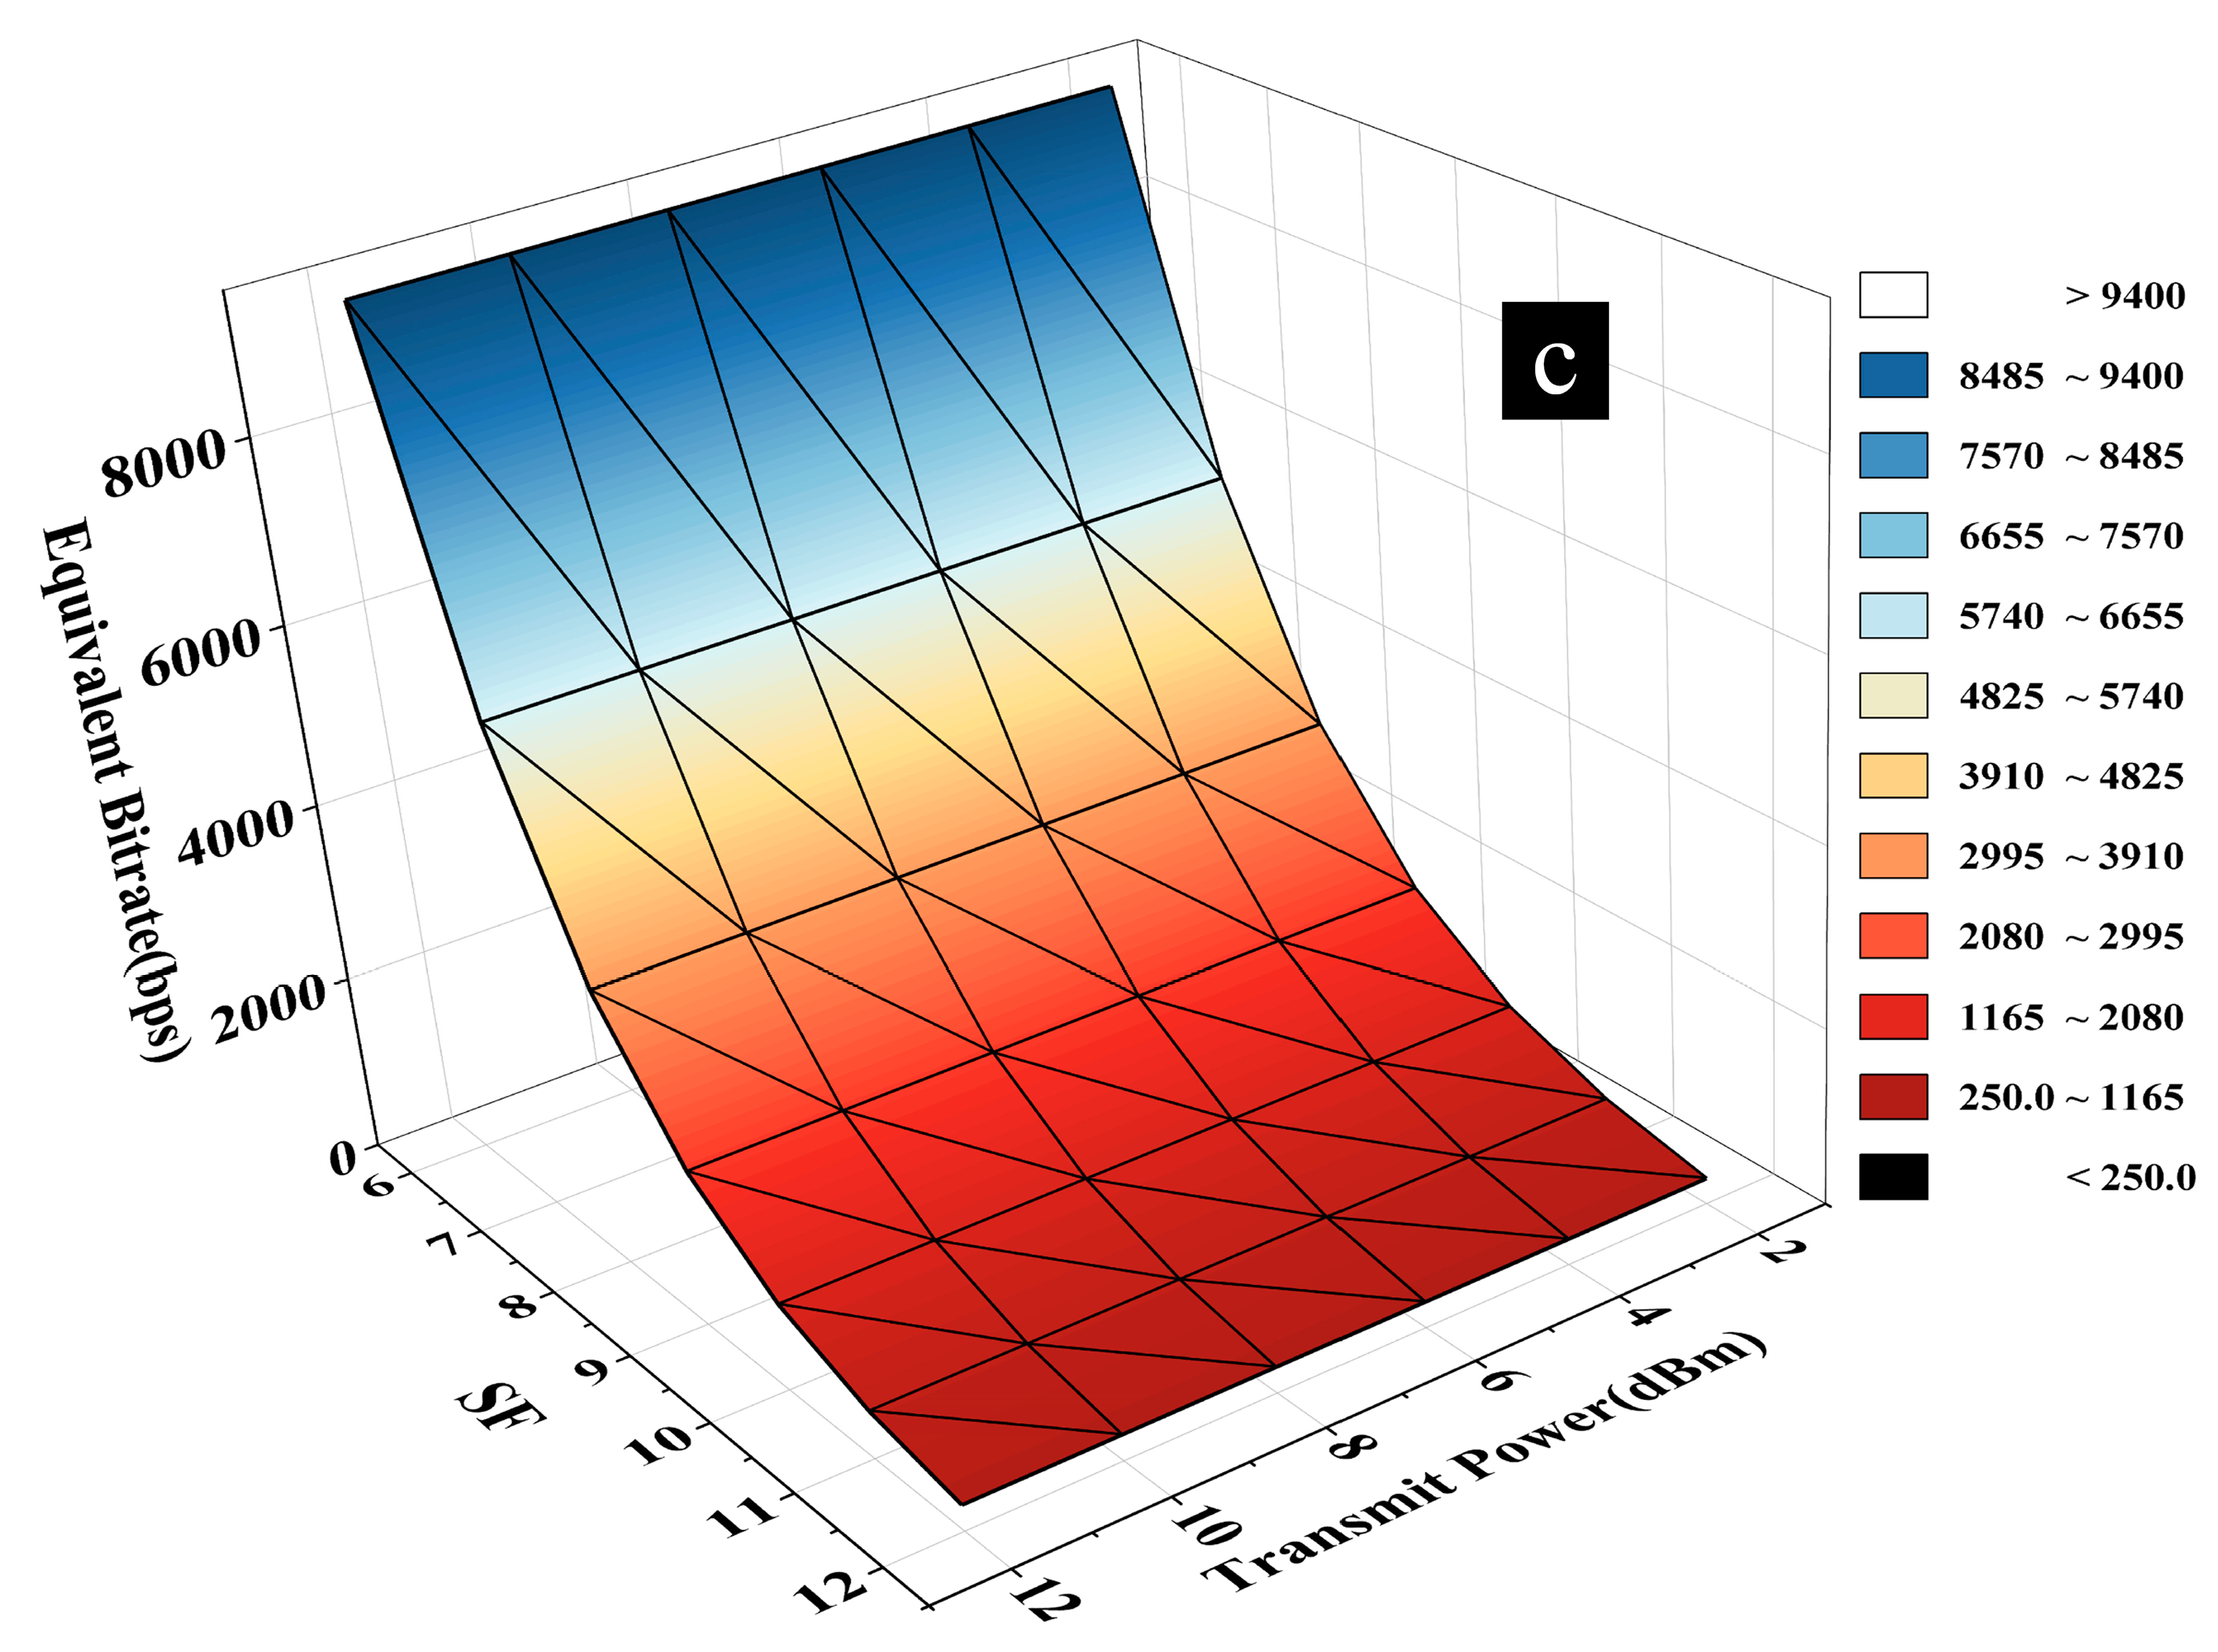
3.1.3. RF Performance

Figure 8 illustrates that the link budget is positively correlated for both SF and TP, and the growth rate of SF as a single independent variable is significantly greater than the growth rate of TP as a single independent variable. The conversion relationship between the transmit power dBm and mW is shown in Equation (5):
dBm = 10 lg P mW
Thus, the maximum transmit power of 12 dBm is 10 times greater than the minimum transmit power of 2 dBm. Numerically, the maximum difference in the link budget is 8%, when the transmit power is a single independent variable, and 16% when SF is a single independent variable. Therefore, the excess link budget can greatly waste the transmit power. Therefore, a good RF performance should satisfy the calculated link budget and minimize the performance parameters.
Please note that the receive sensitivity is a negative value, hence the reversed orientation of the horizontal axis. The reception sensitivity RS is calculated as shown in Equation (6):
R S = 174 + 10 log 10 BW + NF + S N R
where BW = 125 KHz, noise factor (NF) = 6 dB, and the signal to noise ratio (SNR) depends on SF.
The relationship between the received sensitivity RS and the link budget LB and TP is shown in Equation (7):
L B = T P - R S
The free space transmission loss L (dB) is calculated as shown in Equation (8):
L = 20 lg d + 20 lg f + 32.44
where d is the communication distance and f is the operating frequency.
The received signal strength RSS is calculated as shown in Equation (9):
R S S = L B + 2 G - L
Therefore, for a communication distance of 1 km, the communication frequency is 470 MHz, TP = 2 dBm, SF = 6, and the omnidirectional antenna gain of the receiving and transmitting end G = 3 dBi, which leads to the calculation result of RSS = 44.16 dBm, which meets the conditions of the received signal. Therefore, theoretically, the performance under this parameter setting should meet the practical requirements.

3.1.4. Integrated Performance Analysis

The results from the analysis of the time performance, energy consumption performance, and RF performance indicate that SF has a more significant effect on all three aspects.
Furthermore, it is worth noting that the performance achieved with the minimum TP value (TP = 2) is sufficient to meet the communication requirements. This suggests that TP = 2 can be considered the maximum energy consumption ratio parameter within the system.
Given the prominence of SF in influencing the performance and the energy efficiency achieved with TP = 2, a further analysis of the optimal SF parameter was warranted. Determining the ideal SF setting can play a crucial role in achieving the desired balance between the performance and energy efficiency in LoRa communication.
Due to the surplus link budget in the RF performance not contributing to an actual performance improvement, the RF performance is consistent across different SFs. In Figure 9, the time on air and reception time exhibit a negative correlation with the performance, while the equivalent bit rate shows a positive correlation with the performance. The total consumption, receive consumption, and transmit consumption are positively correlated with the actual energy consumption. From the graph, it is evident that the airtime and reception time are positively correlated with SF; the equivalent bit rate is negatively correlated with SF; and total consumption, receive consumption, and transmit consumption are positively correlated with SF. Therefore, SF is negatively correlated with the performance and positively correlated with the actual energy consumption. Increasing SF reduces the energy consumption. Consequently, considering the practical requirements, the optimal parameters for the maximum energy efficiency ratio are SF = 6 and TP = 2. These settings provide a balance between the energy efficiency and communication stability, while meeting the requirements for a stable LoRa communication.

3.2. Strong and Weak Interference Packet Loss Rate: Experimental Results and Discussion

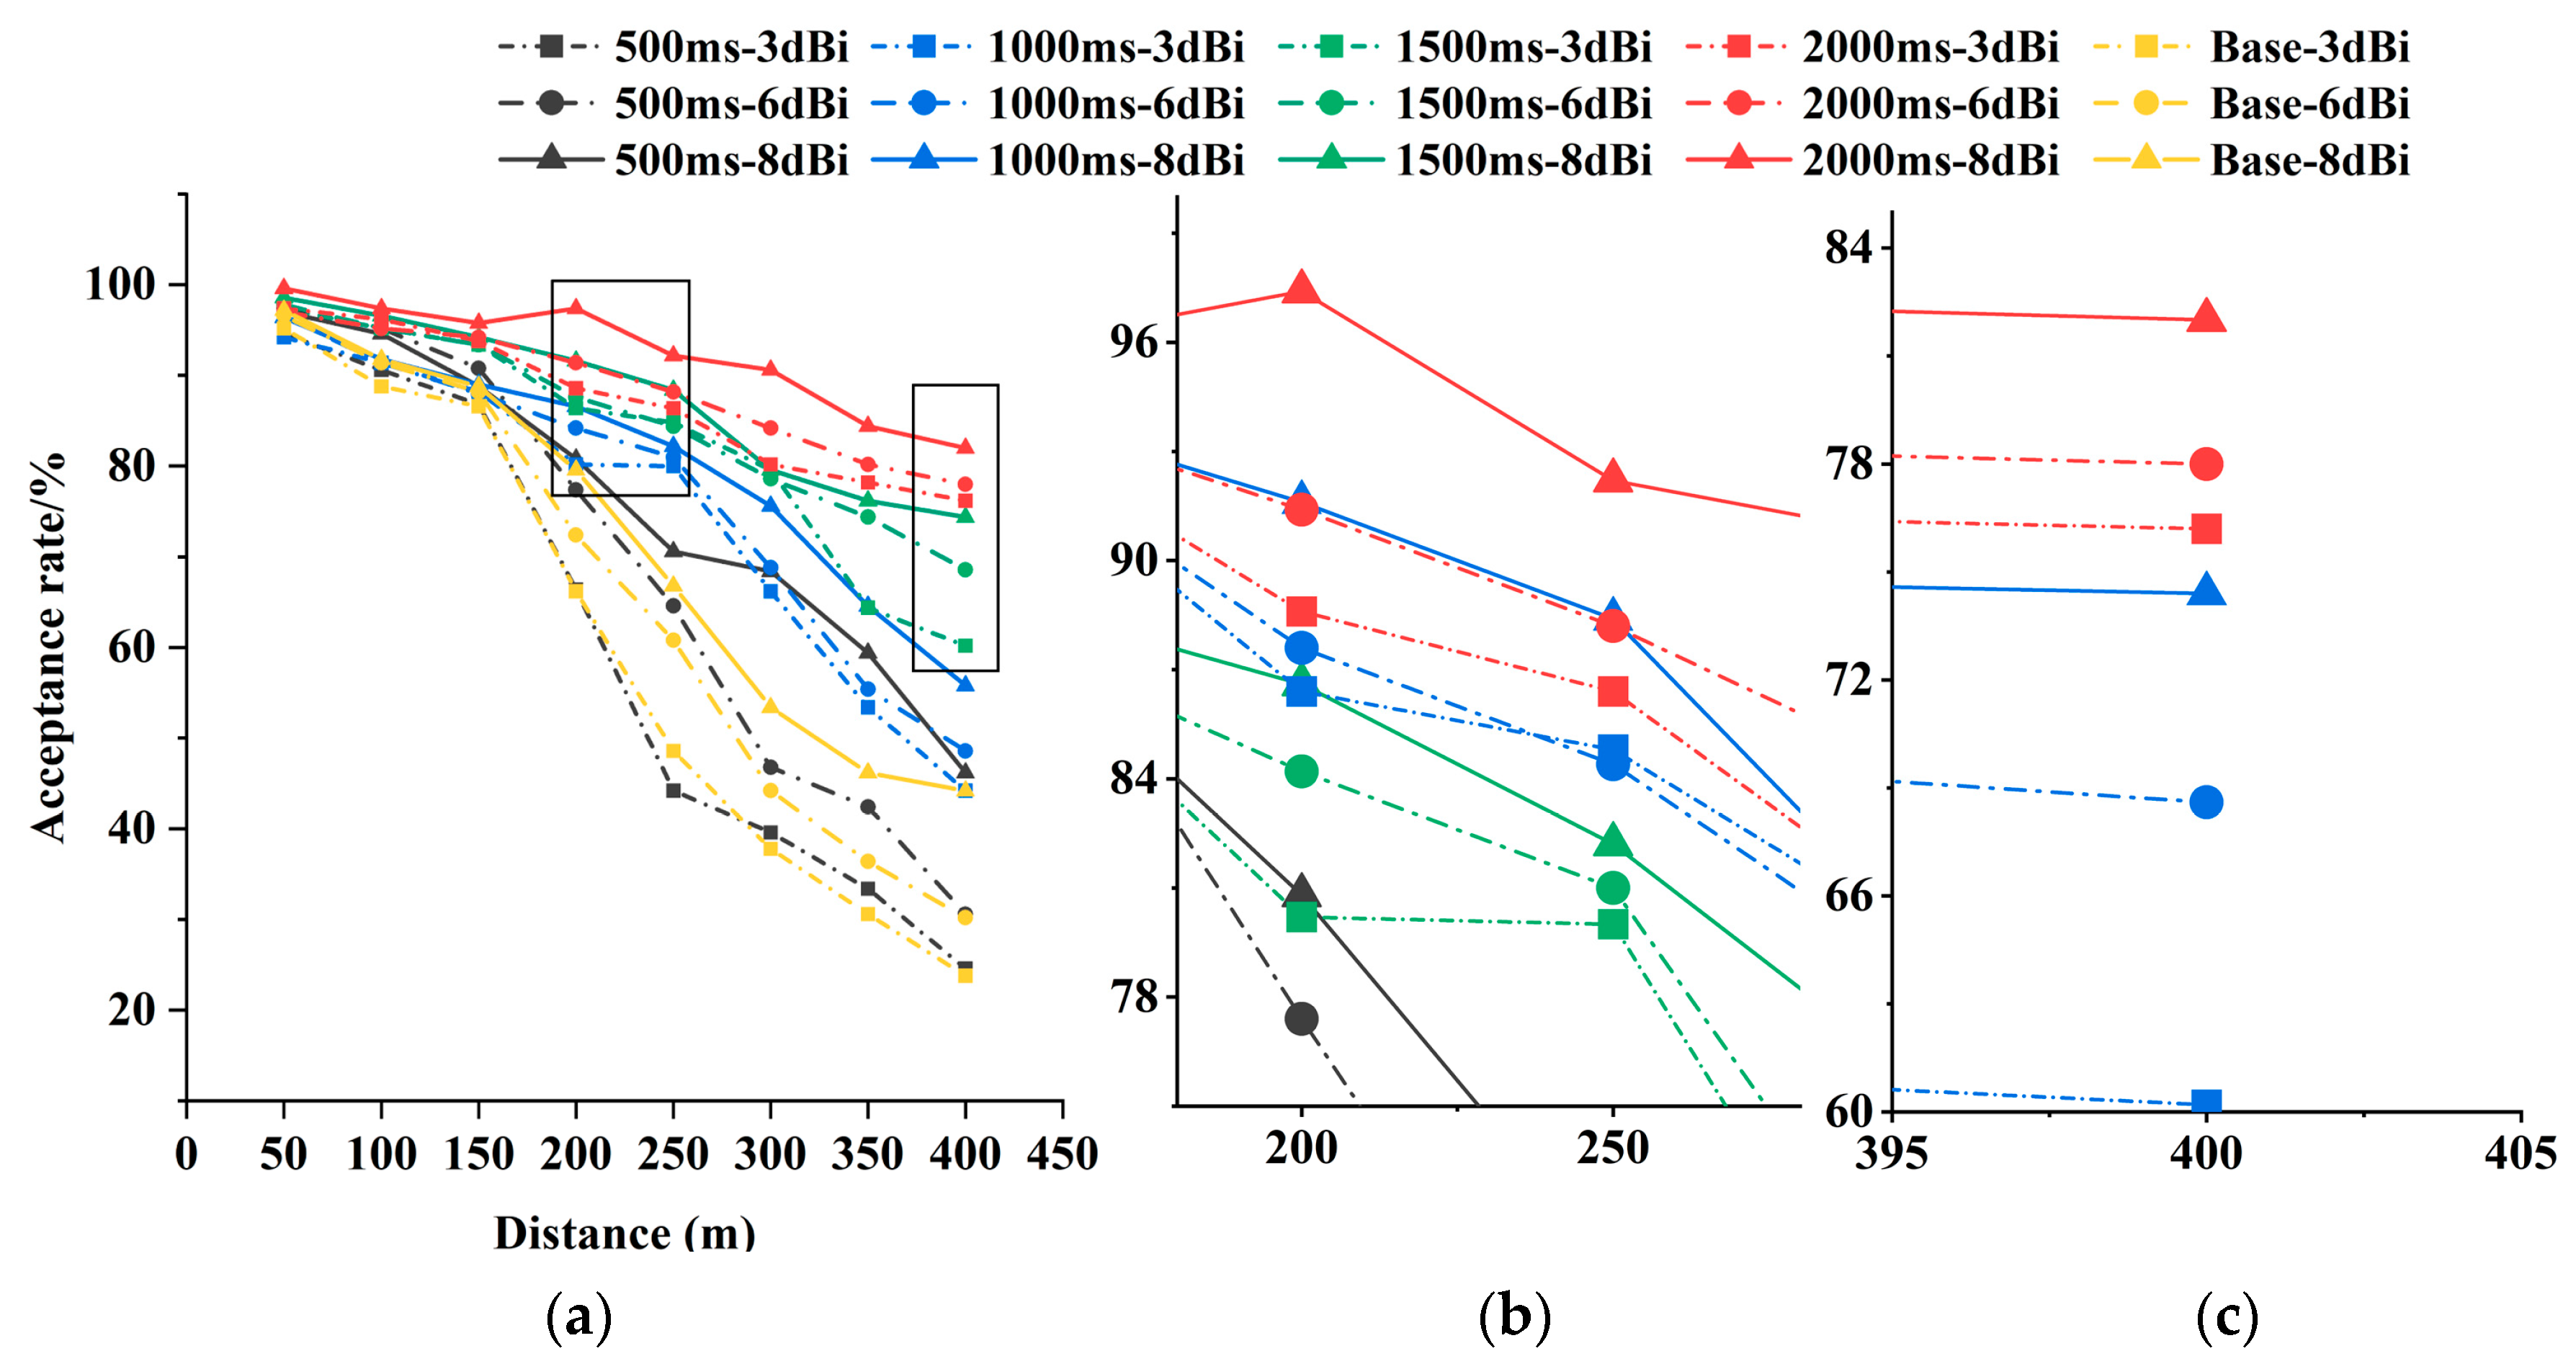
3.2.1. Strong Interference Packet Loss Rate: Experimental Results and Discussion

Figure 10a illustrates that, under strong interference, the acceptance rate is still good within 150 m, and the results of each experiment are gradually dispersed after more than 150 m. The data for the basic LoRa are relatively close to that of the 500 ms experimental group, but show a more significant difference compared to that of the 2000 ms group. At the same distance and omnidirectional antenna gain, the 3 bi experimental group exhibits a maximum reception rate difference of 52.4% at 400 m.
Figure 10b illustrates that the acceptance rate at 200 m is stratified by the different transceiver intervals, in which the results of the 1500 and 2000 ms experiments are still more than 86%, and the results of the overall experiments at 250 m are near 88%.
Figure 10c shows that the acceptance rate at 400 m is stratified according to the transceiver intervals, and only the acceptance rate at 2000 ms is greater than 76%.
The overall experimental results illustrate that, under strong interference, the transceiver interval is the main influencing factor of the acceptance rate, a larger transceiver interval can produce a good communication quality within 250 m, and the difference in the reception rates between the basic LoRa and the gateway with the PHY anti-frame loss mechanism increases with the growth in the communication distance.

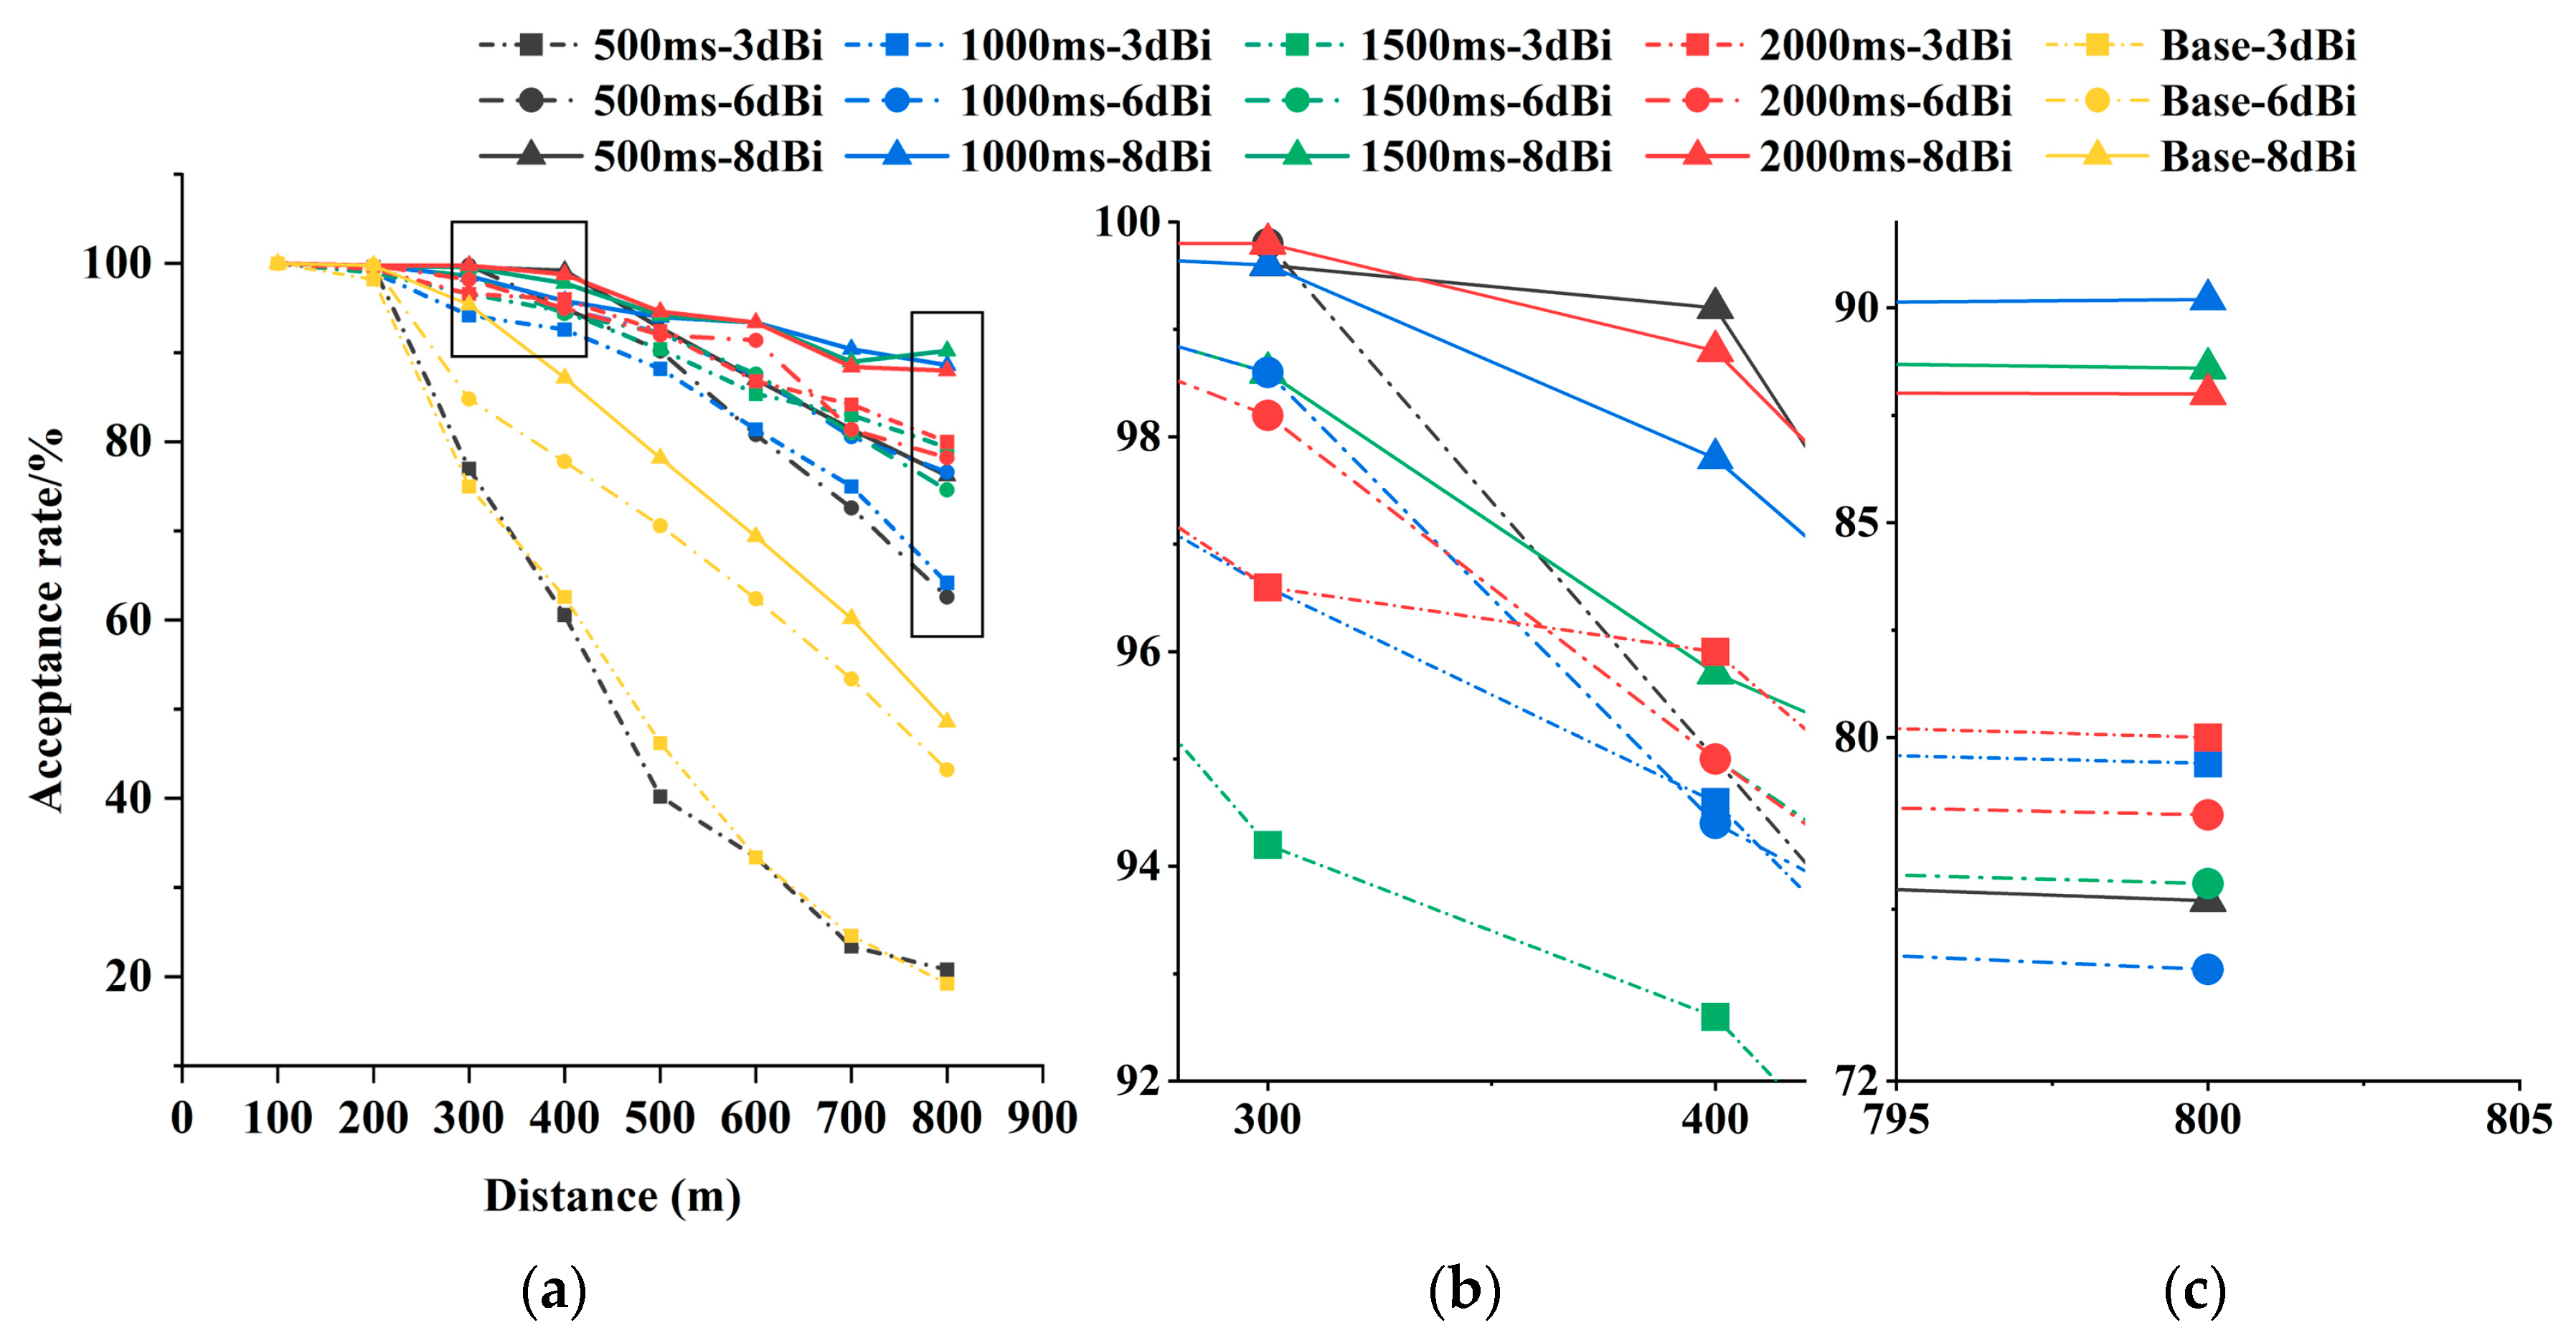
3.2.2. Weak Interference Packet Loss Rate: Experimental Results and Discussion

Figure 11a illustrates the lowest performance parameter of 500 ms-3 dBi. The acceptance rate is more than 99.6% at 200 m, but the rate decreases rapidly after more than 200 m, which indicates that it is difficult to maintain the communication quality at a long distance with short spacing and low gain. The overall trend of the basic LoRa is similar to that of the 500 ms experimental group. At the same distance and omnidirectional antenna gain, the 3 bi experimental group exhibits a maximum reception rate difference of 60.8% at 800 m.
Figure 11b illustrates that, at a distance of 400 m, all the experimental results for the 8 dBi omnidirectional antenna are above 96%. The acceptance rate of the 3 dBi omnidirectional antenna in the 300–400 m range shows stratification, with a significant difference between acceptance rates below and above 1000 ms. Except for a faster decrease in the acceptance rate for the 500 ms-300 dBi case, the other experimental results still maintain an acceptance rate above 93%. This indicates that achieving a higher acceptance rate requires a strong omnidirectional antenna gain.
Figure 11c illustrates that, at 800 m, 1000/1500/2000 ms-8 dBi are close to 90%, the same transceiver interval of the 6 dBi experimental results is close to 78%, and 1500 ms/2000 m-3 dBi is close to 80%, which proves that the transceiver interval is more influential at near 80% of the acceptance rate, and the omnidirectional antenna gain is more influential at near 90% of the acceptance rate, and also proves that the transceiver interval is more important.
Due to the presence of significant water surfaces along the propagation paths of the gateway and nodes in the weak interference experiment, and considering the impact of double-ray propagation over water surfaces leading to signal attenuation [27], the actual reception rates in orchards (such as mountainous or plain areas) might be slightly higher than those obtained in the experimental results.
The overall experimental results illustrate that, under weak interference, the omnidirectional antenna gain strength determines the upper limit of the communication quality, the transceiver interval length determines the lower limit of the communication quality, and the difference in the reception rates between the basic LoRa and the gateway with the PHY anti-frame loss mechanism increases with the growth in the communication distance.

3.2.3. Packet Loss Rate: Experimental Results and Discussion

The conclusions of the strong and weak interference experiments demonstrate that the transceiver interval is a major factor in maintaining a good communication quality. The experimental results illustrate that the higher the link loss, the more pronounced the layering produced by the transceiver interval. Simultaneously, the data for basic LoRa and the 500 ms experimental group are relatively close, showing a noticeable difference compared to that of the 2000 ms experimental group. This indicates that the frame loss prevention mechanism effectively improves the reception rates within the transmission and reception intervals. In response to the first question of the experiment, the first conclusion is drawn: In the mode of low energy consumption of LoRa, compared to the basic LoRa communication, the PHY anti-frame loss mechanism improves the acceptance rate and effective distance significantly. In a strong interference environment, the 2000 ms-3 dBi effective distance is 250 m and Base-3 dBi is 150 m, with an improvement of 100 m; the 500 ms-3 dBi acceptance rate at 250 m is 48.6% and 2000 ms-3 dBi acceptance rate is 86.4%, with an improvement of 37.8%. In a weak interference environment, the 2000 ms-3 dBi effective distance is 600 m and Base-3 dBi is 200 m, with an improvement of 400 m; the Base-3 dBi acceptance rate at 600 m is 33.4% and 2000 ms-3 dBi acceptance rate is 86.8%, with an improvement of 53.4%.
The length of the communication distance and the communication space are the source of the interference factors. The link loss in a real agricultural environment is mainly the tree blocking and free link loss. For the second problem of the experiment, a second conclusion is drawn: the 400 m range is a more appropriate communication distance, in line with the characteristics of the agricultural environment, and the sending and receiving interval should be greater than 1000 ms.
The antenna gain is a factor that directly affects the link budget and also the overall energy consumption. From the experimental results, the higher the acceptance rate, the more the results are affected by the omnidirectional antenna gain, but the omnidirectional antenna gain is not the main factor needed to produce a high acceptance rate. For the third problem of the experiment, a third conclusion is drawn: when the system needs an acceptance rate close to 1 and is not subject to power limitations, the omnidirectional antenna gain can be increased appropriately; for nodes within 400 m, for the requirement of low energy consumption, the 3 dBi low gain omnidirectional antenna can be selected.

4. Conclusions

The PHY anti-frame loss mechanism and maximum energy efficiency ratio parameters obtained in this study effectively reduced power consumption and packet loss while increasing the effective transmission distance, which led to several significant research conclusions:
(1)
The maximum energy consumption ratio parameter: The highest energy consumption ratio parameters and performance for SX1278 are SF = 6, TP = 2, and BW = 125 kHz, operating in the 470 MHz frequency band. These parameters, in conjunction with a send/receive range of [0, 400] m, a 3 dBi gateway omnidirectional antenna gain, a 1 dBi node omnidirectional antenna gain, and a send/receive interval of at least 1000 ms, can achieve an acceptance rate exceeding 90%.
(2)
PHY anti-frame loss mechanism and performance: After implementing the PHY anti-frame loss mechanism and using the maximum energy consumption ratio parameters, the primary factor influencing the reception rate is the send/receive interval. The antenna gain becomes the dominant factor in achieving reception rates greater than 90%. Strong interference environments benefit from a transceiver interval of 2000 ms, leading to a 37.8% increase in the reception rate at 250 m. Weak interference environments similarly benefit from a 2000 ms transceiver interval, resulting in a 53.4% improvement in the reception rate at 600 m.
(3)
Optimal communication distance: Realistic agricultural environments experience a link loss that falls between strong and weak interference scenarios. The a range of 400 m is deemed a more appropriate communication distance, with a recommended send/receive interval greater than 1000 ms. For nodes within 400 m, the 3 dBi low-gain omnidirectional antenna is ideal for low energy consumption.
The research results can improve the LoRa transmission quality and are suitable for agricultural environments, such as mountain orchards, but to make the LoRa power consumption lower, the energy consumption control of sensors, the optimal number of nodes, and the optimal node arrangement model still need to be further researched, as well as the arranged power supply to adapt it to the needs of larger-scale LoRa networking.

5. Patents

The specific patent number is CN 112367148 A, which has been authorized by the State Intellectual Property Office of China.

Author Contributions

Conceptualization, G.W. and Z.C.; methodology, G.W. and Z.C.; software, G.W. and Z.C.; validation, W.H., G.W. and Z.C.; formal analysis, Z.C.; data curation, Z.C.; writing—original draft preparation, Z.C.; writing—review and editing, Q.D. and Z.C.; supervision, S.L.; funding acquisition, Z.L. All authors have read and agreed to the published version of the manuscript.

Funding

This research was funded by the National Natural Science Foundation of China, grant no. 31971797. It was also partly supported by the China Agriculture Research System of MOF and MARA, grant no. CARS-26. The recipients of these two funds are Zhen Li.

Institutional Review Board Statement

Not applicable.

Data Availability Statement

Data are contained within the article.

Conflicts of Interest

The authors declare no conflicts of interest.

References

  1. Swain, M.; Zimon, D.; Singh, R.; Hashmi, M.F.; Rashid, M.; Hakak, S. LoRa-LBO: An Experimental Analysis of LoRa Link Budget Optimization in Custom Build IoT Test Bed for Agriculture 4.0. Agronomy 2021, 11, 820. [Google Scholar] [CrossRef]
  2. da Silveira, F.; Lermen, F.H.; Amaral, F.G. An overview of agriculture 4.0 development: Systematic review of descriptions, technologies, barriers, advantages, and disadvantages. Comput. Electron. Agric. 2021, 189, 106405. [Google Scholar] [CrossRef]
  3. Klaina, H.; Guembe, I.P.; Lopez-Iturri, P.; Campo-Bescós, M.Á.; Azpilicueta, L.; Aghzout, O.; Alejos, A.V.; Falcone, F. Analysis of low power wide area network wireless technologies in smart agriculture for large-scale farm monitoring and tractor communications. Measurement 2022, 187, 110231. [Google Scholar] [CrossRef]
  4. Mekki, K.; Bajic, E.; Chaxel, F.; Meyer, F. A comparative study of LPWAN technologies for large-scale IoT deployment. ICT Express 2019, 5, 1–7. [Google Scholar] [CrossRef]
  5. Tao, W.; Zhao, L.; Wang, G.; Liang, R. Review of the internet of things communication technologies in smart agriculture and challenges. Comput. Electron. Agric. 2021, 189, 106352. [Google Scholar] [CrossRef]
  6. Bonilla, V.; Campoverde, B.; Yoo, S.G. A Systematic Literature Review of LoRaWAN: Sensors and Applications. Sensors 2023, 23, 8440. [Google Scholar] [CrossRef] [PubMed]
  7. Yousuf, A.M.; Rochester, E.M.; Ousat, B.; Ghaderi, M. Throughput, coverage and scalability of LoRa LPWAN for internet of things. In Proceedings of the 2018 IEEE/ACM 26th International Symposium on Quality of Service (IWQoS), Banff, AB, Canada, 4–6 June 2018; pp. 1–10. [Google Scholar]
  8. Li, Q.; Liu, Z.; Xiao, J. A data collection collar for vital signs of cows on the grassland based on LoRa. In Proceedings of the 2018 IEEE 15th International Conference on e-Business Engineering (ICEBE), Xi’an, China, 12–14 October 2018; pp. 213–217. [Google Scholar]
  9. Deng, F.; Zuo, P.; Wen, K.; Wu, X. Novel soil environment monitoring system based on RFID sensor and LoRa. Comput. Electron. Agric. 2020, 169, 105169. [Google Scholar] [CrossRef]
  10. Bravo-Arrabal, J.; Fernandez-Lozano, J.; Serón, J.; Gomez-Ruiz, J.A.; García-Cerezo, A. Development and implementation of a hybrid wireless sensor network of low power and long range for urban environments. Sensors 2021, 21, 567. [Google Scholar] [CrossRef] [PubMed]
  11. Yazdani, N.; Kouvelas, N.; Prasad, R.V.; Lucani, D.E. Energy Efficient Data Recovery from Corrupted LoRa Frames. In Proceedings of the 2021 IEEE Global Communications Conference (GLOBECOM), Madrid, Spain, 7–11 December 2021; pp. 1–6. [Google Scholar]
  12. Sinha, R.S.; Wei, Y.; Hwang, S.-H. A survey on LPWA technology: LoRa and NB-IoT. ICT Express 2017, 3, 1–421. [Google Scholar] [CrossRef]
  13. Ruotsalainen, H.; Shen, G.; Zhang, J.; Fujdiak, R. LoRaWAN Physical Layer-Based Attacks and Countermeasures, A Review. Sensors 2022, 22, 3127. [Google Scholar] [CrossRef] [PubMed]
  14. Sanchez-Iborra, R.; Sanchez-Gomez, J.; Ballesta-Viñas, J.; Cano, M.-D.; Skarmeta, A.F. Performance evaluation of LoRa considering scenario conditions. Sensors 2018, 18, 772. [Google Scholar] [CrossRef]
  15. Szafranski, D.; Reinhardt, A. ELORA: Even Longer Range Sensor Networking Through Modulated Concurrent LoRa Transmissions. In Proceedings of the 2023 IEEE 24th International Symposium on a World of Wireless, Mobile and Multimedia Networks (WoWMoM), Boston, MA, USA, 12–15 June 2023; pp. 388–393. [Google Scholar]
  16. Song, Y.; Lin, J.; Tang, M.; Dong, S. An Internet of energy things based on wireless LPWAN. Engineering 2017, 3, 460–466. [Google Scholar] [CrossRef]
  17. Talavera, J.M.; Tobón, L.E.; Gómez, J.A.; Culman, M.A.; Aranda, J.M.; Parra, D.T.; Quiroz, L.A.; Hoyos, A.; Garreta, L.E. Review of IoT applications in agro-industrial and environmental fields. Comput. Electron. Agric. 2017, 142, 283–297. [Google Scholar] [CrossRef]
  18. Tagarakis, A.C.; Kateris, D.; Berruto, R.; Bochtis, D. Low-cost wireless sensing system for precision agriculture applications in orchards. Appl. Sci. 2021, 11, 5858. [Google Scholar] [CrossRef]
  19. Iqbal, M.; Abdullah, A.Y.M.; Shabnam, F. An application based comparative study of LPWAN technologies for IoT environment. In Proceedings of the 2020 IEEE Region 10 Symposium (TENSYMP), Dhaka, Bangladesh, 5–7 June 2020; pp. 1857–1860. [Google Scholar]
  20. Kochhar, A.; Kumar, N. Wireless sensor networks for greenhouses: An end-to-end review. Comput. Electron. Agric. 2019, 163, 104877. [Google Scholar] [CrossRef]
  21. Sudha, M.N.; Valarmathi, M.L.; Babu, A.S. Energy efficient data transmission in automatic irrigation system using wireless sensor networks. Comput. Electron. Agric. 2011, 78, 215–221. [Google Scholar] [CrossRef]
  22. Premsankar, G.; Ghaddar, B.; Slabicki, M.; Di Francesco, M. Optimal configuration of LoRa networks in smart cities. IEEE Trans. Ind. Inform. 2020, 16, 7243–7254. [Google Scholar] [CrossRef]
  23. Križanović, V.; Grgić, K.; Spišić, J.; Žagar, D. An Advanced Energy-Efficient Environmental Monitoring in Precision Agriculture Using LoRa-Based Wireless Sensor Networks. Sensors 2023, 23, 6332. [Google Scholar] [CrossRef] [PubMed]
  24. Narieda, S.; Fujii, T.; Umebayashi, K. Energy Constrained Optimization for Spreading Factor Allocation in LoRaWAN. Sensors 2020, 20, 4417. [Google Scholar] [CrossRef] [PubMed]
  25. Yim, D.; Chung, J.; Cho, Y.; Song, H.; Jin, D.; Kim, S.; Ko, S.; Smith, A.; Riegsecker, A. An experimental LoRa performance evaluation in tree farm. In Proceedings of the 2018 IEEE Sensors Applications Symposium (SAS), Seoul, Republic of Korea, 12–14 March 2018; IEEE: New York, NY, USA, 2018; pp. 1–6. [Google Scholar]
  26. Urabe, I.; Li, A.; Fujisawa, M.; Kim, S.-J.; Hasegawa, M. Combinatorial MAB-Based Joint Channel and Spreading Factor Selection for LoRa Devices. Sensors 2023, 23, 6687. [Google Scholar] [CrossRef] [PubMed]
  27. Gutiérrez-Gómez, A.; Rangel, V.; Edwards, R.M.; Davis, J.G.; Aquino, R.; López-De la Cruz, J.; Mendoza-Cano, O.; Lopez-Guerrero, M.; Geng, Y. A Propagation Study of LoRa P2P Links for IoT Applications: The Case of Near-Surface Measurements over Semitropical Rivers. Sensors 2021, 21, 6872. [Google Scholar] [CrossRef] [PubMed]
Figure 1. PHY anti-frame loss mechanism.
Agriculture 14 00460 g001
Figure 2. Hardware preparation. (a) PCBA of the LoRa gateway; (b) LoRa sensor node; and (c) overall experimental hardware materials.
Agriculture 14 00460 g002
Figure 3. Layout of the experimental equipment. (a) LoRa gateway; and (b) LoRa node.
Agriculture 14 00460 g003
Figure 4. Layout of the strong interference test.
Agriculture 14 00460 g004
Figure 5. Layout of the weak interference test.
Agriculture 14 00460 g005
Figure 6. Time performance.
Agriculture 14 00460 g006aAgriculture 14 00460 g006b
Figure 7. Energy dissipation performance.
Agriculture 14 00460 g007aAgriculture 14 00460 g007b
Figure 8. Radio frequency performance.
Agriculture 14 00460 g008
Figure 9. Six-dimensional diagram of the performances of LoRa.
Agriculture 14 00460 g009
Figure 10. High interference test for the acceptance rate. (a) Overall acceptance rate; (b) 200–250 m acceptance rate; and (c) 400 m acceptance rate.
Agriculture 14 00460 g010
Figure 11. Weak interference test for the acceptance rate. (a) Overall acceptance rate; (b) 300–400 m acceptance rate; and (c) 800 m acceptance rate.
Agriculture 14 00460 g011
Table 1. Internal composition of the packet payload.
PayloadLength (Byte)Transmitted Data FrameReceived Data Frame
Function code1
Device address2
Destination address2
Load bytes1×
Loaded data12×
CRC2
Table 2. LoRa radio frequency transceiver.
ChannelCommunication Band/MHzLoRa NodesLoRa Gateway
1472.3transmissionreception
2472.5transmissionreception
3472.7transmissionreception
4472.9transmissionreception
5473.1transmissionreception
6473.3transmissionreception
7473.5transmissionreception
8473.7transmissionreception
9502.5receptiontransmission
Disclaimer/Publisher’s Note: The statements, opinions and data contained in all publications are solely those of the individual author(s) and contributor(s) and not of MDPI and/or the editor(s). MDPI and/or the editor(s) disclaim responsibility for any injury to people or property resulting from any ideas, methods, instructions or products referred to in the content.

