
Shading at the Booting Stage Improved the Grain Quality of Hybrid Rice Due to Reduced Spikelet Production


 ,
,
Abstract
1. Introduction
2. Materials and Methods
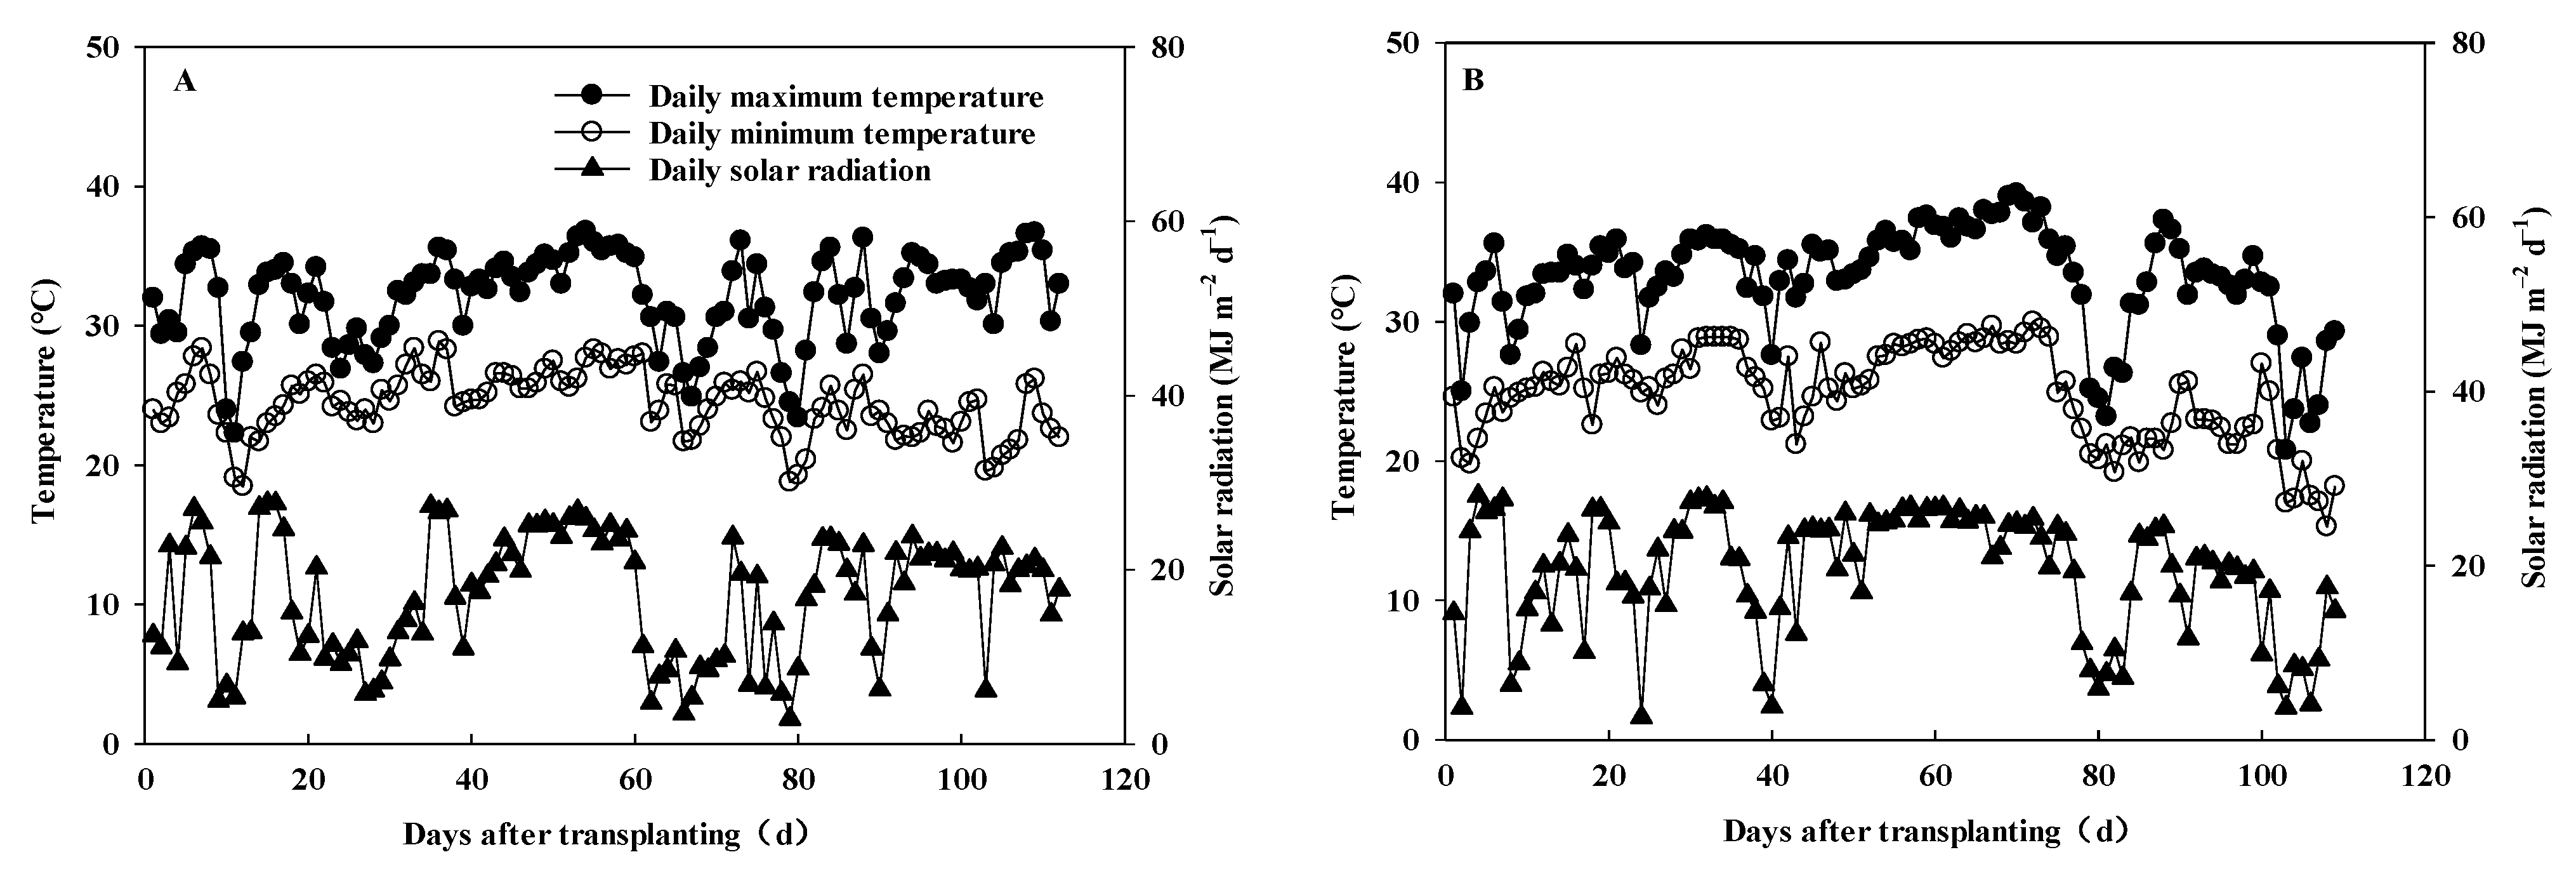
2.1. Experimental Site
2.2. Experimental Design
2.3. Sampling and Measurements
2.3.1. Grain Yield and Other Growth Parameters
2.3.2. Rice Milling and Appearance Quality
2.3.3. Amylose and Protein Content
2.3.4. Rapid Viscosity Analysis (RVA) Profile Characteristics
2.4. Statistical Analysis
3. Results
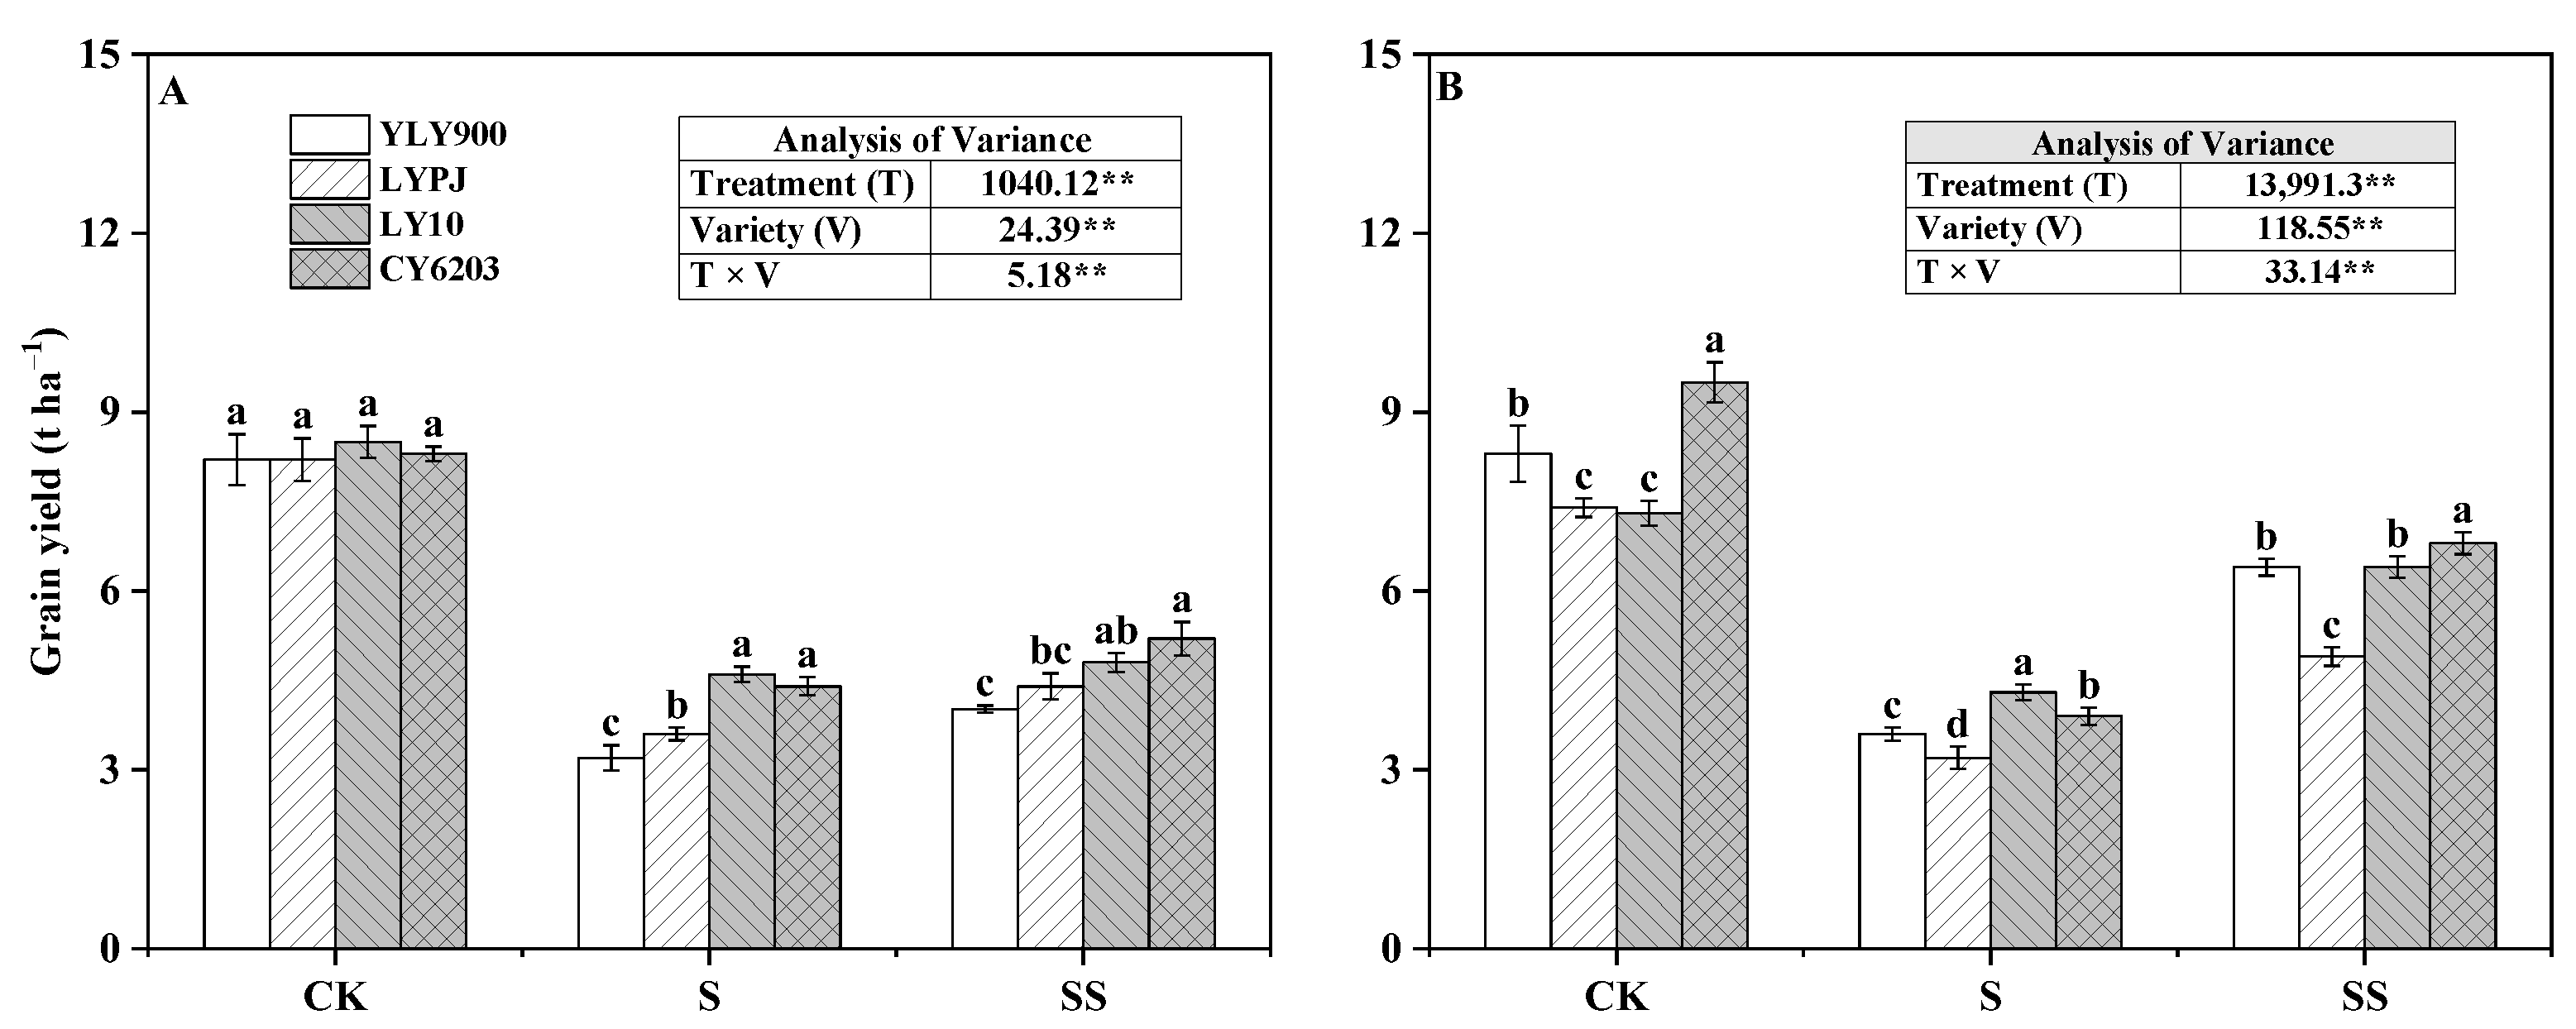
3.1. Grain Yield
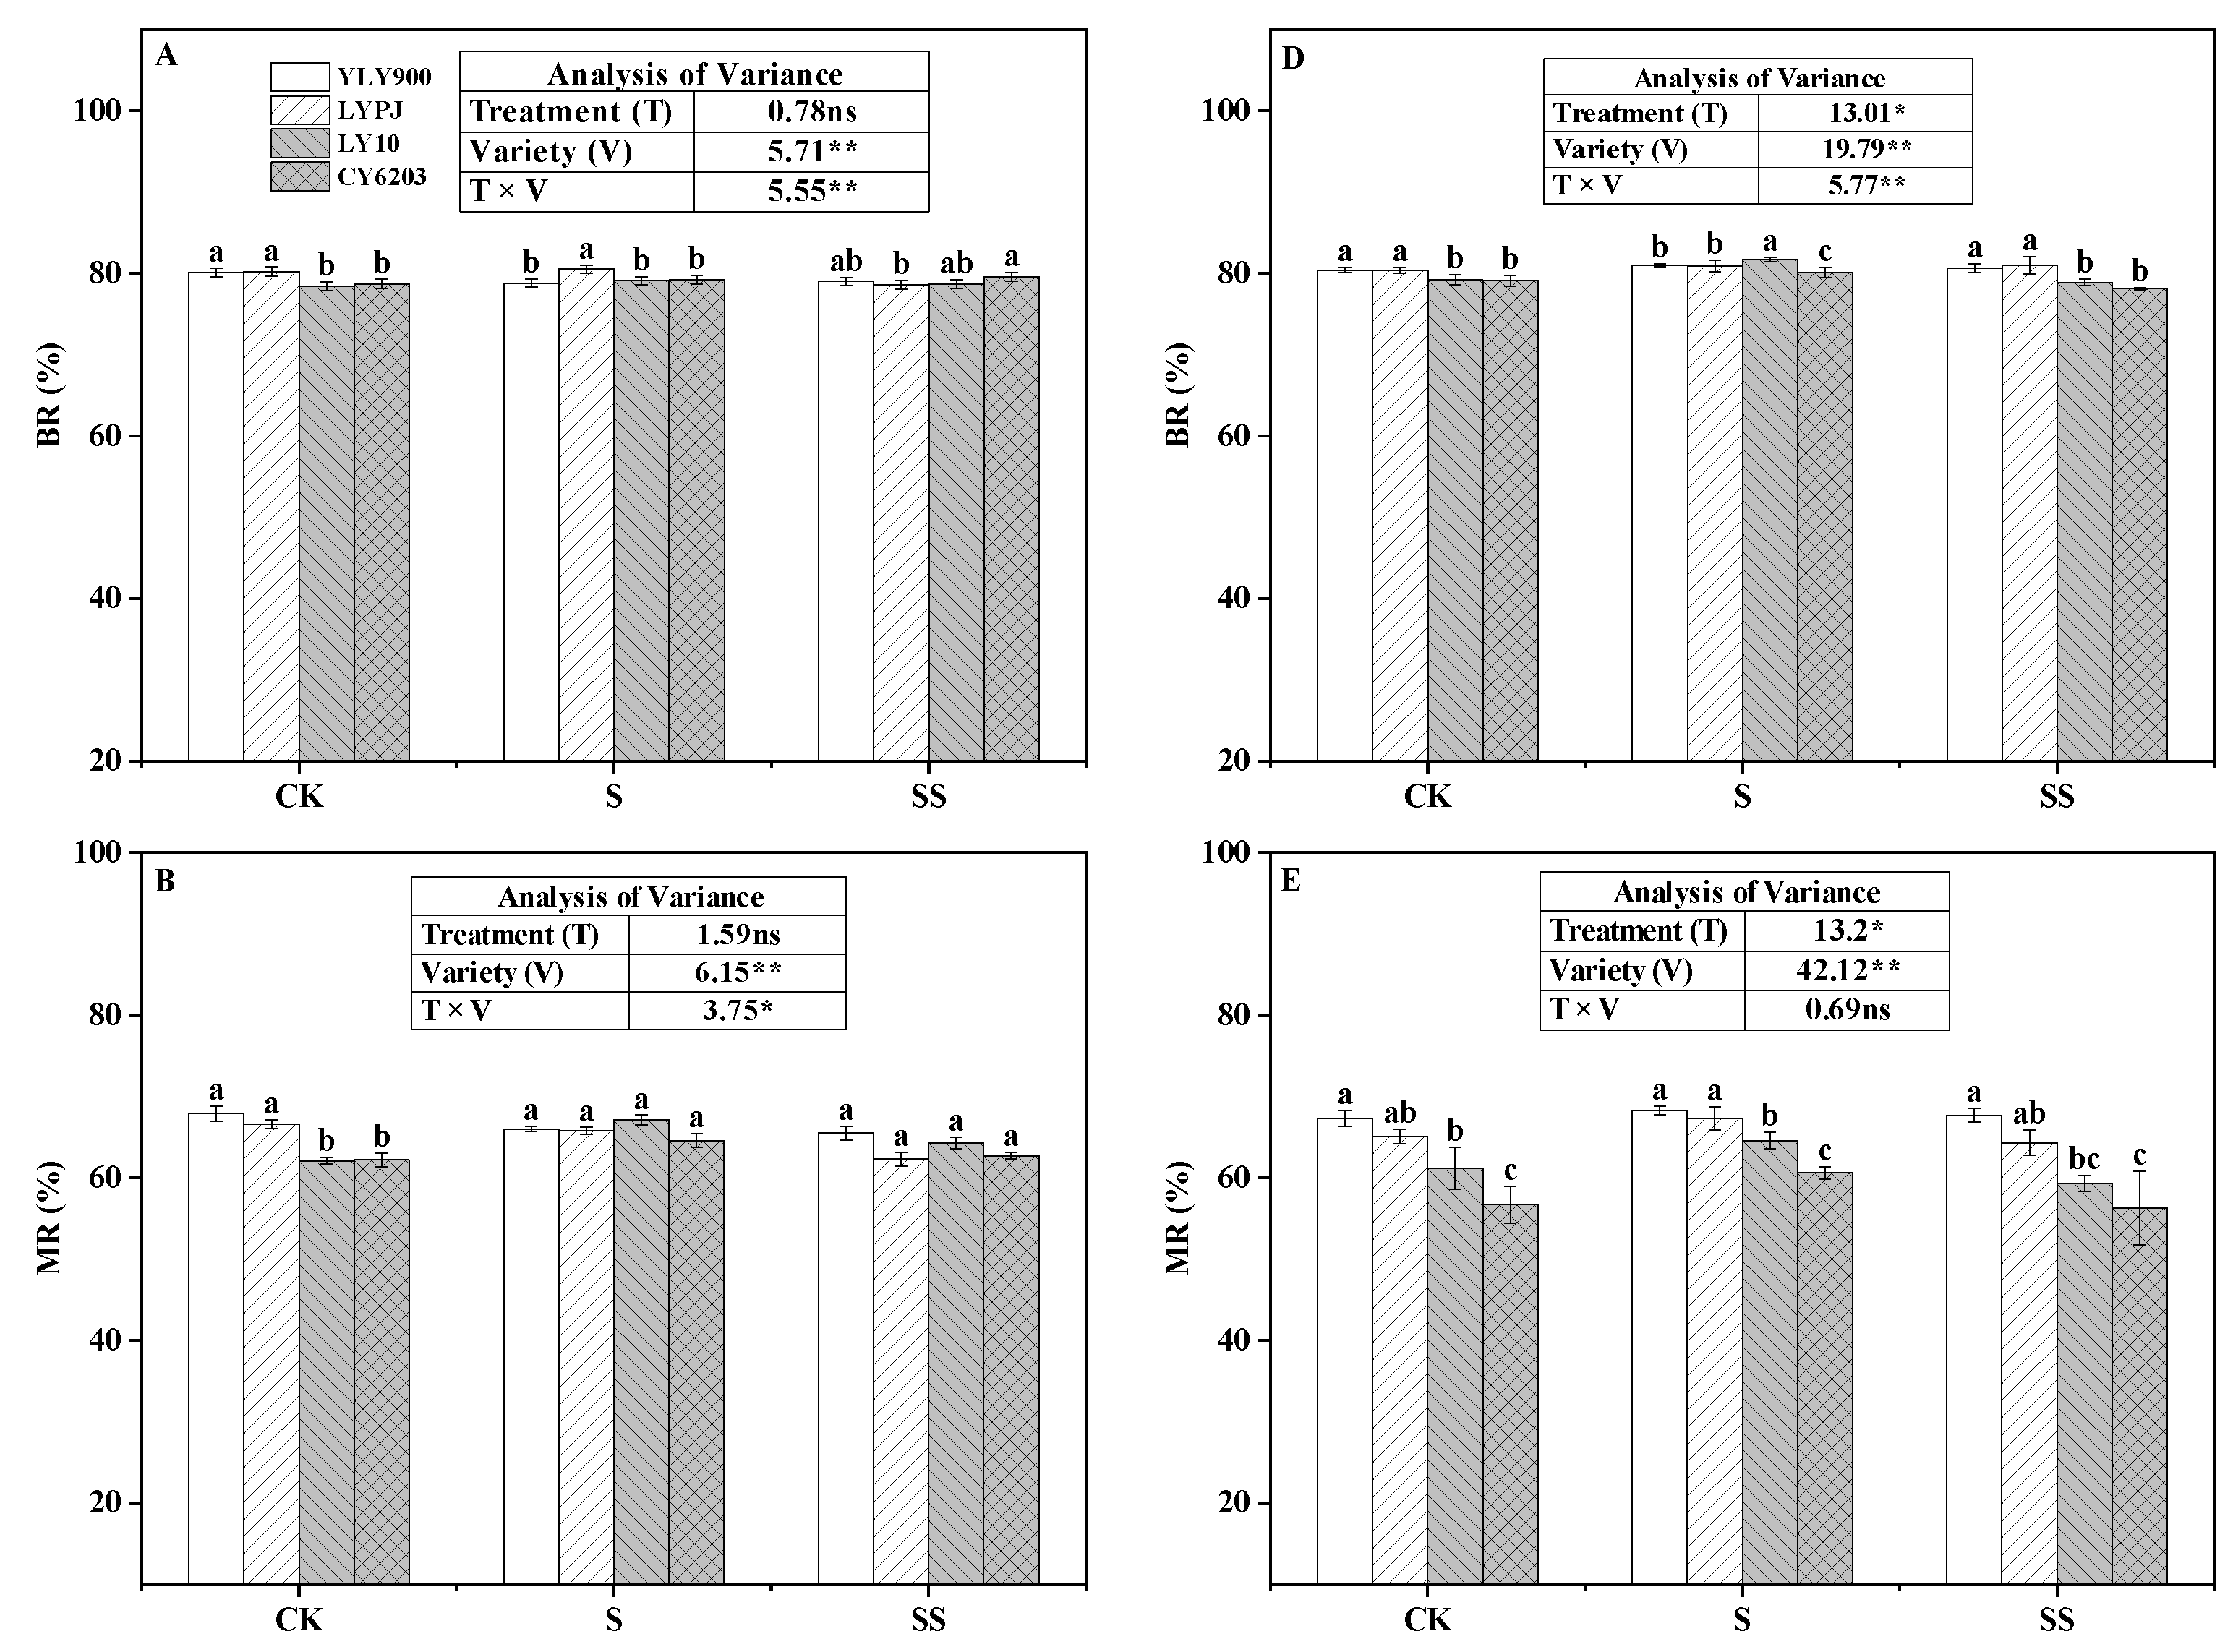
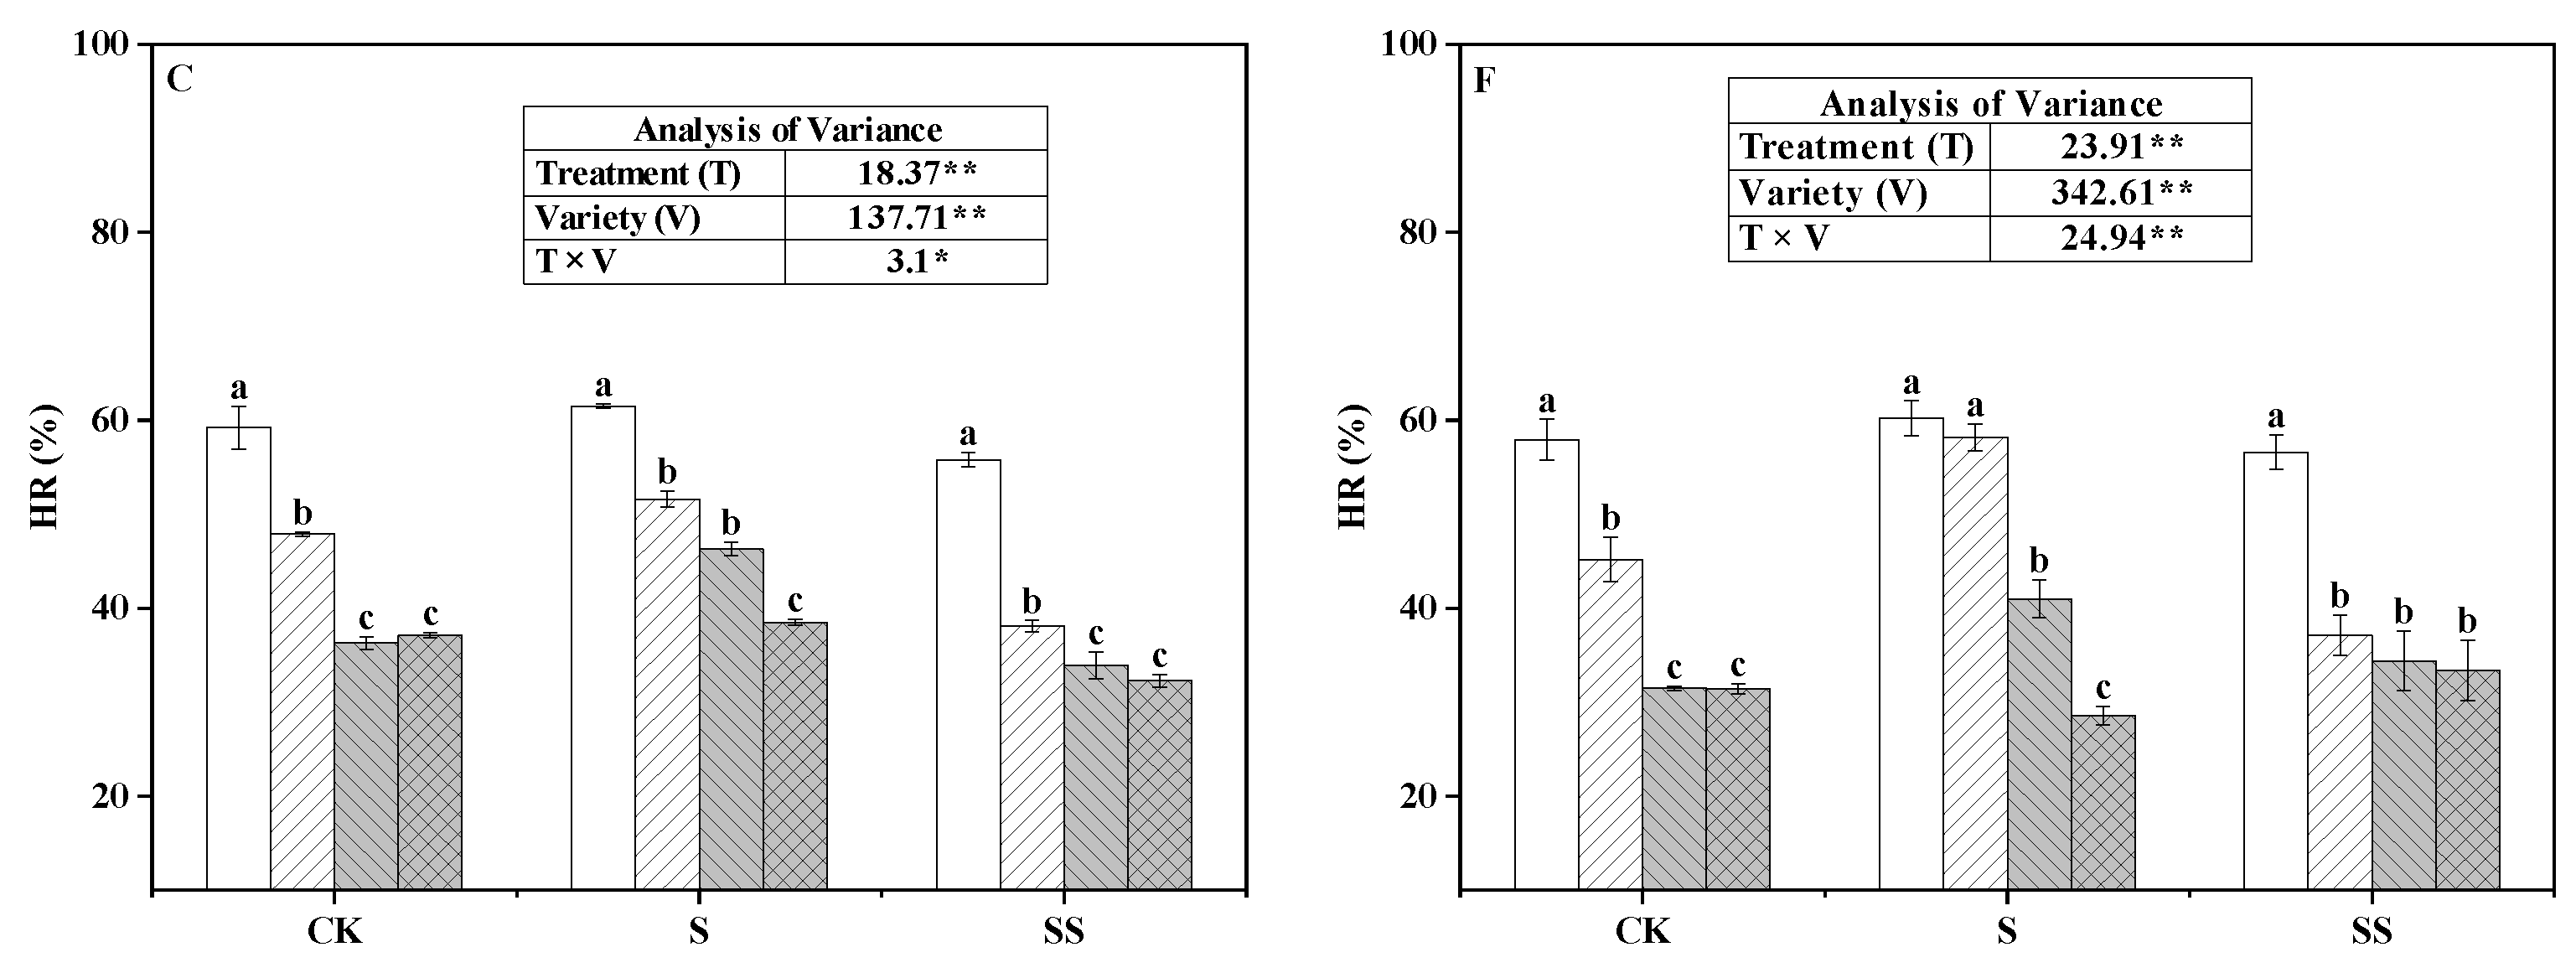
3.2. Milling Quality
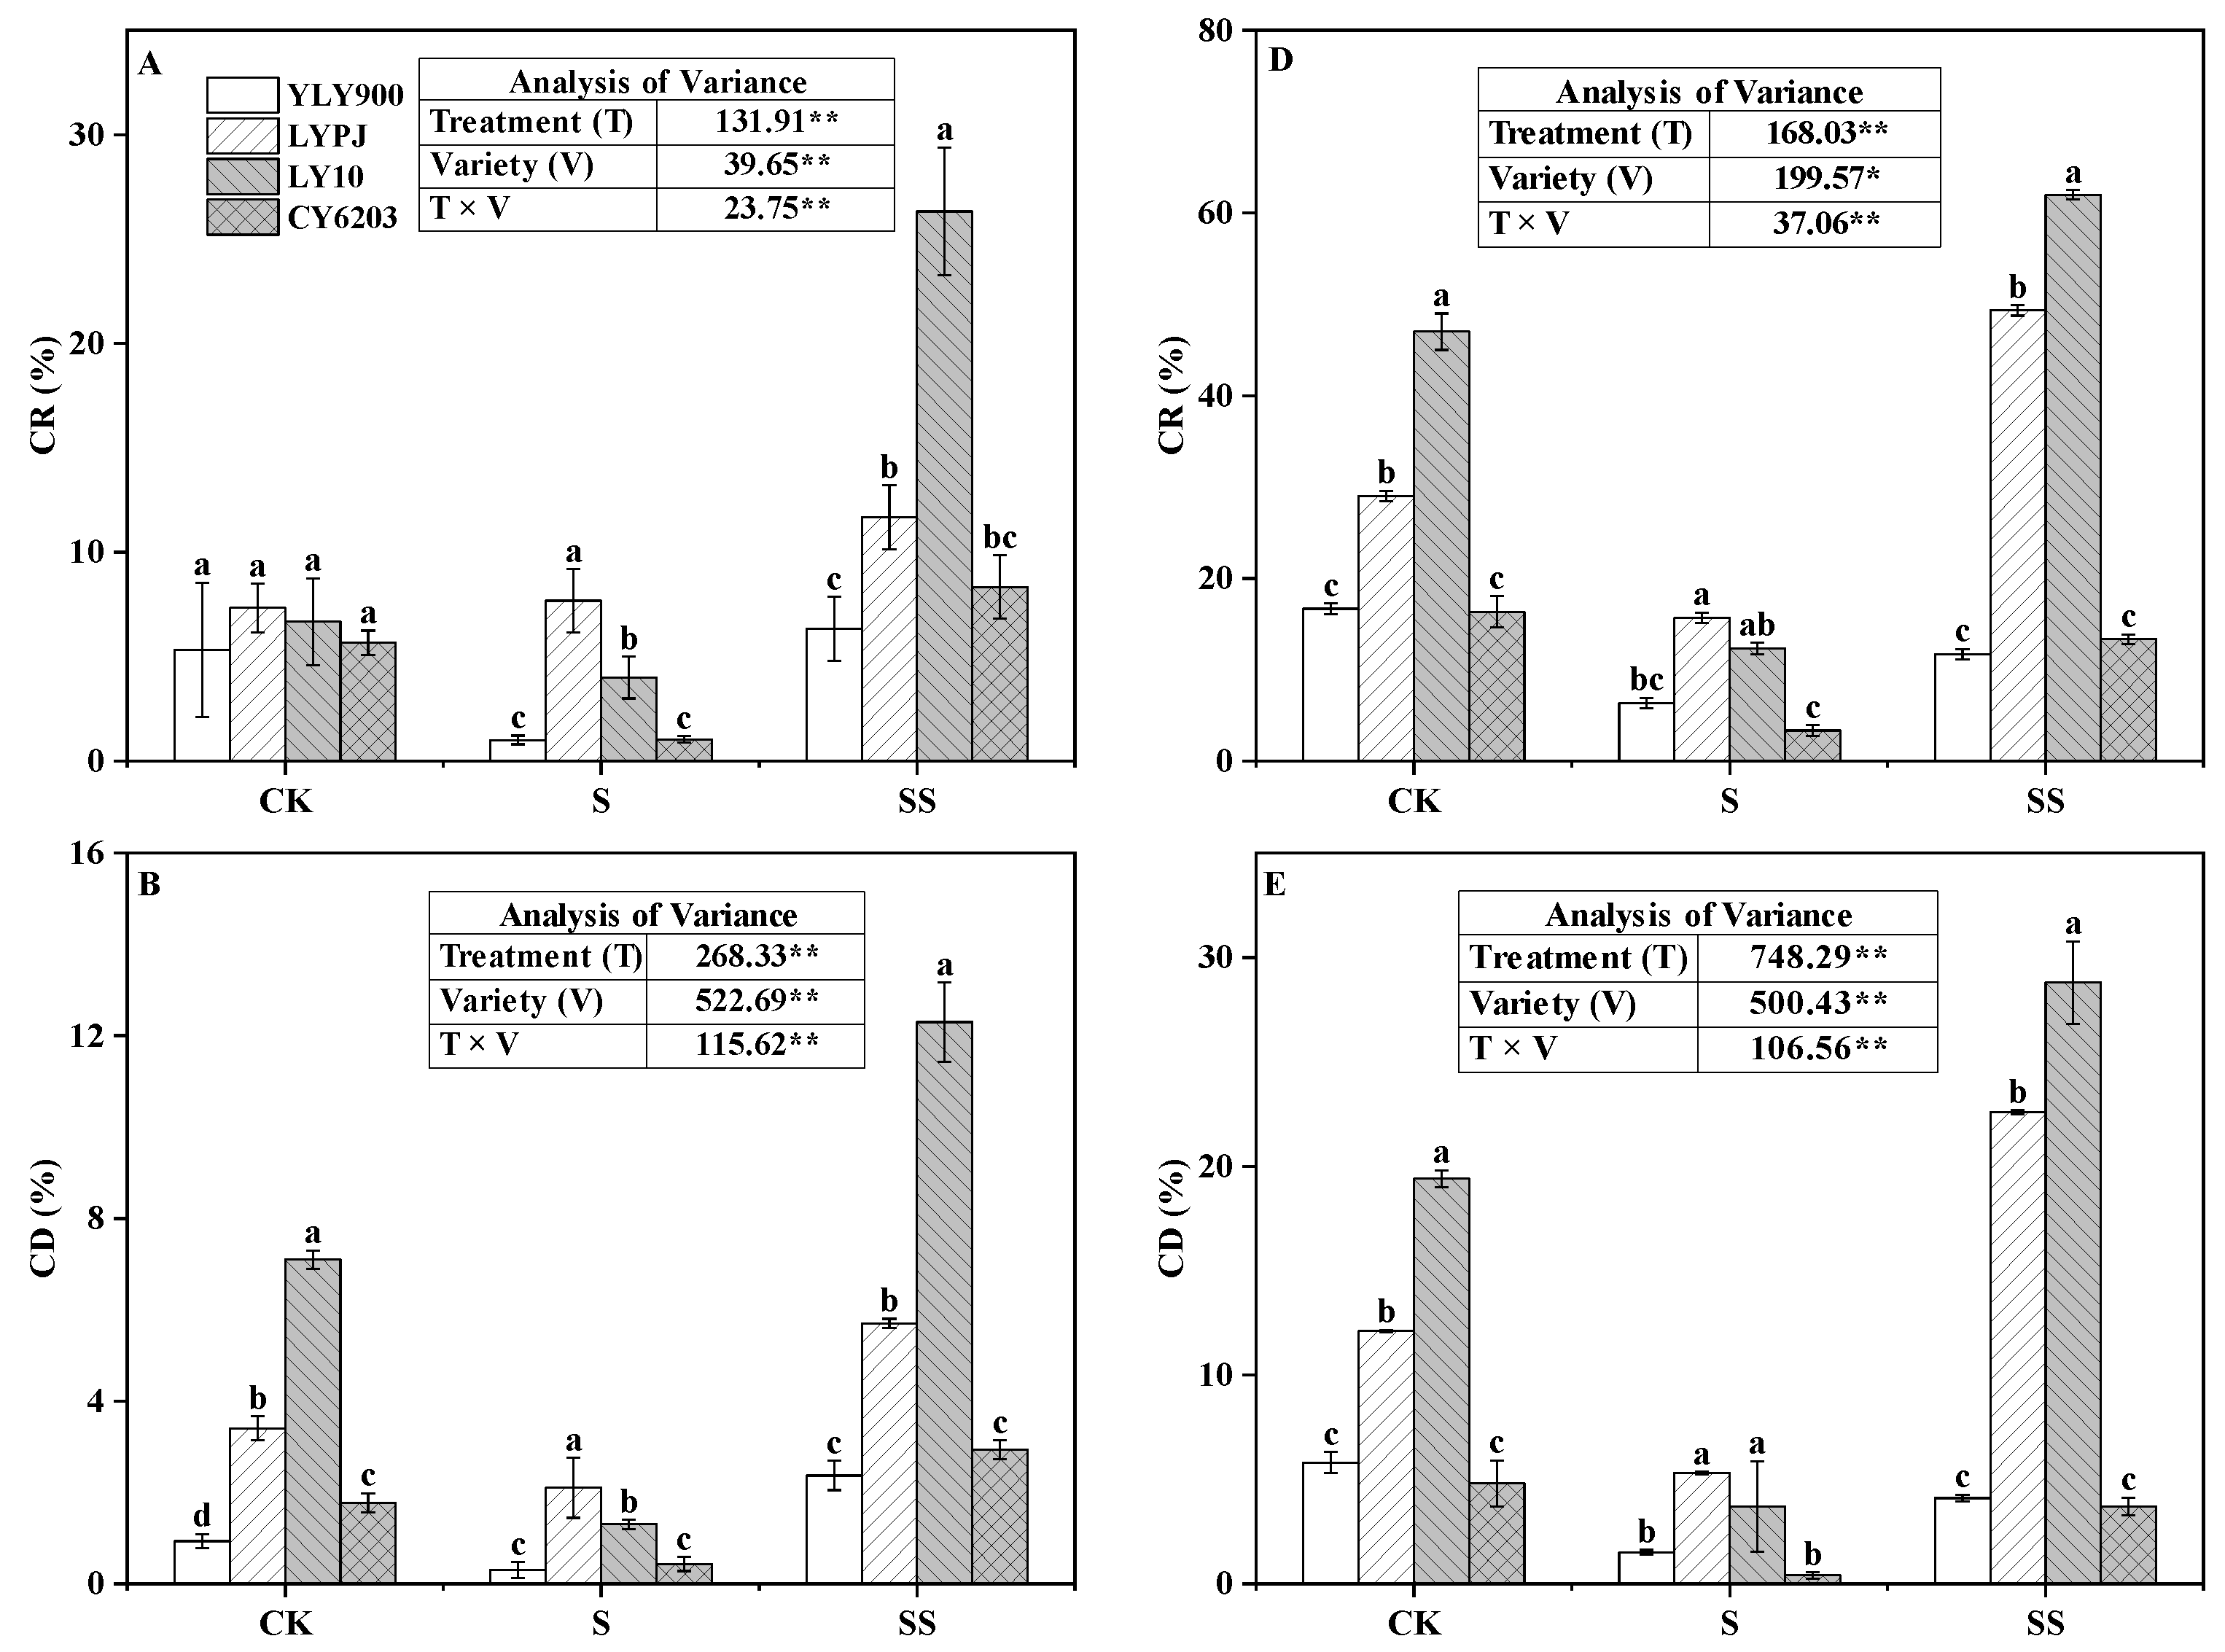
3.3. Appearance Quality
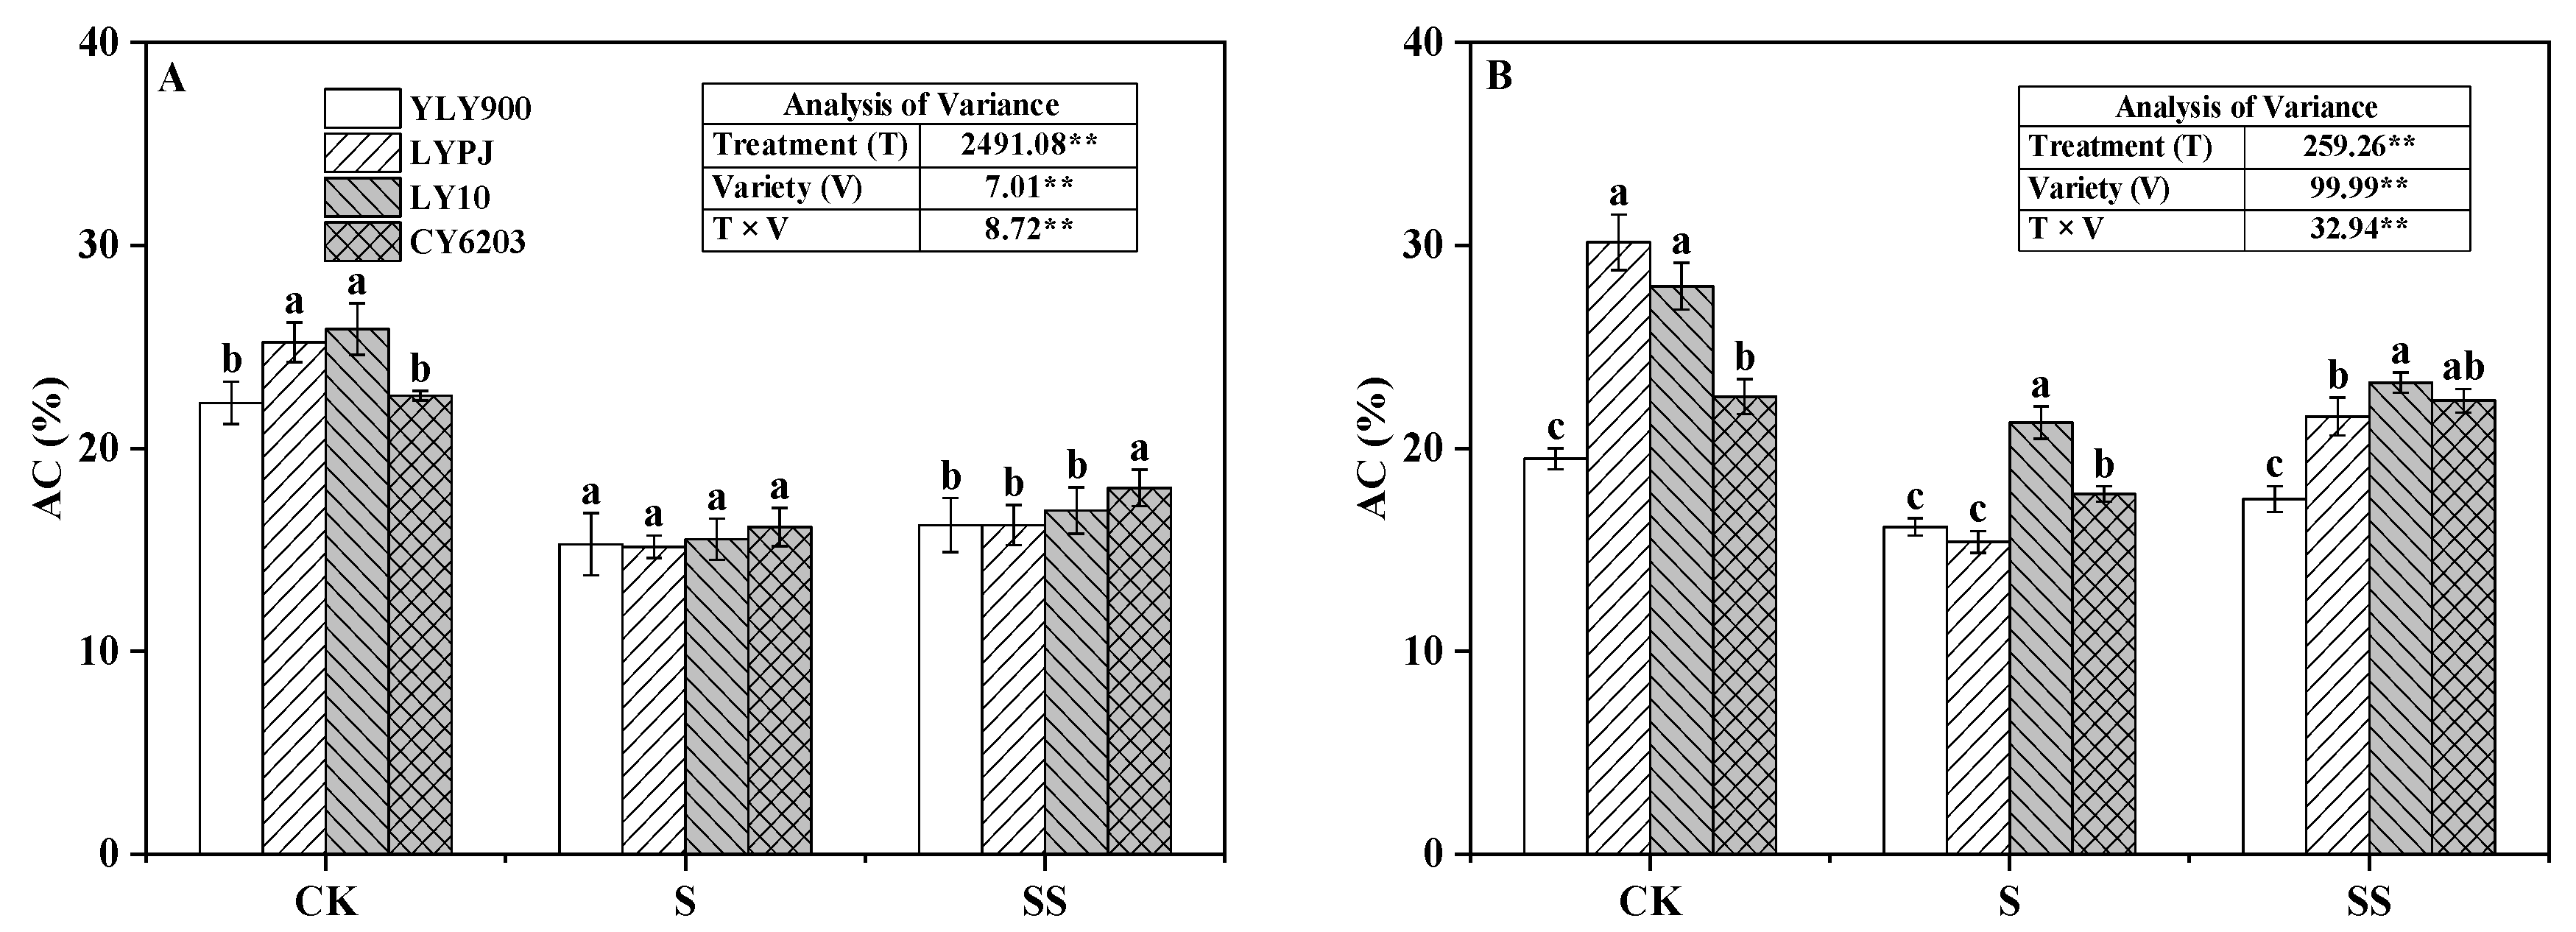
3.4. Amylose Content
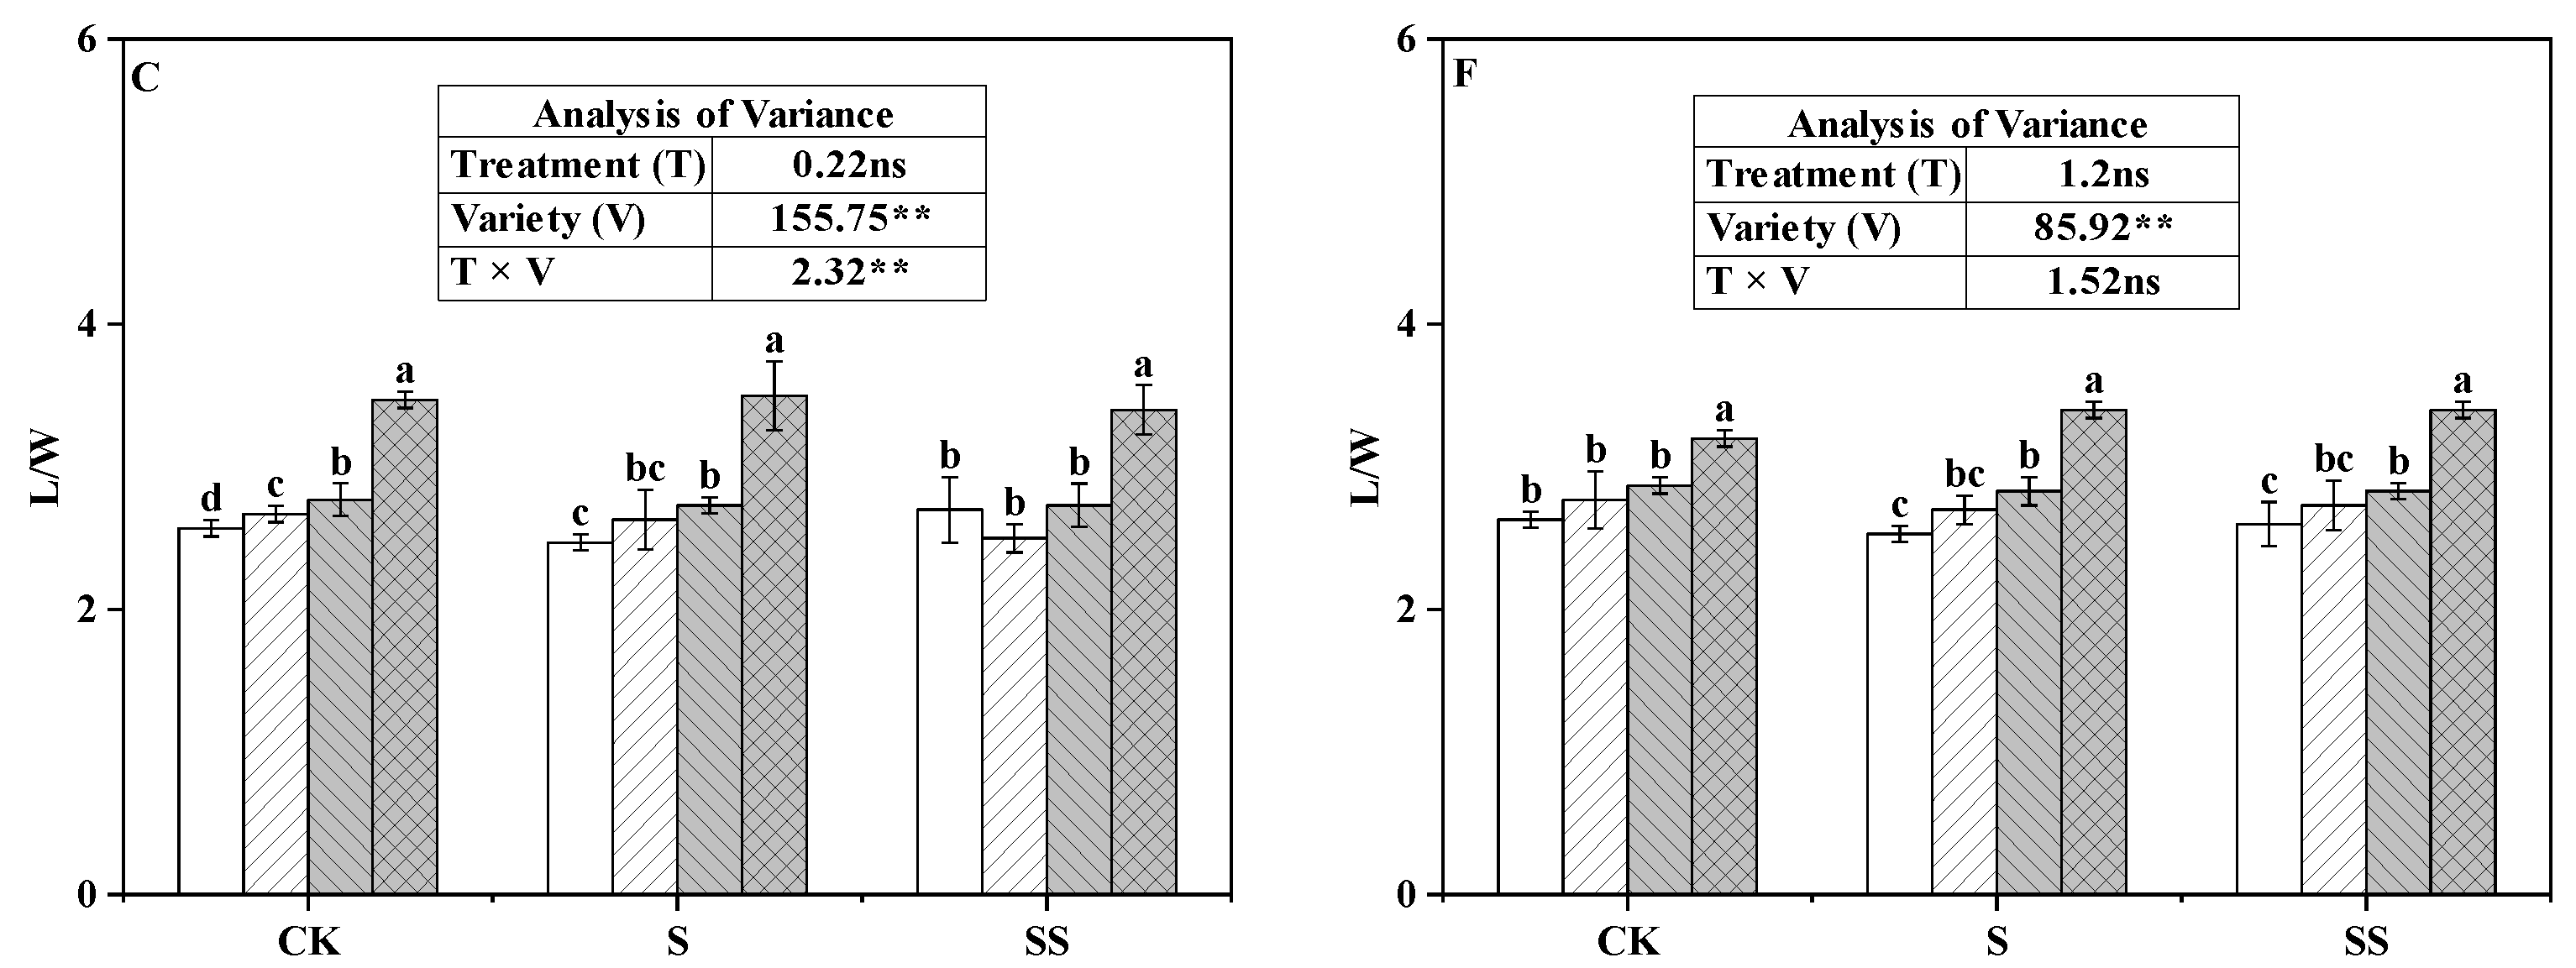
3.5. Protein Content
3.6. RVA Profile Characteristics
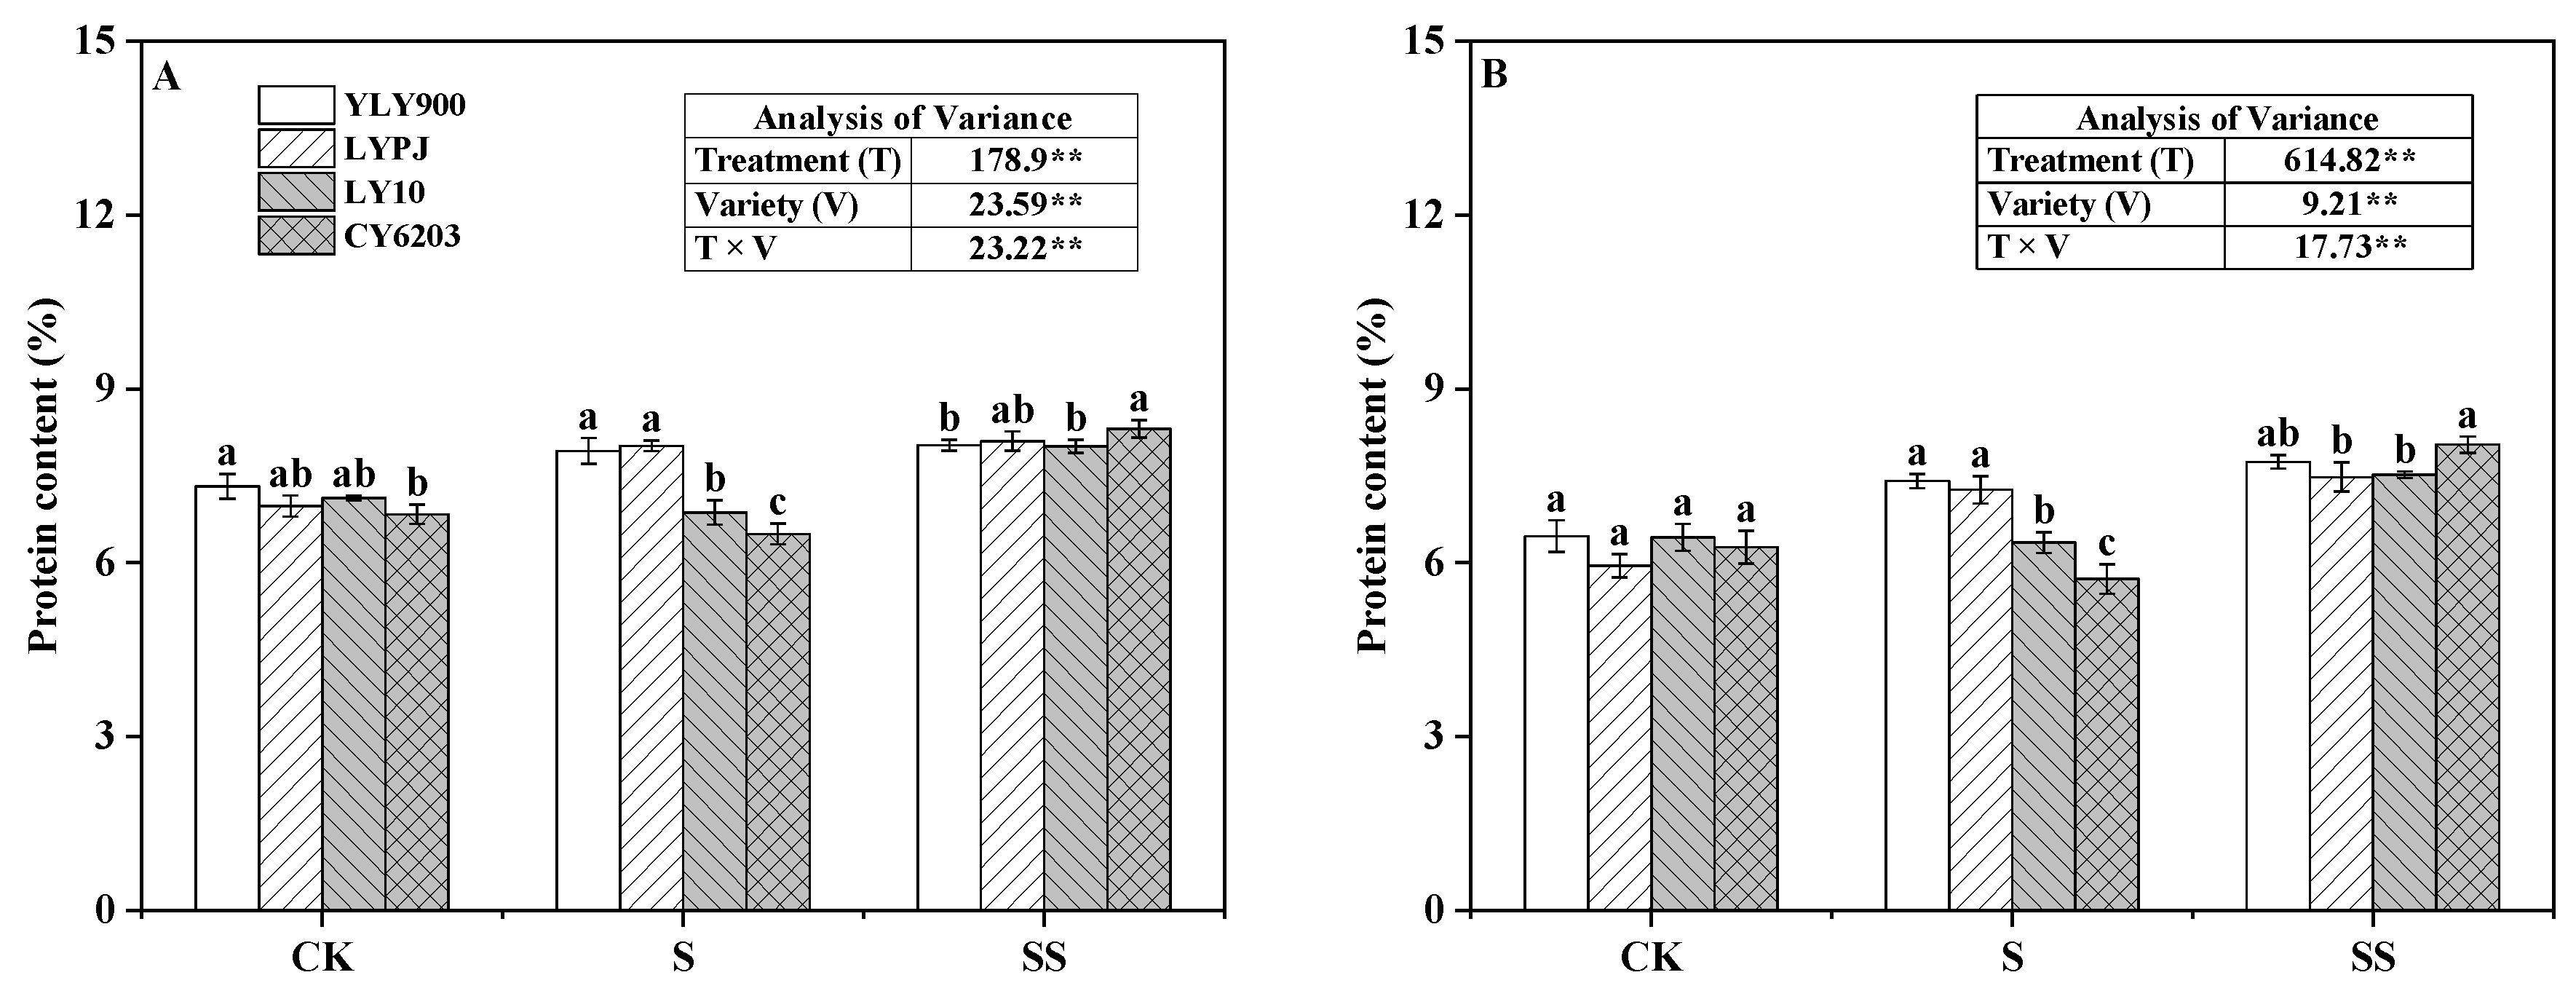
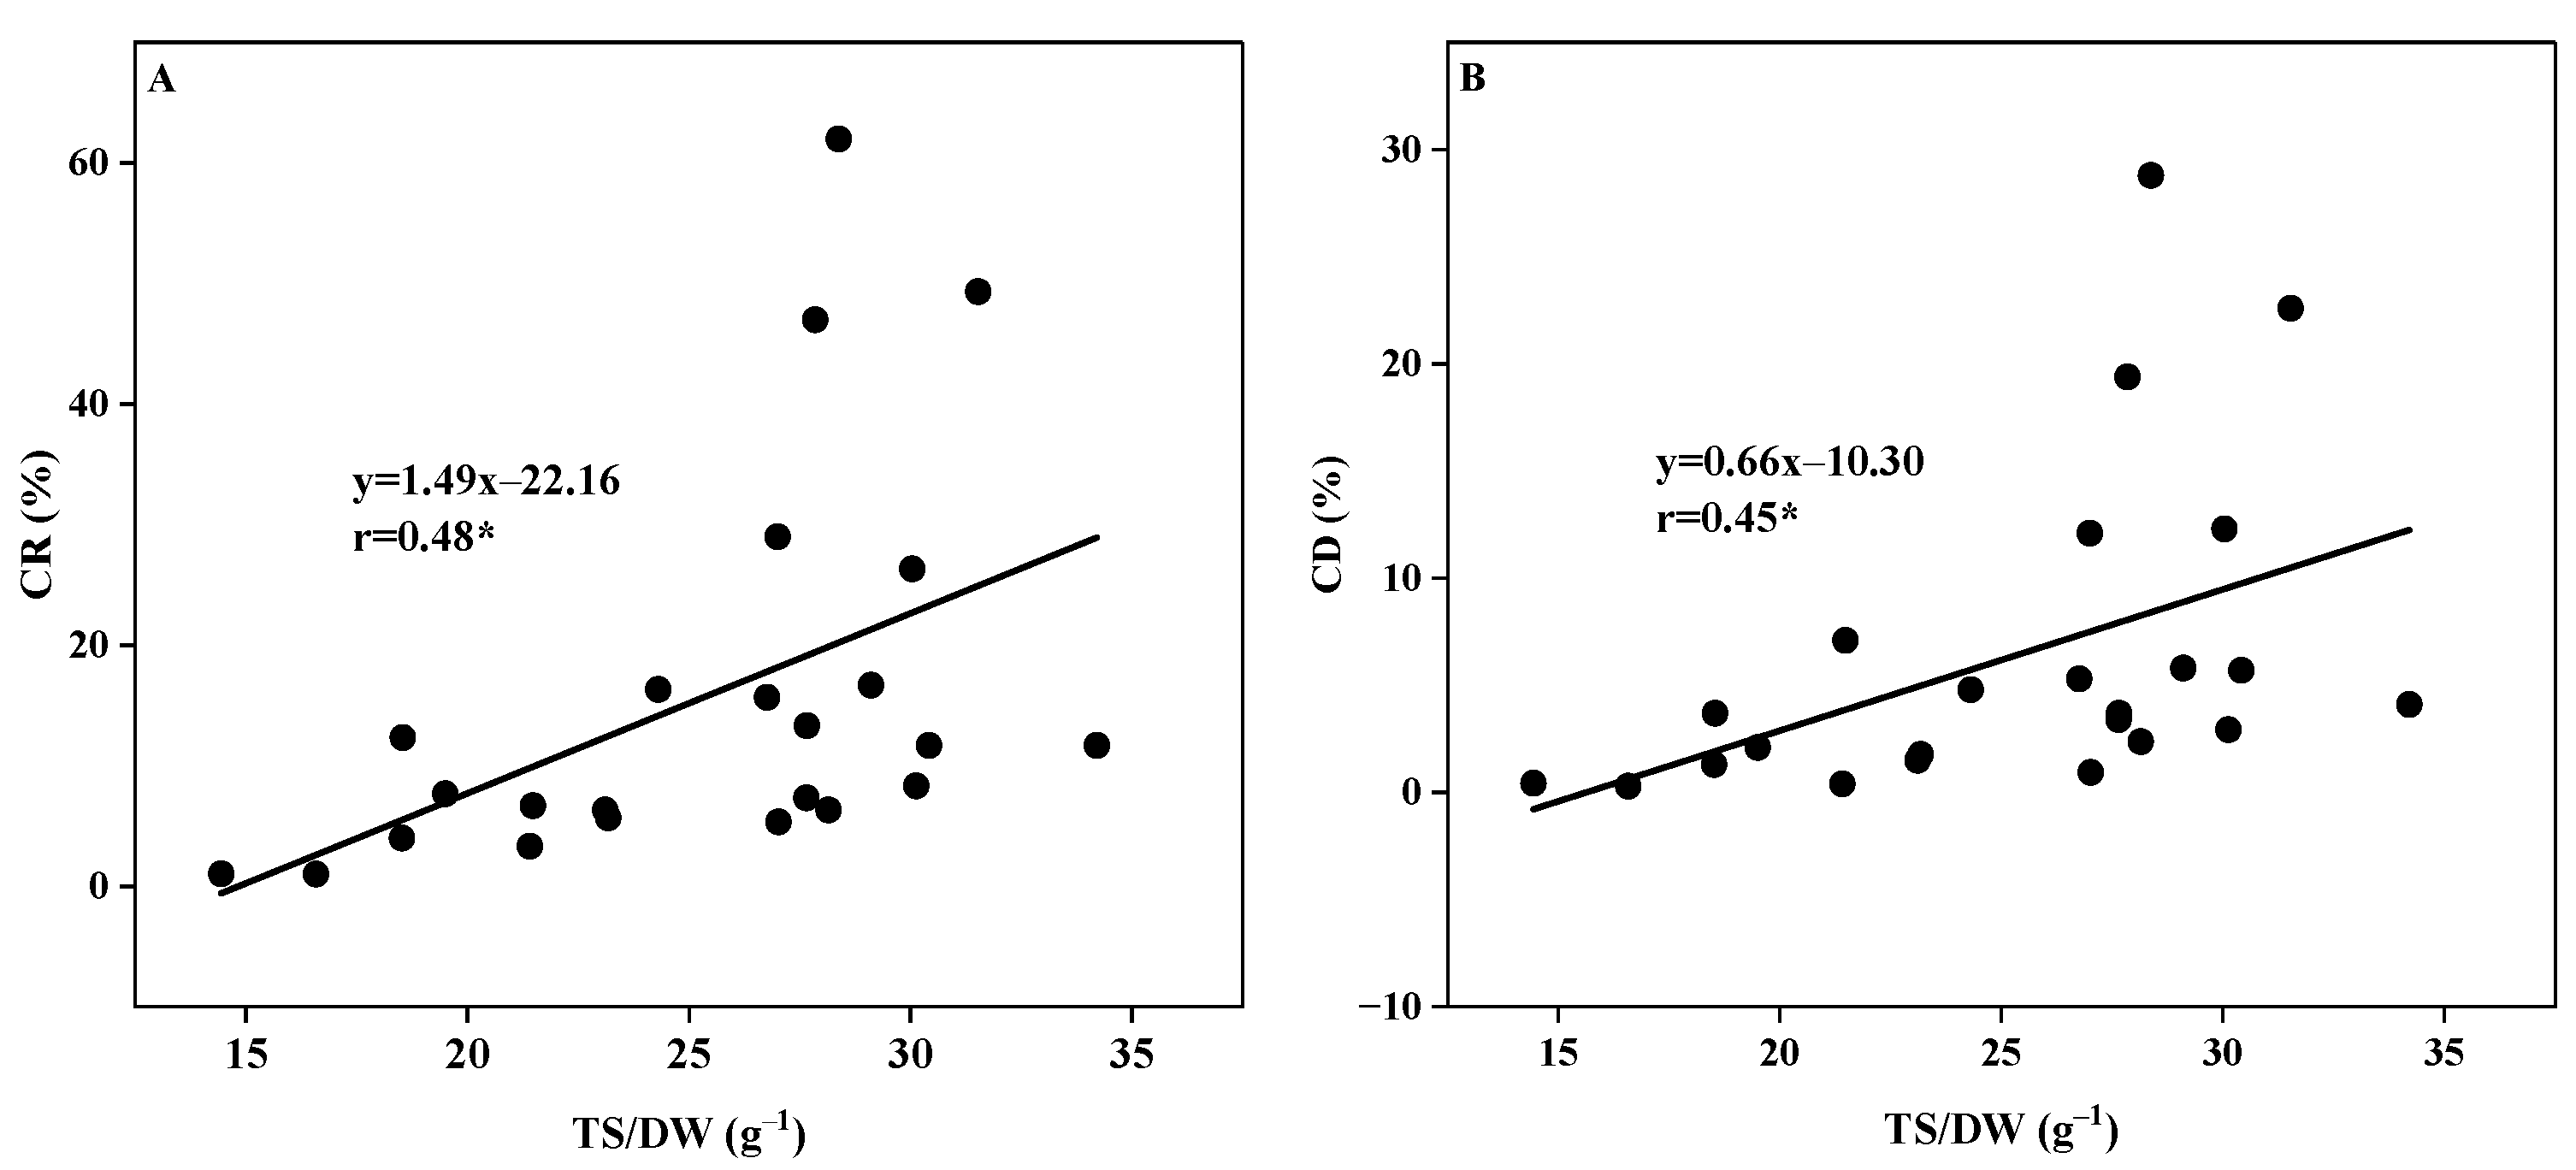
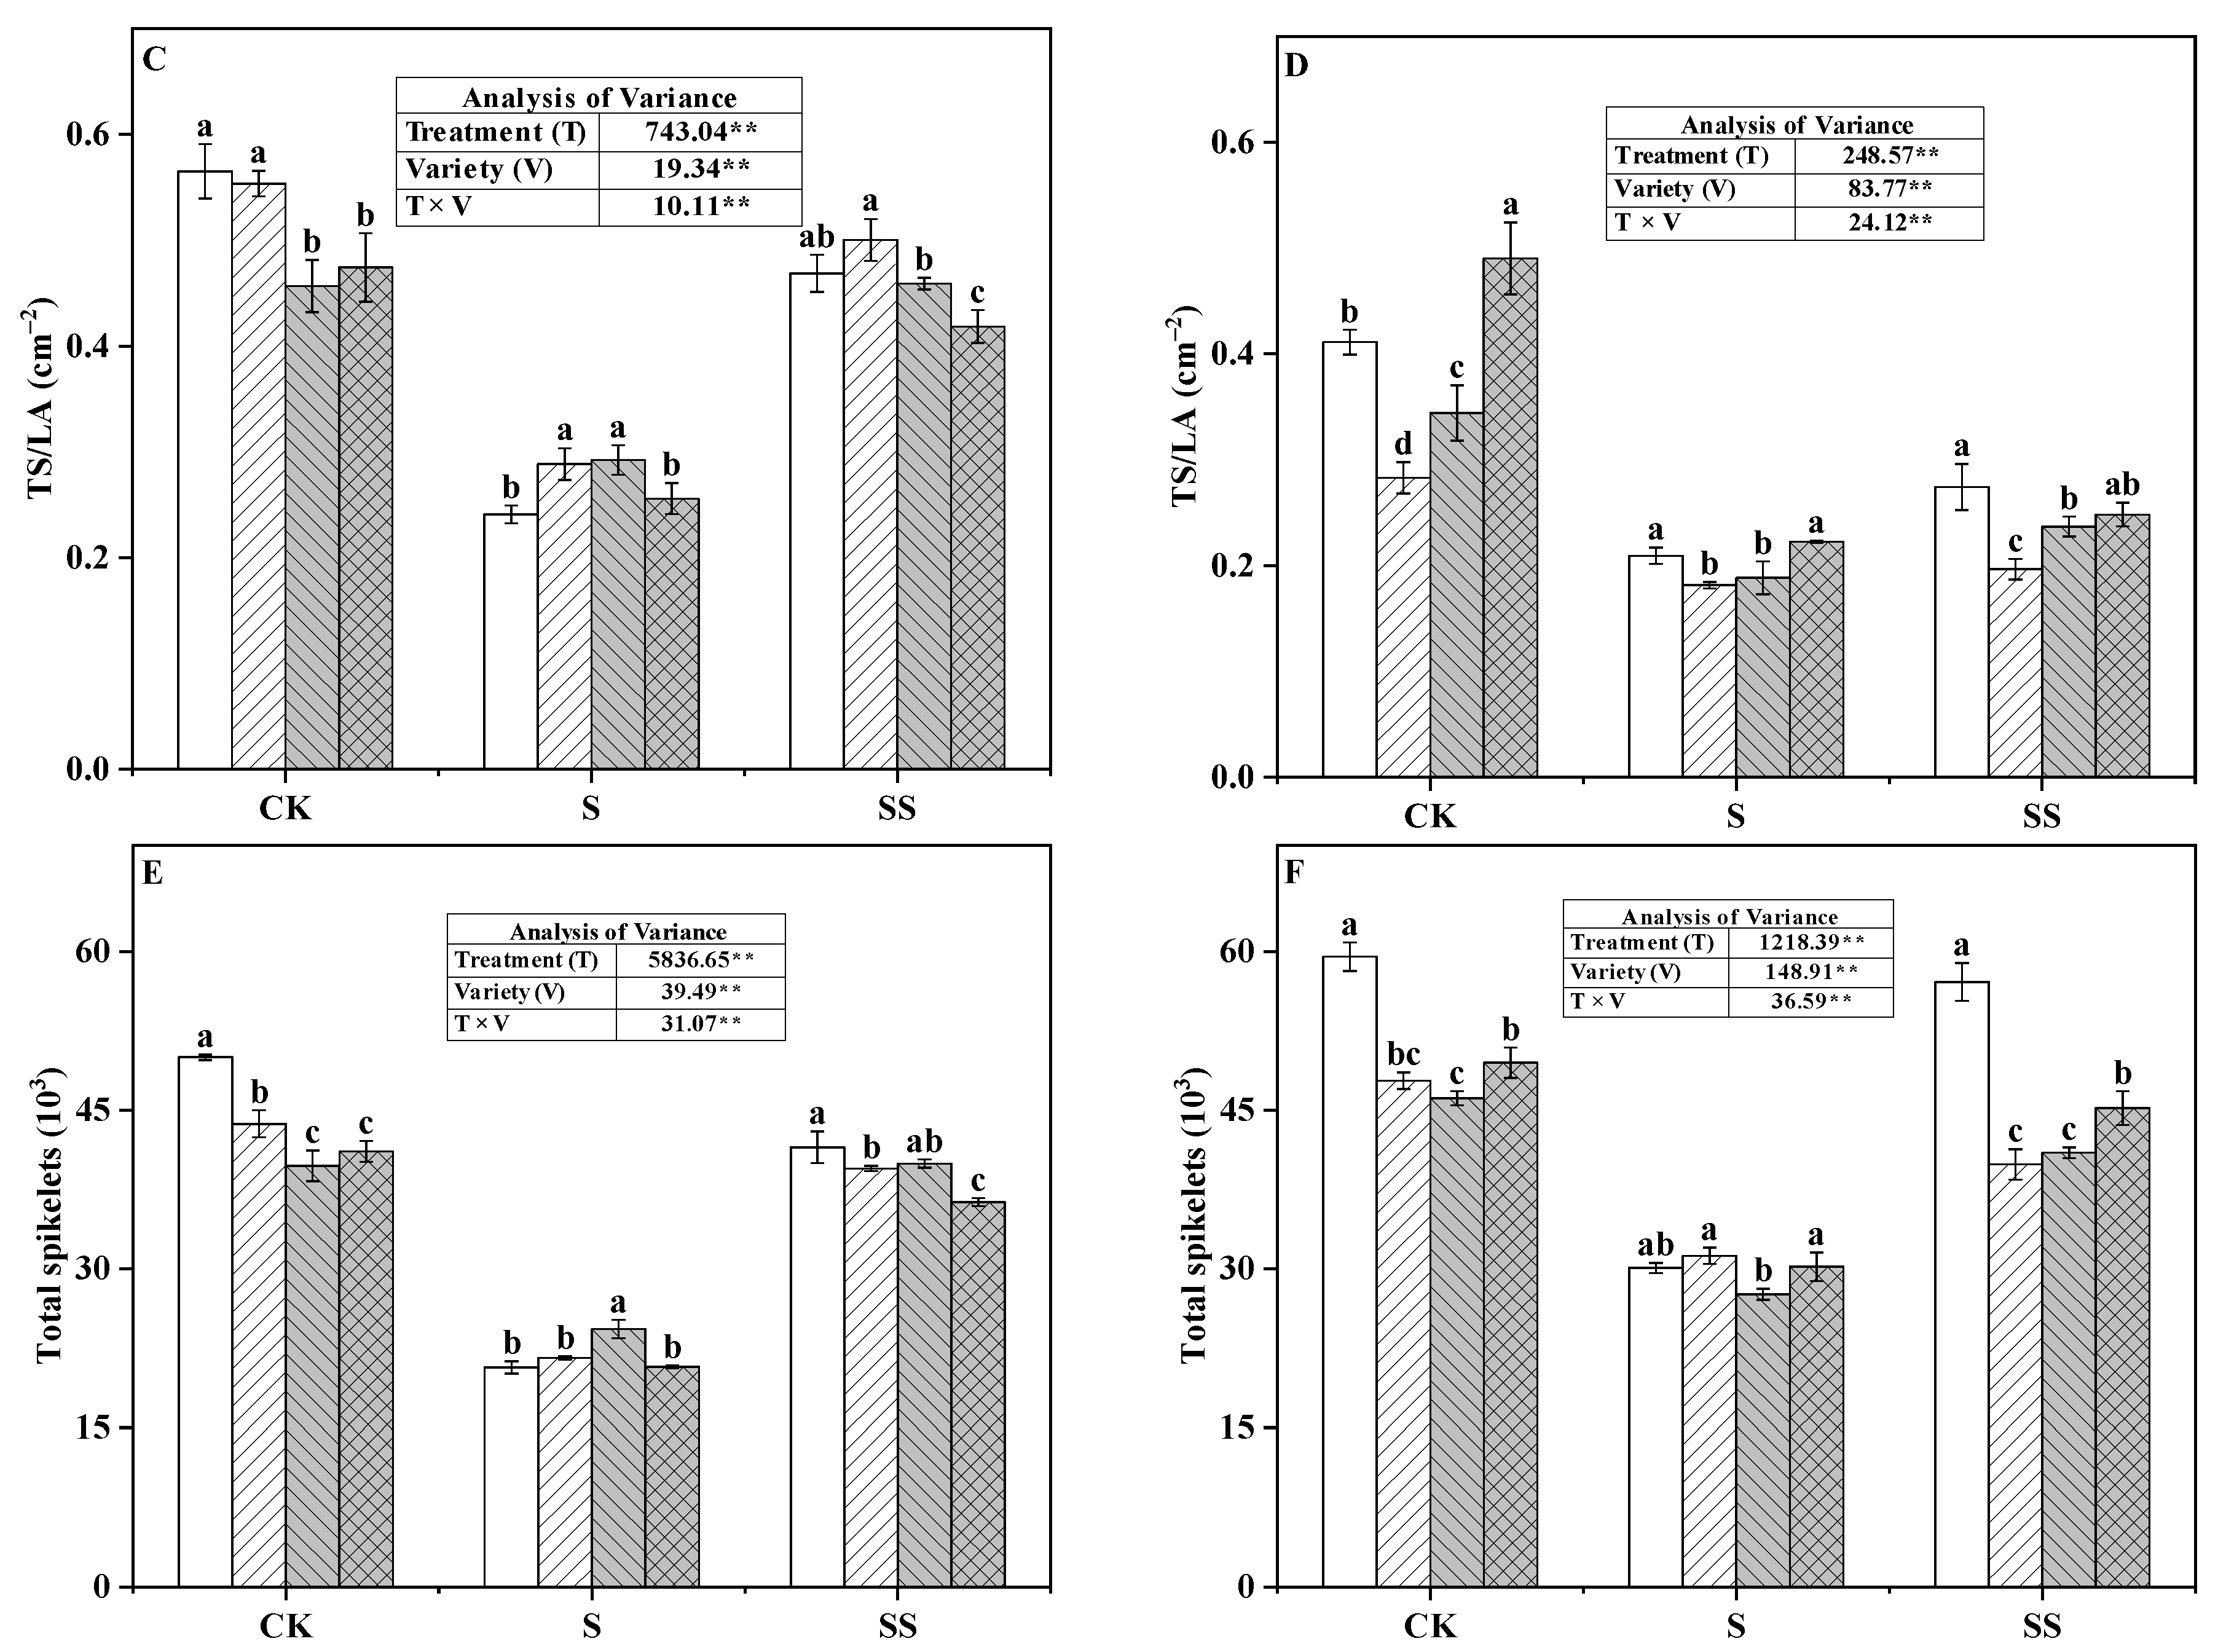
3.7. Total Spikelets·m−2, Grain–leaf Ratio and Dry Weight Spikelet Production Efficiency
4. Discussion
4.1. Effects of Shading at the Booting and Grain Filling Stages on Rice Milling Quality
4.2. Effects of Shading at the Booting and Grain Filling Stages on Rice Appearance Quality
4.3. Effects of Shading at the Booting and Grain Filling Stages on Rice Nutritional and Cooking and Eating Quality
4.4. Response of Grain Yield and Quality of Different Rice Varieties to Shading
5. Conclusions
Author Contributions
Funding
Institutional Review Board Statement
Data Availability Statement
Acknowledgments
Conflicts of Interest
References
- Huang, M.; Zou, Y.B. Integrating mechanization with agronomy and breeding to ensure food security in China. Field Crops Res. 2018, 224, 22–27. [Google Scholar] [CrossRef]
- Feng, F.; Li, Y.J.; Qin, X.L.; Liao, Y.C.; Kadambot, H.M. Changes in rice grain quality of Indica and Japonica type varieties released in China from 2000 to 2014. Front. Plant Sci. 2017, 8, 1863. [Google Scholar] [CrossRef]
- Huang, M.; Cao, J.L.; Liu, Y.; Zhang, M.Y.; Hu, L.Q.; Xiao, Z.W.; Chen, J.N.; Cao, F.B. Low-temperature stress during the flowering period alters the source-sink relationship and grain quality in field-grown late-season rice. J. Agron. Crop Sci. 2021, 207, 833–839. [Google Scholar] [CrossRef]
- Tu, D.B.; Wu, W.G.; Xi, M.; Zhou, Y.J.; Xu, Y.Z.; Chen, J.H.; Shao, C.H.; Zhang, Y.P.; Zhao, Q.X. Effect of temperature and radiation on indica rice yield and quality in middle rice cropping system. Plants 2022, 11, 2697. [Google Scholar] [CrossRef] [PubMed]
- Liu, K.; Harrison, M.T.; Yan, H.L.; Liu, D.L.; Meinke, H.; Hoogenboom, G.; Zhou, M.X.; Hoogenboom, G.; Wang, B.; Peng, B.; et al. Silver lining to a climate crisis in multiple prospects for alleviating crop waterlogging under future climates. Nat. Commun. 2023, 14, 765. [Google Scholar] [CrossRef] [PubMed]
- Ali, J.; Jan, I.; Ullah, H.; Fahad, S.; Saud, S.; Adnan, M.; Ali, B.; Liu, K.; Harrison, M.T.; Hassan, S.; et al. Biochemical response of Okra (Abelmoschus esculentus L.) to selenium (Se) under drought stress. Sustainability 2023, 15, 5694. [Google Scholar] [CrossRef]
- Liu, K.; Harrison, M.T.; Wang, B.; Yang, R.; Yan, H.; Zou, J.; Liu, D.L.; Meinke, H.; Tian, X.; Ma, S.; et al. Designing high-yielding wheat crops under late sowing: A case study in Southern China. Agron. Sustain. Dev. 2022, 42, 29. [Google Scholar] [CrossRef]
- Wild, M.; Wacker, S.; Yang, S.; Sanchez-Lorenzo, A. Evidence for Clear-Sky Dimming and Brightening in Central Europe. Geophys. Res. Lett. 2021, 48, e2020GL092216. [Google Scholar] [CrossRef]
- Wei, H.H.; Ge, J.L.; Zhang, X.B.; Zhu, W.; Deng, F.; Ren, W.J.; Chen, Y.L.; Meng, T.Y.; Dai, Q.G. Decreased panicle N application alleviates the negative effects of shading on rice grain yield and grain quality. J. Integr. Agric. 2023, 22, 2041–2053. [Google Scholar] [CrossRef]
- He, Y.Y.; Wang, K.C.; Zhou, C.L.; Wild, M. A revisit of global dimming and brightening based on the sunshine duration. Geophys. Res. Lett. 2018, 45, 4281–4289. [Google Scholar] [CrossRef]
- Jiang, N.; Ma, D.R.; Gao, H.; Lv, G.Y.; Cheng, X.Y.; Tang, L.; Chen, W.F. Effects of shading at different growth stages on yield and quality of Japonica rice in northern China. J. Shenyang Agr. Univ. 2013, 44, 385–392. [Google Scholar] [CrossRef]
- Liang, C.G.; Liu, J.; Wang, Y.; Xiong, D.; Ding, C.B.; Li, T. Low light during grain filling stage deteriorates rice cooking quality, but not nutritional value. Rice Sci. 2015, 22, 197–206. [Google Scholar] [CrossRef]
- Ahmad, N.; Rajab, A. Textural and cooking qualities of dry laksa noodle made from semi-wet and wet MR253 flours. Cereal Chem. 2018, 95, 872–880. [Google Scholar] [CrossRef]
- Bhat, F.M.; Riar, C.S. Physicochemical, cooking, and textural characteristics of grains of different rice (Oryza sativa L.) cultivars of temperate region of India and their interrelationships. J. Texture Stud. 2017, 48, 160–170. [Google Scholar] [CrossRef]
- Hu, Y.J.; Wu, P.; Xing, Z.P.; Qian, H.J.; Zhang, H.C. Effect of different mechanical transplanted methods and plant density on grain quality and characteristic of starch RVA of rice. J. Yangzhou Univ. 2017, 38, 73–82. [Google Scholar]
- Zhang, J.Y.; Kong, H.C.; Ban, X.F.; Li, C.M.; Gu, Z.B.; Li, Z.F. Rice noodle quality is structurally driven by the synergistic effect between amylose chain length and amylopectin unit-chain ratio. Carbohyd. Polym. 2022, 295, 119834. [Google Scholar] [CrossRef]
- Shang, C.; Harrison, M.; Deng, J.; Ye, J.Y.; Zhong, X.F.; Wang, C.H.; Tian, X.H.; Huang, L.Y.; Liu, K.; Zhang, Y.B. Greater propensity to photosynthesize enables superior grain quality of indica-japonical hybrid rice under shading. Agronomy 2023, 13, 535. [Google Scholar] [CrossRef]
- Li, X.X.; Huang, L.Y.; Peng, S.B.; Wang, F. Inter-annual climate variability constrains rice genetic improvement in China. Food Energy Secur. 2021, 10, e299. [Google Scholar] [CrossRef]
- Song, Y.J.; Choi, I.; Sharma, P.; Kang, C.H. Effect of different nitrogen doses on the storage proteins and palatability of rice grains of primary and secondary rachis branches. Plant Prod. Sci. 2012, 15, 253–257. [Google Scholar] [CrossRef]
- Balindong, J.L.; Ward, R.M.; Liu, L.; Rose, T.J.; Pallas, L.A.; Ovenden, B.W.; Peter, J.S.; Waters, D.L.E. Rice grain protein composition influences instrumental measures of rice cooking and eating quality. J. Cereal Sci. 2018, 79, 35–42. [Google Scholar] [CrossRef]
- Chen, H.; Chen, D.; He, L.H.; Wang, T.; Lu, H. Correlation of taste values with chemical compositions and rapid visco analyser profiles of 36 indica rice (Oryza sativa L.) varieties. Food Chem. 2021, 349, 129176. [Google Scholar] [CrossRef]
- Ren, W.J.; Yang, W.Y.; Xu, J.W.; Fan, G.Q.; Ma, Z.H. Effect of low light on grains and quality in rice. Acta Agron. Sin. 2003, 5, 785–790. [Google Scholar] [CrossRef]
- Chen, H.; Li, Q.P.; Zeng, Y.L.; Deng, F.; Ren, W.J. Effect of different shading materials on grain yield and quality of rice. Sci. Rep. 2019, 9, 9992. [Google Scholar] [CrossRef] [PubMed]
- Yan, M.M.; Yan, P.; Lv, S.Y.; Wu, J.R.; Liu, F.Y.; Xing, C. Effect of shading on rice growth and quality. J. Agric. 2019, 9, 22–25. [Google Scholar]
- Liu, Q.H.; Li, T.; Zhang, J.J. Effects of early stage shading on function leaf growth at grain-filling stage and on grain quality of rice. Chin. J. Ecol. 2006, 10, 1167–1172. [Google Scholar]
- Li, J.; Jiang, X.D.; Yang, S.B.; Tian, X.Y. Changes of agricultural climate resources during rice growing season in the middle and lower reaches of the Yangtze River. Jiangsu J. Agric. Sci. 2020, 36, 99–107. [Google Scholar] [CrossRef]
- IUSS Working Group. World Reference Base for Soil Resources. International Soil Classification System for Naming Soils and Creating Legends for Soil Maps, 4th ed.; International Union of Soil Sciences (IUSS): Vienna, Austria, 2022; Volume 107. [Google Scholar]
- Huang, L.Y.; Yang, D.; Li, X.; Peng, S.B.; Wang, F. Coordination of high grain yield and high nitrogen use efficiency through large sink size and high post-heading source capacity in rice. Field Crops Res. 2019, 233, 49–58. [Google Scholar] [CrossRef]
- GB/T17891-2017; High Quality Paddy. National Food Administration: Beijing, China, 2017.
- Xu, D.; Zhu, Y.; Zhou, L.; Han, C.; Zheng, L.M.; Zhang, H.C.; Wei, H.Y.; Wang, Y.; Liao, A.H.; Cai, S.B. Differences in yield and grain quality among various types of Indica/japonica hybrid rice and correlation between quality and climatic factors during grain filling period. Acta Agron. Sin. 2018, 44, 1548. [Google Scholar] [CrossRef]
- Feng, Z.M.; Shen, J.; Tan, S.Q. Determination of protein in rice by BCA method. Neijiang Technol. 2017, 6, 87. [Google Scholar]
- Xu, F.X.; Zheng, J.K.; Zhu, Y.C.; Wang, G.X. Effect of atmospheric phenomena factors on the milling quality and the appearance quality of medium india hybrid rice during the period from full heading to maturity. Acta Phytoecol. Sin. 2003, 27, 73–77. [Google Scholar]
- Liu, Q.H.; Wu, X.; Chen, B.C.; Ma, J.Q.; Gao, J. Effects of low light on agronomic and physiological characteristics of rice including grain yield and quality. Rice Sci. 2014, 21, 243–251. [Google Scholar] [CrossRef]
- Wei, H.Y.; Zhu, Y.; Qiu, S.; Han, C.; Hu, L.; Xu, D.; Zhou, N.P.; Xing, Z.P.; Hu, Y.J.; Cui, P.Y.; et al. Combined effect of shading time and nitrogen level on grain filling and grain quality in japonica super rice. J. Integr. Agric. 2018, 17, 2405–2417. [Google Scholar] [CrossRef]
- Rosario, A.R.D.; Briones, V.P.; Vidal, A.J.; Juliano, B.O. Composition and endosperm structure of developing and mature rice kernel. Cereal Chem. 1968, 45, 225–235. [Google Scholar]
- Leesawatwong, M.; Jamjod, S.; Kuo, J.; Dell, B.; Rerkasem, B. Nitrogen fertilizer increases seed protein and milling quality of rice. Cereal Chem. 2005, 82, 588–593. [Google Scholar] [CrossRef]
- Du, Y.X.; Ji, X.; Zhang, J.; Li, J.Z.; Sun, H.Z.; Zhao, Q.Z. Research progress on the impacts of low light intensity on rice growth and development. Chin. J. Eco-Agric. 2013, 21, 1307–1317. [Google Scholar] [CrossRef]
- Liu, Q.H.; Cai, J.; Li, T.; Zhang, J.J. Response of grain-filling properties and quality in rice to weak light during initial period of young spike. Acta Agric. Univ. Jiangxiensis 2007, 2, 172–175. [Google Scholar] [CrossRef]
- Liu, K.; Yang, R.; Lu, J.; Wang, X.Y.; Lu, B.L.; Tian, X.H.; Zhang, Y.B. Radiation use efficiency and source-sink changes of super hybrid rice under shade stress during grain filling stage. Agron. J. 2019, 111, 1788–1798. [Google Scholar] [CrossRef]
- Li, H.Y.; Sangeeta, P.; Timothy, M.N.; Melissa, A.F.; Robert, G.G. The importance of amylose and amylopectin fine structure for textural properties of cooked rice grains. Food Chem. 2016, 196, 702–711. [Google Scholar] [CrossRef]
- Chen, Y.; Wang, M.; Ouwerkerk, P.B.F. Molecular and environmental factors determining grain quality in rice. Food Energy Secur. 2012, 1, 111–132. [Google Scholar] [CrossRef]
- Shi, S.J.; Ma, Y.Y.; Zhao, D.; Li, L.N.; Cao, C.G.; Jiang, Y. The differences in metabolites, starch structure, and physicochemical properties of rice were related to the decrease in taste quality under high nitrogen fertilizer application. Int. J. Biol. Macromol. 2023, 253, 126546. [Google Scholar] [CrossRef]
- Deng, F.; Li, Q.P.; Chen, H.; Zeng, Y.L.; Li, B.; Zhong, X.Y.; Ren, W.J. Relationship between chalkiness and the structural and thermal properties of rice starch after shading during grain-filling stage. Carbohyd. Polym. 2021, 252, 117212. [Google Scholar] [CrossRef]
- Mo, Z.W.; Wu, L.; Pan, S.G.; Fitzgerald, T.L.; Xiao, F.; Tang, Y.J.; Tang, X.R. Shading during the grain filling period increases 2-acetyl-1-pyrroline content in fragrant rice. Rice 2015, 8, 9. [Google Scholar] [CrossRef]
- Shi, S.J.; Wang, E.T.; Li, C.X.; Cai, M.L.; Cheng, B.; Cao, C.G.; Yang, J. Use of protein content, amylose content, and RVA parameters to evaluate the taste quality of rice. Front. Nutr. 2022, 8, 758547. [Google Scholar] [CrossRef]
- Liu, Q.Y.; Tao, Y.; Cheng, S.; Zhou, L.; Tian, J.Y.; Xing, Z.P.; Liu, G.D.; Wei, H.Y.; Zhang, H.C. Relating amylose and protein contents to eating quality in 105 varieties of japonica rice. Cereal Chem. 2020, 97, 1303–1312. [Google Scholar] [CrossRef]
- Ali, I.; Iqbal, A.; Ullah, S.; Muhammad, I.; Yuan, P.L.; Zhao, Q.; Yang, M.; Zhang, H.; Huang, M.; Liang, H.; et al. Effects of biochar amendment and nitrogen fertilizer on RVA Profile and rice grain quality attributes. Foods 2022, 11, 625. [Google Scholar] [CrossRef] [PubMed]
- Wang, L.; Deng, F.; Ren, W.J. Shading tolerance in rice is related to better light harvesting and use efficiency and grain filling rate during grain filling period. Field Crops Res. 2015, 180, 54–62. [Google Scholar] [CrossRef]
- Shang, C.; Guo, Z.; Chong, H.T.; Xiong, X.; Deng, J.; Matthew, T.H.; Liu, K.; Huang, L.Y.; Tian, X.H.; Zhang, Y.B. Higher radiation use efficiency and photosynthetic characteristics after flowering could alleviate the yield loss of indica-japonica hybrid rice under shading stress. Int. J. Plant Prod. 2022, 16, 105–117. [Google Scholar] [CrossRef]
- Polthanee, A.; Promsaena, K.; Laoken, A. Influence of low light intensity on growth and yield of four soybean cultivars during wet and dry seasons of northeast Thailand. J. Agric. Sci. 2011, 2, 61–67. [Google Scholar] [CrossRef]
- Wang, L.; Deng, F.; Ren, W.J.; Yang, W.Y. Effects of Shading on Starch Pasting Characteristics of Indica Hybrid Rice (Oryza sativa L.). PLoS ONE 2013, 8, e68220. [Google Scholar] [CrossRef]
- Liu, K.; Yang, R.; Deng, J.; Huang, L.Y.; Zhong, W.W.; Ma, G.H.; Tian, X.H.; Zhang, Y.B. High radiation use efficiency improves yield in the recently developed elite hybrid rice Y-liangyou 900. Field Crops Res. 2020, 253, 107804. [Google Scholar] [CrossRef]


| Treatment | Variety | 2021 | 2022 | ||||||
|---|---|---|---|---|---|---|---|---|---|
| Albumin | Globulin | Gliadin | Glutelin | Albumin | Globulin | Gliadin | Glutelin | ||
| % | % | ||||||||
| CK | YLY900 | 0.17 c | 0.82 b | 0.25 a | 6.08 a | 0.18 b | 0.55 bc | 0.24 a | 5.49 a |
| LYPJ | 0.32 a | 0.79 b | 0.24 a | 5.63 b | 0.18 b | 0.51 c | 0.23 a | 5.03 a | |
| LY10 | 0.29 ab | 0.80 b | 0.21 b | 5.81 ab | 0.24 a | 0.58 b | 0.21 a | 5.41 a | |
| CY6203 | 0.27 b | 0.86 a | 0.22 ab | 5.48 b | 0.25 a | 0.72 a | 0.22 a | 5.08 a | |
| S | YLY900 | 0.30 a | 0.84 a | 0.32 b | 6.47 a | 0.34 a | 0.68 b | 0.33 a | 6.06 a |
| LYPJ | 0.28 a | 0.84 a | 0.30 b | 6.59 a | 0.23 d | 0.64 b | 0.29 a | 6.09 a | |
| LY10 | 0.29 a | 0.84 a | 0.31 b | 5.43 b | 0.26 c | 0.80 a | 0.29 a | 5.00 b | |
| CY6203 | 0.22 b | 0.82 a | 0.35 a | 5.10 b | 0.29 b | 0.66 b | 0.33 a | 4.45 c | |
| SS | YLY900 | 0.29 ab | 0.91 b | 0.39 a | 6.45 ab | 0.47 a | 0.87 a | 0.40 a | 6.49 a |
| LYPJ | 0.27 b | 0.98 a | 0.28 c | 6.57 ab | 0.37 b | 0.86 a | 0.34 b | 6.16 b | |
| LY10 | 0.31 a | 0.92 b | 0.36 b | 6.42 b | 0.32 c | 0.85 a | 0.32 bc | 6.03 b | |
| CY6203 | 0.30 a | 0.91 b | 0.37 ab | 6.73 a | 0.19 d | 0.84 a | 0.28 c | 6.01 b | |
| Analysis of Variance | |||||||||
| Treatment (T) | 43.68 ** | 214.74 ** | 652.71 ** | 104.86 ** | 505.18 ** | 331.42 ** | 284.81 ** | 258.81 ** | |
| Variety (V) | 19.19 ** | 2.39 ns | 21.84 ** | 24.40 ** | 168.82 ** | 6.66 ** | 11.14 ** | 9.08 ** | |
| T × V | 30.15 ** | 13.49 ** | 13.45 ** | 21.88 ** | 130.28 ** | 9.32 ** | 4.71 ** | 18.09 ** | |
| Treatment | Variety | PV | HV | BKV | FV | SB | GT |
|---|---|---|---|---|---|---|---|
| cP | °C | ||||||
| CK | YLY900 | 3740.7 a | 2266.0 ab | 1474.7 a | 3307.3 b | −433.3 d | 81.4 a |
| LYPJ | 3348.0 c | 2254.3 ab | 1093.7 c | 3796.7 a | 448.7 a | 81.1 a | |
| LY10 | 3553.3 b | 2316.3 a | 1237.0 b | 3884.3 a | 331.0 b | 80.8 a | |
| CY6203 | 3298.7 c | 2199.0 b | 1099.7 c | 3390.7 b | 92.0 c | 75.8 b | |
| S | YLY900 | 3647.3 a | 2436.7 b | 1210.7 b | 3475.7 b | −171.7 c | 81.9 a |
| LYPJ | 2978.7 c | 2079.0 c | 899.7 c | 3504.3 b | 525.7 a | 80.3 b | |
| LY10 | 3541.7 a | 2576.3 a | 965.3 c | 3988.0 a | 446.3 b | 80.8 ab | |
| CY6203 | 3322.3 b | 1995.7 c | 1326.7 a | 3163.3 c | −159.0 c | 76.2 c | |
| SS | YLY900 | 3318.7 a | 2272.3 a | 1046.3 a | 3266.7 b | −52.0 d | 81.9 a |
| LYPJ | 2769.3 d | 2113.7 b | 655.7 c | 3294.3 b | 525.0 b | 81.5 a | |
| LY10 | 2910.3 c | 2306.3 a | 604.0 c | 3514.3 a | 604.0 a | 81.9 a | |
| CY6203 | 3050.7 b | 2187.3 ab | 863.3 b | 3245.7 b | 195.0 c | 80.7 a | |
| Analysis of Variance | |||||||
| Treatment (T) | 124.72 ** | 2.25 ns | 705.53 ** | 43.91 ** | 1513.50 ** | 6.53 ns | |
| Variety (V) | 85.28 ** | 38.82 ** | 132.60 ** | 89.77 ** | 3061.81 ** | 21.99 ** | |
| T × V | 9.22 ** | 12.51 ** | 27.50 ** | 13.57 ** | 127.40 ** | 3.00 * | |
| Treatment | Variety | PV | HV | BKV | FV | SB | GT |
|---|---|---|---|---|---|---|---|
| cP | °C | ||||||
| CK | YLY900 | 3228.0 a | 2124.7 ab | 1103.3 a | 3374.0 a | 146.0 c | 85.2 b |
| LYPJ | 2331.3 d | 1859.0 c | 472.3 d | 2974.7 b | 643.3 b | 89.9 ab | |
| LY10 | 2532.3 c | 2014.3 bc | 518.0 c | 3355.7 a | 823.3 a | 91.0 a | |
| CY6203 | 2935.3 b | 2186.3 a | 749.0 b | 3050.7 b | 115.3 d | 87.8 ab | |
| S | YLY900 | 2936.7 a | 2137.0 a | 799.7 a | 3133.7 a | 197.0 d | 89.1 a |
| LYPJ | 1702.0 c | 1485.7 d | 216.3 d | 2591.0 b | 889.0 b | 90.7 a | |
| LY10 | 2226.7 b | 1865.7 b | 361.0 c | 3167.0 a | 940.3 a | 92.3 a | |
| CY6203 | 2188.0 b | 1688.0 c | 500.0 b | 2575.7 b | 387.7 c | 89.6 a | |
| SS | YLY900 | 2888.3 a | 2091.3 a | 797.0 a | 3188.3 a | 300.0 d | 88.9 a |
| LYPJ | 1709.0 d | 1534.7 d | 174.3 d | 2739.7 c | 1030.7 a | 90.9 a | |
| LY10 | 2035.0 c | 1654.3 c | 380.7 c | 2978.3 b | 943.3 b | 88.1 a | |
| CY6203 | 2238.7 b | 1766.3 b | 472.3 b | 2690.0 c | 451.3 c | 89.6 a | |
| Analysis of Variance | |||||||
| Treatment (T) | 2730.16 ** | 708.01 ** | 1535.65 ** | 391.68 ** | 555.90 ** | 9.69 * | |
| Variety (V) | 574.39 ** | 106.63 ** | 2344.58 ** | 150.21 ** | 4991.48 ** | 2.75 ns | |
| T × V | 13.28 ** | 14.44 ** | 20.16 ** | 6.62 ** | 69.86 ** | 1.22 ns | |
Disclaimer/Publisher’s Note: The statements, opinions and data contained in all publications are solely those of the individual author(s) and contributor(s) and not of MDPI and/or the editor(s). MDPI and/or the editor(s) disclaim responsibility for any injury to people or property resulting from any ideas, methods, instructions or products referred to in the content. |
© 2024 by the authors. Licensee MDPI, Basel, Switzerland. This article is an open access article distributed under the terms and conditions of the Creative Commons Attribution (CC BY) license (https://creativecommons.org/licenses/by/4.0/).
Share and Cite
Shang, L.; Liu, Z.; Ye, J.; Sheng, T.; Li, R.; Deng, J.; Liu, K.; Tian, X.; Zhang, Y.; Huang, L. Shading at the Booting Stage Improved the Grain Quality of Hybrid Rice Due to Reduced Spikelet Production. Agriculture 2024, 14, 371. https://doi.org/10.3390/agriculture14030371
Shang L, Liu Z, Ye J, Sheng T, Li R, Deng J, Liu K, Tian X, Zhang Y, Huang L. Shading at the Booting Stage Improved the Grain Quality of Hybrid Rice Due to Reduced Spikelet Production. Agriculture. 2024; 14(3):371. https://doi.org/10.3390/agriculture14030371
Chicago/Turabian StyleShang, Liyan, Zichen Liu, Jiayu Ye, Tian Sheng, Ruijie Li, Jun Deng, Ke Liu, Xiaohai Tian, Yunbo Zhang, and Liying Huang. 2024. "Shading at the Booting Stage Improved the Grain Quality of Hybrid Rice Due to Reduced Spikelet Production" Agriculture 14, no. 3: 371. https://doi.org/10.3390/agriculture14030371
APA StyleShang, L., Liu, Z., Ye, J., Sheng, T., Li, R., Deng, J., Liu, K., Tian, X., Zhang, Y., & Huang, L. (2024). Shading at the Booting Stage Improved the Grain Quality of Hybrid Rice Due to Reduced Spikelet Production. Agriculture, 14(3), 371. https://doi.org/10.3390/agriculture14030371