Article

UAV-Based Vegetation Indices to Evaluate Coffee Crop Response after Transplanting Seedlings Grown in Different Containers

by
Rafael Alexandre Pena Barata
1,
Gabriel Araújo e Silva Ferraz
1,*,
Nicole Lopes Bento
1,
Lucas Santos Santana
1,
Diego Bedin Marin
2,
Drucylla Guerra Mattos
3,
Felipe Schwerz
1,
Giuseppe Rossi
4,
Leonardo Conti
4 and
Gianluca Bambi
4
1
Agricultural Engineering Department, School of Engineering, Federal University of Lavras, Lavras 37200-900, Brazil
2
Agricultural Research Company of Minas Gerais (EPAMIG), Viçosa 36571-000, Brazil
3
Department of Agriculture, School of Agriculture, Federal University of Lavras, Lavras 37200-900, Brazil
4
Department of Agriculture, Food, Environment and Forestry, University of Florence, 50145 Florence, Italy
*
Author to whom correspondence should be addressed.
Agriculture 2024, 14(3), 356; https://doi.org/10.3390/agriculture14030356
Submission received: 18 January 2024 / Revised: 15 February 2024 / Accepted: 21 February 2024 / Published: 23 February 2024
(This article belongs to the Special Issue Precision Remote Sensing and Information Detection in Agriculture)

Abstract

:
Brazil stands out among coffee-growing countries worldwide. The use of precision agriculture to monitor coffee plants after transplantation has become an important step in the coffee production chain. The objective of this study was to assess how coffee plants respond after transplanting seedlings grown in different containers, based on multispectral images acquired by Unmanned Aerial Vehicles (UAV). The study was conducted in Santo Antônio do Amparo, Minas Gerais, Brazil. The coffee plants were imaged by UAV, and their height, crown diameter, and chlorophyll content were measured in the field. The vegetation indices were compared to the field measurements through graphical and correlation analysis. According to the results, no significant differences were found between the studied variables. However, the area transplanted with seedlings grown in perforated bags showed a lower percentage of mortality than the treatment with root trainers (6.4% vs. 11.7%). Additionally, the vegetation indices, including normalized difference red-edge, normalized difference vegetation index, and canopy planar area calculated by vectorization (cm2), were strongly correlated with biophysical parameters. Linear models were successfully developed to predict biophysical parameters, such as the leaf area index. Moreover, UAV proved to be an effective tool for monitoring coffee using this approach.

1. Introduction

Brazil is projected to contribute around a third of the world’s coffee production, solidifying its position as the leading producer and exporter of coffee [1,2]. The arabica coffee (Coffea arabica L.) comprises approximately 70% of Brazil’s coffee output, with Minas Gerais standing out as the state with the highest production volume [2]. These statistics underscore the significant economic and social significance of the coffee industry in Brazil.
The regional climate and terrain characteristics of Minas Gerais state provide favorable conditions for coffee production. However, the high productive potential of coffee in these areas necessitates adequate monitoring and the use of technology to ensure high yields. In this context, precision agriculture has become intrinsic to coffee cultivation. Within coffee farming, this approach is known as precision coffee farming, characterized by a collection of methods and technologies that consider the spatial characteristics of both soil and plants, helping coffee growers manage their crops to improve the final product’s quality and maximize income [2]. However, this technology cannot be implemented without the farmer’s knowledge of the field, and agricultural practices developed across generations are also crucial for successful coffee growing.
Among the different phases of the coffee production cycle, establishing the crop in the field is essential. Therefore, it is important to produce quality seedlings and ensure adequate monitoring after transplanting to ensure a good crop establishment in the field. In this context, conducting studies to evaluate the production of coffee seedlings in different containers, as well as the response of the seedlings after implantation in the field, becomes necessary.
The utilization of different containers for coffee seedling production has been the focus of research studies. Conventional polyethylene bags have some disadvantages, such as potential disintegration, susceptibility to nematode infection, taproot coiling, high substrate demand, and low efficiency in the nursery phase, necessitating a large area and manual planting. Consequently, root trainers and perforated bags have emerged as alternative options. In addition to overcoming the aforementioned disadvantages, both alternatives enable mechanical planting, among other benefits. However, farmers harbor concerns about certain factors, like seedling survival, creating resistance to change due to the high manual labor cost associated with replanting [3,4,5]. Studies on containers for coffee seedling production have been conducted, most of which have shown superior results in higher-volume containers without necessarily indicating an effect from the container material [6,7]. However, the majority of these studies evaluated the nursery phase, with only a few assessing the performance post-transplanting.
One of the approaches integrated into precision agriculture is remote sensing, defined as the acquisition of information about objects on the Earth’s surface without physical contact [8,9]. Due to the well-defined spectral response of plants and their characteristic interaction with electromagnetic radiation, remote sensors find application in agriculture for monitoring purposes. However, there is a lack of studies related to coffee cultivation post-transplanting of seedlings in the field, as coffee is a perennial, complex crop with diverse phenological phases. Furthermore, the emergence of Unmanned Aerial Vehicles (UAV) equipped with remote sensors exacerbates this gap, as UAV images offer higher spatiotemporal resolution compared to satellite images [10]. The challenges related to acquiring spectral information at an appropriate temporal resolution and the expenses associated with obtaining high spatial resolution imagery have been successfully addressed with UAVs [11].
Various studies have employed remote sensing to assess coffee plants, monitor diseases and water stress, and establish correlations among other biotic and abiotic factors using vegetation indices (VIs) measured by orbital sensors [12,13,14]. Others have utilized multispectral cameras coupled to UAVs to evaluate fruit ripening, seedling mortality, and correlations between field measurements and aerial images [15,16,17,18,19,20,21,22,23]. However, no studies have utilized remote sensing and UAVs to monitor farming practices, specifically the response of coffee seedlings transplanted in different containers.
To address this gap, a comparative study was conducted, examining indices obtained from aerial imagery in conjunction with field-collected data, including crop growth variables. The study involved graphical analysis of variations over time, correlation analysis, and development of linear models. Within this scope, the study aimed to evaluate the response of coffee plants grown in different containers (root trainers and perforated bags) after transplantation to the field, using VIs generated from multispectral images acquired by UAVs.

2. Materials and Methods

2.1. Study Area and Experimental Design

The experimental site is situated within the coffee-growing area of Samambaia Farm, located in Santo Antônio do Amparo, in the Campos das Vertentes region, within the Formiga microregion, southeastern Minas Gerais (MG), Brazil [24]. As the Köppen climate classification modified by [25], the regional climate is categorized as Cwb, a subtropical highland climate that features mainly dry winters and mild summers. Temperature averages fall between 18 °C and 22 °C, accompanied by an average annual rainfall of 1650 mm. The dry season typically lasts from May to September, succeeded by the rainy season, which can persist until late March or early April.
The experimental area (Figure 1) is positioned at geographic coordinates 20°53′29.37″ S and 44°56′4.83″ W and an average altitude of 1010 m, covering an area of 0.28 hectares. The Coffea arabica L. cultivar Catuaí IAC-62 was planted. The predominant soil type in the region is classified as red–yellow latosol according to the Brazilian Soil Classification System [26].

2.2. Seedlings Production and Transplanting

The production of coffee seedlings was conducted in a nursery, utilizing two types of containers. The first type was the polyvinyl chloride (PVC) root trainer, which had a volume of 180 mL. The second container was perforated polyethylene bags with a volume of 615 mL. Both containers were filled with a substrate composed of soil and trop-strate, a mixture of vermiculite, coconut fiber, and pine. For clarity in presenting results and discussions, the two container types were referred to as “root trainers” and “perforated bags”.
Following seedling production in the nursery, transplantation occurred in the field between November and December 2018. The research was conducted until March of 2020 (16 months of coffee growing evaluation). The seedlings were planted with 50 cm of spacing between plants and 3.8 m between rows in perforated bags using the Mafes transplanter (Gralha model). Three rows were allocated for planting and evaluating seedlings produced in root trainers. Ground control points (GCPs) were utilized to mark sample units, aiding in their identification in the UAV images. Fifteen GCPs were used for each treatment, one for each sample unit (30 in total). The markers were made of cardboard and colored pressed cards.

2.3. Unmanned Aerial Vehicles, Flight Plans, and Multispectral Sensors

The images were captured between 12:00 and 13:00 (local time) to minimize the impact of shadows, utilizing a commercial DJI Matrice 100 UAV equipped with a quadcopter (rotary-wing) design powered by four engines. This UAV was fitted with a Parrot Sequoia multispectral camera. The camera is equipped with an RGB sensor boasting a resolution of 16 megapixels (4608 × 3456) and four supplementary sensors, each with a resolution of 1.5 megapixels (1280 × 960), capturing spectral bands in green (550 nm BP 40), red (660 nm BP 40), red-edge (735 nm BP 10), and near-infrared (790 nm BP 40).
Additionally, the camera incorporates a solar radiation sensor, integrated with a global navigation satellite system (GNSS), as well as a radiometric calibration panel responsible for calibrating electromagnetic radiation (EMR) and standardizing data into reflectance values. Flight planning and configuration, including flight direction (across planting rows), image overlay (80 × 80%), speed (8 m.s−1), and altitude (50 m), were managed using the open-source software Precision Flight version 2.0 [27]. Images were captured at intervals of 1.2 s, resulting in a total of 335 scenes and generating an orthomosaic with a Ground Sample Distance (GSD) of 4.85 cm. The flights were conducted bimonthly, as well as the field data collection, resulting in six flights in total.

2.4. Processing of Images and Spectral Data

Following the flights, the images underwent processing using PIX4D Mapper software, Version 4.4.10 [28]. The processing workflow is presented in Figure 2. Subsequently, the generated products were utilized in software applications such as QGIS 3.4.14 Madeira [29] and eCognition Developer 9.0 [30] for generating vegetation indices (VIs), image segmentation, and storing geospatial vector data (shapefiles) representing the sample units, which were also used for vectorized canopy planar-area analysis. This enabled the extraction of VI values from the stored data. The field-measured parameters (crown diameter, chlorophyll, and height) were incorporated into tables detailing the attributes of the vectors.

2.5. Vegetation Indices

Vegetation indices were calculated to assess the spectral response of coffee trees transplanted from different containers (Table 1). These indices were selected from the literature to evaluate parameters such as chlorophyll content, nitrogen levels, vigor, water stress, and productivity estimation, among others [31,32,33,34].
The indices were calculated in QGIS using the “Raster Calculator” tool and then extracted using the “Zonal Statistics” tool. The vectors were created in the eCognition Developer software following a predefined process tree outlined in [38] and following the concepts of object-based image analysis (OBIA) for UAV, regarding canopy planar area [39,40], encompassing the following sequence of tasks: (a) Image segmentation conducted using “multi-resolution segmentation” and “spectral difference segmentation” algorithms; (b) coffee tree sampling facilitated using the “sample selection” tool; (c) training and classification conducted using the “support vector machine” classifier, incorporating parameters such as brightness, shape, compactness, spectral bands, and VIs; (d) exporting the transformed vectors into the shapefile format (the vectors represented coffee trees canopy planar area).

2.6. Seedling Mortality Assessment

To determine whether there was a difference in “seedling survival” between transplanted seedlings grown in root trainers versus those produced in perforated polyethylene bags, a survey was conducted to count the number of deceased seedlings. This assessment was conducted using eCognition Developer following the methodology outlined in the previous section [38]. The process involved analyzing images from December 2018, corresponding to the period of coffee seedling transplantation, and images from April, which were recorded before the first replanting (gap filling) was conducted in the area. The percentage of seedling mortality was calculated using Equation (1).
%   s e e d l i n g   m o r t a l i t y = n u m b e r   o f   s e e d l i n g s   t r a n s p l a n t e d   i n   D e c e m b e r n u m b e r   o f   s e e d l i n g s   i n   A p r i l

2.7. Field Sampling

To assess the response of seedlings cultivated in different containers, field analyses were conducted every 2 months, coinciding with the collection of images on the same day. Throughout these evaluations, the height and canopy diameter of the plants were measured with a graduated measuring tape, and the chlorophyll content was determined using a chlorophyll meter sensor. In the section where coffee seedlings were transplanted into perforated bags, designated as the control, three rows were marked for planting. Each row was divided into five sample units, with each unit comprising an average of five plants. These samples were spaced at intervals of at least 20 plants, resulting in a total of 15 samples. The identical procedure was followed in the area where coffee seedlings were transplanted into root trainers, maintaining a one-row separation from the previously sampled area to minimize border row effects (Figure 3).
The chlorophyll measurements were conducted using the atLEAF + chlorophyll meter (FT Green LLC, Wilmington, DE, USA) by attaching the sensor onto the coffee leaf, covering an area of 6 mm2. Subsequently, Equations (2)–(4) developed and described by [41] were employed to estimate the Chlorophyll A and Chlorophyll B content in mg cm−2.
T o t a l   C h l o r o p h y l l = 0.078 × a t L E A F 1.63
C h l a = 5.774 + 0.430 × a t L E A F + 0.0045 × a t L E A F 2
C h l b = 0.040 × a t L E A F 1.57
where atLEAF is chlorophyll content recorded by the chlorophyll meter (dimensionless), C h l a is chlorophyll content a (μg/cm2) and C h l b is chlorophyll content b (μg/cm2).
The Leaf Area Index (LAI) was calculated following the methodology proposed by [42], which correlates leaf area to the crop area, utilizing plant height and crown diameter, as shown in Equation (5)
L A I = 0.0134 + 0.7276 × D ² × h
where D represents plant diameter (m) and h represents plant height (m).

2.8. Statistical Analysis

The data collected in the field and extracted from images were structured into tables using Microsoft Excel version 16.0, and graphical representations were generated to illustrate the coffee trees’ responses.
To assess the distribution of the data, the Shapiro–Wilk test [43] was conducted in SISVAR, indicating a departure from normal distribution. The data were submitted to the Mann–Whitney test [44] for independent and non-parametric variables in the software R version 4.1.3, adopting, in both tests, a significance level of ρ = 0.05.
Spearman’s rank–order correlation [45]– ρ ^ s was employed to determine the correlation between variables measured in the field and those derived from UAV images. Furthermore, the Pearson’s chi-squared (χ2) test [46], suitable for nominal and non-parametric variables, was utilized to investigate the association between the frequency of seedling mortality observed during transplantation and the container type (root trainer or perforated bag) at a significance level of ρ = 0.05.
Additionally, linear models were developed using R [47] to predict physical variables obtained from field sampling based on VIs and digital measurements derived from UAV images.

3. Results and Discussion

3.1. Coffee Growth Evaluations

The growth variables of coffee seedlings from perforated bags and root trainers post-transplantation are detailed in Table 2. Table 2 illustrates a bi-monthly increase in LAI (derived from height and diameter) and the canopy planar area calculated via vectorization. There were fluctuations in chlorophyll levels and VIs. However, in September, both LAI and canopy planar area increases were interrupted due to defoliation. Notably, chlorophyll values peaked in July (winter) and hit their lowest point in January (summer).
The coffee growth variables during the production cycle showed a linear pattern of increase, mainly in height, canopy planar area, and LAI. The increase in leaf area is crucial for photosynthesis and the production of assimilates by the plant, ensuring a good initial establishment of the crop in the field and, thus, reducing the need for replanting seedlings. This result is consistent with other studies such as [48], evaluating the growth of coffee seedlings, where they observed that seedlings with greater leaf area development and root growth have a greater adaptation to field conditions and consequently result in minor replanting.
The variation of vegetation indices during the study period can be seen in Figure 4. The VI decreases during the dry seasons and increase again during the rainy season. Almost all vegetation indices showed a similar trend over time, with a decline observed from May onwards, reaching their lowest values in September. Notably, indices like MCARI1 and MSAVI2 exhibited higher values in November compared to January.
The comparison between seedlings produced in different containers (perforated bags versus root trainers) revealed no significant differences in the majority of variables over time, as shown in Figure 4. Coffee growth variables, such as LAI derived from field measurements of height and diameter, as well as the canopy planar area calculated by vectorization, exhibited a consistent linear increase. These variables experienced a slight decrease in September, notably the canopy planar area, which was likely attributed to defoliation during the dry season and the coffee’s slow-growth period in its phenology. The same response pattern depending on the coffee phases was observed in some studies [49,50,51].

3.2. Coffee Growth Variables under Different Seedling Containers

After confirming the non-normal distribution of the data using the Shapiro–Wilk test, the Mann–Whitney test was conducted to assess differences between treatments for all sampled variables. No statistically significant differences were detected in any sampled variable. This outcome corroborates the earlier findings from the temporal analysis.
To assess the correlation between coffee growth variables measured in the field and those derived from UAV images, the Spearman’s rank–order correlation coefficient ( ρ ^ s ) was calculated. The results are presented in Table 3. Strong correlations were evident among most variables, except for chlorophyll. All VIs exhibited correlations with growth measures exceeding 0.70. Furthermore, the canopy planar area demonstrated the strongest association with other parameters, particularly with diameter and LAI, both showing ( ρ ^ s ) values above 0.90.
The results related to regression metrics and derived errors are presented in Table 4. In the development of linear models, parameters were selected based on their strong correlations, highest coefficient of determination (R2), and relevance to estimation. Specifically, GCI × LAI was chosen.
Additionally, due to the absence of significant differences between containers and the robust correlation (close to 0.90) observed with field-measured diameter (cm) and LAI in both treatments, a unified linear model was constructed encompassing all sampled coffee trees for the variable “canopy planar area calculated by vectorization” (cm2).
The scatterplots of LAI as a function of GCI, the linear models, and the equations of the line of the seedling planting assessment in the different containers tested in this study, were shown in Figure 5.
The R2 values indicate that despite their simplicity, the linear models effectively predict the LAI of coffee plants based on GCI, which typically necessitates field measurements. Post-transplantation, seedlings grown in both perforated bags (A) and root trainers (B) exhibited high R2 values in the model concerning GCI and LAI estimates, exceeding 0.75. Consequently, the simple linear regression models explain more than 75% of the LAI values based on GCI. Notably, the area planted with seedlings from root trainers demonstrated higher R2 values and lower errors (R2 = 0.831; mean squared error (MSE) = 0.002; root mean square error (RMSE) = 0.045; mean absolute error (MAE) = 0.035) compared to seedlings from perforated bags (R2 = 0.775; MSE = 0.003; RMSE = 0.056; MAE = 0.041).
For all samples, disregarding the container type, linear models were developed based on the canopy planar area calculated by vectorization (cm2) to estimate the LAI and crown diameter (cm) of young coffee plants. Figure 6 shows the scatter plots, linear models, and their corresponding equations.
The linearity exhibited in Figure 6 suggests that UAV images served as a credible alternative to field measurements. The significance of the linear model predictions is underscored by the R2 values of both models, nearing 0.90. This indicates that the models, based on canopy planar area calculated by vectorization in software (cm2), show approximately 90% of the values for both LAI and crown diameter (cm). However, despite the high ρ ^ s and R2 values, estimating the diameter (cm) using the canopy planar area calculated by vectorization (cm2) resulted in absolute errors (MAE) of approximately 4.5 cm and an RMSE of 5.948. Notably, the presence of outliers in the scatter plot might have contributed to the elevated MAE and RMSE values. Similar results were reported by [39] who assessed a fast and low-cost technique to estimate canopy volume using UAV images (R2 > 0.8 using pixel-based classification and R2 > 0.9 using OBIA–object-based image analysis). The authors recommend that flights should be conducted at solar noon to avoid shadow interference in algorithms.

3.3. Seedling Mortality Survey

For assessing the number of deceased seedlings, coffee-plant vectors were generated in UAV images obtained immediately after transplanting (December 2018) and before replanting for dead seedlings (April 2019) in areas where seedlings from the two containers were planted in this study. The schematic representation was shown in Figure 7.
Table 5 showed the number of coffee plants planted in both months and the percentage of seed mortality for both studied treatments. The findings indicate that transplanting seedlings from root trainers resulted in a higher number of dead seedlings, indicating lower survival rates compared to seedlings from perforated bags (11.7% vs. 6.3%).
A χ2 test was performed to assess whether the frequency of dead seedlings was significantly associated with the containers, and the results were described in Table 6.
Consequently, the χ2 test rejects the null hypothesis (H0) and highlights the association between the seedling container and the number of dead seedlings observed in April 2019. Details regarding this observation, comparing the transplantation methods in this study in relation to seedling survival, are presented in Table 7.
Figure 8 shows the contrast between the success and failure of coffee seedling establishment. Despite the absence of significant differences in other studied parameters such as VIs and growth variables measured in the field, a notable divergence is observed in seedling survival. Consequently, seedlings from root trainers exhibited a higher number of dead seedlings, signifying lower survival rates compared to seedlings from perforated bags.

4. Discussion

This manuscript contributes relevant information that, alongside other studies, can be utilized as a basis for monitoring coffee plants and evaluating them post-transplantation in the field. Additionally, this study offers insights into choosing the optimal container for producing high-quality seedlings with better survival rates in the field. The results presented here are pivotal for planning and decision-making among coffee producers. The utilization of UAV and the integrated multispectral sensor proved efficient in monitoring the effects of transplanting seedlings from different containers.
Coffee growth variables showed a progressive increase throughout the cycle. This temporal variation correlates with augmented dry matter and leaf emissions, stabilizing in September. According to [52], when estimating LAI using equations, an average of 0.27 for coffee seedlings after 15 months was assessed; this is a value similar to those found in this study. Moreover, similar temporal variations in LAI, as reported by [43] in assessments of evapotranspiration and crop coefficients during coffee plant growth, were observed. Notably, a significant reduction in chlorophyll values occurred during the rainy season (January), consistent with [53], who state that under water stress, chloroplasts increase CO2 assimilation to uphold plant physiological functions, thereby heightening the content of photosynthetic pigments due to reduced leaf water content, consequently elevating chlorophyll meter sensor readings during these periods.
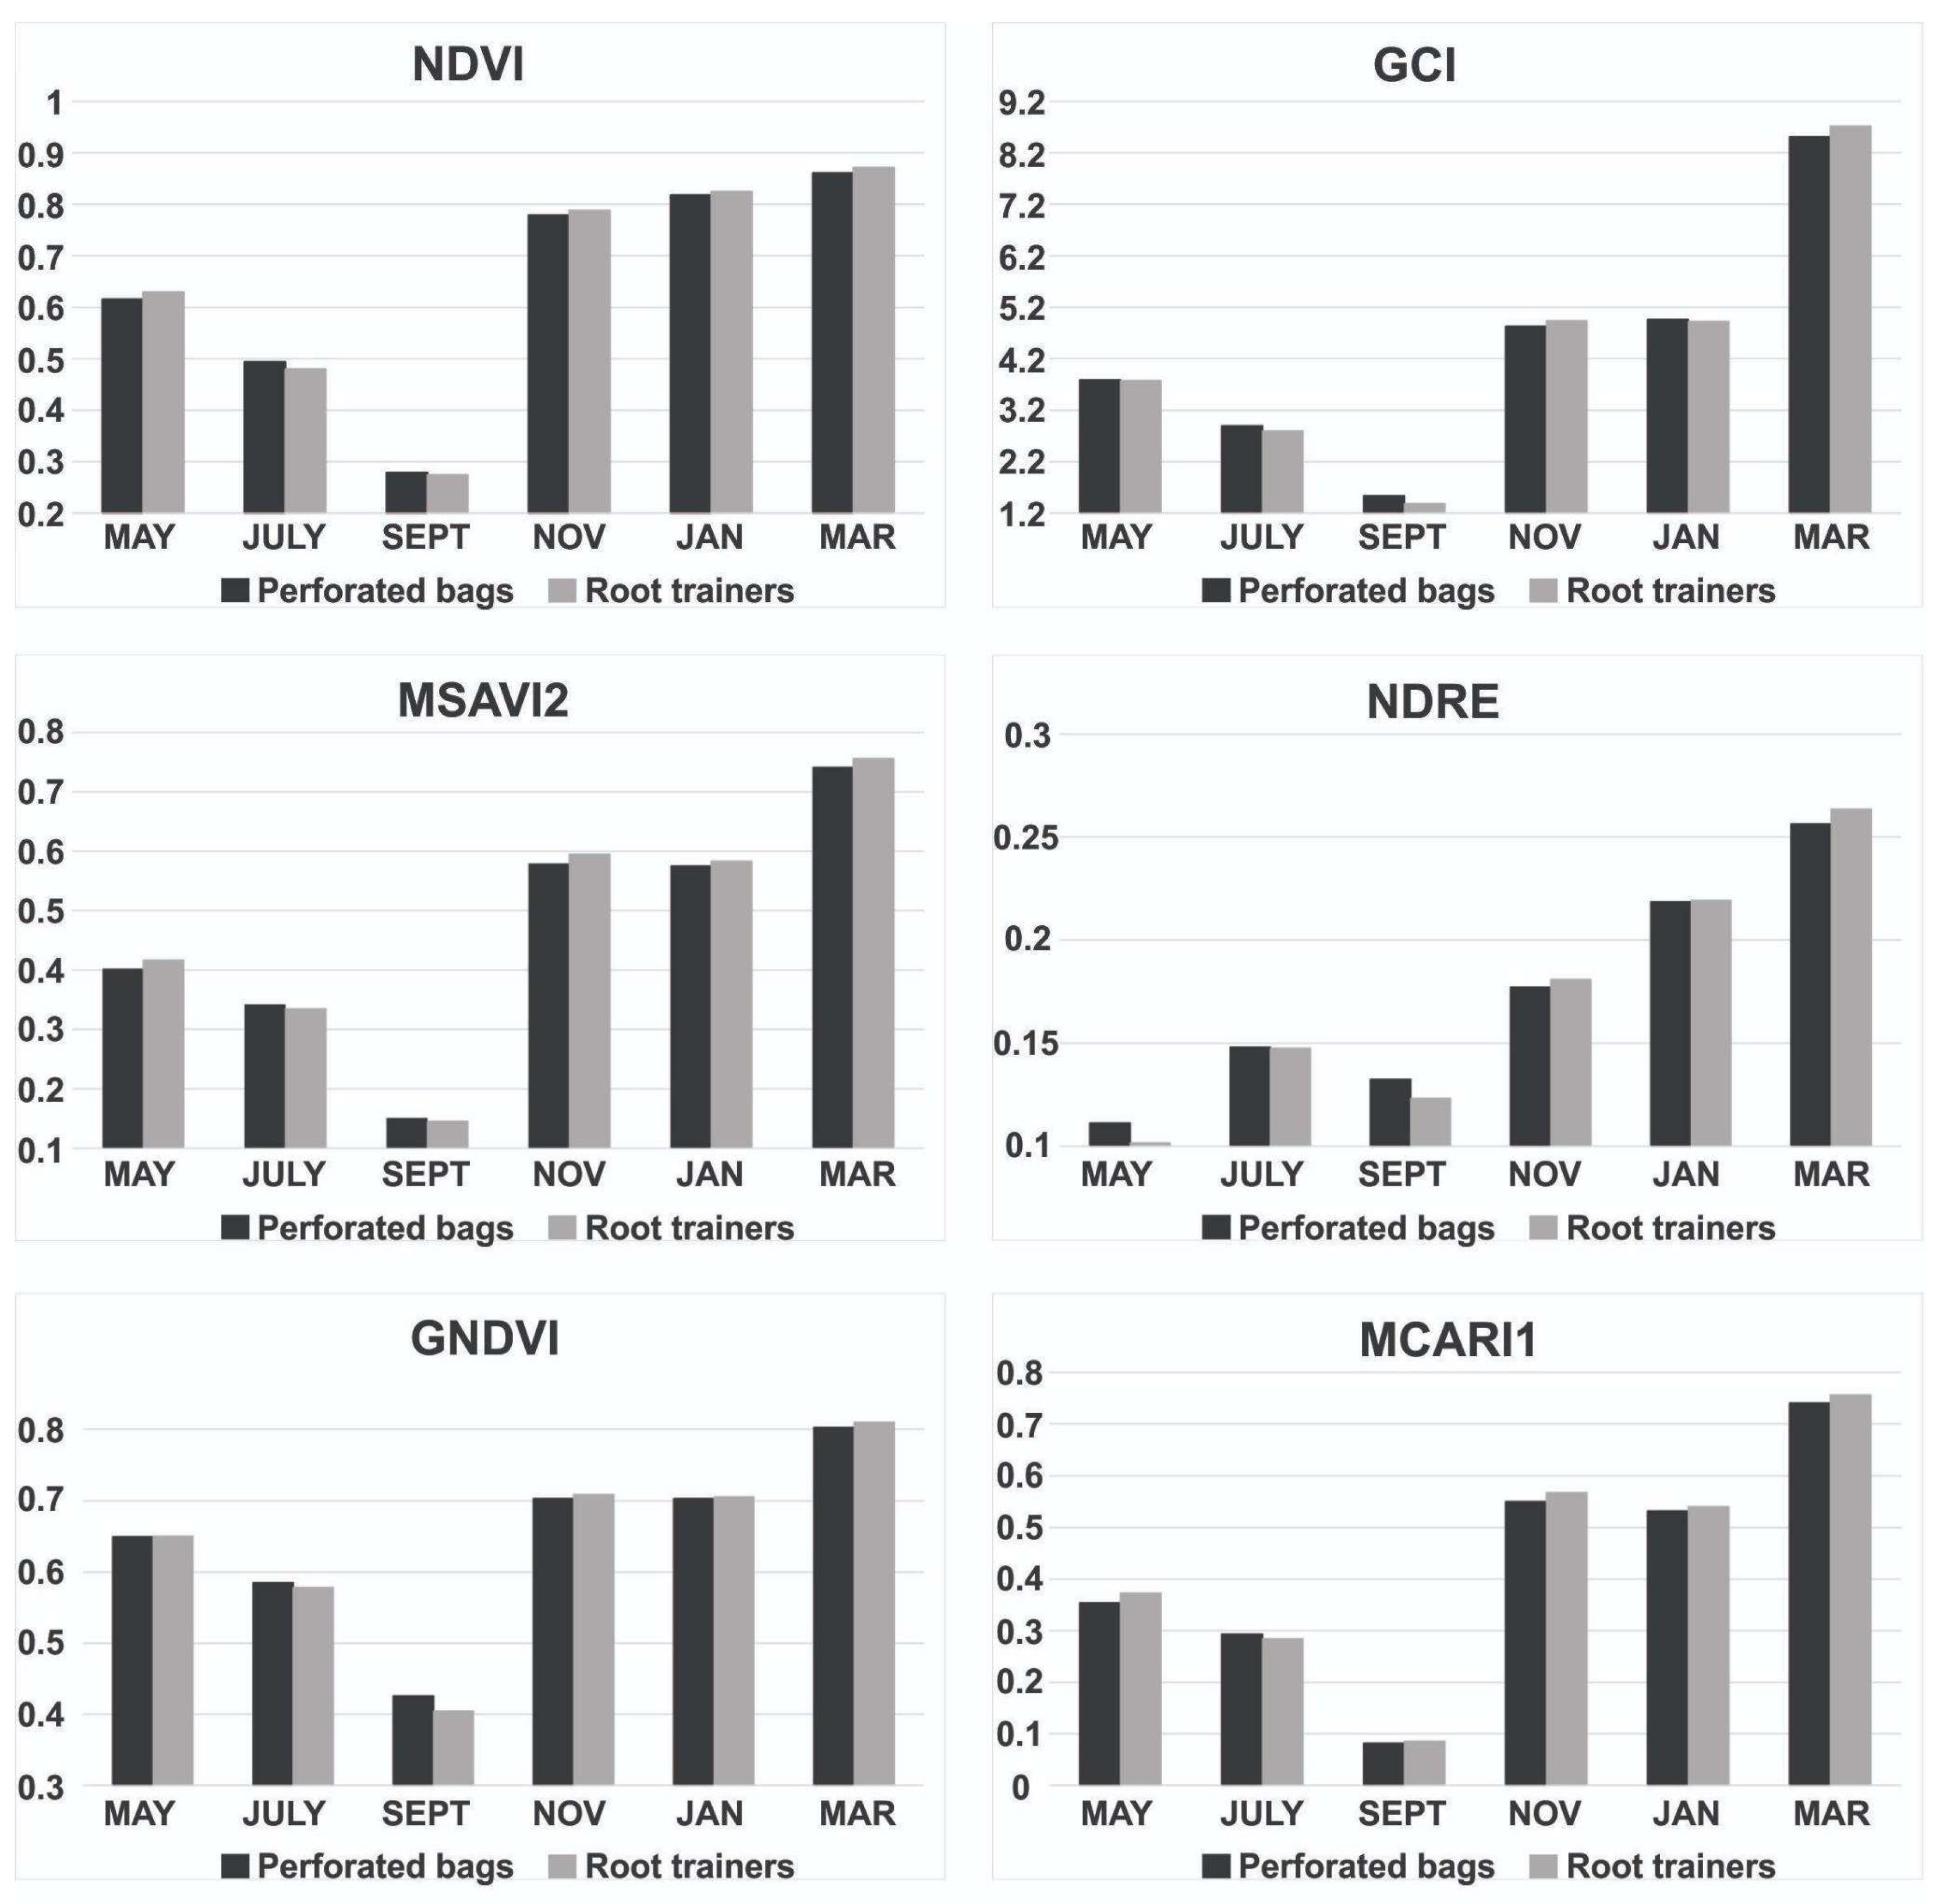
The variations in coffee growth variables corresponded to fluctuations in vegetation indices, which mirror the plant’s response. These indices decline during the dry season and rise during the rainy season. The dry season, overlapping with winter, a period of stress where photoassimilates prioritize root growth overshoots, explains the drop in VI values [54,55,56].
The findings of this study corroborate with [57], which assessed temporal changes in the wood biomass of Arabica coffee plants using Landsat-5 images, revealing the lowest values of NDVI, soil-adjusted vegetation index (SAVI), and field-measured LAI in August and September. Similar water deficit effects were noted in [58], where a decrease in NDVI values was observed using a moderate-resolution imaging spectroradiometer (MODIS) sensor for coffee plants grown under full sunlight. Additionally, Ref. [59] reported the lowest crop coefficient values in June, July, and August, coinciding with the dormancy phase of coffee plants characterized by reduced vegetative activity.
Some indices, such as MCARI1 and MSAVI2, exhibited higher values in November compared to January. These indices might be more responsive to flowering in this experimental area, corroborating with [60], which also observed increased biomass and consequent index elevation from mid-October onward.
The temporal dynamics of VIs calculated in this study agree with the findings from [60], where NDVI measured using a MODIS sensor evaluated coffee plants’ temporal changes during seedling production, growth, and pruning, proposing an agrometeorological–spectral monitoring model. Similar trends in coffee plant variations using VIs have been reported in other studies [57,58,61]. Hence, even during seedling growth and initial months after transplantation, coffee plants exhibit response patterns associated with their phenological phases, as described by [62]. Young coffee plants demonstrate distinct responses compared to mature trees, particularly in the first 3 years, where most photoassimilates drive plant growth, resulting in lower biomass and, subsequently, lower VI values [60,63], as observed in the results of this study.
Most vegetation indices exhibited a similar temporal variation, decreasing from May with the lowest values reached in September. Similar VI responses were documented by [58,60,61], aligning with the coffee phenology proposed by [62]. Notably, NDRE demonstrated distinct behavior compared to other indices, showing a more linear variation over time with no decrease in September or only a slight drop in January. This pattern reflects the dynamics of growth variables. NDRE, commonly associated with ripeness and vegetation pigments, including chlorophyll (strongly linked to vegetative vigor), is widely used in crop monitoring. The consistent increase in this index from September onwards suggests a correlation with the phenological behavior of coffee plants, which experience heightened growth and ripening after that month.
Based on the results presented, no significant differences were found for most studied coffee growth variables across the evaluated treatments. These findings agree with the values observed in the temporal analysis. Many studies on coffee plants grown in different containers focus on seedlings in the nursery stage and do not assess performance after transplanting. In addition to measuring differences between container materials, most studies, like [3,5], evaluate the effects of volume and substrate. They generally identify better results in polyethylene bags or root trainers with larger volumes and commercial substrates compared to mineral soil.
In a study examining coffee plants after transplanting in the field [6], seedlings grown in polyethylene bags and in 50 and 120 mL root trainers using different substrates were evaluated. Considering the studies cited in the previous paragraph, which found no significant differences between coffee seedlings grown in polyethylene bags and those in 120 mL root trainers, it can be concluded that 180 mL root trainers (as used in this research) could be a viable alternative to perforated bags. However, container volume should be carefully considered, as opting for root trainers with lower volumes may result in less substrate and compromise root development.
In the correlation analysis, strong correlations were observed between all variables except for chlorophyll. The weak correlations observed between chlorophyll levels and most calculated VIs in this research could be attributed to random leaf sampling. Even within a single coffee tree, leaves that are more exposed might suffer from burning and chlorosis during cooler periods or endure harsher conditions in hot summers. However, leaves positioned inside the canopy area may be more protected from such factors or receive reduced solar radiation, potentially affecting the behavior of their photosynthetic pigments.
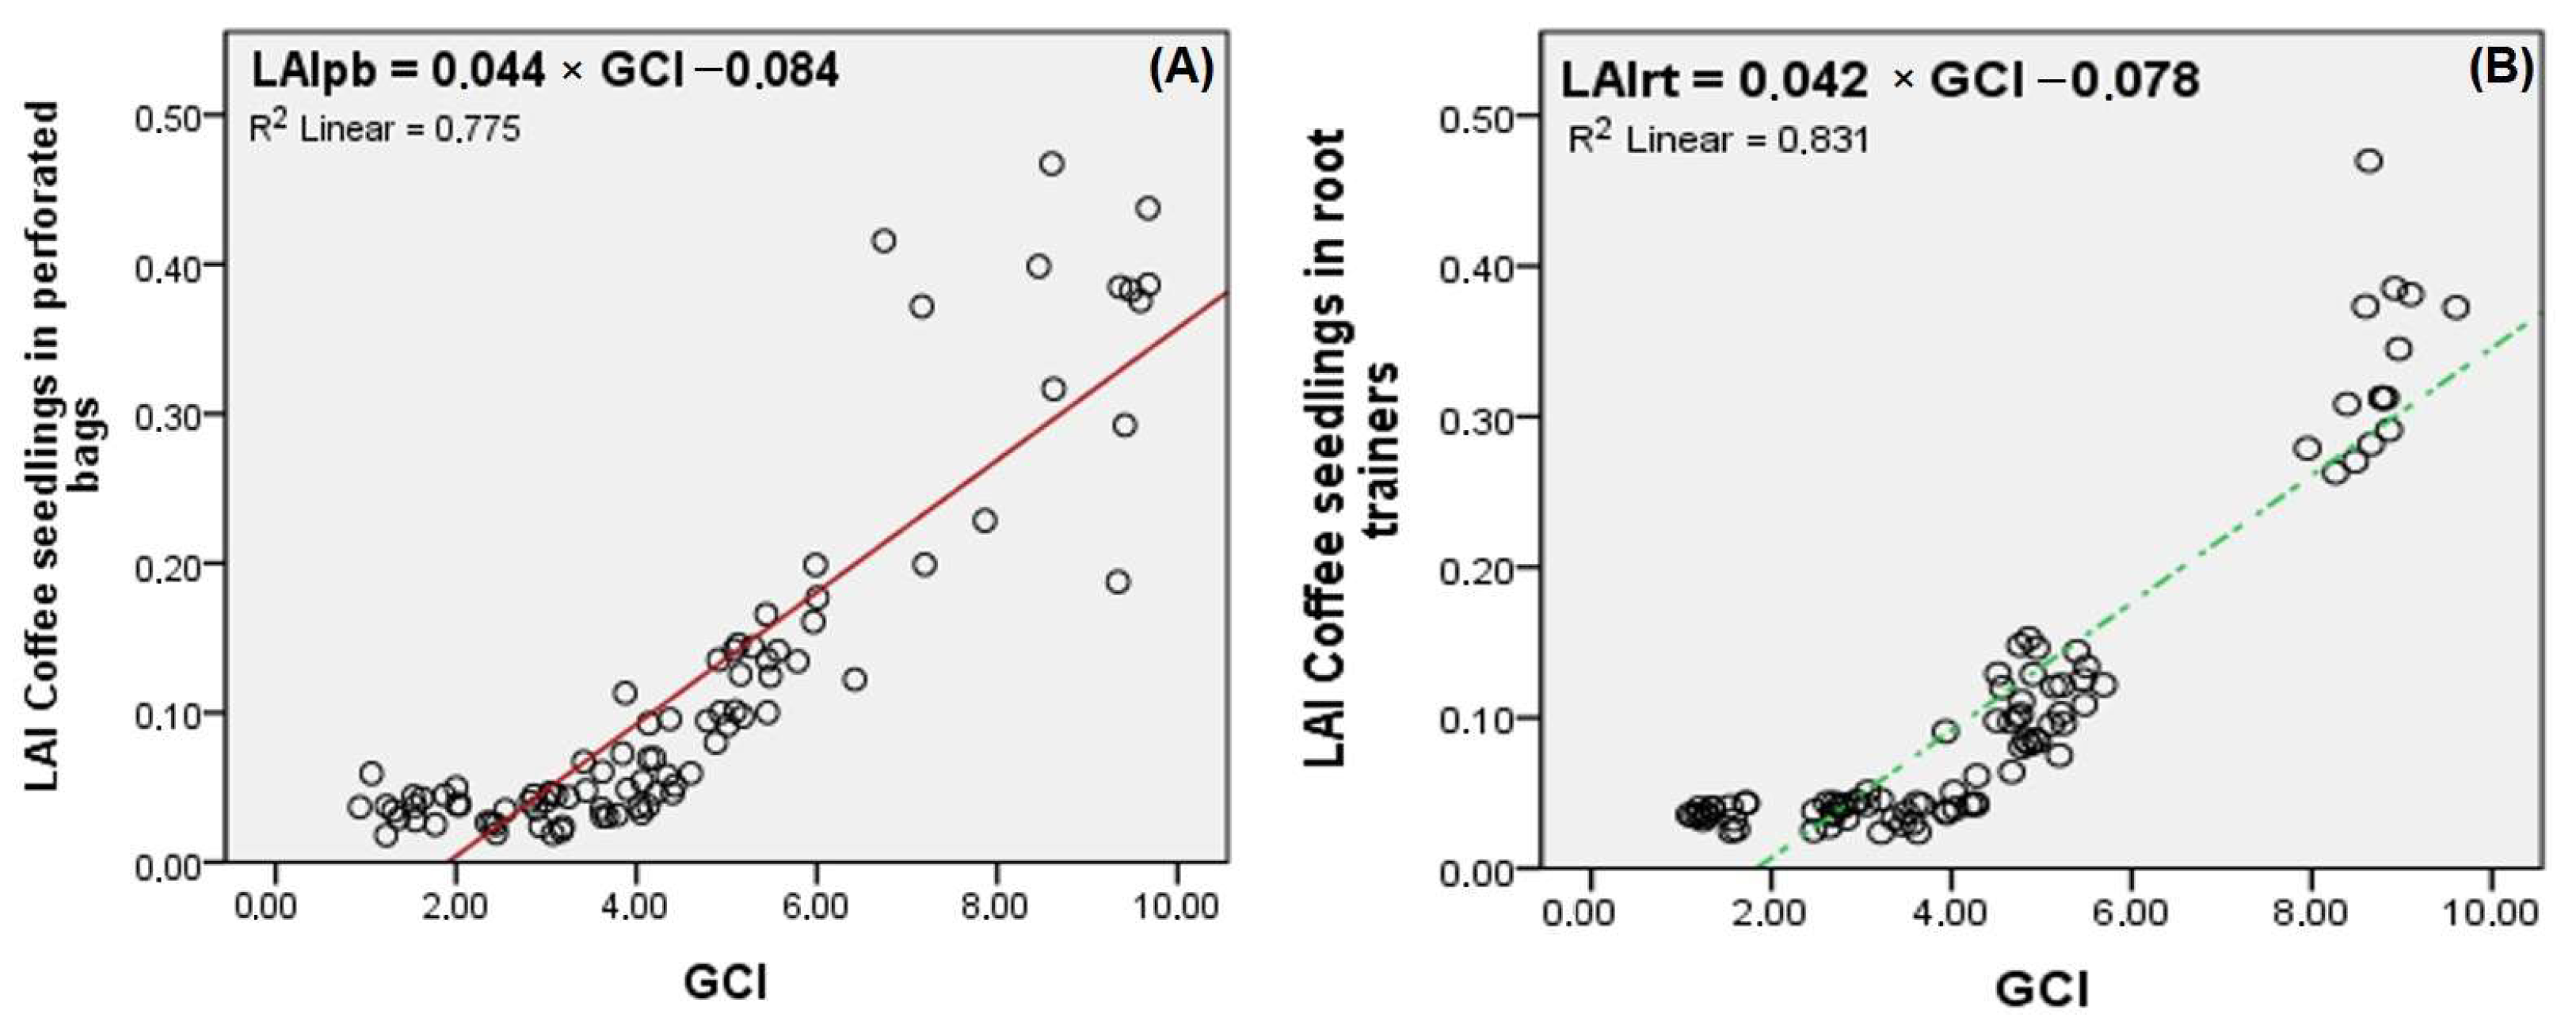
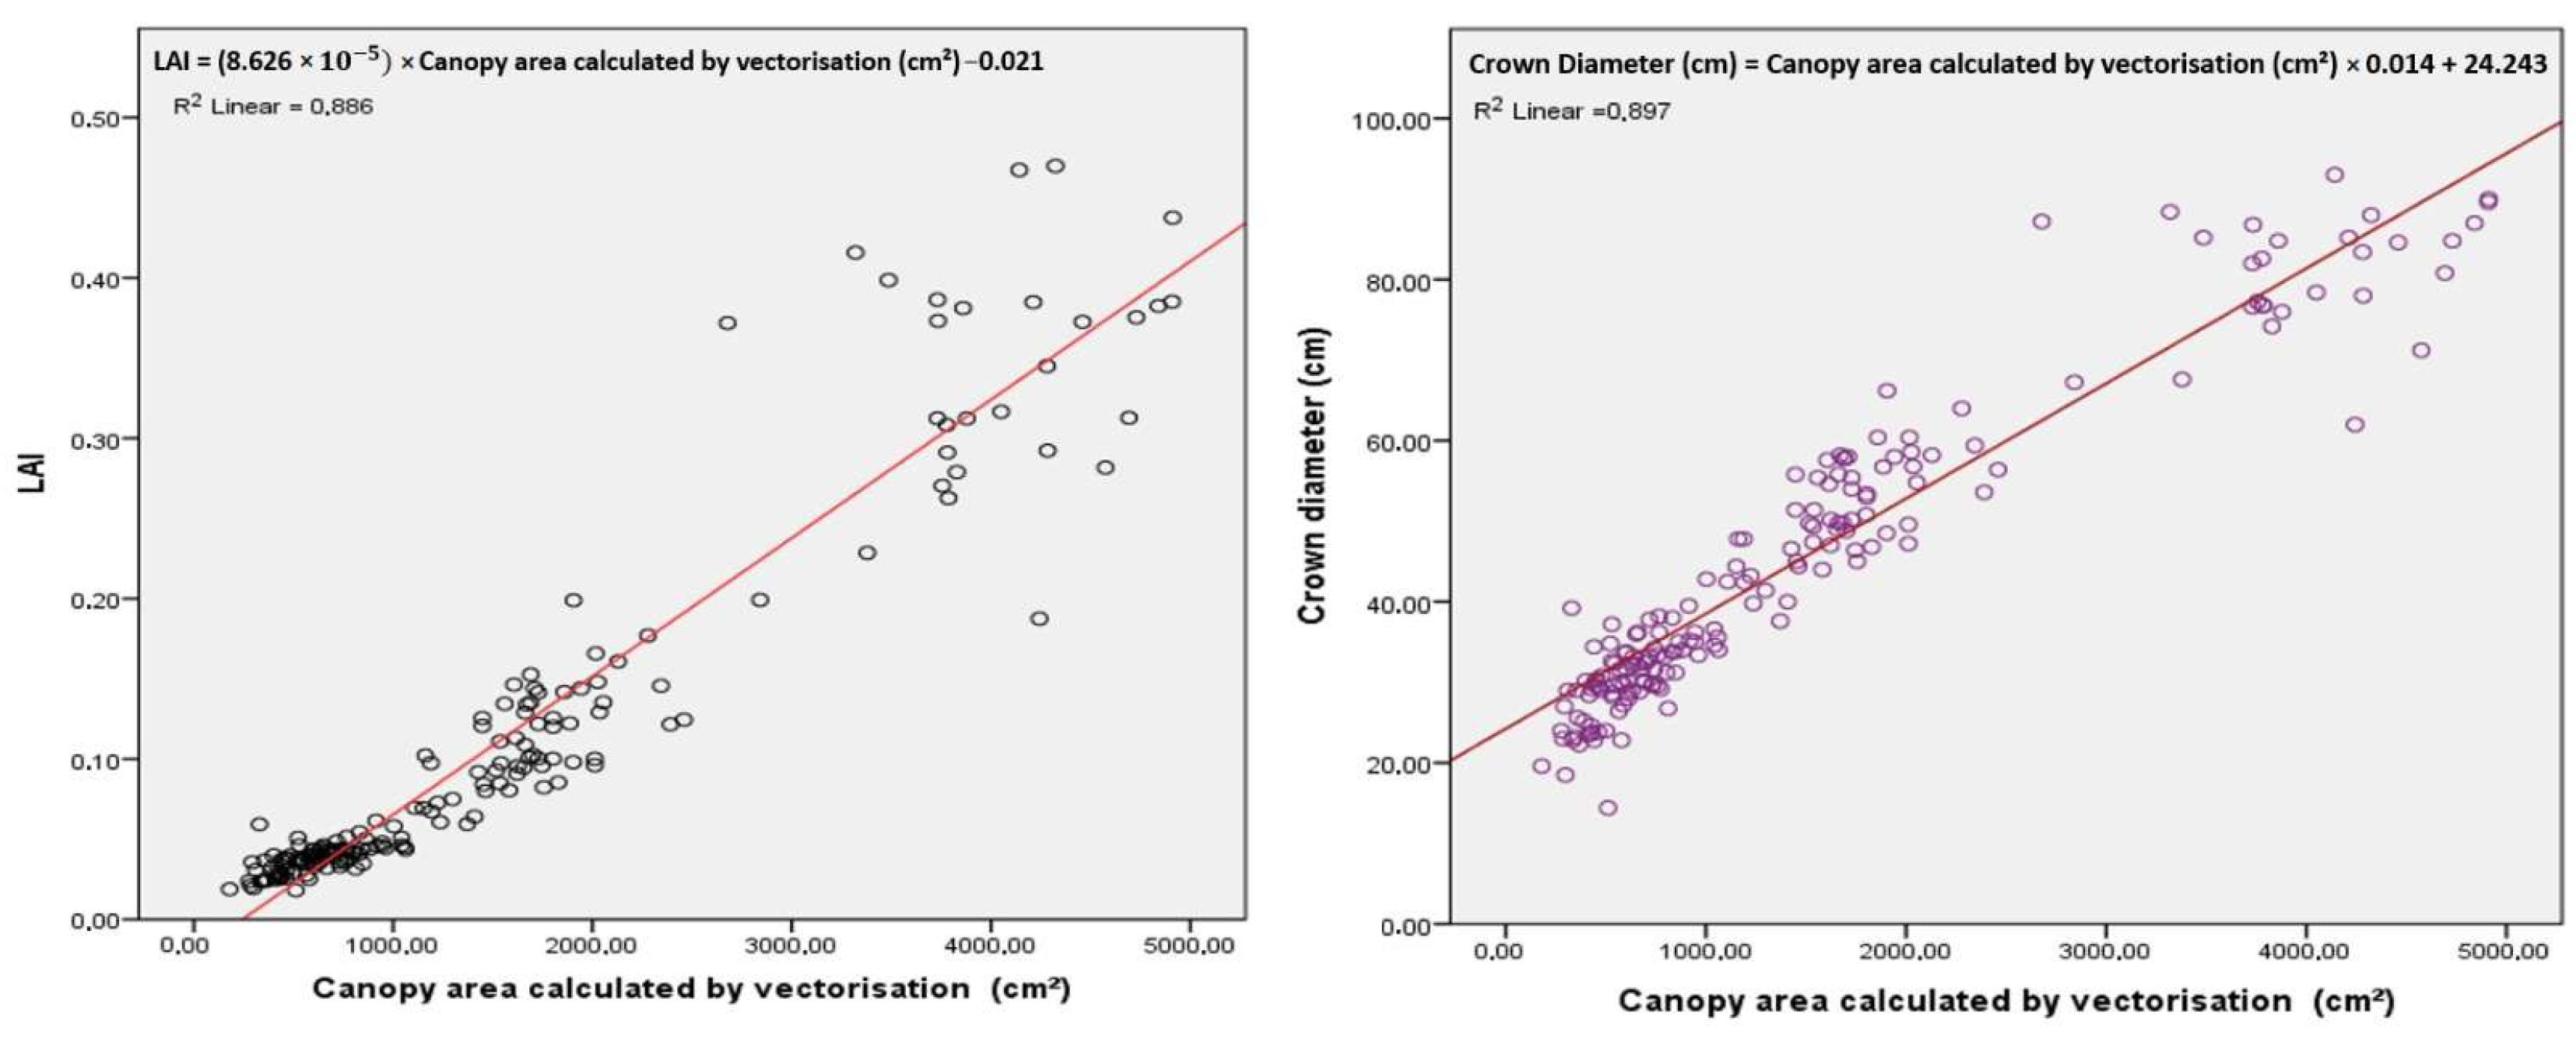
All vegetation indices demonstrated a correlation with growth measures exceeding 0.70, indicating that VIs can be a viable option for estimating certain coffee growth variables using this approach. Moreover, the variables that exhibited higher values both when growing seedlings in perforated bags and when growing seedlings in root trainers in the canopy planar area were calculated by vectorization (cm2), NDVI, and NDRE. However, the latter resulted in the lowest correlation value, with crown diameter among the studied VIs.
Considering the observed relationship between growth variables and vegetation indices, the generated models yielded favorable results for the studied treatments. Consequently, it is possible to use and recommend such linear models for estimating the coffee leaf area. In the literature, some studies have developed linear models to estimate crop-growth parameters such as height, diameter, and LAI, combining these measures, with results similar to the findings of this study. For instance, Ref. [63] reported R2 values close to 0.8 and 0.9 for maize and potatoes, respectively, when using their models to estimate LAI based on SAVI, MSA-VI, the transformed soil-adjusted vegetation index (TSAVI), and the perpendicular vegetation index (PVI) derived from QuickBird satellite images. However, in sorghum, R2 values of 0.85 and 0.81 were observed when estimating LAI using NDVI and EVI, respectively, from multispectral images acquired by UAV [64].
Studies on perennial crops have reported good R2 values and correlations between growth variables measured and those measured by UAV, particularly involving forest species [65,66]. In coffee cultivation, a similar UAV approach was undertaken by [19], with high R2 values for height and diameter (0.87 and 0.95, respectively), which were variables used to calculate LAI. However, there is still a scarcity of studies employing VIs to estimate this variable in coffee plants. This may be attributed to the saturation of indices such as NDVI when LAI reaches higher values [67]. According to [68], no significant results were obtained when using NDVI, SAVI, green vegetation index (GVI), and ratio vegetation index (RVI) to estimate LAI, although they reported a good correlation of the parameter with the blue and green spectral bands. Additionally, Ref. [69] achieved an R² of 0.78 for LAI based on the NDVI measured using a MODIS sensor after several calibrations and adjustments. However, various VIs were calculated in this study, and the coffee plants were young, implying that their LAI values were low. Consequently, the R2 values of the proposed models are considered good in regression models.
An important point to highlight is related to the possible existence of autocorrelation in the data due to temporal analysis. In this study, this fact was not a limiting factor since the objective was to characterize the variations over time and observe the existing correlations between the variables studied. Other studies also conducted monitoring and evaluation of plant response over time and did not observe problems with autocorrelation in the analysis [19,70]. In future studies, especially those with long time series that require temporal analysis, the use of autocorrelation analysis may be necessary and recommended.
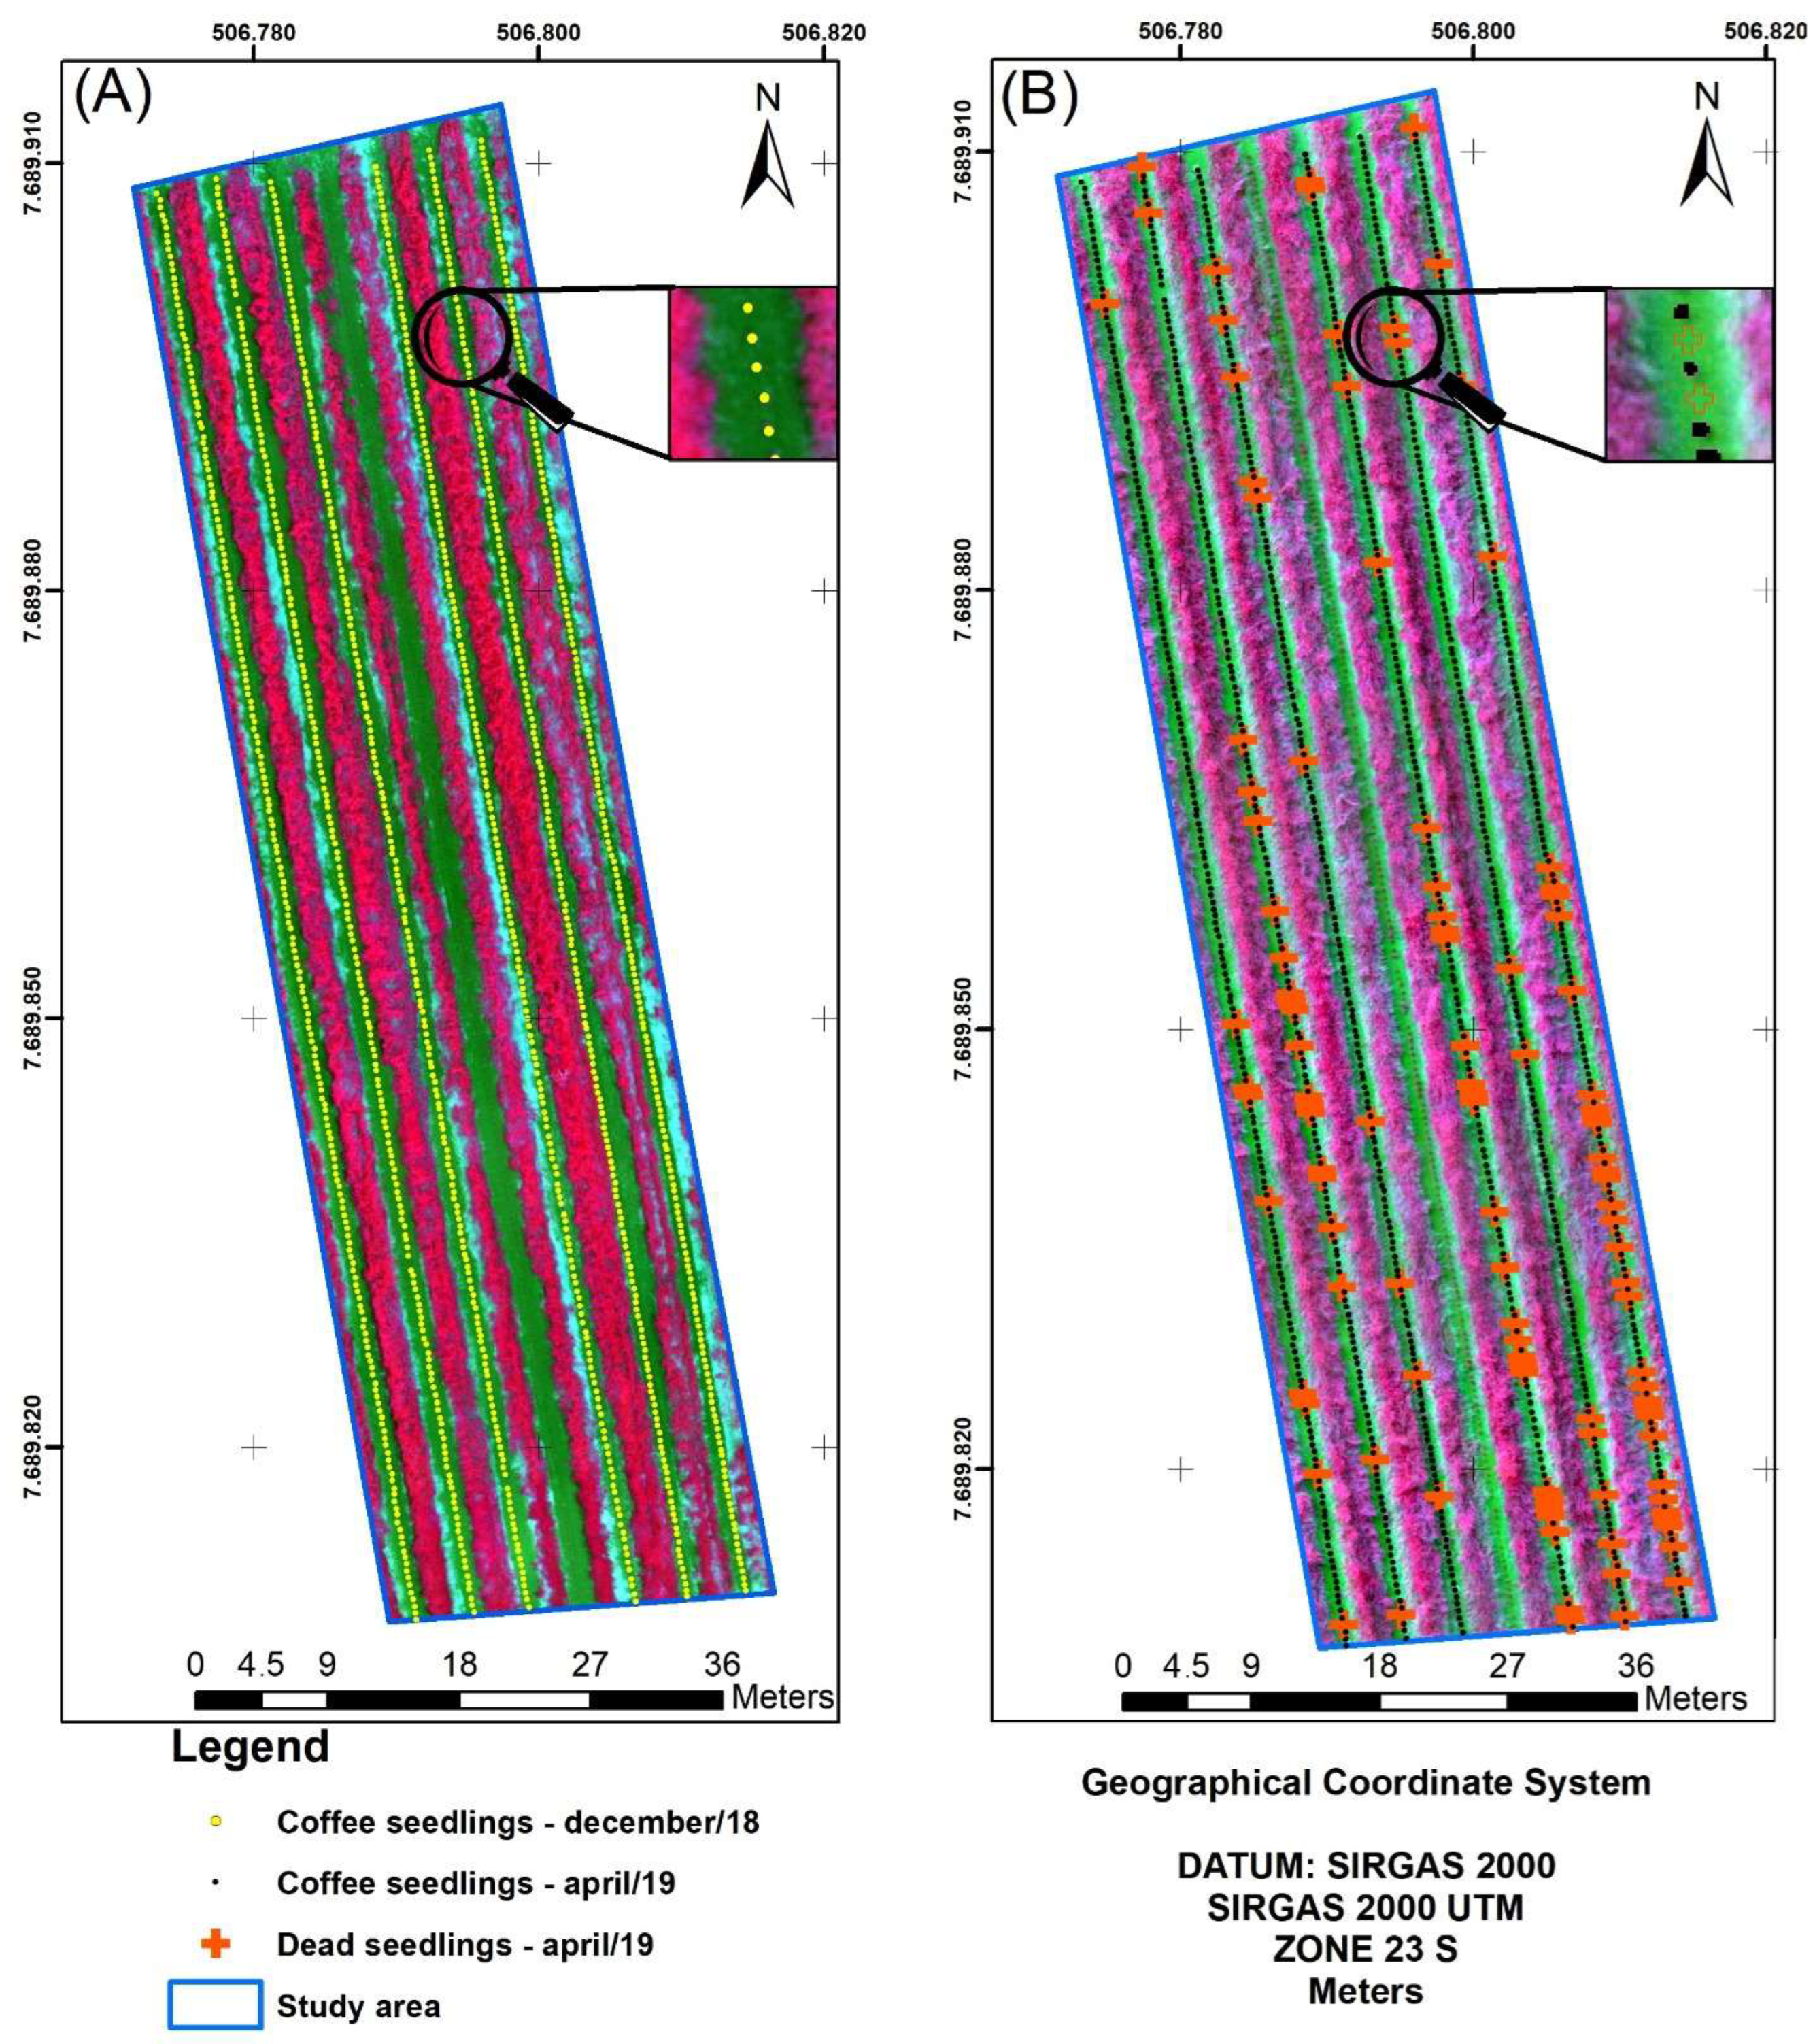
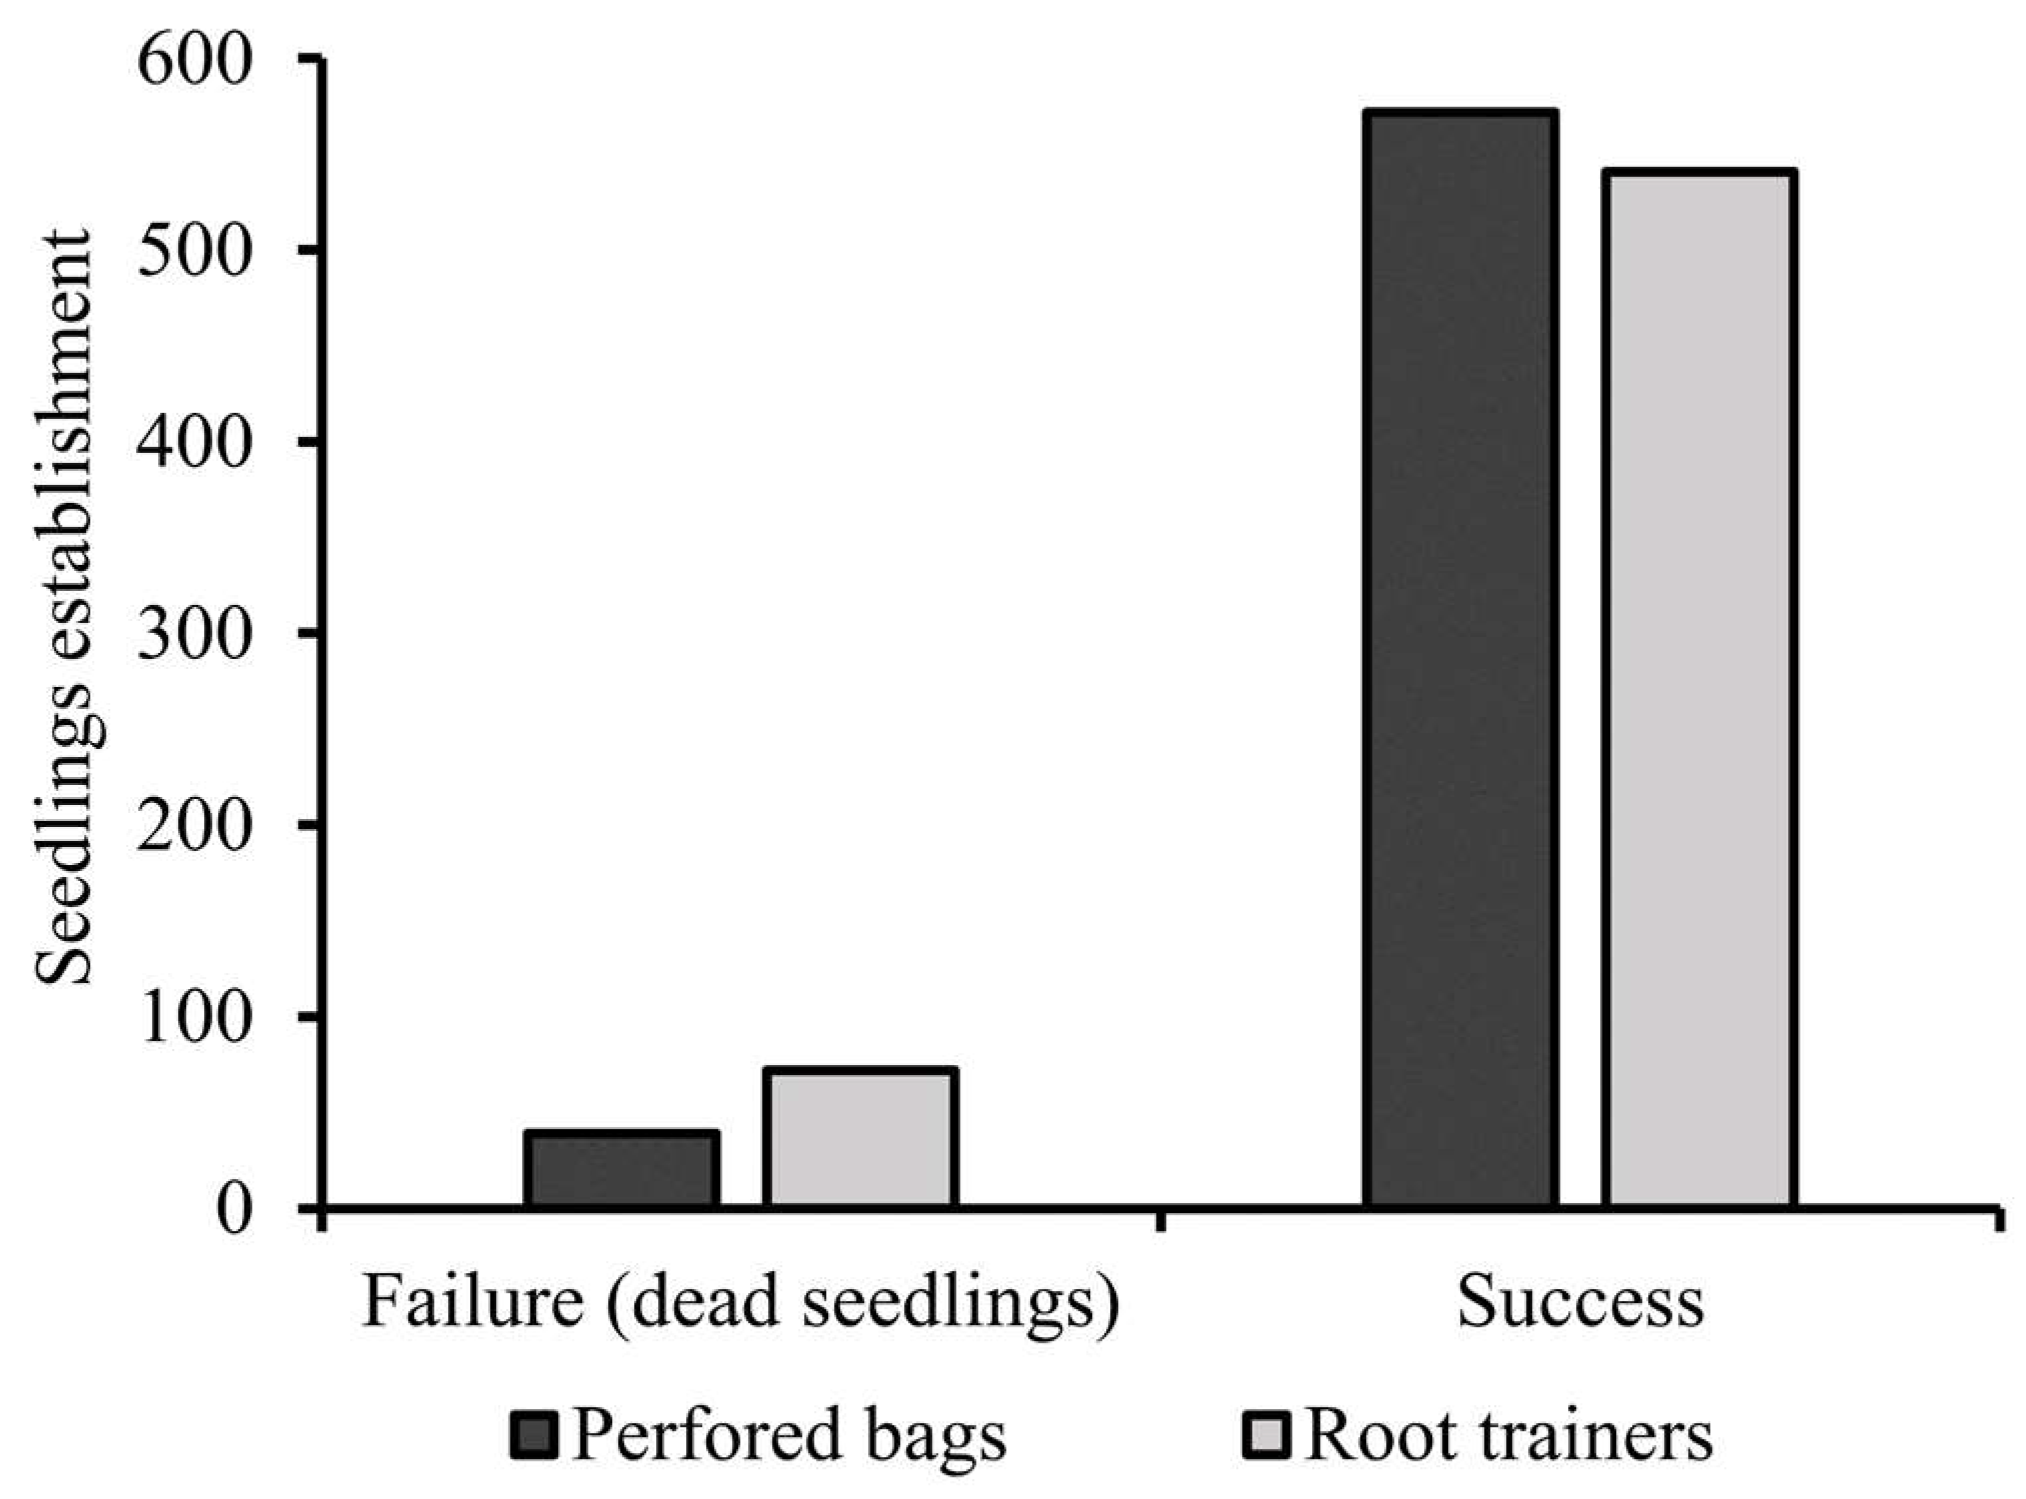
Studying the response and survival of coffee seedlings in the field becomes crucial, primarily due to the high investment and need for a robust establishment of the crop. In this context, coffee seedlings transplanted from perforated polyethylene bags exhibited a higher survival rate than seedlings produced in root trainers, as indicated by the lower number of dead seedlings in the field. This difference may primarily be attributed to the volume of substrate, which is considerably lower in the root trainers than in the perforated polyethylene bags tested in this study, affecting not only the nutrition of the plants but also their ability to retain water during higher temperatures.
The literature lacks studies utilizing vegetation indices and Unmanned Aerial Vehicles for this approach, with agronomic studies typically relying on in situ field measurements. For instance, Ref. [71] evaluated the survival of Topázio cultivar coffee seedlings produced in plastic bags and 120 mL and 50 mL root trainers after transplanting, comparing conventional to no-till planting, where dry Brachiaria was managed on the soil, previously planted between rows. The study observed that seedlings grown in plastic bags exhibited a higher survival rate than those grown in root trainers 138 days after planting (DAP). However, the difference for the root trainer with a higher volume (120 mL) was significantly smaller in conventional planting in dystrophic red–yellow argisol. In no-till planting, a clear difference in seedling survival was observed from 30 days after planting, with percentages reaching 100%, 91.62%, and 40.62% for plastic bags and 120 mL and 50 mL root trainers, respectively, after 138 days.
Another study by [71] focused on seedling survival in different planting seasons for the Acaiá Cerrado cultivar, grown in plastic bags and 120 mL root trainers in different soil types. On all dates, seedlings produced in perforated bags demonstrated a higher survival rate. However, in seasons with unfavorable climatic conditions, the percentage of seedling survival after transplanting from root trainers reached its lowest value (12.50%), in contrast to 90% for seedlings grown in plastic bags in dystrophic red latosol. In dystrophic red–yellow argisol, the difference in seedling survival was lower (97.50% for plastic bags versus 67.50% for root trainers), also highlighting the impact of soil factors. Therefore, substrate volume emerged as a critical factor for seedling survival in periods of stress for coffee plants.
While the increase in seedling survival in perforated bags corroborates with the findings of the present study, the difference in the percentage of seedling mortality is lower in this study (6.4% for perforated bags versus 11.7% for root trainers). Hence, the volume of the root trainers used in this study (180 mL) demonstrated a positive effect on performance. However, replanting represents an increase in labor costs, with an approximate cost of USD 200,000 per hectare for the farm where this research was conducted. Consequently, both containers were interesting alternatives to conventional polyethylene bags, with root trainers proving advantageous for the nursery phase and perforated bags for seedling survival.
This study aimed to evaluate the coffee plant’s response after transplanting seedlings grown in different containers, based on multispectral images acquired by UAVs. The results confirmed that this methodology can be used to assess the impacts of transplanting seedlings produced in different containers. As a recommendation for future research, it is important to highlight the relevance of incorporating analyses on how extreme weather events and climate change can affect these processes. Climatic variability and an increase in the frequency of extreme events, such as prolonged droughts and heavy rainfall, can significantly impact plant development and transplant efficacy, necessitating adaptive strategies for coffee management. Therefore, it is recommended to conduct in-depth research on the coffee root system’s resilience to these adverse conditions. Regarding UAVs, research with other multispectral cameras and hyperspectral cameras could be conducted to assess other coffee responses, primarily related to chlorophyll or flowering, and how these processes are influenced by climate change. Additionally, the use of artificial intelligence (such as machine learning and deep learning, among other AI tools) would represent new research alternatives for UAV image segmentation and the identification of features allowing volume estimation, fruit ripening, harvest prediction, identification of damage caused by extreme weather events, and development of adaptive management strategies.

5. Conclusions

The findings presented in this study are indispensable for the planning and decision-making processes of coffee producers. The utilization of UAVs and coupled multispectral sensors proved effective in monitoring coffee plants, enabling the assessment of the impacts of transplanting seedlings produced in different containers.
No significant differences were observed between transplanting seedlings produced in root trainers and perforated bags concerning coffee growth variables and responses of vegetation indices.
Linear models were successfully developed to predict LAI as a function of the GCI for seedlings produced in both containers tested in this study, achieving R2 values above 0.75. Additionally, when aggregating all data on coffee plants, linear models for LAI and crown diameter (cm2) estimation, as a function of canopy planar area calculated by vectorization (cm2) in software, yielded R² values close to 0.90.
Seedlings grown in perforated bags exhibited lower seedling mortality than those grown in root trainers (6.4% vs. 11.7%, respectively). The mortality of coffee plants was found to be related to the type of container used for seedling production.

Author Contributions

Data curation, R.A.P.B., D.B.M. and L.S.S.; visualization, D.B.M., D.G.M. and N.L.B.; writing—original draft preparation, R.A.P.B.; writing—review and editing, L.C., G.B., G.R. and F.S.; conceptualization, R.A.P.B. and G.A.e.S.F.; methodology and formal analysis, N.L.B., L.S.S., D.B.M. and D.G.M.; project administration, R.A.P.B.; supervision, G.A.e.S.F., L.C., G.B., G.R. and F.S. All authors have read and agreed to the published version of the manuscript.

Funding

This research was funded by the Embrapa Café—Consórcio Pesquisa Café (project 10.18.20.041.00.00), the National Council for Scientific and Technological Development (CNPq) (project 305953/2020-6), and the Minas Gerais Research Support Foundation (FAPEMIG) (project PPE-00118-22).

Data Availability Statement

The data presented in this study are available on request from the corresponding author. The data are not publicly available.

Acknowledgments

The authors would like to acknowledge the Embrapa Café-Consórcio Pesquisa Café (project 10.18.20.041.00.00), the National Council for Scientific and Technological Development (CNPq) (project 305953/2020-6), and the Minas Gerais Research Support Foundation (FAPEMIG) (project PPE-00118-22) for the financial resources provided for this study, the Samambaia Farm for all assistance provided during this research, the Coordination for the Improvement of Higher Education Personnel (CAPES), the Federal University of Lavras (UFLA), the postgraduate program in Agricultural Engineering (PPGEA-UFLA) and University of Florence (UniFI) for supporting this study.

Conflicts of Interest

The authors declare no conflict of interest.

References

  1. Ferraz, G.A.S.; Silva, F.M.; Costa, P.A.N.; Silva, A.C.; Carvalho, F.D.M. Precision agriculture to study soil chemical properties and the yield of a coffee field. Coffee Sci. 2012, 7, 59–67. [Google Scholar]
  2. CONAB—Companhia Nacional de Abastecimento. Acompanhamento da Safra Brasileira de Café—3° Levantamento, 9th ed.; CONAB: Brasília, Brazil, 2022; Volume 4, pp. 1–44. Available online: https://www.conab.gov.br (accessed on 15 March 2022).
  3. Vallone, H.S.; Guimarães, R.J.; Souza, C.A.S.; Carvalho, J.D.A.; Ferreira, R.D.S.; Oliveira, S.D. Substituição do substrato comercial por casca de arroz carbonizada para produção de mudas de cafeeiro em tubetes na presença de polímero hidrorretentor. Ciênc. Agrotec. 2004, 3, 593–599. [Google Scholar] [CrossRef]
  4. Oliveira, H.C.; Guizilini, V.C.; Nunes, I.P.; Souza, J.R. Failure Detection in Row Crops From UAV Images Using Morphological Operators. IEEE Geosci. Remote Sens. Lett. 2018, 7, 991–995. [Google Scholar] [CrossRef]
  5. Marana, J.P.; Miglioranza, É.; Fonseca, É.D.P.; Kainuma, R.H. Índices de qualidade e crescimento de mudas de café produzidas em tubetes. Cien. Rural 2008, 38, 39–45. [Google Scholar] [CrossRef]
  6. Vallone, H.S.; Guimarães, R.J.; Mendes, A.N.G.; Souza, C.A.S.; Cunha, R.L.D.; Dias, F.P. Diferentes recipientes e substrato na produção de mudas de cafeeiros. Ciênc. Agrotec. 2010, 34, 55–60. [Google Scholar] [CrossRef]
  7. Dardengo, M.C.J.; Sousa, E.F.D.; Reis, E.F.D.; Gravina, G.D.A. Crescimento e qualidade de mudas de café conilon produzidas em diferentes recipientes e níveis de sombreamento. Coffee Sci. 2013, 8, 500–509. [Google Scholar]
  8. Jensen, J.R. Sensoriamento Remoto do Ambiente: Uma Perspectiva em Recursos Terrestres; Parêntese: São José dos Campos, Brazil, 2009; p. 672. [Google Scholar]
  9. Mulla, D.J. Twenty five years of remote sensing in precision agriculture: Key advances and remaining knowledge gaps. Biosyst. Eng. 2013, 114, 358–371. [Google Scholar] [CrossRef]
  10. Nebiker, S.; Annen, A.; Scherrer, M.; Oesch, D. A light-weight multispectral sensor for micro UAV—Opportunities for very high resolution airborne remote sensing. ISPRS Arch. 2008, 37, 1193–1199. [Google Scholar]
  11. Zhang, C.; Kovacs, J.M. The application of small unmanned aerial systems for precision agriculture: A review. Precis. Agric. 2012, 13, 693–712. [Google Scholar] [CrossRef]
  12. Chemura, A.; Mutanga, O.; Dube, T. Remote sensing leaf water stress in coffee (Coffea arabica) using secondary effects of water absorption and random forests. Phys. Chem. Earth 2017, 100, 317–324. [Google Scholar] [CrossRef]
  13. Katsuhama, N.; Imai, M.; Naruse, N.; Takahashi, Y. Discrimination of areas infected with coffee leaf rust using a vegetation index. Remote Sens. Lett. 2018, 9, 1186–1194. [Google Scholar] [CrossRef]
  14. Marin, D.B.; Alves, M.D.C.; Pozza, E.A.; Gandia, R.M.; Cortez, M.L.J.; Mattioli, M.C. Sensoriamento remoto multiespectral na identificação e mapeamento das variáveis bióticas e abióticas do cafeeiro. Rev. Ceres 2019, 66, 142–153. [Google Scholar] [CrossRef]
  15. Rosas, J.T.F.; Carvalho Pinto, F.D.A.; Queiroz, D.M.; Melo Villar, F.M.; Magalhaes Valente, D.S.; Nogueira Martins, R. Coffee ripeness monitoring using a UAV-mounted low-cost multispectral camera. Precis. Agric. 2022, 23, 300–318. [Google Scholar] [CrossRef]
  16. Rosas, J.T.F.; Carvalho Pinto, F.A.; Queiroz, D.M.; Melo Villar, F.M.; Martins, R.N.; Silva, S.A. Low-cost system for radiometric calibration of UAV-based multispectral imagery. J. Spat. Sci. 2020, 67, 395–409. [Google Scholar] [CrossRef]
  17. Herwitz, S.R.; Johnson, L.F.; Dunagan, S.E.; Higgins, R.G.; Sullivan, D.V.; Zheng, J.; Brass, J.A. Imaging from an unmanned aerial vehicle: Agricultural surveillance and decision support. Comput. Electron. Agric. 2004, 44, 49–61. [Google Scholar] [CrossRef]
  18. Furfaro, R. Neural network algorithm for coffee ripeness evaluation using airborne images. Appl. Eng. Agric. 2007, 23, 379–387. [Google Scholar] [CrossRef]
  19. Santos, L.M.; Ferraz, G.A.E.S.; Barbosa, B.D.D.S.; Diotto, A.V.; Maciel, D.T.; Xavier, L.A.G. Biophysical parameters of coffee crop estimated by UAV RGB images. Precis. Agric. 2020, 21, 1227–1241. [Google Scholar] [CrossRef]
  20. Santana, L.S.; Ferraz, G.A.E.S.; Cunha, J.P.B.; Santana, M.S.; Faria, R.D.O.; Marin, D.B.; Sarri, D. Monitoring Errors of Semi-Mechanized Coffee Planting by Remotely Piloted Aircraft. Agronomy 2021, 11, 1224. [Google Scholar] [CrossRef]
  21. Marin, D.B.; Ferraz, G.A.E.S.; Guimaraes, P.H.S.; Schwerz, F.; Santana, L.S.; Barbosa, B.D.S.; Rossi, G. Remotely Piloted Aircraft and Random Forest in the evaluation of the spatial variability of foliar nitrogen in coffee crop. Remote Sens. 2021, 13, 1471. [Google Scholar] [CrossRef]
  22. Marin, D.B.; Ferraz, G.A.E.S.; Schwerz, F.; Barata, R.A.P.; Oliveira, F.R.; Dias, J.E.L. Unmanned aerial vehicle to evaluate frost damage in coffee plants. Precis. Agric. 2021, 22, 1845–1860. [Google Scholar] [CrossRef]
  23. Bento, N.L.; Ferraz, G.A.E.S.; Barata, R.A.P.; Soares, D.V.; Santos, L.M.D.; Santana, L.S.; Palchetti, E. Characterization of Recently Planted Coffee Cultivars from Vegetation Indices Obtained by a Remotely Piloted Aircraft System. Sustainability 2022, 14, 1446. [Google Scholar] [CrossRef]
  24. Baruqui, A.M.A.; Naime, U.J.; Motta, P.E.F.; Carvalho Filho, A.D. Levantamento de Reconhecimento de Média Intensidade dos Solos da Zona Campos das Vertentes-MG; Embrapa Solos-Boletim de Pesquisa e Desenvolvimento; Embrapa Solos: Brasilia, Brazil, 2006; 134p. [Google Scholar]
  25. Alvares, C.A.; Stape, J.L.; Sentelhas, P.C.; Gonçalves, J.D.M.; Sparovek, G. Köppen’s climate classification map for Brazil. Meteorol. Zeitschrift. 2013, 22, 711–728. [Google Scholar] [CrossRef] [PubMed]
  26. EMBRAPA—Empresa Brasileira de Pesquisa Agropecuária. Sistema Brasileiro de Classificação de Solos; Embrapa-SPI: Rio de Janeiro, Brazil, 2006; 412p. [Google Scholar]
  27. Precisionhawk. Precision Flight Free—Turn Your Drone into an Advanced Remote Sensing Tool—Features. 2017. Available online: https://www.precisionhawk.com/precisionflight (accessed on 11 March 2022).
  28. Pix4D Mapper, version 4.4.10; PIX4D SA: 2019. Available online: https://www.pix4d.com/product/pix4dmapper-photogrammetry-software (accessed on 25 March 2022).
  29. QGIS Development Team. QGIS Geographic Information System; Open Source Geospatial Foundation Project: Las Vegas, NA, USA, 2019. [Google Scholar]
  30. Trimble. Ecognition Developer 9.0 User Guide; Trimble Germany GmbH: Munich, Germany, 2014. [Google Scholar]
  31. Haboudane, D.; Miller, J.R.; Pattey, E.; Zarco-Tejada, P.J.; Strachan, I.B. Hyperspectral vegetation indices and novel algorithms for predicting green LAI of crop canopies: Modeling and validation in the context of precision agriculture. Remote Sens. Environ. 2004, 90, 337–352. [Google Scholar] [CrossRef]
  32. Gitelson, A.A.; Gritz, Y.; Merzlyak, M.N. Relationships between leaf chlorophyll content and spectral reflectance and algorithms for non-destructive chlorophyll assessment in higher plant leaves. J. Plant Physiol. 2003, 160, 271–282. [Google Scholar] [CrossRef]
  33. Barnes, E.M.; Clarke, T.R.; Richards, S.E.; Colaizzi, P.D.; Haberland, J.; Kostrzewski, M.; Moran, M.S. Coincident detection of crop water stress, nitrogen status and canopy density using ground based multispectral data. In Proceedings of the Fifth International Conference on Precision Agriculture, Bloomington, MN, USA, 16–19 July 2000. [Google Scholar]
  34. Gitelson, A.A.; Kaufman, Y.J.; Merzlyak, M.N. Use of a green channel in remote sensing of global vegetation from EOS-MODIS. Remote Sens. Environ. 1996, 58, 289–298. [Google Scholar] [CrossRef]
  35. Rouse, J.W.; Haas, R.H.; Deering, D.W.; Schell, J.A.; Harlan, J.C. Monitoring the Vernal Advancement and Retrogradation (Green Wave Effect) of Natural Vegetation; Greenbelt: NASA/GSFC, Type III, Final Report; NASA: Houston, TX, USA, 1974; 371p. [Google Scholar]
  36. Gitelson, A.; Merzlyak, M.N. Quantitative estimation of chlorophyll-a using reflectance spectra: Experiments with autumn chestnut and maple leaves. J. Photochem. Photobiol. 1994, 22, 247–252. [Google Scholar] [CrossRef]
  37. Qi, J.; Kerr, Y.; Chehbouni, A. External factor consideration in vegetation index development. ISPRS 1994, 723, 723–730. [Google Scholar]
  38. Benz, U.C.; Hofmann, P.; Willhauck, G.; Lingenfelder, I.; Heynen, M. Multi-resolution, object-oriented fuzzy analysis of remote sensing data for GIS-ready information. ISPRS J. Photogramm. Remote Sens. 2004, 58, 239–258. [Google Scholar] [CrossRef]
  39. Vélez, S.; Vacas, R.; Martín, H.; Ruano-Rosa, D.; Álvarez, S. A novel technique using planar area and ground shadows calculated from UAV RGB imagery to estimate pistachio tree (Pistacia vera L.) canopy volume. Remote Sens. 2022, 23, 6006. [Google Scholar] [CrossRef]
  40. Sozzi, M.; Kayad, A.; Marinello, F.; Taylor, J.; Tisseyre, B. Comparing vineyard imagery acquired from Sentinel-2 and Unmanned Aerial Vehicle (UAV) platform. Oeno One 2020, 202054, 189–197. [Google Scholar] [CrossRef]
  41. Padilla, F.M.; Souza, R.; Peña-Fleitas, M.T.; Gallardo, M.; Giménez, C.; Thompson, R.B. Different responses of various chlorophyll meters to increasing nitrogen supply in sweet pepper. Front. Plant Sci. 2018, 9, 1752. [Google Scholar] [CrossRef] [PubMed]
  42. Favarin, J.L.; Dourado Neto, D.; García, A.G.; Nova, N.A.V.; Favarin, D.G. Equations for estimating the coffee leaf area indexEquacoes para a estimativa do indice de area foliar do cafeeiro. Pesqui. Agropecu. Bras. 2002, 37, 769–773. [Google Scholar] [CrossRef]
  43. Shapiro, S.S.; Wilk, M.B. An analysis of variance test for normality (complete samples). Biometrika 1965, 52, 591–611. [Google Scholar] [CrossRef]
  44. Mann, H.B.; Whitney, D.R. On a test of whether one of two random variables is stochastically larger than the other. Ann. Math. Stat. 1947, 18, 50–60. [Google Scholar] [CrossRef]
  45. Spearman, C. The Proof and Measurement of Association between Two Things. Am. J. Psychol. 1904, 15, 72–101. [Google Scholar] [CrossRef]
  46. Pearson, K.X. On the criterion that a given system of deviations from the probable in the case of a correlated system of variables is such that it can be reasonably supposed to have arisen from random sampling. Lond. Edinb. Dublin Philos. Mag. J. Sci. 1900, 50, 157–175. [Google Scholar] [CrossRef]
  47. R Development Core Team. R: A Language and Environment for Statistical Computing; R Foundation for Statistical Computing: Vienna, Austria, 2009. [Google Scholar]
  48. Rodríguez-López, N.F.; Martins, S.C.; Cavatte, P.C.; Silva, P.E.; Morais, L.E.; Pereira, L.F.; DaMatta, F.M. Morphological and physiological acclimations of coffee seedlings to growth over a range of fixed or changing light supplies. J. Exp. Bot. 2014, 102, 1–10. [Google Scholar] [CrossRef]
  49. Marçal, D.M.; Avila, R.T.; Quiroga-Rojas, L.F.; Souza, R.P.; Junior, C.C.G.; Ponte, L.R.; DaMatta, F.M. Elevated [CO2] benefits coffee growth and photosynthetic performance regardless of light availability. Plant Physiol. Biochem. 2021, 158, 524–535. [Google Scholar] [CrossRef]
  50. DaMatta, F.M. Ecophysiological constraints on the production of shaded and unshaded coffee: A review. Field Crops Res. 2004, 86, 99–114. [Google Scholar] [CrossRef]
  51. Carr, N.F.; Boaretto, R.M.; Mattos, D., Jr. Coffee seedlings growth under varied NO3: NH4+ ratio: Consequences for nitrogen metabolism, amino acids profile, and regulation of plasma membrane H+-ATPase. Plant Physiol. Biochem. 2020, 154, 11–20. [Google Scholar] [CrossRef] [PubMed]
  52. Flumignan, D.L.; De Faria, R.T. Evapotranspiração e coeficientes de cultivo de cafeeiros em fase de formação. Bragantia 2009, 68, 269–278. [Google Scholar] [CrossRef]
  53. Peloso, A.D.F.; Tatagiba, S.D.; Reis, E.F.D.; Pezzopane, J.E.M.; Amaral, J.F.T.D. Limitações fotossintéticas em folhas de cafeeiro arábica promovidas pelo déficit hídrico. Coffee Sci. 2017, 12, 389–399. [Google Scholar] [CrossRef]
  54. Samôr, O.J.M.; Carneiro, J.D.A.; Barroso, D.G.; Leles, P.D.S. Qualidade de mudas de angico e sesbânia, produzidas em diferentes recipientes e substratos. Rev. Árvore 2002, 26, 209–215. [Google Scholar]
  55. Amaral, J.A.T. Crescimento Vegetativo Estacional do Cafeeiro e Suas Interações com Fontes de Nitrogênio, Fotoperíodo, Fotossíntese e Assimilação do Nitrogênio. Master’s Thesis, Universidade Federal de Viçosa, Viçosa, Brazil, 1991; 139p. [Google Scholar]
  56. Barros, R.S.; Maestri, M. Influência dos fatores climáticos sobre a periodicidade de crescimento vegetativo do café (Coffea arabica L.). Rev. Ceres 1974, 21, 268–279. [Google Scholar]
  57. Coltri, P.P.; Romani, L.A.S.; Dubreuil, V.; Corgne, S.; Zullo, J.J.; Pinto, H.S. Variação temporal da biomassa do café arábica arborizado e a pleno sol, através de índices de vegetação. In Proceedings of the 15th Simpósio Brasileiro de Sensoriamento Remoto, Curitiba, Brazil, 30 April 2011; INPE: São José dos Campos, Brazil, 2011. [Google Scholar]
  58. Volpato, M.; Alves, H.; Vieira, T.; Souza, W.D.O. Imagens MODIS para determinação de estiagem agrícola em área cafeeira no município de Patrocínio, MG. In Proceedings of the XIV Simpósio Brasileiro de Sensoriamento Remoto, Natal, Brazil, 14–17 April 2009; INPE: São José dos Campos, Brazil, 2009. [Google Scholar]
  59. Sato, F.A.; Silva, A.M.D.; Coelho, G.; Silva, A.C.D.; Carvalho, L.G.D. Coeficiente de cultura (kc) do cafeeiro (Coffea arabica L.) no período de outono-inverno na região de Lavras-MG. Eng. Agrícola 2007, 27, 383–391. [Google Scholar] [CrossRef]
  60. Rosa, V.G.C. Modelo Agrometeorológico-Espectral para Monitoramento e Estimativa da Produtividade do Café na Região Sul/Sudoeste do Estado de Minas Gerais; INPE: Brasilia, Brazil, 2007; 142p. [Google Scholar]
  61. Júnior, A.F.C.; Carvalho Júnior, O.A.; Souza Martins, E.; Guerra, A.F. Phenological characterization of coffee crop (Coffea arabica L.) from Modis time series. Braz. J. Geol. 2013, 31, 569–578. [Google Scholar] [CrossRef]
  62. Camargo, A.P.; Camargo, M.B.P. Definição e esquematização das fases fenológicas do cafeeiro arábica nas condições tropicais do Brasil. Bragantia 2001, 60, 65–68. [Google Scholar] [CrossRef]
  63. Wu, J.; Wang, D.; Bauer, M.E. Assessing broadband vegetation indices and QuickBird data in estimating leaf area index of corn and potato canopies. Field Crops Res. 2007, 102, 33–42. [Google Scholar] [CrossRef]
  64. Potgieter, A.B.; George-Jaeggli, B.; Chapman, S.C.; Laws, K.; Suárez Cadavid, L.A.; Wixted, J.; Hammer, G.L. Multi-spectral imaging from an unmanned aerial vehicle enables the assessment of seasonal leaf area dynamics of sorghum breeding lines. Front. Plant Sci. 2017, 8, 1532. [Google Scholar] [CrossRef]
  65. Dandois, J.P.; Olano, M.; Ellis, E.C. Optimal altitude, overlap, and weather conditions for computer vision UAV estimates of forest structure. Remote Sens. 2015, 7, 13895–13920. [Google Scholar] [CrossRef]
  66. Panagiotidis, D.; Abdollahnejad, A.; Surový, P.; Chiteculo, V. Determining tree height and crown diameter from high-resolution UAV imagery. Int. J. Remote Sens. 2017, 38, 2392–2410. [Google Scholar] [CrossRef]
  67. Delalieux, S.; Somers, B.; Hereijgers, S.; Verstraeten, W.W.; Keulemans, W.; Coppin, P. A near-infrared narrow-waveband ratio to determine Leaf Area Index in orchards. Remote Sens. Environ. 2008, 112, 3762–3772. [Google Scholar] [CrossRef]
  68. Ramirez, G.M.; Zullo Júnior, J. Estimativa de parâmetros biofísicos de plantios de café a partir de imagens orbitais de alta resolução espacial. Eng. Agrícola 2010, 30, 468–479. [Google Scholar] [CrossRef]
  69. Taugourdeau, S.; Le Maire, G.; Avelino, J.; Jones, J.R.; Ramirez, L.G.; Quesada, M.J.; Roupsard, O. Leaf area index as an indicator of ecosystem services and management practices: An application for coffee agroforestry. Agric. Ecosyst. 2014, 192, 19–37. [Google Scholar] [CrossRef]
  70. Bento, N.L.; Ferraz, G.A.E.S.; Barata, R.A.P.; Soares, D.V.; Santana, L.S.; Barbosa, B.D.S. Estimate and Temporal Monitoring of Height and Diameter of the Canopy of Recently Transplanted Coffee by a Remotely Piloted Aircraft System. AgriEngineering 2022, 4, 207–215. [Google Scholar] [CrossRef]
  71. Marchi, E.C.S.; Campos, K.P.; Corrêa, J.B.D.; Guimarães, R.J.; Souza, C.A.S. Sobrevivência de mudas de cafeeiro produzidas em sacos plásticos e tubetes no sistema convencional e plantio direto, em duas classes de solo. Rev. Ceres 2015, 50, 290. [Google Scholar]
Figure 1. Location map of the study area.
Agriculture 14 00356 g001
Figure 2. Flowchart of the Unmanned Aerial Vehicle (UAV) image processing in the software. ARP: aircraft remotely piloted.
Agriculture 14 00356 g002
Figure 3. Diagram illustrating the coffee plant sampling method for both treatment and control areas.
Agriculture 14 00356 g003
Figure 4. Vegetation indices of coffee seedlings produced in two types of containers perforated bags and root trainers after transplanting.
Agriculture 14 00356 g004
Figure 5. Scatterplot, simple linear regression model, and its equation for LAI estimation as a function of GCI for coffee crops planted with seedlings produced in perforated bags (A) and seedlings produced in root trainers (B).
Agriculture 14 00356 g005
Figure 6. Scatterplot, simple linear regression model, and its equations to estimate LAI and crown diameter as a function of canopy planar area calculated by vectorization of coffee plants in formation from both experiments.
Agriculture 14 00356 g006
Figure 7. Dead seedling assessment, considering coffee crops planted with seedlings produced in perforated bags and seedlings produced in root trainers, using UAV images of December 2018 (A) and April 2019 (B). The transplanting of seedlings produced in perforated bags was conducted at the 3 rows to the left, while the transplanting of seedlings produced in root trainers was conducted at the 3 rows to the right. The central row was left to prevent border row effects.
Agriculture 14 00356 g007
Figure 8. Graphical analysis of the difference between failure and success of coffee seedling establishment, after transplanting, considering the containers: perforated bags and root trainers.
Agriculture 14 00356 g008
Table 1. Vegetation indices of multispectral images obtained using UAV.
Vegetation IndicesEquationReference
GNDVI (Green Normalized Difference Vegetation Index) ρ n i r ρ g r e e n ρ n i r +   ρ g r e e n [34]
NDVI (Normalized Difference Vegetation Index) ρ n i r ρ r e d ρ n i r + ρ r e d [35]
NDRE (Normalized Difference Red Edge) ρ n i r ρ e d g e ρ n i r +   ρ e d g e [36]
GCI (Green Chlorophyll Index) ρ n i r ρ g r e e n 1 [32]
MSAVI 2 (Modified Soil-Adjusted Vegetation Index 2) 0.5   x   [ 2 ρ n i r + 1 2 ρ n i r + 1   x   2 8   x   ( ρ n i r ρ n i r ) ] [37]
MCARI 1 (Modified Chlorophyll Absorption in Reflectance Index 1) 1.5 × 2.5 ( 2 ρ n i r ρ r e d ) 1.3 ( 2 ρ n i r ρ r e d ) [31]
ρ g r e e n reflectance in the green band; ρ r e d : reflectance in the red band; ρ n i r : reflectance in the near-infrared band; ρ e d g e : reflectance in the red-edge band.
Table 2. Growth variables of coffee seedlings produced in two types of containers perforated bags and root trainers after transplanting.
Sampled Months
Coffee Growth VariablesMayJulySeptemberNovemberJanuaryMarch
Perforated-bag Treatment
Height (cm)27.17 *32.5533.7943.2347.6762.66
Canopy planar area (cm2)521.22798.19592.991493.361778.783782.29
LAI0.03620.04040.03760.09060.12920.3311
Chlorophyll A (μg/cm2)33.317547.847835.426337.414533.478542.8305
Chlorophyll B (μg/cm2)22.825332.518224.235425.556122.931329.1725
Total chlorophyll (μg/cm2)56.762581.955260.426563.812557.028873.2248
Root-trainer Treatment
Height (cm)29.7333.6634.4745.1748.8862.25
Canopy planar area (cm2)520.14720.87542.921559.191763.374091.52
LAI0.03700.03950.03590.08980.12440.3305
Chlorophyll A (μg/cm2)35.085146.093435.447036.890735.092141.1585
Chlorophyll B (μg/cm2)24.002131.347624.246025.206724.005028.0558
Total Chlorophyll (μg/cm2)59.795078.896460.441262.902559.789870.3023
* Average value of the treatment.
Table 3. Statistical correlations between the coffee growth variables and the variables obtained using UAV images of coffee seedlings produced in perforated bags and root trainers.
Field Variables
VIs (UAV)Height (cm)Crown Diameter (cm)Chlorophyll Content (IRC)LAIChlorophyll A (μg/cm2)Chlorophyll B (μg/cm2)Chlorophyll A + B (μg/cm2)
Perforated-bag Treatment
GCI0.76600.89300.16840.87100.15350.15350.1530
MSAVI0.79100.90400.16270.88700.14940.14940.1488
MCARI10.78600.89500.16590.87800.15340.15340.1529
GNDVI0.76000.88900.16890.86600.15430.15430.1537
NDRE0.88500.86000.26500.87800.25700.25700.2570
NDVI0.79100.89700.10700.88200.09310.09310.0925
Crown area (cm2)0.90200.93900.27600.94800.27000.27000.2700
Root-trainer Treatment
GCI0.80800.91000.12100.87900.11930.11780.1168
MSAVI0.81100.91500.09370.88200.09070.08900.0878
MCARI10.80300.90700.08780.87300.08470.08310.0818
GNDVI0.80700.90700.12670.87700.12490.12340.1225
NDRE0.88400.87800.20510.89400.20110.19950.1978
NDVI0.81900.92900.07490.89600.07220.07050.0690
Crown area (cm2)0.88800.93400.25500.93500.25300.25100.2500
Table 4. Metrics and errors of following scatter plots–GCI × LAI; canopy planar area calculated by vectorization (cm2) × LAI; canopy planar area calculated by vectorization (cm2) × crown diameter sampled in the field—and linear models for the coffee crop planted with seedlings produced in perforated bags and coffee crops planted with seedlings produced in root trainers.
Model ParameterRegression Metrics and Errors
MSERMSEMAER2 ρ ^ s
Perforated-bag Treatment
GCI × LAI0.0030.0560.0410.7750.871
Root-trainer Treatment
GCI × LAI0.0020.0450.0350.8310.879
Total Coffee Samples From Both Experiments
Canopy planar area calculated by vectorisation (cm2) × LAI0.0010.0360.0230.8860.951
Canopy planar area calculated by vectorisation (cm2) × Diameter (cm)35.3795.9484.4560.8970.951
Table 5. Quantity of coffee seedlings planted in December 2018 and the remaining ones in April 2019 (before replanting), as well as the dead rating assessment for the studied containers.
Seedlings ContainerCoffee Seedlings—December 2018Coffee Seedlings—April 2019Dead SeedlingsFailure Rate
Perforated bags611572396.4%
Root trainers6135417211.7%
Table 6. χ2 test of independence considering the dead seedlings and the containers (perforated bags and rigid root trainers) used for coffee seedling production.
TestNull Hypothesis (H0)Test ValueDegree of FreedomSignificance Value pDecision
χ2There is no association between variables10,671 a10.0011 *Rejects the null hypothesis (H0); there is an association between variables
a Zero cells (0.0%) had an expected frequency lower than 5; * Significant difference at the level ρ = 0.05.
Table 7. Cross-tabulation analysis between seedling establishment status and type of studied containers for coffee plants produced in perforated bags and root trainers based on χ2 test results.
Seedling Establishment StatusFrequenciesContainersTotal
Perforated BagsRoot Trainers
SuccessCount *572 a541 b1113
Expected Count555.6557.41113.0
% within establishment51.4%48.6%100.0%
% within container93.6%88.3%90.9%
% Total46.7%44.2%90.9%
Adjusted Residual3.3−3.3
Failure (dead seedlings)Count39 a72 b111
Expected Count55.455.6111.0
% within establishment35.1%64.9%100.0%
% within container6.4%11.7%9.1%
% Total3.2%5.9%9.1%
Adjusted Residual−3.33.3
TotalCount6116131224
Expected Count611.0613.01224.0
% within establishment49.9%50.1%100.0%
% within container100.0%100.0%100.0%
% Total49.9%50.1%100.0%
* Different letters significant difference between containers at the level ρ = 0.05.
Disclaimer/Publisher’s Note: The statements, opinions and data contained in all publications are solely those of the individual author(s) and contributor(s) and not of MDPI and/or the editor(s). MDPI and/or the editor(s) disclaim responsibility for any injury to people or property resulting from any ideas, methods, instructions or products referred to in the content.

