Article

Indoor Temperature Forecasting in Livestock Buildings: A Data-Driven Approach

by
Carlos Alejandro Perez Garcia
,
Marco Bovo
,
Daniele Torreggiani
,
Patrizia Tassinari
and
Stefano Benni
*
Department of Agricultural and Food Sciences, University of Bologna, Viale G. Fanin 48, 40127 Bologna, Italy
*
Author to whom correspondence should be addressed.
Agriculture 2024, 14(2), 316; https://doi.org/10.3390/agriculture14020316
Submission received: 12 January 2024 / Revised: 9 February 2024 / Accepted: 15 February 2024 / Published: 17 February 2024
(This article belongs to the Special Issue Optimization of Livestock Housing Management)

Abstract

:
The escalating global population and climate change necessitate sustainable livestock production methods to meet rising food demand. Precision Livestock Farming (PLF) integrates information and communication technologies (ICT) to improve farming efficiency and animal health. Unlike traditional methods, PLF uses machine learning (ML) algorithms to analyze data in real time, providing valuable insights to decision makers. Dairy farming in diverse climates is challenging and requires well-designed structures to regulate internal environmental parameters. This study explores the application of the Facebook-developed Prophet algorithm to predict indoor temperatures in a dairy farm over a 72 h horizon. Exogenous variables sourced from the Open-Meteo platform improve the accuracy of the model. The paper details case study construction, data acquisition, preprocessing, and model training, highlighting the importance of seasonality in environmental variables. Model validation using key metrics shows consistent accuracy across different dates, as the mean absolute percentage error on daily base ranges from 1.71% to 2.62%. The results indicate excellent model performance, especially considering the operational context. The study concludes that black box models, such as the Prophet algorithm, are effective for predicting indoor temperatures in livestock buildings and provide valuable insights for environmental control and optimization in livestock production. Future research should explore gray box models that integrate physical building characteristics to improve predictive performance and HVAC system control.

1. Introduction

Worldwide population increase and climate change have triggered the need to develop more sustainable forms of livestock production to meet the growing demand for food. Large-scale livestock production is an alternative used by farmers to reduce costs, but the significant environmental impacts of these practices are not compatible with the current environmental context [1,2]. Therefore, concepts such as Precision Livestock Farming (PLF) have emerged that integrate existing systems of information and communication technologies (ICT) into the farming process to reduce operational costs and increase both production and animal health [3,4,5,6].
In contrast to traditional livestock production, where decisions are based on the knowledge of the farmers, PLF allows the collection of a large amount of data, recorded in almost real time, which can be used through specialized data analysis tools to obtain insights that support the decision making of farmers, technicians, and vets [7,8,9]. Among the most efficient data analysis tools are the machine learning (ML) algorithms and their deep learning subset, since they are powerful tools that allow us to deal with the particularities of real datasets and provide valuable data insights [10].
Dairy cattle farming in temperate and hot climates is a big challenge for farmers, so it is necessary to design safe and high-performance buildings, able to adapt to the environmental parameters associated with the high temperatures of the summer months and the low temperatures of the winter months [11,12]. In this sense, two different construction approaches can be adopted: closed or open/semi-open structures, where the former require a greater use of energy to stabilize the internal climate, while the latter are more dependent on external climatic variables. It is worth noting that in the latter type of construction, the knowledge of precise environmental parameters is an essential indicator for the proper management of the building. The structural and geometrical features, joined to the characteristics of the herd reared in the building, are the required information to establish the relationship between indoor and outdoor environmental variables. Usually, this relation cannot be expressed by a few parameters, so advanced statistical and mathematical techniques, like ML and big data analysis, have a great potential to describe these complex processes. Therefore, they are widely applied in novel algorithms for predictive analysis of the climate in livestock buildings, designed to require an energy input that is as low as possible [13], but at the same time assuring a suitable level of animal welfare.
Predictive building temperature models can be categorized into three main paradigms: white box, black box, and gray box models [14,15,16,17]. Although the boundaries between these categories are blurred and often overlap, this paradigm is useful for understanding the modeling process. When not all the building parameters are available and the development of the dynamic model is not possible, the black box model assumes a remarkable role; therefore, this approach is chosen for the present work. Prophet is a time series algorithm developed by Facebook that stands out as a powerful and easy-to-use framework that is widely used by researchers in the field for time-based data forecasting [18]. Its widespread use is due to its robust ability to model and predict time series data by decomposing it into three main components: trend, seasonality, and holidays.
Monitoring indoor temperatures in livestock barns has been the subject of extensive research and development, testing various strategies and technologies to optimize animal farming practices [19,20]. In [21], Mylostyvyi et al. conducted a study focusing on the monitoring and prediction of microclimate conditions in naturally ventilated barns, with a specific emphasis on addressing the adverse effects of high summer temperatures on dairy cows in the context of global climate change. The underlying hypothesis posited that the utilization of multiple periodic measurements of air temperature and relative humidity, both inside and outside the barn simultaneously, could be employed to construct a linear regression model for predicting the temperature–humidity index (THI). Herbut et al. [22] addressed the profound impact of high ambient temperature and heat waves on the well-being and productivity of dairy cows. They highlighted the expected deterioration of climate conditions for cattle rearing in the coming decades and emphasized the negative consequences of heat stress on physiological and behavioral aspects, as well as milk production. The authors underscored the importance of developing new environmental methods for predicting heat stress among dairy cows. Ji et al. [23] used a dataset of environmental conditions, individual animal behavior, health, productivity, and milk quality to train artificial intelligence algorithms to predict trends in these variables. Finally, the authors presented the development of a framework to automatically train models with updated farm data and predict each cow’s daily milk production, composition (fat and protein content), and milking frequency for the following 28 days. Gautam et al. [24] developed a data-based predictive model using observational data to predict future temperatures as a function of current weather conditions and control inputs. The researchers evaluated the utility of the developed models to improve management decisions, by hypothesizing that a black box predictive model could serve as a surrogate for a physical model to calculate the cost function and optimize controllable parameters.
As the scientific literature revealed a notable gap related to the predictive models in the estimation of indoor environmental parameters, using only historical data, this study aims to develop a predictive model of the indoor temperature in a dairy cattle farm, with a 72 h prediction horizon. In particular, the Prophet framework was used, and outdoor weather forecast parameters were considered exogenous variables in order to increase the accuracy of the model. To address the key aspects, this paper is organized as follows. First, the analysis of the application context is reported, referring to the constructive, geometric, and structural characteristics of the case study. In addition, the main characteristics of a monitoring system, used to collect environmental data in the case study building, are described. Then, the data pre-processing stage is presented, as well as the accuracy of the weather forecasting provider with respect to the raw measurements. Then, the adopted predictive model is described, and the results are discussed based on the research findings. Finally, the limitations of the predictive model are discussed.

2. Materials and Methods

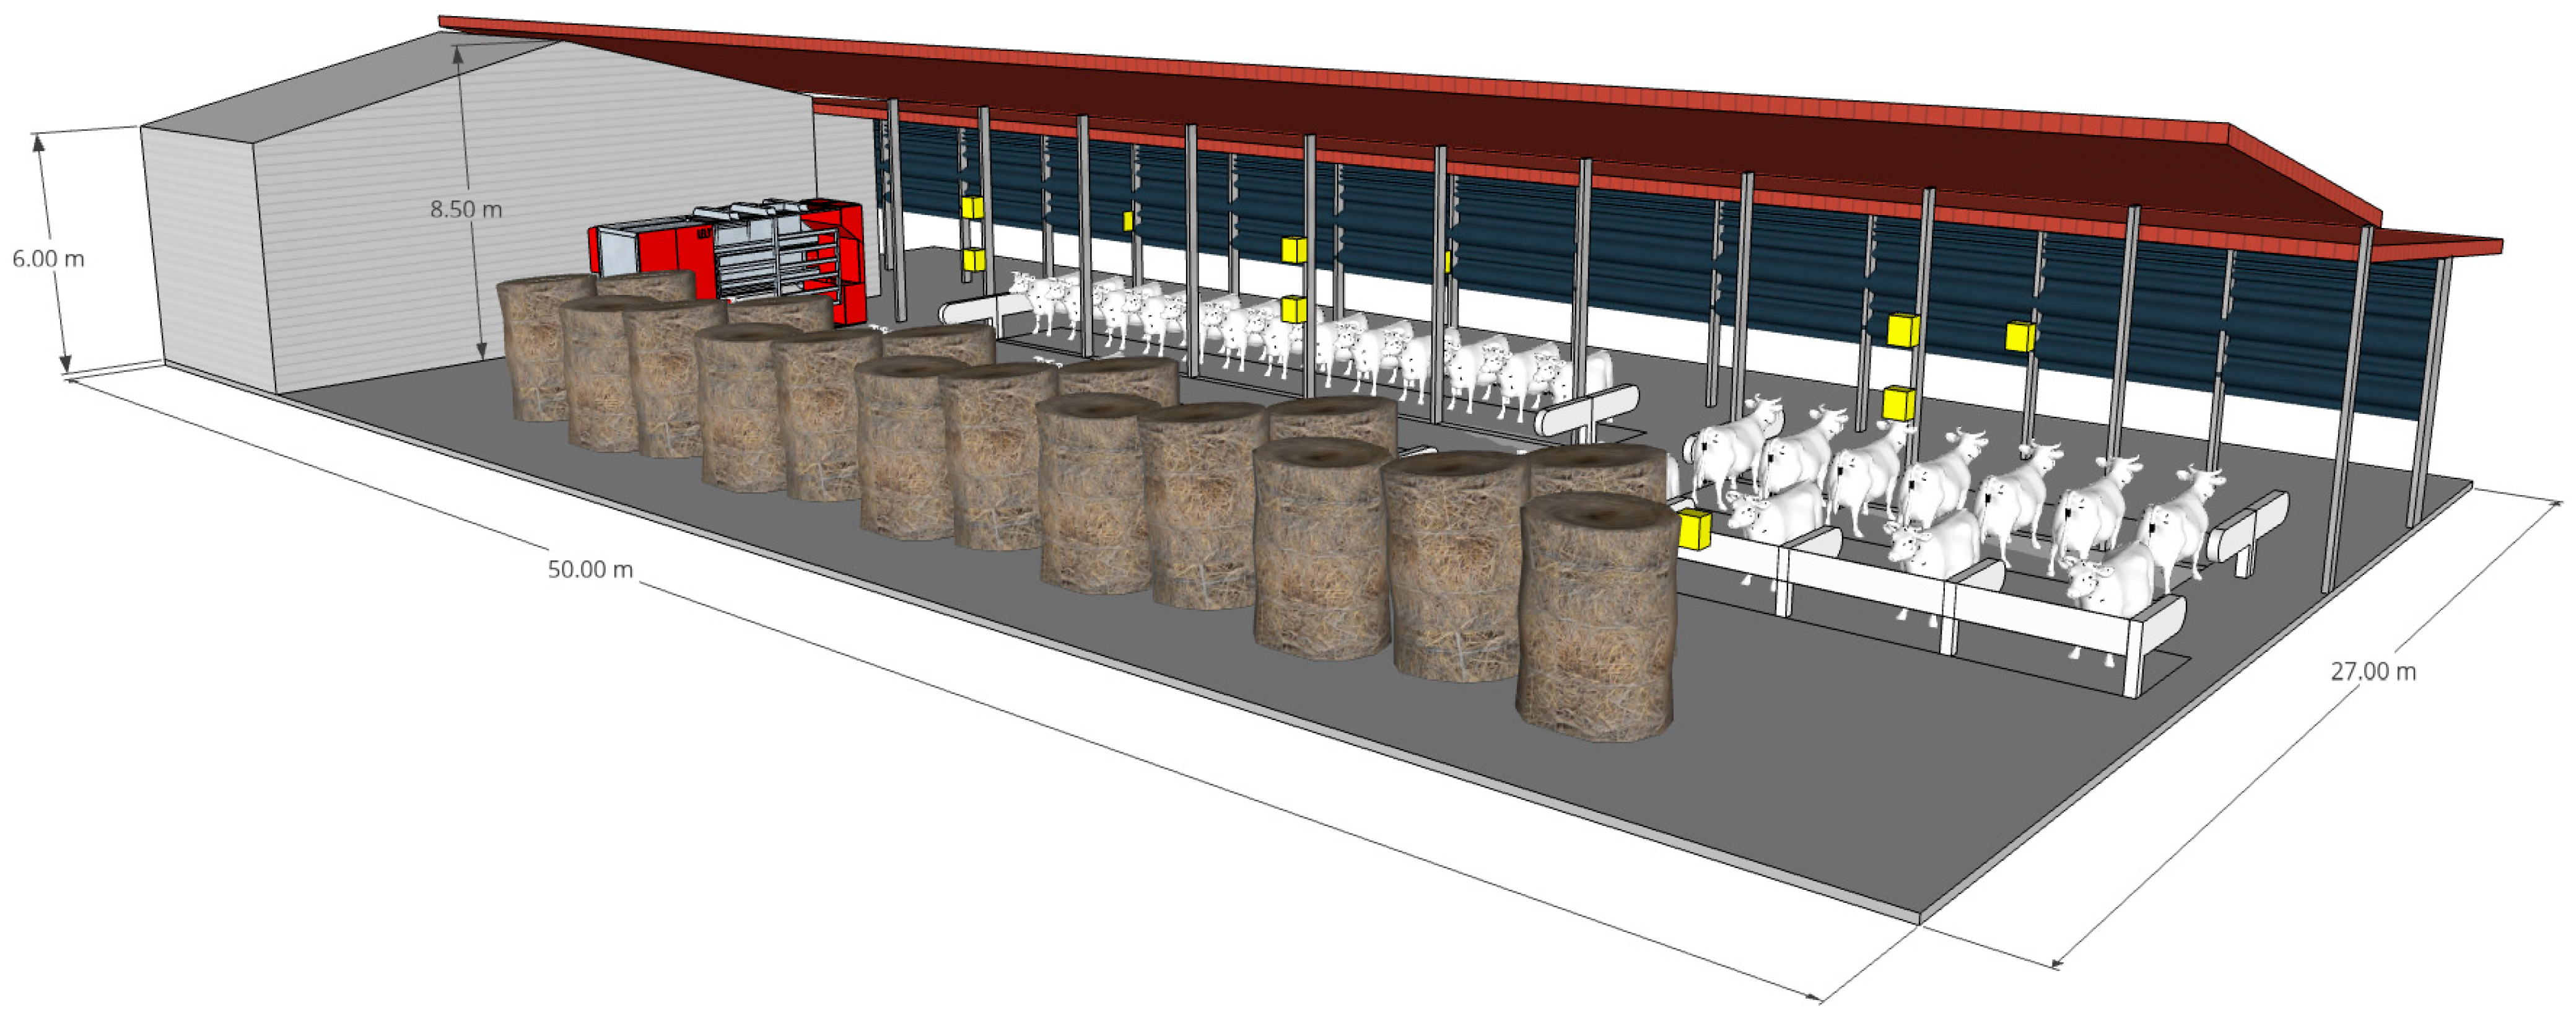
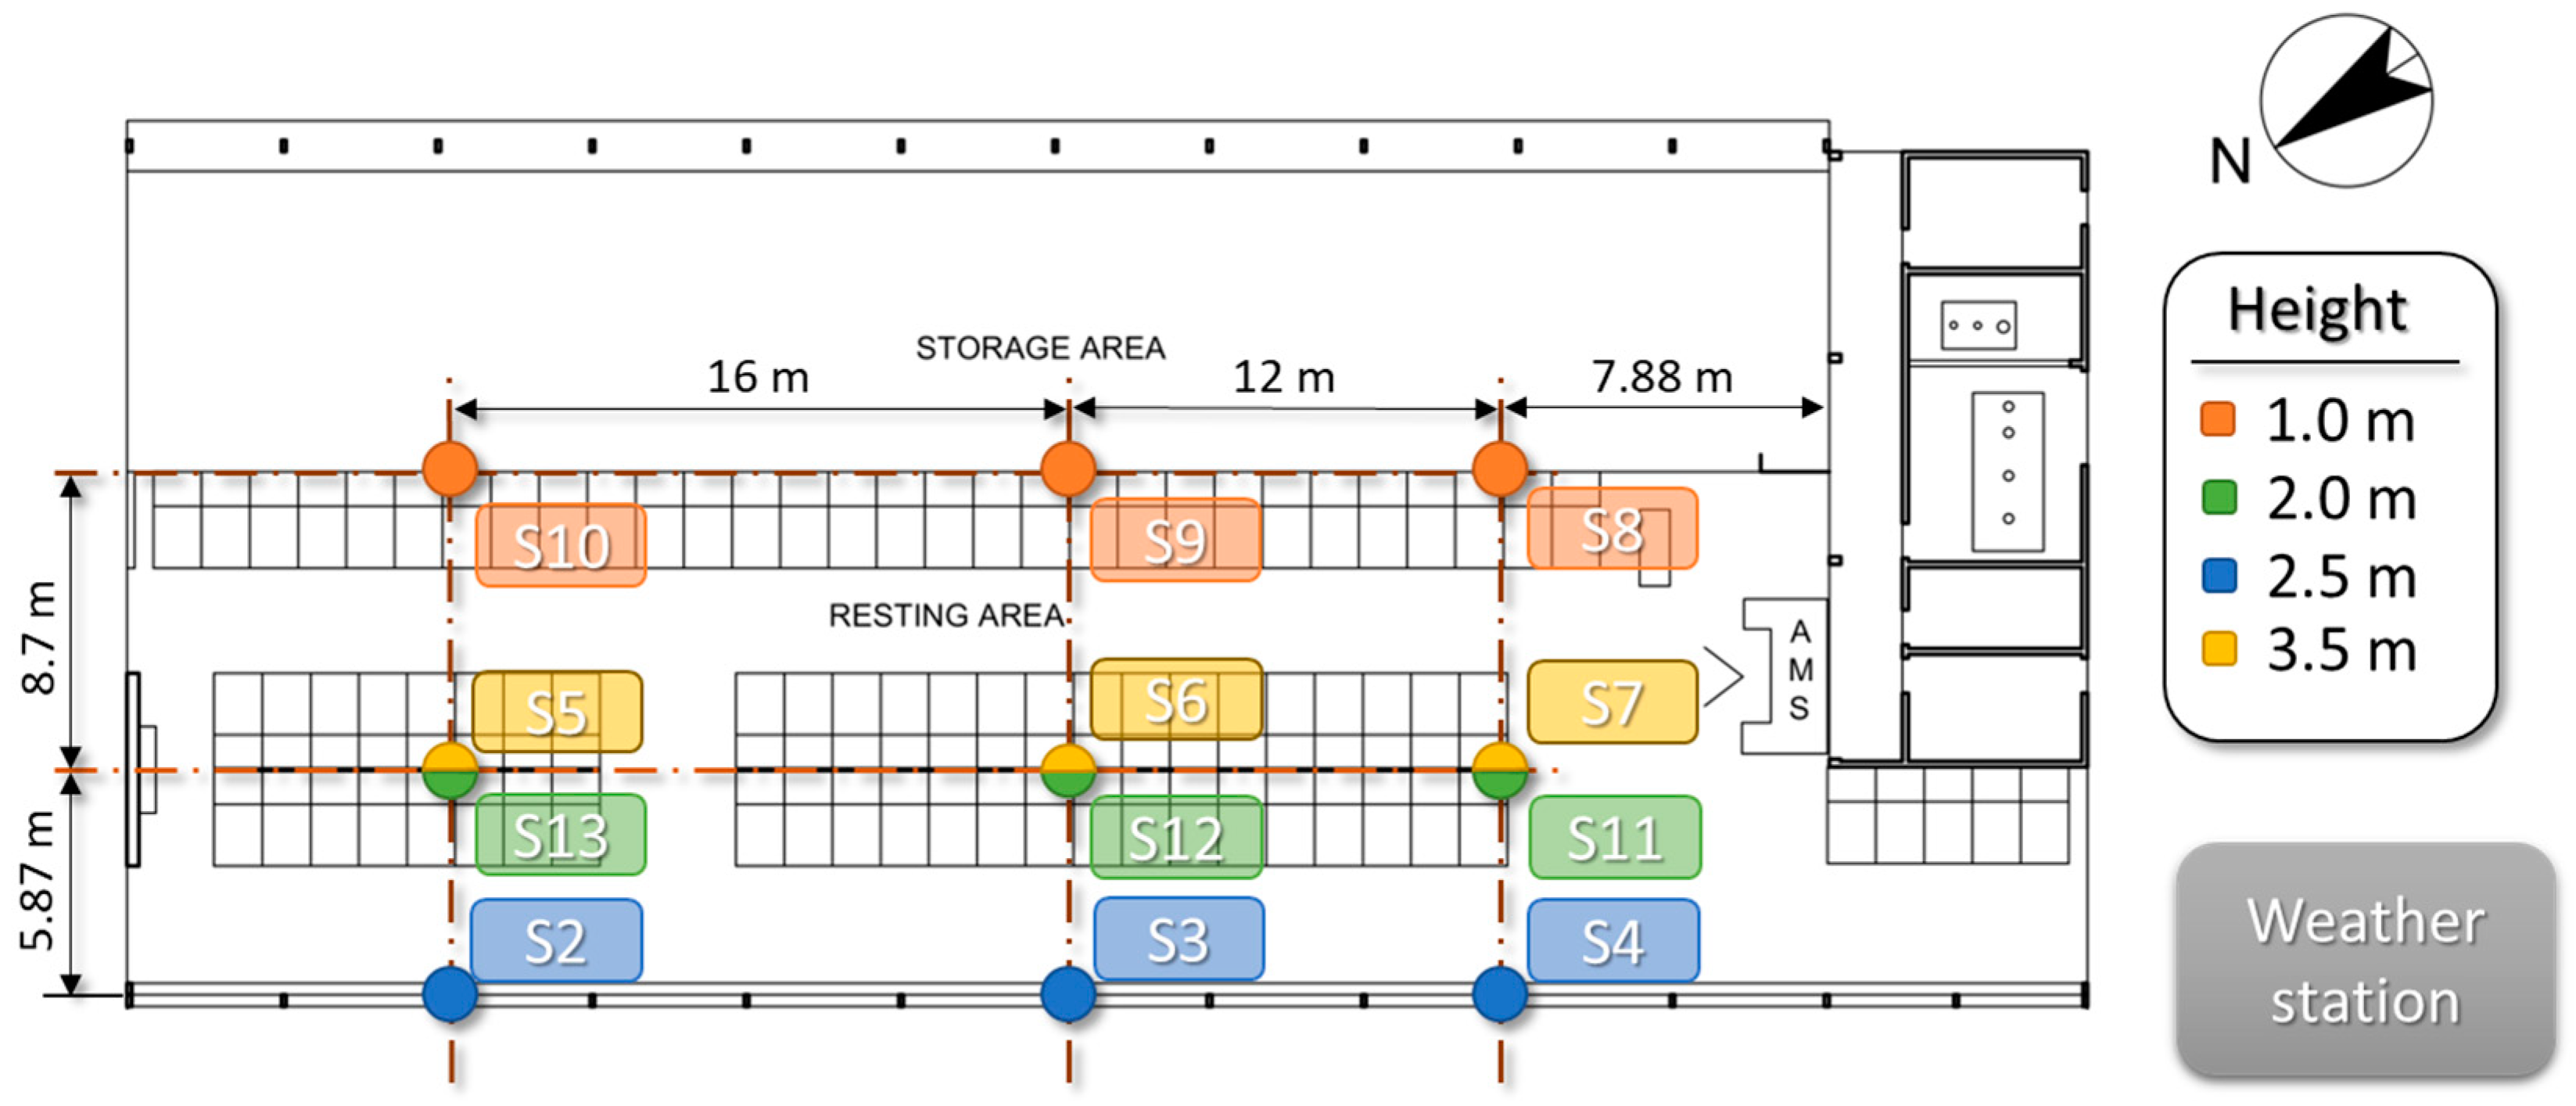
2.1. Description of the Case Study

The work focuses on a case study building officially involved in a scientific collaboration with the University of Bologna. This farm served as an experimental site for collecting data and monitoring various parameters related to the environment, production, and animal behavior. The farm is located in Budrio, a municipality in the metropolitan city of Bologna, Emilia-Romagna, Italy. The geographical coordinates are 44°33′32.7″ N 11°31′09.7″ E, with an elevation of 25 m above sea level. The dairy cattle barn (Figure 1) has a rectangular plan layout with dimensions of 50 m in length and 27 m in width. The roof height varies from about 6.0 m at the eaves to 8.5 m at the ridge. The building has a steel frame structure with a double pitched roof made of insulated metal panels. Within the barn, there were about 70 Holstein-Friesian lactating cows and 15 dried cows.
The internal space of the barn is divided into three main areas: resting, feeding, and milking. The milking process is carried out through an Automatic Milking System (AMS). The resting area has a partially slatted floor and comprises 78 cubicles with sawdust bedding. These cubicles are arranged in two blocks of head-to-head rows in the central part of the resting area, with another row running along its entire length. On the opposite side, the feeding area spans the entire width of the building and is on the north-east side. Lastly, the AMS station houses a robotic milking system “Astronaut A3 Next” by Lely. This system ensures that each cow receives a specific number of daily visits based on its productivity and the expected optimal milk yield per visit. The minimum and maximum number of daily visits are constrained to 2 and 4, respectively. Mechanical ventilation is carried out by three high volume low speed fans with five horizontal blades, activated on the basis of THI, computed from a temperature and humidity sensor placed in the middle of the barn.

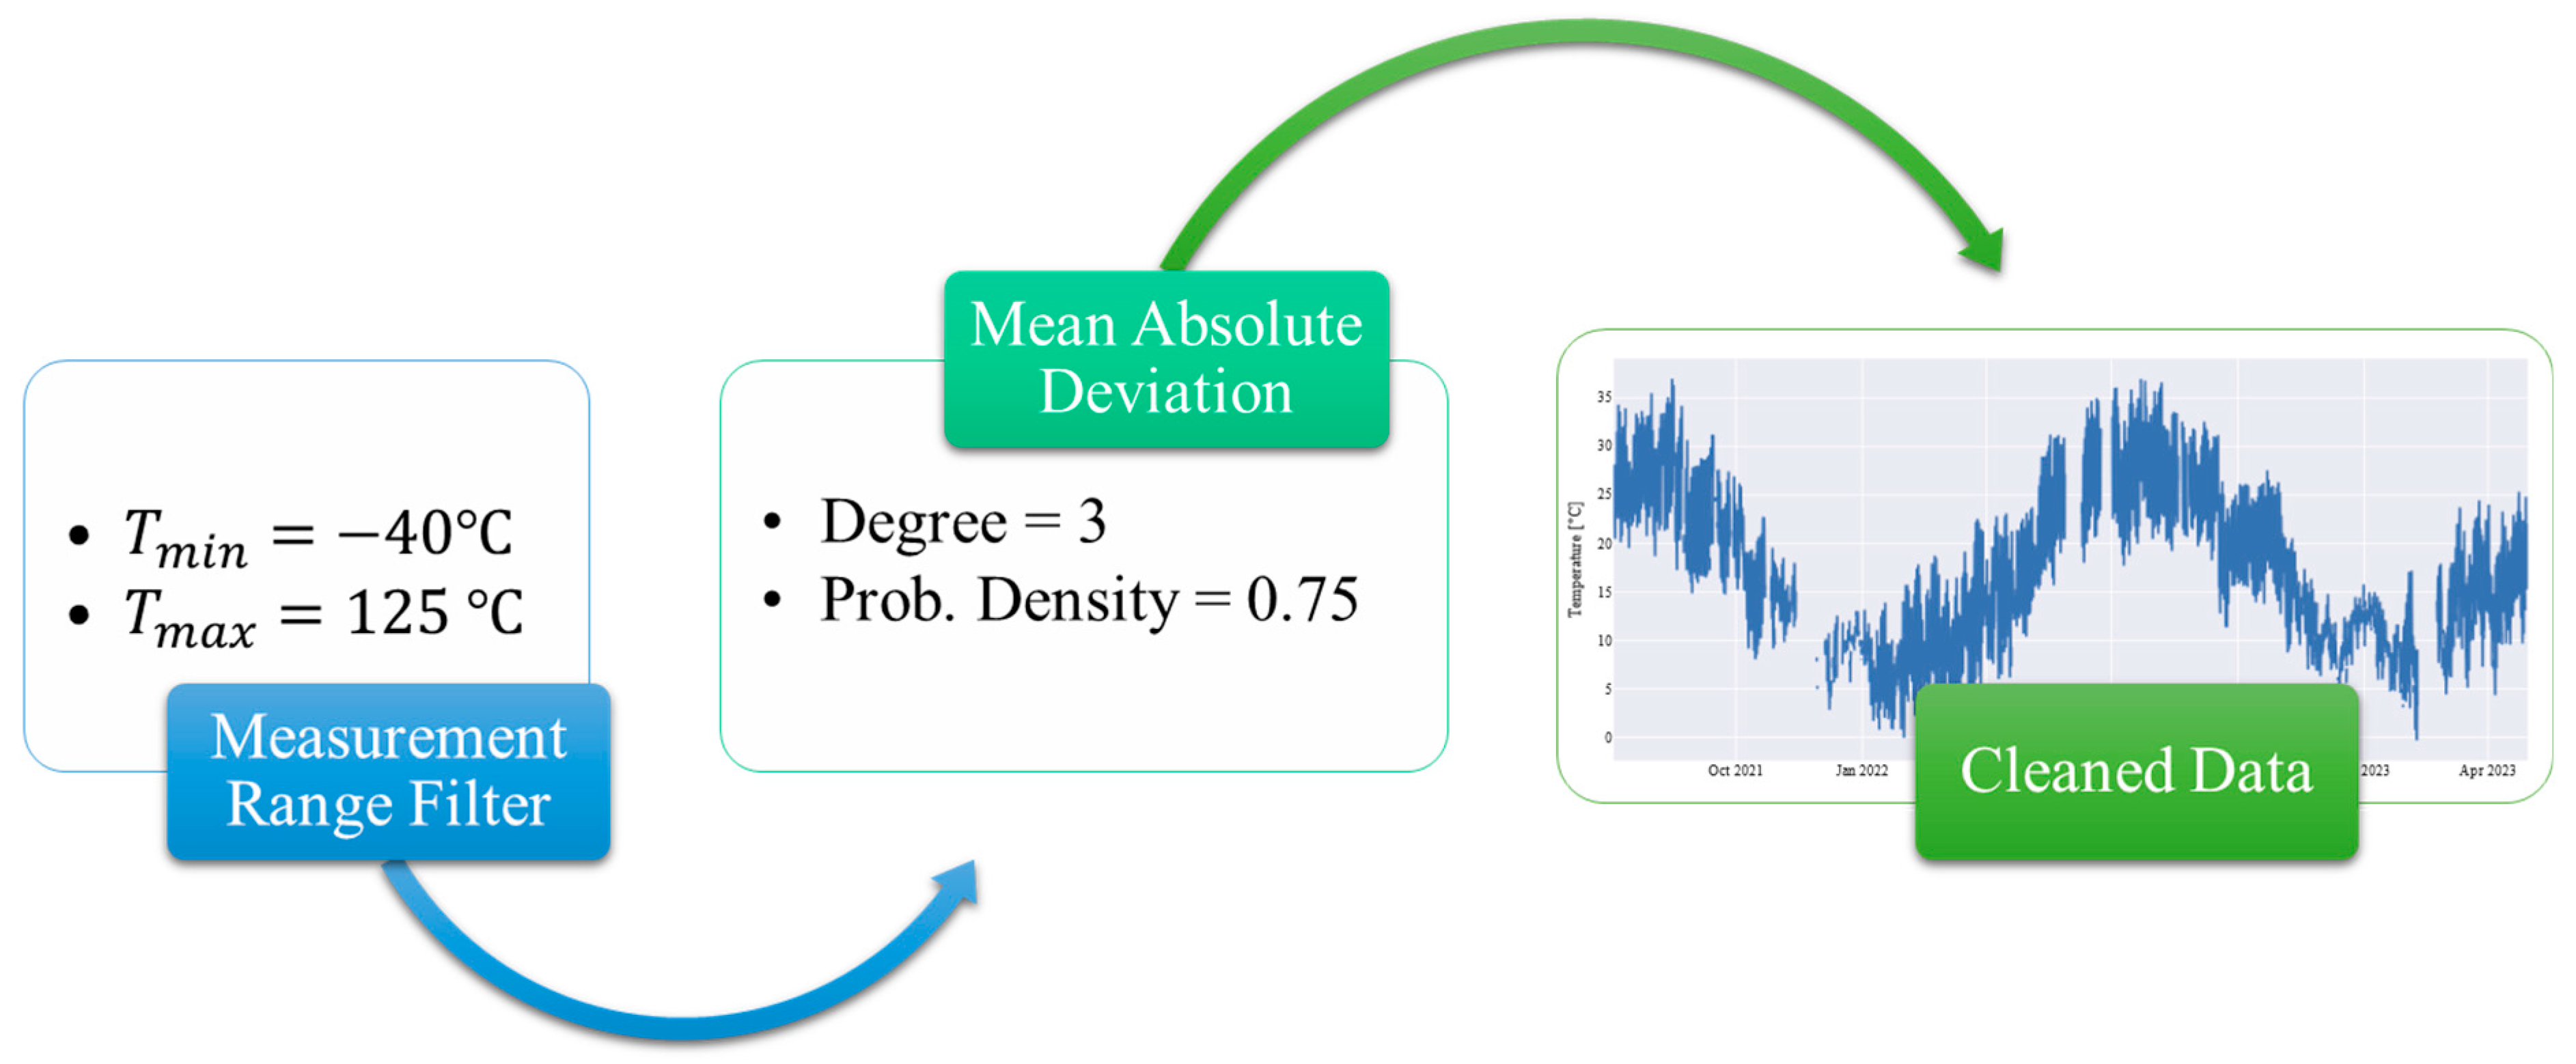
2.2. Data Acquisition and Data Processing

Hourly data of indoor temperature over the timespan from 1 September 2022 to 26 June 2024 were collated by 12 transducers from TE Connectivity, distributed in groups of three and positioned at 1.0, 2.0, 2.5, and 3.5 m high to cover the internal zones sensitive to temperature changes inside the barn (Figure 2). The main parameters of the HTU21D(F) temperature sensor have an operative range going from −40 to +125 °C with an accuracy of ±0.3 °C and a resolution of 0.04 °C.
The outdoor environmental parameters recorded by a local weather station equipped with the sensors listed in Table 1 will be used for the validation of the outdoor measurements of temperature, relative humidity, and atmospheric pressure provided by the weather forecaster, since the latter will be used as input of the model to establish a robust understanding of the external factors influencing the thermal dynamics of the livestock environment. All environmental parameters (indoor and outdoor) were recorded every 5 min and sent to the InfluxDB database management system, using a Raspberry Pi as a gateway connected to the internet.
Missing values and outliers are one of the most challenging errors present in time series because, despite the existence of several algorithms that allow their elimination, an a priori knowledge of the data and their normal behavior is required to make correct estimates based on the erroneous data. To deal with outliers, a cascade of two algorithms has been implemented (Figure 3), first filtering the data according to the measurement range of the sensor, and then applying the mean absolute deviation algorithm with the aim of eliminating the values that, although within the measurement range of the instrument, do not correspond to the difference of each data point from the mean.
Imputing missing values involves filling in the gaps in the dataset with estimated values, typically using statistical techniques or imputation models. However, this can potentially introduce bias or alter the distribution of the data, which may lead to incorrect inferences or predictions by the algorithm. Hence, in this case, the decision was made to keep the data raw, preserving their original characteristics and minimizing bias or inaccuracy of the prediction algorithm.

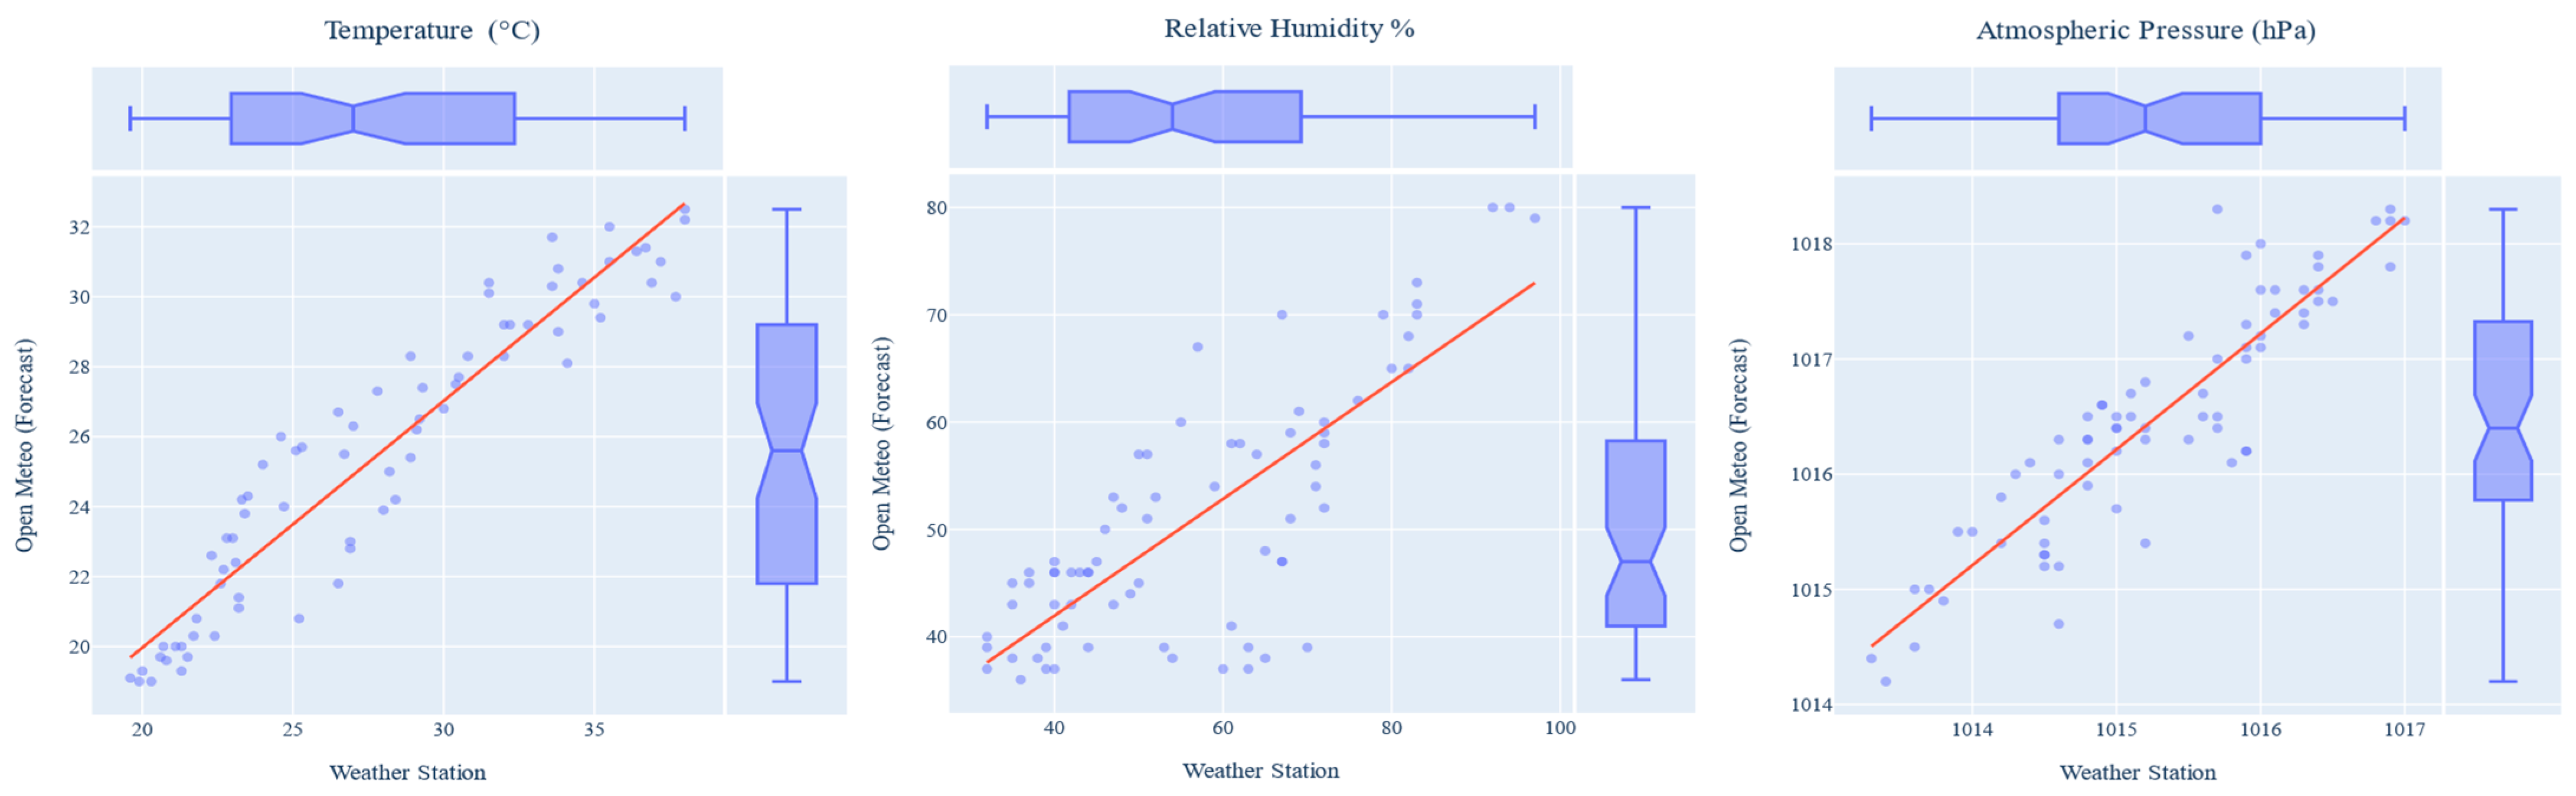
2.3. Weather Forecast Data

The outputs of physical systems, such as indoor air temperature in a building, depend on current and past inputs, but a pivotal feature of current research is the use of free environmental forecasting providers that use complex predictive models that consider the historical behavior as well as the interaction between multiple variables recorded by weather stations. Open-Meteo [25] is a free and open-source weather API that provides high-resolution open data from 1 to 11 km from national weather services. However, it is well known that the accuracy of indicators provided by forecasters depends on several factors, including the distance of the surveyed site from the nearest source of information considered by the model.
To quantify the similarity between the actual outdoor environmental variables recorded by the weather station installed in the case study barn and the data provided by Open-Meteo, a comparative analysis was performed. This was done by randomly selecting three days within the time frame of this work. Figure 4 illustrates the congruence in trends between the values provided by the forecaster and the raw measurements recorded by the local weather station. It is important to note that while there is a similarity in the overall course, there are discrepancies, especially in the air temperature during daylight hours.
Regardless of the similarity of the comparison of the pairs of variables analyzed (temperature, relative humidity, and atmospheric pressure), a correlation analysis was carried out. For this purpose, the presence of a linear relationship between the variables under study (Figure 5) was first verified. Consequently, the confirmation of an approximate linear relationship allows us to consider Pearson’s correlation as a suitable way to quantify the degree of similarity between the two pairs of variables.
Table 2 shows that the correlation coefficients are all higher than 0.85, indicating a strong positive relationship between the two data sources. The p-values are all below 0.05, indicating that the correlations are statistically significant. These findings can have practical implications for understanding how changes in one variable may be associated with changes in the other variables over time.

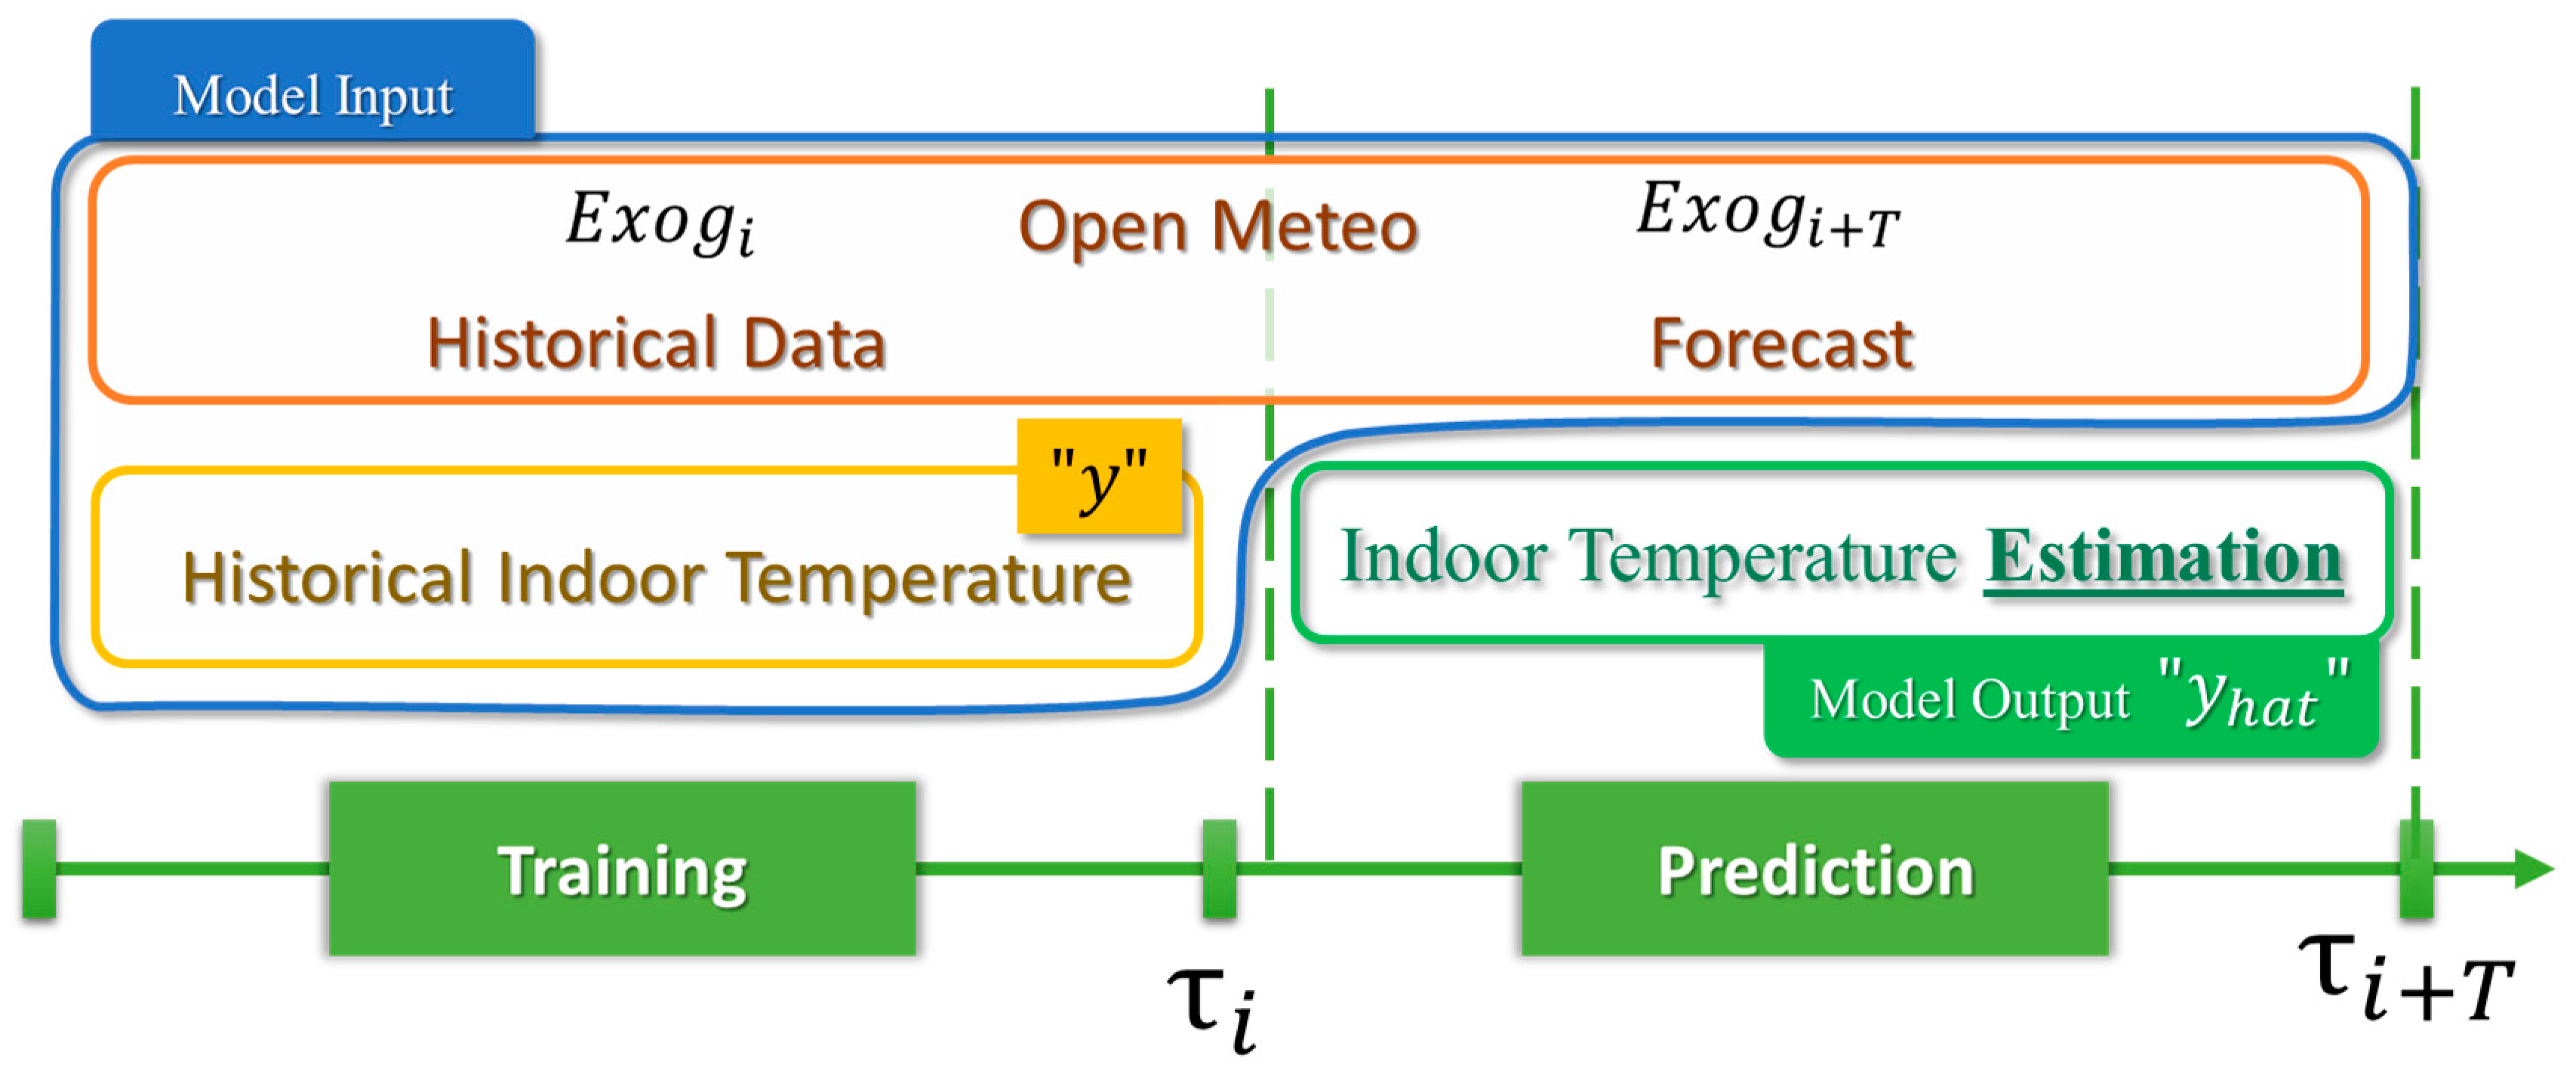
2.4. Model Description

The typical application of a predictive model involves two stages, i.e., the training and the prediction. In the case of black box models, retraining must be conducted periodically, so a common setting for forecasting is to fit models that need to be updated as additional data come in. However, the Prophet model can only be fitted once, and a new model must be fitted as new data become available. In the present work, model retraining and forecasting are performed in the same routine, at a time interval equal to the selected forecast horizon, which will have a maximum of 72 h.
The Facebook Prophet [18] algorithm that uses Bayesian nonlinear regression and univariate generative models has been adopted in order to predict future events based on historical data (see Equation (1)):
y t = T t + S t + H t + ϵ t
where y t is the forecasted value; T t , S t , and H t are, respectively, trend (non-periodic changes), seasonal (periodic changes), and holidays effects, which gives irregular schedules. Finally, ϵ t is the error term of the forecast which represents any unusual changes. In our case, the holiday model parameter has been neglected since it does not apply in the present application.
To effectively use Prophet, input data are required in the form of a Pandas Dataframe containing two crucial columns: a “ds” column indicating the time stamps of the time series, and a “y” column representing the corresponding numerical values to be predicted [18]. In order to increase the accuracy of the predictions calculated by the Prophet model, in addition to the target variable labeled “y”, which in our case is the indoor temperature, additional regressors, also known as exogenous variables, are set, which in our case correspond to the outdoor temperature, outdoor relative humidity, and outdoor atmospheric pressure provided by Open-Meteo. It is necessary to note that these exogenous variables will be used both in the training and in the prediction stages; the former are the historical values stored in the Open-Meteo platform, while the latter correspond to the predictions also provided by the weather forecaster (Figure 6).
It is worth noting that the measurements of outdoor environmental parameters recorded by the weather station may not perfectly coincide with those provided by Open-Meteo. In the current context of application, where exogenous variables are essential during the training and prediction phase, statistical analyses carried out during the conceptual phase of the model have shown that a better performance is obtained using the same information source for both stages.

3. Results and Discussion

3.1. Model Training

Prophet model estimates target variables based on probabilistic estimation trends where patterns are followed to try and determine how the time series extends and how it might evolve in the future. Hence, using a large dataset for training leads to more accurate forecasts by the model. When working with environmental variables, it is well known that they vary depending on the season of the year, considering that we are working with measurements from the same location. Therefore, to take advantage of defining custom seasonality from the labeling of the values, the training dataset (Figure 7) has been labeled with four new Boolean columns that identify the season of the year based on the start and end dates of the different seasons in Italy (Table 3).
In addition to the input parameters related to the seasonality of the training dataset, Prophet has additional parameters that must be tuned to obtain a robust and accurate model. The Changepoint Prior Scale, which determines the flexibility of the train and how much the trend changes at the trend changepoints, is one of the parameters with the greatest impact on model prediction. Small values result in underfitting of the trend, and variance that should have been handled by the trend changes is instead handled by the noise term. On the other hand, if it is too large, the trend will overfit and, in the most extreme case, you may end up with the trend capturing the annual seasonality. Another important parameter is the Seasonality Prior Scale, which controls the flexibility of the seasonality. Similar to the seasonality prior, a large value allows the seasonality to fit large fluctuations, while a small value shrinks the magnitude of the seasonality. The selection of the obtained values corresponding to the parameters described above was made through a hyperparameter tuning process, using the mean squared error as the minimization objective.
The Changepoint Range is the portion of the history in which the trend is allowed to change, to avoid overfitting to trend changes at the very end of the time series where there is not enough runway left to fit well. Prophet documentation suggests not including this parameter in the Hype parameterization algorithm and provides a reasonable range between 0.8 and 0.95 for trial-and-error strategies. In our case, it was set to 0.9.
Special attention should also be paid to the adjustment of the parameters Yearly, Weekly, and Daily Seasonality. In our application context only, the Daily Seasonality was set to True, as it is the one present in this type of target variable (i.e., temperature), since during the day the values can be higher than during the night hours.

3.2. Model Validation
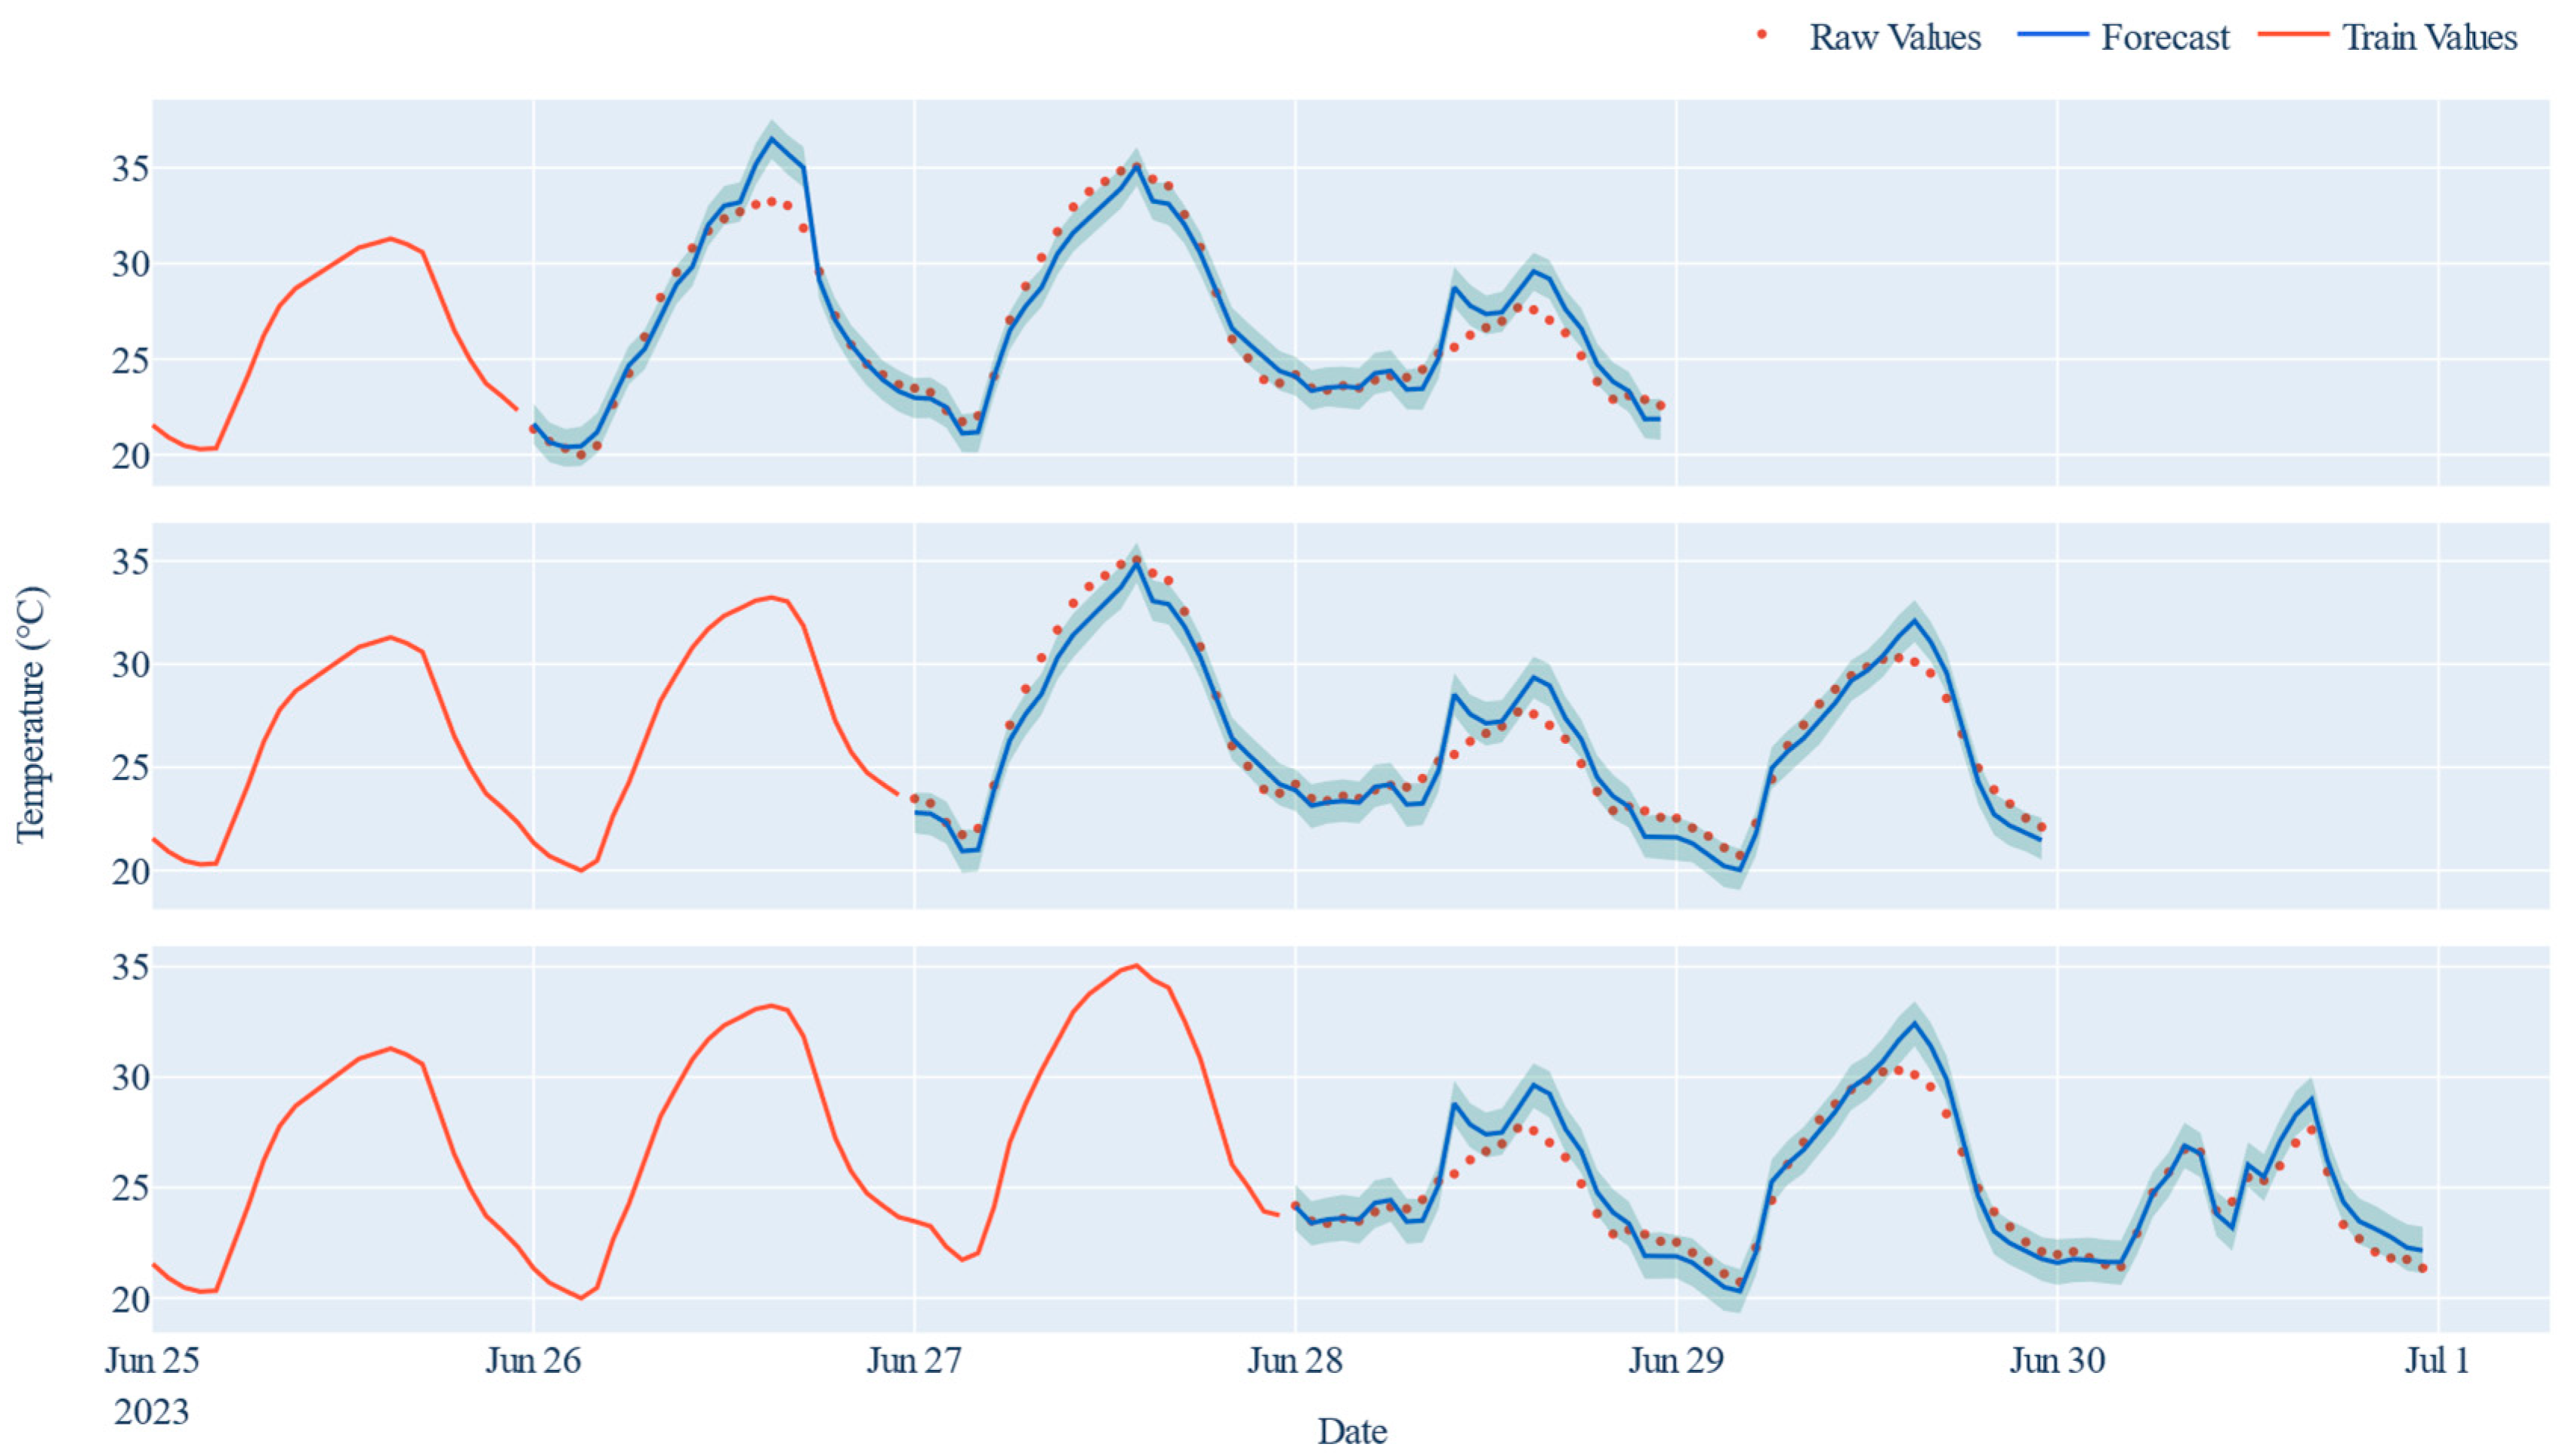
A validation approach using historical real sensor measurements to compute relevant static parameters that allow us to quantify the model accuracy has been performed to verify the model performance using key performance metrics of the predicted temperature, including mean absolute error (MAE), root mean square error (RMSE), R-squared, and mean absolute percentage error (MAPE). Table 4 summarizes the insight into the accuracy of the model at different selected validation dates. The 5 folds of 72 h prediction horizon was obtained through a rolling window algorithm that creates a model output in the extrema case of prediction in terms of forecast periods.
On 13 June, the model had a MAE of 0.684, RMSE of 0.857, root square of 0.959, and MAPE of 2.62. The subsequent validation on June 16, showed improved performance with a reduced MAE of 0.503, RMSE of 0.656, R-squared of 0.972, and a lower MAPE of 1.71. On 19 June, the model showed a slightly higher MAE of 0.6675, RMSE of 0.9223, R-squared of 0.931, and MAPE of 2.39. The final validation on June 22nd, showed a MAE of 0.730, RMSE of 1.085, R-squared of 0.943, and MAPE of 2.55.
These results reveal homogeneous variations across different validation dates. The model demonstrates consistent accuracy in its predictions, reflecting stable performance metrics. Furthermore, considering the context of the application, the values obtained can be classified as excellent.
In the current operational setting, where 1 °C represents an acceptable precision in the estimated temperature, the performance of the model is considered effective. These results underscore the practical applicability of the predictive model in the context of environmental control systems for pilot farms, where accuracy in temperature estimation is critical for optimizing animal welfare and productivity.

3.3. Model Test

An aspect of interest for herd management decisions is the forecast of the internal temperature of a livestock building in temperate climates. However, due to the target variable, short-term predictions are required. Covering a 6-day period from 25 June 2023 to 1 July 2023, Figure 8 contrasts the raw temperature values, denoted by blue dots and light blue connecting lines, with the forecasted temperatures elegantly represented by a smooth red curve. To get an idea of the model performance, an uncertainty interval corresponding to 80% of the quantile was calculated for each accuracy. In addition, the subsequent raw values were added to the graph.
This visual comparison illuminates a significant convergence between the forecasted and actual temperatures, underscoring the model prowess in accurately predicting indoor temperature. The model demonstrates a commendable ability to anticipate temperature changes, and subtle discrepancies are acknowledged. These variations could be attributed to dynamic environmental factors such as sudden weather shifts, potential equipment irregularities, or unforeseen circumstances intrinsic to the agricultural context.

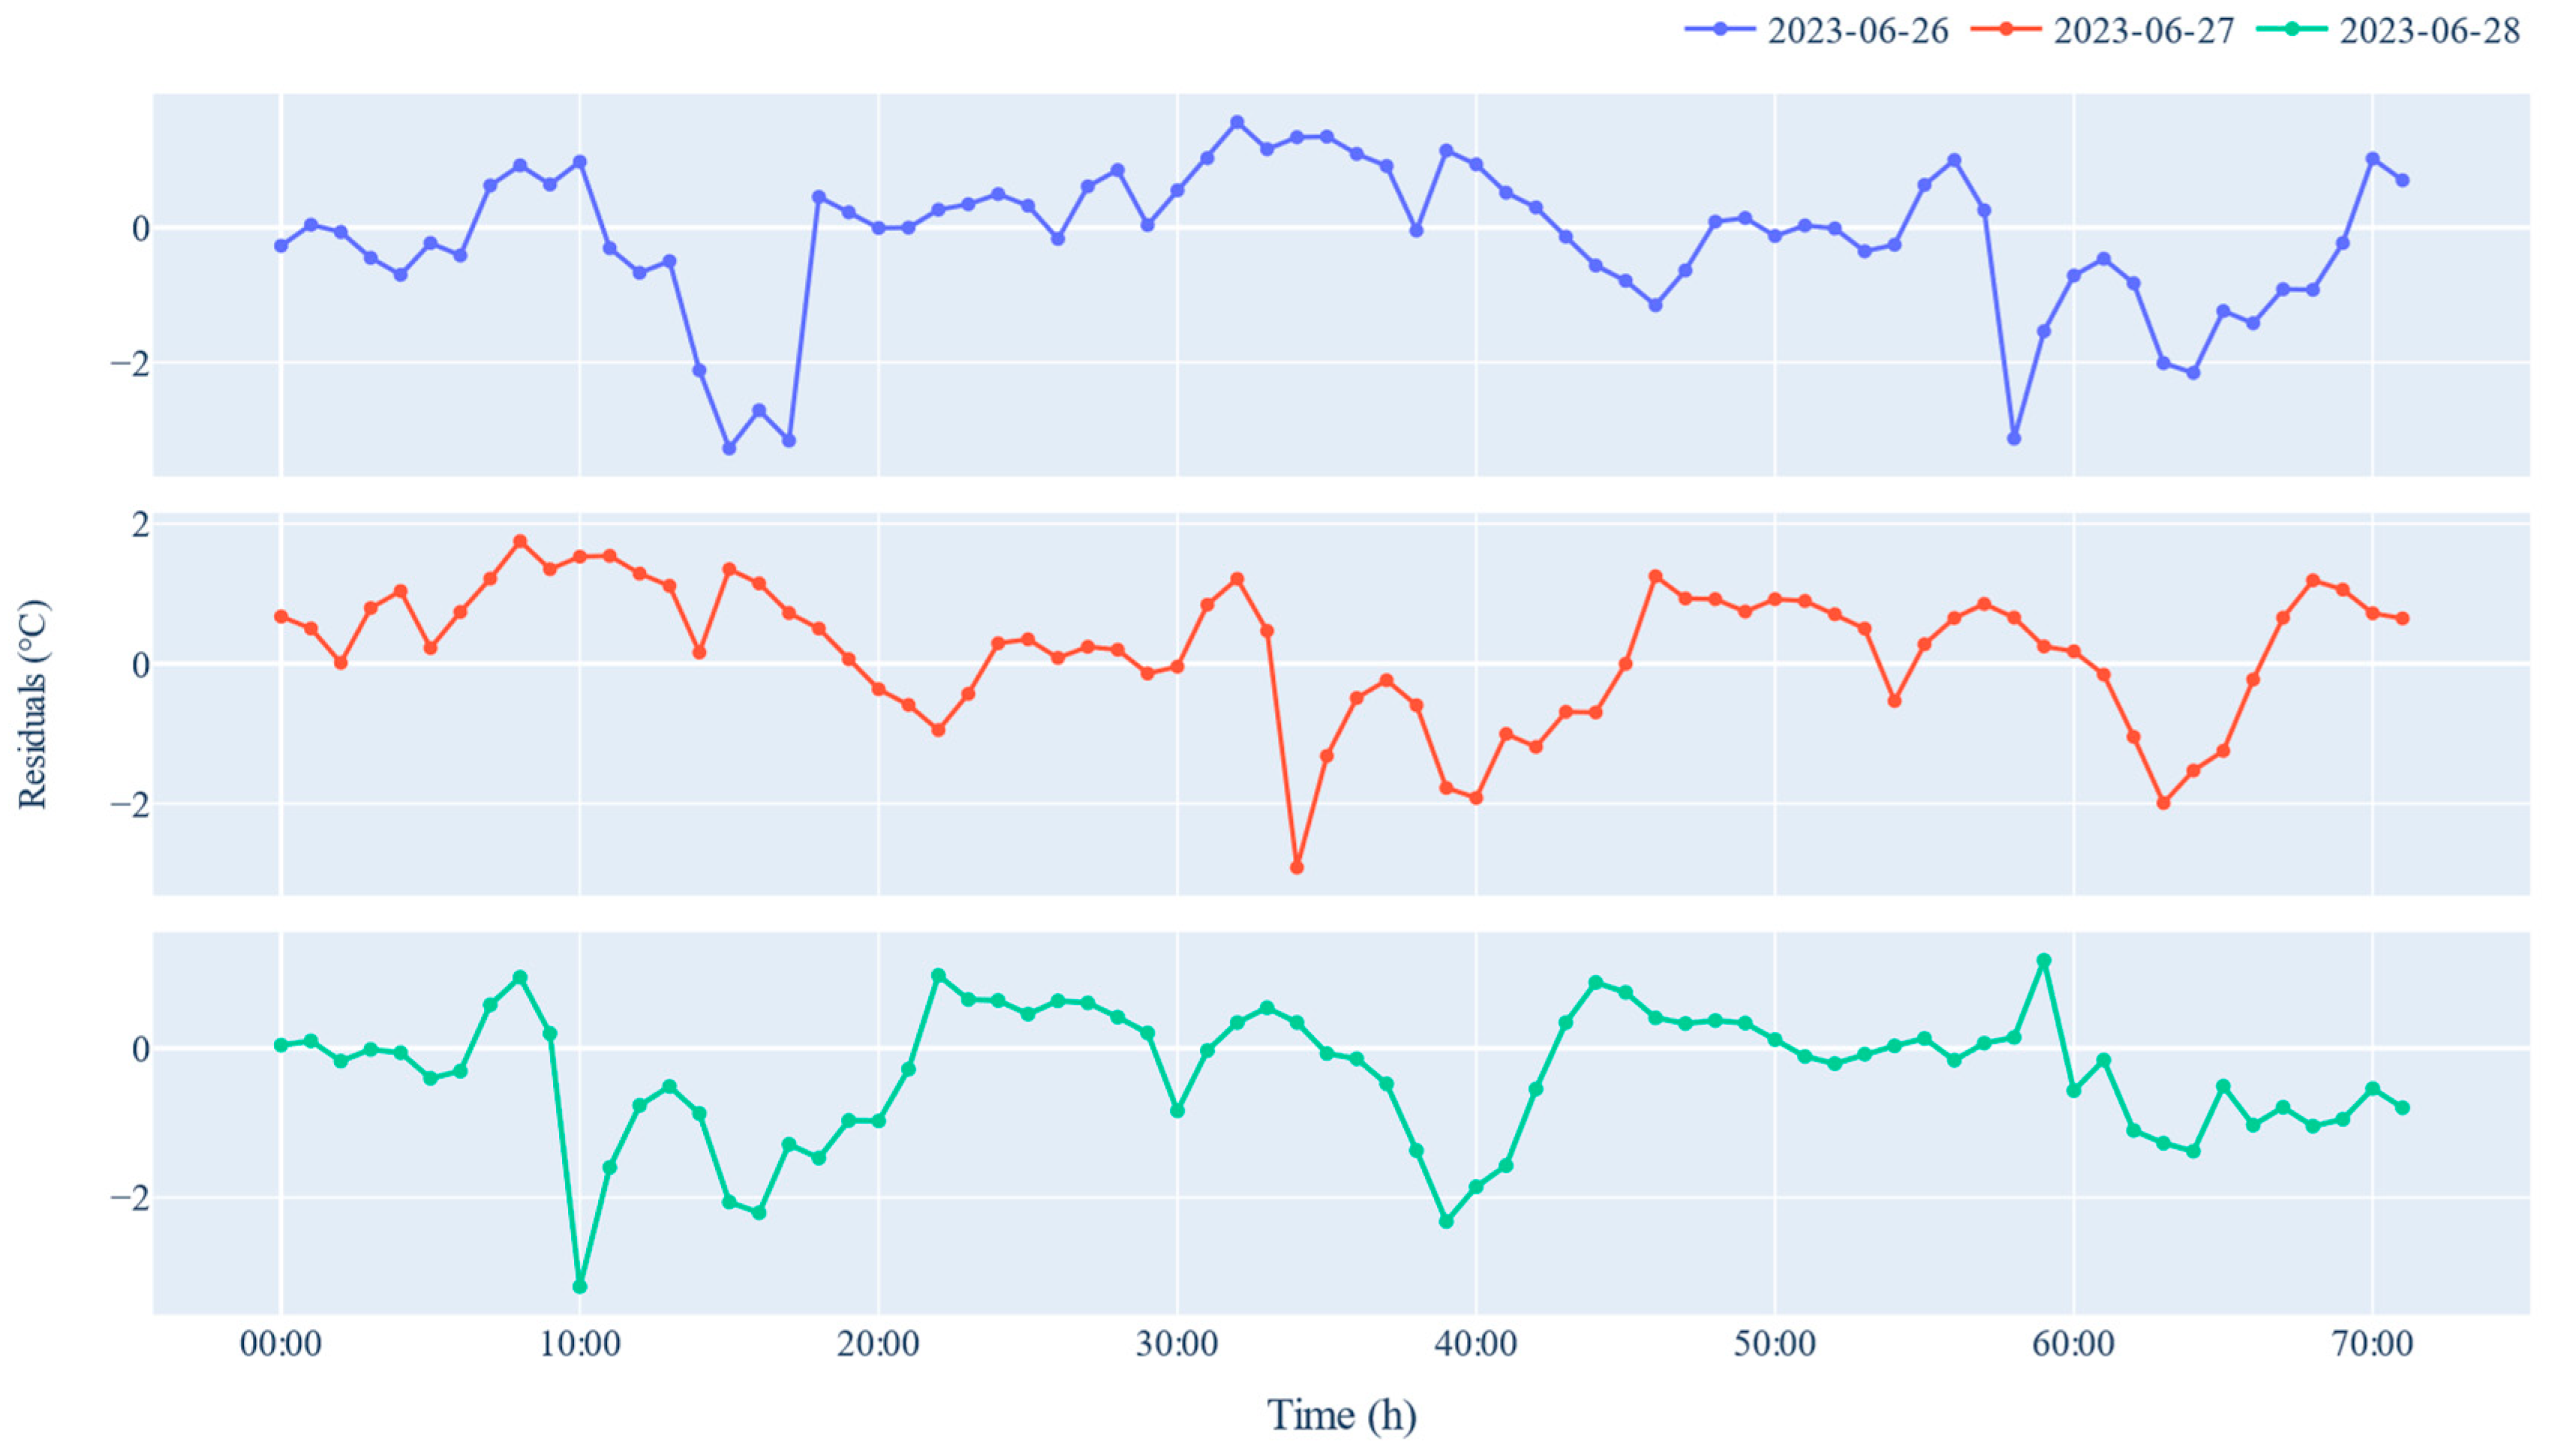
3.4. Residual Analysis and Discussion

It is possible to see that the model overestimates the high temperatures, around 15:00 every day, from the visual inspection of Figure 8. This is one of the requirements of predictive models for this type of performance since it overestimates the high temperatures to tolerate fluctuations in the real values without arriving at heat stress values for the herd. An analysis of the residuals was also performed to examine in detail the differences between the estimated values and the actual values. In this case, Figure 9 plots the residual corresponding to the three predictions on the same abscissa axis. It should be noted that, as mentioned above, the largest differences are of negative sign, where the model overestimates the high temperatures. Once again, the acceptable behavior of the model for the current application context is confirmed.
Based on the residual analysis, it was possible to quantify the limitations of the model defined, and consequently, refinements were considered to further enhance it. The main limitations of the model lie in the length of the prediction horizon, which cannot be extended according to the formulation proposed, and the selection of one single variable, i.e., temperature, among the various environmental parameters characterizing the condition of animal welfare of dairy cows. This involved exploring the incorporation of additional relevant variables, addressing non-linear relationships, and optimizing parameter estimates to align the model more closely with observed temperature patterns. In general terms, residual analysis serves as a pivotal component in the validation and refinement process of the predictive model. The insights gained from this analysis indeed not only contribute to the model’s current accuracy but also guide future iterations for continual improvement in forecasting precision within the dynamic environment of livestock management. According to Hempel et al. [26], the precision of microclimate measurements within buildings can vary significantly due to the heterogeneous dispersion of heat and humidity sources. These sources can be attributed to the operation of equipment, turbulence in airflow, and the diverse comfort zones of the animals. For this reason, the estimation of the internal temperature for different points is another aspect to be considered in the ongoing studies. To achieve this, it may be necessary to use multi-output predictive models or to fit multiple Prophets models according to the internal sampling points. In reference [26], an analysis was conducted to determine the most representative sensor positions. This was done to accurately reflect the behavior of internal environmental variables, while considering the building geometrical and constructive characteristics. The monitoring points, as suggested by [23], must ensure precision and representativeness in assessing either the entire building or targeted problem areas, such as emissions or zones occupied by animals.
The incorporation of forecasts provided by Open-Meteo adds an input not considered in previous works, e.g., Ref. [24], where all variable estimates are based on historical data. This is relevant in the current environmental context, where the average temperature of the planet is increasing every year, and unrecorded meteorological events are taking place. However, these outliers can be labeled as holidays in the fine-tuning of the Prophet model, which could improve the prediction of environmental parameters compared to linear models, as referenced in [21]. The preference for using a Prophet model in an application context can be attributed to its ability to act as a nonlinear extension of logistic regression, providing improved predictive accuracy. Prophet’s ability to capture complex relationships within datasets allows it to outperform traditional logistic regression models in multiple domains. This superiority in predictive performance has been consistently demonstrated in studies by [26,27], consolidating the widespread adoption of ANNs in data analytics applications. Compared to this previous work, where the MAE of the prediction based on the external state of the air outside the stable was between 0.93 and 0.96, lower values of MAE in the range of 0.5–0.7 for calculating internal temperature were achieved in our present study. According to [21], temperature data errors up to ±2 °C and air humidity errors up to ±20% were related to instrument accuracy and the spatial placement of sensors. The forecast accuracy of the present study to predict the indoor temperature based on external environmental forecasts are within the above-defined tolerance range, if the retraining intervals are respected.
When modeling, it is crucial to account for the possibility of significant differences between the microclimate of a particular area and large-scale weather forecasts [28]. These differences can be caused by several factors, such as topography, altitude, proximity to bodies of water and geographical location. Extending the present work to other livestock surveys, of the same type, could also include information of spatial and temporal microclimatic data that can improve the accuracy of microclimatic predictions.
In their study, Gardner et al. [29] highlighted a common behavior in many predictive models of indoor parameters where physiological variables are neglected. This can be considered a limitation of this research model, although these variables are often not fully available in commercia farms, including the studied case. However, there has been other research that has filled this gap by including physiological indicators and milk production as variables in the models. Nevertheless, the literature [30,31,32] has consistently demonstrated the correlation between temperature–humidity index (THI) and various aspects of dairy cow welfare, behavior, and milk yield.
As noted by Maclean et al. [33], certain aspects of predictive models of environmental parameters still have shortcomings, despite their extensive historical use in environmental studies and relatively high predictive accuracy of around 90%. These limitations are partly due to the constraints under which they have been tested, which often do not capture the full range of influencing factors. When modeling, it is crucial to recognize that the microclimate of a specific area can deviate significantly from large-scale average weather predictions, as highlighted by Bramer et al. [28]. This discrepancy is due to a variety of factors, including landscape morphology, elevation, proximity to water bodies, topographic features such as valleys or hills, and the composition of ground vegetation. To address these complexities, the integration of detailed spatial and temporal data on microclimatic conditions is essential, and it can be obtained through remote sensing techniques, as exemplified by Zellweger et al. [34], or direct monitoring outside of buildings, as demonstrated in our present study. Such data collection methods allow the development of more accurate and realistic predictions of microclimatic conditions, thereby facilitating a deeper understanding of biotic responses to variations in weather patterns.

4. Conclusions

This study developed a predictive model of the indoor temperature in a dairy cattle barn. This model serves as a versatile tool that allows stakeholders to make strategic decisions regarding herd management. By accurately predicting indoor temperature fluctuations, this model provides valuable insight into the environmental conditions experienced by the herd, facilitating proactive adjustments to ensure optimal animal welfare in terms of temperature range.
One of the main advantages of using the black box model is that no prior knowledge of the system is required, but at the same time, this feature limits the performance of this type of model to the characteristics of the data used for training. In addition, the predictive model also plays a key role in improving the effectiveness of model-based control strategies for ventilation systems. By dynamically adjusting ventilation parameters based on predicted temperature trends, the model allows energy use to be optimized while maintaining comfortable indoor conditions for the herd. Integrating this predictive model into operational practices not only streamlines management workflows, but also promotes a proactive approach to environmental control within dairy facilities.
The workflow outlined in this paper provides then a practical framework that can be implemented easily during a production phase. This involves deploying the trained machine learning model on a local server infrastructure equipped with the capability to generate specialized visualizations tailored to specific needs and requirements. This approach allows stakeholders to seamlessly integrate the predictive capabilities of the model into their operational processes, facilitating informed decision making and improving overall efficiency.

Author Contributions

Conceptualization, S.B., M.B., D.T. and P.T.; methodology, S.B. and C.A.P.G.; software, C.A.P.G.; validation, S.B., M.B. and C.A.P.G.; formal analysis, C.A.P.G.; investigation, S.B. and M.B.; resources, D.T.; data curation, C.A.P.G.; writing—original draft preparation, C.A.P.G. and S.B.; writing—review and editing, D.T.; visualization, S.B. and M.B.; supervision, P.T.; project administration, D.T.; funding acquisition, P.T. All authors have read and agreed to the published version of the manuscript.

Funding

This study was carried out within the Agritech National Research Center and received funding from the European Union Next-GenerationEU (PIANO NAZIONALE DI RIPRESA E RESILIENZA (PNRR)—MISSIONE 4 COMPONENTE 2, INVESTIMENTO 1.4—D.D. 1032 17 June 2022, CN00000022). This manuscript reflects only the authors’ views and opinions; neither the European Union nor the European Commission can be considered responsible for them.

Institutional Review Board Statement

Not applicable.

Data Availability Statement

Restrictions apply to the availability of these data. Data were obtained from Piazzi Farm and are available from the authors with the permission of Piazzi Farm.

Acknowledgments

The authors wish to thank the farm Azienda Agricola Piazzi of Budrio, Bologna (Italy), for the availability and collaboration during the survey and the activities.

Conflicts of Interest

The authors declare no conflicts of interest. The funders had no role in the design of the study; in the collection, analyses, or interpretation of data; in the writing of the manuscript; or in the decision to publish the results.

References

  1. Lovarelli, D.; Bacenetti, J.; Guarino, M. A Review on Dairy Cattle Farming: Is Precision Livestock Farming the Compromise for an Environmental, Economic and Social Sustainable Production? J. Clean. Prod. 2020, 262, 121409. [Google Scholar] [CrossRef]
  2. Tullo, E.; Finzi, A.; Guarino, M. Review: Environmental Impact of Livestock Farming and Precision Livestock Farming as a Mitigation Strategy. Sci. Total Environ. 2019, 650, 2751–2760. [Google Scholar] [CrossRef] [PubMed]
  3. García, R.; Aguilar, J.; Toro, M.; Pinto, A.; Rodríguez, P. A Systematic Literature Review on the Use of Machine Learning in Precision Livestock Farming. Comput. Electron. Agric. 2020, 179, 105826. [Google Scholar] [CrossRef]
  4. Berckmans, D. General Introduction to Precision Livestock Farming. Anim. Front. 2017, 7, 6–11. [Google Scholar] [CrossRef]
  5. van Erp-van der Kooij, E. Using Precision Farming to Improve Animal Welfare. CAB Rev. Perspect. Agric. Vet. Sci. Nutr. Nat. Resour. 2020, 15. [Google Scholar] [CrossRef]
  6. Norton, T.; Berckmans, D. Engineering Advances in Precision Livestock Farming. Biosyst. Eng. 2018, 173, 1–3. [Google Scholar] [CrossRef]
  7. Banhazi, T.M.; Lehr, H.; Black, J.L.; Crabtree, H.; Schofield, P.; Tscharke, M.; Berckmans, D. Precision Livestock Farming: An International Review of Scientific and Commercial Aspects. Int. J. Agric. Biol. Eng. 2012, 5, 1–9. [Google Scholar] [CrossRef]
  8. Farooq, M.S.; Riaz, S.; Abid, A.; Abid, K.; Naeem, M.A. A Survey on the Role of IoT in Agriculture for the Implementation of Smart Farming. IEEE Access 2019, 7, 156237–156271. [Google Scholar] [CrossRef]
  9. Norton, T.; Chen, C.; Larsen, M.L.V.; Berckmans, D. Review: Precision Livestock Farming: Building ‘Digital Representations’ to Bring the Animals Closer to the Farmer. Animal 2019, 13, 3009–3017. [Google Scholar] [CrossRef]
  10. Cockburn, M. Review: Application and Prospective Discussion of Machine Learning for the Management of Dairy Farms. Animals 2020, 10, 1690. [Google Scholar] [CrossRef] [PubMed]
  11. Santolini, E.; Pulvirenti, B.; Guidorzi, P.; Bovo, M.; Torreggiani, D.; Tassinari, P. Analysis of the Effects of Shading Screens on the Microclimate of Greenhouses and Glass Facade Buildings. Build. Environ. 2022, 211, 108691. [Google Scholar] [CrossRef]
  12. Barbaresi, A.; Bovo, M.; Torreggiani, D. The Dual Influence of the Envelope on the Thermal Performance of Conditioned and Unconditioned Buildings. Sustain. Cities Soc. 2020, 61, 102298. [Google Scholar] [CrossRef]
  13. Strpić, K.; Barbaresi, A.; Tinti, F.; Bovo, M.; Benni, S.; Torreggiani, D.; Macini, P.; Tassinari, P. Application of Ground Heat Exchangers in Cow Barns to Enhance Milk Cooling and Water Heating and Storage. Energy Build. 2020, 224, 110213. [Google Scholar] [CrossRef]
  14. De Coninck, R.; Magnusson, F.; Åkesson, J.; Helsen, L. Toolbox for Development and Validation of Grey-Box Building Models for Forecasting and Control. J. Build. Perform. Simul. 2016, 9, 288–303. [Google Scholar] [CrossRef]
  15. Ferracuti, F.; Fonti, A.; Ciabattoni, L.; Pizzuti, S.; Arteconi, A.; Helsen, L.; Comodi, G. Data-Driven Models for Short-Term Thermal Behavior Prediction in Real Buildings. Appl. Energy 2017, 204, 1375–1387. [Google Scholar] [CrossRef]
  16. Grassi, B.; Piana, E.A.; Lezzi, A.M.; Pilotelli, M. A Review of Recent Literature on Systems and Methods for the Control of Thermal Comfort in Buildings. Appl. Sci. 2022, 12, 5473. [Google Scholar] [CrossRef]
  17. Wang, Z.; Chen, Y. Data-Driven Modeling of Building Thermal Dynamics: Methodology and State of the Art. Energy Build. 2019, 203, 109405. [Google Scholar] [CrossRef]
  18. Taylor, S.J.; Letham, B. Forecasting at Scale. PeerJ Prepr. 2017, 5. [Google Scholar] [CrossRef]
  19. Janke, D.; Bornwin, M.; Amon, T.; Amon, B.; Coorevits, K.; Overbeke, P.V.; Declerck, A.; Demeyer, P. Development and Validation of a Low-Cost Online Monitoring Tool to Manage Barn Climate and Emissions from Livestock Housing Systems. VDI Berichte 2022, 2022, 203–210. [Google Scholar] [CrossRef]
  20. Bovo, M.; Benni, S.; Barbaresi, A.; Santolini, E.; Agrusti, M.; Torreggiani, D.; Tassinari, P. A Smart Monitoring System for a Future Smarter Dairy Farming. In Proceedings of the 2020 IEEE International Workshop on Metrology for Agriculture and Forestry, MetroAgriFor 2020—Proceedings, Trento, Italy, 4–6 November 2020. [Google Scholar]
  21. Mylostyvyi, R.; Izhboldina, O.; Chernenko, O.; Khramkova, O.; Kapshuk, N.; Hoffmann, G. Microclimate Modeling in Naturally Ventilated Dairy Barns during the Hot Season: Checking the Accuracy of Forecasts. J. Therm. Biol. 2020, 93, 102720. [Google Scholar] [CrossRef]
  22. Herbut, P.; Angrecka, S.; Walczak, J. Environmental Parameters to Assessing of Heat Stress in Dairy Cattle—A Review. Int. J. Biometeorol. 2018, 62, 2089–2097. [Google Scholar] [CrossRef]
  23. Ji, B.; Banhazi, T.; Phillips, C.J.C.; Wang, C.; Li, B. A Machine Learning Framework to Predict the next Month’s Daily Milk Yield, Milk Composition and Milking Frequency for Cows in a Robotic Dairy Farm. Biosyst. Eng. 2022, 216, 186–197. [Google Scholar] [CrossRef]
  24. Gautam, K.R.; Zhang, G.; Landwehr, N.; Adolphs, J. Machine Learning for Improvement of Thermal Conditions inside a Hybrid Ventilated Animal Building. Comput. Electron. Agric. 2021, 187, 106259. [Google Scholar] [CrossRef]
  25. Open-Meteo. Available online: https://open-meteo.com/ (accessed on 9 January 2024).
  26. Hempel, S.; König, M.; Menz, C.; Janke, D.; Amon, B.; Banhazi, T.M.; Estellés, F.; Amon, T. Uncertainty in the Measurement of Indoor Temperature and Humidity in Naturally Ventilated Dairy Buildings as Influenced by Measurement Technique and Data Variability. Biosyst. Eng. 2018, 166, 58–75. [Google Scholar] [CrossRef]
  27. Matsoukis, A.; Chronopoulos, K. Estimating Inside Air Temperature of a Glasshouse Using Statistical Models. Curr. World Environ. 2017, 12. [Google Scholar] [CrossRef]
  28. Bramer, I.; Anderson, B.J.; Bennie, J.; Bladon, A.J.; De Frenne, P.; Hemming, D.; Hill, R.A.; Kearney, M.R.; Körner, C.; Korstjens, A.H.; et al. Advances in Monitoring and Modelling Climate at Ecologically Relevant Scales. Adv. Ecol. Res. 2018, 58, 101–161. [Google Scholar] [CrossRef]
  29. Gardner, A.S.; Maclean, I.M.D.; Gaston, K.J. Climatic Predictors of Species Distributions Neglect Biophysiologically Meaningful Variables. Divers. Distrib. 2019, 25, 1318–1333. [Google Scholar] [CrossRef]
  30. Bohmanova, J.; Misztal, I.; Cole, J.B. Temperature-Humidity Indices as Indicators of Milk Production Losses Due to Heat Stress. J. Dairy Sci. 2007, 90, 1947–1956. [Google Scholar] [CrossRef]
  31. Allen, J.D.; Hall, L.W.; Collier, R.J.; Smith, J.F. Effect of Core Body Temperature, Time of Day, and Climate Conditions on Behavioral Patterns of Lactating Dairy Cows Experiencing Mild to Moderate Heat Stress. J. Dairy Sci. 2015, 98, 118–127. [Google Scholar] [CrossRef]
  32. Herbut, P. Temperature, Humidity and Air Movement Variations inside a Free-Stall Barn during Heavy Frost. Ann. Anim. Sci. 2013, 13, 587–596. [Google Scholar] [CrossRef]
  33. Maclean, I.M.D.; Mosedale, J.R.; Bennie, J.J. Microclima: An r Package for Modelling Meso- and Microclimate. Methods Ecol. Evol. 2019, 10, 280–290. [Google Scholar] [CrossRef]
  34. Zellweger, F.; De Frenne, P.; Lenoir, J.; Rocchini, D.; Coomes, D. Advances in Microclimate Ecology Arising from Remote Sensing. Trends Ecol. Evol. 2019, 34, 327–341. [Google Scholar] [CrossRef] [PubMed]
Figure 1. Three-dimensional view of the case study farm.
Agriculture 14 00316 g001
Figure 2. Plan view of the sensor position.
Agriculture 14 00316 g002
Figure 3. Data cleaning workflow.
Agriculture 14 00316 g003
Figure 4. Local weather station vs. Open-Meteo data.
Agriculture 14 00316 g004
Figure 5. Linear correlation between the local weather station and Open-Meteo data.
Agriculture 14 00316 g005
Figure 6. Model description and data structure.
Agriculture 14 00316 g006
Figure 7. Model input variables.
Agriculture 14 00316 g007
Figure 8. Indoor temperature predictions from the model.
Agriculture 14 00316 g008
Figure 9. Residuals analysis for rolling windows prediction.
Agriculture 14 00316 g009
Table 1. Features of the weather station sensors used as a base line.
Sensor ModelData OutputResolutionAccuracy RangeUnit
HTU21D(F) RH/TTemperature0.04±0.3−40~+125°C
Relative Humidity0.04±20~100%
BMP280Atmospheric pressure0.01±1300~1100hPa
Table 2. Results of the correlation analysis between local weather station and Open-Meteo data.
VariablesCorrelation Coefficientp-Values
Ambient Temperature0.95 < 0.05
Relative Humidity0.88 < 0.05
Atmospheric Air Pressure0.91 < 0.05
Table 3. Seasonal timeline in Italy.
SeasonsStartEnd
Spring21 March20 June
Summer21 June20 September
Fall21 September20 December
Winter21 December20 March
Table 4. Main metrics of the model predictions.
DateMAE (°C)RMSE (°C)R-SquaredMAPE
13 June 20230.6840.8570.9592.62
16 June 20230.5030.6560.9721.71
19 June 20230.6680.9220.9312.39
22 June 20230.7301.0850.9432.55
Disclaimer/Publisher’s Note: The statements, opinions and data contained in all publications are solely those of the individual author(s) and contributor(s) and not of MDPI and/or the editor(s). MDPI and/or the editor(s) disclaim responsibility for any injury to people or property resulting from any ideas, methods, instructions or products referred to in the content.

