Article

Effect of Ultraviolet B Radiation on the Biosynthesis of Carotenoids in Foxtail Millet Grains

1
College of Agriculture, Shanxi Agricultural University, Jinzhong 030801, China
2
Shanxi Key Laboratory of Minor Crops Germplasm Innovation and Molecular Breeding, Shanxi Agricultural University, Jinzhong 030801, China
3
Center for Agricultural Genetic Resources Research, Shanxi Agricultural University, Taiyuan 030031, China
*
Author to whom correspondence should be addressed.
These authors contributed equally to this work.
Agriculture 2024, 14(2), 289; https://doi.org/10.3390/agriculture14020289
Submission received: 10 January 2024 / Revised: 7 February 2024 / Accepted: 7 February 2024 / Published: 10 February 2024
(This article belongs to the Section Crop Genetics, Genomics and Breeding)

Abstract

:
Foxtail millet is a vital nutritional cereal. The de-husked grain is usually yellow and mainly contains carotenoids, which directly reflects the millet quality. In this study, the impact of ultraviolet-B(UV-B) on millet color and carotenoid content was determined using two foxtail millet varieties, HuaJinZao (HJZ) and Qinhuang 2 (QH). The b* value at different stages of grain development and the content of carotenoids (primarily lutein and zeaxanthin) in foxtail millet grains decreased when the plants were exposed to low UV-B intensity. A total of 3113 and 96 differentially expressed genes were identified in HJZ and QH, respectively, and were found to be associated with the metabolism of tryptophan, starch, and sucrose as well as the biosynthesis of amino acids, which was relatively consistent with the functional annotation of differential metabolites. Furthermore, we evaluated the changes in the expression of seven and eight genes associated with carotenoid and starch metabolism, respectively, in the kernels of foxtail millet exposed to UV-B and found that appropriate UV-B intensity could promote the expression levels of genes involved in carotenoid synthesis and repress the expression of genes involved in carotenoid degradation. This study lays a theoretical foundation for cultivating new foxtail millet varieties with high carotenoid content.

1. Introduction

Natural light plays a significant role in the life cycle of plants, exerting a huge influence on many morphological, physiological, and other developmental processes. Among the different wavelengths of light entering the Earth’s atmosphere, ultraviolet (UV) radiation is one of the most determining environmental factors. The UV radiation (100–400 nm) can be divided into the following three bands based on the wavelength: (1) UV-C (100–280 nm), (2) UV-B (280–315 nm), and (3) UV-A (315–400 nm). UV-B has received huge attention from the scientific community because the thinning of the ozone layer increases the content of UV-B in the biosphere, hence increasing the possibility of harmful effects [1]. The intensity of UV-B depends on the solar angle and the thickness of the stratospheric ozone layer and is mainly dictated by latitude and elevation [2].
Although UV-B radiation constitutes only a minor component of sunlight, it can cause biological damage due to its high energy. Extensive studies have been conducted to reveal the mechanisms of UV-B-induced damage in plants, and it was discovered that plants have evolved effective mechanisms to prevent UV-B-induced damage. For instance, in the presence of UV-B, plants can increase the expression of flavonoid biosynthesis genes [3,4] and accumulate “sunscreen” flavonoids, such as flavonols, anthocyanins, and procyanidins [5]. Furthermore, a few plants can adapt to different climate regions (with different UV-B levels) through epigenetic regulation [6].
In recent years, an increasing number of studies have been conducted to understand the effects of UV-B radiation on different crops and mechanisms present in crops, such as maize, soybean, wheat, and rice, to resist the harmful effects of UV-B. In maize (Zea mays L.), the R2R3-MYB transcription factor P1 regulates the accumulation of flavonoids in floral tissues and the content of several UV-B-absorbing phenolic compounds by activating a few flavonoid biosynthetic genes in leaves for adaptation at high altitudes [6,7]. Furthermore, it was also demonstrated that the levels of P1 DNA methylation change under UV-B induction [6]. In soybeans (Glycine max L.), although an appropriate UV-B dose can induce isoflavones [8] and enhance the defenses against herbivore insects [9], high-intensity UV-B radiation has been shown to substantially aggravate the growth decline of soybean roots, which was mostly associated with flavonoids [10]. In winter wheat (Triticum aestivum L.) seedlings, elevated UV-B radiation has been found to reduce the efficiency of photosystem II (PS-II) photochemistry, with subsequent inhibition of photosynthesis; furthermore, the excess excitation energy could not be dissipated as heat by xanthophyll cycle pigments to achieve photoprotection [11]. UV-B radiation has also been shown to influence the programmed cell death and antioxidant defense systems in the roots and shoots of wheat seedlings [12]. In rice (Oryza sativa L.), the UV-B tolerance was positively correlated with the content of carotenoids, total protein, soluble sugar, proline, ascorbate, and glutathione [13]. In the presence of strong UV-B radiation, the growth of Magnaporthe oryzae was significantly inhibited, decreasing its infectivity, increasing the activities of rice leaf enzymes responsible for disease resistance, and significantly enhancing the resistance response of leaves [13].
Foxtail millet [Setaria italica (L.) Beauv], a self-compatible annual herb that stems from the Yellow River basin in China [14], is a crucial coarse cereal in northern China and is characterized by its ability to adapt to adverse ecological conditions such as drought, poor soil, and high temperatures [15,16]. Foxtail millet after shelling is a nutritious traditional food used in the daily diet in China. Notably, the main components of the yellow pigment found in foxtail millet are carotenoids (lutein and zeaxanthin), and hence the color of the millet is the main factor defining the quality of foxtail millet [17,18]. Carotenoids are famous for their wide range of roles, such as light harvesting, preserving photosystems against UV radiation, and helping plants scavenge reactive oxygen species (ROS) [2,19]. The content of carotenoids increases in the presence of UV-B radiation to protect the photosynthetic apparatus [20]; however, prolonged exposure to UV-B may cause the breakdown of carotenoid pigments and inhibition of their synthesis [21].
The concentrations of carotenoids have been mainly analyzed in fruits and vegetables. Carotenoids are primarily made up of tetraterpenoids and synthesized de novo in virtually all types of plastids [22,23]. The biosynthesis of carotenoids initializes with the synthesis of isopentenyl pyrophosphate (IPP) and dimethylallyl pyrophosphate (DMAPP) via the plastid-localized methylerythritol 4-phosphate (MEP) and cytoplasm-localized mevalonate (MVA) pathways [24,25]. Three IPP units and one DMAPP unit are condensed in reactions catalyzed by geranylgeranyl pyrophosphate (GGPP) synthase to generate GGPP, which is the direct precursor of carotenoid. Subsequently, phytoene synthase (PSY), a major rate-limiting enzyme of carotenoid biosynthesis, catalyzes the condensation of two GGPP molecules to form the first carotenoid, 15-cis-phytoene [23,26,27]. Desaturation and isomerization of 15-cis-phytoene produce all trans-lycopene in reactions catalyzed by phytoene desaturase (PDS), ζ-carotene isomerase (ZISO), ζ-carotene desaturase (ZDS), and carotenoid isomerase (CRTISO) [28]. Subsequently, lycopene ε-cyclase (LCYE) and/or lycopene β-cyclase (LCYB) cyclize all-trans-lycopene, forming symmetric orange β-carotene and α-carotene, and the ratio between the two branches affects the downstream carotenoid production [29]. Lutein and zeaxanthin are produced from α-carotene and β-carotene, respectively, in reactions catalyzed by two non-heme β-ring hydroxylases (BCH1 and BCH2) and two cytochrome P450-type hydroxylases (CYP97A and CYP97C). The instability of carotenoids with conjugated double bonds leads to continuous degradation in cells, sometimes at a high rate, which is often catalyzed by a family of enzymes known as carotenoid cleavage oxygenase (CCO) [30,31,32,33]. In plants, the CCO family includes 9-cis-epoxy carotenoid dioxygenases (NCEDs) as well as carotenoid cleavage dioxygenases (CCDs). Furthermore, CCDs are classified into CCD1, CCD2, CCD4, CCD7, CCD8, CCD10, and zaxinone synthase (ZAS) [34,35,36]. CCOs can dictate the types of apocarotenoid degradation products because of the substrate specificity with which they cleave carotenoids at specific sites.
Although previous studies have been conducted to understand the carotenoid components in foxtail millet, studies addressing the effects of UV-B intensity on millet color are rare. Therefore, this study aimed to elucidate the impact of different UV-B doses (long-term treatment) on two foxtail millet cultivars in terms of carotenoid content and gene expression profile. A profound understanding of the resistance pattern of foxtail millet to UV-B will offer novel insights into the basis for carotenoid biosynthesis in foxtail millet.

2. Materials and Methods

2.1. Plant Materials and Growth Conditions

In this study, two yellow foxtail millet varieties were selected, “HJZ” and “QH”, which were provided by the Shanxi Key Laboratory of Minor Crops Germplasm Innovation and Molecular Breeding at Shanxi Agricultural University. HJZ is the Jingu 21 line, which is a high-yield and high-quality millet variety. After being soaked in water at 4 °C for 36 h, the seeds were planted in the experimental field of Shanxi Agricultural University, Taigu, China (37.42 N, 112.59 E), which has a semiarid climate and an average yearly precipitation of less than 450 mm. The average temperature during the reproductive period is 21 °C, and the relative humidity is 58%. The millet grain filling period was divided into the following five stages: S1 (initial stage, bright green skin, and water emulsion content), S2 (early stage, dark green skin, embryo formation, and emulsion content), S3 (middle stage, yellow-green skin, solidification and separation of embryo, and powdery inclusion), S4 (late stage, dark yellow skin, grain texture hardening, more substantial contents, and difficult to separate embryo and inclusion), and S5 (last stage, deep yellow skin, dry and brittle lemma, and ripe grain).

2.2. UV-B Radiation Treatment and Sample Collection

The plants in the field were treated with KS-60 UV-shielding film to reduce UV intensity (rUV-B) from heading to the maturity stage, and the average intensity was 43.9 μW/cm2. The control group was exposed to natural light, with a UV-B intensity of 133.18 μW/cm2. Maturing grains of stages S3 to S5 and SGAH were gathered and hulled, immediately frozen in liquid nitrogen, and ground into powder for carotenoid extraction and RNA isolation.
The UV-B illuminance meter (UV-B (UV-297), Optoelectronic Instruments of Beijing Normal University) used in this study was produced in Beijing, China, and had a wavelength of 275–330 nm.

2.3. Color Determination and Extraction of Total Carotenoids from Foxtail Millet Grains

The color of de-husked millets was measured using a colorimeter (X-Rite VS450, Big Rapids, MI, USA). The International Commission on Illumination (CIE) L*a*b* chromaticity system was adopted, where L*, a*, and b* refer to brightness, red to green, and yellow to blue, respectively. The positive and negative values for a* are red and green, respectively, whereas the positive and negative values for b* are yellow and blue, respectively. In this study, b* was used as the index determining the color of the samples in an analysis conducted in triplicates [18].
Carotenoids were extracted as per the procedure of the American Association of Cereal Chemists (AACC) [17,37], with marginal modifications. All the extraction steps were carried out in dim light to reduce photo-oxidative reactions to the maximum possible extent. Every freeze-dried and grounded foxtail millet sample was sifted using a 100-mesh sieve to obtain a powder of uniform thickness. After uniform mixing, the powder was transferred to a 10 mL centrifuge tube, dried, and dehydrated in a freeze dryer (Marin Christ (Germany) Alpha 1–4 LDplus) for 48 h at −58 °C. Subsequently, 0.6 g of freeze-dried powder was transferred to a separate 10 mL centrifuge tube containing 6 mL of water-saturated n-butanol with continuous vortexing, and this mixture was incubated for 3 h at room temperature with continuous shaking and later centrifuged at 8000 rpm for 15 min at 4 °C. The absorbance of the resulting supernatant was determined (three times for each sample) at 450 nm (A450) using water-saturated n-butanol as the reference. The total carotenoid content (TCC; mg/kg) was calculated using the following formula: ([A450/0.250] × V[mL]/M [g]), where V(mL) is the volume (mL) of extract used for absorbance measurement and M (g) is the sample mass [38]. During the extraction procedure, tubes were kept wrapped in tinfoil to avoid photo-oxidation of sample constituents.

2.4. Analysis of Lutein and Zeaxanthin Using High-Performance Liquid Chromatography (HPLC)

Lutein and zeaxanthin were quantitatively analyzed using an HPLC system (Ultimate 3000, Thermo Fisher Scientific, Waltham, MA, USA) equipped with a 250 cm × 4.6 mm C30 column having a 5 µm particle size (YMC, Kyoto, Japan). The HPLC was performed at a detection wavelength of 450 nm, a column temperature of 35 °C, and a flow rate of 1 mL/min. The mobile phase A contained methanol, methyl tertiary butyl ether (MTBE), and HPLC-grade water in the ratio of 81:15:4 (v:v:v), whereas the mobile phase B was prepared by mixing MTBE and methanol in a 90:10 ratio (v:v). Furthermore, the mobile phase B was changed from 0% to 22.2% in 0–20 min, 22.2% to 0% in 20–25 min, and to 0% in 25–30 min. The retention time of lutein and zeaxanthin was approximately 10 min and 11 min, respectively, as previously reported [17]. HPLC-based quantitative analysis of each sample was performed with three biological replicates.

2.5. Transcriptome Sequencing and Data Analysis

Both foxtail millet varieties (from the S4 stage) treated under control (CK) or rUV-B conditions were used to extract total RNA (three replicates from each treatment group), and subsequently, the assessment of RNA quality and determination of RNA concentrations were achieved using 1% agarose electrophoresis and a NanoPhotometer® spectrophotometer (IMPLEN, Westlake Village, CA, USA). Qualified RNA was used to prepare the library by Novogene Bioinformatic Company, Beijing, China. Different libraries were then pooled based on the effective concentration and target offline data volume for Illumina sequencing. Sequencing results were first processed for data quality control, and the filtered clean reads were mapped to the Foxtail Millet reference genome available at https://phytozome-next.jgi.doe.gov/ (accessed on 6 April 2023).
The gene function was annotated based on the following databases: NCBI non-redundant protein sequences (Nr); NCBI non-redundant nucleotide sequences (Nt); Protein family (Pfam); Clusters of Orthologous Groups of Proteins (KOG/COG); a manually annotated and reviewed protein sequence database (Swiss-Prot); KEGG Ortholog (KO); and Gene Ontology (GO). The fragment per kilobase per million (FPKM) value was used to normalize the expression level of each gene. The differential expression analysis of two conditions/groups was performed using the DESeq2 R package (1.20.0) [39]. DESeq2 provides a statistical method for determining differential expression in digital gene expression data using a model based on a negative binomial distribution. The resulting p-values were adjusted using the Benjamini–Hochberg approach for controlling the false discovery rate. Genes with an adjusted |log2FoldChange| > 1 and FDR < 0.05 detected by DESeq2 were assigned as DEGs. GO enrichment analysis of DEGs was performed using the Cluster Profiler R package, in which gene length bias was corrected. We used the Cluster Profiler R package to test the statistical enrichment of DEGs in the KEGG (Kyoto Encyclopedia of Genes and Genomes) pathways.
The FPKM values of key genes involved in the carotenoid biosynthesis pathway at the S4 stage of grain development in HJZ and QH under CK and rUV-B treatment were obtained. Furthermore, the cluster heat maps of DEGs were prepared using TBtools [40].

2.6. RNA Extraction and qRT-PCR Assay

Using total RNA samples isolated from millet grains at different filling stages, the cDNA was synthesized in a reaction consisting of an RNA template (1 µg), 5X PrimeScript buffer 2 (4 μL), RT Primer Mix (1 μL), and PrimeScript RT Enzyme Mix I (1 μL; RR047Q, Takara). Prime 5.0 software was used to design primers for this experiment, and the specificity of these primers was evaluated using the BLAST analysis (Supplementary Table S6). SYBR Premix Ex TaqTM II (Tli RNaseH Plus, Takara, Baobioengineering (Dalian) Co., Ltd, Dalian, China) was used to perform qRT-PCR, and the reaction mixture consisted of SYBR Premix Ex Taq II (5 μL), each primer (0.5 μL; 10 μM), cDNA (1 μL; 5X diluted), and distilled water (3 μL). qRT-PCR was performed using the following conditions: initiation at 95 °C for 30 s and 40 cycles at 95 °C for 5 s and 55 °C for 30 s. Melting curves were constructed by gradual heating from 60 °C to 95 °C, with an increase of 0.5 °C and 5 s of holding time per step. The qRT-PCR assays were conducted by real-time PCR equipment (CFX-96, Bio-Rad, Hercules, CA, USA) in three biological replicates, and each biological replicate was performed in three technical replicates. The expression levels of the target genes were normalized against SiActin and calculated using the 2−ΔΔ CT method [41].

2.7. Swiss-Prot, GO, and KEGG Pathway Annotations

We used the following online tools to perform annotation analysis: (1) the UniProtKB/Swiss-Prot database (http://www.uniprot.org/ (accessed on 6 April 2023)), (2) the GO database (http://geneontology.org/ (accessed on 6 April 2023)), and (3) the KEGG database (http://www.kegg.jp/kegg/ko.html (accessed on 6 April 2023)). The KEGG and GO annotations of DEGs were further performed using the GOseq (https://bioconductor.org/packages/release/bioc/html/goseq.html (accessed on 6 April 2023)) and KOBAS (2.0) software, respectively [42].

2.8. Statistical Analysis

Experiments were conducted in three biological replicates, and each biological replicate was performed in three technical replicates. Significant differences were determined using GraphPad Prism7 software (* represents p < 0.05; ** represents p < 0.01).

3. Results

3.1. Low-Intensity UV-B Lightened the Millet Color

Millet grains (S3–S5 stages) treated under CK and rUV-B were first shelled to measure the millet color. The b* value of grains in these stages and exposed to rUV-B was significantly lower than that of grains exposed to CK (Table 1). The L* value of grains in the S3 stage (both varieties) was higher than that of grains in other stages. Furthermore, the L* value of QH millets exposed to rUV-B was significantly lower at the S3 and SGAH stages. Although all a* values were found to be positive, a* values of HJZ millets at the S3 stage and QH millets at the S4 stage exposed to rUV-B were significantly lower than those exposed to CK. During the transition from S3 to the S4 stage, the values of L* and a* changed greatly, but they tended to stabilize in the subsequent period. Although both millet varieties showed positive b* values, HJZ (S3 and S4) and QH (S3, S5, and the grain stage after harvest-SGAH) showed significant differences in b* values between exposures to CK and rUV-B. All these results were in accordance with the visual observation.

3.2. Low Doses of UV-B Reduced the Carotenoid Content of Millet

The content of total carotenoid (TCC) of both millet varieties at S3–S5 and SGAH stages exposed to rUV-B was lower than that of millets exposed to CK (Table 2). When exposed to rUV-B, the TCC of HJZ millets decreased less sharply (21.75 mg/kg at S3 stage to 11.99 mg/kg at SGAH) than that of HJZ millets exposed to CK (27.87 mg/kg at S3 stage to 12.66 mg/kg at SGAH). The TCC of QH millets showed a slight increase during the maturation stages (S3–S5) and subsequently decreased after harvest.
Changes in lutein concentration (LC) followed a pattern similar to that of TCC, with UV-B exposure considerably reducing the lutein content during multiple grain development stages (Table 2). Furthermore, the levels of zeaxanthin (ZC) showed a trend with increasing concentrations at the grain maturity stage; however, the change range of both lutein and zeaxanthin levels was relatively small during the maturation stage of grains exposed to CK and rUV-B. Overall, the proportion of lutein and zeaxanthin in TCC increased gradually during grain development, reaching a maximum in the range of 88.04–96.44% at the SGAH stage.

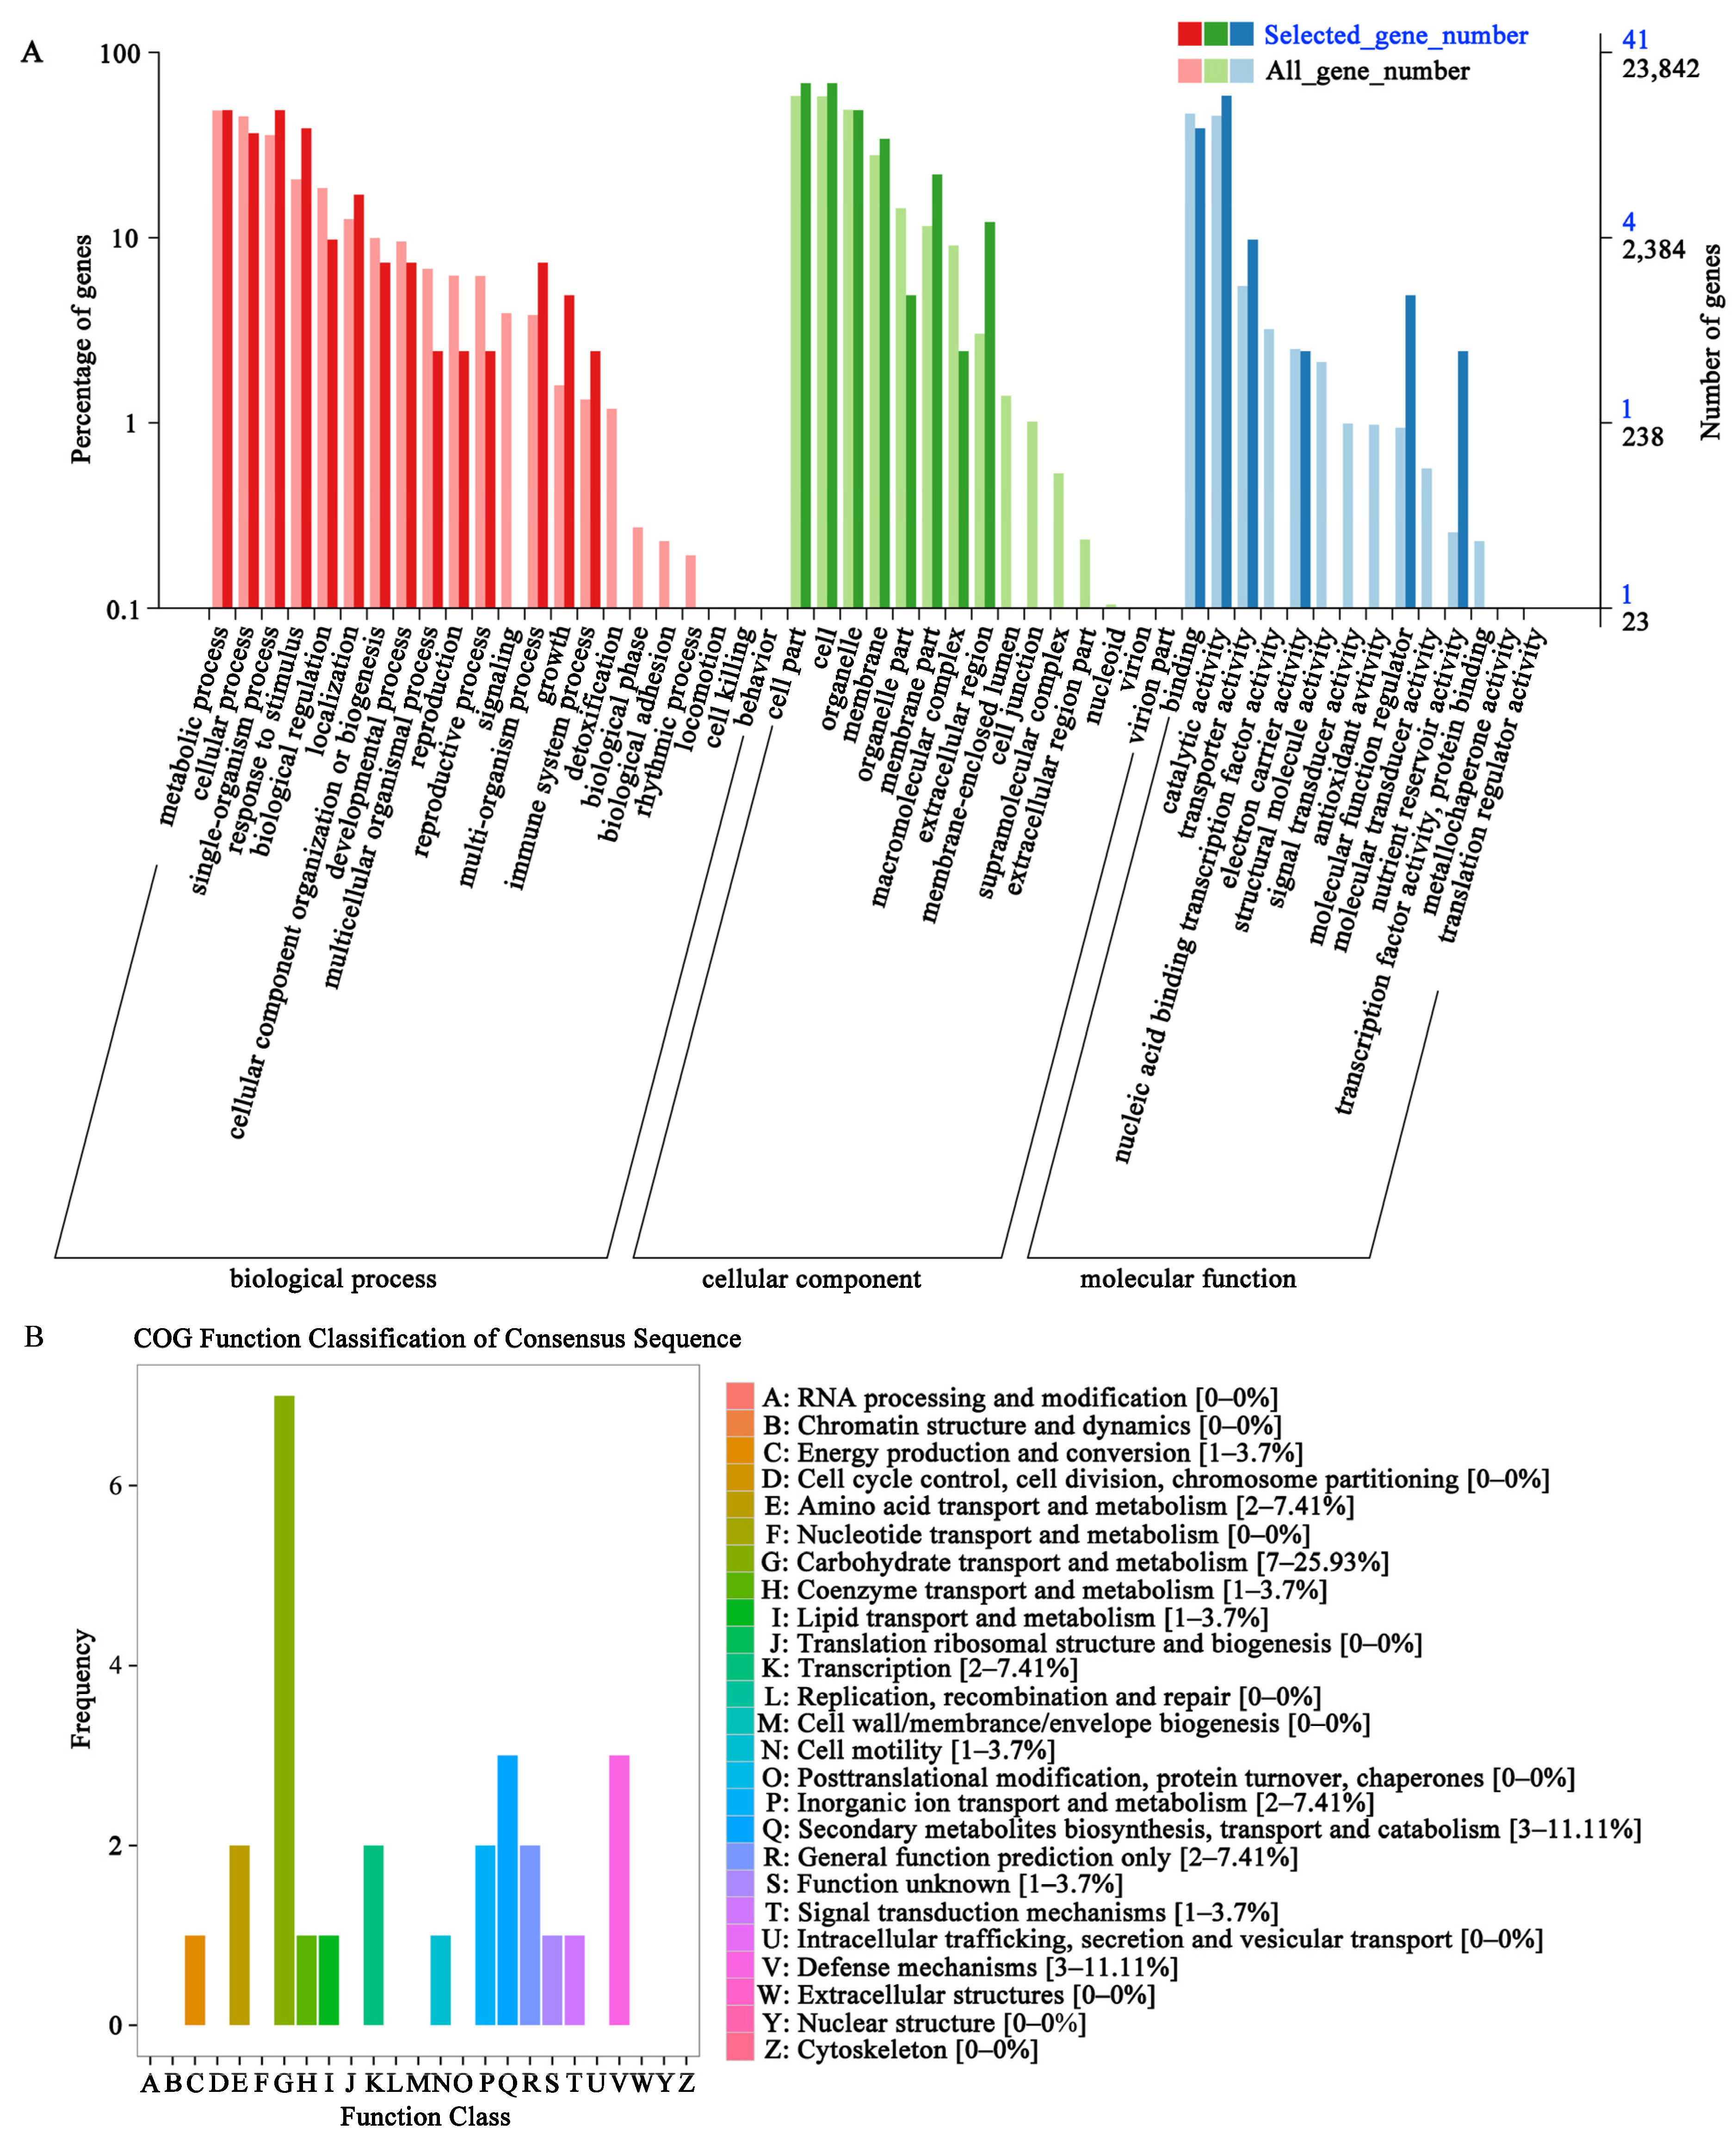
3.3. Transcriptome Analysis of Foxtail Millet Exposed to the Different UV-B Radiation Intensity

A total of 89.72 Gb clean reads with a Q30 of ≥94.35% were obtained and mapped to the foxtail millet reference genome sequence (Supplemental Table S1). When the gene expression levels in HJZ and QH varieties exposed to CK were compared to those of HJZ and QH varieties exposed to rUV-B, 3113 and 97 differentially expressed genes (DEGs) were identified in HJZ and QH millets, respectively (Figure 1A). Among DEGs, HJZ millets contained 1775 (57.02%), and 1338 (42.98%) up-regulated and down-regulated genes, respectively. Furthermore, among DEGs, QH contained 46 (47.92%) and 50 (52.08%) up-regulated and down-regulated genes, respectively. In addition, both HJZ and QH millets contained 53 DEGs, including 15 up-regulated, 2 down-regulated genes, and 36 up- or down-regulated genes.
Figure 1B,C show the KEGG enrichment analysis and clustering expression patterns of DEGs, respectively. Supplementary Table S2 shows a list and details of 53 identified DEGs. Basic metabolic pathways, such as nitrogen and tryptophan metabolism, were found to be enriched in the KEGG pathway. Notably, Seita.4G263300 (SiGH31) and Seita.2G254000 (SiBGLU17) were annotated to be associated with starch and sucrose metabolism, where Seita.7G286800 (SiFBA2) was found to be associated with six different pathways, including pentose phosphate pathway, fructose and mannose metabolism, carbon fixation in photosynthetic organisms, biosynthesis of amino acids, glycolysis/gluconeogenesis, and carbon metabolism.
In the GO enrichment analysis of DEGs, 41 DEGs of 23,842 total genes were associated with three major GO categories, i.e., biological process, cellular component, and molecular function (Figure 2A). In the biological process category, DEGs were annotated in metabolic (n = 20), single-organism (n = 20), response to stimulus (n = 16), and cellular (n = 15) processes. In the cellular component category, 28, 20, and 14 DEGs were annotated in cell part and cell at most, organelle, and membrane, respectively. Furthermore, in the molecular function category, the largest number of DEGs were annotated in catalytic activity (24, 58.54%), followed by binding process (16, 39.02%) and transporter activity (4, 9.76%).
In the COG annotation analysis, 24 DEGs were annotated and divided into 13 functional categories (Figure 2B, Supplemental Table S2). Among them, most DEGs (7, 25.93%) were annotated in carbohydrate transport and metabolism. Furthermore, DEGs participating in secondary metabolite biosynthesis, transport, and catabolism, accounted for 11.11% of the total DEGs. In addition, a few DEGs were found to be associated with defense mechanisms, transcription, and general function.
Subsequently, we performed the metabolome analysis of millets at the S4 stage and isolated 2557 compounds. In addition, we identified a few differential metabolites (Supplemental Table S3). Functional annotation and enrichment analysis of isolated metabolites revealed enrichment of five pathways in the HJZ variety, including arginine and proline metabolism; β-alanine metabolism; butanoate metabolism; nicotinate and nicotinamide metabolism; and alanine, aspartate, and glutamate metabolism (Supplemental Table S4). In contrast, the tryptophan metabolism pathway was enriched in the QH variety (Supplemental Table S4). These results were in agreement with the KEGG enrichment analysis of DEGs.

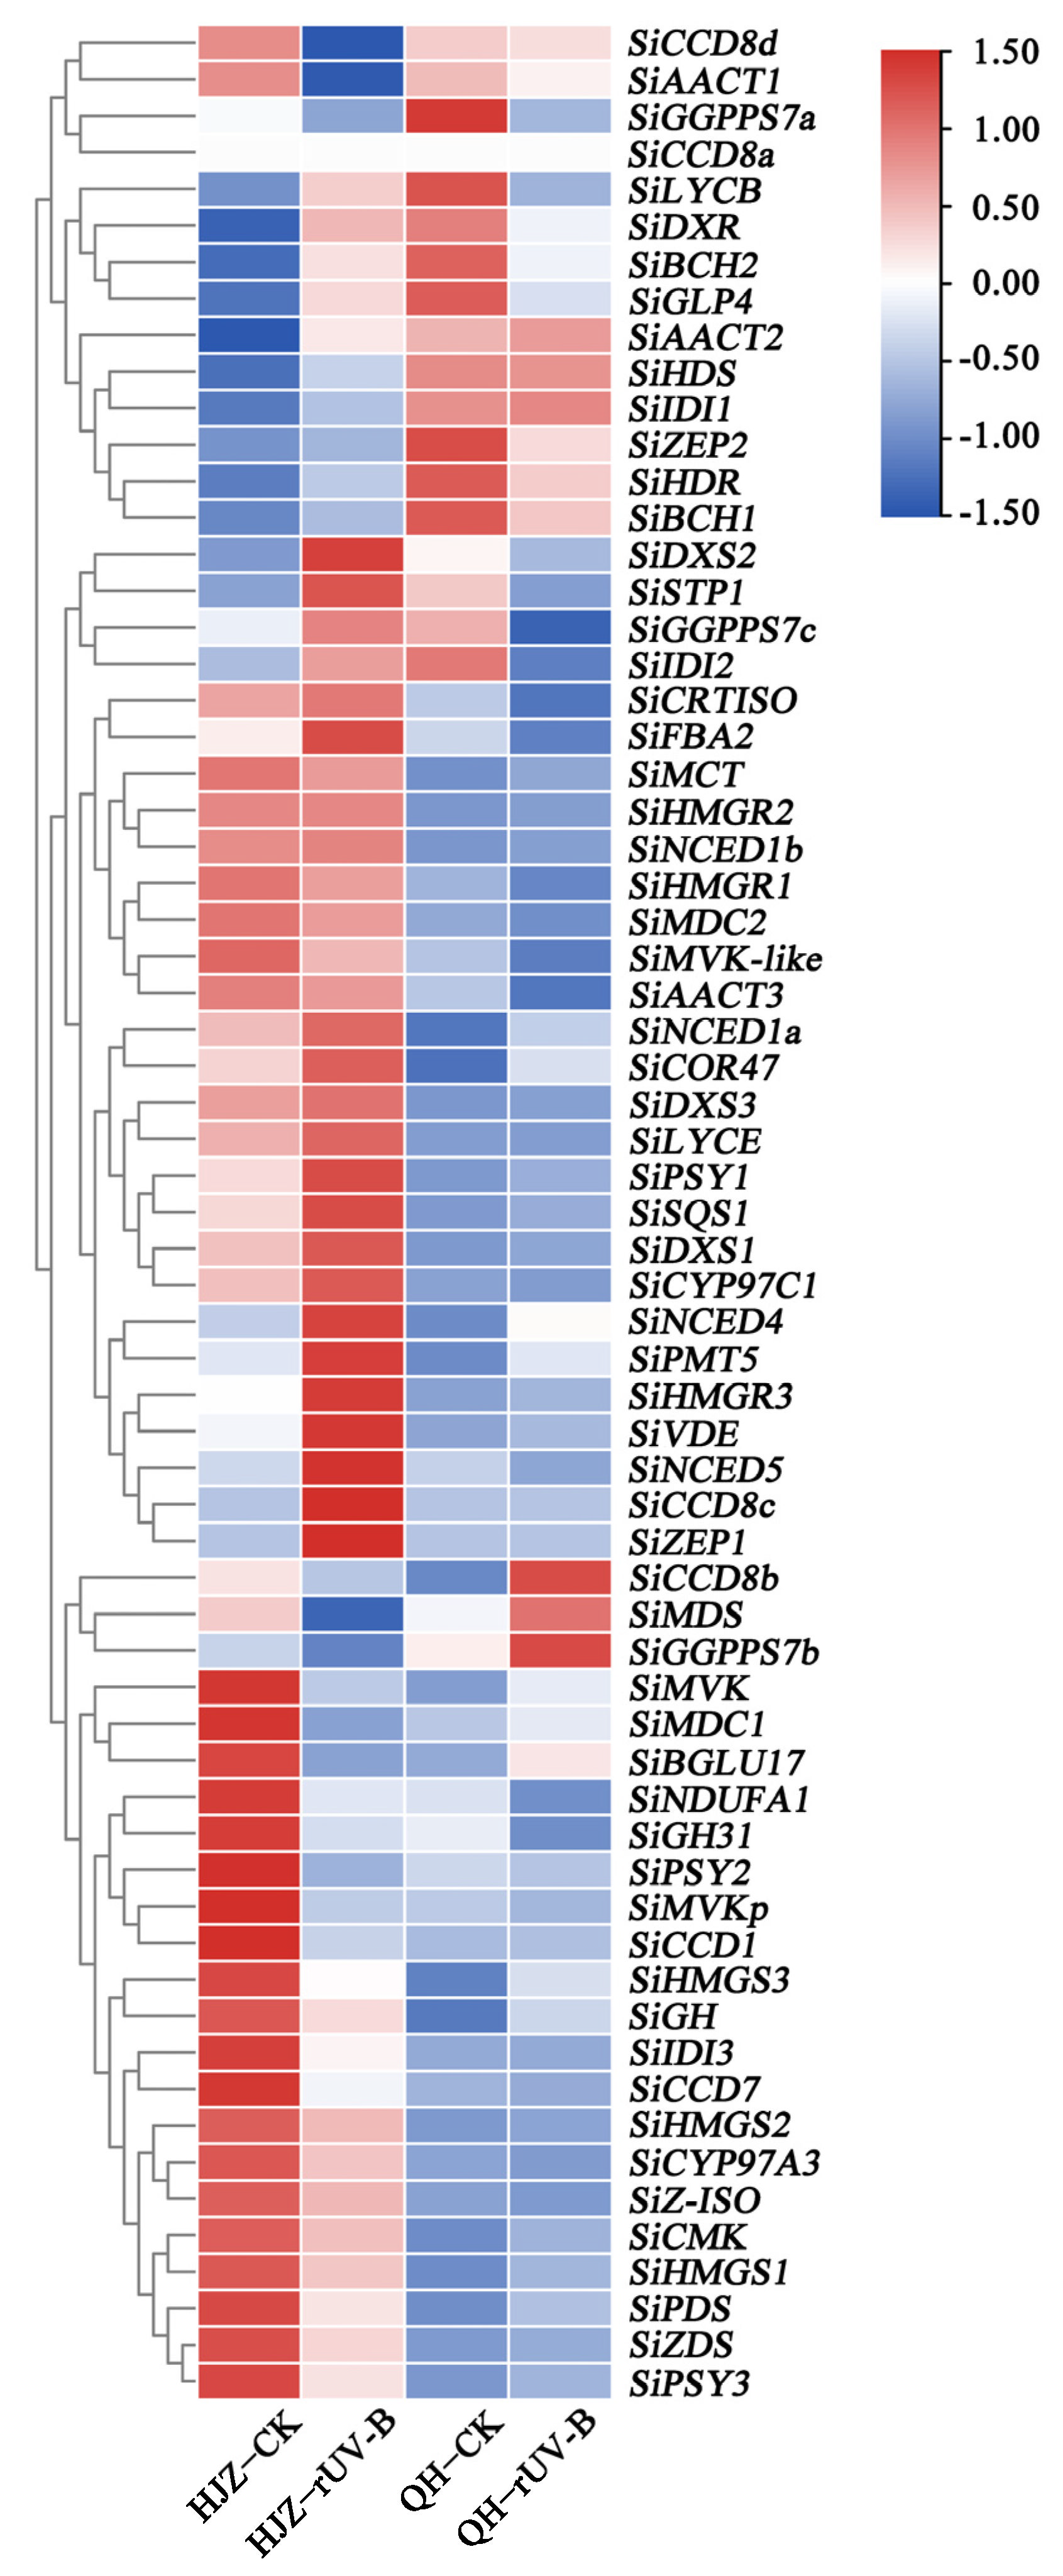
3.4. Expression Profiling of Carotenoid and Starch Genes Based on Transcriptome Data

Different millet varieties when exposed to CK or r-UV-B showed significant differences in the expression of most of the carotenoid genes (Figure 3, Supplemental Table S5), including genes encoding the major rate-limiting enzymes of carotenoid biosynthesis (SiPSY1, SiPSY2, and SiPSY3), carotenoid cleavage dioxygenase involved in carotenoid degradation (SiCCD1 and SiCCD7), and isoprenoid biosynthesis enzymes (SiSQS1 and SiNDUFA1). The expressions of SiPSY1 in QH and HJZ varieties exposed to rUV-B were 15- and 2-fold higher than those exposed to CK, respectively. Furthermore, the expression of SiCCD1 in the HJZ variety exposed to rUV-B was lower than that exposed to CK.
The expression of the following eight genes associated with starch metabolism was found to be significantly altered: glycosyl hydrolases genes (SiBGLU17 and SiGH31), TIM superfamily gene SiFBA2, sugar transporter gene SiSTP1, germin family gene SiGLP4, dehydrin gene SiCOR47, β-xylosidase gene SiGH, and a major facilitator superfamily gene SiPMT5 (Figure 3, Supplemental Table S5). The expressions of SiBGLU17 in HJZ and QH varieties exposed to rUV-B were 7 times lower and 2-fold higher than those exposed to CK, respectively. Similarly, the expressions of SiGLP4 in HJZ and QH varieties exposed to rUV-B were 37.3-fold higher and 8-fold lower than those exposed to CK, respectively.

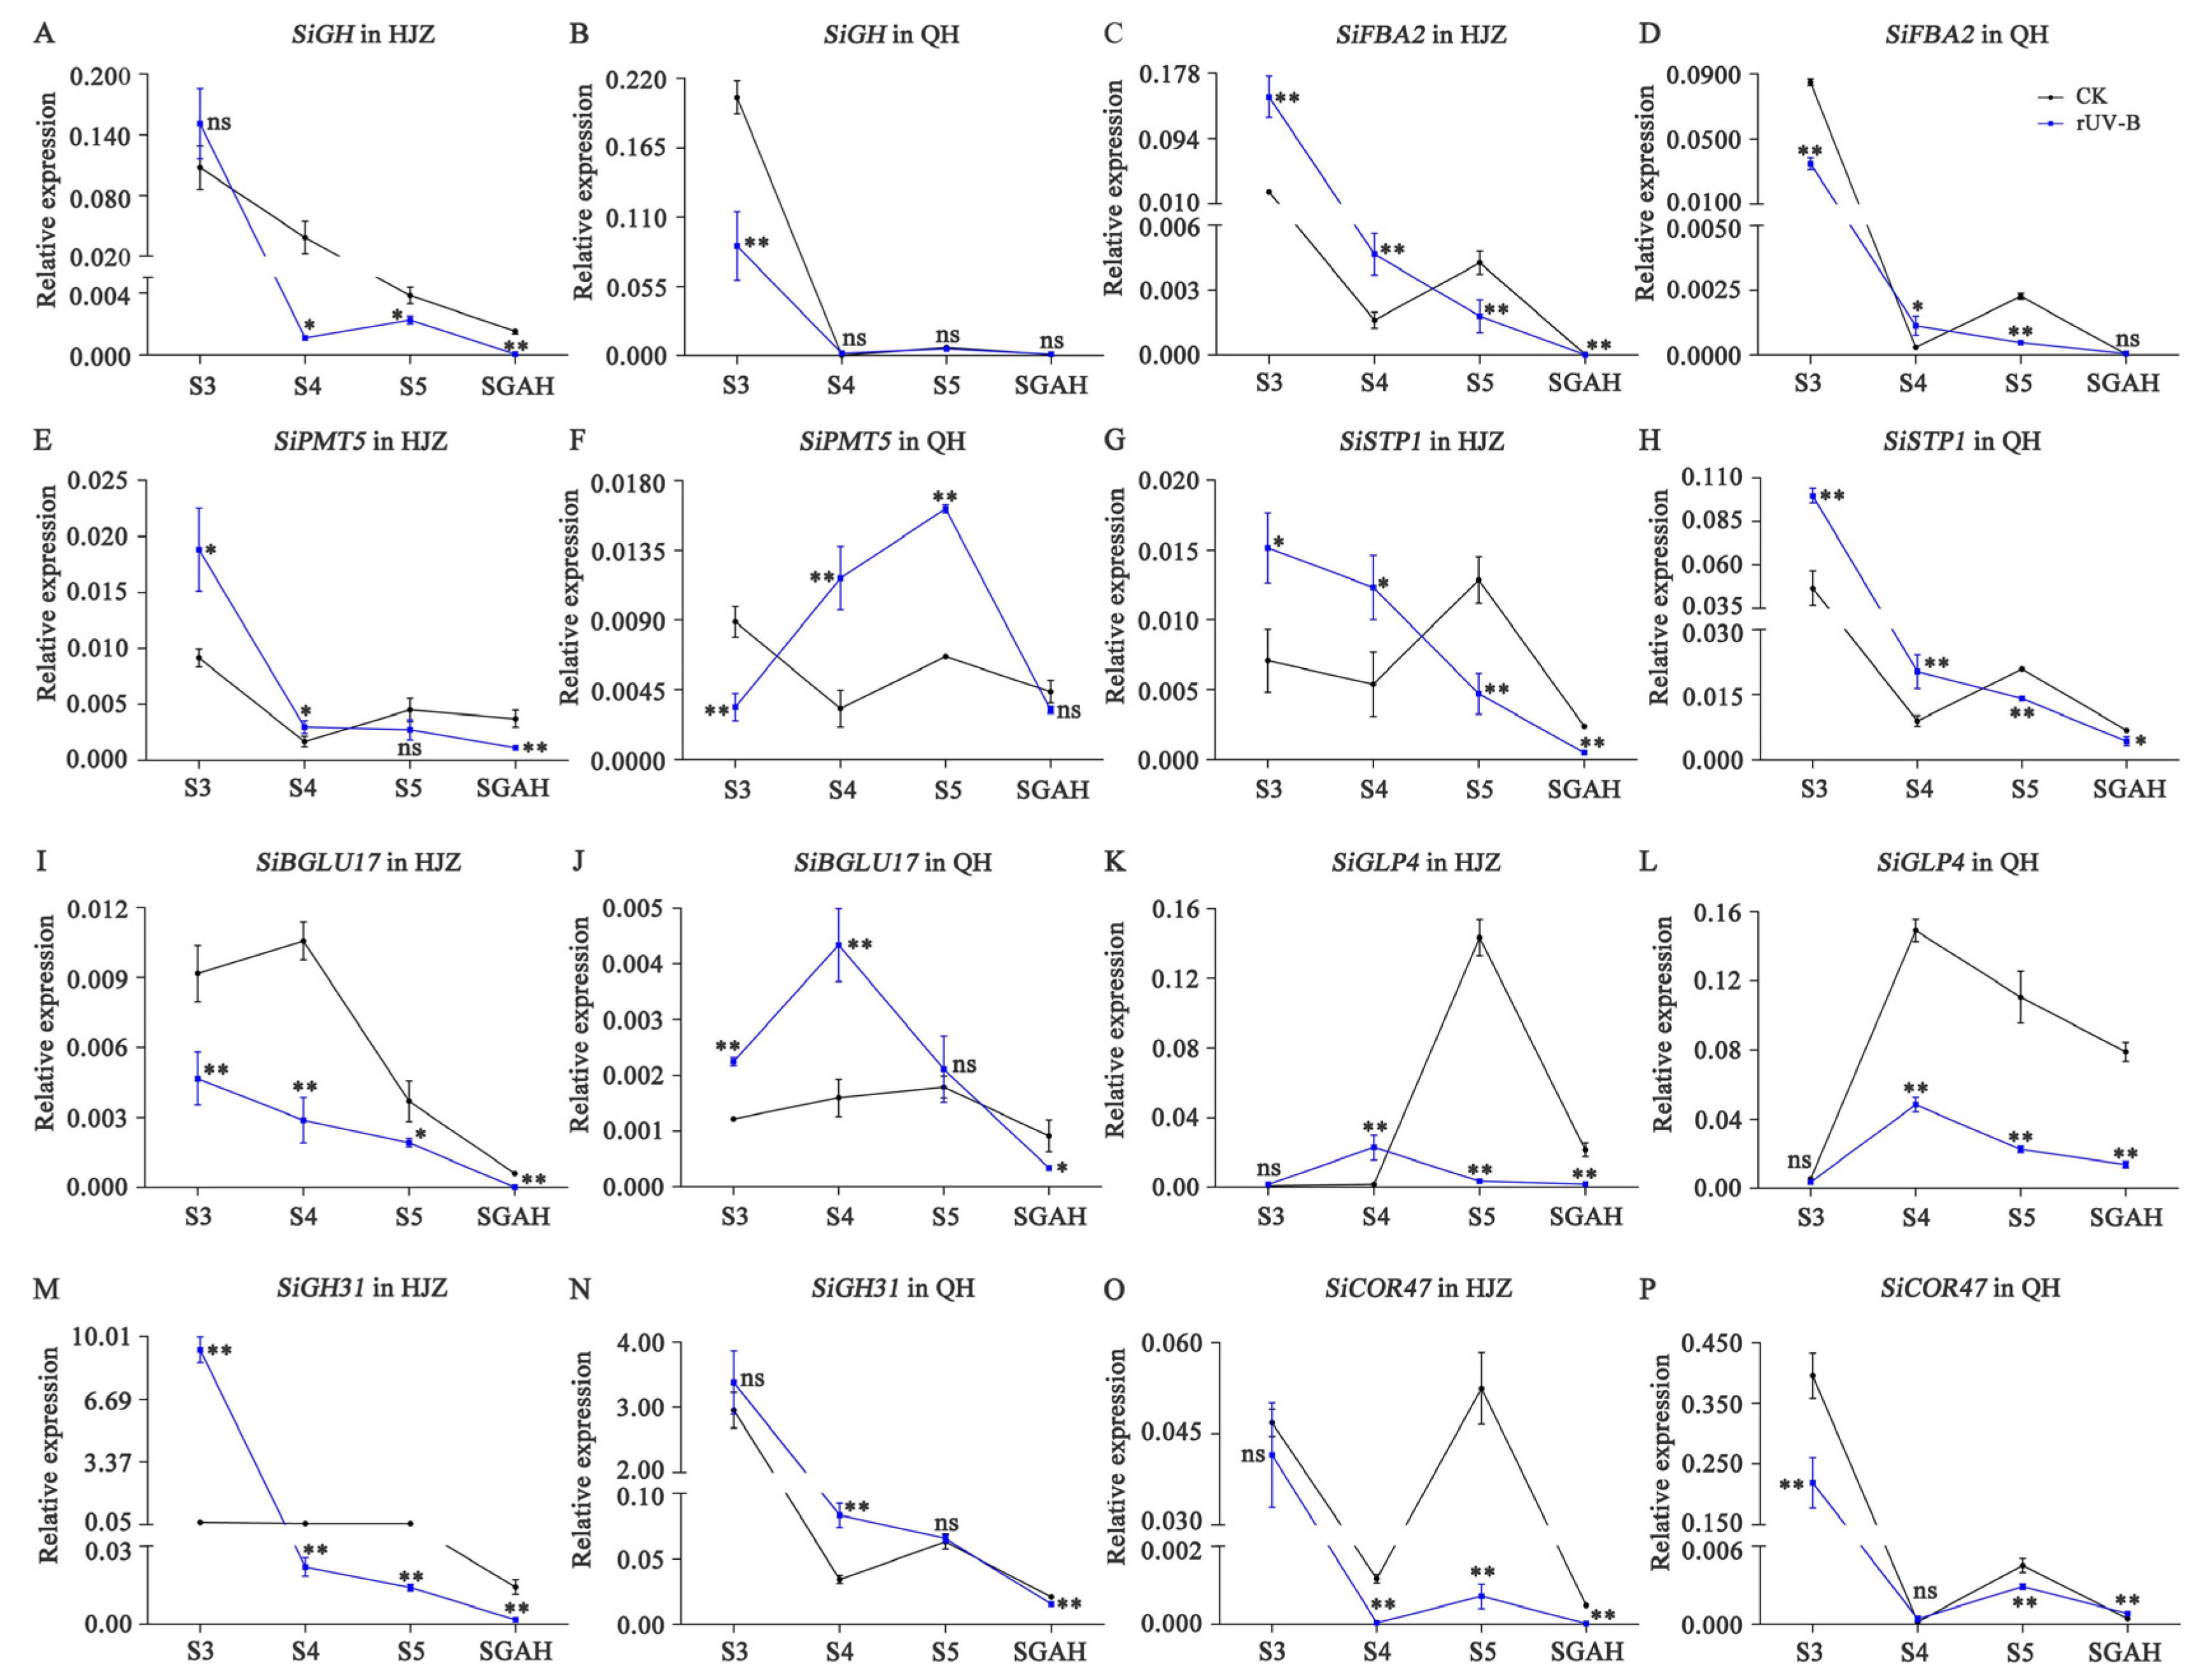
3.5. Expression Changes of Carotenoid and Starch Metabolism Genes at Four Stages of Grain Maturation

Figure 4 and Figure 5 show the differences in the expression of genes involved in carotenoid and starch metabolism, respectively, in millet varieties at four different stages of grain maturation exposed to different UV-B intensities. In both the foxtail millet varieties, the expression of SiPSY1, SiPSY3, and SiCCD7 decreased progressively with the gradual maturity of grains. Furthermore, the SiPSY1 expressions in both millet varieties during the S3 to S5 growth stages exposed to rUV-B were higher than those when exposed to CK. However, at the SGAH stage, the expression levels of SiPSY1 were more than 62 and 21 times higher in HJZ and QH exposed to CK than those when exposed to rUV-B, respectively. The expression levels of SiCCD7 were at least one order of magnitude lower than those of SiPSY, and with the maturity of grains, the effect caused by changes in the expression levels of SiCCD7 might be relatively weaker than that of SiPSY. Furthermore, the expression levels of SiPSY2, SiCCD1, SiSQS1, and SiNDUFA1 first increased and subsequently decreased during the growth period of S3 to SGAH.
Starch can be transformed into chromoplasts, partly influencing the final color of foxtail millet grains. During the analysis of expression levels of genes involved in starch metabolism, SiGH, SiFBA2, SiSTP1, and SiGH31 expression demonstrated a downward trend with grain development. In comparison to grains exposed to CK, the expression levels of SiGH, SiSTP1, and SiGH31 decreased sharply in grains exposed to rUV-B. The SiCOR47 expression levels at S4, S5, and SGAH stages of HJZ millet exposed to CK were 31 times, 73 times, and 22 times higher than those when exposed to rUV-B, respectively. The expression of SiGLP4 first increased and subsequently decreased from S3 to SGAH stages, and the expression levels of SiGLP4 during most stages of development were higher when exposed to CK than those when exposed to rUV-B. SiPMT5 and SiBGLU17 expression did not show a consistent pattern in both the millet varieties, indicating that these genes are not significantly involved in the plants’ response to different UV-B intensities.

4. Discussion

Many studies have demonstrated that the induction of carotenoid biosynthesis in plants depends on the length of exposure of plants to UV-B radiation probably because phytochromes and/or UV-B receptors regulate the production of carotenoids [43,44]. UV radiation increases the content of antheraxanthin, neoxanthin, violaxanthin, and lutein in the leaves of Arabidopsis thaliana [45]. However, the relationship between UV-B radiation and carotenoid production in foxtail millet remains unknown. Notably, millets husked from foxtail millets are rich in proteins, vitamins, soluble starch, carotenoids, and minerals [46,47]. Consumers’ preference for millets depends primarily on the yellow color, for which all-trans-lutein and all-trans-zeaxanthin are mainly responsible [38]. In this study, we used the CIE L*a*b* chromaticity system to analyze the color of two different varieties of foxtail millet [18]. Overall, the changes in the values of indices of this chromaticity system in the two varieties of foxtail millets during different developmental stages when exposed to different UV-B treatments were similar. However, the b* value, which represents the yellowness of millets, reduced when the plants were exposed to decreased UV-B intensity. The L* values of both the foxtail millet varieties in the S3 stage were higher than those in other growth stages, possibly because the grain contents were not completely solidified and grain contained more water in the S3 stage.
During the development of foxtail millet grains, the content and composition of carotenoids change dynamically. We observed that the TCC of both millet varieties decreased from S3 to the SGAH stage mainly because of the decreased expression levels of carotenoid biosynthesis genes. In contrast, the proportion of lutein and zeaxanthin increased during the grain development, and these components were found to be the predominant carotenoids in the mature foxtail millet grains, possibly due to the solidification of content with a gradual decrease of water content. These results were consistent with those reported previously [17,38]. In the presence of attenuated UV-B radiation (43.9 μW/cm2), lutein and TCC decreased at all grain developmental stages compared with those in the presence of non-attenuated UV-B radiation (133.18 μW/cm2), indicating that UV-B at an appropriate intensity contributes to the synthesis of carotenoids. Carotenoids, as the accessory photosynthetic pigments, can be triggered in the photoprotection machinery by UV-B [45]. Therefore, we believe that different plants have distinct tolerance to UV-B radiation, and an appropriate intensity of UV-B is beneficial to plant growth. A previous study conducted on rice showed that the strengthening of UV-B radiation could significantly inhibit the growth and sporulation of M. oryzae and decrease the infectivity of rice blast disease [48].
The plants’ response to UV-B varies not only among species but also among different varieties of the same species [49]. In the present study, the transcriptomic analysis of both foxtail millet varieties exposed to different UV-B intensities led to the identification of 3113 DEGs in HJZ and 96 DEGs in QH including 53 common DEGs between the two varieties. Common DEGs were mainly involved in the metabolic pathways of amino acids, starch, sucrose, tryptophan, and nitrogen. A previous study has shown a correlation between starch and carotenoid metabolism and suggested that sucrose promoted the transformation of starch into chromoplasts [50]. Therefore, we believe that starch also contributes to millet color. To further evaluate this aspect, in the present study, we evaluated the expression levels of genes involved in carotenoid and starch metabolism in both the foxtail millet varieties and found significant variations in the expression of most genes in response to UV-B treatment. A subsequent analysis conducted by selecting seven carotenoids and eight starch genes revealed different levels of expression changes in genes during most of the developmental stages of millets exposed to decreasing intensities of UV-B radiation. However, the regulation of these genes involved in carotenogenesis is regulated at the transcriptional level, and carotenoid metabolism is influenced by post-translational regulation mechanisms such as the proteostasis and activity of carotenogenic enzymes in plants [51]. Carotenoids are synthesized exclusively in plastids [23] and protease systems in plastids, such as Clp, were found to regulate carotenoid accumulation during tomato fruit ripening [52].
The plant metabolome is considered a bridge between the genome and phenology. Notably, phenology is extremely important to understand the interaction between plant growth and the surrounding environment. We found that the number of differential metabolites in the present study was relatively less, and the KEGG pathway is also not enriched in carotenoid metabolism. Therefore, more studies, such as analysis of carotenoid targeted metabolome, are required to understand the regulatory mechanism of carotenoid metabolism in plants.

5. Conclusions

In summary, the present study demonstrated that a decreased UV-B intensity was not conducive to the accumulation of pigments in foxtail millets, resulting in a lower content of carotenoids, mainly lutein and zeaxanthin, and light millet color. Transcriptomics analysis identified a differential response of two foxtail millet varieties to UV-B treatment. The identified DEGs were related to stress resistance, such as the metabolism of tryptophan, starch, and sucrose and the biosynthesis of amino acids, which was relatively in accordance with the KEGG enrichment analysis of differential metabolites. Furthermore, genes related to starch and carotenoid metabolism demonstrated a differential expression pattern when plants were exposed to rUV-B and CK. Collectively, these findings provide new information on the relationship between UV-B intensity and carotenoid accumulation during the foxtail millet grain development and identify a series of candidate genes that may prepare a response to changing intensities of UV-B radiation.

Supplementary Materials

The following supporting information can be downloaded at: https://www.mdpi.com/article/10.3390/agriculture14020289/s1, All data generated or analyzed during this study are included in this published article and its supplementary information files. Illumina sequencing data are available at the Sequence Read Archive (SRA) under accession PRJNA977956 (Submission ID: SUB13481862) (https://www.ncbi.nlm.nih.gov/bioproject/PRJNA977956) URL (accessed on 1st May 2023). Supplemental Table S1: Summary of parameters representing the quality of sequencing data. Supplemental Table S2: DEGs of millet at S4 stage in HJZ and QH exposed to CK and rUV-B. Supplemental Table S3: Differential metabolites of HJZ and QH millet at S4 stage exposed to CK and rUV-B. Supplemental Table S4: Functional annotation of genes and KEGG pathway-based enrichment of differential metabolites. Supplemental Table S5: All identified gene IDs. Supplemental Table S6: List of primers used for qRT-PCR.

Author Contributions

Conceptualization, B.Z. and Y.H. (Yuanhuai Han); Data curation, X.P.; Formal analysis, Y.H. (Yiqiong Huo) and R.H.; Funding acquisition, Y.H. (Yiqiong Huo), H.W., B.Z. and Y.H. (Yuanhuai Han); Methodology, H.F., R.Z. and Y.W.; Project administration, Y.H. (Yuanhuai Han); Resources, Y.W., B.Z. and Y.H. (Yuanhuai Han); Software, X.P., H.F., R.H. and R.Z.; Supervision, B.Z.; Validation, X.P., H.F., R.H., R.Z. and Y.W.; Writing—original draft, Y.H. (Yiqiong Huo), X.P.; Writing—review & editing, Y.H. (Yiqiong Huo), B.Z. and Y.H. (Yuanhuai Han). All authors have read and agreed to the published version of the manuscript.

Funding

This research was supported by Applied Basic Research Program of Shanxi Province (Yiqiong Huo, grant number 20210302124021), National Natural Science Foundation Joint Fund Project of China (Yuanhuai Han, grant number U21A20216), the Scientific and Technological Innovation Foundation of Higher Education Institutions in Shanxi (Yushen Wang, grant number 2021L113), Shanxi Agricultural University Science and Technology Innovation Fund Project (Haigang Wang, grant number 2021BQ37).

Institutional Review Board Statement

Not applicable.

Data Availability Statement

The original contributions presented in the study are included in the article/Supplementary Material, further inquiries can be directed to the corresponding author.

Acknowledgments

The authors would like to thank all the reviewers who participated in the review.

Conflicts of Interest

The authors declare no conflict of interest.

References

  1. Andrady, A.; Aucamp, P.J.; Bais, A.F.; Ballare, C.L.; Bjorn, L.O.; Bornman, J.F.; Caldwell, M.; Callaghan, T.; Cullen, A.P.; Erickson, D.J.; et al. Environmental effects of ozone depletion and its interactions with climate change: Progress report, 2004. Photochem. Photobiol. Sci. 2005, 4, 177–184. [Google Scholar]
  2. Shen, J.; Jiang, C.Q.; Yan, Y.F.; Liu, B.R.; Zu, C.L. Effect of increased UV-B radiation on carotenoid accumulation and total antioxidant capacity in tobacco (Nicotiana tabacum L.) leaves. Genet. Mol. Res. 2017, 16, gmr16018438. [Google Scholar] [CrossRef]
  3. Clayton, W.A.; Albert, N.W.; Thrimawithana, A.H.; McGhie, T.K.; Deroles, S.C.; Schwinn, K.E.; Warren, B.A.; McLachlan, A.R.G.; Bowman, J.L.; Jordan, B.R.; et al. UVR8-mediated induction of flavonoid biosynthesis for UVB tolerance is conserved between the liverwort Marchantia polymorpha and flowering plants. Plant J. 2018, 96, 503–517. [Google Scholar] [CrossRef]
  4. Stracke, R.; Favory, J.J.; Gruber, H.; Bartelniewoehner, L.; Bartels, S.; Binkert, M.; Funk, M.; Weisshaar, B.; Ulm, R. The Arabidopsis bZIP transcription factor HY5 regulates expression of the PFG1/MYB12 gene in response to light and ultraviolet-B radiation. Plant Cell Environ. 2010, 33, 88–103. [Google Scholar] [PubMed]
  5. Liang, T.; Shi, C.; Peng, Y.; Tan, H.; Xin, P.; Yang, Y.; Wang, F.; Li, X.; Chu, J.; Huang, J.; et al. Brassinosteroid-activated BRI1-EMS-SUPPRESSOR 1 inhibits flavonoid biosynthesis and coordinates growth and UV-B stress responses in plants. Plant Cell 2020, 32, 3224–3239. [Google Scholar] [CrossRef] [PubMed]
  6. Rius, S.P.; Emiliani, J.; Casati, P. P1 epigenetic regulation in leaves of high altitude maize landraces: Effect of UV-B radiation. Front. Plant Sci. 2016, 7, 523. [Google Scholar] [CrossRef] [PubMed]
  7. Rius, S.P.; Grotewold, E.; Casati, P. Analysis of the P1 promoter in response to UV-B radiation in allelic variants of high-altitude maize. BMC Plant Biol. 2012, 12, 92. [Google Scholar] [CrossRef] [PubMed]
  8. Ma, M.; Wang, P.; Yang, R.; Gu, Z. Effects of UV-B radiation on the isoflavone accumulation and physiological-biochemical changes of soybean during germination: Physiological-biochemical change of germinated soybean induced by UV-B. Food Chem. 2018, 250, 259–267. [Google Scholar] [CrossRef] [PubMed]
  9. Dillon, F.M.; Tejedor, M.D.; Ilina, N.; Chludil, H.D.; Mithofer, A.; Pagano, E.A.; Zavala, J.A. Solar UV-B radiation and ethylene play a key role in modulating effective defenses against Anticarsia gemmatalis larvae in field-grown soybean. Plant Cell Environ. 2018, 41, 383–394. [Google Scholar] [CrossRef] [PubMed]
  10. Mao, B.; Wang, Y.; Zhao, T.H.; Tian, R.R.; Wang, W.; Ye, J.S. Combined effects of elevated O3 concentrations and enhanced UV-B radiation of the biometric and biochemical properties of soybean roots. Front Plant Sci. 2017, 8, 1568. [Google Scholar] [CrossRef] [PubMed]
  11. Yang, S.H.; Wang, L.J.; Li, S.H.; Duan, W.; Loescher, W.; Liang, Z.C. The effects of UV-B radiation on photosynthesis in relation to Photosystem II photochemistry, thermal dissipation and antioxidant defenses in winter wheat (Triticum aestivum L.) seedlings at different growth temperatures. Funct. Plant Biol. 2007, 34, 907–917. [Google Scholar] [CrossRef]
  12. Chen, H.; Gong, Y.; Han, R. Cadmium telluride quantum dots (CdTe-QDs) and enhanced ultraviolet-B (UV-B) radiation trigger antioxidant enzyme metabolism and programmed cell death in wheat seedlings. PLoS ONE 2014, 9, e110400. [Google Scholar] [CrossRef]
  13. Faseela, P.; Puthur, J.T. Intraspecific variation in sensitivity of high yielding rice varieties towards UV-B radiation. Physiol. Mol. Biol. Pla. 2019, 25, 727–740. [Google Scholar] [CrossRef] [PubMed]
  14. Li, Y.; Wu, S. Traditional maintenance and multiplication of foxtail millet (Setaria italica (L.) P. Beauv.) landraces in China. Euphytica 1996, 87, 33–38. [Google Scholar] [CrossRef]
  15. Aidoo, M.K.; Bdolach, E.; Fait, A.; Lazarovitch, N.; Rachmilevitch, S. Tolerance to high soil temperature in foxtail millet (Setaria italica L.) is related to shoot and root growth and metabolism. Plant Physiol. Biochem. 2016, 106, 73–81. [Google Scholar] [CrossRef] [PubMed]
  16. Doust, A.N.; Kellogg, E.A.; Devos, K.M.; Bennetzen, J.L. Foxtail millet: A sequence-driven grass model system. Plant Physiol. 2009, 149, 137–141. [Google Scholar] [CrossRef] [PubMed]
  17. Zhang, B.; Liu, J.; Cheng, L.; Zhang, Y.Y.; Hou, S.Y.; Sun, Z.X.; Li, H.Y.; Han, Y.H. Carotenoid composition and expression of biosynthetic genes in yellow and white foxtail millet [Setaria italica (L.) Beauv]. J. Cereal Sci. 2019, 85, 84–90. [Google Scholar] [CrossRef]
  18. Zhang, Y.; Gao, J.; Qie, Q.; Yang, Y.; Hou, S.; Wang, X.; Li, X.; Han, Y. Comparative analysis of flavonoid metabolites in foxtail millet (Setaria italica) with different eating quality. Life 2021, 11, 578. [Google Scholar] [CrossRef] [PubMed]
  19. Zheng, X.; Kuijer, H.N.J.; Al-Babili, S. Carotenoid biofortification of crops in the CRISPR era. Trends Biotechnol. 2020, 39, 857–860. [Google Scholar] [CrossRef] [PubMed]
  20. Jansen, M.; Hectors, K.; O’Brien, N.M.; Guisez, Y.; Potters, G. Plant stress and human health: Do human consumers benefit from UV-B acclimated crops. Plant Sci. 2008, 175, 449–458. [Google Scholar] [CrossRef]
  21. Middleton, E.M.; Teramura, A.H. The role of flavonol glycosides and carotenoids in protecting soybean from ultraviolet-B damage. Plant Physiol. 1993, 103, 741–752. [Google Scholar] [CrossRef]
  22. Li, L.; Yuan, H.; Zeng, Y.; Xu, Q. Plastids and carotenoid accumulation. Sub-Cell. Biochem. 2016, 79, 273–293. [Google Scholar]
  23. Sun, T.; Yuan, H.; Cao, H.; Yazdani, M.; Tadmor, Y.; Li, L. Carotenoid metabolism in plants: The role of plastids. Mol. Plant. 2018, 11, 58–74. [Google Scholar] [CrossRef] [PubMed]
  24. Sun, T.; Rao, S.; Zhou, X.; Li, L. Plant carotenoids: Recent advances and future perspectives. Mol. Hortic. 2022, 2, 3. [Google Scholar] [CrossRef]
  25. Vranova, E.; Coman, D.; Gruissem, W. Network analysis of the MVA and MEP pathways for isoprenoid synthesis. Annu. Rev. Plant Biol. 2013, 64, 665–700. [Google Scholar] [CrossRef]
  26. Cazzonelli, C.I.; Pogson, B.J. Source to sink: Regulation of carotenoid biosynthesis in plants. Trends Plant Sci. 2010, 15, 266–274. [Google Scholar] [CrossRef] [PubMed]
  27. Nisar, N.; Li, L.; Lu, S.; Khin, N.C.; Pogson, B.J. Carotenoid metabolism in plants. Mol. Plant 2015, 8, 68–82. [Google Scholar] [CrossRef]
  28. Sandmann, G. Diversity and origin of carotenoid biosynthesis: Its history of coevolution towards plant photosynthesis. New Phytol. 2021, 232, 479–493. [Google Scholar] [CrossRef] [PubMed]
  29. Harjes, C.E.; Rocheford, T.R.; Bai, L.; Brutnell, T.P.; Kandianis, C.B.; Sowinski, S.G.; Stapleton, A.E.; Vallabhaneni, R.; Williams, M.; Wurtzel, E.T.; et al. Natural genetic variation in lycopene epsilon cyclase tapped for maize biofortification. Science 2008, 319, 330–333. [Google Scholar] [CrossRef]
  30. Ahrazem, O.; Gomez-Gomez, L.; Rodrigo, M.J.; Avalos, J.; Limon, M.C. Carotenoid cleavage oxygenases from microbes and photosynthetic organisms: Features and functions. Int. J. Mol. Sci. 2016, 17, 1781. [Google Scholar] [CrossRef]
  31. Beltran, J.C.; Stange, C. Apocarotenoids: A new carotenoid-derived pathway. Sub-Cell. Biochem. 2016, 79, 239–272. [Google Scholar]
  32. Dhar, M.K.; Mishra, S.; Bhat, A.; Chib, S.; Kaul, S. Plant carotenoid cleavage oxygenases: Structure-function relationships and role in development and metabolism. Brief. Funct. Genom. 2020, 19, 1–9. [Google Scholar] [CrossRef] [PubMed]
  33. Liang, M.H.; Zhu, J.; Jiang, J.G. Carotenoids biosynthesis and cleavage related genes from bacteria to plants. Crit. Rev. Food Sci. 2018, 58, 2314–2333. [Google Scholar] [CrossRef] [PubMed]
  34. Ablazov, A.; Mi, J.; Jamil, M.; Jia, K.P.; Wang, J.Y.; Feng, Q.; Al-Babili, S. The apocarotenoid zaxinone is a positive regulator of strigolactone and abscisic acid biosynthesis in arabidopsis roots. Front. Plant Sci. 2020, 11, 578. [Google Scholar] [CrossRef] [PubMed]
  35. Wang, J.Y.; Haider, I.; Jamil, M.; Fiorilli, V.; Saito, Y.; Mi, J.; Baz, L.; Kountche, B.A.; Jia, K.P.; Guo, X.; et al. The apocarotenoid metabolite zaxinone regulates growth and strigolactone biosynthesis in rice. Nat. Commun. 2019, 10, 810. [Google Scholar] [CrossRef] [PubMed]
  36. Zhong, Y.; Pan, X.; Wang, R.; Xu, J.; Guo, J.; Yang, T.; Zhao, J.; Nadeem, F.; Liu, X.; Shan, H.; et al. ZmCCD10a encodes a distinct type of carotenoid cleavage dioxygenase and enhances plant tolerance to low phosphate. Plant Physiol. 2020, 184, 374–392. [Google Scholar] [CrossRef] [PubMed]
  37. Abdel-Aalel, S.M.; Young, J.C.; Rabalski, I.; Hucl, P.; Fregeau-Reid, J. Identification and quantification of seed carotenoids in selected wheat species. J. Agric. Food Chem. 2007, 55, 787–794. [Google Scholar] [CrossRef] [PubMed]
  38. Shen, R.; Yang, S.; Zhao, G.; Shen, Q.; Diao, X. Identification of carotenoids in foxtail millet (Setaria italica) and the effects of cooking methods on carotenoid content. J. Cereal Sci. 2015, 61, 86–93. [Google Scholar] [CrossRef]
  39. Wang, L.; Feng, Z.; Wang, X.; Wang, X.; Zhang, X. DEGseq: An R package for identifying differentially expressed genes from RNA-seq data. Bioinformatics 2010, 26, 136–138. [Google Scholar] [CrossRef]
  40. Chen, C.; Chen, H.; Zhang, Y.; Thomas, H.R.; Frank, M.H.; He, Y.; Xia, R. TBtools: An integrative toolkit developed for interactive analyses of big biological data. Mol. Plant. 2020, 13, 1194–1202. [Google Scholar] [CrossRef]
  41. Livak, K.J.; Schmittgen, T.D. Analysis of relative gene expression data using real-time quantitative PCR and the 2(−Delta Delta C(T)) method. Methods 2001, 25, 402–408. [Google Scholar] [CrossRef] [PubMed]
  42. Kanehisa, M.; Araki, M.; Goto, S.; Hattori, M.; Hirakawa, M.; Itoh, M.; Katayama, T.; Kawashima, S.; Okuda, S.; Tokimatsu, T.; et al. KEGG for linking genomes to life and the environment. Nucleic Acids Res. 2008, 36, D480–D484. [Google Scholar] [CrossRef] [PubMed]
  43. Becatti, E.; Petroni, K.; Giuntini, D.; Castagna, A.; Calvenzani, V.; Serra, G.; Mensuali-Sodi, A.; Tonelli, C.; Ranieri, A. Solar UV-B radiation influences carotenoid accumulation of tomato fruit through both ethylene-dependent and -independent mechanisms. J. Agric. Food Chem. 2009, 57, 10979–10989. [Google Scholar] [CrossRef] [PubMed]
  44. Mackerness, S.A.H. Plant responses to ultraviolet-B (UV-B: 280–320 nm) stress: What are the key regulators? Plant Growth Regul. 2000, 32, 27–39. [Google Scholar] [CrossRef]
  45. Badmus, U.O.; Crestani, G.; Cunningham, N.; Havaux, M.; Urban, O.; Jansen, M.A.K. UV radiation induces specific changes in the carotenoid profile of Arabidopsis thaliana. Biomolecules 2022, 12, 1879. [Google Scholar] [CrossRef] [PubMed]
  46. Yang, X.S.; Wang, L.L.; Zhou, X.R.; Shuang, S.M.; Zhu, Z.H.; Li, N.; Li, Y.; Liu, F.; Liu, S.C.; Lu, P.; et al. Determination of protein, fat, starch, and amino acids in foxtail millet [Setaria italica (L.) Beauv.] by Fourier transform near-infrared reflectance spectroscopy. Food Sci. Biotechnol. 2013, 22, 1495–1500. [Google Scholar] [CrossRef]
  47. Zhang, L.Z.; Liu, R.H. Phenolic and carotenoid profiles and antiproliferative activity of foxtail millet. Food Chem. 2015, 174, 495–501. [Google Scholar] [CrossRef]
  48. Li, X.; He, Y.; Xie, C.; Zu, Y.; Zhan, F.; Mei, X.; Xia, Y.; Li, Y. Effects of UV-B radiation on the infectivity of Magnaporthe oryzae and rice disease-resistant physiology in Yuanyang terraces. Photochem. Photobiol. Sci. 2018, 17, 8–17. [Google Scholar] [CrossRef]
  49. Teramura, A.H.; Sullivan, J.H. Effects of UV-B radiation on photosynthesis and growth of terrestrial plants. Photosynth. Res. 1994, 39, 463–473. [Google Scholar] [CrossRef] [PubMed]
  50. Iglesias, D.J.; Tadeo, F.R.; Legaz, F.; Primo-Millo, E.; Talon, M. In vivo sucrose stimulation of colour change in citrus fruit epicarps: Interactions between nutritional and hormonal signals. Physiol. Plant. 2001, 112, 244–250. [Google Scholar] [CrossRef] [PubMed]
  51. Sun, T.H.; Zhou, X.S.; Rao, S.; Liu, J.P.; Li, L. Chapter Thirteen—Protein–protein interaction techniques to investigate post-translational regulation of carotenogenesis. Method Enzymol. 2022, 671, 301–325. [Google Scholar]
  52. D’Andrea, L.; Simon-Moya, M.; Llorente, B.; Llamas, E.; Marro, M.; Loza-Alvarez, P.; Li, L.; Rodriguez-Concepcion, M. Interference with Clp protease impairs carotenoid accumulation during tomato fruit ripening. J. Exp. Bot. 2018, 69, 1557–1568. [Google Scholar] [CrossRef] [PubMed]
Figure 1. KEGG enrichment analysis and cluster heat map of differentially expressed genes (DEGs) between HJZ and QH at the S4 stage of grain development. (A) Numbers of DEGs. HJZ vs. QH refers to differential genes shared by the two varieties. (B) KEGG pathway enrichment bubble diagram of DEGs. Each circle represents a KEGG pathway (names are shown on the left). The size of the circle represents the number of genes and the color gradient represents the extent of enrichment. (C) Cluster heat map of DEGs. The X-axis represents the name of the sample and the clustering results of the sample, whereas the Y-axis represents the clustering results of different genes. Different columns in the figure represent different samples, and different rows represent different genes. The colors show the levels of gene expression in the sample.
Agriculture 14 00289 g001
Figure 2. GO and COG function classification analyses of DEGs. Samples were collected at the S4 stage of grain development in HJZ and QH under natural light (CK) and UV-B reduction treatment (rUV-B).
Agriculture 14 00289 g002
Figure 3. Differences in the transcriptome of genes associated with carotenoid and starch metabolism in HJZ and QH. The relative expression of these genes was calculated using the logarithmic (log) value of FPKM with a base of 2. The heat map was prepared using TBtools. All gene IDs are listed in Supplementary Table S5.
Agriculture 14 00289 g003
Figure 4. qRT-PCR determined expression of genes involved in carotenoid metabolism at four stages of grain development. (AN), Expression of SiPSY1 (A,B), SiPSY2 (C,D), SiPSY3 (E,F), SiCCD1 (G,H), SiCCD7 (I,J), SiSQS1 (K,L) and SiDUFA1 (M,N) in HJZ and QH. All gene IDs are listed in Supplementary Table S5. The data represent the mean of three technical replicates of three biological replicates. The bars represent SD from three biological replicates. Asterisks indicate significant differences, p < 0.05 and p < 0.01 are designated by * and **, respectively. ns, no significant difference.
Agriculture 14 00289 g004
Figure 5. qRT-PCR determined the expression of genes involved in starch metabolism at four stages of grain development. (AP), Expression of SiGH (A,B), SiFBA2 (C,D), SiPMT5 (E,F), SiSTP1 (G,H), SiBGLU17 (I,J), SiGLP4 (K,L), SiGH31 (M,N) and SiCOR47 (O,P) in HJZ and QH. All gene IDs are listed in Supplementary Table S5. The data represent the mean of three technical replicates of three biological replicates. The bars represent SD from three biological replicates. Asterisks indicate significant differences, p < 0.05 and p < 0.01 are designated by * and **, respectively. ns, no significant difference.
Agriculture 14 00289 g005
Table 1. The analysis of color indicators in millet grains exposed to CK and rUV-B.
Developmental StagesTreatmentL*a*b*
S3HJZ-CK61.45 ± 1.3725.20 ± 0.26540.49 ± 0.268
HJZ-rUV-B61.06 ± 0.9963.72 ± 0.109 **35.95 ± 0.353 **
QH-CK65.31 ± 0.2654.26 ± 0.43335.68 ± 0.194
QH-rUV-B62.34 ± 0.989 *3.44 ± 0.14734.48 ± 1.062
S4HJZ-CK55.56 ± 1.2358.12 ± 0.10043.39 ± 0.908
HJZ-rUV-B54.22 ± 1.61511.34 ± 0.791 *37.88 ± 0.869 *
QH-CK55.26 ± 0.4729.55 ± 0.29641.69 ± 0.118
QH-rUV-B61.74 ± 0.160 **5.80 ± 0.468 **37.18 ± 0.159 **
S5HJZ-CK53.71 ± 0.40310.67 ± 0.24542.98 ± 0.369
HJZ-rUV-B55.39 ± 0.48810.70 ± 0.04442.28 ± 0.103
QH-CK56.55 ± 0.6079.04 ± 0.20440.24 ± 0.294
QH-rUV-B55.66 ± 1.5318.96 ± 0.51138.78 ± 0.303 *
SGAHHJZ-CK57.01 ± 0.3229.89 ± 0.05344.99 ± 0.215
HJZ-rUV-B54.96 ± 0.2409.32 ± 0.01943.29 ± 0.115
QH-CK53.69 ± 1.0109.30 ± 0.28041.97 ± 0.322
QH-rUV-B49.99 ± 0.392 *9.58 ± 0.23440.40 ± 0.286 *
Note: L*, a*, and b* represent luminosity, redness, and yellowness, respectively. rUV-B represents UV-B reduction treatment. Data are means±SE from three biological replicates. Asterisks indicate significant differences. p < 0.01 is designated by **. p < 0.05 is designated by *.
Table 2. TCC, LC, and ZC in different millet grain stages exposed to CK and rUV-B.
Developmental StagesTreatmentContent of Total Carotenoid
(TCC, mg/kg DW)
Lutein Content
(LC, mg/kg DW)
Zeaxanthin Content
(ZC, mg/kg DW)
(LC + ZC)/TCC(%)
S3HJZ-CK27.87 ± 3.2395.49 ± 1.0122.75 ± 0.27729.54%
HJZ-rUV-B21.75 ± 0.8744.52 ± 0.546 *3.61 ± 1.24337.39%
QH-CK13.14 ± 0.3353.50 ± 0.7832.63 ± 0.07946.70%
QH-rUV-B12.58 ± 0.8572.32 ± 0.068 *1.22 ± 0.073 **28.10%
S4HJZ-CK19.29 ± 0.5745.09 ± 0.3122.70 ± 0.13340.37%
HJZ-rUV-B19.00 ± 1.9534.86 ± 0.6242.53 ± 0.45038.90%
QH-CK13.95 ± 1.0775.55 ± 0.2193.16 ± 0.33862.40%
QH-rUV-B12.86 ± 1.2794.09 ± 0.199 **2.27 ± 0.079 *49.44%
S5HJZ-CK17.63 ± 1.0565.64 ± 0.1973.18 ± 0.22350.04%
HJZ-rUV-B16.94 ± 0.3585.54 ± 0.5432.95 ± 0.38150.06%
QH-CK14.04 ± 1.4404.57 ± 0.2642.74 ± 0.24252.11%
QH-rUV-B13.95 ± 2.1483.48 ± 2.254 *2.89 ± 0.07545.66%
SGAHHJZ-CK12.66 ± 0.4907.84 ± 1.0574.36 ± 0.64496.36%
HJZ-rUV-B11.99 ± 0.469 *6.83 ± 0.8893.73 ± 0.68588.04%
QH-CK10.03 ± 0.4496.12 ± 0.5783.42 ± 0.43395.12%
QH-rUV-B8.77 ± 0.5274.92 ± 0.9543.53 ± 0.76296.44%
Note: S3 to S5 stages represent the middle stage, late stage, and last stage of millet grain development, respectively. SGAH represents the grain stage after harvest. CK, natural light. rUV-B, UV-B reduction treatment. Data are means ± SE from three biological replicates. Asterisks indicate significant differences. p < 0.01 is designated by ** p < 0.05 is designated by *.
Disclaimer/Publisher’s Note: The statements, opinions and data contained in all publications are solely those of the individual author(s) and contributor(s) and not of MDPI and/or the editor(s). MDPI and/or the editor(s) disclaim responsibility for any injury to people or property resulting from any ideas, methods, instructions or products referred to in the content.

