Article

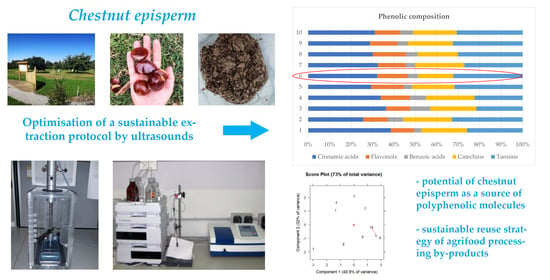
Chestnut Episperm as a Promising Natural Source of Phenolics from Agri-Food Processing by-Products: Optimisation of a Sustainable Extraction Protocol by Ultrasounds

by
Dario Donno
1,2,*,
Federica Turrini
3,4,
Emanuele Farinini
3,
Maria Gabriella Mellano
1,2,
Raffaella Boggia
3,5,
Gabriele Loris Beccaro
1,2 and
Giovanni Gamba
1,2
1
Department of Agriculture, Forestry and Food Science, University of Torino, Largo Braccini 2, 10095 Grugliasco, Italy
2
Chestnut R&D Center—Piemonte, Regione Gambarello 23, 12013 Chiusa di Pesio, Italy
3
Department of Pharmacy, University of Genoa, Viale Cembrano 4, 16148 Genoa, Italy
4
National Center for the Development of New Technologies in Agriculture (Agritech), 80121 Napoli, Italy
5
Centro Nazionale Biodiversità: National Biodiversity Future Center (NBFC), 90133 Palermo, Italy
*
Author to whom correspondence should be addressed.
Agriculture 2024, 14(2), 246; https://doi.org/10.3390/agriculture14020246
Submission received: 15 January 2024 / Revised: 25 January 2024 / Accepted: 31 January 2024 / Published: 2 February 2024

Abstract

:
Chestnut processing has increasingly grown in recent years. All the processes involved in the chestnut supply chain are characterized by the production of high levels of by-products that cause several environmental and disposal issues. The Castanea spp. fruit production is related to a high number of chestnut episperm. This underutilized agricultural by-product may be evaluated as a good resource for the extraction of health-promoting natural molecules, such as phenolics. This preliminary study aimed to develop and optimize, using a multivariate statistical approach, a sustainable protocol for the ultrasound-assisted extraction (UAE) of the main phenolics from chestnut episperm (cv Marsol, C. sativa × C. crenata). A design of experiment (DoE) approach was employed. This approach focused on the two quantitative UAE process factors: the extraction time (X1), within a timeframe ranging from 10 to 30 min, and the sample-to-solvent (w/v) ratio (X2), ranging from 1/30 to 1/10. These variables were investigated to determine their impact on phenol extraction yield. Exploratory analysis, in particular principal component analysis (PCA) and multiple linear regression (MLR), were carried out on the studied responses. The phenolic characterization of ten different extracts was also performed using high-performance liquid chromatography (HPLC), both to define the levels of specific phenolics selected for their health-promoting properties and to evaluate some important features, such as the total antioxidant capacity. The values of total polyphenolic content (TPC) obtained in the different experiments ranged between 97 (extract 4) and 142 (extract 6) mg GAE/g of dried weight (DW). Moreover, results from the ferric reducing antioxidant power (FRAP) test confirmed the high TPC values, highlighting that all the ultrasound extracts contained excellent levels of molecules with good antioxidant properties. In particular, extracts 2 and 3 showed the highest AOC values (about 490–505 mmol Fe2+/Kg of dried weight). The proposed optimized protocol allowed for obtaining formulations characterized by high levels of tannins, phenolic acids, and catechins. Indeed, episperm extracts contained high levels of chlorogenic acid (15–25 mg/100 g DW), ferulic acid (80–120 mg/100 g DW), castalagin (20–80 mg/100 g DW), and vescalagin (40–75 mg/100 g). Finally, in this research study, the potential of chestnut episperm as a source of polyphenolic molecules to be extracted by green technologies and used in several food and/or pharmaceutical applications was evaluated to valorize a sustainable reuse strategy of agri-food processing by-products, also reducing the environmental impact of this waste derived from chestnut processing.

Graphical Abstract

1. Introduction

The “linear economy” model is still the main scenario in the world. It is based on the production, use, and elimination of materials by incinerators or landfills, recycling only a low waste percentage (about 12%). The “circular economy” is an alternative system based on the minimum material consumption and waste production, reusing and recycling the residues for the production of new materials. In this framework, waste is turned into a resource with many benefits in the sustainability of processes and raw materials [1,2]. Moreover, the emergent needs of modern society are associated with the safety of people’s health and lifestyle-related diseases (e.g., cancer, diabetes, neurological issues, and cardiovascular pathologies) together with the sustainability topics in relation to agri-food waste and efforts for the disposal of industrial and agricultural residues [3]. For this reason, agri-food companies were encouraged to improve their production supply chain and design new eco-sustainable applications and formulations with bioactive molecules, such as phenolics, recovered from natural resources [4].
Agri-food industries generate very high levels of processing residues (about 30% of the total production). For example, stems, leaves, seeds, and peels are the main wastes generated in the different industrial steps involved in fruit and vegetable production [5]. Specific applications include the use of these residues as animal feed, soil fertilizers, or biomass to produce fuels or energy [1,6]. Moreover, the agri-food industry by-products are rich in several health-promoting substances and components, such as phenolics, that provide excellent health-positive effects [4]. Polyphenols are free-radical scavengers; these radicals are produced by aerobic metabolism, and they cause oxidative stress in living organisms. Several studies showed that phenolics are useful against cancer, aging-related issues, and neurological and cardiovascular diseases, mainly because of their high antioxidant capacity [7]. For this reason, agri-food processing wastes are an excellent natural source of phenolic compounds (circular economy), particularly for food, cosmetic, and pharmaceutical companies, following the United Nations Sustainable Development Goals [1].
Among the several applications in the agri-food sector, the recovery of phytochemicals (such as phenolics) from processing wastes is very important to valorize the industrial processes involved in the chestnut supply chain, improving its sustainability [3]. Even if most of the Castanea spp. nuts are consumed fresh, boiled, or roasted [7,8], and several techniques are used to obtain different chestnut-derived products such as flours, jams, bakery products, purées, and marron-glacés [9,10]. All these products are also important for celiac patients due to the gluten-free nature of chestnut flours [11].
Chestnut processing has increasingly grown in recent years. All the processes involved in the chestnut supply chain are characterized by the production of high levels of by-products that cause several environmental and disposal issues [3]. In any case, in recent years, by-products derived from chestnut production have gained increasing interest as a low-cost natural source useful to extract bioactive compounds and develop added-value innovative products with high antioxidant power [12]. Moreover, the management of chestnut waste is important as a strategy to improve the economic sustainability and competitiveness of the chestnut supply chain, reducing its environmental impact [13]. The Castanea spp. fruit production is related to a high number of chestnut shells, underutilized forestry, and agricultural by-products that may be evaluated as a good resource for the extraction of health-promoting natural molecules. Chestnuts are covered by a shell (i.e., about 20% of the total nut weight) that is removed during the industrial processes [13]. The removal of the chestnut shell, which is composed of the pericarp, integument, and episperm, produces several agricultural wastes that may be studied for the extraction of health-positive bioactive molecules to be re-used in many applications [14,15]. In particular, wastes derived from chestnut episperm (i.e., about 6–7% of the total nut weight) may be a very good source of active substances recognized for their health-promoting effects on humans as tannins (both hydrolyzable and condensed), phenolic acids (cinnamic acids, gallic and ellagic acids), flavonols (rutin and quercetin), and catechins (epicatechin and catechin) [3]. Few studies have been performed on the phenolic composition of chestnut episperm, but high variability in polyphenol content was reported (about 2 to 6%). Many factors seem to influence this percentage, such as genotype (cultivar and species), harvest time, pedoclimatic conditions, and extraction conditions [16]. The abundance of antioxidants and bioactive substances increases the value of the chestnut processing wastes as episperm and valorizes the potential benefits derived from the design of health-promoting products with effective applications in pharmaceutical, cosmeceutical, and nutraceutical sectors, recycling and simultaneously providing innovative economic resources [13].
The implementation and development of eco-sustainable and effective extraction protocols is an important challenge for industries to valorize the processing wastes and agri-food residues as chestnut episperm [3,13]. Phytochemical extraction is the first critical step in the isolation and purification of bioactive substances. The environmental and economic sustainability of agri-food processes is becoming one of the main issues for research institutions and industries, including not only solvents, reagents, and chemicals used to extract the health-promoting agents but also the extraction procedure and technique [17]. Conventional extraction techniques (e.g., maceration) are often applied for the recovery of phytochemicals, such as phenolics, from natural sources, but these common methodologies showed several problems (e.g., high levels of used solvents, low efficiency for the extraction, utilization of high energy) [17,18]. In the literature, many studies reported several alternative technologies for greener extraction, such as ultrasound-assisted extraction (UAE), microwave-assisted extraction, subcritical water extraction, and supercritical fluid extraction with CO2; in particular, UAE has been developed to achieve a more effective and sustainable extraction and recovery of health-promoting compounds obtaining low-cost and high-quality products overcoming the limits of traditional extraction methods [19]. In recent years, ultrasound technologies have been used as a simple, reproducible, and cheap alternative technique with a high industrial relevance to improve the extraction of bioactive molecules from food applications. The effects of ultrasounds on liquid matrices are related to the cavitation phenomena. UAE applied in food processing is very interesting because it allows an increase both in the extraction rate and yield, reducing the extraction time and obtaining a higher throughput [20,21]. Each mechanical effect involved in the extraction processes by ultrasounds may accelerate the internal diffusion and eddy, allowing a higher mass transfer if compared with traditional extraction methods and better penetration of solvent into the food matrix [22,23]. If the food substrate was previously dried, ultrasounds may then be used to facilitate hydration and swelling, causing an enlargement of cell wall pores. Additional positive effects and benefits derived from the break of the biological cell walls during cavitation induced by ultrasounds to facilitate the molecule release [24]. Moreover, the common operating conditions usually applied in UAE present no significant changes in the molecular and structural functionality and properties of most bioactive substances, such as phenolics, making this technology useful in the case of heat-sensitive molecules in food matrices [25].
Currently, the UAE technology is also widely used by food, pharmaceutical, or nutraceutical industries to improve the isolation of health-promoting agents from renewable agri-food processing wastes [26,27]. The current industrial strategy is to apply green technologies and design sustainable processes aimed to significantly reduce or eliminate the generation and use of unsafe substances, avoiding negative health and environmental impacts. For these reasons, in recent years, the characterization (extraction, purification, identification, and quantification) of phenolic compounds from agri-food wastes of industrial processes has stimulated an increasing commercial and scientific interest [28]. In this scenario, the optimization of the extraction and analysis protocols for the phytochemical study of agri-food processing wastes represents the first main step for an effective valorization of resources, increasing production sustainability and promoting an industrial economic circularity.
This preliminary study aimed to develop and optimize a sustainable protocol for the UAE of the main phenolics from chestnut episperm (cv Marsol, C. sativa × C. crenata), an important by-product derived from nut industrial processing. The phenolic characterization of the different extracts was also performed using high-performance liquid chromatography, both to define the levels of specific phenolics selected for their health-promoting properties and to evaluate some important features, such as the total antioxidant capacity. In this study, an eco-sustainable strategy for the valorization of chestnut episperm was performed through the optimization and efficiency validation of an extraction process by ultrasounds followed by a phytochemical characterization of the obtained extracts. This integrated approach allowed us to separate, identify, and quantify several classes of bioactive compounds (e.g., phenolic acids, tannins, flavonols, catechins) from dried chestnut episperm. The extraction protocol was studied to obtain high levels of phenolics using an eco-friendly process. Finally, in this research study, the potential of chestnut episperm as a source of polyphenolic molecules to be extracted by green technologies and used in several food and/or pharmaceutical applications was evaluated to valorize a sustainable reuse strategy of agri-food processing by-products, also reducing the environmental impact of this waste derived from chestnut processing.

2. Materials and Methods

2.1. Plant Material

Euro–Japanese hybrid nuts were collected during the seasonal harvest (2022 Autumn) from the germplasm repository of the Chestnut R&D Center—Piemonte (Chiusa di Pesio, Cuneo Province, Italy). Three representative plants were considered, and 1 kg of fruits (‘Marsol’ cv) for each tree was randomly picked up, transferred to the laboratory of the University of Turin (Department of Agriculture, Forestry and Food Science), and stored at 2 °C. The selected chestnut cultivar was composed of 82.7% of nut, 8.3% of pericarp, 2.1% of integument, and 6.9% of episperm (dried weight; N = 100 nuts). This cultivar was selected as a reference to optimize a model for the phenolic extraction from the episperm of the Euro–Japanese hybrids; these genotypes, characterized by high productivity, were considered in this study for their high levels of by-products to be used as alternative sources of phenolics.

2.2. Preparation of Chestnut Samples

This study was performed on nut episperm. Three replications of mature nuts (N = 3) were considered. After collecting, fresh chestnuts were first oven-roasted in an electric oven (WIPA, Stadtlohn, Germany) for 30 min at 180 °C. After processing, chestnuts were manually peeled to separate the kernel and the shell; then, the pericarp was manually separated from the episperm. Chestnut episperm samples were then immediately moved to the Food Chemistry laboratory at the University of Genoa (Department of Pharmacy) and stored at room temperature and controlled humidity for a few days until the phenolic extraction. The use of these procedures (e.g., working on dry material, storage at controlled temperature and humidity, minimizing the time before extraction) was intended to reduce the effects of the storage time on the inference process.

2.3. Optimisation of the Extraction Protocol

UAE was conducted using a sonicator (Hielscher Ultrasonics UP200 St, Teltow, Germany) operating at a frequency of 26 kHz and an effective output of 200 W. It was equipped with a 7 mm titanium (internal diameter) sonotrode suitable for the solvent volumes employed [29].
The extraction operations were carried out in pulsed mode (pulsed ultrasound-assisted extraction, PUAE) with the following set parameters: an 80% duty cycle, indicating the total “on time” in seconds per 10 s of the total cycle time, and a 50% ultrasound amplitude. Ethanol 70% served as the extraction solvent, and the temperature was maintained below 60 ± 1 °C using an ice bath. In fact, by using an ice bath, it is possible to lower the temperature, avoiding excessive increases due to the acoustic cavitation process and minimizing the thermal degradation of the samples treated with the probe. The choice of ethanol 70% as the extraction solvent was driven by its eco-friendly and non-toxic characteristics. It is also generally recognized as safe (GRAS) by the Food and Drug Administration (FDA), ensuring both safety and minimizing adverse effects [30].
In the context of studying the effects and optimizing UAE conditions, a design of experiment (DoE) approach was employed. The DoE approach was valuable in identifying the process conditions for optimizing the extraction of the aforementioned beneficial compounds from chestnut episperm. This approach focused on the two quantitative UAE process factors: the extraction time (X1), within a timeframe ranging from 10 to 30 min, and the sample-to-solvent (w/v) ratio (X2), ranging from 1/30 to 1/10. These variables were investigated to determine their impact on phenol extraction yield, with each variable tested at three levels (+1, 0, −1) to explore potential quadratic effects on the different responses. The levels are detailed in Table 1.
To optimize the process conditions, a central composite design (CCD) was employed. The postulated model of MLR is a second-order full quadratic model with an intercept, which includes two linear terms, one interaction term, and two quadratic terms, as follows:
y = b0 + b1x1 + b2x2 + b12x1x2 + b11x12 + b22x22
In fact, with the experiments selected through the CCD, it is possible to estimate a constant term (b0), the two linear terms (b1 and b2), the two-term interaction (b12), and the two quadratic terms (b11 and b22). To estimate the mentioned coefficients, the CCD requires nine experiments. Furthermore, the central point was replicated to assess experimental variability, albeit with just one degree of freedom, resulting in a total of ten experiments. The postulated model includes a total of six coefficients, estimated with four degrees of freedom. Table 2 illustrates the experimental matrix (and plan). The experiments were conducted in random order to avoid introducing unwanted systematic effects.

2.4. Spectrophotometric Analysis

The Folin–Ciocalteu colorimetric method [31] was applied to assess the total polyphenolic content (TPC), using mg of gallic acid equivalents (GAE) per g of dried weight (DW) as the expression of the results (N = 3).
The FRAP test (ferric reducing antioxidant power assay) [32] was utilized for the measurement of the antioxidant capacity (AOC), using mmol of Fe2+ equivalents per kilogram of DW as the expression of the results (N = 3).
Absorbance was measured by a UV/Vis spectrophotometer (1600-PC, VWR International, Milano, Italy) at 760 nm for TPC and 595 nm for AOC.

2.5. Chromatographic Analysis

A high-performance liquid chromatograph—HPLC (Agilent 1200 series, Agilent Technologies, Santa Clara, CA, USA) was coupled to a UV-Vis diode array detector for the chromatographic analysis.
Separation of polyphenolic markers was performed using a Kinetex—C18 column (4.6 × 150 mm, 5 μm, Phenomenex, Torrance, CA, USA). Two methods were performed to analyze the chestnut episperm extracts under the chromatographic conditions validated in other studies [33], with some modifications. The external standard calibration was applied for quantitative phenolic determination. All the results were expressed as mg·100 g−1 of DW. The HPLC conditions are detailed in Table S1 (Supplementary Materials).

2.6. Principal Component Analysis (PCA)

For a better data evaluation, a PCA was initially performed on 18 variables (i.e., 15 single phenolic markers, total phenolics by HPLC, total phenolic content by Folin–Ciocalteu, and antioxidant capacity) were tested, but only the most relevant ones were then selected for extraction modeling. Therefore, six response variables are studied: total phenolic content (Y1 = TPC, evaluated using the Folin–Ciocalteu spectrophotometric method described in paragraph 2.4), total phenolics via HPLC (Y2 = TPs HPLC, described in paragraph 2.5), antioxidant capacity (Y3 = AOC, determined using the FRAP test described in paragraph 2.4), ellagic acid content (Y4), castalagin content (Y5), and vescalagin content (Y6), which are chromatographically determined and they represent the marker compounds of Castanea spp.

2.7. Data Analysis

Results were reported as mean values ± standard deviation. A one-way analysis of variance (ANOVA) was performed on these experimental data to compare the different phenolic profiles of the extracts. Tukey’s HSD post hoc comparison test (N = 3) was applied to define significant statistical differences among mean values at the 5% level [34]. IBM SPSS Statistics 22.0 (IBM, Armonk, NY, USA) was utilized for ANOVA. Exploratory Analysis, in particular principal component analysis (PCA) and multiple linear regression (MLR), were carried out on the studied responses. The elaborations were performed using the open-source CAT software (Chemometric Agile Tool, updated version, 2 November 2023) [35]. The software CAT is a tool based on the R environment (R Core Team, Vienna, Austria).

3. Results and Discussion

3.1. Total Polyphenolic Content and Antioxidant Capacity

Despite the health-positive potential of these extracts derived from chestnut episperm, few studies showed their phenolic profile and antioxidant properties by high-level analytical techniques, such as spectrophotometry and liquid chromatography, as performed in the present research study. Moreover, in this study, an eco-sustainable technology, such as pulsed ultrasounds, was applied to recover phenolics from chestnut episperm. Table 3 reports the results obtained using spectroscopic analysis.
Concerning the TPC, the values obtained in the different experiments ranged between 97 (extract 4) and 142 (extract 6) mg GAE/g of dried weight (DW), as shown in Table 3. A previous study carried out by Ferrara et al. [13] on Castanea sativa ‘Verdole’ cv, an autochthonous variety of the Campania region (Italy), showed comparable TPC values, which ranged between 70.19 mg GAE/g DW in the inner shell and 227.43 mg GAE/g DW in the episperm. Instead, Squillaci et al. [36] reported TPC values of about 11 and 3 mg GAE/g dry matter in inner and outer chestnut shells extracted in boiling water, respectively. Moreover, results from the FRAP test (Table 3) confirmed the high TPC values, highlighting that all the ultrasound extracts contained excellent levels of molecules with good antioxidant properties, in accordance with other studies [4,13], but slightly lower than those reported by Rodrigues et al. [37] (about 800 mmol Fe2+/Kg of dried weight). In particular, extracts 2 and 3 showed the highest AOC values (about 490–505 mmol Fe2+/Kg of dried weight), as shown in Table 3, even if these extracts did not present the highest TPC values. This no-correlation between TPC-AOC may be due to the extract phenolic composition; indeed, some studies reported that different phenolic compounds showed differences in their specific AOC levels [38]. In this case, the extracts with high levels of ellagic acid (about 20–30 mg/100 g DW), one of the main antioxidant compound along with some vitamins as α-tocopherol and ascorbic acid [39], showed the highest AOC values.

3.2. Phenolic Composition by HPLC

According to several studies [14,40,41], chestnut episperm is a good source of bioactive substances, in particular phenolic compounds such as phenolic acids, ellagitannins, flavonoids, and condensed tannins, that present health-promoting properties against diseases and disorders related to oxidative stress. Moreover, the recovery of phenolic compounds from chestnut wastes (e.g., episperm) may be very useful to valorize the sustainability of chestnut processing [3]. In this study, eco-sustainable technologies (ultrasounds) were used for the recovery of polyphenolic substances from chestnut episperm. Table 4 reports the obtained results by the chromatographic analysis in relation to the main phenolic classes. The amounts of all the selected phenolic markers are reported in Supplementary Material (Table S2).
Phenolics, such as tannins and benzoic acids (i.e., gallic and ellagic acids), extracted by chestnut episperm and used as additives in food applications, may provide specific organoleptic properties (e.g., astringency, bitterness, color) and simultaneously protect the materials from oxidative stress after production and during conservation [9,42]. In this study, the total levels of phenolics in chestnut episperm, identified by HPLC, ranged from 300 to 450 mg/100 g DW, according to other studies [13,36]. Cinnamic acids and tannins were the main phenolic classes (about 25–35% and 35–45% of the total phenolics, respectively), as shown in Table 4, slightly less than other previous works [40,43]. Indeed, Squillaci et al. [36] reported that tannins represented the main phenolic class, accounting for between 60% and 80% of the total phenolic compounds. In particular, episperm extracts contained high levels of chlorogenic acid (15–25 mg/100 g DW), ferulic acid (80–120 mg/100 g DW), castalagin (20–80 mg/100 g DW), and vescalagin (40–75 mg/100 g DW) (Table S2), as shown in other similar studies [4,40]. These molecules show low toxicity, important cholesterol-lowering and free-radical scavenging capacities, and chemo-preventive effects on heart disorders, together with anti-aging and anti-inflammatory activities [44]. Other phenolics (benzoic acids), such as ellagic acid (10–30 mg/100 g DW) and gallic acid (2–10 mg/100 g DW) (Table S2), were also detected and quantified (4–10% of the total phenolics). Other studies reported higher amounts of gallic acid (about 50–60 mg/100 DW) and ellagic acid (about 60–80 mg/100 DW) [36]. The difference in the levels of gallic and ellagic acids between this research study and other studies may be due to a different starting level of tannins among the considered chestnut genotype. Indeed, some studies reported that ellagic acid and other metabolites derive from tannins after a drying process [45]. Benzoic acids are important in nutrition for their many biological effects on humans, including anti-inflammatory activity and antioxidant capacity [46]. Catechins (catechin and epicatechin) and flavonols (isoquercitrin) were also present in good amounts (about 15–25% and 10–15% of the total phenolics, respectively), as shown in Table 4. In particular, episperm extracts contained good levels of catechin (15–50 mg/100 g DW), epicatechin (25–70 mg/100 g DW), and isoquercitrin (35–70 mg/100 g) (Table S2), as reported in other previous studies [4,13]. Squillaci et al. [36] reported similar amounts for catechin and epicatechin (about 30–70 mg/100 g DW). Catechins are considered important for the inhibition of lipid peroxidation, while flavonols are useful for the inhibition of in vitro oxidation of low-density lipoproteins [9].

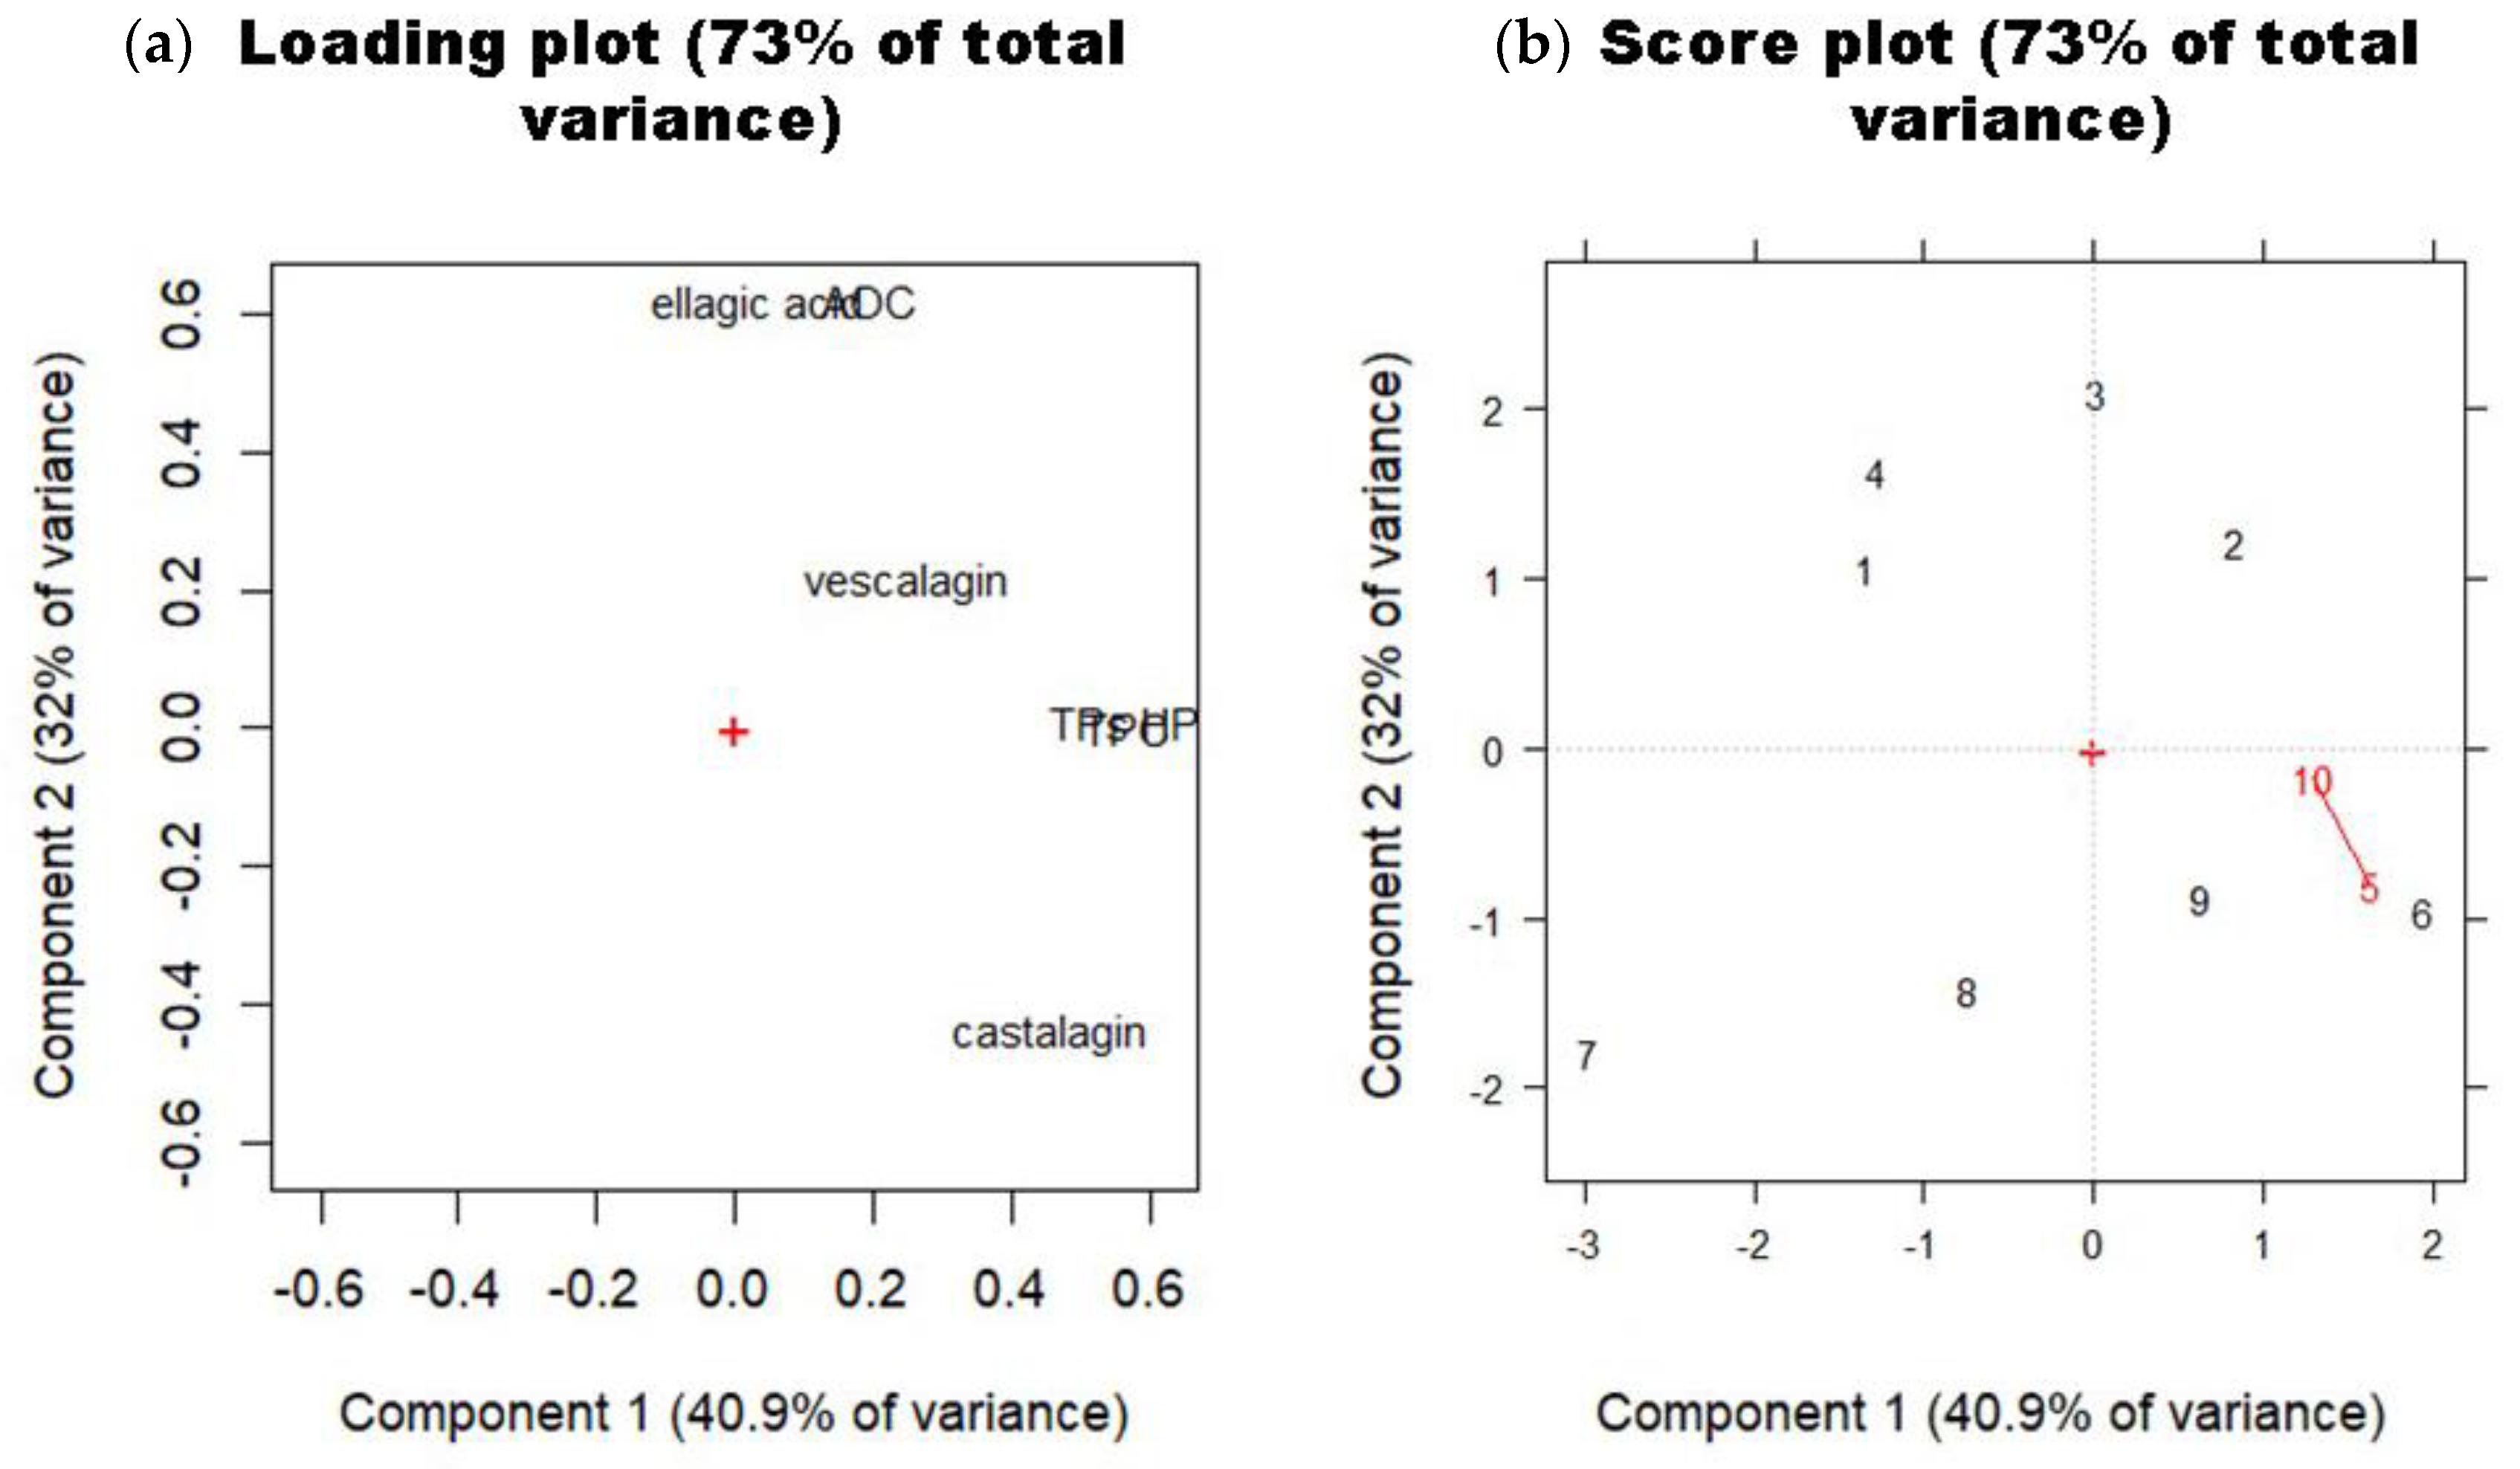
3.3. Multivariate Approach

In this study, the DoE approach aiming for the estimation of quadratic terms (CCD) was applied to optimize the extraction process conditions of phenolic compounds from the chestnut episperm. To better visualize the sample dispersion and understand the correlation structure, a PCA was performed on six more relevant studied responses (Figure 1). The following response variables have been studied: total phenolic content (Y1 = TPC, evaluated using the Folin–Ciocalteu spectrophotometric method), total phenolics via HPLC (Y2 = TPs HPLC), AOC (Y3 = antioxidant capacity), ellagic acid content (Y4), castalagin content (Y5), and vescalagin content (Y6), which represent the main marker compounds of Castanea spp. The results of the PCA performed on the set of variables have been added as supplementary material (Figure S1).
Due to the multivariate statistical approach used, as an initial result, it was observed that across all the examined responses, the replicates exhibited low experimental variability, which is lower than the variability induced in the system by the experimental design itself. Notably, the responses for total phenolic content (Y1 = TPC, assessed using the Folin–Ciocalteu method) and total phenolics via HPLC (Y2 = TPs HPLC) demonstrated a strong positive correlation (r = 0.750; p < 0.05). This correlation has suggested the potential for leveraging the faster and cheaper analytical method, and particularly for this matrix, the colorimetric Folin–Ciocalteu test demonstrated to be useful and accurate in estimating the polyphenolic content of the obtained extracts.
The loading plot, displayed on the PC1-PC2 plane (Figure 1a), showed the correlation structure among the studied responses. PC1 primarily explained the variation in TPC and HPLC-based TP responses, confirming the positive correlation between them. These responses were also partially positively correlated with castalagin but exhibited no correlation with ellagic acid and antioxidant capacity (AOC). PC2, on the other hand, explained the antioxidant capacity, with ellagic acid directly correlated while exhibiting a partial inverse relationship with castalagin. These data confirmed that the antioxidant capacity is not always only correlated with the total amount of phenolic compounds but strongly depends on the presence of specific phenolics (i.e., ellagic acid), as previously discussed.
The score plot (Figure 1b), presented in the PC1-PC2 plane, illustrated the dispersion of the 10 experiments. Notably, the red segment connecting the replicates of the central point (5, 10) highlighted low experimental variability compared with the global induced variability through the DoE strategy. The positioning of the replicates at the domain boundaries suggested a potential quadratic behavior in the responses. Moreover, experiments 2, 6, and 9, along with the replicates at the central point, showed positive scores on PC1, indicating elevated values, particularly for TPC and HPLC-based TPs. In contrast, experiments 1, 2, 3, and 4, characterized by positive scores on PC2, exhibited superior antioxidant capacity and a higher ellagic acid content. To precisely quantify the factor effects on the system and thoroughly study the curvature of the responses, it was imperative to perform the models’ calculation. Based on the planned experiments, the following full quadratic models have been obtained and reported in Table 5.
Generally, the models explained a high variance and presented an acceptable variance in prediction, apart from ellagic acid (Y4), which results in a negative explained variance, and for this reason, the model is not reported (E.V.% = −9.72). The standard deviations of the residuals for the responses aligned with the experimental variability observed at the center point, indicating the absence of any lack of fit. The significance levels of the coefficients are denoted in accordance with the common convention: * for p < 0.05, ** for p < 0.01, and *** for p < 0.001.
The models and response surfaces were discussed, and these surfaces are illustrated in Figure 2. In detail, for the TPC response (Y1), only the extraction time was significant. The linear and quadratic terms related to the sample/solvent ratio were close to statistical significance. It is observed that, for the TPC response, working at longer extraction times with intermediate sample/solvent ratios was crucial. The coefficient profile for the HPLC-based TP response (Y2) was analogous to the TPC response. The information was nearly identical: it is better to operate at longer extraction times with intermediate sample/solvent ratios. Regarding the antioxidant capacity (AOC, Y3), in this case, the only significant variable was the sample/solvent ratio. Lower ratios favored higher AOC. The response surface was, therefore, a plane (with no interaction or curvature). Lower ratios were preferred in this case. For castalagin (Y5), the variance explained by the model was not high, so the model was more qualitative than purely predictive. No significant coefficients were observed, but the absolute values of the coefficients related to time were high. A curvature was observed for the time variable, with a peak around medium to high values. For the vescalagin response (Y6), the interaction term was the only significant one. To interpret it, a response surface was studied, in which the effect of the extraction time depends on the level of the sample/solvent ratio. In this case, there was a reversal of effects: at short extraction times, increasing ratios led to reduced extraction, while at longer times, higher ratios favored vescalagin extraction. Conversely, better results were achieved at low ratios and short times, while at higher ratios, longer times were preferred.
To achieve a good compromise between responses, it was sufficient to work at longer times (30 min) and intermediate ratios (1/20).

4. Conclusions

In this study, the valorization of the chestnut episperm, an underutilized industrial by-product, has been defined as a good opportunity to improve the sustainability of the transformation processes involved in the chestnut supply chain in terms of recovery of good levels of health-promoting molecules, such as phenolics, reducing the disposal of agri-food wastes.
Moreover, in this work, the effectiveness of an eco-friendly and low-cost extraction system based on ultrasounds and food-grade solvent (ethanol 70%) has also been investigated for the extraction of several phenolic markers from chestnut episperm. The proposed optimized protocol allowed for obtaining formulations characterized by high levels of tannins, phenolic acids, and catechins. Indeed, episperm extracts contained high levels of chlorogenic acid, ferulic acid, castalagin, and vescalagin. Particularly, thanks to a multivariate statistical approach, it was possible to underline the best compromise between the studied responses, highlighting that it was sufficient to sonicate at longer times (30 min) and intermediate sample/solvent ratios (1/20) to maximize the phenolic extraction. Moreover, the results highlighted that the targeted HPLC analysis and the colorimetric Folin–Ciocalteu method used to evaluate the total phenolic content showed a strong positive correlation, also confirmed by principal component analysis, suggesting that, for this plant matrix, the rapid and cheaper spectroscopic analytical method could be useful to estimate the polyphenolic content of the extracts.
These extracts, enriched in phenolic compounds, may be used for cosmeceutical and food applications, but further chemical and pharmacological studies are necessary. The use of these extracts in innovative applications is potentially a very important goal, considering the increasing demand for natural bioactive molecules. Chestnut companies may improve their incomes and obtain further economic advantages by the extraction of bioactive molecules from processing wastes as episperm and the selling of these additional preparations in the market, also avoiding spending financial resources for the by-product disposal.
Finally, this study may be important to contribute to the effective valorization of by-products from chestnut processing in terms of reducing environmental wastes and recycling them for innovative uses.

Supplementary Materials

The following supporting information can be downloaded at: https://www.mdpi.com/article/10.3390/agriculture14020246/s1, Figure S1: The results of the PCA performed on the set of variables. Table S1: Chromatographic conditions of the used methods. Table S2: Chromatographic fingerprint of the analyzed extracts.

Author Contributions

Conceptualization, D.D., F.T., R.B., and G.G.; methodology, D.D. and F.T.; validation, D.D. and F.T.; formal analysis, D.D., E.F., G.G., and F.T.; investigation, D.D. and F.T.; resources, M.G.M. and G.G.; data curation, D.D. and F.T.; writing—original draft preparation, D.D., E.F., and F.T.; writing—review and editing, D.D., F.T., M.G.M., G.G., R.B. and G.L.B.; supervision, R.B. and G.G.; project administration, R.B. and G.L.B.; funding acquisition, R.B. and G.L.B. All authors have read and agreed to the published version of the manuscript.

Funding

Project National Center 410 for the Development of New Technologies in Agriculture (Agritech), funded under the National 411 Recovery and Resilience Plan (NRRP), Mission 4 Component 2 Investment 1.4—Call for tender No. 412 3138 of 16 December 2021, rectified by Decree n.3175 of 18 December 2021 of the Italian Ministry of 413 University and Research, funded by the European Union, NextGenerationEU, Project code_CN 414 00000022, Concession Decree No. 1032 of 17 June 2022, adopted by the Italian Ministry of University 415 and Research, CUP B63D21015240004.

Institutional Review Board Statement

Not applicable.

Informed Consent Statement

Not applicable.

Data Availability Statement

Data are contained within the article and Supplementary Materials.

Acknowledgments

The authors thank the Chestnut R&D Center—Piemonte for providing plant material.

Conflicts of Interest

The authors declare no conflict of interest.

References

  1. Mir-Cerdà, A.; Nuñez, O.; Granados, M.; Sentellas, S.; Saurina, J. An overview of the extraction and characterization of bioactive phenolic compounds from agri-food waste within the framework of circular bioeconomy. TrAC Trends Anal. Chem. 2023, 161, 116994. [Google Scholar] [CrossRef]
  2. Scarlat, N.; Fahl, F.; Lugato, E.; Monforti-Ferrario, F.; Dallemand, J. Integrated and spatially explicit assessment of sustainable crop residues potential in europe. Biomass-Bioenergy 2019, 122, 257–269. [Google Scholar] [CrossRef]
  3. Conidi, C.; Donato, L.; Algieri, C.; Cassano, A. Valorization of chestnut processing by-products: A membrane-assisted green strategy for purifying valuable compounds from shells. J. Clean. Prod. 2022, 378, 134564. [Google Scholar] [CrossRef]
  4. Pinto, D.; Cádiz-Gurrea, M.d.l.L.; Vallverdú-Queralt, A.; Delerue-Matos, C.; Rodrigues, F. Castanea sativa shells: A review on phytochemical composition, bioactivity and waste management approaches for industrial valorization. Food Res. Int. 2021, 144, 110364. [Google Scholar] [CrossRef]
  5. Vella, F.M.; De Masi, L.; Calandrelli, R.; Morana, A.; Laratta, B. Valorization of the agro-forestry wastes from italian chestnut cultivars for the recovery of bioactive compounds. Eur. Food Res. Technol. 2019, 245, 2679–2686. [Google Scholar] [CrossRef]
  6. Kowalska, H.; Czajkowska, K.; Cichowska, J.; Lenart, A. What’s new in biopotential of fruit and vegetable by-products applied in the food processing industry. Trends Food Sci. Technol. 2017, 67, 150–159. [Google Scholar] [CrossRef]
  7. Donno, D.; Mellano, M.G.; Carini, V.; Bergamasco, E.; Gamba, G.; Beccaro, G.L.J.A. Application of traditional cooking methods in chestnut processing: Effects of roasting and boiling on secondary metabolites and antioxidant capacity in Castanea spp. Fruits. Agriculture 2023, 13, 530. [Google Scholar] [CrossRef]
  8. Chang, S.K.; Alasalvar, C.; Bolling, B.W.; Shahidi, F. Nuts and their co-products: The impact of processing (roasting) on phenolics, bioavailability, and health benefits—A comprehensive review. J. Funct. Foods 2016, 26, 88–122. [Google Scholar] [CrossRef]
  9. Donno, D.; Fabro, M.; Mellano, M.G.; Gamba, G.; Fioccardi, A.; Beccaro, G.L. Integrating traditional wheat-based foods with high health value flours: Castanea spp. Agro-biodiversity in bakery products. Agriculture 2022, 12, 946. [Google Scholar] [CrossRef]
  10. Šoronja-Simović, D.; Pajin, B.; Šubarić, D.; Dokić, L.; Šereš, Z.; Nikolić, I. Quality, sensory and nutritional characteristics of cookies fortified with chestnut flour. J. Food Process. Preserv. 2017, 41, e12887. [Google Scholar] [CrossRef]
  11. Durazzo, A.; Turfani, V.; Azzini, E.; Maiani, G.; Carcea, M. Phenols, lignans and antioxidant properties of legume and sweet chestnut flours. Food Chem. 2013, 140, 666–671. [Google Scholar] [CrossRef]
  12. Vella, F.M.; Laratta, B.; La Cara, F.; Morana, A. Recovery of bioactive molecules from chestnut (Castanea sativa mill.) by-products through extraction by different solvents. Nat. Prod. Res. 2018, 32, 1022–1032. [Google Scholar] [CrossRef]
  13. Ferrara, E.; Pecoraro, M.T.; Cice, D.; Piccolella, S.; Formato, M.; Esposito, A.; Petriccione, M.; Pacifico, S. A joint approach of morphological and uhplc-hrms analyses to throw light on the autochthonous ‘verdole’ chestnut for nutraceutical innovation of its waste. Molecules 2022, 27, 8924. [Google Scholar] [CrossRef]
  14. de Vasconcelos, M.; Bennett, R.N.; Quideau, S.; Jacquet, R.; Rosa, E.A.S.; Ferreira-Cardoso, J.V. Evaluating the potential of chestnut (Castanea sativa mill.) fruit pericarp and integument as a source of tocopherols, pigments and polyphenols. Ind. Crop. Prod. 2010, 31, 301–311. [Google Scholar] [CrossRef]
  15. de Vasconcelos, M.; Nunes, F.; Viguera, C.G.; Bennett, R.N.; Rosa, E.A.S.; Ferreira-Cardoso, J.V. Industrial processing effects on chestnut fruits (Castanea sativa mill.) 3. Minerals, free sugars, carotenoids and antioxidant vitamins. Int. J. Food Sci. Technol. 2010, 45, 496–505. [Google Scholar] [CrossRef]
  16. Beccaro, G.L.; Donno, D.; Lione, G.G.; De Biaggi, M.; Gamba, G.; Rapalino, S.; Riondato, I.; Gonthier, P.; Mellano, M.G. Castanea spp. Agrobiodiversity conservation: Genotype influence on chemical and sensorial traits of cultivars grown on the same clonal rootstock. Foods 2020, 9, 1062. [Google Scholar] [CrossRef]
  17. Turrini, F.; Donno, D.; Beccaro, G.L.; Pittaluga, A.; Grilli, M.; Zunin, P.; Boggia, R. Bud-derivatives, a novel source of polyphenols and how different extraction processes affect their composition. Foods 2020, 9, 1343. [Google Scholar] [CrossRef]
  18. Giacometti, J.; Kovačević, D.B.; Putnik, P.; Gabrić, D.; Bilušić, T.; Krešić, G.; Stulić, V.; Barba, F.J.; Chemat, F.; Barbosa-Cánovas, G.; et al. Extraction of bioactive compounds and essential oils from mediterranean herbs by conventional and green innovative techniques: A review. Food Res. Int. 2018, 113, 245–262. [Google Scholar] [CrossRef] [PubMed]
  19. Cagliero, C.; Marengo, A.; Sgorbini, B.; Rubiolo, P. Green strategies for analysis of natural products. In Green Approaches for Chemical Analysis; Elsevier: Amsterdam, The Netherlands, 2023; pp. 85–125. [Google Scholar]
  20. Soria, A.C.; Villamiel, M. Effect of ultrasound on the technological properties and bioactivity of food: A review. Trends Food Sci. Technol. 2010, 21, 323–331. [Google Scholar] [CrossRef]
  21. Goula, A.M.; Ververi, M.; Adamopoulou, A.; Kaderides, K. Green ultrasound-assisted extraction of carotenoids from pomegranate wastes using vegetable oils. Ultrason. Sonochem. 2017, 34, 821–830. [Google Scholar] [CrossRef] [PubMed]
  22. Gallo, M.; Ferrara, L.; Naviglio, D. Application of ultrasound in food science and technology: A perspective. Foods 2018, 7, 164. [Google Scholar] [CrossRef] [PubMed]
  23. Chemat, F.; Rombaut, N.; Sicaire, A.-G.; Meullemiestre, A.; Fabiano-Tixier, A.-S.; Abert-Vian, M. Ultrasound assisted extraction of food and natural products. Mechanisms, techniques, combinations, protocols and applications. A review. Ultrason. Sonochem. 2017, 34, 540–560. [Google Scholar] [CrossRef] [PubMed]
  24. Ashokkumar, M. Applications of ultrasound in food and bioprocessing. Ultrason. Sonochem. 2015, 25, 17–23. [Google Scholar] [CrossRef] [PubMed]
  25. Fu, X.; Belwal, T.; Cravotto, G.; Luo, Z. Sono-physical and sono-chemical effects of ultrasound: Primary applications in extraction and freezing operations and influence on food components. Ultrason. Sonochem. 2020, 60, 104726. [Google Scholar] [CrossRef] [PubMed]
  26. Osorio-Tobón, J.F. Recent advances and comparisons of conventional and alternative extraction techniques of phenolic compounds. J. Food Sci. Technol. 2020, 57, 4299–4315. [Google Scholar] [CrossRef] [PubMed]
  27. Paraíso, C.M.; dos Santos, S.S.; Correa, V.G.; Magon, T.; Peralta, R.M.; Visentainer, J.V.; Madrona, G.S. Ultrasound assisted extraction of hibiscus (Hibiscus sabdariffa L.) bioactive compounds for application as potential functional ingredient. J. Food Sci. Technol. 2019, 56, 4667–4677. [Google Scholar] [CrossRef] [PubMed]
  28. Aires, A.; Carvalho, R.; Saavedra, M.J. Valorization of solid wastes from chestnut industry processing: Extraction and optimization of polyphenols, tannins and ellagitannins and its potential for adhesives, cosmetic and pharmaceutical industry. Waste Manag. 2016, 48, 457–464. [Google Scholar] [CrossRef]
  29. Capelo-Martínez, J.-L. Ultrasound in Chemistry: Analytical Applications; John Wiley & Sons: Hoboken, NJ, USA, 2009. [Google Scholar]
  30. Turrini, F.; Boggia, R.; Leardi, R.; Borriello, M.; Zunin, P.J.M. Optimization of the ultrasonic-assisted extraction of phenolic compounds from oryza sativa l.‘Violet nori’and determination of the antioxidant properties of its caryopses and leaves. Molecules 2018, 23, 844. [Google Scholar] [CrossRef]
  31. Slinkard, K.; Singleton, V.L. Total phenol analysis: Automation and comparison with manual methods. Am. J. Enol. Vitic. 1977, 28, 49–55. [Google Scholar] [CrossRef]
  32. Benzie, I.F.; Strain, J. Ferric reducing/antioxidant power assay: Direct measure of total antioxidant activity of biological fluids and modified version for simultaneous measurement of total antioxidant power and ascorbic acid concentration. Methods Enzymol. 1999, 299, 15–27. [Google Scholar]
  33. Donno, D.; Hassani, S.; Sofoini, T.; Mellano, M.G.; Riondato, I.; Gamba, G.; Beccaro, G.L. Traditional foods and sustainable rural development: Exploiting the case of the comoros tea as a potential source of bioactive compounds. Sustainability 2021, 13, 5815. [Google Scholar] [CrossRef]
  34. Crawley, M. The r Book, 2nd ed.; John Wiley & Sons. Ltd.: Chichester UK, 2013. [Google Scholar]
  35. Leardi, C.M.R.; Polotti, G. Cat (Chemometric Agile Tool). Available online: http://gruppochemiometria.it/index.php/software (accessed on 20 September 2023).
  36. Squillaci, G.; Apone, F.; Sena, L.M.; Carola, A.; Tito, A.; Bimonte, M.; Lucia, A.D.; Colucci, G.; Cara, F.L.; Morana, A. Chestnut (Castanea sativa mill.) industrial wastes as a valued bioresource for the production of active ingredients. Process Biochem. 2018, 64, 228–236. [Google Scholar] [CrossRef]
  37. Rodrigues, F.; Santos, J.; Pimentel, F.B.; Braga, N.; Palmeira-de-Oliveira, A.; Oliveira, M.B.P. Promising new applications of castanea sativa shell: Nutritional composition, antioxidant activity, amino acids and vitamin e profile. Food Funct. 2015, 6, 2854–2860. [Google Scholar] [CrossRef]
  38. Ratnam, D.V.; Ankola, D.D.; Bhardwaj, V.; Sahana, D.K.; Kumar, M.N. Role of antioxidants in prophylaxis and therapy: A pharmaceutical perspective. J. Control Release 2006, 113, 189–207. [Google Scholar] [CrossRef]
  39. Ríos, J.-L.; Giner, R.M.; Marín, M.; Recio, M.C. A pharmacological update of ellagic acid. Planta Medica 2018, 84, 1068–1093. [Google Scholar] [CrossRef]
  40. Pinto, D.; Silva, A.M.; Freitas, V.; Vallverdú-Queralt, A.; Delerue-Matos, C.; Rodrigues, F. Microwave-assisted extraction as a green technology approach to recover polyphenols from castanea sativa shells. ACS Food Sci. Technol. 2021, 1, 229–241. [Google Scholar] [CrossRef]
  41. Barreira, J.C.M.; Ferreira, I.C.F.R.; Oliveira, M.B.P.P.; Pereira, J.A. Antioxidant activities of the extracts from chestnut flower, leaf, skins and fruit. Food Chem. 2008, 107, 1106–1113. [Google Scholar] [CrossRef]
  42. Turrini, F.; Boggia, R.; Donno, D.; Parodi, B.; Beccaro, G.; Baldassari, S.; Signorello, M.G.; Catena, S.; Alfei, S.; Zunin, P. From pomegranate marcs to a potential bioactive ingredient: A recycling proposal for pomegranate-squeezed marcs. Eur. Food Res. Technol. 2020, 246, 273–285. [Google Scholar] [CrossRef]
  43. Vázquez, G.; Pizzi, A.; Freire, M.S.; Santos, J.; Antorrena, G.; González-Álvarez, J. Maldi-tof, hplc-esi-tof and 13c-nmr characterization of chestnut (Castanea sativa) shell tannins for wood adhesives. Wood Sci. Technol. 2013, 47, 523–535. [Google Scholar] [CrossRef]
  44. García-Villalba, R.; Espín, J.C.; Aaby, K.; Alasalvar, C.; Heinonen, M.; Jacobs, G.; Voorspoels, S.; Koivumäki, T.; Kroon, P.A.; Pelvan, E.; et al. Validated method for the characterization and quantification of extractable and nonextractable ellagitannins after acid hydrolysis in pomegranate fruits, juices, and extracts. J. Agric. Food Chem. 2015, 63, 6555–6566. [Google Scholar] [CrossRef] [PubMed]
  45. Landete, J.M. Ellagitannins, ellagic acid and their derived metabolites: A review about source, metabolism, functions and health. Food Res. Int. 2011, 44, 1150–1160. [Google Scholar] [CrossRef]
  46. Fracassetti, D.; Costa, C.; Moulay, L.; Tomás-Barberán, F.A. Ellagic acid derivatives, ellagitannins, proanthocyanidins and other phenolics, vitamin c and antioxidant capacity of two powder products from camu-camu fruit (Myrciaria dubia). Food Chem. 2013, 139, 578–588. [Google Scholar] [CrossRef] [PubMed]
Figure 1. Loading plot (a) and score plot (b) are presented for the first two components (PC1-PC2, which explain 73% of the total variance. In the score plot, the red segment connects the replicates, emphasizing the significantly smaller experimental variability compared with the induced variability. The overlapping between ellagic acid and AOC (on the top of Figure 1a) and the overlapping between TPC and TPs HPLC (on the right of Figure 1a) can be observed.
Agriculture 14 00246 g001
Figure 2. Isoresponse surfaces, each accompanied by the respective semi-amplitude of the confidence interval of the prediction.
Agriculture 14 00246 g002
Table 1. Factors and the respective levels involved in the process.
Extraction ParametersExperimental CCD Matrix
Extraction Time (min)
ID Code: x1
Sample/Solvent Ratio (w/v)
ID Code: x2
Levels
101/30−1
201/200
301/10+1
CCD = Central Composite Design.
Table 2. Experimental values of the considered extraction factors (extraction time and sample/solvent ratio) and respective CCD matrix levels for each analyzed extract.
Extraction Time (min)Sample/Solvent Ratio (w/v)
Extract ID CodeExperimental Values CCD Matrix LevelsExperimental ValuesCCD Matrix Levels
110−11/30−1
22001/30−1
33011/30−1
410−11/200
52001/200
63011/200
710−11/101
82001/101
93011/101
102001/200
CCD: Central Composite Design.
Table 3. Total polyphenolic content (TPC) by Folin–Ciocalteu assay and antioxidant capacity (AOC) using the FRAP test of the considered ultrasound extracts.
TPCAOC
Extract ID Code(mg GAE/g DW)(mmol Fe2+/Kg DW)
1101.45 ± 0.09 c459.30 ± 57.96 c
2119.63 ± 1.86 e490.68 ± 72.72 c
3132.53 ± 0.73 g505.12 ± 57.38 c
496.93 ± 1.10 b356.36 ± 28.07 b
5122.35 ± 0.13 f351.81 ± 35.72 b
6142.04 ± 1.12 h342.10 ± 46.03 b
790.88 ± 1.31 a162.95 ± 44.90 a
8113.92 ± 0.17 d173.97 ± 46.70 a
9124.84 ± 0.53 fg206.92 ± 46.01 a
10128.40 ± 0.39 fg340.45 ± 59.69 b
Results were reported as mean values ± standard deviation. Different letters indicate significant statistical differences (p < 0.05) among all the considered extracts (N = 3). DW = dried weight; GAE = gallic acid equivalent.
Table 4. Polyphenolic fingerprint and total phenolics (TPs) from the HPLC analysis of the considered ultrasound extracts.
Cinnamic AcidsFlavonolsBenzoic AcidsCatechinsTanninsTPs
Extract ID Code(mg/100 g DW)(mg/100 g DW)(mg/100 g DW)(mg/100 g DW)(mg/100 g DW)(mg/100 g DW)
1137.80 ± 4.69 d38.28 ± 1.27 a12.61 ± 1.25 a76.07 ± 6.58 b92.60 ± 6.42 ab357.35 ± 6.40 ab
2101.77 ± 6.73 a44.73 ± 1.67 b29.37 ± 1.19 c89.50 ± 3.55 d130.54 ± 3.03 bc395.92 ± 9.86 d
3137.59 ± 4.62 d42.41 ± 2.05 b35.96 ± 1.30 d81.56 ± 6.44 bc82.01 ± 6.42 a379.53 ± 9.74 c
4129.72 ± 4.03 c52.09 ± 1.80 c29.31 ± 1.68 c86.75 ± 5.94 c85.96 ± 7.92 ab383.83 ± 5.24 c
5129.49 ± 5.00 c67.00 ± 1.75 d17.07 ± 1.21 b87.66 ± 5.34 c140.00 ± 6.51 c441.21 ± 8.73 e
6136.49 ± 5.95 d60.47 ± 1.72 cd20.19 ± 1.16 b69.61 ± 4.44 a137.10 ± 7.43 c423.87 ± 5.14 e
7103.60 ± 5.08 ab41.42 ± 2.17 b14.33 ± 1.32 a73.06 ± 5.54 b86.43 ± 7.04 ab318.84 ± 5.78 a
8111.67 ± 5.98 b57.09 ± 3.13 cd20.16 ± 1.31 b70.01 ± 4.56 a111.33 ± 7.00 b370.26 ± 6.38 b
9115.44 ± 5.33 b51.94 ± 2.35 c19.90 ± 1.23 b84.18 ± 6.64 c130.51 ± 5.50 bc401.98 ± 8.05 d
10131.29 ± 3.53 c50.25 ± 4.64 c24.76 ± 0.57 bc85.99 ± 3.96 c129.57 ± 5.04 bc421.86 ± 10.64 e
Results were reported as mean values ± standard deviation. Different letters indicate significant statistical differences (p < 0.05) among all the considered extracts (N = 3). DW = dried weight.
Table 5. Coefficients of the MLR models for each response with the corresponding p-value and the significance indicators (i.e., * for p < 0.05, ** for p < 0.01, and *** for p < 0.001).
MLR ModelTPC
y1
TPs HPLC
y2
AOC
y3
Castalagin
y5
Vescalagin
y6
Termcoeff.p-valuecoeff.p-valuecoeff.p-valuecoeff.p-valuecoeff.p-value
b0124.9 429.0 346.7 70.5 64.2
ET18.40.00***24.20.00**12.60.17 13.90.12 0.20.91
S/S R−4.00.09 −7.00.16 −151.90.00***7.60.34 −3.80.15
ET × S/S R0.70.76 15.20.04*−0.50.96 −1.50.87 15.20.00**
ET^2−5.00.15 −22.50.03*2.00.87 −19.90.15 −3.30.39
S/S R^2−7.70.05 −43.30.00**−14.90.29 −11.80.36 −1.90.60
E.V.%92.9 92.5 97.8 35.5 79.2
SD of the residuals4.4 9.9 18.4 17.3 5.2
MLR = Multiple Linear Regression; ET = Extraction Time; S/S R = Sample/Solvent Ratio; ET × S/S R = Extraction Time × Sample/Solvent Ratio; ET^2 = Extraction Time^2; S/S R^2 = Sample/Solvent Ratio^2; E.V.% = explained variance percentage; SD of the residuals = standard deviation of residuals.
Disclaimer/Publisher’s Note: The statements, opinions and data contained in all publications are solely those of the individual author(s) and contributor(s) and not of MDPI and/or the editor(s). MDPI and/or the editor(s) disclaim responsibility for any injury to people or property resulting from any ideas, methods, instructions or products referred to in the content.

