1. Introduction
Cotton is an essential strategic reserve material in China and one of the major cash crops in Xinjiang [
1]. Xinjiang has consistently maintained its leading position in China for 28 consecutive years in terms of cotton production and planting area [
2]. Moreover, the adoption of machine harvesting for cotton in Xinjiang is a significant trend. Round mold baling cotton pickers have emerged as the predominant trend in the technological development of cotton pickers due to their advantages, such as high compression density, low operating cost, and high transportation and storage efficiency [
3]. Although compression plays a vital role in the cotton picker baling process, field trials have revealed issues with machine-harvested seed cotton. These problems include bale cracking, loose bales, and nonformation after baling. Researchers have shown that fiber materials exhibit viscoelastic behavior during deformation [
4]. Seed cotton is an agricultural fiber material [
5] that exhibits viscoelastic behaviors, including stress relaxation, creep, and springback, during the postprocessing steps, such as compression molding and baling. These behaviors contribute to size and shape changes in the bales relative to their initial baling, resulting in poor dimensional stability and even potential damage to the bale. Hence, the rheological characteristics of stress relaxation, creep, and springback in seed cotton play a crucial role in optimization relevant to baling equipment parameters, power consumption, and bale dimensional stability [
6]. Meanwhile, modern computing tools are known for their speed, efficiency, and cost-effectiveness. When these modern computational tools are applied to seed cotton, a notable challenge arises due to the relatively limited availability of data on the rheological properties of the material. Accordingly, the rheological properties of seed cotton must be explored. Kong et al. [
6,
7] studied the compression and stress relaxation characteristics of seed cotton and obtained the influence of moisture content and feeding quality on the compression and stress relaxation model, which can provide a theoretical reference for the compression process of seed cotton and the optimal design of the baling mechanism.
Scholars have conducted less research on the creep characteristics of machine-harvested seed cotton. Hardin used the Burgers model to study the compression and creep characteristics of scattered low-density (64–128 kg/m
3) cotton. The results showed that the number of compression (15 times) had an effect on the compression density [
8]. However, the density of the existing harvesting and packaging machine could reach 199–240 kg/m
3 [
9]. Research results on other agricultural materials are more abundant, and the theory is more well established [
10,
11,
12]. Xiao et al. [
13] outlined the creep properties of rice seedlings by using the Burgers model and showed that different load levels have an influence on creep parameters. The creep strain rate under constant and cyclic humidity conditions was linearly related to the applied load level [
11]. Graham et al. [
14] used a nonlinear viscoelastic model to simulate the creep process of grass materials and noted that the parameters in the model were related to the stress, material type, and moisture content. Nielsen et al. [
15] proposed a nonlinear Maxwell model to simulate the compression and stress relaxation behavior of agricultural materials during compression and found that the compression speed was related to the model parameters. Du et al. [
16] established a five-element Maxwell mathematical model. The parameter optimization tests indicated that the specific energy consumption was minimal at a moisture content of 57%, providing a theoretical foundation for the optimal design of low-density straw block compression equipment and the required energy consumption.
The superimposed vibration on the biomass compression process could increase the stress relaxation rate and minimize the stress relaxation time and residual stress inside the forming block, which could minimize the compression resistance and energy consumption of recompression and improve the product quality and productivity [
17]. Moreover, continuous compression can remove air between fibers and promote fiber densification, and the energy consumption of each layer exponentially increases with the compression volume [
18]. The relaxation ratio of maize straw compression molding was 1.2–1.5 at a compression force of 6.22 MPa, a compression time of 2–6 times, and a compression speed of 128–337 mm·min
−1 [
19].
In summary, the loading method of agricultural materials affects not only their power consumption during compression but also their subsequent rheological properties, such as stress relaxation, creep, and springback. A single-factor experiment was conducted to investigate the influence of the cyclic loading method on the energy consumption and creep performance of machine-harvested seed cotton, minimize the power consumption during the loading process of seed cotton, and obtain a better loading method of seed cotton. The effects of cyclic loading times, cyclic stress peak, and cyclic loading frequency on the energy consumption of the cyclic loading stage and the creep performance of the creeping stage of machine-harvested seed cotton were investigated through a combination of experimental and theoretical methods. The experimental results can provide academic and data support for studying the rheological characteristics of seed cotton, designing the seed cotton baling device, and clarifying the seed cotton forming mechanism and the molding quality of the molding bale (mold).
3. Results and Discussion
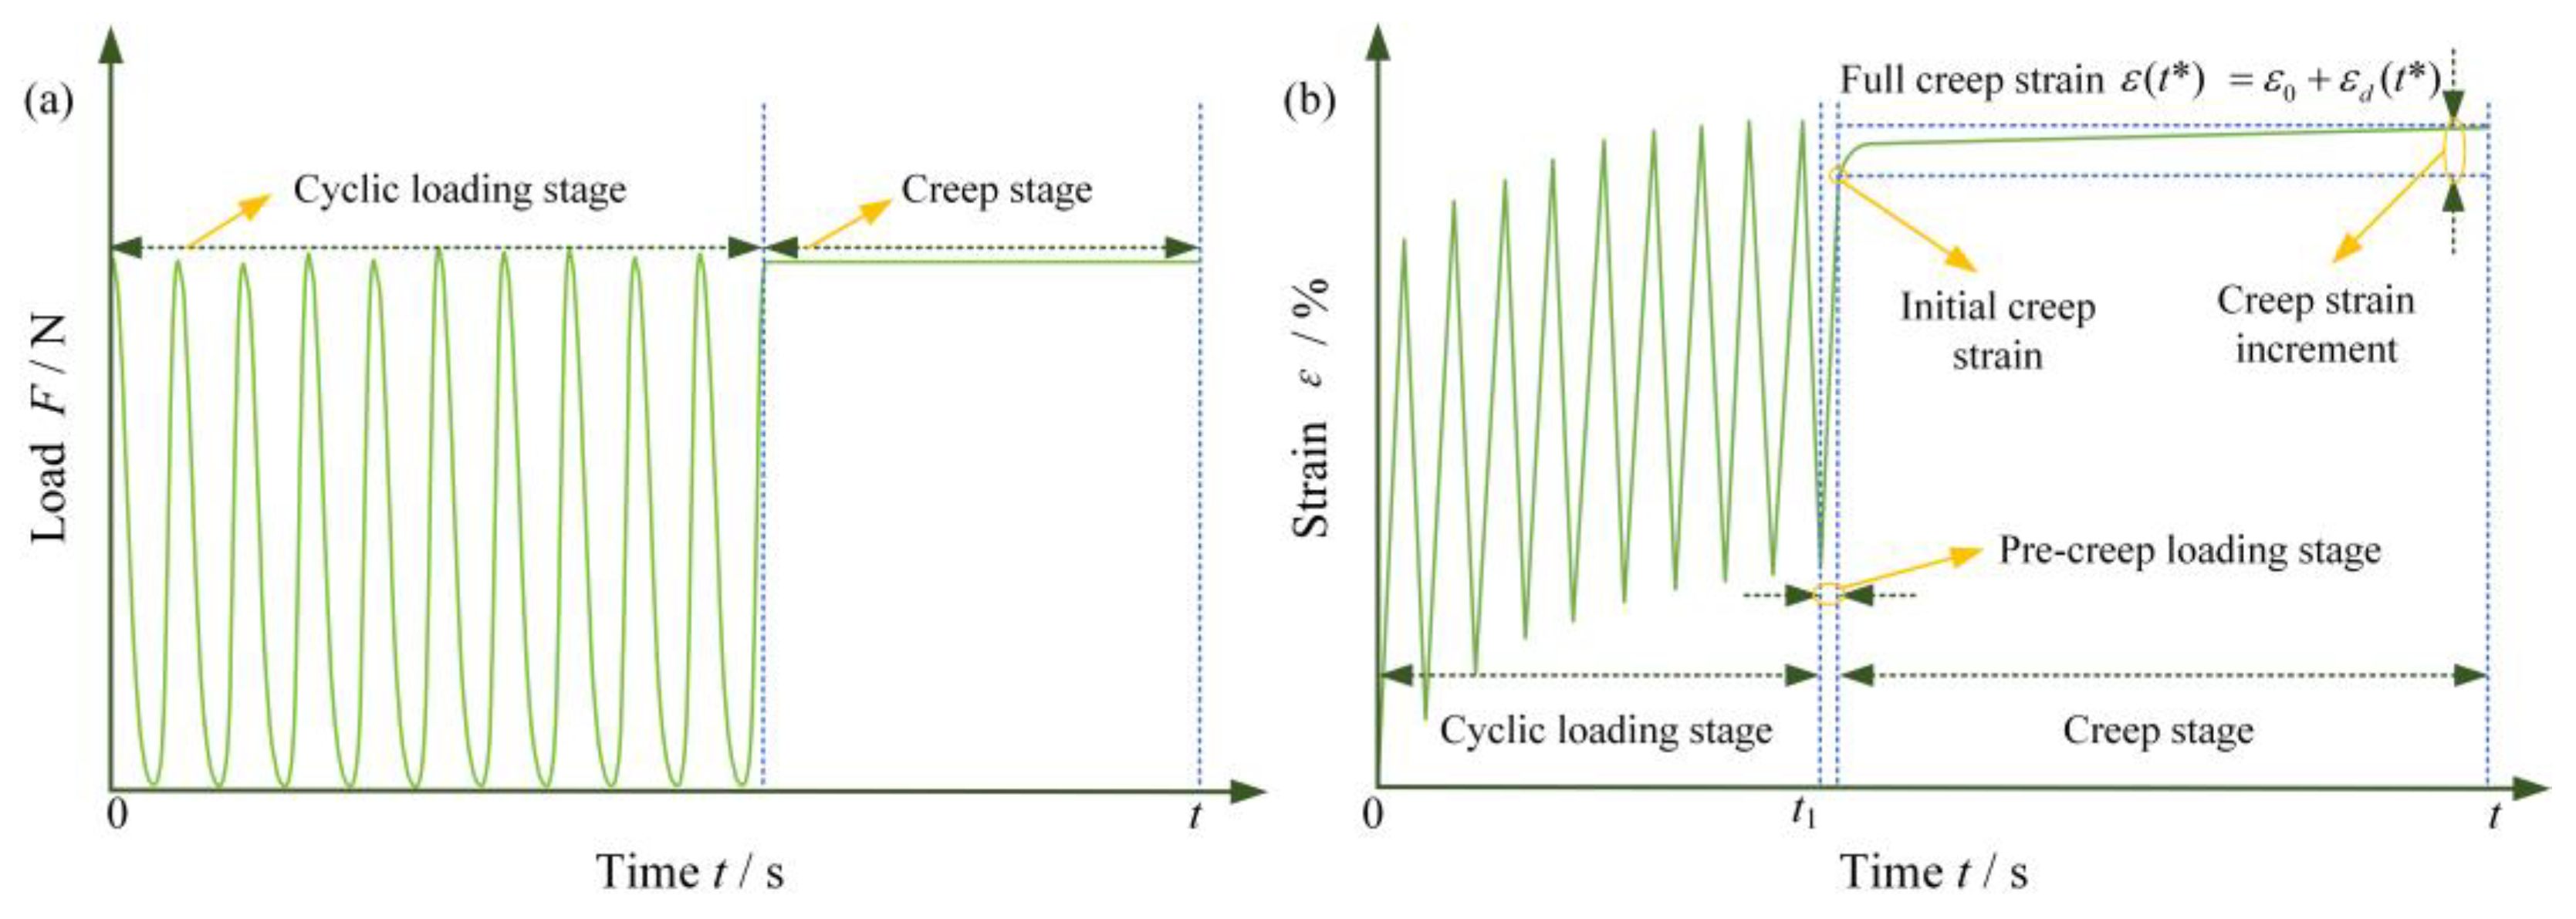
Each group of tests was repeated five times, and the data obtained were divided into two parts, namely, cyclic loading and creep phases, to analyze and characterize the energy changes during cyclic loading, the creep characteristics, and the ability of the machine-harvested seed cotton to maintain the initial creep strain during creep.
3.1. Cyclic Loading Phase
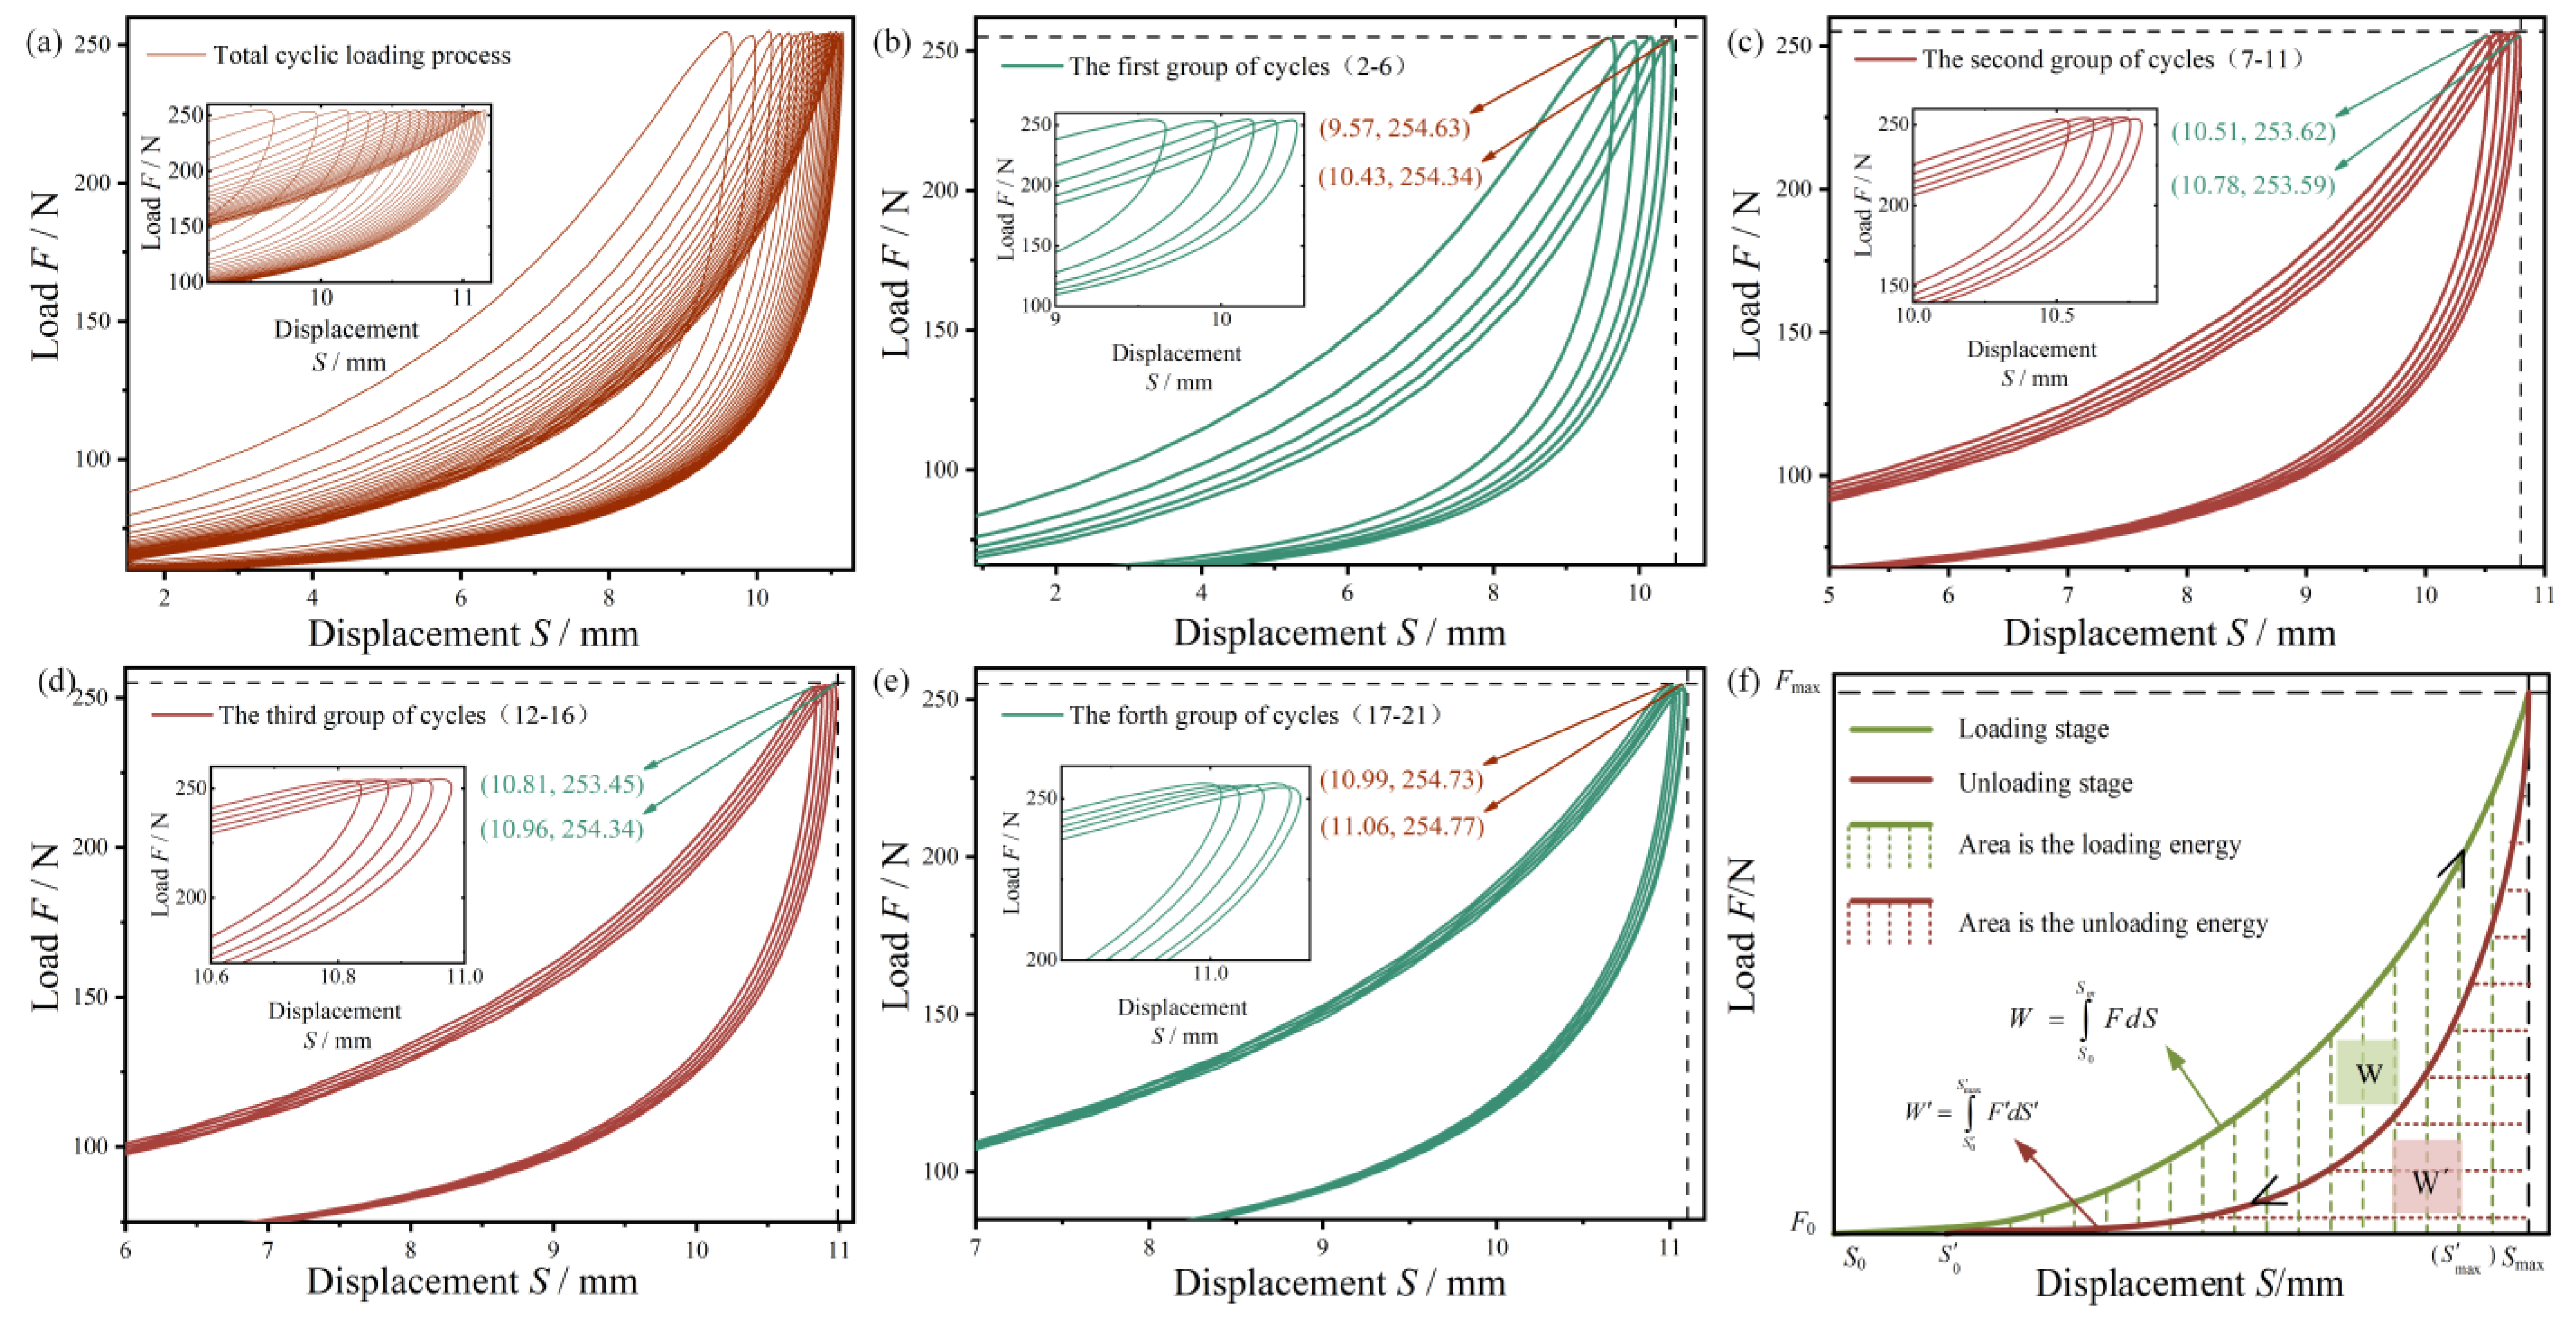
Given that the fiber density of the machine–harvested seed cotton in the 1st cycle was not uniform, more air was observed, and the curve unevenly changed during the compression process; the data are shown from the second cycle [
24].
Figure 4a shows that in the force–displacement curve of the whole cyclic loading process, machine-harvested seed cotton exhibits hysteresis characteristics under the action of cyclic loading, which is consistent with the results after cyclic loading of rice grains [
25]. The area enclosed by each hysteresis loop gradually decreases with the increase in the cyclic loading times, and the curves overlap after the fifth cycle. Therefore, the test treated each of the five cyclic loading curves as a group and analyzed the repetition period and characteristic parameters of each group of cyclic loading curves.
The first four groups of cyclic loading curves reveal that the hysteresis curves of the machine-harvested seed cotton are consistent with the different cyclic loading times (
Figure 4b–e). The hysteresis curves of the machine-harvested seed cotton significantly deviate with increased cyclic loading times. The first group of curves (
Figure 4b, i.e., 2nd–6th cyclic loading curves) remarkably deviate, with a displacement difference of 0.88 mm. The second and third groups of curves (
Figure 4c,d, i.e., the 7th–11th and 12th–16th cyclic loading curves, respectively) remarkably deviate, with displacement differences of 0.27 and 0.15 mm, respectively. The deviation of the fourth group of curves (
Figure 4e, i.e., 17th–21st cyclic loading curves) is the smallest, and the hysteresis curves almost overlap, with an intragroup displacement difference of 0.07 mm, which is due to the plastic deformation and accumulation of the machine-harvested seed cotton during the cyclic loading process.
The area enclosed by each hysteresis loop represents the energy the machine-harvested seed cotton absorbed in one loading-and-unloading cycle. In summary, increasing the cycle loading time results in a reduction in the area enclosed by the hysteresis loop, which rapidly decreases, then slowly decreases, and finally remains in a relatively stable state. Specifically, the less energy absorbed, and the more energy lost in the cyclic loading process of the machine-harvested seed cotton, the smaller the displacement difference within the group in the subsequent cycle process. Accordingly, the first two groups of cycles (i.e., 2–11 cycles of the loading process) were selected for the energy change in the cyclic loading process of the machine-harvested seed cotton for further analysis. Meanwhile, the energy absorbed by the machine-harvested seed cotton during the loading phase (later expressed as compression energy) was analyzed for one machine-harvested seed cotton cyclic loading cycle as follows (
Figure 4f):
where
W is the energy absorbed by one cycle of seed cotton loading (compression energy),
S0 is the moment of the beginning of loading (end of unloading) in one cycle,
Smax is the time of the end of loading (beginning of unloading) in one cycle, and
F is the loading phase load.
The energy absorbed by machine-harvested seed cotton during the unloading phase is:
where
is the energy absorbed by the unloading of seed cotton in one cycle,
is the moment of the end of unloading in one cycle,
is the time of the beginning of unloading in one cycle, and
is the load of the unloading phase.
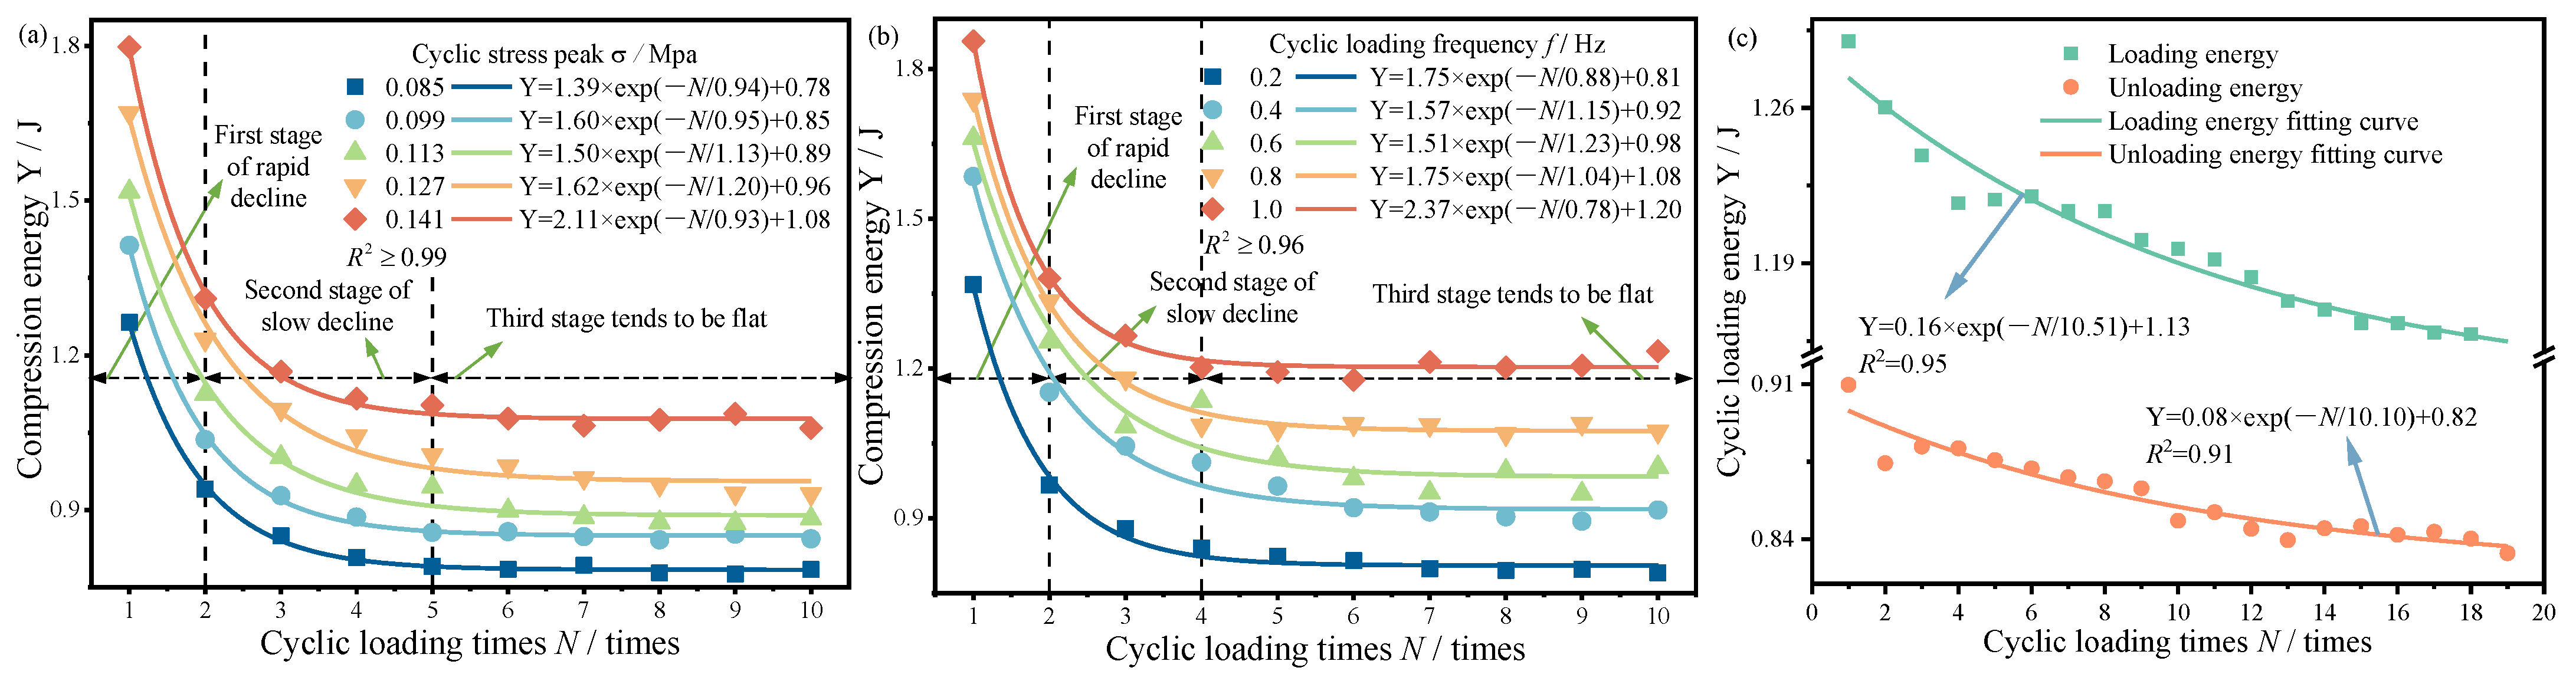
3.1.1. Effect of Cycle Loading Number on the Compression Energy of Machine-Harvested Seed Cotton
The trend of the compression energy of the machine-harvested seed cotton with the cyclic loading time is shown in
Figure 5.
Figure 5a,b depict that the trend of the compression energy of the machine-harvested seed cotton under different cyclic loading times can be divided into three stages. The compression energy rapidly decreases in the first stage, slowly decreases in the second stage, and stabilizes in the third stage. Under the same cyclic stress peak and cyclic loading frequency conditions, the change law of the machine-harvested seed cotton compression energy can be expressed as an exponential function (
R2 ≥ 0.91) with increasing cyclic loading times. This result reveals that the compression energy of the machine-harvested seed cotton under different cyclic loading times first rapidly decreases and then stabilizes because the seed cotton in the first stage is loose and has sufficient air. The friction inside the seed cotton and between the seed cotton and the chamber is small and compressible. The air is gradually discharged as the pressure head descends, and the force and displacement are increased, thus requiring considerable compression energy. In the second stage, more plastic deformation is gradually produced with increased cyclic loading times. The seed cotton density increases, the internal voids decrease, and the friction inside the seed cotton and between the seed cotton and the chamber increases. Accordingly, a small displacement requires a large force, resulting in a small compression energy at this stage. In the third stage, more plastic deformation is produced, the seed cotton reaches a higher density, its internal fibers are bonded to each other, the internal clearances are extremely small, the compressibility is poor, and the material is a solid material. Accordingly, the pressure can instantly increase during the compression process, and a minimal displacement requires a large force, resulting in a smaller compression energy. The overall trend of energy in the unloading phase is the same as that in the loading phase (
Figure 5c). Thus, only the loading phase is subsequently analyzed.
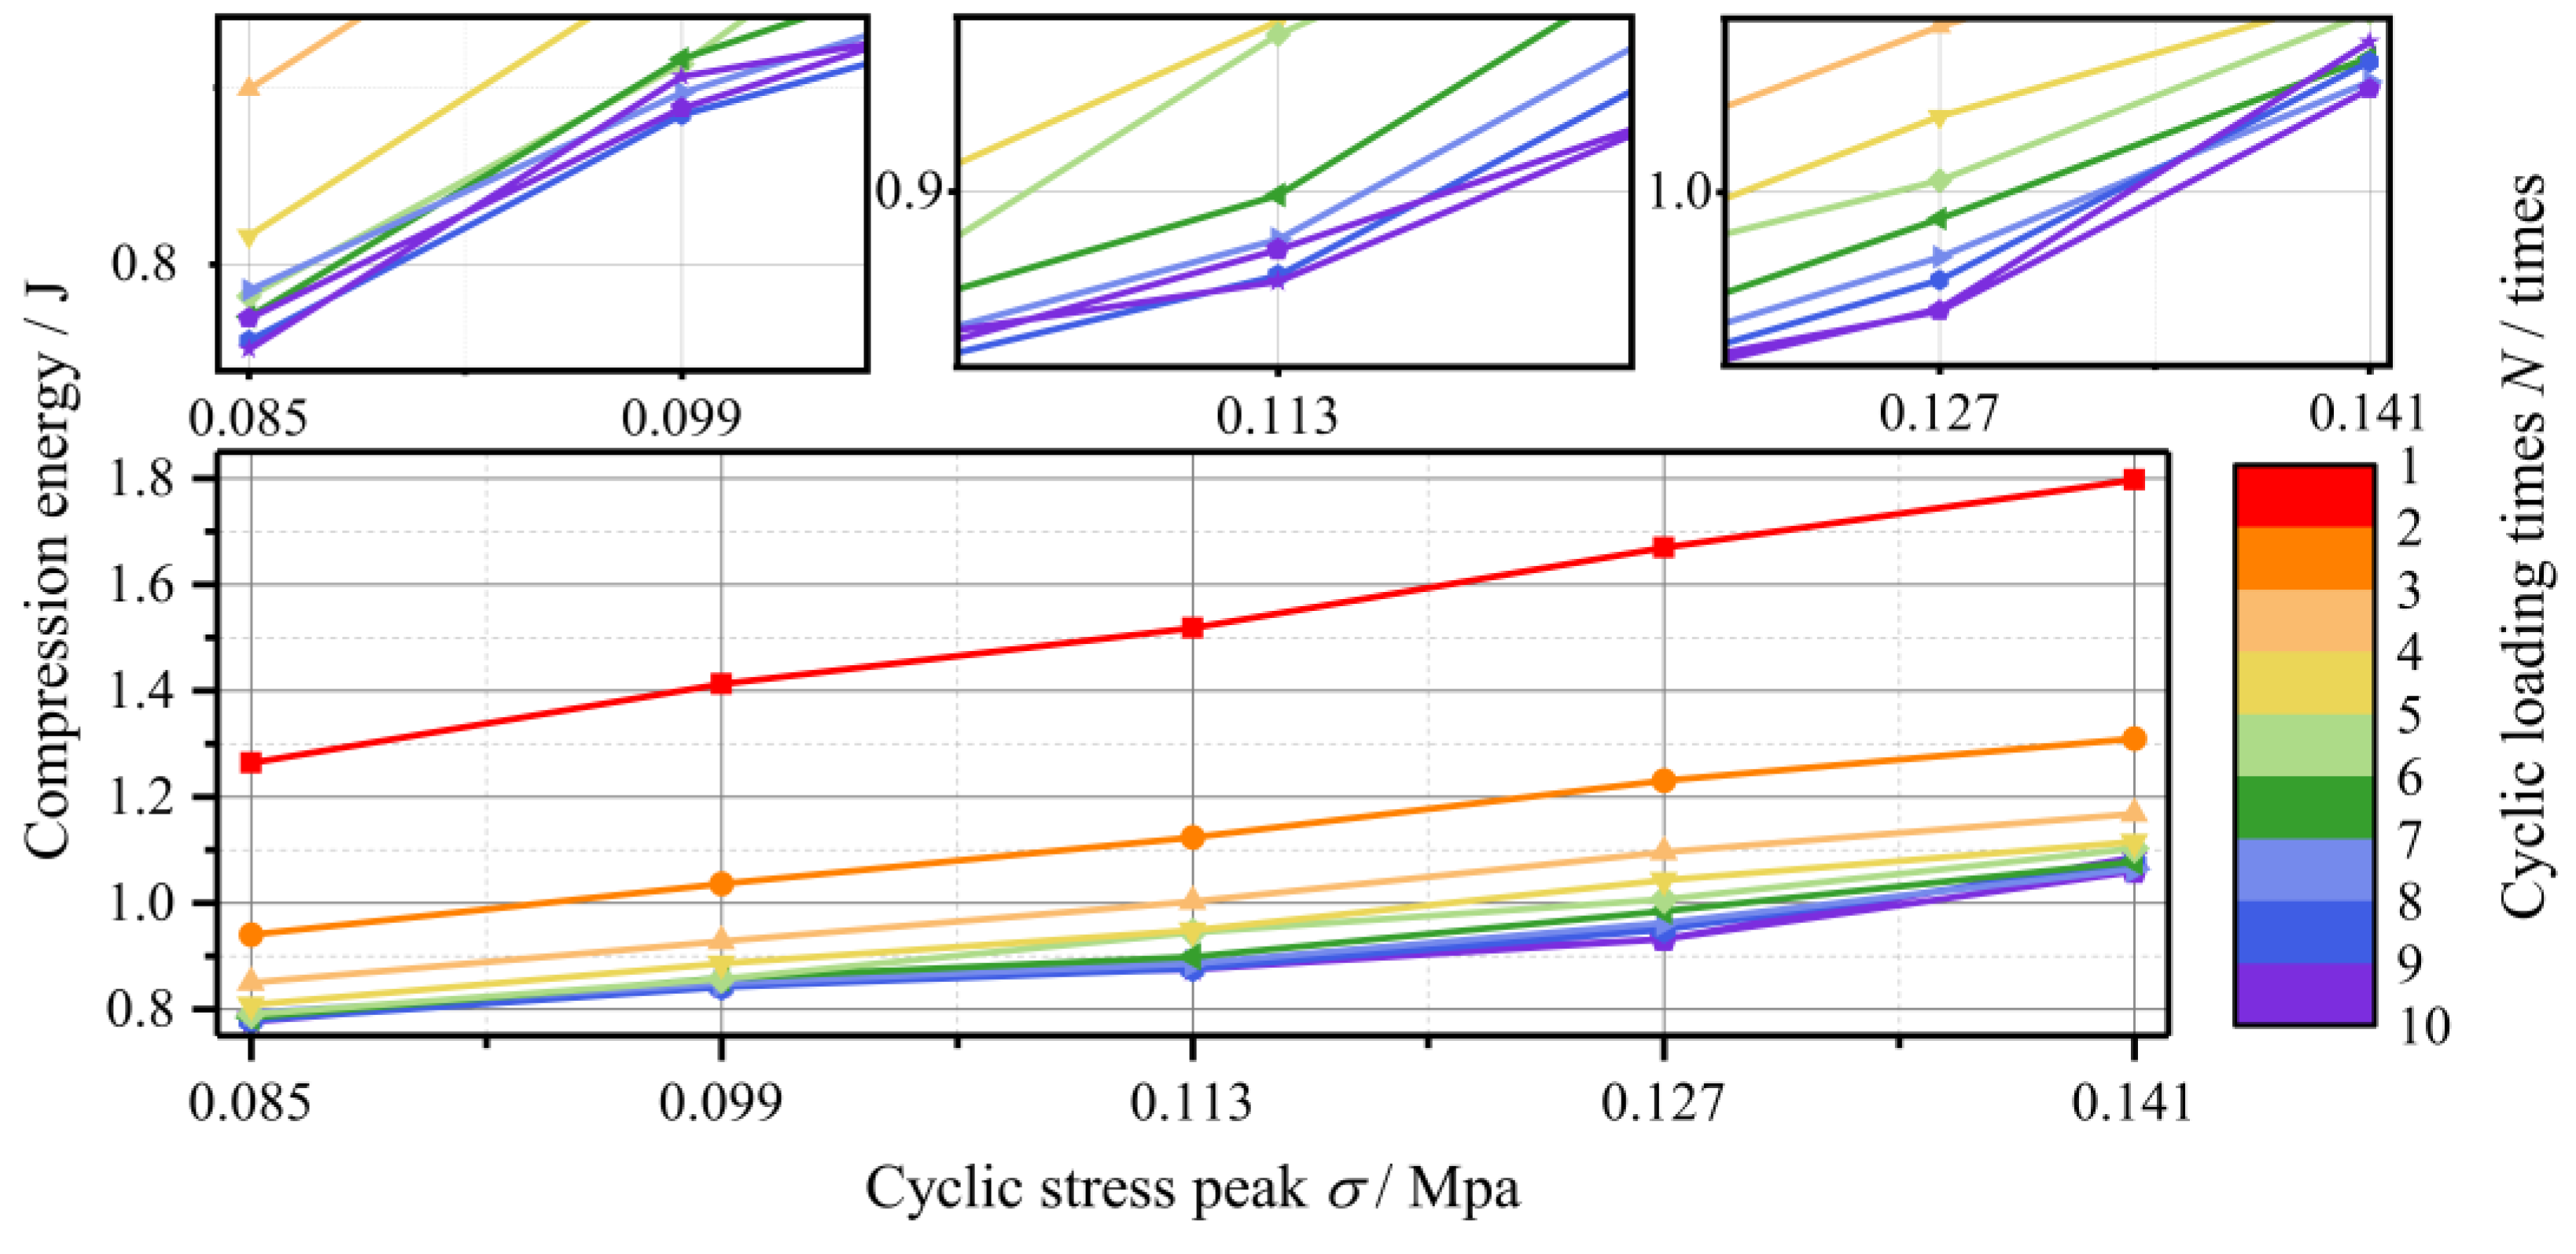
3.1.2. Effect of Cyclic Stress Peak on the Energy Consumption of Machine-Harvested Seed Cotton
Figure 6 shows the required compression energy in the cyclic loading process of the machine-harvested seed cotton for the different cyclic stress peaks. The needed compression energy of the machine-harvested seed cotton increases with the increase in the cyclic stress peak. This relationship is due to the exponential growth of the seed cotton compression force and compression density in the single seed cotton compression process under the same loading frequency and cyclic loading times [
23].
Increasing the cyclic stress peak results in the formation of more fiber bonds within the machine-harvested seed cotton. This scenario results in greater plastic deformation and higher seed cotton density. Moreover, the air between the cotton fibers decreases, the seed cotton inside is tighter, and the friction forces inside the seed cotton and between it and the chamber increase, making the seed cotton less likely to be compressed. The final part of the survey revealed an increase in the required compression energy during the machine-harvested seed cotton compression process. Similar observations were made by Du et al. [
26], who showed that the higher the compression force needed for the forming process, the greater the energy consumed.
3.1.3. Effect of Cyclic Loading Frequency on the Energy Consumption of Machine-Harvested Seed Cotton
Figure 7 shows the trend of the required compression energy for the machine-harvested seed cotton under different cyclic loading frequencies. When the cyclic loading times and stress peaks are the same, the required compression energy of the machine-harvested seed cotton increases with the increase in the cyclic loading frequency. This relationship occurs because the higher the cyclic loading frequency is, the faster the compression speed, and the better the air resistance will be. When the time to unload and return after each compression of the machine-harvested seed cotton is short, the internal bonding of the fibers cannot be popped open to be compressed again, resulting in a closer bond. This bond results in more significant deformation, increasing the seed cotton density. Moreover, the internal friction of the seed cotton and the friction between the seed cotton and the chamber increase, indicating that the required compression energy of the machine-harvested seed cotton in the process increases.
3.2. Creep Stage
The full creep strain
ε(
t*) of the machine-harvested seed cotton was divided into two parts for further analysis of the effect of the cyclic loading method on the creep performance of the machine-harvested seed cotton: initial creep strain
ε0 and creep strain increment
εd(
t*):
where
ε0 is the initial creep strain, which is only related to the loading history before creep at the same stress level and not related to the creep time; and
εd(
t*) is the creep strain increment, which indicates the increase in deformation with the creep time during creep and is related to the creep time.
The creep strain increment is particularly important for the creep characteristics of the machine-harvested seed cotton. Agricultural materials are typically described by a four-element Burgers model [
27]. The model consists of a spring (
E1) in series with a damper (
η1) and a spring (
E2) and a damper (
η2) in parallel. Therefore, the four-element Burgers model was used in this study to characterize further the seed cotton creep strain increment law to elucidate the effect of test factors on the viscoelastic mechanical index of the strain increment in the creep phase of the machine-harvested seed cotton, which is expressed as follows:
where
σ is stress, MPa;
ε is strain;
t is creep time, s;
E1 is instantaneous elasticity modulus, MPa;
η1 is viscosity coefficient, MPa·s;
E2 is the hysteresis modulus of elasticity, MPa; and
τr is delay time, s.
The relative deformation index
β was introduced to characterize the ability of the machine-harvested seed cotton to maintain the initial deformation during creep, and its mathematical expression is as follows:
The smaller the relative deformation index β is, the better the ability of the machine-harvested seed cotton to maintain the initial deformation during creep, and the better the dimensional stability will be. β = 0 when the creep time t* = 0, indicating that no deformation is generated relative to the initial creep strain.
OriginPro 2019b software was used to fit the creep strain increments at different machine-harvested seed cotton factor levels in accordance with Equation (4). The fitting results are shown in
Table 1, which is at the end of the paper. The data are expressed as the mean ± standard deviation. The correlation coefficient
R2 ≥ 0.97 indicates that the model fits well, and the Burgers model is suitable for describing the creep strain increments of the machine-harvested seed cotton. The correlations of the creep strain increments corresponding to each factor are shown in
Table 2. Meanwhile, 0.05 was selected for the significance test to investigate the influence of each factor on the law and characteristics of the creep strain increment [
28]. The fitted parameters were analyzed by ANOVA with IBM SPSS Statistics 26 software.
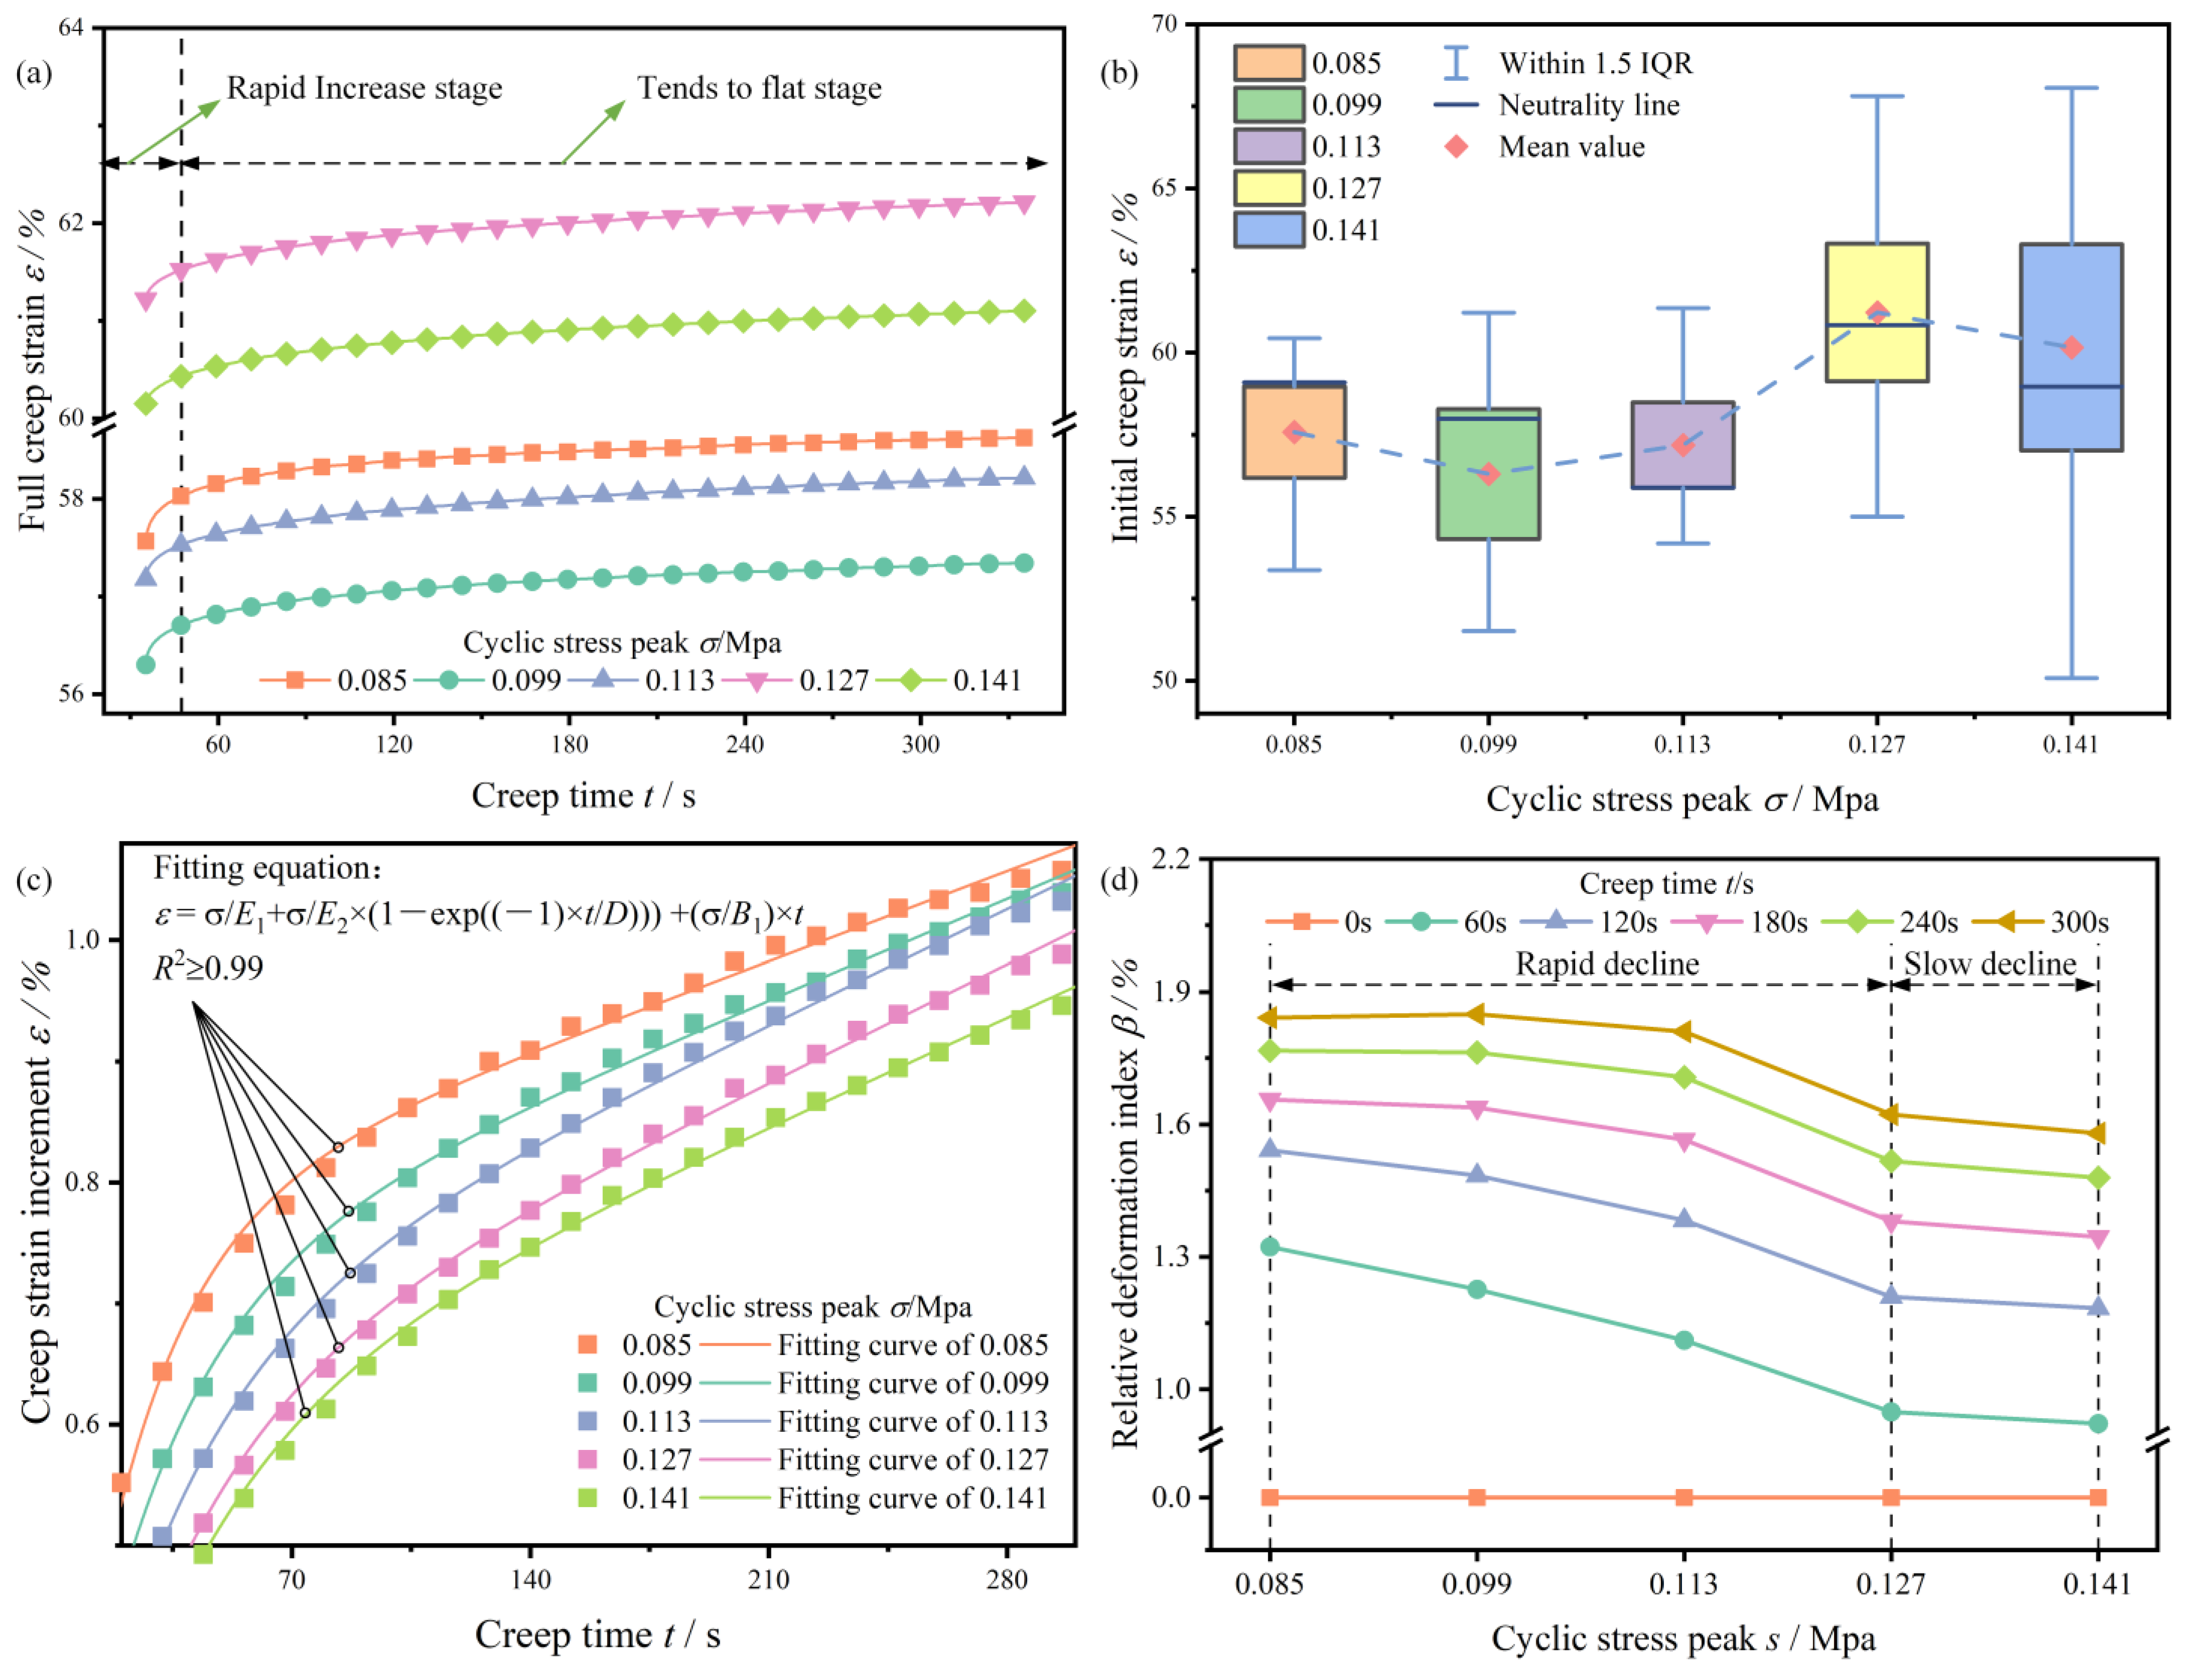
3.2.1. Effect of Cyclic Loading Times on the Creep Performance of Machine-Harvested Seed Cotton
When the loading frequency was
f = 6 Hz, the cyclic stress peak was
σ = 0.113 MPa. The full creep strain curves of the machine-harvested seed cotton are shown in
Figure 8a after cyclic loading. The full creep strain mechanism of the machine-harvested seed cotton is consistent with the increase in creep time, and they all show rapid growth first and then stability.
The initial creep strains of the machine-harvested seed cotton after different cyclic loading times are shown in
Figure 8b. The aforementioned figure reveals that the initial creep strain of the machine-harvested seed cotton shows an overall increasing trend with increasing cyclic loading times under the same cyclic loading frequency and cyclic stress peak conditions, but some data fluctuate. In the cyclic loading process, the hysteresis curve deviated (
Figure 4). The deviation increases with the cyclic loading times. Consequently, the initial creep strain shows an increasing trend. The data fluctuate because the machine-harvested seed cotton itself is a mixture containing cotton fiber, cotton seeds, impurities of the seed cotton itself (cotton stalk, cotton leaves, and boll shells), and other impurities (residual film, hair, etc.). In the compression process of the machine-harvested seed cotton, the internal arrangement of the cotton seeds and the type and amount of cotton impurities affect its stress and strain curve, showing the fluctuation of the initial creep strain.
The creep strain increment trend of the machine-harvested seed cotton in
Figure 8c shows that the creep strain increment decreases with increasing cyclic loading times. This relationship occurs because more plastic deformation is generated, and plastic accumulates between seed cotton fibers with the increase in the cyclic loading times, resulting in a tighter fiber bond formed inside the machine-harvested seed cotton. Moreover, the internal clearance decreases, the friction inside the seed cotton and between the seed cotton and the chamber increases, and the degree of mutual slippage between the seed cotton fibers decreases, resulting in a reduction in the creep strain increment.
Table 3 shows that the cyclic loading time has a considerable effect on the instantaneous elasticity modulus
E0 and hysteresis modulus
Er (
p < 0.5), and the instantaneous elasticity modulus
E0 and hysteresis modulus
Er increase with increasing cyclic loading. The overall positive correlation is shown, and the corresponding correlation coefficients are
r = 0.924 and 0.942. The higher the modulus of elasticity
E0, the lower the elastic deformability. The higher the value of the viscosity coefficient
η is, the higher the deformability resistance and the poorer the mobility of the internal structure of the machine-harvested seed cotton will be. Consequently, the instantaneous elastic modulus
E0 and hysteresis elastic modulus
Er increase, indicating that the more cyclic loading times, the smaller the instantaneous elastic deformability. Although the cyclic loading times in
Table 2 are not significantly correlated with the viscosity coefficient
η,
Table 3 shows an overall upward trend for the viscosity coefficient
η, indicating that the internal fluidity of the machine-harvested seed cotton is worse with the increase in the cyclic loading times. Thus, smaller creep strain increments are produced, generating better shape stability of the machine-harvested seed cotton after compression.
The isochronous curves of the relative deformation index of the machine-harvested seed cotton with the cyclic loading times are shown in
Figure 8d. The relative deformation index can be divided into two stages with increasing cyclic loading times when the creep times are the same. Furthermore, the relative deformation index of the machine-harvested seed cotton rapidly decreases with the increase in cyclic loading times in the fast-declining stage and the relative deformation index in the slow-declining stage. Although this stage achieves a smaller value, the overall trend is flatter than the previous stage mainly because the initial creep strain increases with the increase in the cyclic loading time, and the creep strain increment decreases. This result shows that the relative deformation index decreases, and the ability of the machine-harvested seed cotton to maintain the initial deformation increases. Moreover, increasing the cyclic loading times can improve the ability of the machine-harvested seed cotton to retain the initial deformation during creep. However, excessively increasing the cyclic loading times is insignificant for improving the ability of the machine-harvested seed cotton to maintain the initial deformation.
3.2.2. Effect of Cyclic Stress Peak on the Creep Properties of Machine-Harvested Seed Cotton
The curves of the full creep strain, initial creep strain, and creep strain increment with time for the different cyclic stress peaks are shown in
Figure 9a,
Figure 9b, and
Figure 9c, respectively. Meanwhile, the isochronous curves of the relative deformation index of the cyclic stress peaks of the machine-harvested seed cotton are shown in
Figure 9d.
The trend of the machine-harvested seed cotton’s full creep strain curve under different cyclic stress peak conditions is the same, showing a rapid increase before leveling off (
Figure 9a). The initial creep strain of the machine-harvested seed cotton shows an overall increasing trend with the rise in cyclic stress peak, but some of the data have fluctuations (
Figure 9b). This phenomenon arises because the higher cyclic stress peak produces a more significant displacement during cyclic loading. Thus, the initial creep strain increases. The reason for the fluctuation in the data is the same as above.
Figure 9c shows that the creep strain increment of the machine-harvested seed cotton shows an overall trend of gradually decreasing with the increase in the cyclic stress peak. This trend occurs because under the same cyclic loading frequency and cyclic loading times, the higher the stress peak produced, the closer the fiber bonding inside the machine-harvested seed cotton, and the greater the plastic deformation produced. However, the creep strain increment of the machine-harvested seed cotton is the smallest when the cyclic stress peak is
σ = 0.085 MPa. The curve trend is also relatively flat compared with other curves, which is probably due to the arrangement of the internal cotton seeds and the uniform distribution of impurity species. Consequently, the machine-harvested seed cotton easily compresses and produces more plastic deformation; thus, a higher initial creep strain creates lower cyclic stress peaks. By contrast, the plastic deformation produced by low stress is limited, resulting in a relatively flat creep curve during pressure retention compared with other curves. The creep increment is relatively small.
The ANOVA results in
Table 4 show that the effect of the cyclic stress peak on the instantaneous elasticity modulus
E0, hysteresis modulus
Er, and delay time
τr of the machine-harvested seed cotton is significantly below the significance level of 0.05. Furthermore, the instantaneous elasticity modulus
E0, hysteresis modulus
Er, and delay time
τr of the machine-harvested seed cotton increase with the increase in the cyclic stress peak, and the corresponding correlation coefficients are
r = 0.893, 0.952, and 0.841, respectively. The instantaneous elasticity modulus
E0, hysteresis modulus
Er, and delay time
τr increase, indicating that the higher the cyclic stress peak of the machine-harvested seed cotton generates, the smaller the transient elastic deformation in the creep phase, the poorer the internal mobility of the machine-harvested seed cotton, and the smaller the permanent deformation. Accordingly, a smaller creep strain increment is produced, which is more conducive to maintaining the shape stability of the machine-harvested seed cotton after compression. Similar results have been obtained in the relaxation process of the knitted cotton fabrics [
29].
The relative deformation index displayed a trend of rapid decrease, followed by a slight decline with the increase in the cyclic stress peak for the same creep time (
Figure 9d). This trend is mainly due to the increase in the cyclic stress peak inducing the growth of the initial creep strain and the decrease in the creep strain increment. This result shows that the relative deformation index decreases, and the ability of the machine-harvested seed cotton to maintain the initial deformation increases, indicating that a moderate increase in the cyclic stress peak can enhance the retention ability of the initial creep strain of the machine-harvested seed cotton during creep. Nevertheless, an excessive increase in the cyclic stress peak can no longer improve the initial deformation retention ability of the machine-harvested seed cotton to a significant extent.
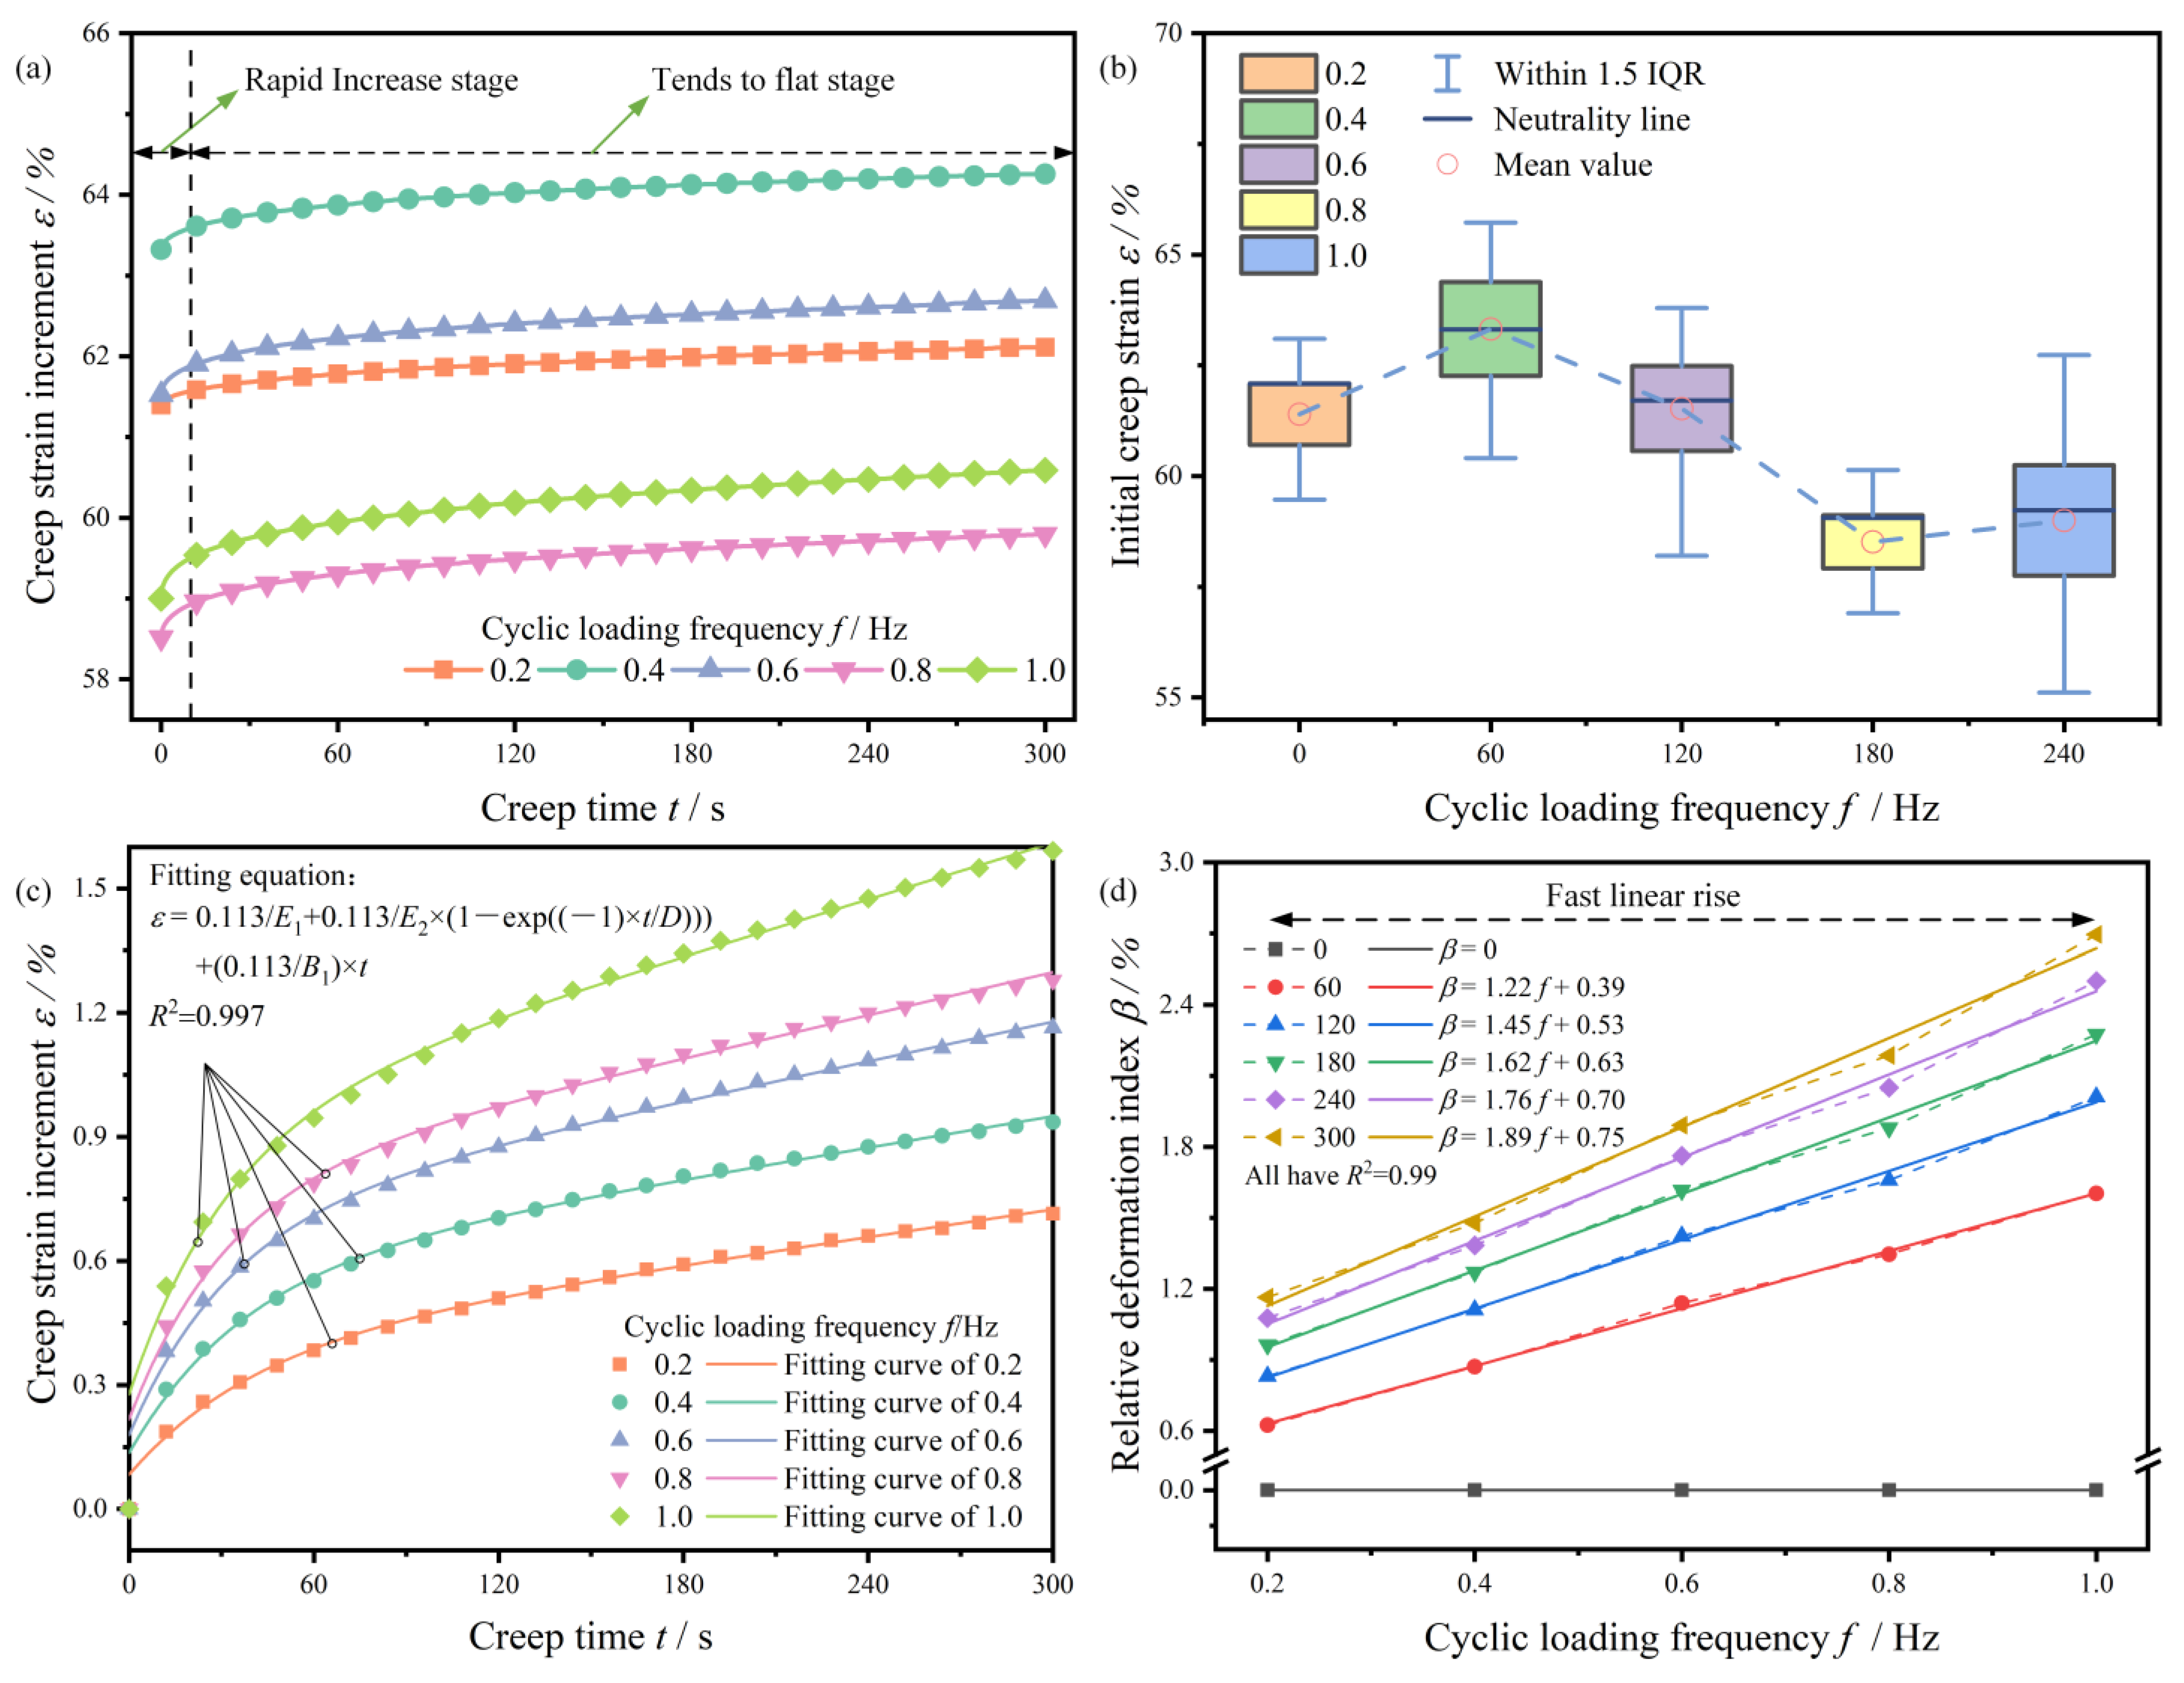
3.2.3. Effect of Cyclic Loading Frequency on the Creep Performance of Machine-Harvested Seed Cotton
The full creep strain, initial creep strain, creep strain increment, and relative deformation index curves of the machine-harvested seed cotton for the different cyclic loading frequencies are shown in
Figure 10 (i.e., when the cyclic stress peak is
σ = 0.113 MPa, and the cyclic loading times are 15 times).
Figure 10a shows that the full creep strain curves of the machine-harvested seed cotton under different cyclic loading frequencies are highly similar. These curves all show an overall trend of rapid increase and then leveling off. The initial creep strain of the machine-harvested seed cotton corresponds to the different cyclic loading frequencies (
Figure 10b). This finding shows that the initial creep strain of the machine-harvested seed cotton exhibits a decreasing trend with the increase in the cyclic loading frequency. Nevertheless, some values fluctuate because a faster cyclic loading frequency results in a quicker corresponding loading speed and better air resistance, thus producing smaller displacements and decreasing the initial creep strain. The reason for the fluctuation is the same as above.
Figure 10c shows that the creep strain increment of the machine-harvested seed cotton increases with increased cyclic loading frequency because increasing the loading frequency in the cyclic loading stage decreases the time of structural adjustment between the seed cotton fiber molecules. The degree of sufficient slip between fibers decreases. By contrast, the time of seed cotton springback is reduced during the unloading phase, and more structural adjustment is required. Therefore, the creep strain increment increases with increasing cyclic loading frequency.The ANOVA results in
Table 5 show that the effect of the cyclic loading frequency on the instantaneous elasticity modulus
E0, hysteresis modulus
Er, coefficient of viscosity
η, and delay time
τr of the machine-harvested seed cotton is significantly below the significance level of 0.05. As shown in
Table 2, the corresponding correlation coefficients are
r = −0.928, −0.924, −0.951, and −0.771. The instantaneous elasticity modulus
E0, hysteresis modulus
Er, viscosity coefficient
η, and delay time
τr of the machine-harvested seed cotton decreased, indicating that the higher the cyclic loading frequency generates greater instantaneous elastic deformation in the creep phase, the better the internal mobility of seed cotton. The greater the mutual slip and adjustment of fibers produced, the greater the permanent deformation. Moreover, a more significant creep strain increment occurs, which is not conducive to maintaining the shape stability of the machine-harvested seed cotton after compression.
The isochronous curves of the relative deformation index of the machine-harvested seed cotton correspond to the cyclic loading frequency at different moments in
Figure 10d. The relative deformation index of the machine-harvested seed cotton linearly increases with the cyclic loading frequency (
R2 ≥ 0.9898) in the level range selected for this test. The increase in cyclic loading frequency is not conducive to improving the initial deformation retention ability of the machine-harvested seed cotton in the creep process. Although a low cyclic loading frequency can improve the deformation retention ability of the machine-harvested seed cotton in the creep process, it increases the time-consuming workload of the cyclic loading process before creep. Increasing the loading frequency can effectively reduce the time-consuming loading stage of the machine-harvested seed cotton. However, given the inertia of the instrument fixture, a transient overload phenomenon easily occurs in the cyclic loading process [
22], thus affecting the test results. In addition, accurately controlling the initial creep stress of the machine-harvested seed cotton is not conducive.
4. Conclusions
In this experiment, machine-harvested seed cotton was regarded as the research object. The test factors used were the cyclic loading time, cyclic stress peak, and cyclic loading frequency. The energy change during the cyclic loading process of the machine-harvested seed cotton, the creep characteristics during the creep process, and the ability to maintain the initial creep strain were analyzed and characterized by a single factor. The energy consumption curve of the machine-harvested seed cotton during cyclic loading was obtained to analyze its energy change law. The full creep strain was divided into two parts: initial creep strain and creep strain increment, and the relative deformation index was introduced to characterize its deformation retention capacity. The main conclusions are as follows:
1. Machine-harvested seed cotton shows hysteresis characteristics in the cyclic loading-and-unloading process. The loading and unloading curves of the machine-harvested seed cotton in the cyclic loading process are similar in shape and consistent in law. The compression energy could be expressed as an exponential function (R2 ≥ 0.91) with increased cyclic loading times. The compression energy in the loading stage of the machine-harvested seed cotton rapidly decreases and then stabilizes with the increase in the cyclic loading times. The compression energy in the compression process of the machine-harvested seed cotton increases with the rise in the cyclic stress peak cyclic loading frequency.
2. After cyclic loading under different conditions, the creep strain curves of machine-harvested seed cotton are similar in shape, and the creep mechanisms are consistent, showing a general trend of rapidly increasing and then leveling off. The initial creep strain of machine-harvested seed cotton shows an overall increasing trend with the increase in cyclic loading times and cyclic stress peak. By contrast, the initial creep strain shows a general decreasing trend with the increase in cyclic loading frequency.
3. Cyclic loading time, cyclic stress peak, and cyclic loading frequency have different effects on the instantaneous elasticity modulus E0, hysteresis modulus Er, viscosity coefficient η, and delay time τr of machine-harvested seed cotton. The creep strain increment decreases with increasing cyclic loading times. Moreover, the instantaneous elastic modulus E0 and the hysteresis elastic modulus Er increase, and the relative deformation index decreases. The creep strain increment shows a decreasing trend with the increase in the cyclic stress peak. The instantaneous elastic modulus E0, hysteresis elastic modulus Er, and delay time τr increase, but the relative deformation index decreases. The creep strain increment increases with the increase in cyclic loading frequency. The instantaneous elastic modulus E0, hysteresis elastic modulus Er, viscosity coefficient η, and delay time τr decrease, and the relative deformation index linearly increases.
4. Without considering the power consumption and interaction, appropriately increasing the cyclic loading times and the peak cyclic loading stress and minimizing the cyclic loading frequency can reduce the relative deformation index of the creep phase of machine-harvested seed cotton. Accordingly, the deformation retention ability of machine-harvested seed cotton in the creep process decreases, but the compression energy increases.

 ,
, 


