Article

Biochar and Flooding Increase and Change the Diazotroph Communities in Tropical Paddy Fields

School of Tropical Agriculture and Forestry, Hainan University, Haikou 570228, China
*
Author to whom correspondence should be addressed.
Agriculture 2024, 14(2), 211; https://doi.org/10.3390/agriculture14020211
Submission received: 18 December 2023 / Revised: 25 January 2024 / Accepted: 26 January 2024 / Published: 28 January 2024
(This article belongs to the Section Agricultural Water Management)

Abstract

:
Biological nitrogen fixation (BNF) can reduce synthetic N fertilizer application and improve N-use efficiency. However, knowledge about the effect of biochar and water management regimes on soil diazotrophic microorganisms in tropical paddy fields remains only rudimentary. A field trial was started in the early rice season in 2019 and ended in the late rice season in 2020. We studied the effects of five treatments comprising different water management and biochar applications on the diazotrophic abundance and community composition: no N fertilizer + conventional water management, conventional fertilization + conventional water management, no N fertilizer + flooding, conventional fertilization + flooding, and application of 40 t ha−1 biochar + conventional fertilization + conventional water management. According to the results, biochar increased soil pH and organic carbon (SOC), whereas flooding decreased the soil available phosphorus (P) content. However, the addition of biochar and flooding as well as N application treatments increased nifH abundance. The nifH abundance negatively correlated with available N and P, whereas it significantly positively correlated with SOC (p < 0.05). The results of redundancy analysis unveiled that biochar stimulated the relative abundance of Pelomonas and changed the diazotrophic microbial community structure by increasing soil pH, while flooding stimulated the relative abundance of Azospirllum. Conclusively, both flooding and biochar affect soil diazotrophic microbial community and abundance in paddy fields. Reducing N and P fertilizer application clubbed with biochar amendment and flooding may be beneficial for soil N-fixing in tropical paddy fields.

1. Introduction

Nitrogen (N) is a major atmospheric component and is an essential nutrient for plant growth. To meet the rising human food demand, large amounts of N fertilizers are applied in paddy fields for increasing rice production. In China, the N-use efficiency (NUE) of rice is low because only 20–40% of applied N fertilizers are taken up by the plants. [1,2,3]. The ecosystem N retention in China is 10–35% in paddy fields, and this creates several environmental problems, such as soil acidification [4] and greenhouse gas emission [5]. Therefore, we must identify a reasonable way to reduce the amount of synthetic N fertilizers used to achieve sustainable agricultural development.
Dinitrogen (N2) is available abundantly in the atmosphere, but plants cannot use it directly. N2 must first be converted into inorganic N through lightning or biological N fixation (BNF) [6]. The BNF has been estimated to be 52~130 Tg (1 Tg = 1012 g) N year−1 in the global natural ecosystem [7]. Thus, unfertilized crops can achieve a certain yield through BNF [8]. In addition to common legume crops, non-symbiotic N-fixing microorganisms are also present in rice roots and provide N for rice growth [9]. Herridge et al. [10] found that BNF in paddy soils can provide 22–30 kg N ha−1 year−1. Diazotrophs catalyze BNF using the highly conserved nitrogenase enzyme [11]. The nifH gene is the most common biomarker used for determining the evolution and ecology of N-fixing bacteria. This biomarker has been extensively employed to study diazotrophic microbial communities in paddy soils [12]. The nifH gene has also been detected in many microbial genera (e.g., Geobacter and Pelomonas) [13,14]. Edaphic and environmental factors, such as climate, cropping systems, soil type, nutrient availability, and vegetation, influence BNF activity and diazotrophic microbial communities [15,16]. Edaphic and environmental factors vary across climatic zones [17], which may cause variations in the BNF activity and diazotrophic microbial communities in paddy fields across these zones [18,19]. For instance, soil acidification is more severe in the tropics than in other climatic zones [20]. Soil aluminum determines N and diazotrophic communities in rice fields, which leads to changes in BNF activity and diazotrophic communities in these fields in the tropics relative to the other regions [21]. Moreover, changes in diazotrophic microbial communities, which are mainly caused by temperature and rainfall [22,23], also occur with seasons; different results were obtained at different times in the same location [24]. Therefore, multi-seasonal studies are warranted to elucidate the factors influencing diazotrophic microbial communities in the tropics so as to augment BNF activity in these regions.
Diazotrophs are sensitive to water [25]. Therefore, changes in the soil moisture content can affect BNF activity by altering soil redox conditions, particularly in paddy fields [26]. Das et al. [27] found that BNF activity in paddy soils was lower under non-flooding conditions than under flooding conditions. BNF activity in soil increased when paddy soil changed from dry to wet, whereas it decreased when the soil changed from wet to dry [28]. Changes in water availability in paddy soils can also affect the soil microbial community structure by affecting soil properties, such as pH and nutrient content [29,30], which are crucial factors affecting BNF activity [31]. In tropical regions, water changes dramatically, and diazotrophic communities may be accustomed to such changes [32]. Other factors (except O2 concentration, redox conditions) may impact BNF activity in tropical paddy fields through water management. Yet, how different irrigation practices affect BNF activity in tropical paddy soils remains poorly known.
Different fertilization management practices also affect the structure of soil microbial communities in paddy fields [33] by affecting soil properties, thereby affecting soil N-fixing microbial diversity and community structure in these fields [34]. Because soil N-fixing microorganisms are more sensitive to the available N content in the soil [25], the soil N-fixing activity of the paddy field without any added N fertilizer was significantly higher than that of the field under long-term N fertilization, and the soil microbial community structure was also changed [35]. However, in some studies, N application had no significant effects on BNF activity and the diazotrophic microbial community composition in paddy soils [36]. Some studies have also reported that phosphorus (P) and potassium (K) deficiency caused a decrease in nifH expression and the N2 fixation ability [37]. Although these nutrients (NPK) can affect the BNF of paddy soils, their effects on the diazotrophic microbial community structure in tropical areas remains unclear and needs further research.
Biochar, as a soil amendment, has recently been investigated extensively because of its great potential in mitigating greenhouse gas emission [38]. Furthermore, biochar has recently exhibited its effects on diazotrophic communities and BNF activity [39]. For example, Liu et al. [40] observed that biochar affects diazotrophic communities and BNF activity by increasing labile carbon (C) in soil. Biochar can also change the characteristics of the diazotrophic community by changing soil C/N [41]. However, according to Zhao et al. [42], biochar affects the soil diazotrophic community mainly by increasing soil pH. In some studies, biochar increased the abundance of diazotrophic microbes by increasing soil Olsen-P [43]. In addition, biochar can affect BNF activity by changing inorganic N availability in paddy soils through abiotic processes such as physical adsorption [44]. Biochar application in fields also favor the biochar weathering process in paddy fields, particularly in tropical areas that receive plenty of rain and heat [45]. Although many studies in temperate and subtropical regions have explored the effects of biochar application and different water management practices on BNF activity in paddy fields [46,47,48], the effects in tropical paddy soils remain unclear.
This study investigated the effect of fertilization and irrigation practices on the diazotrophic community diversity and composition in tropical paddy soils. We hypothesized that environmental influencing factors have distinct effects on diazotrophic microorganisms in tropical paddy soils compared with those in other climatic zones. Biochar application and water management practices would affect diazotrophic microbial communities by influencing various environmental factors.

2. Materials and Methods

2.1. Experiment Site

The field experiment was conducted in the Xi’an village Qiaotou Town (109°56′01″ E, 19°56′58″ N), Chengmai County, Hainan Province, China. This village has a tropical monsoon climate (average annual temperature: 23.8 °C; average annual precipitation: 1786 mm). We used sandy loam soil in the experiment (62.7% sand, 20.5% silt, and 16.8% clay). This soil has a pH of 5.9 in soil as well as the following properties: water suspension (1:2.5), soil organic carbon (SOC) of 15.7 g kg−1, total N of 2.80 g kg−1, available N of 148 mg kg−1, available P of 123 mg kg−1, available K of 49.6 mg kg−1, and cation exchange capacity (CEC) of 4.0 cmolc kg−1.

2.2. Experimental Setup

The field trial was started in the early rice season in 2019 and was ended in the late rice season in 2020. The experiment had a randomized complete block design. The edges of each plot were bedded and covered with tarps. The tarps were buried 50 cm deep in the soil to prevent water and fertilizer circulation between the plots. The rice variety used was ‘Teyou 808’, which is a temperature-sensitive three-line hybrid rice. Five treatments were established in the experiment: (1) no N fertilizer + conventional water management (CK); (2) conventional fertilization + conventional water management (CON); (3) no N fertilizer + flooding (FCK); (4) conventional fertilization + flooding (FCON); (5) application of 40 t ha−1 biochar + conventional fertilization + conventional water management (B). Each treatment was set up with three replicates. The application rate of conventional fertilization was determined according to local traditional farming practices, and the fertilization time and application rate are shown in Table 1. Urea, superphosphate, and potassium chloride were applied as N, P, and K fertilizers, respectively. Urea was applied in the early rice season in three splits (5:3:2) at basal, tillering, and ear stage, respectively, while urea was applied in two splits (6:4) at tillering and ear stage, respectively, in the late rice season. Superphosphate and potassium chloride were applied to all plots as basal fertilization in all treatments. The flood treatment maintained flooding throughout the rice growth cycle. Conventional water management practices were implemented according to local traditional water management methods. The rice was dried out for 2 weeks at the tillering stage, after which it was the same as the flood treatment.
Biochar application to the soil by spreading and ploughing was only practiced during the first year of the rice season. Biochar was obtained through coconut husk pyrolysis at 600 °C. The physicochemical properties of the biochar were determined according to the methods of Harter et al. [39]. In this study, biochar had a pH of 9.7, total C content of 676.78 g kg−1, total N of 3.0 g kg–1, available P of 99.6 mg kg−1, available K of 65.1 mg kg−1, CEC of 8.2 cmol kg−1, and specific surface area of 5.8 m2 g−1. In accordance with the local paddy field management methods, flood water in the rice field was drained in the tillering stage and flooding was performed again at the filling stage. Flooding treatment maintained the water level in the field after rice transplanting until the filling stage. Based on the five-point sampling method, soil samples (0–20 cm depth) were collected from each plot in each treatment at each rice harvest, and then mixed into one composite sample. A part of the soil sample was refrigerated at −80 °C for determining soil microbial activity. The other part of the soil sample was naturally air-dried and sieved for determining soil physical and chemical properties.

2.3. Soil Physicochemical Properties

Soil physicochemical properties were determined according to Bao [49]. Soil pH was determined using suspensions prepared at a soil: water ratio of 1:2.5. Available N was determined using a microdiffusion technique following alkaline hydrolysis. The soil available P was extracted with acid ammonium fluoride solution and measured using the molybdenum blue colorimetric method. The soil available K was extracted with NH4OAc (1 M, pH 7.0) and determined using a flame photometer. Soil CEC was determined according to the ammonium acetate extraction method [50]. SOC was estimated using the K2Cr2O7 oxidation method.

2.4. Soil DNA Extraction and Real-Time PCR

Soil DNA was extracted from 0.5 g of soil by using the soil DNA extraction kit DNeasy PowerSoil Kit(100)12888-100. Following extraction, the nucleic acid concentration and quality were determined using the micro ultraviolet spectrophotometer. An appropriate amount of the extracted DNA sample was diluted and used as a qPCR template for amplification using Cytology 2× T5 Fast qPCR Mix (SYBR Green I) and the following primers: PolF (FAAAGGYGGWATCGGYAARTCCACCAC)/PolR(RTTGTTSGCSGCRTACATSGCCATCAT) [51]. The reaction system was 20 μL, including 10 μL 2× T5 Fast qPCR Mix (SYBR Green I), 1 μL positive and negative primers, 1 μL DNA template, and the remaining volume was supplemented with sterile water. The PCR amplification procedure was as follows: 95 °C for 12 min; 94 °C for 1 min; 55 °C for 30 s; 72 °C for 1 min; and 39 cycles. The plasmid concentration of eight target gene fragments was prepared, and the standard curve was plotted with the logarithm of the initial template DNA copy number as the horizontal coordinate and the Ct value. Based on the Ct value of the tested samples, nifH gene abundance was estimated using the standard curve. The gradient dilution standard plasmid was amplified through fluorescent quantitative PCR to calculate nifH abundance.

2.5. High-Throughput Sequencing Analysis

The original sequence was analyzed using QIIME (version 1.8.0) and USEARCH (version 10.0) to remove primers and low-quality sequences to obtain the final valid sequence. Effective sequences were converted to amino acid sequences by FunGene Pipeline. The translation protein does not match the nifH protein or the sequence containing the stop codon is discarded. High-quality sequences were clustered into operational taxonomic units (OTUs) with 97% similarity and all singleton OTUs were deleted. MEGAN (version 5.8.1) software was used for sequence comparison in the NCBI database (serial number PRJNA 836297) to determine the classification of nifH OUT. Alpha diversity was evaluated by Abundance-based Coverage Estimator (ACE), Chao1, and Shannon and Simpson indices [52].

2.6. Data Analysis

Data were collected and processed using Excel 2019. SPSS 23.0 was used for analyzing the data for ANOVA. Duncan multiple comparison was performed for one-way ANOVA to compare differences among the various treatments. The effects of seasonal change, fertilization management, and water management practices on nifH abundance were analyzed through two- and three-factor ANOVA. The Pearson correlation coefficient (p < 0.05) was used to analyze the correlation between nifH abundance and soil physicochemical properties. Corresponding graphs were drawn using Origin 2021. The redundancy analysis (RDA) of the community structure of N-fixing microbes and environmental factors was performed using CANOCO 5 software.

3. Results

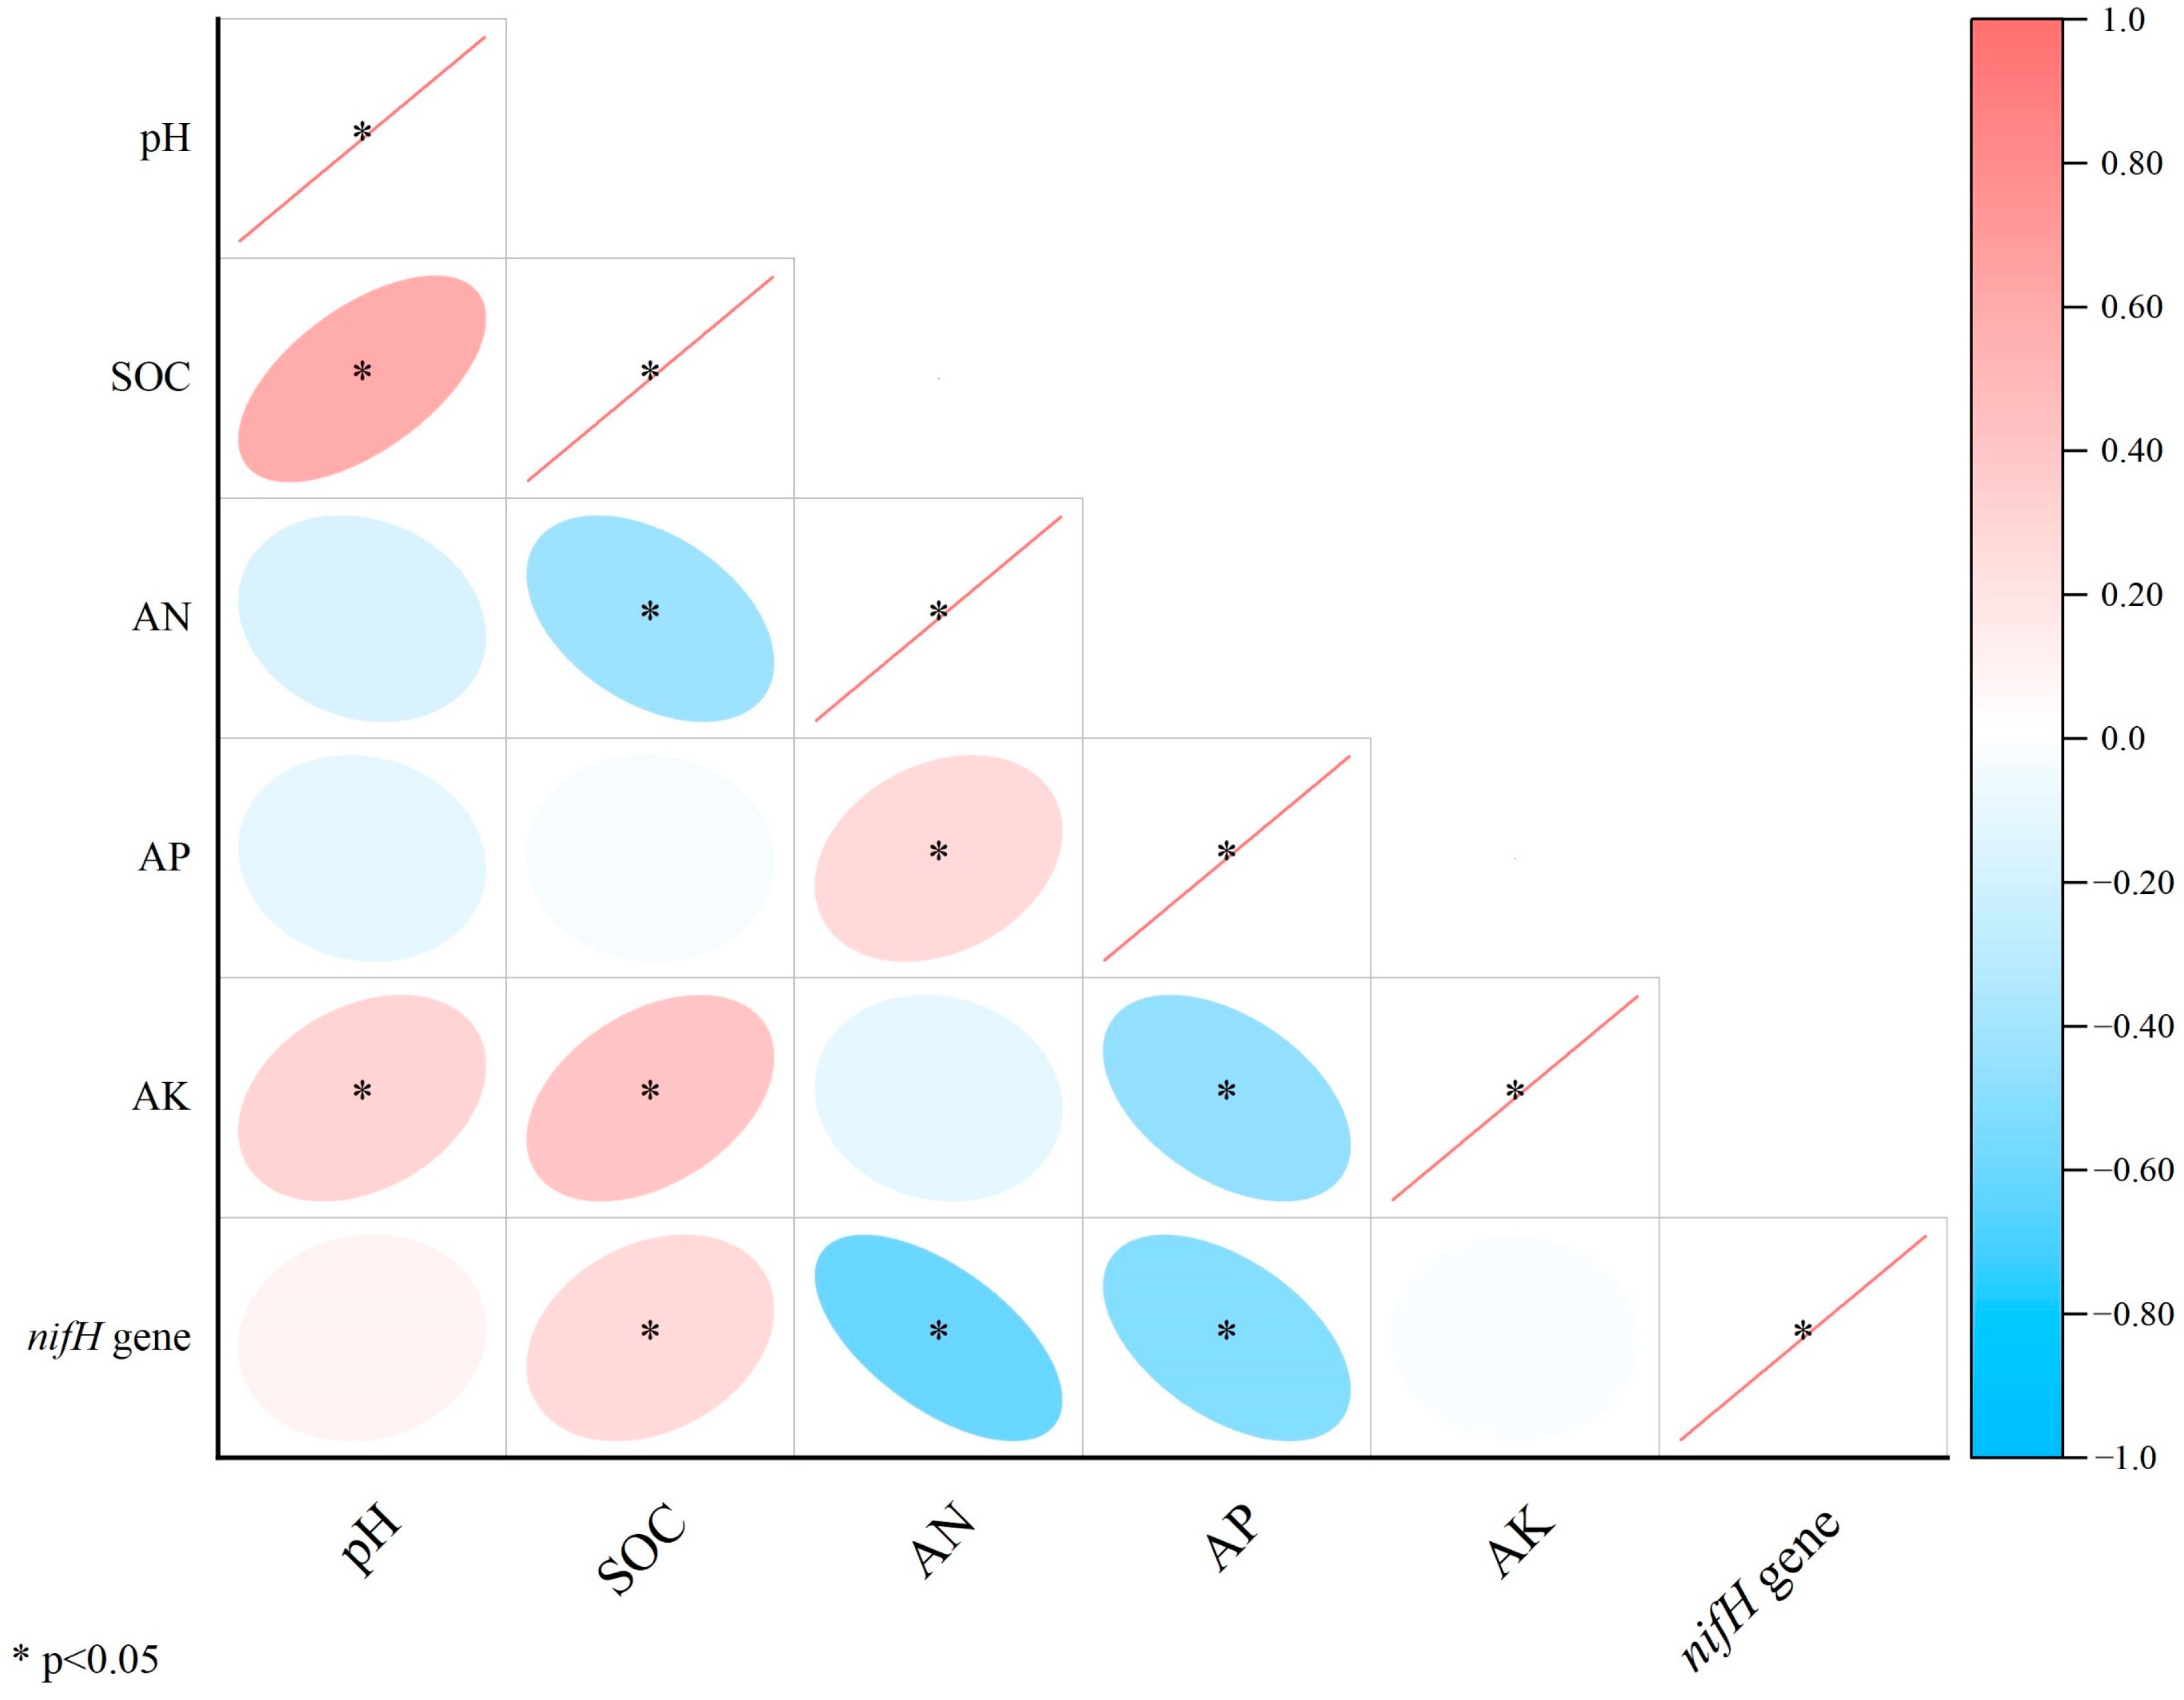
3.1. Soil Physicochemical Properties

Following four seasons of rice planting, the applied N fertilizer reduced soil pH. However, under the same fertilization condition, flooding treatment exerted no significant effect on soil pH (Table 2). Compared with other treatments, biochar addition significantly increased soil pH and significantly increased SOC. Under the same fertilization condition, flooding treatment increased the soil available N content (except in the early rice season in the second year for FCON and in the late rice season in the first year for FCK and FCON), and the increase rates of the FCK and FCON treatments were 12.06% to 14.64% and 8.61% to 20.27%, respectively (Table 2). By contrast, biochar only significantly decreased the available N content in the early rice season in 2019, and then, the effect disappeared. Except for the second year of the early rice season, flooding treatment reduced the soil available P content. Compared with CON, biochar alone reduced the available P content in the first year, but had no effect on the content in the second year. In addition to the early rice season in 2020, the available K content following in the FCK and FCON treatments increased by 17–70% and 3.0–81%, respectively, compared with the CK treatment. Additionally, soil available N and P contents were higher after the first year of rice planting than after the second year.
Table 3 and Table 4 present the average soil physicochemical properties of the four rice planting seasons. Compared with other treatments, biochar significantly increased soil pH and SOC, whereas flooding treatment significantly decreased soil available P and K contents. Under different water management conditions, N fertilizer application and seasonal changes significantly affected the measured soil properties (p < 0.05), whereas water management only significantly affected SOC and soil available P and available K contents (p < 0.05). Following conventional water management, different fertilization treatments significantly affected pH, SOC, and the available K content, while seasonal changes significantly affected other soil properties (p < 0.05), except pH. However, different fertilization treatments and seasonal changes only exhibited significant interactions with soil available N and K contents.

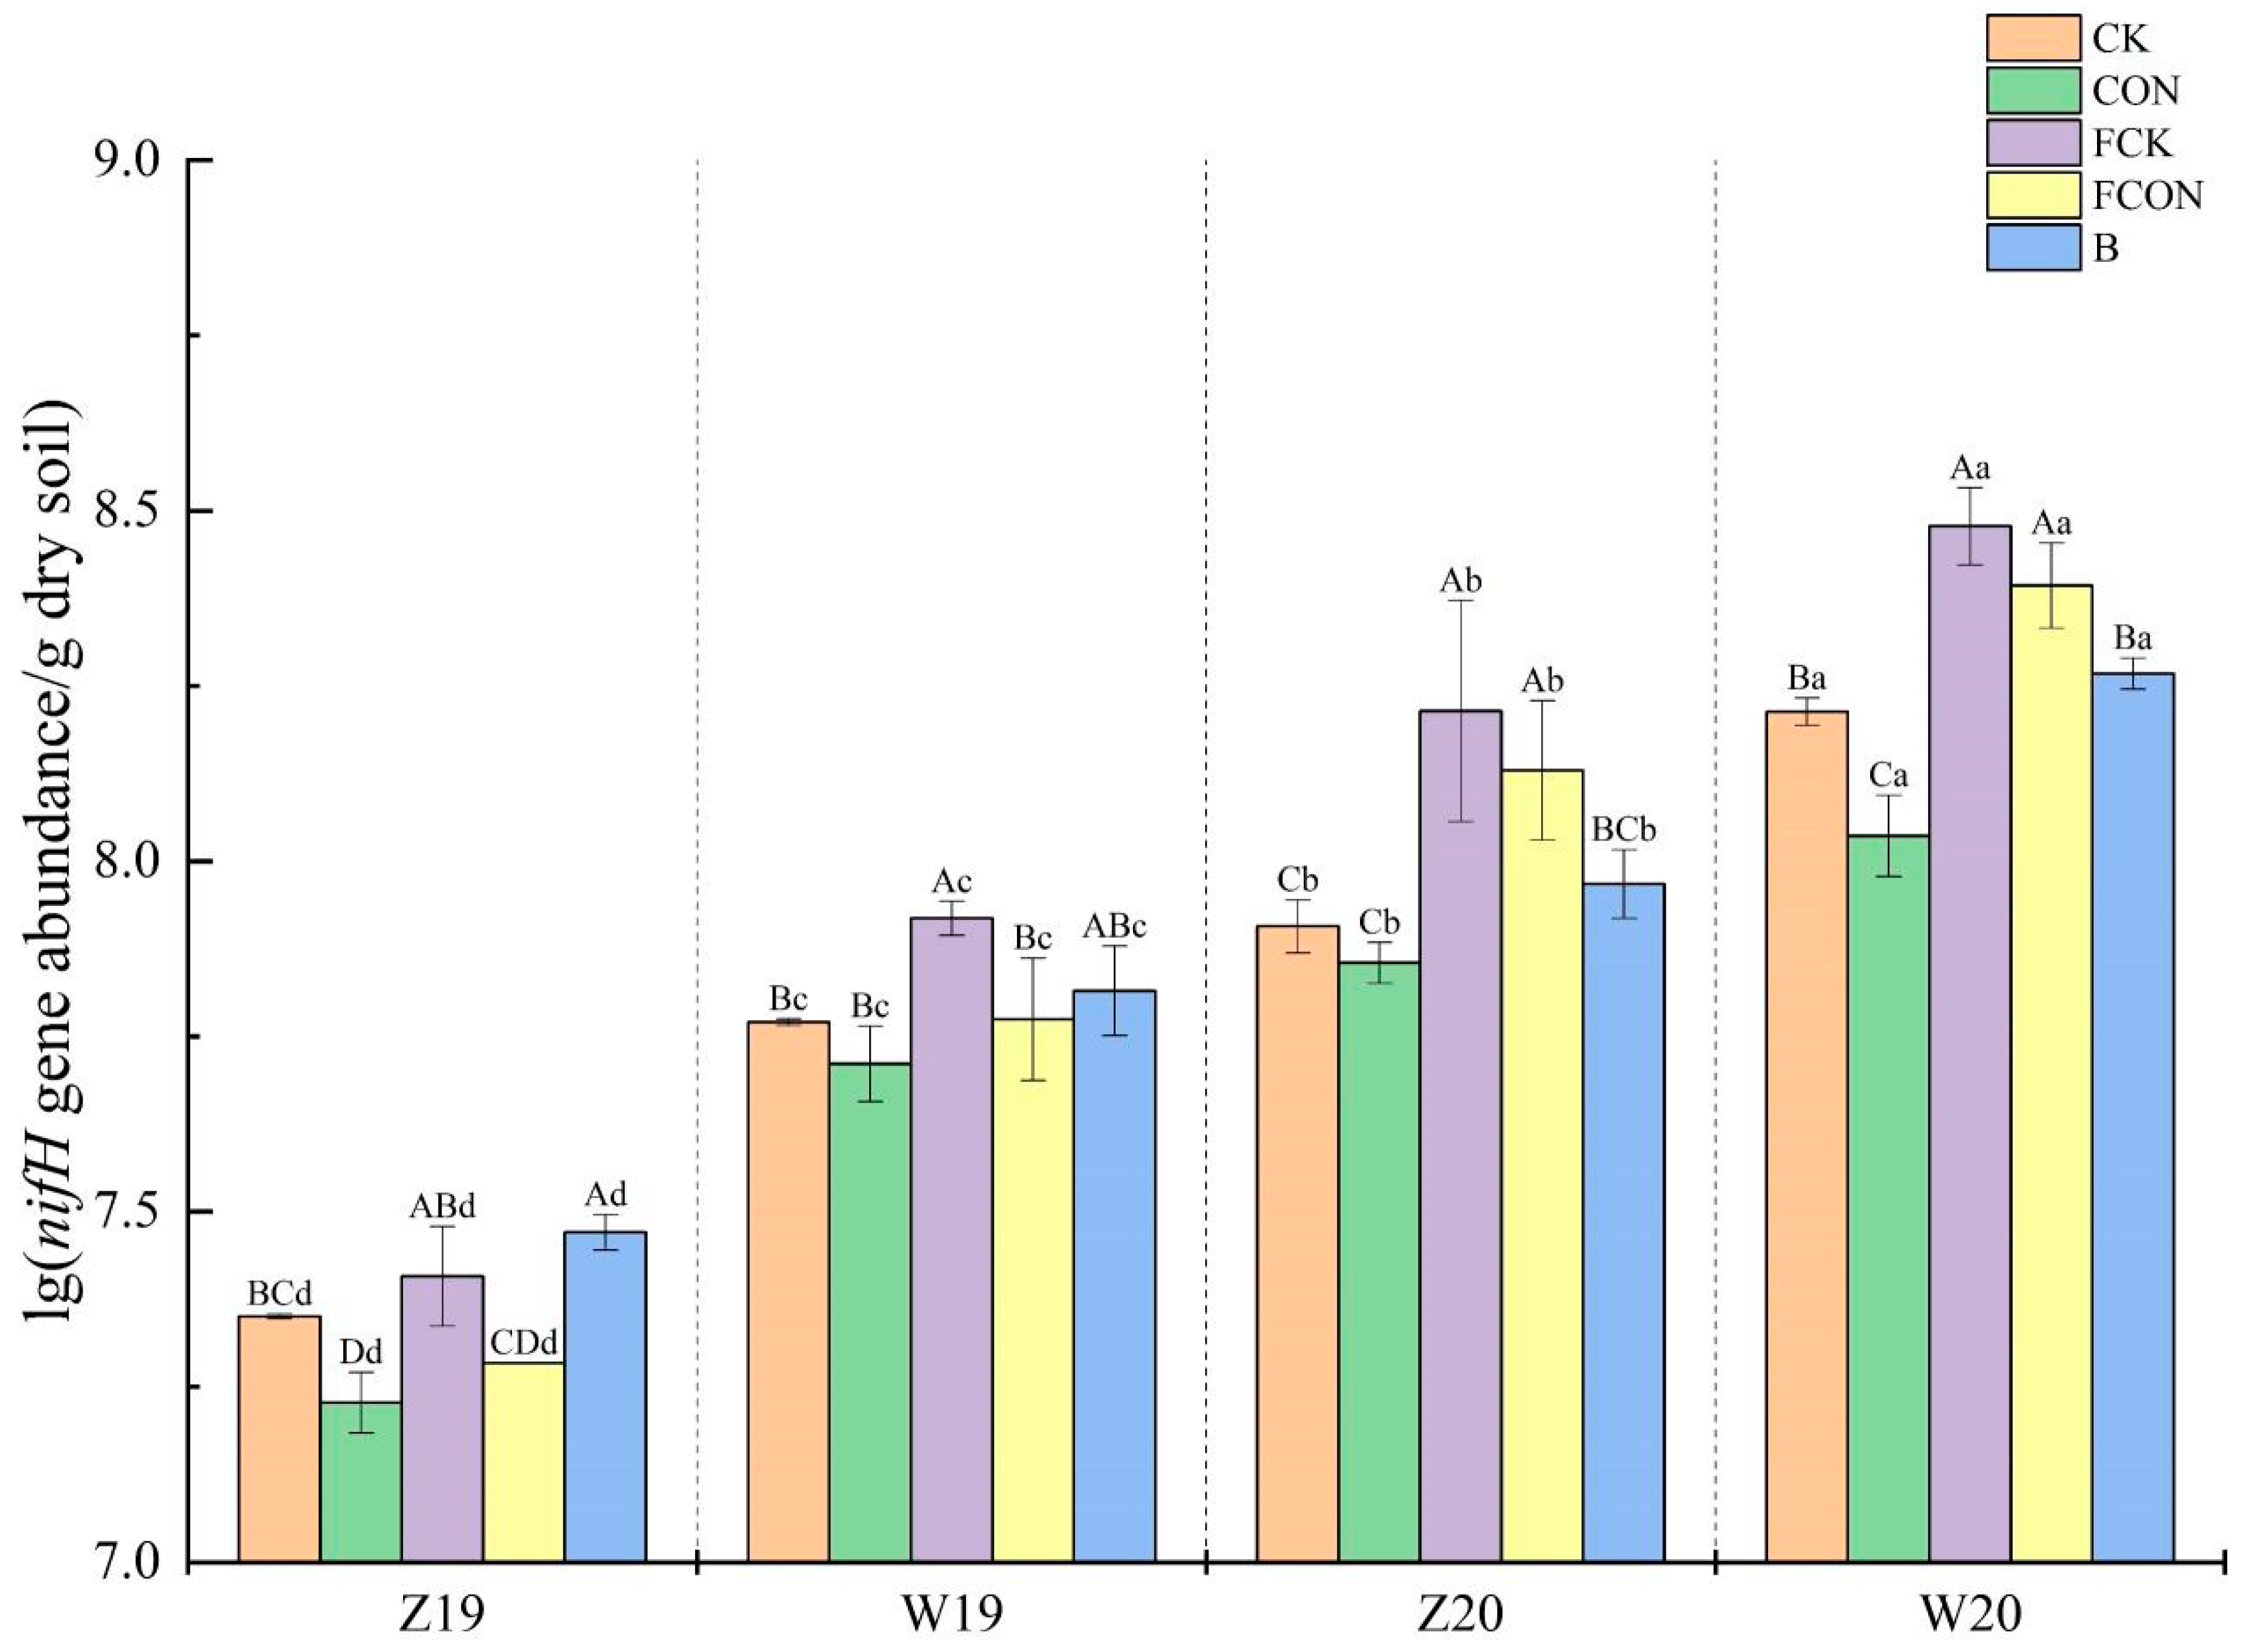
3.2. nifH Gene Abundance

With the same treatment, nifH gene abundance increased in the second year (Figure 1). Compared with the conventional water management treatment, the FCK and FCON treatments increased nifH abundance by 15–41% and 17–93%, respectively. The FCK treatment resulted in higher abundance than the CK treatment. Compared with the CON treatment, biochar addition increased nifH gene abundance by 13–74% in the four-season rice cultivation. Compared with the CK and FCK treatments, the CON and FCON treatments reduced nifH abundance by 11–15% and 8.0–28%, respectively. With the second year of the early rice season being an exception, nifH abundance significantly increased after the biochar treatment compared with the CON treatment. However, this nifH abundance was higher than that after the FCON treatment only in the first year and lower than that after the FCON treatment in the second year, which was not remarkably different from that after the CK treatment.
Under the same water management treatment, N fertilizer application decreased soil nifH abundance, except for the early rice season in the first year. Regarding the average nifH abundance in the four seasons (Table 3 and Table 4), both flooding and biochar treatment significantly increased nifH abundance. N fertilizer application, seasonal change, and water management all significantly affected nifH abundance under different water management practices (p < 0.05), but only season and water management exhibited a significant interaction (p < 0.05) (Table 3). Under conventional water management treatment, different fertilization treatments and seasonal changes significantly affected nifH abundance (p < 0.05), but no significant interaction was observed between them (Table 4).
According to the obtained nifH abundance and measured soil properties, the correlation analysis was performed (Figure 2). nifH abundance exhibited no significant correlation with pH and the available K content, but was negatively correlated with available N and P contents (p < 0.05). By contrast, nifH abundance exhibited a significant positive correlation with SOC (p < 0.05).

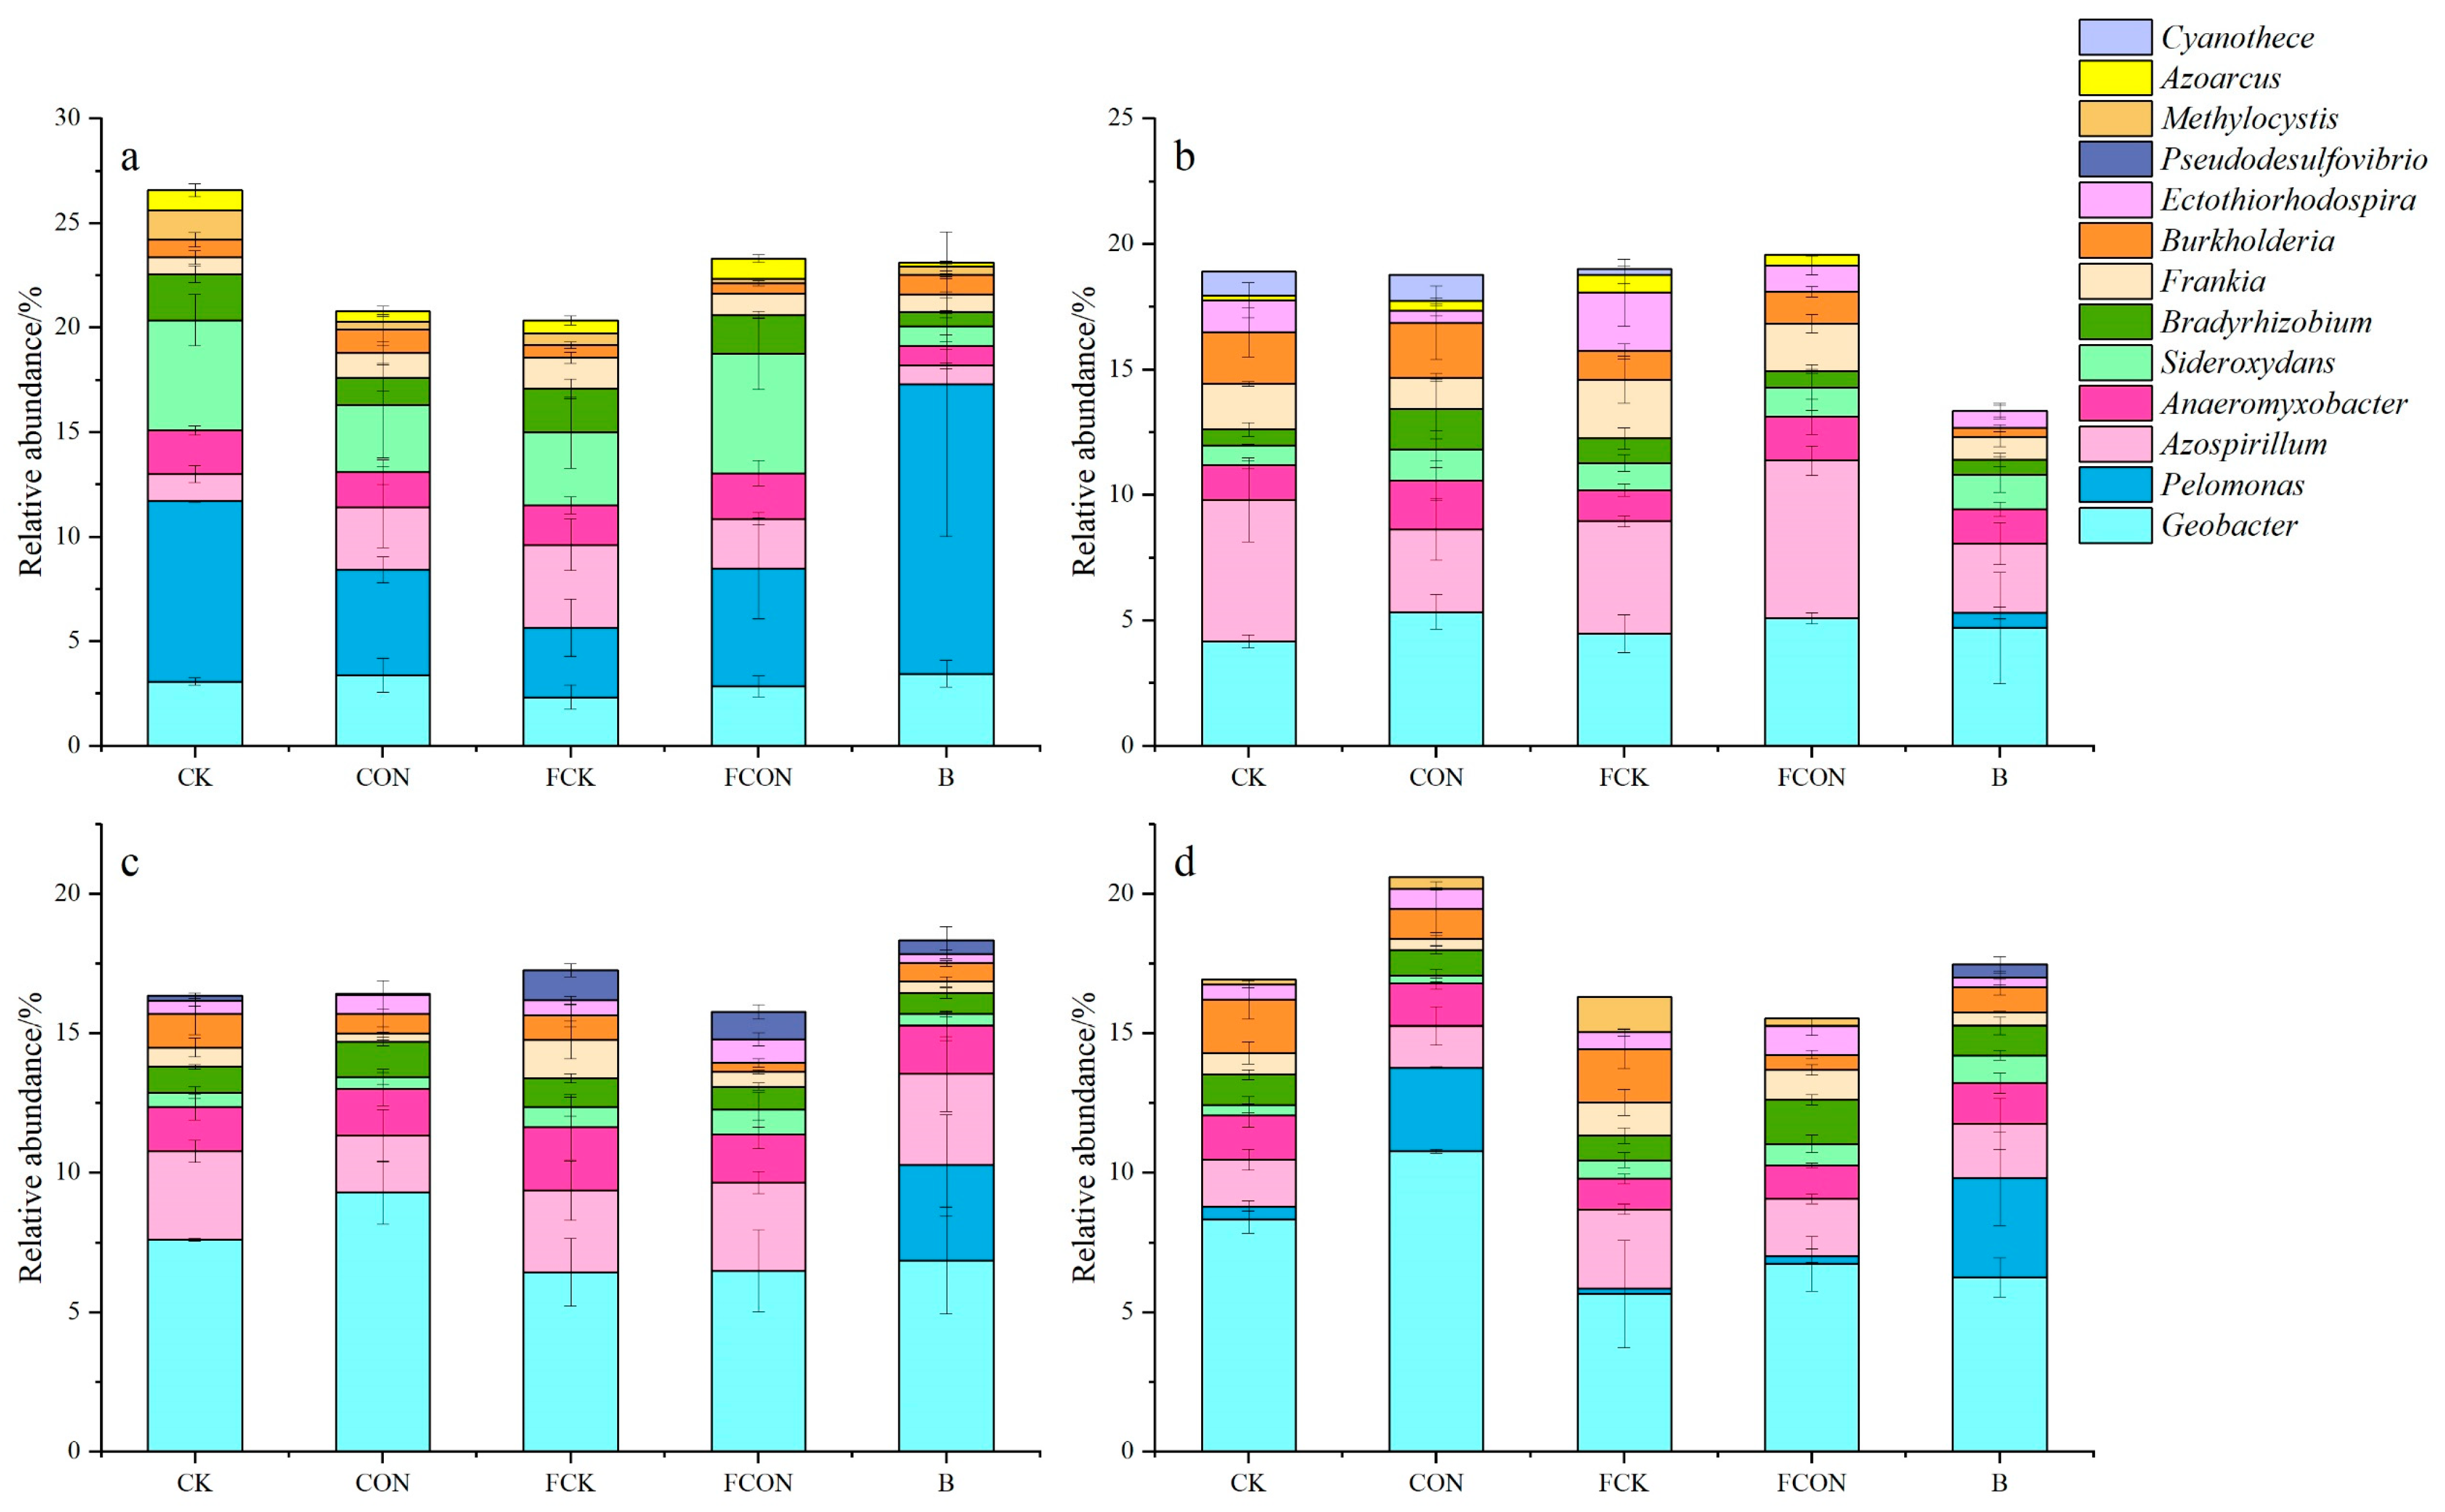
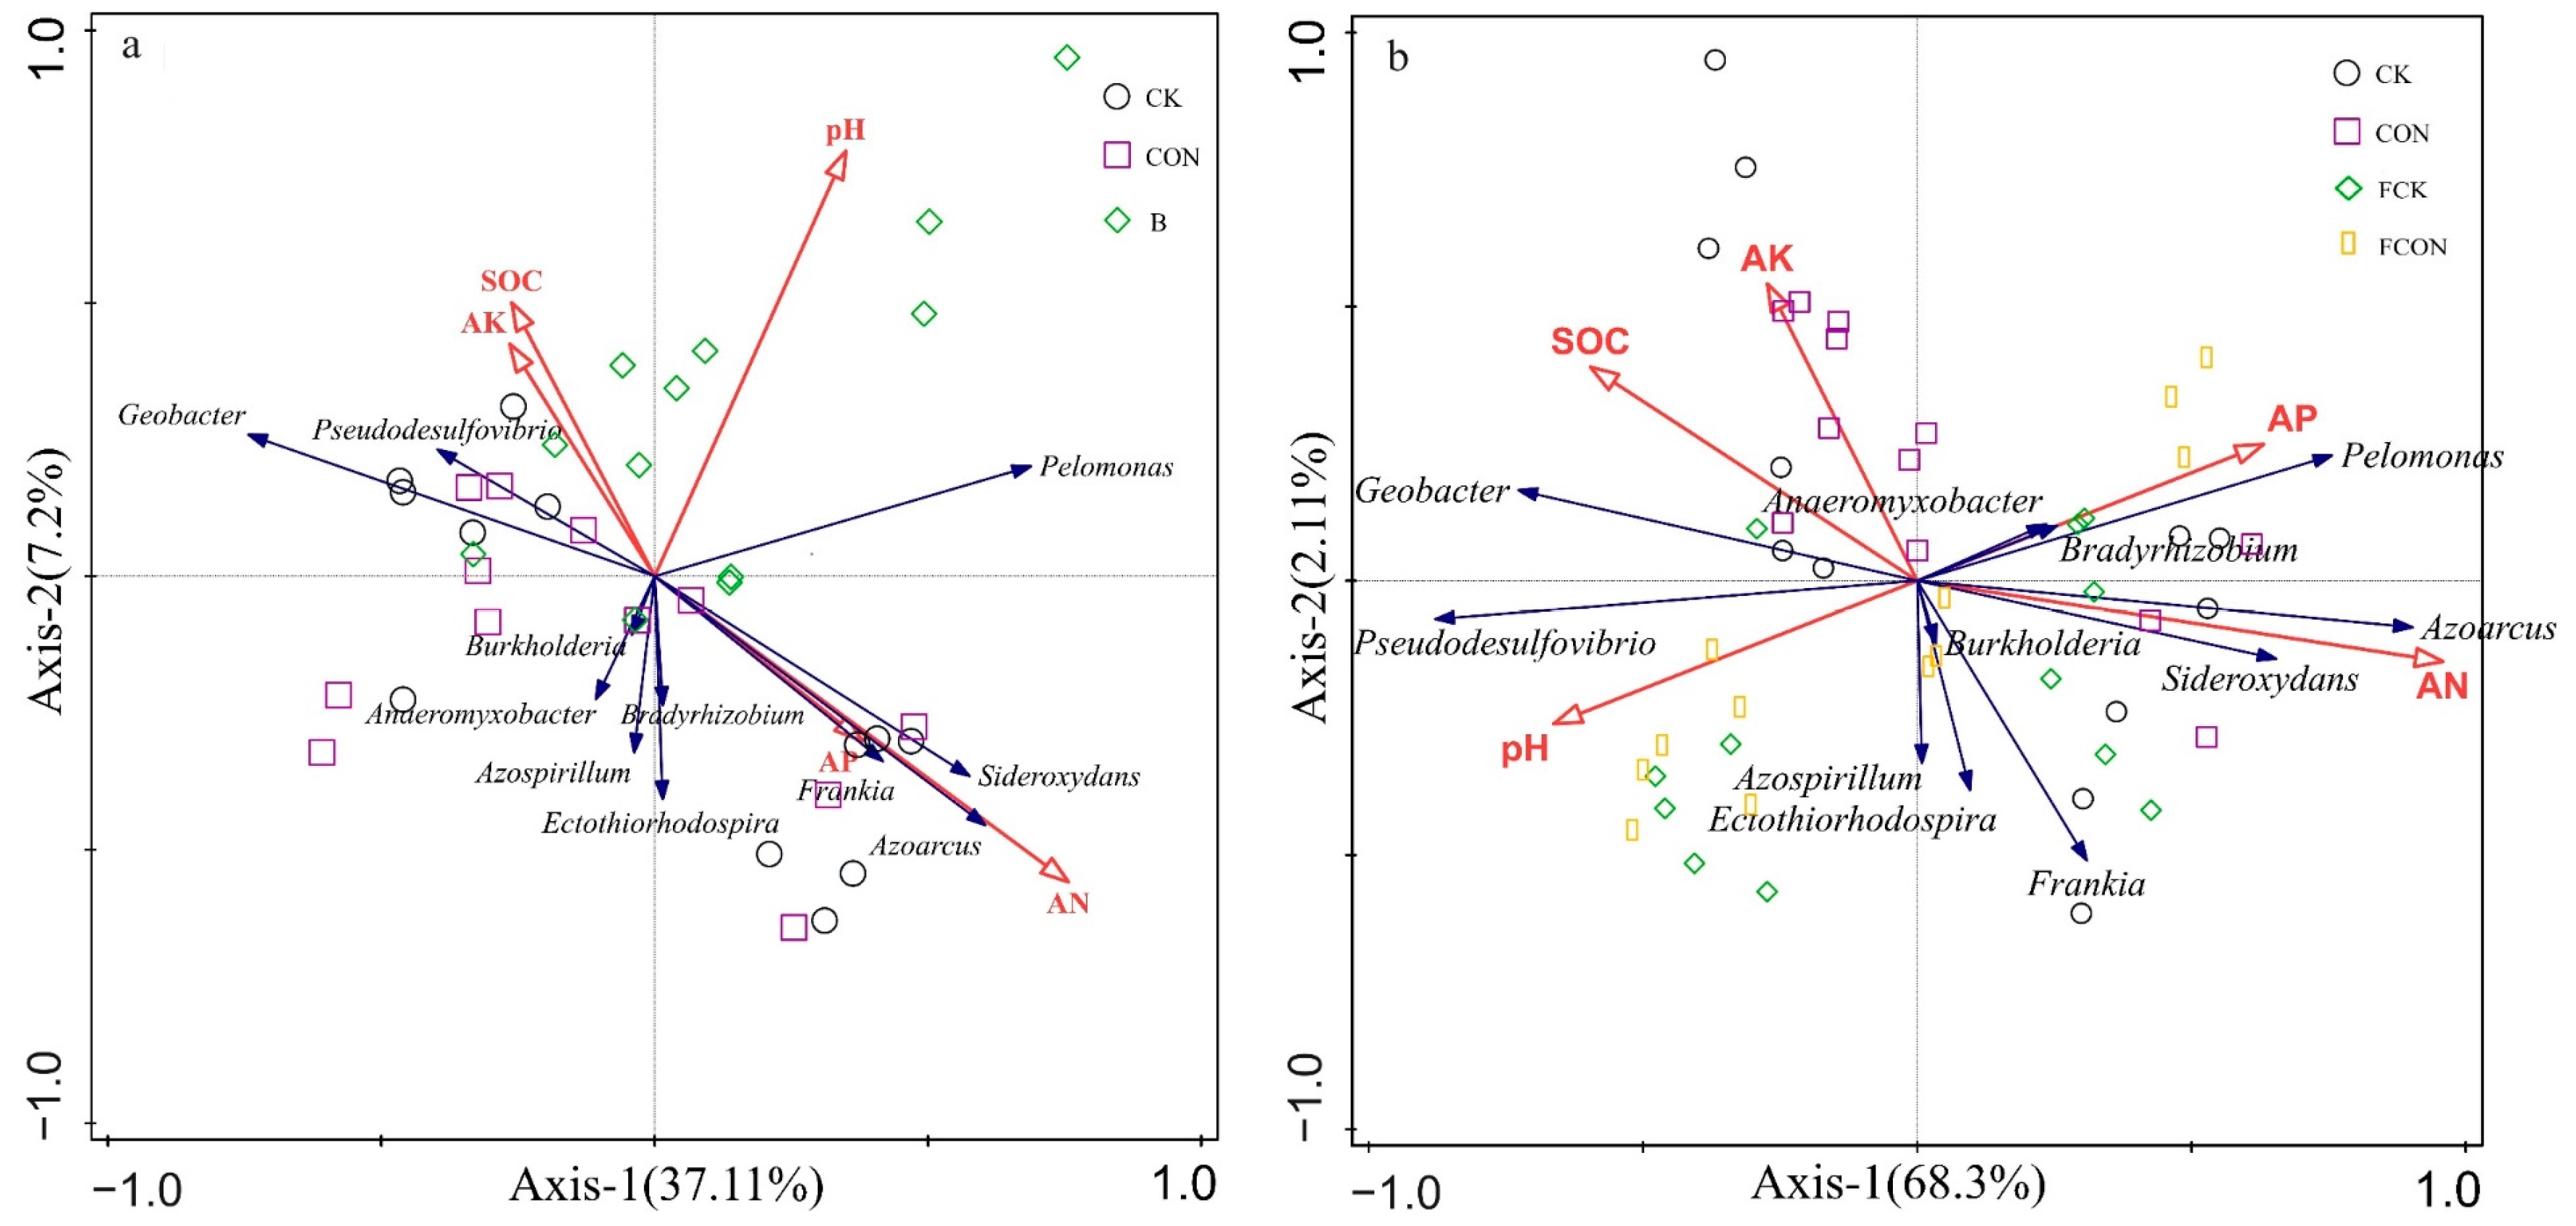
3.3. Effects of Different Treatments on Community Structure of nifH Gene-Related Microorganisms

According to the OTU classification, alpha diversity analysis was conducted. Table 5 presents each index. With rice planting, the ACE and Chao1 indices exhibited an increasing trend. Under the same fertilization condition, the ACE, Chao1, Shannon, and Simpson indices increased in the FCK and FCON treatments. Flooding increased the richness of the microbial community and species, but decreased community uniformity. Except for the early rice season in the first year, although the ACE and Chao1 indices increased after the biochar treatment compared with the CON treatment, the impact in the second year was significantly reduced (p < 0.05) compared with that in the first year. Biochar treatment only reduced the Simpson index in the first year, whereas it increased the same index in the second year, but not as much as the flooding treatment. Thus, the effects of biochar application on microbial diversity gradually decreased with rice planting and were not associated with flooding.
The abundance of nifH-related microorganisms in each treatment was determined through high-throughput sequencing. Other unclassified bacterial genera were excluded. Geobacter, Pelomonas, and Azospirllum were the main dominant bacterial genera (Figure 3). The relative abundance of Geobacter in rice in the first year of each treatment was lower than that in the second year. In the same rice season, biochar treatment increased the relative abundance of Pelomonas compared with the other treatments. Compared with the conventional water management treatment, the FCK and FCON treatments increased the relative abundance of Azospirillum, whereas they decreased the relative abundance of Pelomonas and Geobacter in the second year. With the same water management treatment, the CON and FCON treatments increased the relative abundance of Geobacter and Anaeromyxbacter.
According to the RDA results (Figure 4), biochar application mainly affected soil pH and the SOC content. Biochar mainly affected bacteria belonging to Pelomonas. Pelomonas was positively correlated with pH, which indicated that biochar mainly affected the relative abundance of Pelomonas by increasing soil pH (Figure 4a). However, Pelomonas was significantly and negatively correlated with pH, while Azospirllum exhibited a negative correlation with the available P content. Flooding affected the diazotrophic microbial composition mainly by changing soil pH and available N and P contents (Figure 4b). Geobacter negatively correlated with the available N content in all treatments. This indicated that the available N content was the main factor influencing Geobacter. Pelomonas was positively correlated with the available P content.

4. Discussion

4.1. Effects of Flooding and Biochar Amendment on nifH Gene Abundance

In topsoil, nifH abundance was positively proportional to the N fixation rate [25,47], so nifH abundance can serve as a relevant index of soil activity. In this study, nifH abundance in the early rice season was lower than that in the late rice season (Figure 1). nifH abundance may increase because of an increase in temperature and precipitation in the late rice season. BNF activity in soil changes with temperature and humidity [53]. In the present study, low temperature in the early rice season easily inhibits nitrogenase activity and microbial metabolism. This is possibly why nifH abundance in the early rice season was lower than that in the late rice season. Additionally, because of less rainfall in the early rice season, the field was prone to insufficient irrigation water, which affected the microbial community structure of rice soil [54]. Moreover, compared with conventional irrigation measures, flooding significantly increased nifH abundance and microbial alpha diversity. This also suggests that soil flooding in paddy fields affects the soil diazotrophic microbial activity and community structure [55].
The SOC content is among the primary factors affecting the growth of soil microorganisms. BNF in soil is often affected by the SOC content. The SOC content may affect bacterial nifH abundance and increase BNF in soil [56]. A significant positive correlation was also observed between SOC and nifH abundance in this study (Figure 2). In addition, the input of N and P affected the abundance of soil diazotrophic microorganisms and nifH genes. Long-term application of the chemical fertilizer in paddy soil reduced soil nitrogenase activity [57], with an increase in the N application rate and a decrease in the soil N2 fixation rate [48]. This may be due to the sensitivity of nifH-encoded nitrogenase to N input [25]. Similar results were obtained in the present study as N fertilizer application reduced nifH abundance. According to previous studies, N input reduced N fixation activity and nifH abundance, whereas P input exerted a positive effect [58]. P deficiency inhibited nifH gene expression and decreased N fixation activity in the paddy field soil [37]. In this study, the soil available P content was inversely proportional to nifH abundance (Figure 2), which is in disagreement with the results of other studies [37], which may due to the high fertilizer application rate and higher P residues in the tropical field. Thus, nifH abundance was inhibited [59]. These results suggest that reducing P application in this cropping system is beneficial for BNF.
Furthermore, as a microbial habitat, biochar boosts microbial activity [60]. However, in this study, the impact of biochar treatment on the nifH gene in the second year was significantly lower than that of the flooding treatment. This can be attributable to the decreased C availability after biochar aging, which made it challenging for bacteria to decompose and utilize biochar [61]. However, C availability often affects the ability of microbes to fix N [62], and so, the effect of second-year C in this study was far lower than that of the flooding treatment. Additionally, biochar aging was related to the decreased impact on the amended soil environment [63]. Consequently, the biochar treatment only reduced the available N content in the early rice season in 2019, which decreased the effect of biochar on nifH gene stimulation in the following year.

4.2. Effects of Flooding and Biochar on the Community Structure of Diazotrophic Microorganisms

Long-term N fertilizer application affects the soil diazotrophic microbial community structure [34]. In this study, fertilization decreased the abundance of the soil microbial community and ACE, Chao1, and Shannon indices of the diazotrophic microbial community. This indicated that the N fertilizer applied decreased the diversity of the diazotrophic microbial community [64]. This was mainly because of the increase in the soil available N content caused by the applied N fertilizer, which reduced the diazotrophic microbial diversity [65].
Biochar addition previously affected the diazotrophic microbial community structure in alkaline soil [40]. Compared with the CON treatment, although the biochar treatment increased the diazotrophic microbial community diversity, the increase was less than that resulting from the flooding treatment in the second year. This may be due to certain SOC present in the first-year biochar, which induces an increase in nifH gene abundance [66]. After aging, the SOC in the second-year biochar decreased [67], thereby reducing the impact on the amended soil environment [63] and thus decreasing the effect in the second year.
Different water management treatments could also affect the soil microbial community structure and function [30,68]. In this study, flooding increased the diazotrophic microbial community diversity (Table 5). This may be related to flooding-induced reduction in soil pH and the available P content. In the second year [33], nifH abundance after the biochar treatment was lower than that after the FCON. The flooding treatment increased the abundance of diazotrophic microbial communities in all planting years. This suggests that the effect of aging biochar on microbes may be far less than that of flooding.
Consistent with previous study results, Proteobacteria was the main diazotrophic bacteria family in the paddy soil [15,19]. Although diazotrophic bacteria have been extensively studied, the effects of biochar application and different water management treatments on diazotrophic bacteria in tropical regions are less known. Most current studies have believed that changes in soil properties can affect the composition of soil diazotrophic microbial communities [64,65]. However, diazotrophic microbial communities respond differently to environmental factors in different soil types [18].
In the present study, Geobacter, Pelomonas, and Azospirllum were the main bacterial genera involved in N fixation in paddy soil [19]. According to the RDA analysis results (Figure 4), the effects of soil properties on different diazotrophic bacterial genera varied. Geobacter was among the main dominant bacterial genera and was significantly negatively correlated with available N. Soil N enrichment often inhibits the growth of diazotrophic bacteria [69]. A similar conclusion was drawn in the present study, as the soil available N content decreased gradually with rice planting, whereas Geobacter abundance increased gradually. However, some studies have reported that Geobacter grows well at a neutral pH [70]. In this study, pH had little effect on Geobacter growth, especially in biochar-treated soils. This indicates that pH is not a major factor influencing Geobacter in tropical paddy field soils.
Pelomonas is also a common diazotrophic genus [71]. It was also among the dominant bacterial genera in this study. According to previous studies, Pelomonas is positively correlated with pH [13], which is similar to the results of biochar treatment in our study. Biochar addition increased soil pH, which stimulated the relative abundance of Pelomonas and increased nifH gene abundance. However, Pelomonas exhibited a negative correlation with soil pH during the flooding treatment, which led to slight pH change between different water management treatments (Table 2). This indicated that diazotrophic microbial communities responded differently to environmental factors under different tillage practices [72]. In the present study, the response of Pelomonas to environmental factors varied between the flooding and biochar treatments (Figure 2). In the flooding treatment, Pelomonas was negatively correlated with pH. On the other hand, biochar treatment increased the relative abundance of Pelomonas, which was primarily due to soil pH. The contrasting results are attributable to the impact of soil changes on the symbiotic pattern of diazotrophic microorganisms, which prompt them to adapt to the altered environment [73]. The flooding treatment may have had a slight effect on soil pH, so soil pH is not a major factor influencing Pelomonas in the flooding treatment. The available P content decreased, and Pelomonas was positively correlated with the available P content in the flooding treatment. Therefore, flooding treatment can reduce Pelomonas abundance by reducing available P.
Azospirllum is widely found in paddy soil [74,75]. It is often believed to dissolve phosphate in soil and promote phosphorus uptake by crops [76]. In this study, Azospirllum was among the Azospirllum species affected by flooding, and a negative correlation was observed between Azospirllum and the available P content. This indicates that flooding stimulated Azospirllum, which accelerated P dissolution. The dissolved P was absorbed by crops, which reduced the soil available P content in the flooding treatment. However, the correlation between Azospirllum and available P was not significant, which suggested that other diazotrophic genera such as Geobacter also participate in the P cycle [77]. Additionally, studies have shown that Azospirllum promotes rice growth and increases rice yield [78]. At the same time, it also participates in the soil N cycle [79], which suggests that flooding contributes to rice growth and yield.

5. Conclusions

In conclusion, both flooding and biochar addition affected the diazotrophic microbial community in the paddy soil and increased nifH gene abundance. However, the effect of biochar decreased in the second year. These results revealed that the effects of flooding and biochar on nifH abundance in tropical soils were mainly related to SOC and available N and P contents. Additionally, flooding and biochar increased N fixation in the paddy soil by stimulating the relative abundance of Azospirllum and Pelomonas, respectively. Flooding treatment may promote crop yield and P absorption by stimulating Azospirllum. Tests specifically examining the effects of biochar were conducted under conventional water management conditions. Unfortunately, the application of the same treatment under flooded conditions caused damage, attributed to human factors.

Author Contributions

Y.C.: Conceptualization, methodology, writing—original draft, writing—review and editing. Y.Z.: Investigation, formal analysis, validation. Y.W. (Yuqin Wang), X.L., X.Q., Q.C., Q.Z. and A.S.E.: Formal analysis, validation, investigation. Y.W. (Yanzheng Wu) and L.M.: Conceptualization, methodology, software, resources, investigation, supervision, project administration, funding acquisition. All authors have read and agreed to the published version of the manuscript.

Funding

This research was supported by National Natural Science Foundation of China (42367048, 41671243), Hainan Provincial Natural Science Foundation of China (2019RC049, 320RC493).

Institutional Review Board Statement

Not applicable.

Data Availability Statement

Data are contained within the article.

Conflicts of Interest

The authors declare no conflicts of interest.

References

  1. Qin, C.; Wright, A.L.; Ma, L.; He, X.; Xie, D.; Jiang, X. Improving nitrogen-use efficiency by using ridge tillage in rice paddy soils. Soil Use Manag. 2022, 38, 528–536. [Google Scholar] [CrossRef]
  2. Zhu, Z.L.; Chen, D.L. Nitrogen fertilizer use in China—Contributions to food production, impacts on the environment and best management strategies. Nutr. Cycl. Agroecosyst. 2002, 63, 117–127. [Google Scholar] [CrossRef]
  3. Zhang, J.; Zhang, F.; Yang, J.; Wang, J.; Cai, M.; Li, C.; Cao, C. Emissions of N2O and NH3, and nitrogen leaching from direct seeded rice under different tillage practices in central China. Agric. Ecosyst. Environ. 2011, 140, 164–173. [Google Scholar]
  4. Guo, J.H.; Liu, X.J.; Zhang, Y.; Shen, J.L.; Han, W.X.; Zhang, W.F.; Christie, P.; Goulding, K.W.T.; Vitousek, P.M.; Zhang, F.S. Significant Acidification in Major Chinese Croplands. Science 2010, 327, 1008–1010. [Google Scholar] [CrossRef]
  5. Zhang, X.; Davidson, E.A.; Mauzerall, D.L.; Searchinger, T.D.; Dumas, P.; Shen, Y. Managing nitrogen for sustainable development. Nature 2015, 528, 51–59. [Google Scholar] [CrossRef]
  6. Cleveland, C.C.; Townsend, A.R.; Schimel, D.S.; Fisher, H.; Howarth, R.W.; Hedin, L.O.; Perakis, S.S.; Latty, E.F.; Von Fischer, J.C.; Elseroad, A. Global patterns of terrestrial biological nitrogen (N2) fixation in natural ecosystems. Glob. Biogeochem. Cycles 1999, 13, 623–645. [Google Scholar] [CrossRef]
  7. Davies-Barnard, T.; Friedlingstein, P. The Global Distribution of Biological Nitrogen Fixation in Terrestrial Natural Ecosystems. Global Biogeochem. Cycles 2020, 34, e2019GB006387. [Google Scholar] [CrossRef]
  8. Roger, P.A.; Watanabe, I. Technologies for utilizing biological nitrogen fixation in wetland rice: Potentialities, current usage, and limiting factors. In Nitrogen Economy of Flooded Rice Soils. Developments in Plant and Soil Sciences; De Datta, S.K., Patrick, W.H., Eds.; Springer: Dordrecht, The Netherlands, 1986; Volume 26. [Google Scholar] [CrossRef]
  9. Ueda, T.; Suga, Y.; Yahiro, N.; Matsuguchi, T. Remarkable N2-fixing bacterial diversity detected in rice roots by molecular evolutionary analysis of nifH gene sequences. J. Bacteriol. 1995, 177, 1414–1417. [Google Scholar] [CrossRef]
  10. Herridge, D.F.; Peoples, M.B.; Boddey, R.M. Global inputs of biological nitrogen fixation in agricultural systems. Plant Soil 2008, 311, 1–18. [Google Scholar] [CrossRef]
  11. Boujenna, A.; del Moral, L.F.G. Biotechnological approaches to develop nitrogen-fixing cereals: A review. Span. J. Agric. Res. 2021, 19, 12. [Google Scholar] [CrossRef]
  12. Islam, M.R.; Sultana, T.; Cho, J.C.; Joe, M.M.; Sa, T.M. Diversity of free-living nitrogen-fixing bacteria associated with Korean paddy fields. Ann. Microbiol. 2012, 62, 1643–1650. [Google Scholar] [CrossRef]
  13. Guo, L.; Wang, C.; Zheng, M.M.; Li, W.X.; Cai, Z.J.; Wang, B.R.; Chen, J.; Shen, R.F. Fertilization practices affect biological nitrogen fixation by modulating diazotrophic communities in an acidic soil in southern China. Pedosphere 2023, 33, 301–311. [Google Scholar] [CrossRef]
  14. Masuda, Y.; Shiratori, Y.; Ohba, H.; Ishida, T.; Takano, R.; Satoh, S.; Shen, W.S.; Gao, N.; Itoh, H.; Senoo, K. Enhancement of the nitrogen-fixing activity of paddy soils owing to iron application. Soil Sci. Plant Nutr. 2021, 67, 243–247. [Google Scholar] [CrossRef]
  15. Cai, S.; Zhang, H.; Zhu, H.; Xu, S.; Zhang, D.; Lv, W. Rice Rotation System Affects the Spatial Dynamics of the Diazotrophic Community in Paddy Soil of the Yangtze Delta, China. Eurasia Soil Sci. 2019, 52, 696–706. [Google Scholar] [CrossRef]
  16. Wu, C.; Wei, X.; Hu, Z.; Liu, Y.; Hu, Y.; Qin, H.; Chen, X.; Wu, J.; Ge, T.; Zhran, M.; et al. Diazotrophic Community Variation Underlies Differences in Nitrogen Fixation Potential in Paddy Soils across a Climatic Gradient in China. Microb. Ecol. 2021, 81, 425–436. [Google Scholar] [CrossRef]
  17. Ge, T.; Luo, Y.; He, X. Quantitative and mechanistic insights into the key process in the rhizodeposited carbon stabilization, transformation and utilization of carbon, nitrogen and phosphorus in paddy soil. Plant Soil 2019, 445, 1–5. [Google Scholar] [CrossRef]
  18. Mårtensson, L.; Díez, B.; Wartiainen, I.; Zheng, W.; El-Shehawy, R.; Rasmussen, U. Diazotrophic diversity, nifH gene expression and nitrogenase activity in a rice paddy field in Fujian, China. Plant Soil 2009, 325, 207–218. [Google Scholar] [CrossRef]
  19. Wang, H.; Li, X.; Li, X.; Li, F.; Su, Z.; Zhang, H. Community Composition and Co-Occurrence Patterns of Diazotrophs along a Soil Profile in Paddy Fields of Three Soil Types in China. Microb. Ecol. 2021, 82, 961–970. [Google Scholar] [CrossRef]
  20. Peng, J.; Wu, X.; Ni, S.; Wang, J.; Song, Y.; Cai, C. Investigating intra-aggregate microstructure characteristics and influencing factors of six soil types along a climatic gradient. Catena 2022, 210, 105867. [Google Scholar] [CrossRef]
  21. Wang, X.; Liu, B.; Ma, J.; Zhang, Y.; Hu, T.; Zhang, H.; Feng, Y.; Pan, H.; Xu, Z.; Liu, G.; et al. Soil aluminum oxides determine biological nitrogen fixation and diazotrophic communities across major types of paddy soils in China. Soil Biol. Biochem. 2019, 131, 81–89. [Google Scholar] [CrossRef]
  22. Mergel, A.; Kloos, K.; Bothe, H. Seasonal fluctuations in the population of denitrifying and N2-fixing bacteria in an acid soil of a Norway spruce forest. Plant Soil 2001, 230, 145–160. [Google Scholar] [CrossRef]
  23. Bentley, B.L. Nitrogen Fixation by Epiphylls in a Tropical Rainforest. Ann. Mo. Bot. Gard. 1987, 74, 234–241. [Google Scholar] [CrossRef]
  24. Pereira, E.S.M.C.; Schloter-Hai, B.; Schloter, M.; van Elsas, J.D.; Salles, J.F. Temporal dynamics of abundance and composition of nitrogen-fixing communities across agricultural soils. PLoS ONE 2013, 8, e74500. [Google Scholar]
  25. Smercina, D.N.; Evans, S.E.; Friesen, M.L.; Tiemann, L.K. To Fix or Not to Fix: Controls on Free-Living Nitrogen Fixation in the Rhizosphere. Appl. Environ. Microbiol. 2019, 85, e02546-18. [Google Scholar] [CrossRef] [PubMed]
  26. Said-Pullicino, D.; Cucu, M.A.; Sodano, M.; Birk, J.J.; Glaser, B.; Celi, L. Nitrogen immobilization in paddy soils as affected by redox conditions and rice straw incorporation. Geoderma 2014, 228, 44–53. [Google Scholar] [CrossRef]
  27. Das, S.; Bhattacharyya, P.; Adhya, T.K. Impact of elevated CO2, flooding, and temperature interaction on heterotrophic nitrogen fixation in tropical rice soils. Biol. Fertil. Soils 2011, 47, 25–30. [Google Scholar] [CrossRef]
  28. Rao Rajaramamohan, V.; Rao, J.L.N. Nitrogen fixation (C2H2 reduction) in soil samples from rhizosphere of rice grown under alternate flooded and nonflooded conditions. Plant Soil 1984, 81, 111–118. [Google Scholar] [CrossRef]
  29. Haque, A.N.A.; Uddin, M.K.; Sulaiman, M.F.; Amin, A.M.; Hossain, M.; Solaiman, Z.M.; Mosharrof, M. Rice Growth Performance, Nutrient Use Efficiency and Changes in Soil Properties Influenced by Biochar under Alternate Wetting and Drying Irrigation. Sustainability 2022, 14, 7977. [Google Scholar] [CrossRef]
  30. Wu, J.; Ma, C.; Li, F. Microbial community structure and function in paddy soil as affected by water-saving irrigation mode. Eur. J. Soil Biol. 2022, 113, 103450. [Google Scholar] [CrossRef]
  31. Liu, Y.; Guo, Z.; Xue, C.; Gao, W.; Wang, G.; Liu, X. Changes in N2-fixation activity, abundance and composition of diazotrophic communities in a wheat field under elevated CO2 and canopy warming. Appl. Soil Ecol. 2021, 165, 104017. [Google Scholar] [CrossRef]
  32. Zhang, Y.; Li, D.; Wang, H.; Xiao, Q.; Liu, X. Molecular diversity of nitrogen-fixing bacteria from the Tibetan Plateau, China. FEMS Microbiol. Lett. 2006, 260, 134–142. [Google Scholar] [CrossRef] [PubMed]
  33. Geisseler, D.; Scow, K.M. Long-term effects of mineral fertilizers on soil microorganisms—A review. Soil Biol. Biochem. 2014, 75, 54–63. [Google Scholar] [CrossRef]
  34. Wang, J.; Li, Q.; Shen, C.; Yang, F.; Wang, J.; Ge, Y. Significant dose effects of fertilizers on soil diazotrophic diversity, community composition, and assembly processes in a long-term paddy field fertilization experiment. Land Degrad. Dev. 2020, 32, 420–429. [Google Scholar] [CrossRef]
  35. Liao, H.; Li, Y.; Yao, H. Fertilization with inorganic and organic nutrients changes diazotroph community composition and N-fixation rates. J. Soils Sediment 2018, 18, 1076–1086. [Google Scholar] [CrossRef]
  36. Masuda, Y.; Satoh, S.; Miyamoto, R.; Takano, R.; Ishii, K.; Ohba, H.; Shiratori, Y.; Senoo, K. Biological nitrogen fixation in the long-term nitrogen-fertilized and unfertilized paddy fields, with special reference to diazotrophic iron-reducing bacteria. Arch. Microbiol. 2023, 205, 291. [Google Scholar] [CrossRef] [PubMed]
  37. Tang, Y.F.; Zhang, M.M.; Chen, A.L.; Zhang, W.Z.; Wei, W.X.; Sheng, R. Impact of fertilization regimes on diazotroph community compositions and N-fixation activity in paddy soil. Agric. Ecosyst. Environ. 2017, 247, 1–8. [Google Scholar] [CrossRef]
  38. Abhishek, K.; Shrivastava, A.; Vimal, V.; Gupta, A.K.; Bhujbal, S.K.; Biswas, J.K.; Singh, L.; Ghosh, P.; Pandey, A.; Sharma, P.; et al. Biochar application for greenhouse gas mitigation, contaminants immobilization and soil fertility enhancement: A state-of-the-art review. Sci. Total Environ. 2022, 853, 158562. [Google Scholar] [CrossRef]
  39. Harter, J.; Krause, H.M.; Schuettler, S.; Ruser, R.; Fromme, M.; Scholten, T.; Kappler, A.; Behrens, S. Linking N2O emissions from biochar-amended soil to the structure and function of the N-cycling microbial community. ISME J. 2014, 8, 660–674. [Google Scholar] [CrossRef]
  40. Liu, X.; Liu, C.; Gao, W.; Xue, C.; Guo, Z.; Jiang, L.; Li, F.; Liu, Y. Impact of biochar amendment on the abundance and structure of diazotrophic community in an alkaline soil. Sci. Total Environ. 2019, 688, 944–951. [Google Scholar] [CrossRef]
  41. Jiang, Y.; Liu, J.; Li, Y.; Xiao, P.; Liu, S.; Shao, J.; Cai, Y.; Yan, X.; Fan, L. Biochar amendment reduces biological nitrogen fixation and nitrogen use efficiency in cadmium-contaminated paddy fields. J. Environ. Manag. 2023, 344, 118338. [Google Scholar] [CrossRef]
  42. Zhao, Z.; Zhang, Y.; Sun, P.; Wang, Q.; Ruan, Y. Effects of biochar and chemical fertilizer amendment on diazotrophic abundance and community structure in rhizosphere and bulk soils. Environ. Sci. Pollut. Res. Int. 2022, 29, 62361–62370. [Google Scholar] [CrossRef] [PubMed]
  43. Wang, C.; Li, Z.; Shen, J.; Li, Y.; Chen, D.; Bolan, N.; Li, Y.; Wu, J. Biochar amendment increases the abundance and alters the community composition of diazotrophs in a double rice cropping system. Biol. Fertil. Soils 2023, 59, 873–886. [Google Scholar] [CrossRef]
  44. Lv, R.; Wang, Y.; Wang, Q.; Wen, Y.; Shang, Q. Rice straw biochar alters inorganic nitrogen availability in paddy soil mainly through abiotic processes. J. Soils Sed. 2022, 23, 568–581. [Google Scholar] [CrossRef]
  45. Duan, P.; Zhang, X.; Zhang, Q.; Wu, Z.; Xiong, Z. Field-aged biochar stimulated N2O production from greenhouse vegetable production soils by nitrification and denitrification. Sci. Total Environ. 2018, 642, 1303–1310. [Google Scholar] [CrossRef] [PubMed]
  46. Ghorbani, M.; Neugschwandtner, R.W.; Konvalina, P.; Asadi, H.; Kopecký, M.; Amirahmadi, E. Comparative effects of biochar and compost applications on water holding capacity and crop yield of rice under evaporation stress: A two-years field study. Paddy Water Environ. 2023, 21, 47–58. [Google Scholar] [CrossRef]
  47. Chen, K.; Li, N.; Zhang, S.; Liu, N.; Yang, J.; Zhan, X.; Han, X. Biochar-induced changes in the soil diazotroph community abundance and structure in a peanut field trial. Biochar 2022, 4, 26. [Google Scholar] [CrossRef]
  48. Zhang, Y.H.; Hu, T.L.; Wang, H.; Jin, H.Y.; Liu, Q.; Lin, Z.B.; Liu, B.J.; Liu, H.T.; Chen, Z.; Lin, X.W.; et al. How do different nitrogen application levels and irrigation practices impact biological nitrogen fixation and its distribution in paddy system? Plant Soil 2021, 467, 329–344. [Google Scholar] [CrossRef]
  49. Bao, S.D. Soil and Agricultural Chemistry Analysis; Agriculture Press: Beijing, China, 2005. [Google Scholar]
  50. Loeppert, R.; Inskeep, W.; Sparks, D. Methods of Soil Analysis. Part 3. Chemical Methods; ACSESS: Mississauga, ON, Canada, 1996; Volume 677. [Google Scholar]
  51. Rosch, C.; Mergel, A.; Bothe, H. Biodiversity of denitrifying and dinitrogen-fixing bacteria in an acid forest soil. Appl. Environ. Microbiol. 2002, 68, 3818–3829. [Google Scholar] [CrossRef]
  52. Gihring, T.M.; Green, S.J.; Schadt, C.W. Massively parallel rRNA gene sequencing exacerbates the potential for biased community diversity comparisons due to variable library sizes. Environ. Microbiol. 2012, 14, 285–290. [Google Scholar] [CrossRef]
  53. Horel, A.; Bernard, R.J.; Mortazavi, B. Impact of crude oil exposure on nitrogen cycling in a previously impacted Juncus roemerianus salt marsh in the northern Gulf of Mexico. Environ. Sci. Pollut. Res. Int. 2014, 21, 6982–6993. [Google Scholar] [CrossRef]
  54. Zhang, J.; Zhou, X.; Chen, L.; Chen, Z.; Chu, J.; Li, Y. Comparison of the abundance and community structure of ammonia oxidizing prokaryotes in rice rhizosphere under three different irrigation cultivation modes. World J. Microbiol. Biotechnol. 2016, 32, 85. [Google Scholar] [CrossRef]
  55. Hu, J.; Wang, J.; Yang, S.; Qi, S.; Jiang, Z.; Dai, H.; Zhou, J. Soil nitrogen functional transformation microbial genes response to biochar application in different irrigation paddy field in southern China. Environ. Sci. Pollut. Res. Int. 2023, 30, 7770–7785. [Google Scholar] [CrossRef]
  56. Fan, H.; Jia, S.; Yu, M.; Chen, X.; Shen, A.; Su, Y. Long-term straw return increases biological nitrogen fixation by increasing soil organic carbon and decreasing available nitrogen in rice–rape rotation. Plant Soil 2022, 479, 267–279. [Google Scholar] [CrossRef]
  57. Tang, H.; Li, C.; Shi, L.; Xiao, X.; Cheng, K.; Wen, L.; Li, W. Effect of different long-term fertilizer managements on soil nitrogen fixing bacteria community in a double-cropping rice paddy field of southern China. PLoS ONE 2021, 16, e0256754. [Google Scholar] [CrossRef]
  58. Wang, Q.; Wang, J.; Li, Y.; Chen, D.; Ao, J.; Zhou, W.; Shen, D.; Li, Q.; Huang, Z.; Jiang, Y. Influence of nitrogen and phosphorus additions on N(2)-fixation activity, abundance, and composition of diazotrophic communities in a Chinese fir plantation. Sci. Total Environ. 2018, 619–620, 1530–1537. [Google Scholar] [CrossRef]
  59. Chakraborty, A.; Islam, E. Temporal dynamics of total and free-living nitrogen-fixing bacterial community abundance and structure in soil with and without history of arsenic contamination during a rice growing season. Environ. Sci. Pollut. Res. Int. 2017, 25, 4951–4962. [Google Scholar] [CrossRef] [PubMed]
  60. Ameloot, N.; Graber, E.R.; Verheijen, F.G.A.; De Neve, S. Interactions between biochar stability and soil organisms: Review and research needs. Eur. J. Soil Sci. 2013, 64, 379–390. [Google Scholar] [CrossRef]
  61. Paterson, E.; Osler, G.; Dawson, L.A.; Gebbing, T.; Sim, A.; Ord, B. Labile and recalcitrant plant fractions are utilised by distinct microbial communities in soil: Independent of the presence of roots and mycorrhizal fungi. Soil Biol. Biochem. 2008, 40, 1103–1113. [Google Scholar] [CrossRef]
  62. Orr, C.H.; Leifert, C.; Cummings, S.P.; Cooper, J.M. Impacts of organic and conventional crop management on diversity and activity of free-living nitrogen fixing bacteria and total bacteria are subsidiary to temporal effects. PLoS ONE 2012, 7, e52891. [Google Scholar] [CrossRef]
  63. Xia, H.; Riaz, M.; Ming, C.; Li, Y.; Wang, X.; Jiang, C. Assessing the difference of biochar and aged biochar to improve soil fertility and cabbage (Brassica oleracea var. capitata) productivity. J. Soils Sediment 2022, 23, 606–618. [Google Scholar] [CrossRef]
  64. Yang, L.; Bai, J.; Zeng, N.; Zhou, X.; Liao, Y.; Lu, Y.; Rees, R.M.; Nie, J.; Cao, W. Diazotroph abundance and community structure are reshaped by straw return and mineral fertilizer in rice-rice-green manure rotation. Appl. Soil Ecol. 2019, 136, 11–20. [Google Scholar] [CrossRef]
  65. Wang, C.; Zheng, M.; Song, W.; Wen, S.; Wang, B.; Zhu, C.; Shen, R. Impact of 25 years of inorganic fertilization on diazotrophic abundance and community structure in an acidic soil in southern China. Soil Biol. Biochem. 2017, 113, 240–249. [Google Scholar] [CrossRef]
  66. Li, D.; Liu, J.; Zhang, R.; Chen, M.; Yang, W.; Li, J.; Fang, Z.; Wang, B.; Qiu, Y.; Zheng, M. N2 fixation impacted by carbon fixation via dissolved organic carbon in the changing Daya Bay, South China Sea. Sci. Total Environ. 2019, 674, 592–602. [Google Scholar] [CrossRef] [PubMed]
  67. Qiu, H.; Liu, J.; Boorboori, M.R.; Li, D.; Chen, S.; Ma, X.; Cheng, P.; Zhang, H. Effect of biochar application rate on changes in soil labile organic carbon fractions and the association between bacterial community assembly and carbon metabolism with time. Sci. Total Environ. 2023, 855, 158876. [Google Scholar] [CrossRef]
  68. Lagomarsino, A.; Agnelli, A.E.; Pastorelli, R.; Pallara, G.; Rasse, D.P.; Silvennoinen, H. Past water management affected GHG production and microbial community pattern in Italian rice paddy soils. Soil Biol. Biochem. 2016, 93, 17–27. [Google Scholar] [CrossRef]
  69. Roesch, L.F.W.; Olivares, F.L.; Pereira Passaglia, L.M.; Selbach, P.A.; de Sá, E.L.S.; de Camargo, F.A.O. Characterization of diazotrophic bacteria associated with maize: Effect of plant genotype, ontogeny and nitrogen-supply. World J. Microbiol. Biotechnol. 2006, 22, 967–974. [Google Scholar] [CrossRef]
  70. Röling, W.F.M. The Family Geobacteraceae. In The Prokaryotes: Deltaproteobacteria and Epsilonproteobacteria; Rosenberg, E., DeLong, E.F., Lory, S., Stackebrandt, E., Thompson, F., Eds.; Springer: Berlin/Heidelberg, Germany, 2014; pp. 157–172. [Google Scholar]
  71. Chen, S.; Xiang, X.; Ma, H.; Penttinen, P.; Zhao, J.; Li, H.; Gao, R.; Zheng, T.; Fan, G. Straw Mulching and Nitrogen Fertilization Affect Diazotroph Communities in Wheat Rhizosphere. Front. Microbiol. 2021, 12, 658668. [Google Scholar] [CrossRef] [PubMed]
  72. Lin, Y.; Ye, G.; Liu, D.; Ledgard, S.; Luo, J.; Fan, J.; Yuan, J.; Chen, Z.; Ding, W. Long-term application of lime or pig manure rather than plant residues suppressed diazotroph abundance and diversity and altered community structure in an acidic Ultisol. Soil Biol. Biochem. 2018, 123, 218–228. [Google Scholar] [CrossRef]
  73. Wang, Y.; Li, H.; Li, J.; Li, X. The diversity and co-occurrence patterns of diazotrophs in the steppes of Inner Mongolia. Catena 2017, 157, 130–138. [Google Scholar] [CrossRef]
  74. Roy, M.L.; Srivastava, R.C. Changes in Diazotrophic Population in Paddy Soil on N-Fertilisation Alone or in Integration with Certain Growth Promoting Rhizobacteria. Vegetos 2013, 26, 357–361. [Google Scholar] [CrossRef]
  75. Feng, M.; Du, Y.; Li, X.; Li, F.; Qiao, J.; Chen, G.; Huang, Y. Insight into universality and characteristics of nitrate reduction coupled with arsenic oxidation in different paddy soils. Sci. Total Environ. 2023, 866, 161342. [Google Scholar] [CrossRef] [PubMed]
  76. Cassan, F.; Coniglio, A.; Lopez, G.; Molina, R.; Nievas, S.; de Carlan, C.L.N.; Donadio, F.; Torres, D.; Rosas, S.; Pedrosa, F.O.; et al. Everything you must know about Azospirillum and its impact on agriculture and beyond. Biol. Fertil. Soils 2020, 56, 461–479. [Google Scholar] [CrossRef]
  77. Wang, Y.; Li, J.; Xu, Y.; Rodgers, T.F.M.; Bao, M.; Tan, F. Uptake, translocation, bioaccumulation, and bioavailability of organophosphate esters in rice paddy and maize fields. J. Hazard. Mater. 2023, 446, 130640. [Google Scholar] [CrossRef]
  78. Bao, Z.; Sasaki, K.; Okubo, T.; Ikeda, S.; Anda, M.; Hanzawa, E.; Kakizaki, K.; Sato, T.; Mitsui, H.; Minamisawa, K. Impact of Azospirillum sp. B510 Inoculation on Rice-Associated Bacterial Communities in a Paddy Field. Microbes Environ. 2013, 28, 487–490. [Google Scholar] [CrossRef]
  79. Ishii, S.; Ohno, H.; Tsuboi, M.; Otsuka, S.; Senoo, K. Identification and isolation of active N2O reducers in rice paddy soil. ISME J. 2011, 5, 1936–1945. [Google Scholar] [CrossRef] [PubMed]
Figure 1. nifH gene abundance in soil after planting in different rice seasons. Capital letters indicate the difference between different treatments in the same rice season (p < 0.05), and lowercase letters indicate the difference between different rice seasons in the same treatment (p < 0.05) CK: no N fertilizer + conventional water management; CON: conventional fertilization + conventional water management; FCK: no N fertilizer + flooding; FCON: conventional fertilization + flooding; B: application of 40 t ha−1 biochar + conventional fertilization + conventional water management.
Agriculture 14 00211 g001
Figure 2. Correlation analysis of nifH gene abundance with pH, SOC, available N, available P, and available K. * Significant correlation (p < 0.05).
Agriculture 14 00211 g002
Figure 3. Horizontal abundance of each treatment genus after the end of different rice seasons. (ad) represent early rice season in 2019, late rice season in 2019, early rice season in 2020, and late rice season in 2020, respectively. CK: no N fertilizer + conventional water management; CON: conventional fertilization + conventional water management; FCK: no N fertilizer + flooding; FCON: conventional fertilization + flooding; B: application of 40 t ha−1 biochar + conventional fertilization + conventional water management.
Agriculture 14 00211 g003
Figure 4. RDA analysis of population composition of diazotrophic microorganisms and soil properties factors. (a,b) represent biochar and flooded RDA analysis, respectively.
Agriculture 14 00211 g004
Table 1. Field fertilization management and dosage.
SeasonField Management20192020Nitrogenous Fertilizer/Urea: N 46%Phosphate Fertilizer/Superphosphate: P2O5 16%Potassium Fertilizer
/Potassium Chloride: K2O 60%
Early rice seasonSeedling transplanting, Base fertilizer20 April 20191 May 202060 kg·ha−190 kg·ha−190 kg·ha−1
Tillering fertilizer13 May 20198 May 202036 kg·ha−1
Ear fertilizer13 June 201914 June 202024 kg·ha−1
harvest20 July 20195 August 2020
Late rice seasonSeedling transplanting, Base fertilizer30 July 201914 August 2020 90 kg·ha−1120 kg·ha−1
Tillering fertilizer12 August 201922 August 202090 kg·ha−1
Ear fertilizer9 September 201921 September 202060 kg·ha−1
harvest5 November 20198 November 2020
Only phosphorus and potassium fertilizer should be applied in the blank, and all of them should be applied at one time to spread into the field.
Table 2. Soil properties after rice planting.
SeasonTreatmentspHSOC/g·kg−1Available N/mg·kg−1Available P/mg·kg−1Available K/mg·kg−1
Z19CK5.5 ± 0.19 b 16.3 ± 0.40 b216.8 ± 14.31 a101.1 ± 17.05 ab29.8 ± 2.39 b
CON5.4 ± 0.09 b15.4 ± 0.40 b199.8 ± 25.71 a120.4 ± 12.40 a20.5 ± 1.64 c
FCK5.3 ± 0.06 b15.6 ± 0.34 b186.8 ± 4.09 a89.7 ± 5.30 b35.0 ± 5.85 ab
FCON5.2 ± 0.13 b15.8 ± 0.11 b217.0 ± 4.86 a94.3 ± 2.50 b37.1 ± 4.10 ab
B6.2 ± 0.48 a19.0 ± 0.90 a128.5 ± 8.52 b111.8 ± 8.53 ab40.4 ± 4.99 a
W19CK5.7 ± 0.09 b17.6 ± 0.20 ab189.5 ± 27.42 ab113.9 ± 5.49 a30.2 ± 8.92 b
CON5.5 ± 0.01 ab17.6 ± 1.0 ab113.5 ± 6.19 d121.7 ± 18.10 a26.8 ± 1.12 b
FCK5.4 ± 0.16 b15.4 ± 1.15 b217.3 ± 16.98 a64.9 ± 1.27 b51.2 ± 6.42 a
FCON5.3 ± 0.10 b15.3 ± 0.24 b136.5 ± 2.35 dc81.9 ± 4.96 b27.5 ± 0.49 b
B6.5 ± 0.44 a19.2 ± 2.10 a165.2 ± 16.74 bc82.6 ± 11.42 b35.6 ± 6.47 b
Z20CK5.8 ± 0.04 b19.9 ± 0.30 a81.4 ± 12.12 c56.2 ± 3.21 a148.6 ± 12.02 a
CON5.6 ± 0.07 bc16.8 ± 0.70 b114.1 ± 6.64 b48.3 ± 2.71 a99.0 ± 12.61 b
FCK5.7 ± 0.23 bc16.3 ± 1.14 b92.6 ± 1.79 c52.0 ± 8.88 a31.6 ± 1.99 c
FCON5.5 ± 0.16 c16.5 ± 1.18 b84.9 ± 2.43 c54.3 ± 1.90 a25.6 ± 1.40 c
B6.2 ± 0.18 a20.4 ± 1.10 a141.8 ± 8.12 a50.4 ± 8.36 a153.5 ± 21.84 a
W20CK5.6 ± 0.09 b18.3 ± 0.80 b83.7 ± 3.56 b105.0 ± 14.66 a29.8 ± 2.39 b
CON5.3 ± 0.05 b18.3 ± 0.70 b73.7 ± 1.78 c115.9 ± 11.96 a20.5 ± 1.64 d
FCK5.6 ± 0.24 b18.0 ± 0.36 b93.8 ± 2.92 a32.3 ± 4.46 b39.4 ± 2.49 a
FCON5.7 ± 0.10 ab18.3 ± 0.85 b82.5 ± 5.99 b37.5 ± 15.76 b36.0 ± 4.39 b
B5.9 ± 0.11 a19.5 ± 0.40 a82.3 ± 10.82 c111.2 ± 3.18 a24.7 ± 2.37 c
Different letters indicate significant difference between different treatments in the same rice season (n = 3; p < 0.05). The numbers after ± symbol are standard errors. Z19, W19, Z20, W20, respectively, denote the early rice season of 2019, the late rice season of 2019, the early rice season of 2020, and the late rice season of 2020. CK: no N fertilizer + conventional water management; CON: conventional fertilization + conventional water management; FCK: no N fertilizer + flooding; FCON: conventional fertilization + flooding; B: application of 40 t ha−1 biochar + conventional fertilization + conventional water management.
Table 3. Mean pH, SOC, available N, available P, available K, and nifH gene abundance under different water management treatments over a two-year experiment period.
TreatmentspHSOC/g·kg−1Available N/mg·kg−1Available P/mg·kg−1Available K/mg·kg−1lg (nifH Gene Abundance/Dry Soil)
CK5.6 ± 0.18 a 18.0 ± 1.39 a142.8 ± 63.33 a94.0 ± 25.22 a59.6 ± 51.96 a7.8 ± 0.34 b
CON5.5 ± 0.12 b17.0 ± 1.34 b125.3 ± 48.00 b101.6 ± 33.29 a41.7 ± 33.77 b7.7 ± 0.33 b
FCK5.5 ± 0.25 b16.3 ± 1.20 b146.6 ± 57.27 a59.7 ± 21.58 b39.3 ± 8.73 b8.0 ± 0.48 a
FCON5.4 ± 0.21 b16.5 ± 1.36 b130.2 ± 54.71 b67.0 ± 23.88 b31.5 ± 5.92 c7.9 ± 0.42 a
N**********
S************
Wns**ns******
N × Sns****ns**ns
N × Wns*nsns*ns
S × W*********
N × S × Wnsns**ns**ns
Different characters in the same column indicate significance at the 0.05 level between different treatments (n = 12) based on the one-way ANOVA. The numbers after ± symbol are standard errors. The results of three-way analysis of variance on the effect of N fertilizer (N), season (S), water management (W), and their interactions (N × S; N × W; S × W; and N × S × W) on pH, SOC, available N, available P, available K, and nifH gene abundance. ** significant at p < 0.01; * significant at p < 0.05; ns no significant. CK: no N fertilizer + conventional water management; CON: conventional fertilization + conventional water management; FCK: no N fertilizer + flooding; FCON: conventional fertilization + flooding.
Table 4. Mean pH, SOC, available N, available P, available K, and nifH gene abundance under different fertilizer treatments over a two-year experiment period.
TreatmentspHSOC/g·kg−1Available N/mg·kg−1Available P/mg·kg−1Available K/mg·kg−1lg (nifH Gene Abundance/Dry Soil)
CK5.6 ± 0.18 b 18.0 ± 1.39 b142.8 ± 63.33 a94.0 ± 25.22 ab59.6 ± 51.96 a7.8 ± 0.34 b
CON5.5 ± 0.12 b17.0 ± 1.34 c125.3 ± 48.00 ab101.6 ± 33.29 a41.7 ± 33.77 b7.7 ± 0.33 b
B6.2 ± 0.39 a19.5 ± 1.38 a129.4 ± 32.38 b89.0 ± 26.60 b63.6 ± 53.52 a7.9 ± 0.31 a
Sns**********
F****nsns****
S × Fnsns**ns**ns
Different characters in the same column indicate significance at the 0.05 level between different treatments (n = 12) based on the one-way ANOVA. The numbers after ± symbol are standard errors. The results of two-way analysis of variance on the effect of fertilizer (F), season (S), and their interactions (S × F) on pH, SOC, available N, available P, available K, and nifH gene abundance. ** significant at p < 0.01; ns no significant. CK: no N fertilizer + conventional water management; CON: conventional fertilization + conventional water management; B: application of 40 t ha−1 biochar + conventional fertilization + conventional water management.
Table 5. α diversity of soil microorganisms in different treatments after the end of different rice seasons.
SeasonTreatmentsACE Chao1 Shannon Simpson
Z19CK694.3 ± 9.12 bc 701.9 ± 6.28 c0.89 ± 0.01 ab5.4 ± 0.10 b
CON674.4 ± 4.82 c670.2 ± 5.83 d0.88 ± 0.01 b5.1 ± 0.02 c
FCK711.7 ± 0.06 b725.3 ± 1.50 b0.91 ± 0.01 a5.9 ± 0.03 a
FCON752.9 ± 10.08 a754.3 ± 9.59 a0.91 ± 0.01 a5.8 ± 0.15 a
B675.7 ± 18.68 c684.3 ± 18.32 cd0.81 ± 0.01 c4.4 ± 0.12 d
W19CK757.8 ± 17.1 a770.2 ± 16.81 a0.89 ± 0.01 bc5.1 ± 0.25 b
CON697.6 ± 14.58 c730.8 ± 29.20 a0.89 ± 0.01 bc5.6 ± 0.21 ab
FCK727.8 ± 7.15 b762.7 ± 19.69 a0.92 ± 0.01 a6.0 ± 0.11 a
FCON700.3 ± 1.52 c664.9 ± 5.29 b0.92 ± 0.02 ab5.8 ± 0.09 ab
B773.9 ± 10.58 a766.2 ± 2.02 a0.87 ± 0.00 c5.5 ± 0.19 ab
Z20CK803.2 ± 14.13 a822.1 ± 9.35 b0.84 ± 0.01 b5.4 ± 0.03 ab
CON686.5 ± 7.41 d727.8 ± 15.85 d0.86 ± 0.02 b5.2 ± 0.08 b
FCK832.5 ± 23.59 a864.7 ± 16.97 a0.84 ± 0.02 b5.4 ± 0.34 ab
FCON718.5 ± 12.48 c734.1 ± 0.95 d0.90 ± 0.01 a5.7 ± 0.04 a
B766.8 ± 0.99 b786.2 ± 11.00 c0.88 ± 0.01 ab5.7 ± 0.04 a
W20CK778.3 ± 21.4 bc794.5 ± 29.40 bc0.84 ± 0.01 a5.2 ± 0.07 b
CON746.0 ± 18.54 d753.5 ± 11.63 c0.85 ± 0.03 a4.8 ± 0.03 c
FCK856.9 ± 7.16 a862.0 ± 0.23 a0.88 ± 0.01 a5.6 ± 0.02 a
FCON817.9 ± 47.01 ab832.8 ± 43.07 ab0.87 ± 0.01 a5.7 ± 0.16 a
B787.2 ± 3.65 bc808.7 ± 4.76 abc0.84 ± 0.01 a5.2 ± 0.05 b
Different letters indicate significant difference between different treatments in the same rice season (n = 3; p < 0.05). The numbers after ± symbol are standard errors. Z19, W19, Z20, W20, respectively, denote the early rice season of 2019, the late rice season of 2019, the early rice season of 2020, and the late rice season of 2020. CK: no N fertilizer + conventional water management; CON: conventional fertilization + conventional water management; FCK: no N fertilizer + flooding; FCON: conventional fertilization + flooding; B: application of 40 t ha−1 biochar + conventional fertilization + conventional water management.
Disclaimer/Publisher’s Note: The statements, opinions and data contained in all publications are solely those of the individual author(s) and contributor(s) and not of MDPI and/or the editor(s). MDPI and/or the editor(s) disclaim responsibility for any injury to people or property resulting from any ideas, methods, instructions or products referred to in the content.

