Article

Plant Growth-Promoting Bacteria Enhance Survival, Growth, and Nutritional Content of Sugarcane Propagated through Pre-Sprouted Seedlings under Water Deficit

by
Laura Costa Oliveira Almeida
1,
Hariane Luiz Santos
1,
Carlos Henrique de Castro Nogueira
1,
Melina Rodrigues Alves Carnietto
1,
Gustavo Ferreira da Silva
1,
Carmen Sílvia Fernandes Boaro
2 and
Marcelo de Almeida Silva
1,*
1
Laboratory of Ecophysiology Applied to Agriculture (LECA), School of Agricultural Sciences, UNESP—São Paulo State University, Botucatu 18610-034, SP, Brazil
2
Biodiversity and Biostatistics Department, Institute of Biosciences, UNESP—São Paulo State University, Botucatu 18610-034, SP, Brazil
*
Author to whom correspondence should be addressed.
Agriculture 2024, 14(2), 189; https://doi.org/10.3390/agriculture14020189
Submission received: 31 December 2023 / Revised: 17 January 2024 / Accepted: 24 January 2024 / Published: 26 January 2024
(This article belongs to the Section Crop Production)

Abstract

:
Sugarcane plays a crucial role in global sugar and ethanol production. Conventionally, sugarcane propagation involves planting billets. However, Brazilian researchers have introduced the innovative pre-sprouted seedlings (PSS) method, widely used in the MEIOSI (Simultaneously Occurring Interrotational Method) system. Although PSS has several advantages over the conventional method, its sensitivity to water scarcity is a challenge. This study aimed to evaluate the survival and growth of PSS inoculated with Bacillus licheniformis and Bacillus subtilis (PGPB) under different water regimes. The experiment was conducted in the field in a randomized block in strips (split-block) using a 2 × 4 factorial scheme consisting of two inoculation conditions (with and without PGPB) and four water regimes (WR) (0%, 33%, 66%, and 100% of the ideal irrigation). PGPB increased PSS survival (4.17%) and water use efficiency (185.10% under the 0% WR). In addition, inoculation increased root (12.5%, 7.7%, and 16.2% for surface area, area projection, and root volume, respectively) and shoot growth. PGPB also increased nutrient uptake, such as N (60.8% and 18.3% under 0% and 66% WR), P (on average 11.7%), Mn (27.6% and 28.7% under 66% and 100% WR), Zn (111.4% under 0% WR), and Cu accumulation (27.17%), which provided a higher number of stalks per meter and, therefore, a higher multiplication rate in the MEIOSI system. Inoculation proved to be a promising alternative for PSS establishing under water restriction.

1. Introduction

Sugarcane is a vital bioenergy crop due to its rapid growth and high energy balance, representing a relevant alternative in the production of biofuels [1,2,3]. The high concentration of sucrose in its stalks mostly meets the demands of the sugar-energy sector [4], which favors replacing fossil fuels and minimizing the anthropogenic impact on the planet. In this scenario, Brazil ranks first in global sugarcane production, with production estimated at 677.6 million tons in the 2023/24 harvest, representing an increase of 10.9% compared to the 2022/23 harvest, which makes it a country with great potential for exporting biofuels [5]. Favorable soil and climate conditions and the use of technologies have made it possible to increase the efficiency of inputs, reduce production costs, and increase the productivity of land and human resources [6,7].
Since the dawn of sugarcane cultivation, sugarcane fields have been established by planting billets containing buds that provide for the sprouting of new plants [4,8]. In this method, a high density of billets is necessary to ensure adequate sprouting, contributing to the reduction in stalks used for sugar and ethanol production [9]. Brazilian researchers have developed a method for planting pre-sprouted seedlings (PSS) to reduce the material used. This method consists of individualizing the buds in trays so that the sprouts emerge before planting, which reduces the number of stalks used per area in this operation by 90% [9,10,11]. The use of PSS as a propagation material has stood out due to the efficiency promoted through varietal guarantee and high health [10,12,13,14], especially in association with the MEIOSI (Simultaneously Occurring Interrotational Method) system, due to the smaller production scale and operational advantage [15,16].
However, PSS have reduced nutrient and water reserves compared to the conventional method and, consequently, are more susceptible to abiotic stresses, especially water restriction [17]. Therefore, water supplementation is recommended after transplanting PSS from plant seedling nurseries to the field since there is high plant mortality in planting seasons with low rainfall [10,17,18].
Furthermore, as the sugarcane cycle can vary from 12 to 18 months, this crop is susceptible to climatic adversities throughout the year. Scarce water supply is the main limiting factor to sugarcane’s good growth and development [4,19], with the beginning of development being the most sensitive period to water restriction [20,21]. Therefore, technologies that mitigate water restrictions are required to form new sugarcane fields that meet the demand for sugar, biofuels, and by-products even under limited resource availability [22]. The current climate change scenario, characterized by increased temperature and reduced precipitation and aggravated by the burning of fossil fuels, supports these new technologies [1,23,24,25].
An alternative that has shown positive results is using plant growth-promoting bacteria (PGPB). Among the known species, the most abundant belong to the genus Bacillus [26,27,28]. Many of these bacteria can produce phytohormones, antioxidant enzymes, and siderophores, in addition to promoting the availability of nutrients through nitrogen fixation and solubilization of phosphate, potassium, and micronutrients [29,30,31,32,33,34], inducing tolerance to environmental stresses, such as water deficiency [34,35,36].
In this sense, increases in sprouting speed and root and shoot dry matter accumulation of sugarcane PSS have already been observed under the association of PGPB and nitrogen doses [37]. Furthermore, the increase in nutrient concentration in the shoot, the increase in photosynthetic efficiency and water use, as well as the stimulation of root system growth after inoculation with Bacillus subtilis under water deficit conditions have already been reported in sugarcane [36,38]. Tolerance to water deficiency induced by Bacillus licheniformis has also been reported in maize [39] and potato [40], mainly due to increased water use efficiency, CO2 assimilation, and greater production of antioxidant enzymes.
The association of two Bacillus species is a promising approach to improving plant growth, given the particularities present in each species and the increased spectrum of action and specificity [41,42]. However, there are still no studies involving the association of B. licheniformis and B. subtilis in sugarcane propagated by PSS in the field; both are known and reported to be effective in promoting tolerance to water deficits.
Considering the importance of seeking plant tolerance to water stress, the advance in the use of PSS in the formation of new sugarcane fields, the biological mechanisms of action of these microorganisms, and the potential of the association of two species of the Bacillus genus, this research hypothesizes that the inoculation of PSS during its formation in the plant seedling nursery with Bacillus licheniformis and Bacillus subtilis will increase the survival rates and growth of seedlings after transplanting in the field, as well as improving the nutritional status, resulting in higher multiplication rates for MEIOSI under water restriction.
Therefore, this study aimed to evaluate the survival, growth, nutrient content, and yield of sugarcane plants from a PSS nursery treated with B. licheniformis strain FMCH001 (DSM32154) and B. subtilis strain FMCH002 (DSM32155) under different water regimes.

2. Materials and Methods

2.1. Description of the Experimental Area

The experiment was conducted in the field during 2021–2022 in Lençóis Paulista County, São Paulo, Brazil (22°78′44″ S, 48°79′90″ W, and 687 asl). The region’s climate is considered tropical in altitude (CWa) according to the Köppen climate classification, characterized by temperatures ranging from 4 °C (from June to August) to 38 °C (from November to February) [43].
The soil of the experimental area is classified as Allic Red Latosol [44]. Granulometric analyses of the soil, proposed by Donagemma et al. [44], showed 73.9% sand, 19.5% clay, and 6.6% silt, characterized by a medium-textured soil, according to the texture class grouping triangle [45], with the production environment classified as E2 [46,47].
A soil chemical analysis was performed at 0–20 cm and 20–40 cm depths before the experiment was set up (Table 1), according to the methodology proposed by van Raij et al. [48]. The experiment area was prepared with plowing, subsoiling, and leveling harrowing. In total, 1000 kg ha–1 of dolomitic limestone was applied two months before the experiment installation, according to Vitti et al. [49].
The fertilization was performed with 30 kg ha–1 of N, 60 kg ha–1 of P2O5, and 40 kg ha–1 of K2O, corresponding to 150 kg ha–1 of the 08-40-08 fertilizer formulated, 26 kg ha–1 of urea, and 48 kg ha–1 of potassium chloride [49]. The cover fertilization was performed 60 days after transplanting (DAT) with 60 kg ha–1 of N, corresponding to 130 kg ha–1 of urea [50].

2.2. Plant Material, Experimental Design, and Treatments

The IACSP01-5503 cultivar was used because it is considered rustic, adapted to the production environment, and has industrial gains of around 15% compared to the variety most cultivated in the mid-south of Brazil (RB867515) [51]. The propagation method was the PSS, which was produced by planting buds extracted from the stalks in trays containing 54 cells. The seedlings were 45 days old and transplanted to the experimental area after seven days of hardening.
The transplanting took place on 4 August 2021, through a manual planter, with a spacing of 0.6 m between plants. The seedlings had four fully developed leaves with cut ends, maintaining a standard of 30 cm length per leaf. This practice aims to reduce water vapor loss by transpiration [9]. Each plot was composed of two lines of 12.5 m and a spacing of 0.60 m from each other, based on the principles of the MEIOSI [15].
The experimental design used was a randomized block in strips (split-block) using a 2 × 4 factorial scheme consisting of two inoculation conditions (with and without PGPB) and four water regimes (0%, 33%, 66%, and 100% of the ideal irrigation depth for establishment and initial development) until 57 DAT, with four replicates. After this period, all plants received only water from precipitation. The four water regimes enabled the determination of regression curve plots and the ideal water regime under PGPB inoculation.
The PGPB used was a commercial product with a water-soluble powder formulation composed of B. licheniformis strain FMCH001 (DSM32154) (minimum of 1.0 × 10¹¹ colony forming units—CFU g–1) and B. subtilis strain FMCH002 (DSM32155) (minimum of 1.0 × 10¹¹ CFU g–1). The inoculation occurred in the plant seedling nursery through a watering can containing the bacteria solution at 0.324 g of the commercial product in 1.35 L of spray volume per tray. The spray volume was defined based on the saturation point of the trays’ alveoli, which corresponded to 25 mL. At the same time, the product dose was stipulated based on the dose recommended in the leaflet (200 g ha−1) and the planting spacing, which allowed us to delimit the area of each plant in the field.
The irrigation rate was defined according to the estimated evapotranspiration of the sugarcane crop in the early stage, based on Equation (1).
G I R = i = 1 n E T c i E f f i c i e n c y
where GIR: gross irrigation rate; n: watering shift; ETci: EToi × Kc; EToi: evapotranspiration obtained from database; Kc: early-stage crop conversion factor.

2.3. Meteriological Conditions and Crop Management

During the experimental period, evapotranspiration data (EToi) were collected from the São Manuel Experimental Farm Meteorological Station—UNESP. After determining the required gross rate, the proportions of each treatment were calculated (0, 33, 66, and 100%). The water supply occurred until 30 September 2021 (57 DAT), coinciding with the beginning of frequent rainfall (Figure 1).
The average air temperature during the experiment was 22.3 °C, and the total rainfall volume reached 1059 mm (Figure 1).
Weed management occurred periodically manually. Considering pest and disease management, there was no incidence of any pathogen at the control level that would require the application of pesticides.

2.4. Evaluations

2.4.1. Plant Survival

Plant survival (PS) was assessed 30 DAT. The ratio between the number of plants per plot and the number of seedlings transplanted in each plot (32 plants) enabled us to calculate the percentage of surviving plants. Any plant with at least one erect green leaf was considered a survivor (Equation (2)):
P S % = S N I × 100
where S is the number of surviving plants, and NI is the initial number of plants.

2.4.2. Water Use Efficiency

Water use efficiency (WUE) was determined at the end of the water regime imposition (63 DAT), according to Equation (3):
W U E ( g m 3 ) = D B L
where DB is the total dry biomass at 63 DAT (g), and L is the amount of water applied via irrigation plus precipitation until 63 DAT (m3).

2.4.3. Morphological Variables

The evaluations of the number of tillers (NT), stalk height (SH), stalk diameter (SD), and shoot dry biomass (SDB) were performed in five random plants per plot at 63 DAT (seven days after the end of the water regimes).
The NT was determined by counting the tillers in each plot. SH was determined using a tape measure, and the measurement was taken from the ground to the +1 leaf sheath insertion. The SD was determined using a digital caliper (MeterMall, 150 mm, and 0.1 mm reading, Marysville, OH, USA), and the measurements were performed in the lower third of the stalk. Additionally, for SDB, one plant per plot was chosen based on other biometric variables, and the sampled plants were dried in an air-forced circulation oven at 65 °C until a constant mass was reached. They were then weighed on a balance (Balmak, ELC–6/15/30, Santa Barbara d’Oeste, SP, Brazil).

2.4.4. Growth Analysis

Evaluations for growth analysis took place from 27 to 231 DAT, with collections every 21 days until the unfolding time.
For this purpose, leaf area (LA) and dry matter mass (DMM) were assessed [52]. Leaf area was estimated according to Equation (4) [53], using +3 leaf width and length measurements.
L A = L × W × 0.75 × ( N + 2 )
where L is the +3 leaf length, characterized as the third leaf with the ligule fully open, W is its width, 0.75 is the crop correction factor, and N is the number of green leaves.
To determine the leaf dry matter mass (LDMM) and the shoot dry matter mass (SDMM), the plants were separated into leaves + sheaths and stalks. The samples were kept in a forced air circulation oven at 65 °C until they reached a constant mass and then weighed on a 0.01 g precision scale (Balmak, ELC-6/15/30, Santa Bárbara d’Oeste, SP, Brazil), with the results expressed in grams per plant.
The LDMM, SDMM, and LA data were used to determine the crop growth rate (CGR, g day–1, Equation (5)), relative growth rate (RGR, g g–1 day–1, Equation (6)), net assimilation rate (NAR, g dm–2 day–1, Equation (7)), leaf area ratio (LAR, dm2 g–1, Equation (8)), specific leaf area (SLA, dm2 g–1, Equation (9)), and specific leaf weight (SLW, dm2 g–1, Equation (10)), considering the number of days (ND). The dry matter mass and leaf area data were adjusted using the Anacres program (EMBRAPA, Goiânia, GO, Brazil) (Table S1) [54].
C G R = D M M 2 D M M 1 N D
R G R = ln D M M 2 ln D M M 1 N D
N A R = D M M 2 D M M 1 N D × ln L A 2 ln L A 1 N D
L A R = L A S D M M
S L A = L A L D M M
S L W = 1 S L A

2.4.5. Nutritional Assessments

At 63 DAT, +1 leaf (top visible dewlap—TVD) was collected, their midribs were discarded, and the middle third was used for evaluation [55]. The collection period corresponds to the period without precipitation, allowing for the differentiation of the water regimes since, after this, the rainfall regime homogenized the irrigation of the sugarcane field.
The sampled material was washed and kept in an air-forced circulation oven at 65 °C until a constant weight was reached, followed by crushing in a Willey mill. The concentrations of nitrogen (N), phosphorus (P), potassium (K), calcium (Ca), magnesium (Mg), sulfur (S), boron (B), copper (Cu), iron (Fe), manganese (Mn), and zinc (Zn) were determined according to AOAC [56].
Leaf N was extracted by sulfuric digestion and determined by the Kjeldahl method. At the same time, the extraction of K, Ca, Mg, S, P, Fe, Zn, Mn, B, and Cu occurred by nitroperchloric digestion [56]. Potassium, Ca, Mg, Fe, Zn, Mn, and Cu were determined by atomic absorption spectrophotometry (AAS), and S, P, and B were determined by the colorimetric method.
Nutrient accumulation was calculated using Equation (11):
N A = L B × N C
where NA is the nutrient accumulation (g or mg plant−1), LB is the leaf biomass (g), and NC is the nutrient concentration (g or mg kg−1).

2.4.6. Morphological Variables of the Root System

At 243 DAT, the roots were collected using a sampling probe made of stainless steel, measuring 120 × 5.08 cm (length × internal diameter), comprising approximately 405 cm3 of collection volume at each 20 cm depth. The probes were made in duplicate parallel to the planting lines, in the projection of the crop line and on its sides at 20 cm from the plants, at depths of 0–20, 20–40, 40–60, and 60–80 cm.
The samples were sieved through a 2 mm mesh, the soil was removed, and the roots were isolated by washing them in running water. The roots were stored in 50% ethanol solution vials to avoid dehydration. The roots were placed in a 15 × 25 cm (width × length) acrylic tub containing water to analyze the root system morphology. The samples were then scanned using an optical scanner (EPSON, Perfection V700 Photo, São Paulo, Brazil) with a resolution of 250 dpi, and the images obtained were analyzed using the WinRhizo Pro program (Regent Instrument Inc, 2007, Quebec, Canada) to determine root length (RL) (cm), surface area (SA) (cm2), area projection (AP) (cm2), root volume (RV) (cm3), average root diameter (RD) (mm), and number of bifurcations (NBif) [57].

2.4.7. Yield, Productivity, and Multiplication Rate

Harvesting occurred on 6 April 2022, at 245 DAT, when the plants had a multiplication rate of 1:8, with an average of 11 buds per stalk and 10 stalks per meter [58]. To estimate yield, the stalk length (SL), stalk diameter (SD), number of nodes (NN), internode length (IL), mass of 10 stalks (M10), and number of stalks per meter (NSM) were determined. The NSM was counted in the central 10 m of each plot, and the M10 was determined on a load cell scale (Tomate, STC-02, São Paulo, Brazil).
Stalk productivity, expressed in tons of stalks per hectare (TSH), was estimated using the Equation (12) [59]:
T S H = 0.007854 × d 2 × h × S × E 1
where d is the diameter (cm), h is the height (cm), S is the number of stalks per meter, and E is the spacing (m).
In addition, the unfolding rate for manual MEIOSI planting was also determined according to the number of buds per stalk or the stalk height and tillers per meter, as recommended in the Technical Manual for planting sugarcane in MEIOSI [58].

2.5. Statistical Analysis

The data were subjected to analysis of variance (ANOVA) with the F test. When there was a statistical difference, the data relating to the qualitative factor (presence and absence of PGPB) were submitted to the T-Test (p ≤ 0.05 * and p ≤ 0.01 **), and those referring to the quantitative factor (water regimes) were subjected to regression analysis (p ≤ 0.05 * and p ≤ 0.01 **) using the AgroEstat software (AgroEstat, version 2015, Jaboticabal, SP, Brazil).
Pearson’s linear correlation coefficient (p ≤ 0.05 * and p ≤ 0.01 **) between variables influenced by inoculation was analyzed using the R software (Version 4.3.1, Vienna, Austria). Using Pearson’s correlation values, each R-value was interpreted within the following ranges (Table 2):

3. Results

3.1. Plant Survival and Shoot Biometry

The different water regimes and PGPB inoculation affected plant survival (PS) at 30 DAT and stalk height (SH), with no interaction between these factors, while stalk diameter (SD), number of tillers (NT), and shoot dry biomass (SDB) were affected only by water regimes.
Water supply influenced the percentage of PSS survival, with a positive linear regression (p ≤ 0.01, R2 = 0.71), and PGPB inoculation increased PSS survival by 3.13% (p ≤ 0.05) (Figure 2). The absence of interaction between the factors for this variable indicates a highly significant linear adjustment with the water regimes in both inoculation conditions.
Inoculation increased SH by 22.2% compared to the control (Figure 3a), and there was a significant linear regression for the different water regimes. Although the variation between the regimes with the highest water availability (33%, 66%, and 100%) was slight, they provided an average increase of 41.3% in SH compared to severe water deficiency (0%).
There was a linear adjustment between water regimes for SD (R2 = 0.46 **); as water availability increased, SD increased (Figure 3b). Similarly, the NT and the SDB also increased linearly with the increase in irrigation rates (R2 = 0.23 ** and R2 = 0.30 **, respectively) (Figure 3c,d).

3.2. Water Use Efficiency

There was an interaction between inoculation and water regimes for water use efficiency (WUE) (Figure 4). In the absence of an initial water supply, under 0% water regime, inoculation increased WUE by 185%. With increased water availability, although PGPB provided higher nominal averages, no statistical difference existed (Figure 4a). Increased water availability reduced the WUE of inoculated plants but did not influence the WUE of non-inoculated plants (Figure 4b).

3.3. Growth Analysis

According to the crop growth rate (CGR), the crop reached its maximum growth at approximately 180 DAT (Figure 5). Under the 0% and 33% water regimes, Bacillus inoculation provided greater CGR throughout the cycle (Figure 5a,b), with the most significant difference at 192 DAT. At 192 DAT, under the 0% regime, the inoculated plants reached 10.21 g day–1, and the non-inoculated plants 8.60 g day–1; and under the 33% regime, there was an increase of 2.42 g day–1 in the inoculated plants. In the 66% water regime, inoculation resulted in a higher GCR from 145 DAT onwards (Figure 5c), while under an adequate water regime (100%), inoculation increased the GCR until 211 DAT, followed by a sharp decrease in this variable at 231 DAT, both in the presence and absence of PGPB. All the treatments decreased growth speed at 211 DAT, with a sharper decrease for non-inoculated plants under the 33% and 66% regimes.
The relative growth rate (RGR) shows the plant’s growth based on the amount of already existing dry matter. This variable had a downward trend over the period studied for all treatments. As water availability increased, there was a reduction in the difference between inoculated and non-inoculated plants, represented by the approximation of the curves (Figure 6). Under the 0% water regime, the non-inoculated plants had higher RGR until 175 DAT, when the curves were inverted, and the inoculated plants provided higher RGR from 192 DAT to 231 DAT (Figure 6a). Similar behavior occurred under the 33% regime (Figure 6b). In the 66% regime, there was no difference between the presence or absence of PGPB until 175 DAT, at which point the inoculated plants stood out (Figure 6c). Under an adequate regime (100%), the RGR was very similar between inoculated and non-inoculated plants (Figure 6d).
Under the 0% water regime, the inoculated plants had a higher net assimilation rate (NAR) throughout the cycle. The PGPB attenuated the marked decrease verified in non-inoculated plants (Figure 7a). Under the 33% water regime, the same behavior was observed in the inoculated plants since the non-inoculated plants had higher NAR from 83 DAT to 192 DAT, after which NAR became more elevated in the inoculated plants (Figure 7b). Under the 66% water regime, PGPB provided greater NAR than the control. However, after the beginning of frequent rainfall and the cessation of irrigation, the non-inoculated plants reached higher NAR until 175 DAT, when there was a sharp decrease in this variable under this condition. At the same time, in the inoculated plants, this decrease was attenuated (Figure 7c). Under suitable initial water conditions (100%), plants with and without inoculation behaved similarly, with a sharp reduction towards the end of the cycle (Figure 7d).
The leaf area ratio (LAR) showed a similar standard in all the water regimes (Figure 8). Under controlled irrigation, non-inoculated plants had higher LAR up to 126, 63, and 83 DAT under the water regimes of 0% (Figure 8a), 33% (Figure 8b), and 66% (Figure 8c), respectively. However, under adequate water availability, there was no inoculation effect throughout the experiment (Figure 8d).
For the specific leaf area (SLA), under the 0% water regime, non-inoculated plants provided higher values until 105 DAT, when the curves of both treatments cross and remain stable until 211 DAT when the non-inoculated plants again stand out compared to the inoculated plants (Figure 9a). Under the 33% water regime, PGPB did not affect SLA, with a slight reduction in values between 45 and 231 DAT for both treatments (Figure 9b). The 66% water regime curves were similar to the 0% water regime. Still, both had higher values throughout the cycle, with 58.1% and 55.6% reductions between 45 and 231 DAT for the non-inoculated and inoculated plants, respectively (Figure 9c). As for the adequate water regime, the curves were similar between inoculated and non-inoculated plants throughout the cycle (Figure 9d).
The SLA and LAR indices behaved similarly; the non-inoculated plants provided higher values at the beginning of the cycle under the 0%, 33%, and 66% water regimes for both. However, under severe water restriction (0%), the curves crossed later, at 175 DAT (Figure 9).
Specific leaf weight (SLW) behaved inversely to LAR and SLA (Figure 10). Possibly, the PGPB increased leaf thickness at the beginning of the cycle under the 0%, 33%, and 66% water regimes, whereas under the adequate water regime, this increase occurred at the end of the cycle.

3.4. Nutritional Variables

There was an interaction between inoculation and water regimes for N and P. PGPB provided increases of 63.2%, 61.7%, and 18.3% under 0%, 33%, and 66% water regimes, respectively, compared to the non-inoculated plants (Figure 11a). Inoculation with B. licheniformis and B. subtilis provided increases of 15.2%, 17.6%, and 10.3% in the P content under the 0%, 33%, and 66% water regimes (p ≤ 0.01), respectively, and 3.8% in the adequate water regime (p ≤ 0.05) compared to non-inoculated plants (Figure 11b).
The treatments did not influence the K, Ca, Mg, and S contents (Table 3).
There was an interaction between inoculation and water regimes for Zn and Mn contents (Figure 12). Under 66% and 100% water regimes, the PGPB provided higher Mn content than the control (Figure 12a). The water regimes did not influence the Zn content in inoculated plants, while in non-inoculated plants, there was an influence on the irrigation levels (Figure 12b). The PGPB increased the Zn levels under the 0% water regime.
The increase in water availability increased the Fe and Cu levels (Table 4).
The water regimes influenced the macro and micronutrient leaf accumulation, with a significant linear adjustment (p ≤ 0.01) (Table 5 and Table 6). The highest determination coefficients were observed for N and P (R = 0.56 ** and R = 0.59 **, respectively) (Table 5). B. licheniformis and B. subtilis influenced Cu accumulation, with an increase of 27.17% compared to non-inoculated plants (Table 6).

3.5. Morphological Variables of the Root System

There was no interaction between inoculation and water regimes for the root system variables, regardless of depth. Although root volume (RV), area projection (AP), and surface area (SA) were influenced by PGPB inoculation at 0–20 cm depth (p ≤ 0.05), there was no interference from PGPB at the other depths. At 0–20 cm depth, inoculated plants had an increase of 15.79% and 13.67% in RV and SA, respectively, compared to non-inoculated plants (Table 7).
Water regimes influenced root length (RL), SA, AP, and number of bifurcations (Nbif) at 60–80 cm depth. There was a linear regression inversely proportional to the water regimes, in which increased water availability reduced RL, SA, AP, and Nbif (Table 7).

3.6. Yield and Multiplication Rate

There was an interaction between inoculation and water regimes on the number of stalks per meter (NSM). Under the 33% and 100% water regimes, PGPB provided increases of 9.78% and 18.10% in NSM, respectively, compared to the control and, consequently, there was an inoculation effect on TSH and multiplication rate (MR) (Figure 13). This way, the PGPB increased TSH in the 33% and 100% water regimes due to the higher NSM. However, the increase in MR was only verified under the 33% water regime (Figure 13c).
The increase in water availability decreased the number of nodes (NN) but provided greater internode length (IL) (Table 8).

3.7. Pearson’s Correlation

There was a highly positive correlation between PS, LA, SDB, CGR, N, P, Mn, and Zn. Survival was inversely correlated with LAR (R2 = 0.65 **) (Figure 14). WUE correlated strongly negatively with RGR (R2 = −0.54 **) and P content (R2 = −0.43 *). In contrast, WUE correlated positively with NAR (R2 = 0.46 **), SDB (R2 = 0.37 *), NSM (R2 = 0.44 *), and MR (R2 = 0.38 *).
Inversely proportional correlations between LA, LAR, NSM, and MR were observed. Regarding growth analysis, CGR correlated with NAR, SLW, and all the nutrients. RGR correlated negatively with WUE, SLW, and Zn content (Figure 14). This was also the case for LAR which showed an inversely proportional correlation with CGR, SLW, and nutrient content and correlated positively only with NSM. There was also a correlation between N, P, Mn, and Zn content.
Root variables correlated positively with each other (SA and RV), and RV correlated negatively with NN (R2 = –0.36 *) (Figure 14). Regarding the production variables, NSM, NN, and MR correlated, showing that NSM and NN directly affected MR.

4. Discussion

The establishment method using PSS is under development in Brazil [18], and its expansion is associated with the significant growth of the MEIOSI production system [60]. The MEIOSI system consists of planting central rows of sugarcane in consortium with other crops of economic interest. After harvesting the crops grown between the rows, the sugarcane is used as propagation material for the rest of the area [15,16,58]. The search for propagation materials that present varietal guarantee and better health conditions drives the expansion of PSS planting in this production system [18].
However, despite the reduction in the propagation material volume for the MEIOSI central rows, PSS have low water and nutrient reserves, a poorly developed root system, and low leaf area when they are transplanted to the field [17], which makes water supplementation indispensable for plant establishment, since the absence of irrigation leads to high plant mortality and the need for replanting [18].
This study shows that plant growth-promoting bacteria (PGPB) from the genus 
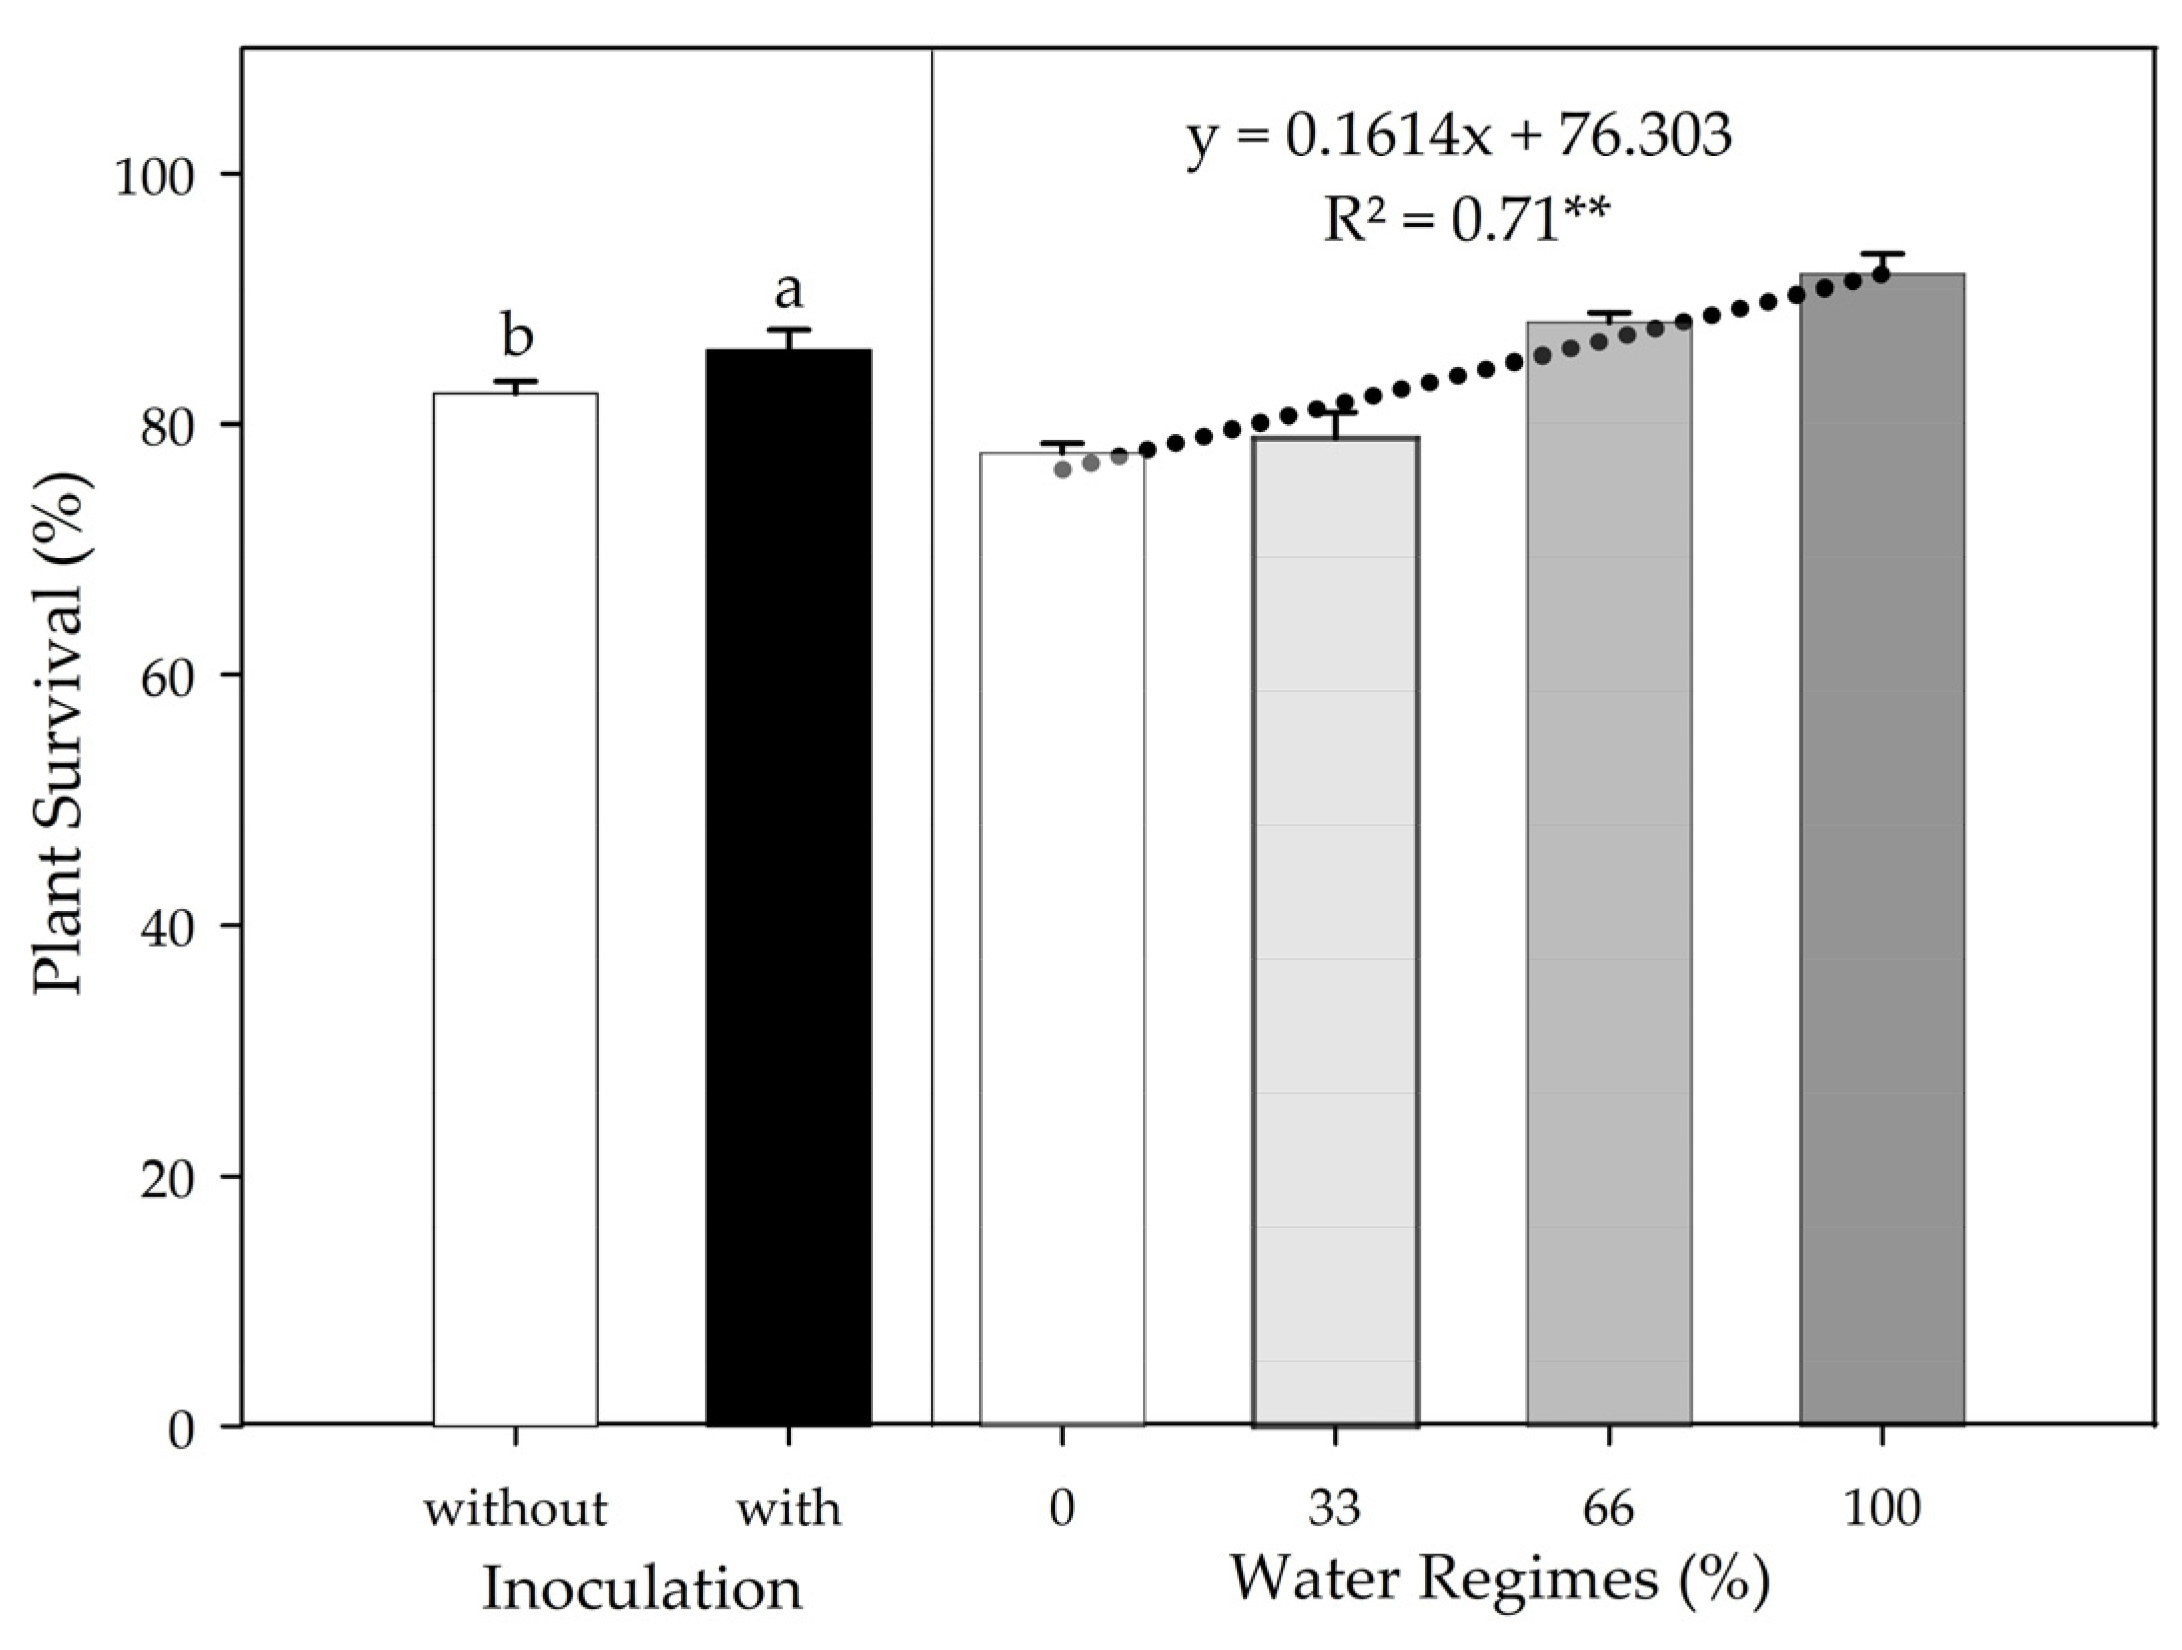
Bacillus spp. can attenuate this problem. The increased plant survival promoted by PGPB inoculation at 30 DAT suggests that the inoculated plants were influenced by the biological mechanisms already reported by B. licheniformis [35,61] and B. subtilis [38,62,63,64,65,66], such as the production of phytohormones, siderophores, and exopolysaccharides, biofertilization, and remediation of abiotic stresses. In the absence of inoculation, PSS survival of 82.4% corroborates with the results found by Almeida Neto et al. [67]. Although no other studies evaluate PSS survival in the field under the use of microorganisms, studies reported the PGPB action in improving rooting and nutritional aspects [37,68,69,70,71].
Inoculation of B. licheniformis and B. subtilis can be a promising approach to improving plant growth, as the particularities of each species allow for a greater action spectrum on signaling pathways, nutrient solubilization, and phytohormone production [38,41,42,72]. Our results show that inoculation increased the stalk height (SH) at 63 DAT, similar to that found by Brandi et al. [41], who reported that the association of two bacteria of the Bacillus genus increased the sugarcane height. In contrast, individual inoculation of each species did not raise this parameter [41].
Water is indispensable for plant development and is involved in metabolic processes. Hence, a decrease in water supply directly and indirectly interferes with various processes related to plant growth and development [73,74], which explains the increase in SH, SD, NT, and SDB as the water supply increased.
As water availability decreased, there was an increase in WUE; however, the inoculation × water regime interaction was only verified under severe water restriction (0% irrigation), where PGPB surprisingly increased WUE by 185%. These results indicate that the plants treated with FMCH001 and FMCH002 had better control of maintaining the plant’s water status during the progressive drought than the non-inoculated control plants. These bacteria remain as spores for survival in water-scarce conditions, which helps them survive better in extreme conditions for extended periods [39].
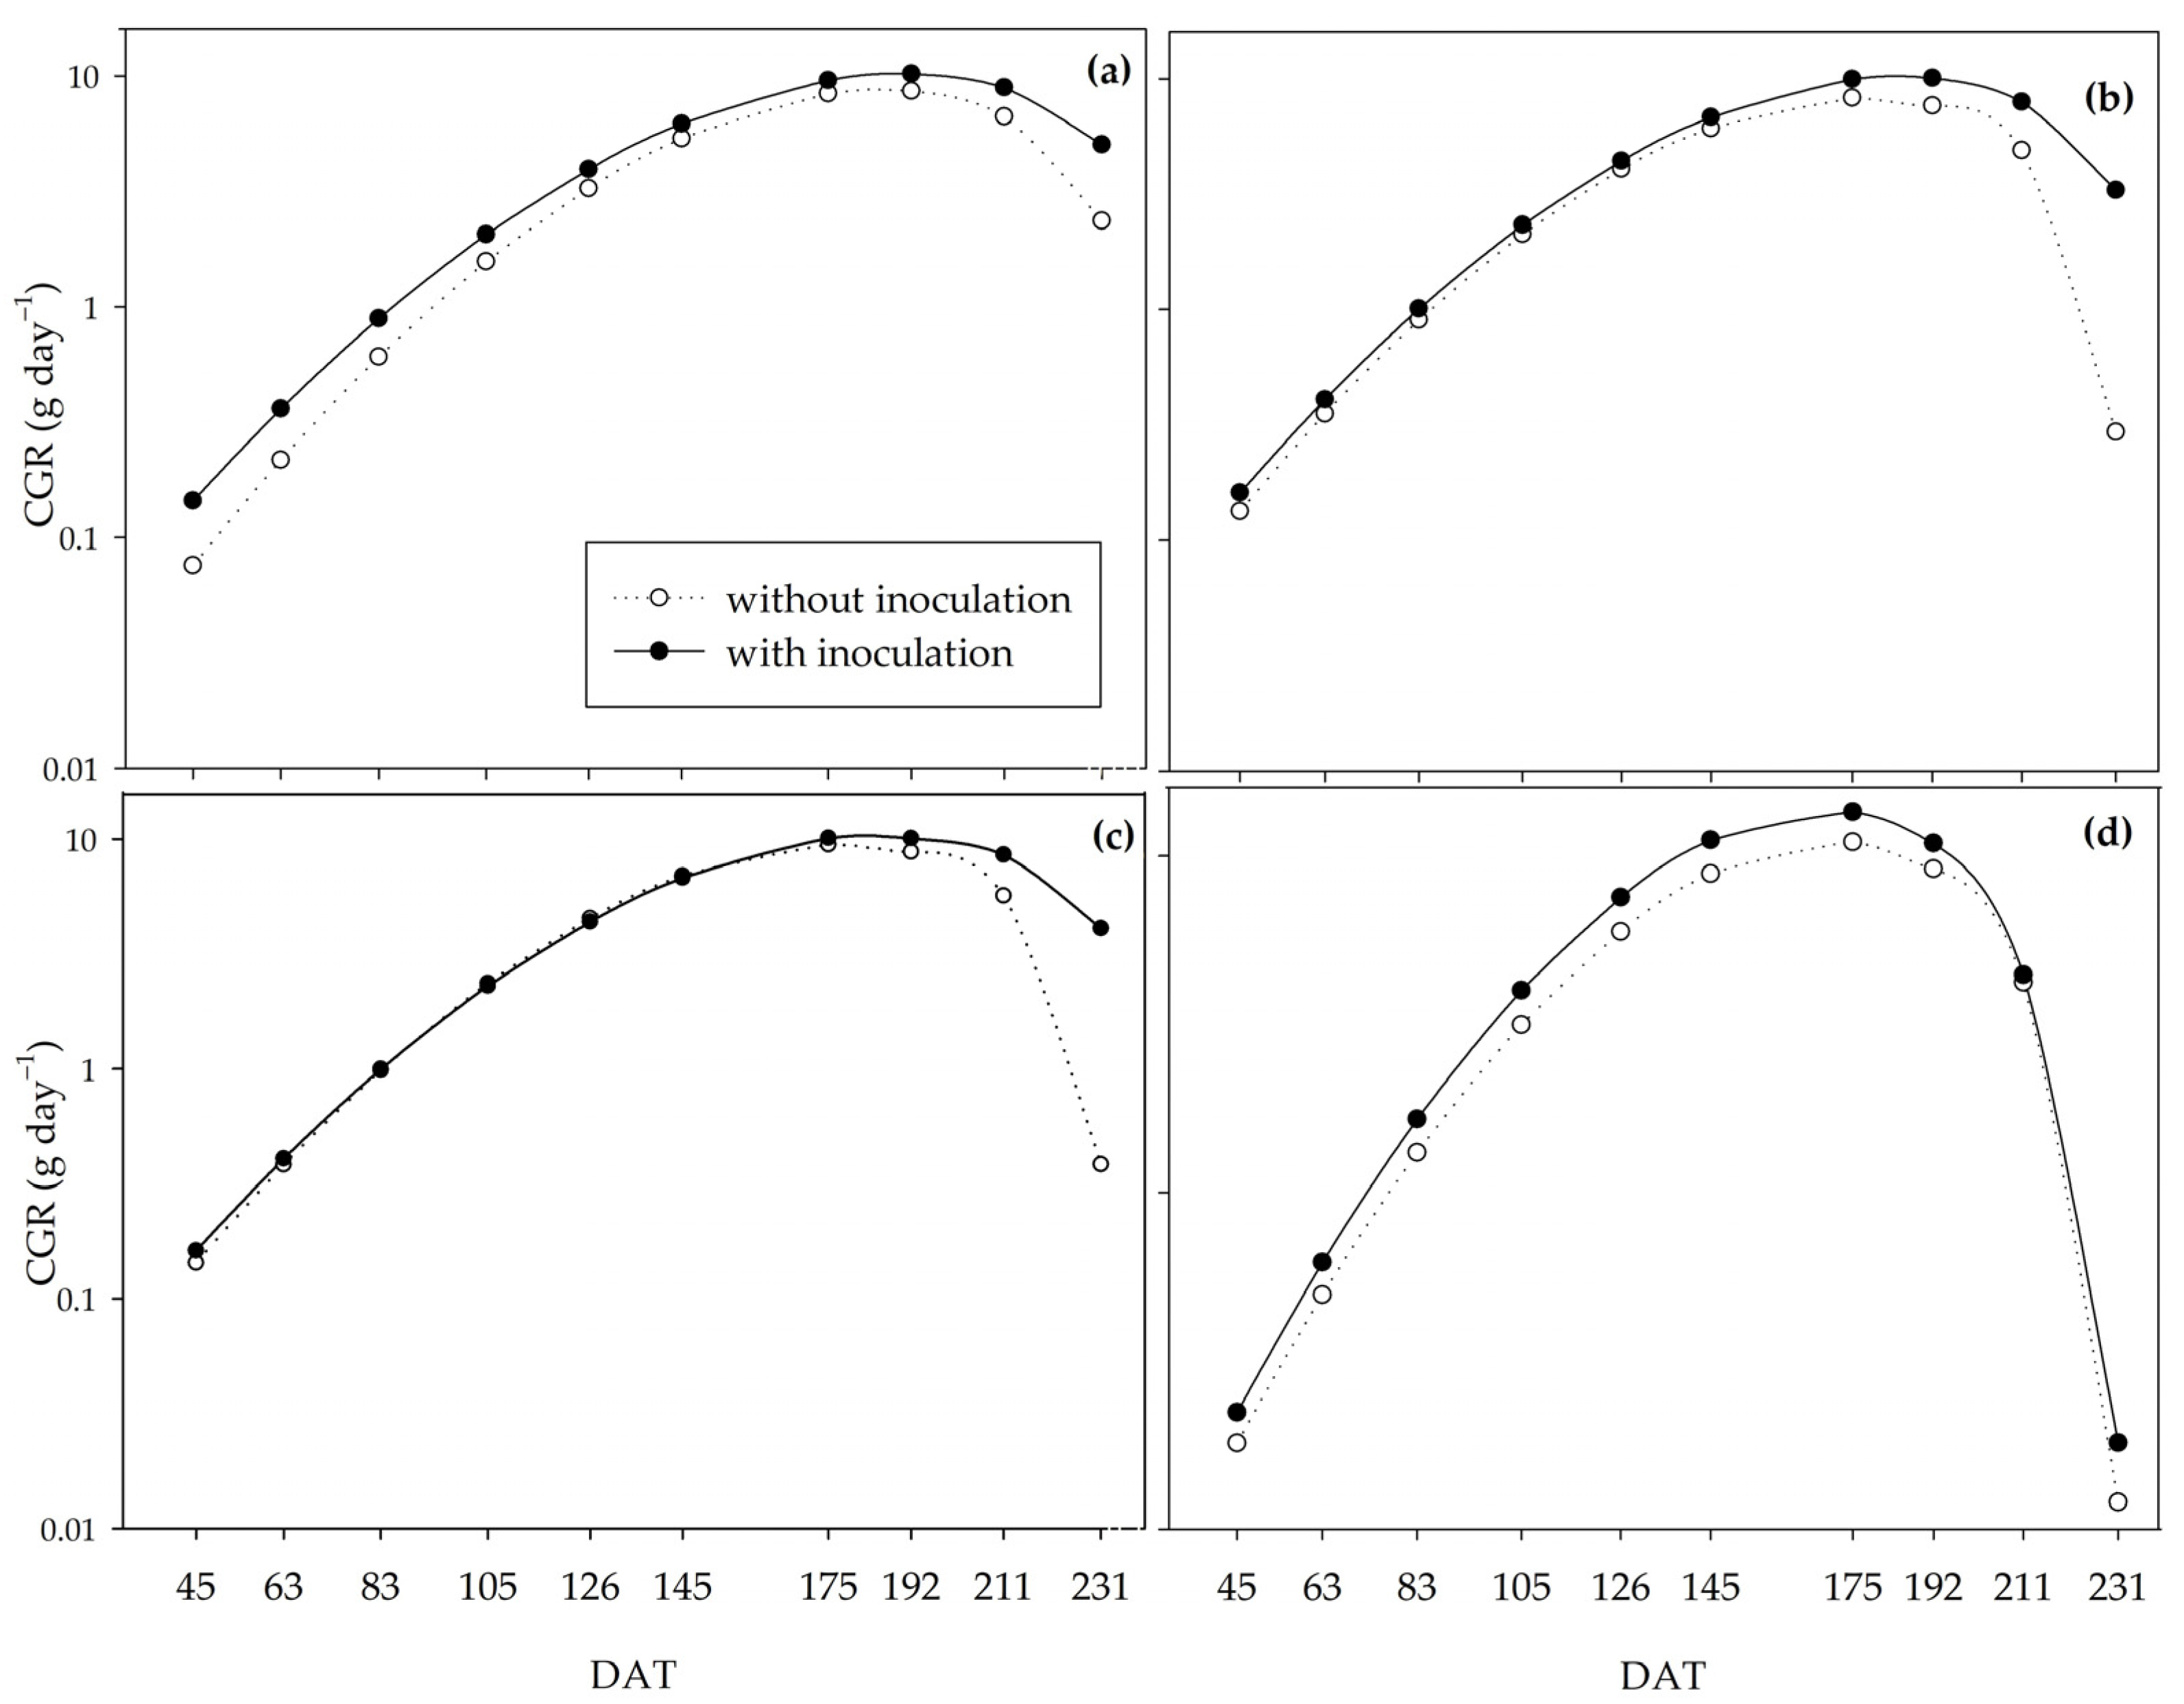
Inoculation provided a higher crop growth rate (CGR) at the peak of development (145 to 192 DAT) for all the water regimes studied. Between 130 and 180 days after planting, in mid-August/September, sugarcane plants are at the peak of their development due to favorable temperature and rainfall conditions [4], which justifies the higher net assimilation rate (NAR) for all treatments. The CGR and NAR curves corroborate the results of Pedula et al. [75], who showed an increase in these indices by applying five diazotrophic bacteria.
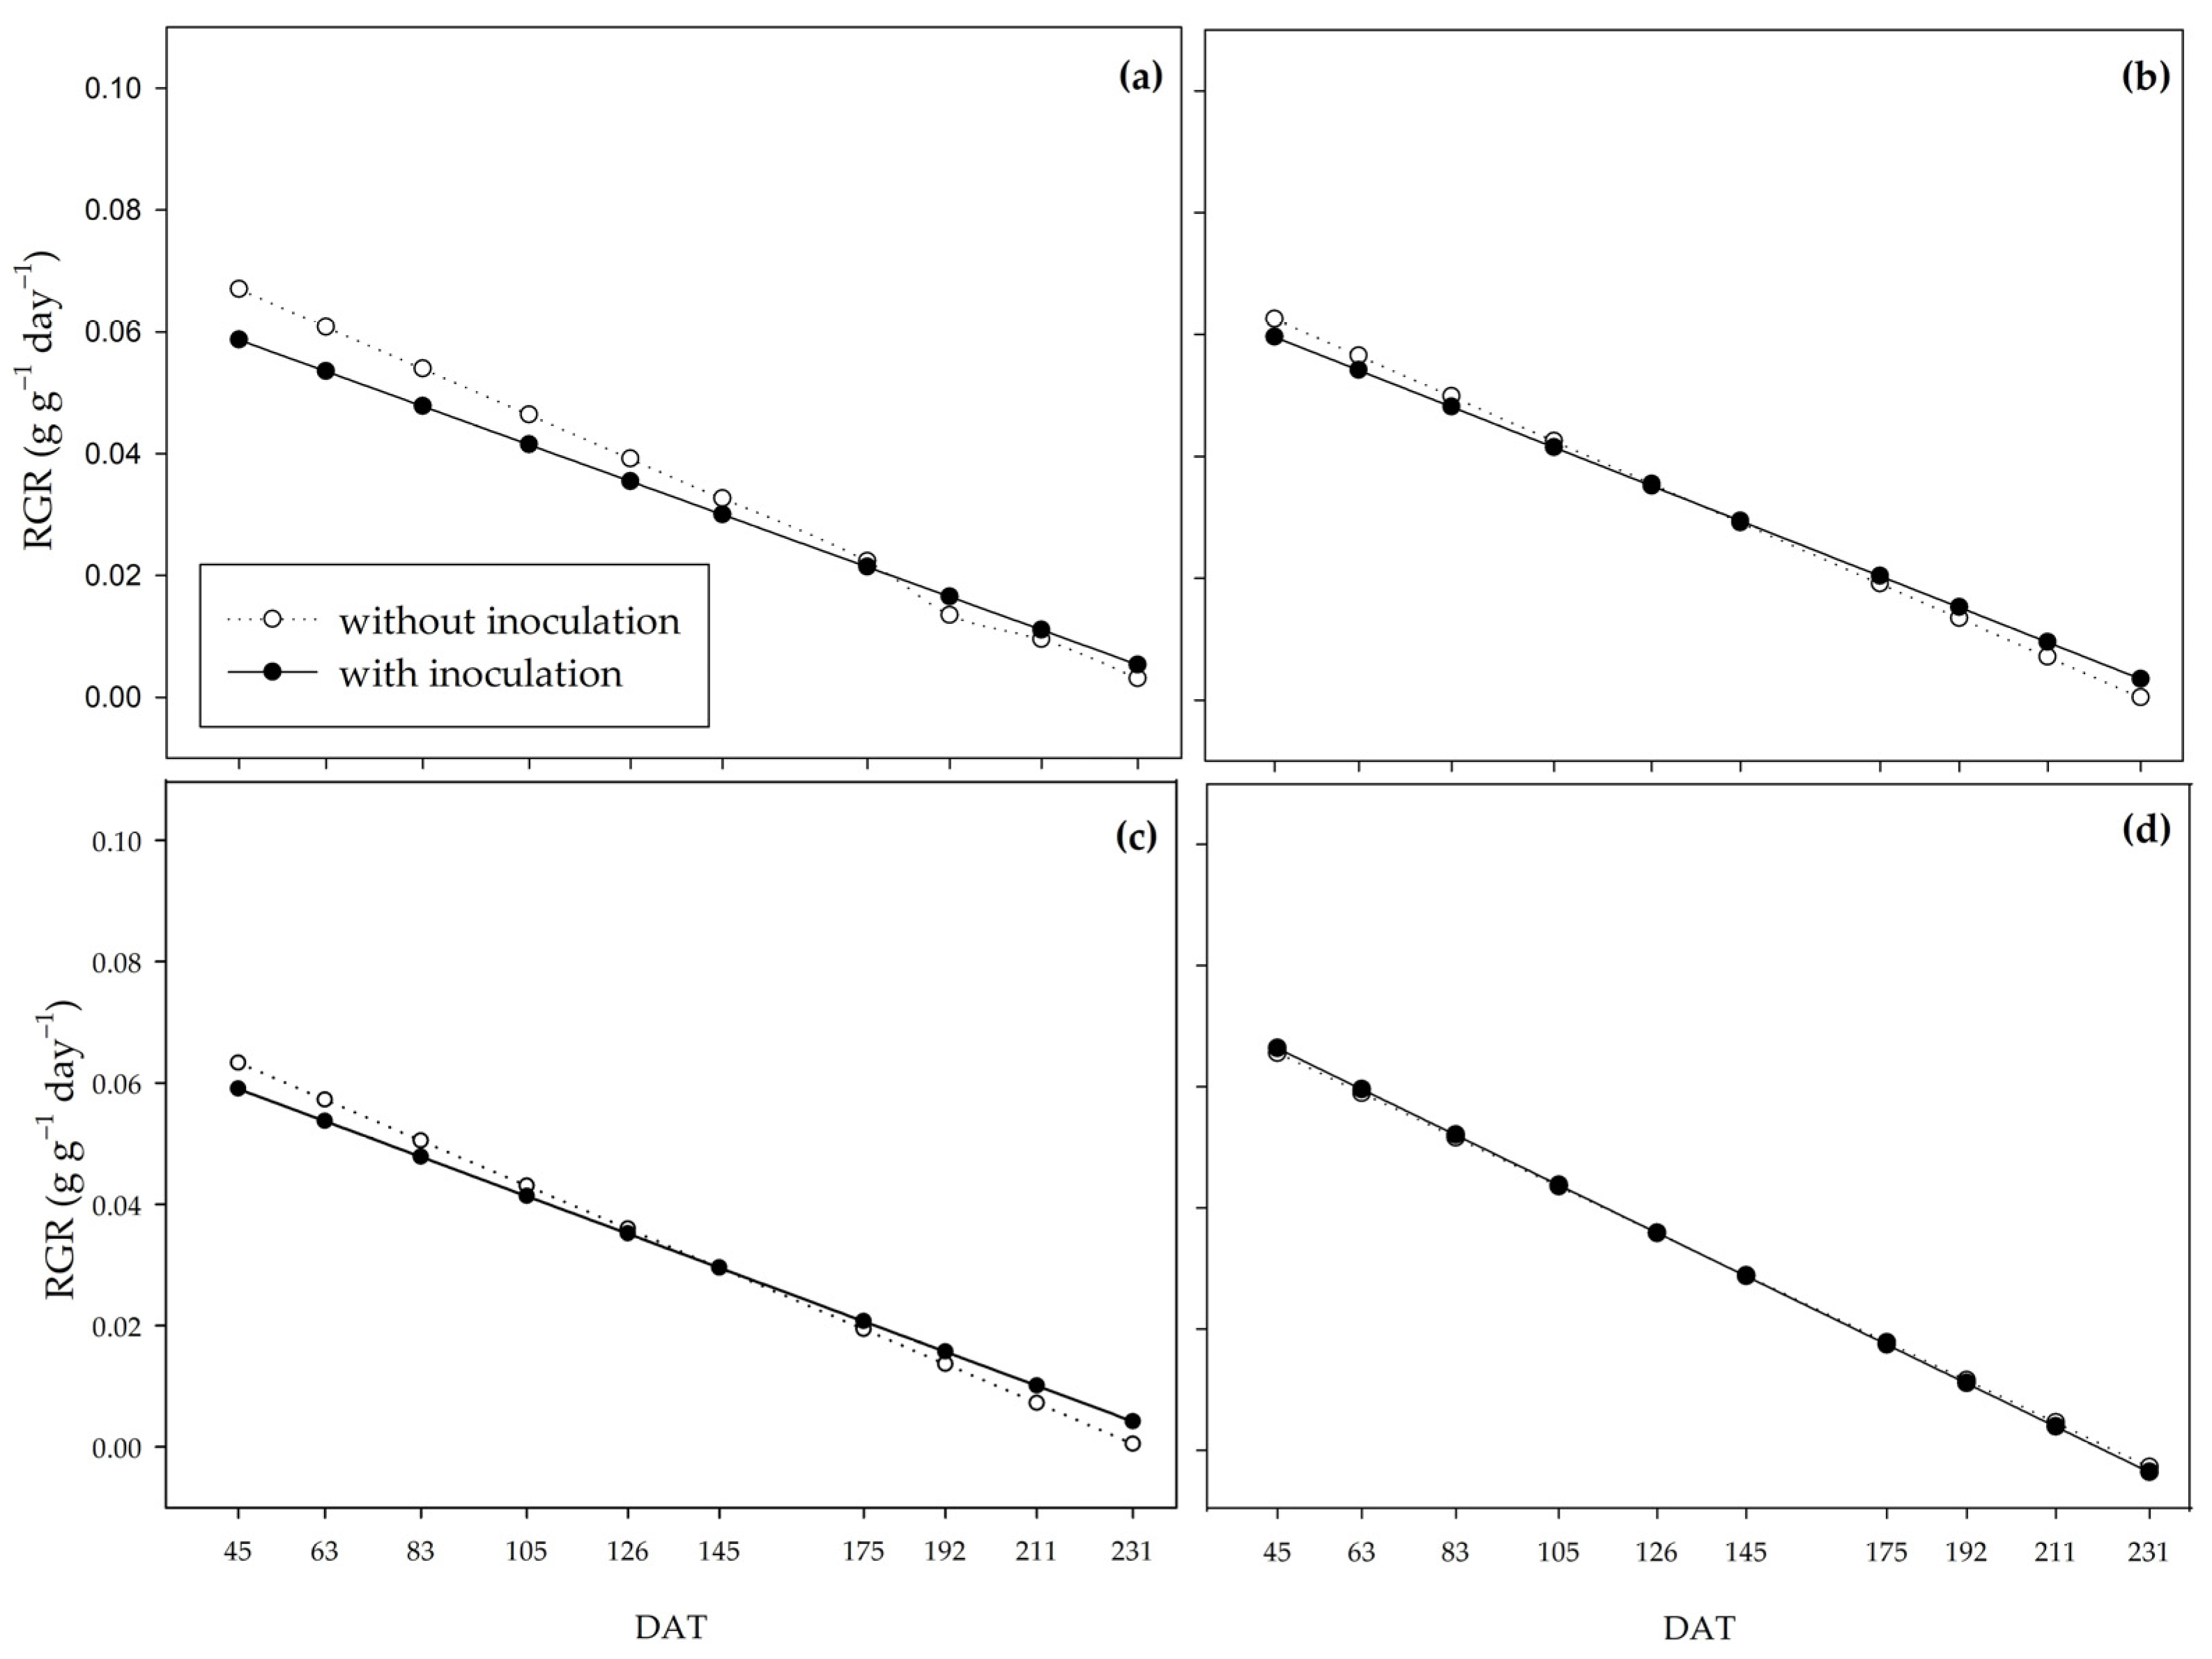
The relative growth rate (RGR) represents the plant’s efficiency in producing new material [54]. It is estimated that 40% of the photoassimilates produced by plants go into the production of exudates by the root system [76]. The exudates released by plant roots play a role in maintaining and interacting with rhizospheric microorganisms [77], as they are the primary source of organic carbon in the rhizodeposition process [78]. Root exudation represents a significant carbon cost for the plant [79]. At the beginning of the cycle, under water restriction, the plants may have partitioned part of their assimilates for the inoculated bacteria maintenance, which possibly affected carbohydrate production. This allowed the colonies to settle and develop in the rhizosphere of the plants and promote the inversion of the RGR curves between the inoculated and non-inoculated plants at the end of the cycle. Under conditions closer to adequate in terms of the necessary water supply (66% and 100% water regimes), the partitioning to the production of exudates probably did not interfere enough to influence the dry matter production by the pre-existing material.
It is worth noting that the treatments related to the water regimes took up to 57 DAT (Figure 1), after which all the plants were subjected to natural rainfall. Considering the long period of the crop in the field (231 DAT) and the controlled irrigation period (57 DAT), it is possible that, at the end of the evaluations, the dry matter mass production parameters were level for all the water regimes.
Unlike the RGR, the inoculated plants showed higher NAR values at the beginning of the cycle, which indicates that the photoassimilates resulting from the higher net assimilation rate of the inoculated plants were being partitioned to resources other than the production of shoot dry matter mass, such as the root system improvement [39,80]. These resources may have aided the greater production of shoot dry matter mass after 145 DAT, as shown by the CGR and RGR curves under inoculation with B. licheniformis and B. subtilis.
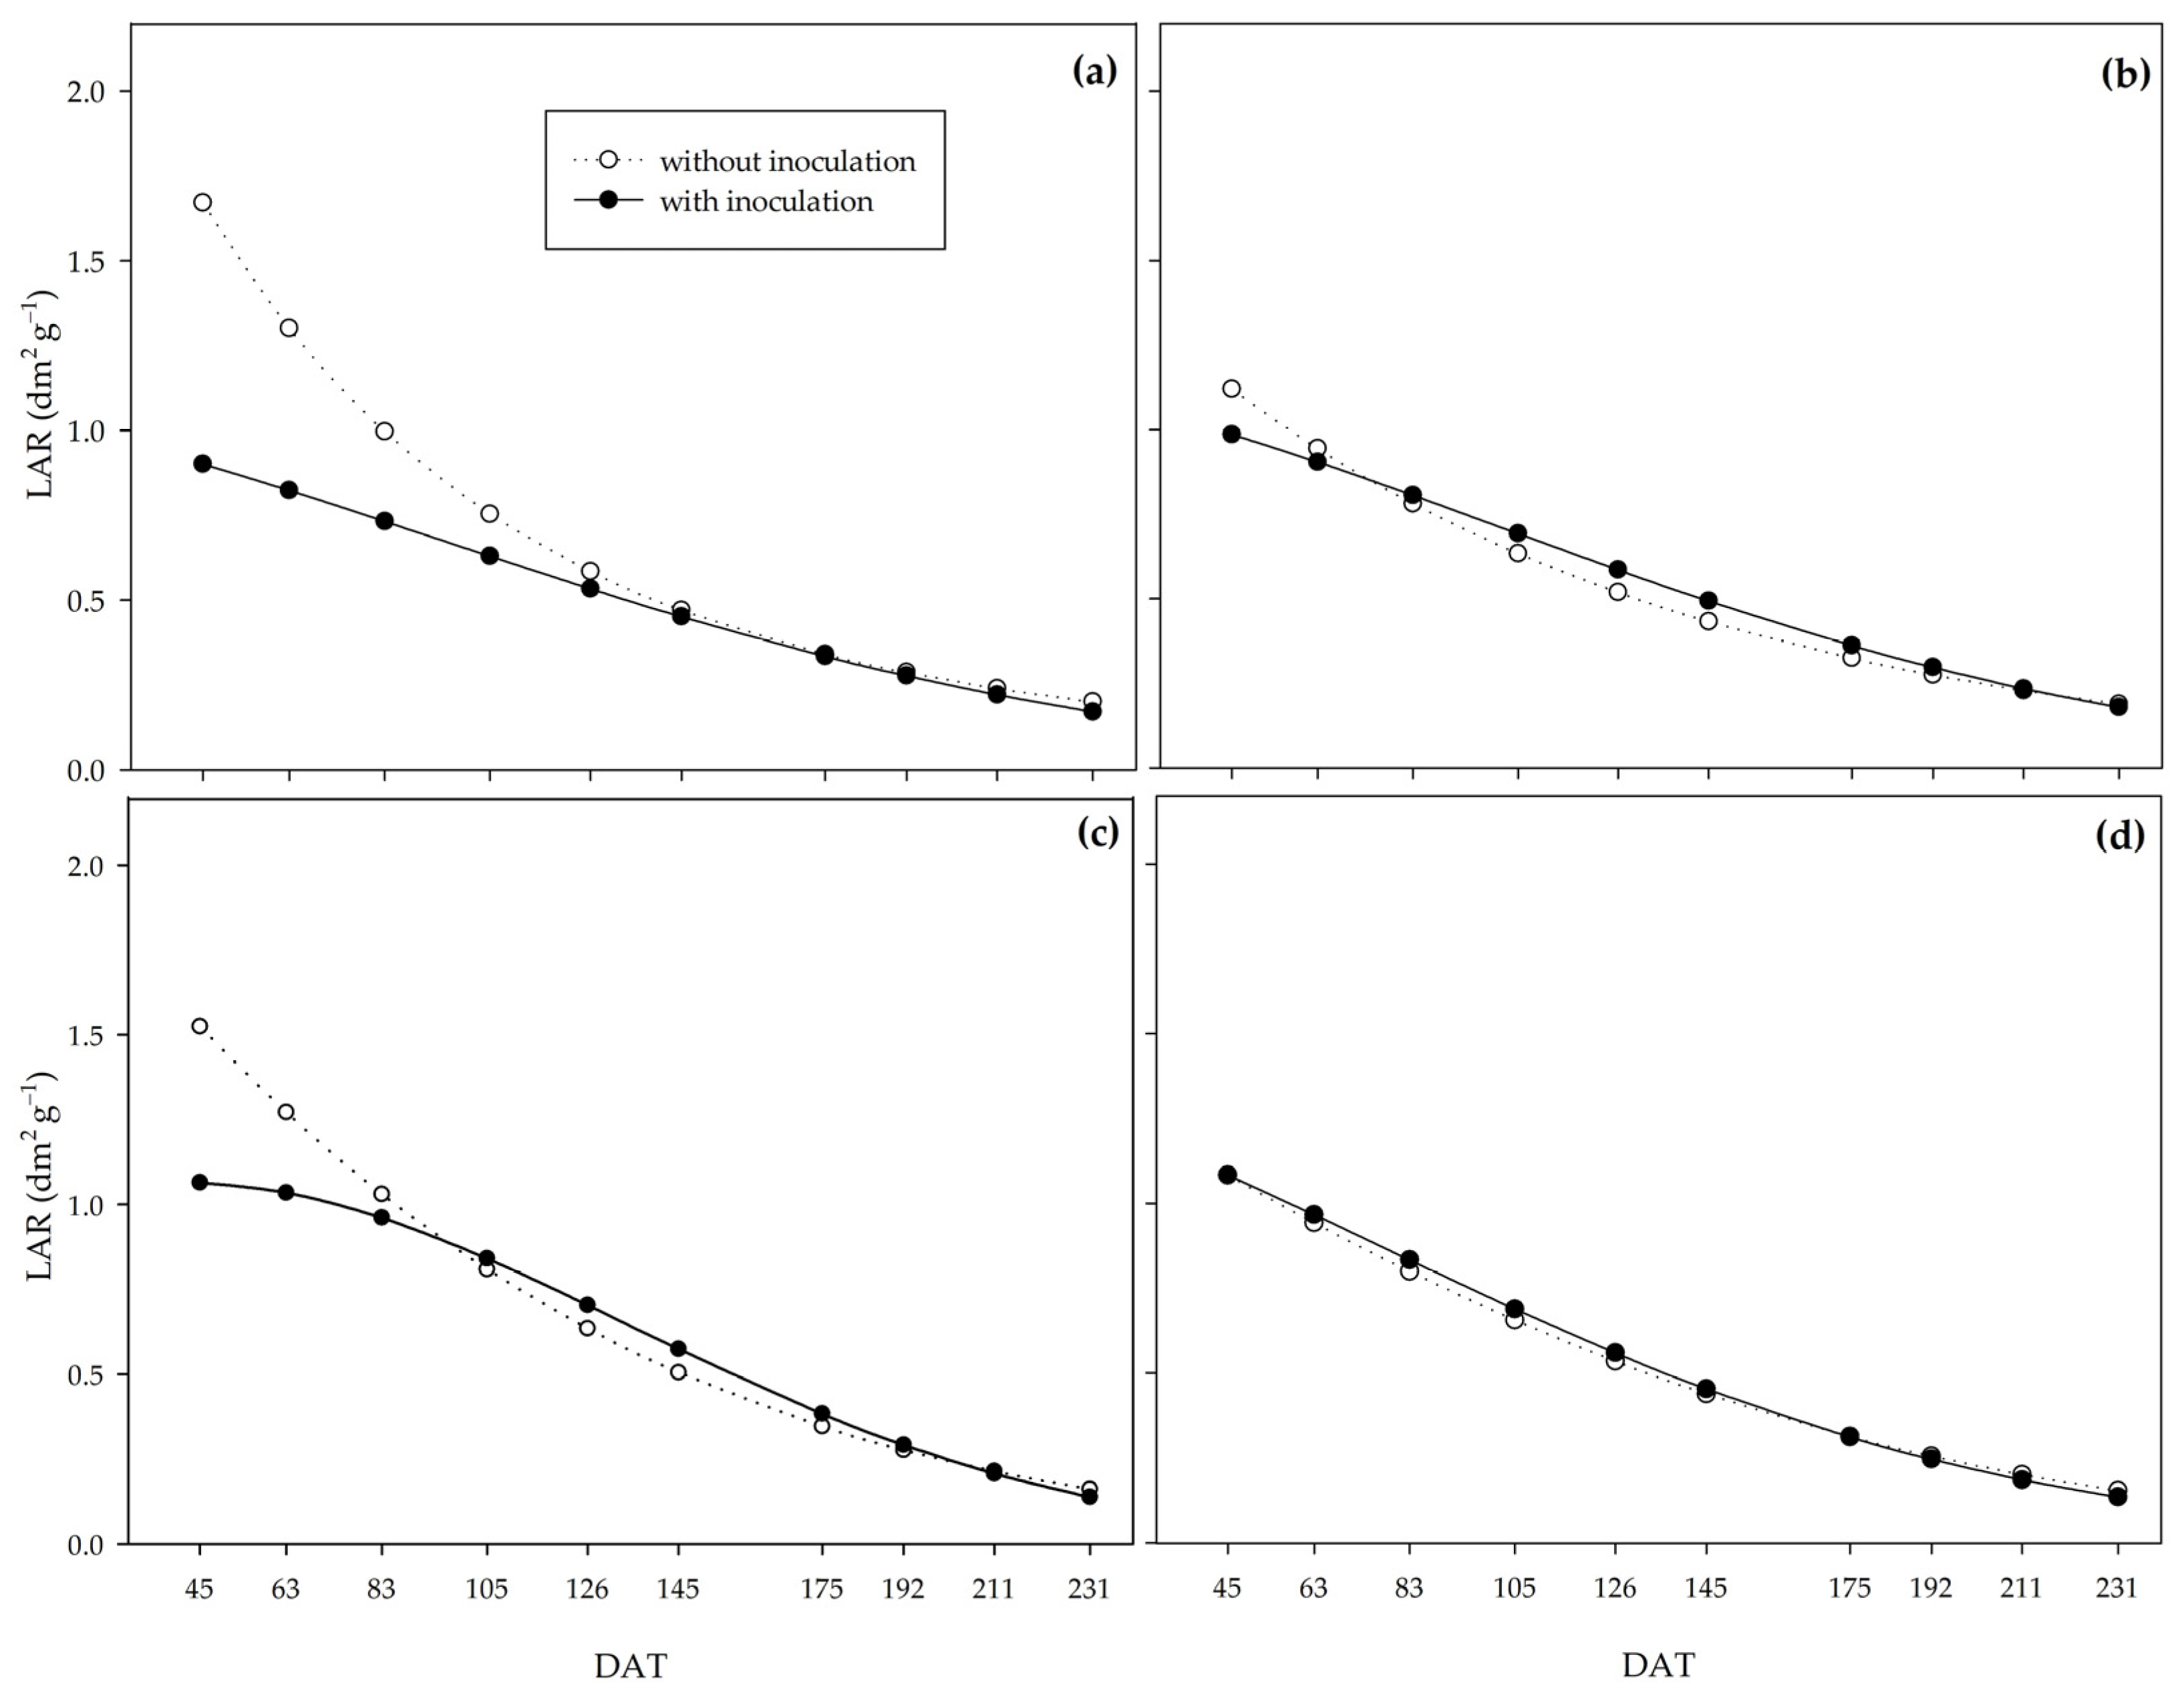
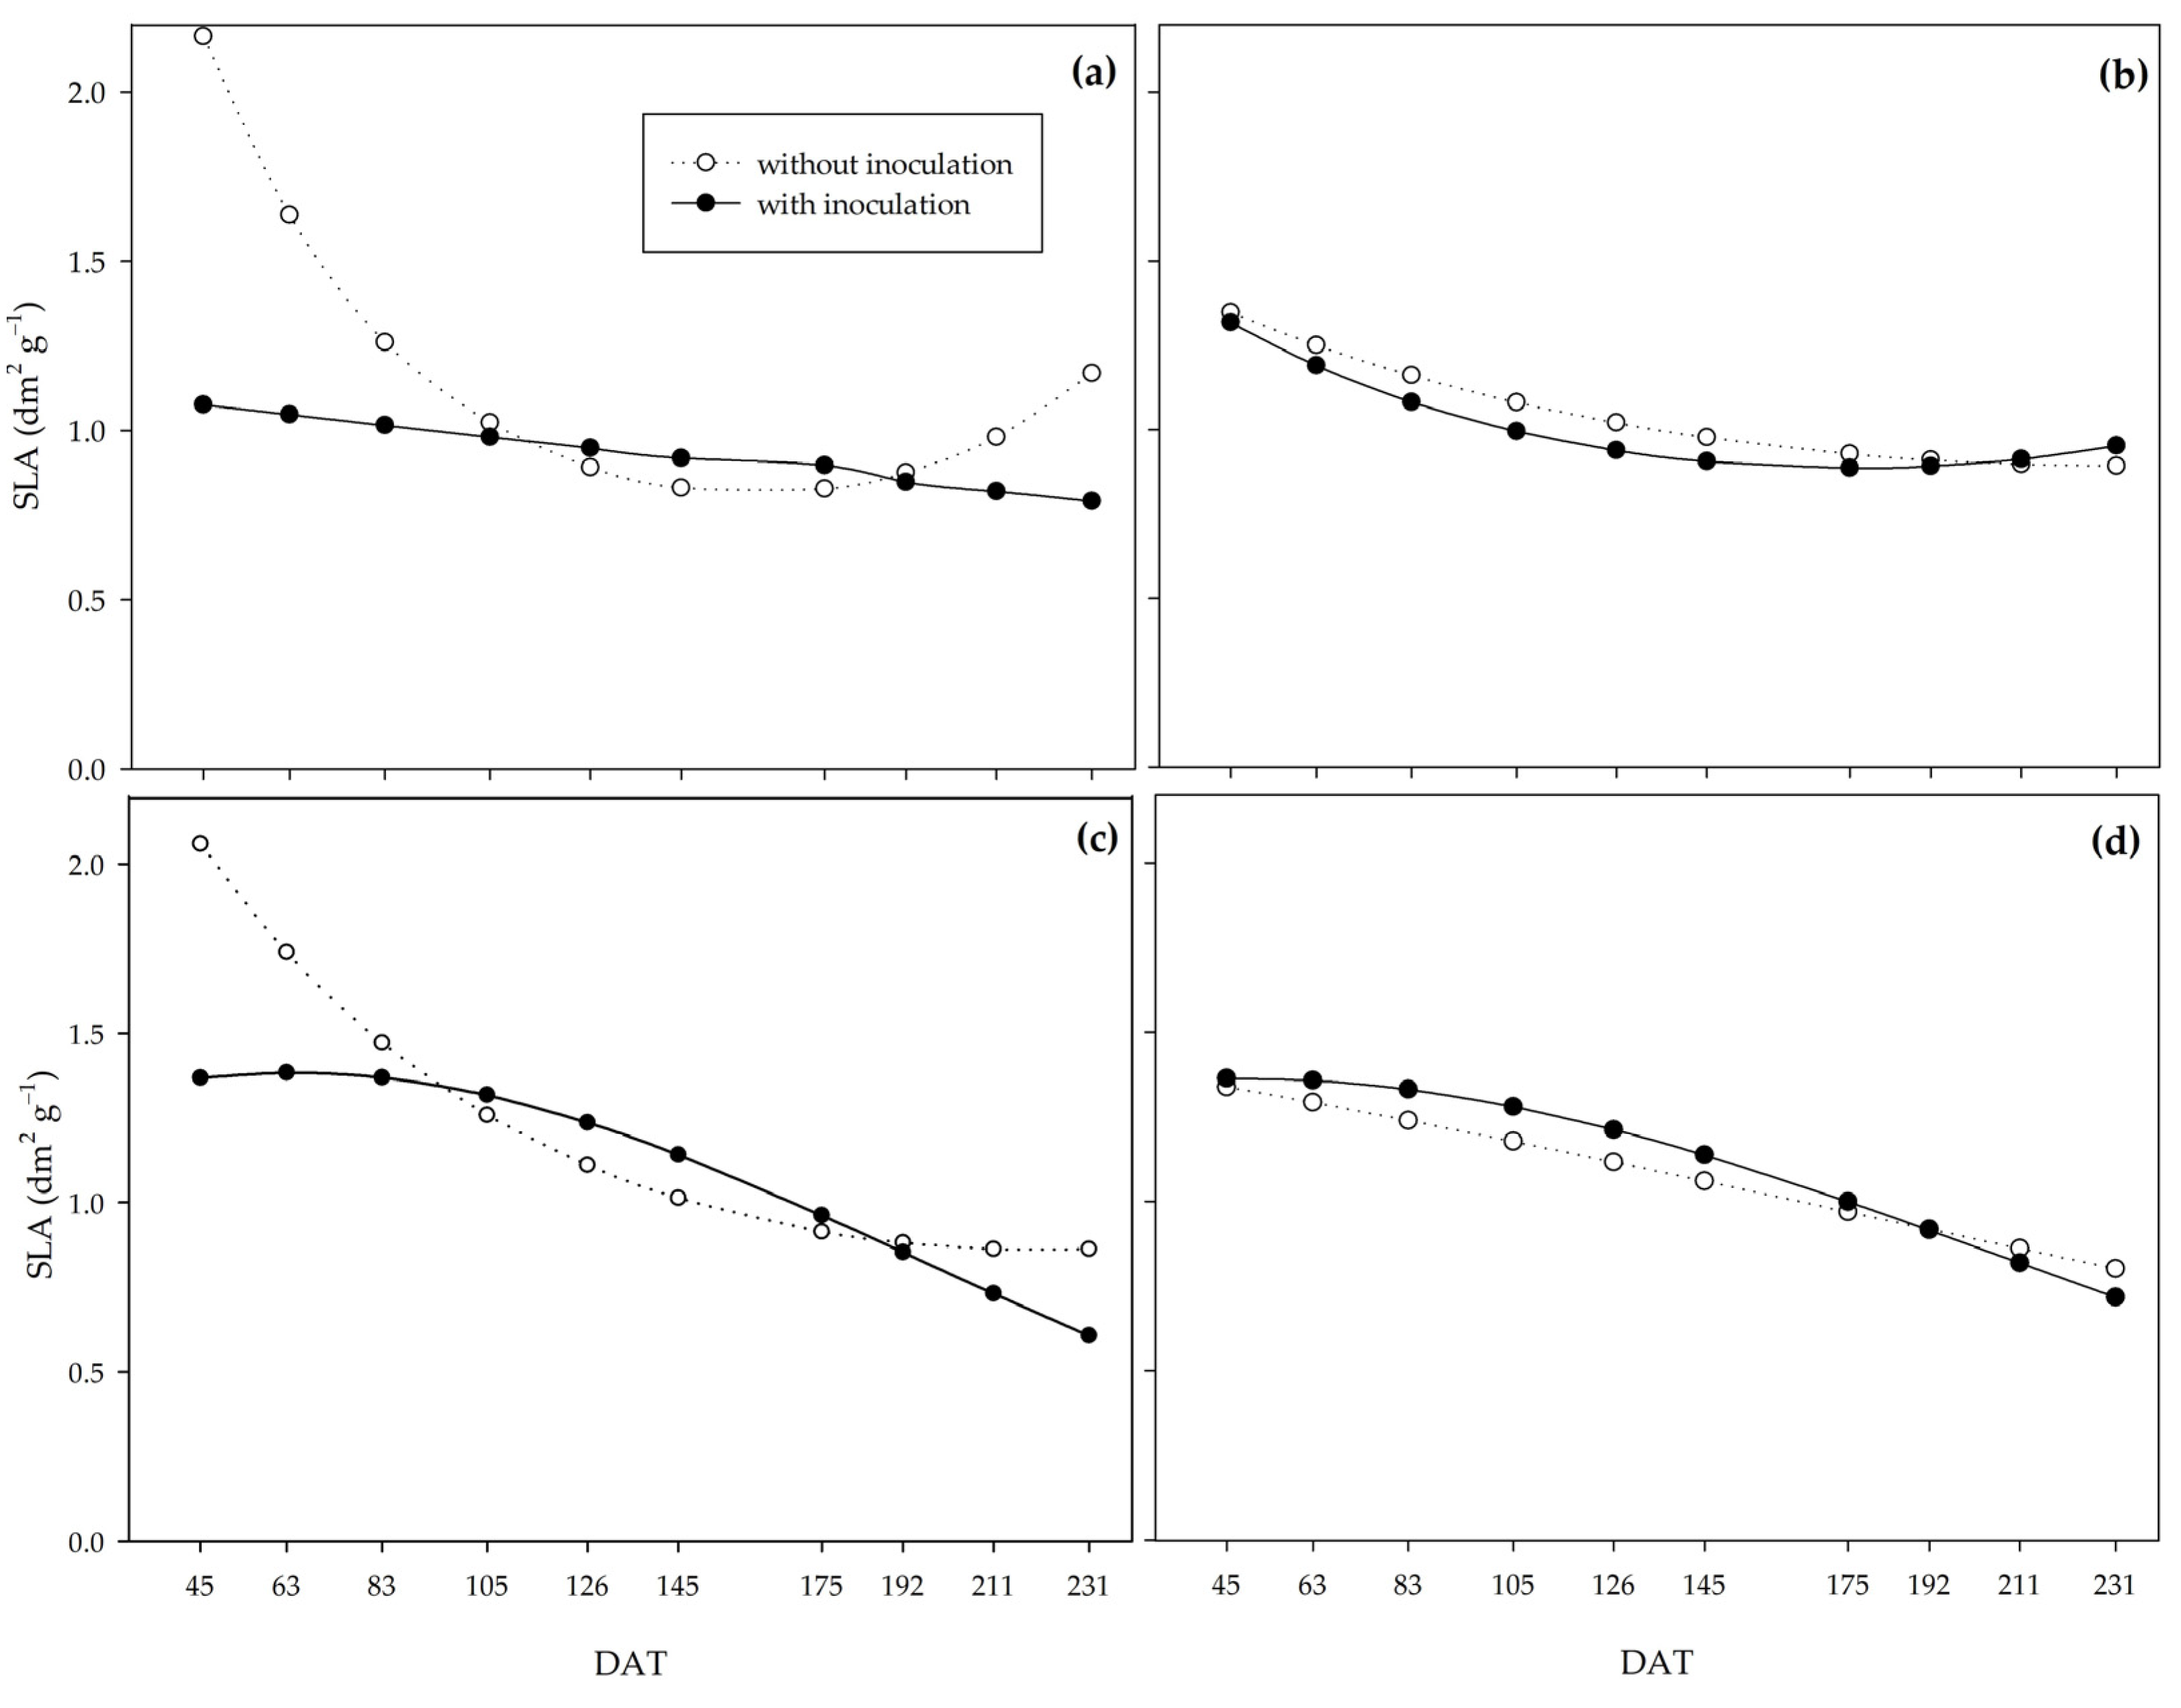
Lower values of leaf area ratio under the action of PGPB indicate the action of Bacillus on yield efficiency, as it indicates that the inoculated plants produced more assimilate per unit of assimilatory surface [54]. Specific leaf area (SLA) and specific leaf weight (SLW) allow us to analyze leaf thickness since the higher the SLA, the lower the leaf thickness, and the higher the SLW, the greater the leaf thickness. PGPB promoted greater leaf thickness, which explains the higher net assimilation rate in inoculated plants. The higher leaf thickness may represent greater shoot dry biomass production efficiency by improving the photosynthetic apparatus, mainly due to the vascular bundle sheath in C4 plants such as sugarcane [4]. SLW at 63 DAT was highly correlated with shoot dry biomass, crop growth rate, and net assimilation rate (R2 = 0.5 **).
These results show the potential of PGPB to promote tolerance to water deficiency since, under water restriction, these bacteria enabled greater dry matter mass yield efficiency at the end of the experiment, as well as a higher assimilation rate and greater leaf thickness at the beginning of the PSS growth in the field.
Several reports of bacteria of the genus Bacillus increase the rooting of sugarcane, which explains the increase in volume, area projection, and surface area of roots at a depth of 20 cm [28,36,81]. One of the ways PGPBs promote tolerance is by acting on signaling pathways that promote more significant partitioning of assimilates to the root system [81]. Species of the genus Bacillus spp. can synthesize auxins, gibberellins, cytokinins, and spermidines, which increases the division and elongation of root cells [82], in addition to being abundant in the root zone of drought-adapted plants [39]. Roots are considered one of the essential adaptive traits for withstanding water stress. Much evidence shows that plants with more prolific, deeper, and higher root biomass can tolerate water stress better than plants with thinner root systems since roots are the only organ capable of extracting water from the soil profile [83,84].
In addition to increased rooting, which increases the water and nutrient uptake, enabling the tolerance to water deficiency in plants [73,74,85], it also increases root and shoot dry matter, directly related to the plant’s WUE [39]. In this study, inoculation increased the N, P, Mn, and Zn uptake at 63 DAT and increased WUE at the whole plant level under severe water restriction.
Increased water restriction led to increased bifurcations and surface area of the roots at 60–80 cm depth. Water deficit stimulates the expansion of the root system to deeper regions of the soil profile [86,87,88,89]. The emission of root hairs increases the surface area and maximizes water uptake [74].
Under water restriction, nutrient uptake decreases due to transpiration, which reduces mass flow. However, due to the reduction in dry matter mass resulting from water restriction, the reduction in uptake may have a low effect on the tissue nutrient concentration [90]. Thus, the final nutrient concentration in the tissues depends on the relation between the reduction in uptake and dry matter accumulation. If the decrease in uptake is more significant than the reduction in dry matter accumulation, the nutrient concentration in the tissues will be more significantly affected [91]. Here, we found an influence of water regimes on N, P, Ca, Mn, Zn, and Fe levels. On the other hand, water regimes did not affect K, Mg, S, B, and Cu levels, probably due to the decrease in dry matter mass accumulation. However, leaf accumulation of these nutrients, considering dry matter mass, was strongly influenced by water regimes.
Around 40% to 70% of the N and 80% to 90% of the P fertilizers applied are lost to the environment due to variations in soil dynamics [92]. In this sense, the use of B. licheniformis and B. subtilis can minimize these losses and contribute to nutrient uptake, promoting sugarcane growth in the initial phase, with nutritional increases of 14.9% and 10.8%, respectively, compared to the control under the 66% water regime.
Increased P content (13%) was also observed by Santos et al. [93], studying PSS treated with B. subtilis and B. pumilus. In addition, the authors reported greater root growth and an increase in total dry matter in PSS treated with B. subtilis. The Bacillus genus is deeply associated with phosphorus solubilization [94] due to mechanisms such as the production of organic acids, acidification, and chelation [36,95], which increases the nutrient uptake efficiency by the roots, especially under adequate water availability.
As diffusion is the primary means of P-root contact, water availability is indispensable for the successful uptake of this nutrient by the roots; the lower the humidity, the more critical the P diffusion, especially in sandy soils [96,97], which explains the increase in phosphorus availability. In addition, water is mainly required to mineralize organic P through microbial activity [98].
However, PGPB contributed to minimizing this effect in conditions of low water availability since, under severe water stress, there was a 15.3% increase in the P content. Fonseca et al. [36] also found 15% and 33% increases in P content under irrigated and moderate drought conditions, respectively, in PSS inoculated with B. subtilis.
The endogenous P availability influences the N metabolism, so an adequate P supply increases the nitrate uptake from the soil solution, which is transported from the roots to the shoot, with a more significant accumulation of amino acids in the leaves and roots [99,100,101]. This explains the high correlation between N and P contents (R2 = 0.8 **). Nitrogen is essential for forming proteins and enzymes that help plant growth and development [74]. In our study, water availability (66% rate) also contributed to higher N levels under PGPB inoculation, possibly due to the mechanisms above and the higher P levels in this irrigation rate. Rosa et al. [102], assessing the interaction of N and P concentrations in sugarcane leaves inoculated with Azospirillum brasilense, B. subtilis, and Pseudomonas fluorescens as a function of phosphate fertilization, found an increase in N concentration, which resulted in higher agro-industrial quality of the sugarcane.
Singh et al. [103], verifying the potential of nitrogen-fixing rhizobacteria, found that Bacillus species isolated from the root system of sugarcane plants could produce ammonia and showed high nitrogenase activity in vitro. This explains the promotion of N uptake by sugarcane by applying B. licheniformis and B. subtilis [36,81,104]. Under water stress, PGPB promoted a 60.8% increase in N content compared to the control, corroborating Gírio et al. [37], who studied sugarcane PSS inoculated with PGPB associated with the application of N in low-fertility soils and found gains in initial growth, dry matter mass, and root length, regardless of fertilizer application, resulting in a positive physiological effect of the bacteria on sugarcane growth.
The correlation between the contents of N, P, and Zn and SLW, CGR, LA, and PS shows that the increased nutrient concentration resulted in greater thickness, which led to greater net CO2 assimilation, promoting greater survival and a higher crop growth rate. The effect of Bacillus inoculation on the N and P uptake is already well-established, but verifying a high correlation between these nutrients and plant survival elucidates the mechanisms of action of these microorganisms in the survival of pre-sprouted seedlings in the field.
According to Rana et al. [105], Mn and Zn can be supplied to plants by microbial exudates since uptake is carried out directly by microorganisms [106]. In a heavy metal phytoremediation study, Huang et al. [107] reported that two species of the genus Bacillus improved Mn uptake and increased this nutrient content in the leaves and stems of Broussonetia papyrifera. This suggests that the Bacillus species studied promoted a more significant translocation of these nutrients to the shoot. In addition, the increase in root length and surface area seen in inoculated plants is closely linked to the uptake and translocation of micronutrients.
The soil Zn mobility is directly associated with microbial metabolism [108]. Zn uptake and transport in plants occurs in several stages and can be affected by N mediated by microorganisms [105]. There is evidence that the plant N status can positively impact the nutrient translocation between root and shoot and positively affect the root Zn uptake. Rana et al. [105] demonstrated a highly significant correlation between Zn, N, and P concentrations, as observed in our results. This suggests that the improved nutritional status promoted by B. licheniformis and B. subtilis about N and P may have favored Zn uptake.
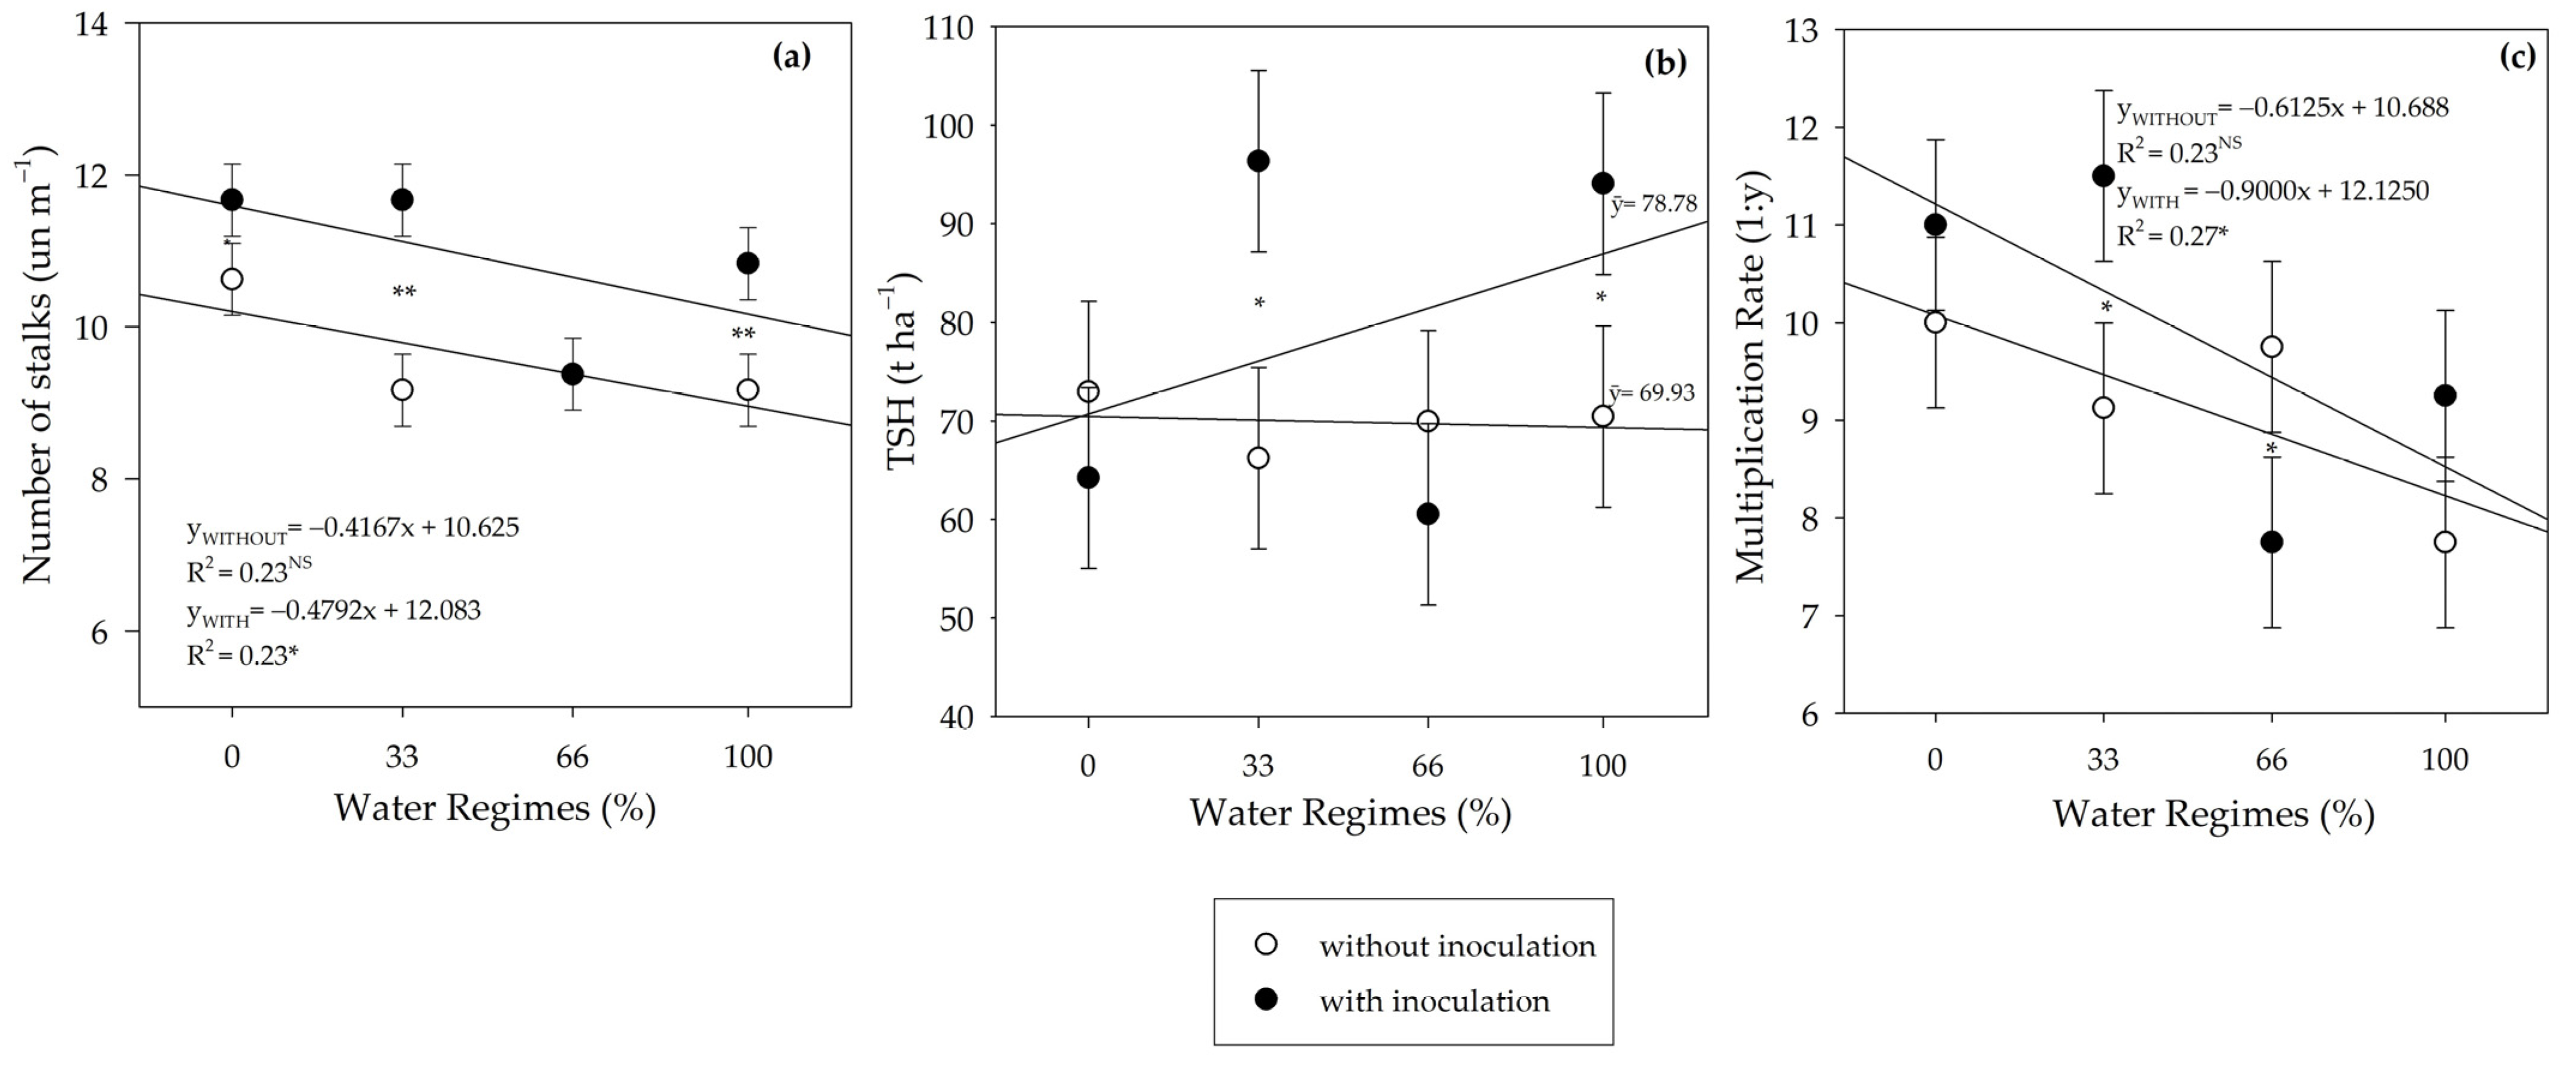
Inoculation did not influence the yield variables SH, SD, NN, and IL at harvest. However, PGPB increased NT under the 33% and 100% water regimes. The number of tillers per meter is a component of productivity that acts as a strong indicator of drought tolerance in sugarcane [109], showing that the increase obtained from PGPB under the 33% water regime demonstrates the tolerance-promoting potential of these species. Other studies have also reported an increase in the number of tillers under inoculation with species of the genus Bacillus [36,41,94,110].
The increase in NT under the 33% and 100% water regimes resulted in higher MEIOSI multiplication rates in these conditions, considering the high level of correlation between these variables (R2 = 0.8 **). It is, therefore, pertinent to emphasize the beneficial effects of B. licheniformis and B. subtilis on PSS in the context of producing basic propagative material for the MEIOSI system. The increased NT results in greater quantities of plant material suitable for subsequent planting throughout the area [58,111].
The different water regimes influenced the NN and, consequently, the IL. The lowest irrigation rates reduced IL. This phenomenon is called curling and is common in water restriction conditions [112]. Therefore, as the multiplication rate is a result of the number of tillers per meter and the number of buds per stalk [58], and lower initial irrigation rates resulted in shorter internodes and a greater number of nodes/buds, the multiplication rate responded with a linearity that was inversely proportional to the water regimes.
All of these findings demonstrate that the synergism between B. licheniformis and B. subtilis favored the sugarcane pre-sprouted seedlings growth in the MEIOSI system, with improved root attributes and nutrient uptake and, therefore, favored the multiplication rate in the MEIOSI system, even under water deficiency.

5. Conclusions

We report how Bacillus licheniformis strain FMCH001 (DSM32154) and Bacillus subtillis strain FMCH002 (DSM32155) increased plant survival and water use efficiency of sugarcane pre-sprouted seedlings in the field. Inoculation with two Bacillus species benefited crop growth in the MEIOSI system, mainly because it increased root attributes and thus favored nutrient uptake such as N, P, Mn, and Zn. In addition, inoculation increased the number of stalks in the initial water regimes by 33% and 100%, which resulted in a higher multiplication rate in the MEIOSI system. In addition to the need to supply water at the beginning of the establishment of sugarcane pre-sprouted seedling areas, sugarcane fields depend on high doses of fertilizers for their proper development, influencing their longevity. Therefore, these results have important implications for sustainability since, in addition to increasing nutrient uptake, this study showed that inoculation with B. licheniformis and B. subtillis is a viable strategy to favor the efficiency of water resources in the formation of sugarcane fields using plant material from pre-sprouted seedlings.

Supplementary Materials

The following supporting information can be downloaded at https://www.mdpi.com/article/10.3390/agriculture14020189/s1, Table S1: Equations for adjusting the leaf area and total dry mass variables for growth analysis.

Author Contributions

Conceptualization: L.C.O.A., C.H.d.C.N. and M.d.A.S.; funding acquisition: M.d.A.S.; methodology: L.C.O.A., C.S.F.B. and M.d.A.S.; investigation: L.C.O.A., H.L.S., C.H.d.C.N., M.R.A.C. and G.F.d.S.; formal analysis: L.C.O.A., H.L.S., C.H.d.C.N. and C.S.F.B.; writing—original draft: L.C.O.A., H.L.S., C.H.d.C.N. and M.d.A.S.; writing—review and editing: L.C.O.A., H.L.S. and M.d.A.S.; project administration: M.d.A.S.; supervision: M.d.A.S. All authors have read and agreed to the published version of the manuscript.

Funding

This research was funded by the Foundation for Agricultural and Forestry Studies and Research (FEPAF) (Proc. FEPAF 1593). M.d.A.S. and G.F.d.S. would like to thank the CNPq (National Council for Scientific and Technological Development) for the “Productivity in Research” fellowship (Proc. 307457/2022-2) and “Scientific Initiation” scholarship (Proc. 125989/2022-9), respectively. We want to thank CAPES (Coordination of Superior Level Staff Improvement) for the “Ph.D.” fellowship for L.C.O.A., C.H.d.C.N., H.L.S. and M.R.A.C. (financing code 001).

Institutional Review Board Statement

Not applicable.

Data Availability Statement

The raw data supporting the conclusions of this article will be made available by the authors on request.

Acknowledgments

We thank the Mid-Tietê Sugarcane Growers Association (ASCANA) for all their assistance during the experimental field phase.

Conflicts of Interest

The authors declare that the research was conducted in collaboration with FMC Corporation (Ribeirão Preto, SP, Brazil) and CHR Hansen (Valinhos, SP, Brazil), which provided product and technical support and are interested in the product’s performance at a biological level.

References

  1. Tilman, D.; Balzer, C.; Hill, J.; Befort, B.L. Global food demand and the sustainable intensification of agriculture. Proc. Natl. Acad. Sci. USA 2011, 108, 20260–20264. [Google Scholar] [CrossRef]
  2. Junginger, M.; Goh, C.S.; Faaij, A. International Bioenergy Trade: History, Status e Outlook on Securing Sustainable Bioenergy Supply, Demand and Markets, 1st ed.; Springer: Amsterdam, The Netherlands, 2014; 233p. [Google Scholar]
  3. Legg, S. IPCC, 2021: Climate Change 2021—The Physical Science Basis. Available online: https://search.informit.org/doi/abs/10.3316/informit.315096509383738 (accessed on 2 February 2023).
  4. Rodrigues, J.D.; Jadoski, C.J.; Fagan, E.B.; Ono, E.O.; Soares, L.H.; Dourado Neto, D. Fisiologia da Produção de Cana-de-açúcar, 1st ed.; Andrei: São Paulo, Brazil, 2018; 177p. [Google Scholar]
  5. Conab. Boletim da Safra de Cana-de-Açúcar. 1st Levantamento: Safra 2023/24. Available online: https://www.conab.gov.br/info-agro/safras/cana/boletim-da-safra-de-cana-de-acucar (accessed on 17 May 2023).
  6. Oliveira, T.B.A.; Selig, P.M.; Barbosa, V.M.; de Souza Campos, L.M.; Bornia, A.C.; de Oliveira, M.W. Tecnologia e custos de produção de cana-de-açúcar: Um estudo de caso em uma propriedade agrícola. Lat. Am. J. Bus. Manag. 2012, 3, 150–172. [Google Scholar]
  7. Shabbir, R.; Javed, T.; Afzal, I.; El Sabagh, A.; Ali, A.; Vicente, O.; Chen, P. Modern Biotechnologies: Innovative and Sustainable approaches for the improvement of sugarcane tolerance to environmental stresses. Agronomy 2021, 11, 1042. [Google Scholar] [CrossRef]
  8. Dinardo-Miranda, L.L.; Vasconcelos, A.C.M.; Landell, M.G.A. Cana-de-Açúcar, 1st ed.; Instituto Agronômico: Campinas, Brazil, 2008; 882p. [Google Scholar]
  9. Landell, M.G.A.; Campana, M.P.; Figueiredo, P. Sistema de Multiplicação de Cana-de-açúcar Com Uso de Mudas Pré-Brotadas (Mpb), Oriundas de Gemas Individualizadas, 1st ed.; Instituto Agronômico: Campinas, Brazil, 2012; 16p. [Google Scholar]
  10. Teixeira, G.C.M.; Prado, R.M.; Rocha, A.M.S.R.; dos Santos, L.C.N.; Sarah, M.M.S.; Gratão, P.L.; Fernandes, C. Silicon in pre-sprouted sugarcane seedlings mitigates the effects of water deficit after transplating. J. Soil Sci. Plant Nutr. 2020, 20, 849–859. [Google Scholar] [CrossRef]
  11. Fraga, A. Startup Planeja Produzir Mais de 1 Bilhão de Mudas Pré-Brotadas de Cana Em 5 Anos. Available online: https://globorural.globo.com/Noticias/Agtech/noticia/2021/02/startup-planeja-produzir-mais-de-1-bilhao-de-mudas-pre-brotadas-de-cana-em-5-anos.html (accessed on 1 December 2021).
  12. Braga, N.C.C.; Severiano, E.C.; Santos, L.S.; Rúbio Neto, A.; Rodrigues, T.M.; Lima, J.D.P. Production of sugarcane seedlings pre-sprouted in comercial and alternative substrates with by-products of the sugarcane industry. Sci. Agric. 2019, 40, 33–48. [Google Scholar] [CrossRef]
  13. Fluminhan, A.; Fluminhan, T.V. A biotecnologia na produção em larga escala de mudas de cana-de-açúcar e a importância da automação dos processos. In Cana-de-açúcar, Expansão, Métodos, Tecnologias E Impactos, 1st ed.; Zacharias, A.A., Piroli, E.L., Dias, L.S., Eds.; ANAP: Tupã, Brazil, 2020; pp. 113–128. [Google Scholar]
  14. Macan, N.P.F.; Ferrarezi, R.S.; Matsura, E.E.; Maia, A.H.N.; Xavier, M.A.; Da Silva, T.P.C.T. Fertilizer recommendations for sugarcane pre-sprouted seedling production in ebb-and-flow subirrigation benches. Sugar Tech. 2020, 22, 976–986. [Google Scholar] [CrossRef]
  15. Barcelos, J.E.T. Meiosi—Cana e Alimentos, método inter-rotacional ocorrendo simultaneamente. Rev. Saccharum 1984, 7, 10–18. [Google Scholar]
  16. Gazola, T.; Cipola Filho, M.L.; Franco Júnior, N.C. Avaliação de mudas pré-brotadas de cana-de-açúcar provenientes de substratos submetidos a adubação química e orgânica. Científica 2017, 45, 300–306. [Google Scholar] [CrossRef]
  17. Martins, A.P.C.; Albrecht, L.P.; Castaldo, J.; Carneiro, R.; Zucareli, V. Novas tecnologias no plantio de cana-de-açúcar (Saccharum spp.). J. Agron. Sci. 2015, 4, 301–317. [Google Scholar]
  18. Otto, R.; Machado, B.A.; da Silva, A.C.M.; De Castro, S.G.Q.; Lisboa, I.P. Sugarcane pre-sprouted seedlings: A novel method for sugarcane establishment. Field Crops Res. 2022, 275, 108336. [Google Scholar] [CrossRef]
  19. Endres, L.; Santos, C.M.D.; Silva, J.V.; Barbosa, G.V.S.; Silva, A.L.J.; Froehlich, A.; Teixeira, M.M. Inter-relationship between photosynthetic efficiency, Δ13C, antioxidant activity and sugarcane yield under drought stress in field conditions. J. Agron. Crops Sci. 2019, 205, 433–446. [Google Scholar] [CrossRef]
  20. Silva, P.P.; Soares, L.; Da Costa, J.G.; Viana, L.S.; De Andrade, J.C.F.; Gonçalves, E.R.; Dos Santos, J.M.; Barbosa, G.V.S.; Nascimento, V.X.; Todaro, A.R.; et al. Path analysis for selection of drought tolerant sugarcane genotypes through physiological components. Ind. Crops Prod. 2012, 37, 11–19. [Google Scholar] [CrossRef]
  21. Dingre, S.K.; Gorantiwar, S.D. Soil misture based deficit irrigation management for sugarcane (Saccharum officinarum L.) in semiarid environment. Agric. Water Manag. 2021, 245, 106549. [Google Scholar] [CrossRef]
  22. Mancosu, N.; Snyder, R.L.; Kyriakakis, G.; Spano, D. Water scarcity future challenges for food production. Water 2015, 7, 975–999. [Google Scholar] [CrossRef]
  23. Popp, A.; Dietrich, J.P.; Lotze-Campen, H.; Klein, D.; Bauer, N.; Krause, M.; Beringer, T.; Gerten, D.; Edenhofer, O. The economic potential of bioenergy for climate change mitigation with special attention given to implications for the land system. Environ. Res. Lett. 2011, 6, 034017. [Google Scholar] [CrossRef]
  24. Goh, C.-H.; Vallejos, D.F.V.; Nicotra, A.B.; Mathesius, U. The impact of beneficial plant-associated microbes on plant phenotypic plasticity. J. Chem. Ecol. 2013, 39, 826–839. [Google Scholar] [CrossRef]
  25. Zilli, M.; Scarabello, M.; Soterroni, A.C.; Valin, H.; Mosnier, A.; Leclère, D.; Havlík, P.; Kraxner, F.; Lopes, M.A.; Ramos, F.R. The impact of climate change on Brazil’s agriculture. Sci. Total Environ. 2020, 740, 139384. [Google Scholar] [CrossRef] [PubMed]
  26. Lamizadeh, E.; Enayatizamir, N.; Motamedi, H. Isolation and identification of plant growth-promoting rhizobacteria (PGPR) from the rhizosphere of sugarcane in saline and non-saline soil. Int. J. Curr. Microbiol. Appl. Sci. 2016, 5, 1072–1083. [Google Scholar] [CrossRef]
  27. Saxena, A.K.; Kumar, M.; Chakdar, H.; Anuroopa, N.; Bagyaraj, D.J. Bacillus species in soil as a natural resource for plant health and nutrition. J. Appl. Microbiol. 2020, 128, 1583–1594. [Google Scholar] [CrossRef] [PubMed]
  28. Michavila, G.; Alibrandi, P.; Cinà, P.; Welin, B.; Castagnaro, A.P.; Chalfoun, N.R.; Noguera, A.S.; Puglia, A.M.; Ciaccio, M.; Racedo, J. Plant growth-promoting bacteria isolated from sugarcane improve the survival of micropropagated plants during acclimatiation. Ital. J. Agron. 2022, 17, 2006. [Google Scholar] [CrossRef]
  29. Vurukonda, S.S.K.P.; Vadharajula, S.; Shrivastava, M.; Skz, A. Enhancement of drought stress tolerance in crops by plant growth promoting rhizobacteria. Microbiol. Res. 2016, 184, 13–24. [Google Scholar] [CrossRef]
  30. Radhakrishnan, R.; Hashem, A.; Abd-Allah, E.F. Bacillus: A biological tool for crop improvement through bio-molecular changes in adverse environments. Front. Physiol. 2017, 8, 667. [Google Scholar] [CrossRef]
  31. Tiwari, S.; Prasad, V.; Chauhan, P.S.; Lata, C. Bacillus amyloliquefaciens confers tolerance to various abiotic stresses and modulates plant response to phytohormones throught osmoprotection and gene expression regulation in rice. Front. Plant Sci. 2017, 8, 2017. [Google Scholar] [CrossRef]
  32. Ferreira, N.C.; Mazzuchelli, R.C.L.; Pacheco, A.C.; Araújo, F.F.; Antunes, J.E.L.; Araújo, A.S.F. Bacillus subtilis improves maize tolerance to salinity. Ciênc Rural 2018, 48. [Google Scholar] [CrossRef]
  33. Saied, A.; Prochownik, E.; Dobrowolska-Iwanek, J. Phosphorus solubilization by Bacillus species. Molecules 2018, 23, 2897. [Google Scholar] [CrossRef]
  34. Gupta, A.; Bano, A.; Rai, S.; Mishra, R.; Singh, M.; Sharma, S.; Pathak, N. Mechanistic insights of plant-microbe interaction towards drought and salinity stress in plants for enhancing the agriculture productivity. Int. J. Mol. Sci. 2022, 7, 3741. [Google Scholar] [CrossRef]
  35. Lim, J.H.; Kim, S.D. Induction of drought stress resistance by multi-functional PGPR Bacillus licheniformis K11 in Pepper. Plant Pathol. J. 2013, 29, 201–208. [Google Scholar] [CrossRef] [PubMed]
  36. Fonseca, M.D.C.; Bossolani, J.W.; De Oliveira, S.L.; Moretti, L.G.; Portugal, J.R.; Scudeletti, D.; De Oliveira, E.F.; Crusciol, C.A.C. Bacillus subtilis inoculation improves nutrient uptake and physiological activity in sugarcane under drought stress. Microorganisms 2022, 10, 809. [Google Scholar] [CrossRef]
  37. Gírio, L.A.D.S.; Dias, F.L.F.; Reis, V.M.; Urquiaga, S.; Schultz, N.; Bolonhezi, D.; Mutton, M.A. Bactérias promotoras de crescimento e adubação nitrogenada no crescimento inicial de cana-de-açúcar proveniente de mudas pré-brotadas. Pesqui. Agropecu. Bras. 2015, 50, 33–43. [Google Scholar] [CrossRef]
  38. Chandra, A.; Chandra, P.; Tripathi, P. Whole genome sequence insight of two plant growth-promoting bacteria (B. subtilis BS87 and B. megaterium BM89) isolated and characterized from sugarcane rhizosphere depicting better crop yield potentiality. Microbiol. Res. 2021, 247, 126733. [Google Scholar] [CrossRef]
  39. Akhtar, S.S.; Amby, D.B.; Hegelund, J.N.; Fimognari, L.; Grobkinsky, D.K.; Westergaard, J.C.; Muller, R.; Moelbak, L.; Liu, F.; Roitsch, T. Bacillus licheniformis FMCH001 increases water use efficiency via growth stimulation in both normal and drought conditions. Front. Plant Sci. 2020, 11, 297. [Google Scholar] [CrossRef]
  40. Liu, J.; Zhang, J.; Zhu, M.; Wan, H.; Chen, Z.; Yang, N.; Duan, J.; Wei, Z.; Hu, T.; Liu, F. Effects of plant growth promoting rhizobacteria (PGCPR) strain Bacillus licheniformis with biochar amendment on potato growth and water use efficiency under reduced irrigation regime. Agronomy 2022, 12, 1031. [Google Scholar] [CrossRef]
  41. Brandi, F.; Heck, D.W.; Ferreira, T.C.; Bettiol, W. Commercial formulations of Bacillus spp. for sugarcane pineapple disease control and growth promotion. Pesqui. Agropecu. Bras. 2018, 53, 1311–1319. [Google Scholar] [CrossRef]
  42. Vekataramappa, R.; Mahadev, N.K.; Venkatesh, S.; Balakrishanan, K.; Suryan, S.; Shivashankar, N.G.; Seshagiri, S. The isolation, characterization and identification of multifaceted halotolerant Bacillus licheniformis and Bacillus wudalianchiensis from rhizospheric soils of Bangalore. J. Microbiol. Biotechnol. Food Sci. 2022, 11, e3553. [Google Scholar] [CrossRef]
  43. Kotterk, M.; Grieser, J.; Beck, C.; Rudolf, B.; Rubel, F. World map of the Köppen-Geiger climate classification updated. Meteorol. Z. 2006, 15, 259–263. [Google Scholar] [CrossRef]
  44. Donagemma, G.K.; Viana, J.H.M.; Almeida, B.G.; Ruiz, H.A.; Klein, V.A.; Dechen, S.C.F.; Fernandes, R.B.A. Análise Granulométrica. In Manual de Métodos de Análise de Solo; Teixeira, P.C., Donagemma, G.K., Fontana, A., Eds.; Embrapa: Brasília, Brazil, 2017. [Google Scholar]
  45. Santos, H.G.; Jacomine, P.K.T.; Anjos, L.H.C.; Oliveira, V.A.; Lumberas, J.F.; Coelho, M.R.; Almeida, J.A.; Araújo Filho, J.C.; Oliveira, J.B.; Cunha, T.J.F. Sistema Brasileiro de Classificação de Solos, 5th ed; Embrapa: Brasília, Brazil, 2018; 356p. [Google Scholar]
  46. Prado, H.; Pádua Junior, A.L.; Garcia, J.C.; Moraes, J.D.; Carvalho, J.D.; Donzeli, P.L. Solos e ambientes de produção. In Cana-de-açúcar; Dinardo-Miranda, L.L., De Vasconcelos, A.C.M., Landell, M.G.A., Eds.; Instituto Agronômico: Campinas, Brazil, 2008; pp. 179–204. [Google Scholar]
  47. Barbosa, A.M.; Zilliani, R.R.; Tiritan, C.S.; Souza, G.M.; Silva, M.A. Energy conversion efficiency in sugarcane cultivars as a function of production environments in Brazil. Renew. Sustain. Energy Rev. 2021, 150, 111500. [Google Scholar] [CrossRef]
  48. van Raij, B.; Andrade, J.C.; Cantarella, H.; Quaggio, J.A. Análise Química Para Avaliação da Fertilidade de Solos Tropicais; Instituto Agronômico de Campinas: Campinas, Brazil, 2001. [Google Scholar]
  49. Vitti, G.C.; Otto, R.; Ferreira, L.R.P. Nutrição E Adubação Da Cana-de-açúcar: Manejo Nutricional Da Cultura Da Cana-de-açúcar; ESALQ: Jaboticabal, Brazil, 2015. [Google Scholar]
  50. Cantarella, H.; Quaggio, J.A.; Mattos, D., Jr.; Boaretto, R.M.; Van Raij, B. Boletim 100: Recomendações de Adubação e Calagem Para o Estado de São Paulo; Instituto Agronômico de Campinas: Campinas, Brazil, 2022. [Google Scholar]
  51. IAC. Boletim Técnico 226; Censo Varietal IAC; Instituto Agronômico Campinas: Campinas, Brazil, 2021. [Google Scholar]
  52. Radford, P.J. Growth analysis formulae—Their use and abuse. Crop Sci. 1967, 7, 171–175. [Google Scholar] [CrossRef]
  53. Hermann, E.R.; Câmara, G.M.D.S. Um método para estimar a área foliar da cana-de-açúcar. STAB-Açú. Álc. Subprod. 1999, 17, 32–34. [Google Scholar]
  54. Portes, T.D.A.; Castro Júnior, L.D. Análise de crescimento de plantas: Um programa computacional auxiliar. Rev. Bras. Fisiol. Veg. 1991, 3, 53–56. [Google Scholar]
  55. van Raij, B.V.; Cantarella, H. Outras culturas industriais. In Boletim 100: Recomendacões de Adubacão e Calagem Para o Estado de São Paulo; Van Raij, B., Cantarella, H., Quaggio, J.A., Furlani, A.M.C., Eds.; Instituto Agronômico de Campinas: Campinas, Brazil, 1997; pp. 233–239. [Google Scholar]
  56. AOAC. Official Methods of Analysis of AOAC International; AOAC International: Rockville, MD, USA, 2016. [Google Scholar]
  57. Tennant, D. A test of a modified line intercept method of estimating root length. J. Ecol. 1975, 63, 995–1001. [Google Scholar] [CrossRef]
  58. CTC. Manual Técnico Meiosi. 2019. Available online: https://ctc.com.br/produtos/storage/2018/09/Manual-de-Boas-Pr%C3%A1ticas-Meiosi-FEV2019-V5.pdf (accessed on 5 September 2022).
  59. Landell, M.D.A.; Silva, M.D.A. As estratégias de seleção da cana em desenvolvimento no Brasil. Vis. Agric. 2004, 1, 18–23. [Google Scholar]
  60. Oliveira, I.N.; De Souza, Z.M.; Bolonhezi, D.; Totti, M.C.V.; De Moraes, M.T.; Lovera, L.H.; Lima, E.S.; Esteban, D.A.A.; Oliveira, C.F. Tillage systems impact on soil physical attributes, sugarcane yield and root system propagated by pre-sprouted seedlings. Soil Tillage Res. 2022, 223, 105460. [Google Scholar] [CrossRef]
  61. James, N.; Umesh, M.; Sarojini, S.; Shanmugan, S.; Nasif, O.; Alharbi, S.A.; Chi, N.T.L.; Brindhadevi, K. Unravelling the potential plant growth activity of halotolerant Bacillus licheniformis NJ04 isolated from soil and its possible use as a green bioinoculant on Solanum lycopersicum L. Environ. Res. 2023, 216, 114620. [Google Scholar] [CrossRef] [PubMed]
  62. Gagné-Bourque, F.; Mayer, B.F.; Charron, J.B.; Vali, H.; Bertrand, A.; Jabaji, S. Accelerated growth rate and increased drought stress resilience of the model grass Brachypodium distachyon colonized by Bacillus subtilis B26. PLoS ONE 2015, 10, e0130456. [Google Scholar] [CrossRef]
  63. Tahir, H.A.S.; Gu, Q.; Wu, H.; Raza, W.; Hanif, A.; Wu, L.; Colman, M.V.; Gao, X. Plant growth promotion by volatile organic compounds produced by Bacillus subtilis SYST2. Front. Microbiol. 2017, 8, 171. [Google Scholar] [CrossRef] [PubMed]
  64. Zubair, A.; Nadeem, M.; Shah, A.A.; Nelofer, R. Statistical optimization, production and characterization of CMCase from mutante Bacillus subtilis ML-1UVb. J. Multidiscip. Appl. Sci. 2019, 11, 18–37. [Google Scholar]
  65. Leontidou, K.; Genitsaris, S.; Papadopoulou, A.; Kamou, N.; Bosmali, I.; Matsi, T.; Madesis, P.; Vokou, D.; Karamanoli, K.; Mellidou, I. Plant growth promoting rhizobacteria isolated from halophytes and drought-tolerant plants: Genomic characterisation and exploration of phyto-beneficial traits. Sci. Rep. 2020, 10, 14857. [Google Scholar] [CrossRef]
  66. Mahapatra, S.; Yadav, R.; Ramakrishna, W. Bacillus subtilis impact on plant growth, soil health and environment: Dr. Jekyll and Mr. Hyde. J. Appl. Microbiol. 2022, 132, 3543–3562. [Google Scholar] [CrossRef]
  67. Almeida Neto, L.A.; Guiselini, D.M.; Cordeiro Júnior, J.J.; Pandorfi, H. Growth of pre-sprouted sugarcane seedlings submitted to suplementary lighting. Rev. Bras. Eng. Agrícola Ambient. 2020, 24, 194–199. [Google Scholar] [CrossRef]
  68. Santos, S.G.; Chaves, V.A.; Ribeiro, F.S.; Alves, G.C.; Reis, V.M. Rooting and growth of pre-germinated sugarcane seedlings inoculated with diazotrophic bacteria. Appl. Soil Ecol. 2019, 133, 12–23. [Google Scholar] [CrossRef]
  69. Rossetto, L.; Pierangeli, G.M.F.; Kuramae, E.E.; Xavier, M.A.; Cipriano, M.A.P.; Silveira, A.P.D.D. Sugarcane pre-sprouted seedlings produced with beneficial bacteria and arbuscular mycorrhizal fungi. Bragantia 2021, 80, e2721. [Google Scholar] [CrossRef]
  70. Ferreira, T.C.; Lago, L.D.; Silva, L.G.; Pacífico, M.G.; Faria, M.R.; Bettiol, W. Potencial de Bacillus spp. em promover o crescimento e controlar Fusarium verticillioides em milho. Summa Phytopathol. 2021, 47, 195–203. [Google Scholar] [CrossRef]
  71. May, A.; Ramos, N.P.; Santos, M.S.; Silva, E.H.F.M.; Rossi, P.; Viana, R.S. Pre-sprouted seedlings production methods through buds or mini-stems emergence and initial development of sugarcane cultivars. Científica 2018, 46, 403–411. [Google Scholar] [CrossRef]
  72. Reis, V.M.; Alves, B.J.; Hartmann, A.; James, E.K.; Zilli, J.E. Beneficial microorganisms in agriculture: The future of plant growth-promoting rhizobacteria. Plant Soil 2020, 451, 1–3. [Google Scholar] [CrossRef]
  73. Santos, R.F.; Carlesso, R. Déficit hídrico e os processos morfológicos e fisiológicos das plantas. Rev. Bras. Eng. Agrícola Ambient. 1998, 2, 287–294. [Google Scholar] [CrossRef]
  74. Taiz, L.; Zeiger, E. Fisiologia e Desenvolvimento Vegetal, 6th ed.; Artmed: Porto Alegre, Brazil, 2017. [Google Scholar]
  75. Pedula, R.O.; Schultz, N.; Monteiro, R.C.; Pereira, W.; de Araujo, A.P.; Urquiaga, S.; Reis, V.M. Growth analysis of sugarcane inoculated with diazotrophic bacteria and nitrogen fertilization. Afr. J. Agric. Res. 2016, 11, 2786–2795. [Google Scholar] [CrossRef]
  76. Whipps, J.M. Carbon economy. In The Rhizosphere; Lynch, J.M., Ed.; John Wiley: Chichester, UK, 1990; pp. 59–97. [Google Scholar]
  77. Aerts, R. Interspecific competition in natural plant communities: Mechanisms, trade-offs and plant-soil feedback. J. Exp. Bot. 1999, 50, 29–37. [Google Scholar] [CrossRef]
  78. Nguyen, C. Rhizodeposition of organic C by plants: Mechanisms and controls. Agronomie 2003, 23, 375–396. [Google Scholar] [CrossRef]
  79. Brunn, M.; Hafner, B.D.; Zwetsloot, M.J.; Weikl, F.; Pritsch, K.; Hikino, K.; Ruehr, N.K.; Sayer, E.J.; Bauerle, T.L. Carbon allocation to root exudates in maintained in mature temperature tree species under drought. New Phytol. 2022, 235, 965–977. [Google Scholar] [CrossRef]
  80. Naveed, M.; Hussain, M.B.; Zahir, Z.A.; Mitter, B.; Sessitsch, A. Drought stress ameloration in wheat through inoculation with Burkholderia phytofirmans strain PsJN. J. Plant Growth Regul. 2014, 73, 121–131. [Google Scholar] [CrossRef]
  81. Di, Y.N.; Kui, L.; Singh, P.; Liu, L.F.; Xie, L.Y.; He, L.L.; Li, F.S. Identification and characterization of Bacillus subtilis B9: A diazotrophic plant growth-primoting endophytic bacterium isolated from sugarcane root. J. Plant Growth Regul. 2023, 42, 1720–1737. [Google Scholar] [CrossRef]
  82. Xie, S.S.; Wu, H.J.; Zang, H.Y.; Wu, L.M.; Zhu, Q.Q.; Gao, X.W. Plant growth promotion by spermidine-producing Bacillus subtilis OKB105. Mol. Plant-Microbe Interact. 2014, 27, 655–663. [Google Scholar] [CrossRef]
  83. Kavar, T.; Maras, M.; Kidrič, M.; Šuštar-Vozlič, J.; Meglič, V. Identification of genes involved in the response of leaves of Phaseolus vulgaris to drought stress. Mol. Plant Breed. 2008, 21, 159–172. [Google Scholar] [CrossRef]
  84. Gowda, V.R.P.; Henry, A.; Yamauchi, A.; Shashidhar, H.E.; Serraj, R. Root biology and genetic improvement for drought avoidance in rice. Field Crops Res. 2011, 122, 1–13. [Google Scholar] [CrossRef]
  85. Bengough, A.G.; Mckenzie, B.M.; Hallett, P.D.; Valentine, T.A. Root elongation, water stress, and mechanical impedance: A revier of limiting stresses and beneficial root tip traits. J. Exp. Bot. 2011, 62, 59–68. [Google Scholar] [CrossRef]
  86. Hoongenboom, G.; Peterson, C.M.; Huck, M.G. Shoot growth rate of soybean as affected by drought stress. Agron. J. 1987, 79, 598–607. [Google Scholar] [CrossRef]
  87. Pimentel, C. A Relação Da Planta Com a ÁGua; EDUR: Seropédica, Brazil, 2004; 191p. [Google Scholar]
  88. Marchiori, P.E.R.; Machado, E.C.; Vendas, C.R.G.; Espinoza-Núñez, E.; Magalhães Filho, J.R.; Souza, G.M.; Pires, R.C.M.; Ribeiro, R.V. Physiological plasticity is importante for mantaining sugarcane growth under water deficit. Front. Plant Sci. 2017, 8, 2148. [Google Scholar] [CrossRef]
  89. Xiong, R.; Liu, S.; Considini, M.J.; Siddique, K.H.; Lam, H.M.; Chen, Y. Root system architecture, physiological and transcriptional traits of soybean (Glycine max L.) in response to water deficit: A review. Physiol. Plant 2021, 172, 405–418. [Google Scholar] [CrossRef]
  90. Kramer, P.J.; Boyer, J.S. Water Relations of Plants and Soils; Academic Press: New York, NY, USA, 1995. [Google Scholar]
  91. Hopmans, J.W.; Bristow, K.L. Current capabilities and future needs of root water and nutrient uptake modeling. Adv. Agronon. 2002, 77, 103–183. [Google Scholar] [CrossRef]
  92. Fageria, N.K. Yield and yield components and Phosphorus use efficiency of lowland rice genotypes. J. Plant Nutr. 2014, 37, 979–989. [Google Scholar] [CrossRef]
  93. Santos, R.M.; Kandasamy, S.; Rigobelo, E.C. Sugarcane growth and nutrition levels are differentially affected by the application of PGPR and cane waste. Microbiol. Open 2018, 7, e00617. [Google Scholar] [CrossRef]
  94. Santos, H.L.; Silva, G.F.D.; Carnietto, M.R.A.; Oliveira, L.C.; Nogueira, C.H.D.C.; Silva, M.D.A. Bacillus velezensis associated with organomineral fertilizer and reduced phosphate doses improves soil microbial—Chemical Properties and biomass of sugarcane. Agronomy 2022, 12, 2701. [Google Scholar] [CrossRef]
  95. Afzal, I.; Shinwari, Z.K.; Sikandar, S.; Sikandar, S.; Shahzad, S. Plant beneficial endophytic bacteria: Mechanisms, diversity, host range and genetic determinants. Microbio. Res. 2019, 221, 36–49. [Google Scholar] [CrossRef]
  96. Ruiz, H.A.; Fernandes, B.; Novais, R.F.; Alvarez, V.V.H. Efeito da umidade do solo sobre o volume e o conteúdo de fósforo no exsudato xilemático de soja. Rev. Bras. Cienc. Solo 1988, 12, 39–42. [Google Scholar]
  97. Malavolta, E. Manual de Nutrição Mineral de Plantas; Agronômica Ceres: São Paulo, Brazil, 2006. [Google Scholar]
  98. Faquin, V. Nutrição Mineral de Plantas; UFLA/FAEPE: Lavras, Brazil, 2005. [Google Scholar]
  99. Malavolta, E.; Vitti, G.C.; Oliveira, S.A.D. Avaliação Do Estado Nutricional Das Plantas: Princípios E Aplicações; Associação Brasileira para Pesquisa da Potassa e do Fosfato: Piracicaba, Brazil, 1997. [Google Scholar]
  100. Oliveira, R.I.; de Medeiros, M.R.F.A.; Freire, C.S.; Freire, F.J.; Simoes Neto, D.E.; de Oliveira, E.C.A. Nutrient partitioning and nutritional requirement in sugarcane. Aust. J. Crop Sci. 2016, 10, 69–75. [Google Scholar]
  101. Oliveira, M.W.; Macêdo, G.A.R.; Martins, J.A.; da Silva, V.S.G.; de Oliveira, A. Mineral Nutrition and Fertilizat. In Sugarcane: Techology and Research; de Oliveira, A., Ed.; IntechOpen: London, UK, 2018; pp. 169–173. [Google Scholar]
  102. Rosa, P.A.L.; Galindo, F.S.; Oliveira, C.E.d.S.; Jalal, A.; Mortinho, E.S.; Fernandes, G.C.; Marega, E.M.R.; Buzetti, S.; Teixeira Filho, M.C.M. Inoculation with plant growth-promoting bacteria to reduce phosphate fertilization requirement and enhance technological quality and yield of sugarcane. Microorganisms 2022, 10, 192. [Google Scholar] [CrossRef] [PubMed]
  103. Singh, R.K.; Singh, P.; Li, H.-B.; Song, Q.-Q.; Guo, D.-J.; Solanki, M.K.; Verma, K.K.; Malviya, M.K.; Song, X.-P.; Lakshmanan, P.; et al. Diversity of nitrogen-fixing rhizobacteria associated with sugarcane: A comprehensive study of plant-microbe interactions for growth enhancement in Saccharum spp. BMC Plant Biol. 2020, 20, 220. [Google Scholar] [CrossRef]
  104. Hossain, G.M.A.; Solaiman, A.R.M.; Karim, A.J.M.S.; Rahman, G.K.M.M.; Mia, M.A.B. Influence of diazotrophic bacteria on growth and biomass production of sugarcane invitro. Int. J. Curr. Microbiol. Appl. Sci. 2020, 9, 3077–3088. [Google Scholar] [CrossRef]
  105. Rana, A.; Saharan, B.; Nain, L.; Prasanna, R.; Shivay, Y.S. Enhancing micronutrient uptake and yield of wheat through bacterial PGPR consortia. J. Soil. Sci. Plant Nutr. 2021, 58, 573–582. [Google Scholar] [CrossRef]
  106. Barber, D.A.; Lee, R.B. The effect of microorganisms on the absorption of manganese by plants. New Phytol. 1974, 73, 97–106. [Google Scholar] [CrossRef]
  107. Huang, H.; Zhao, Y.; Fan, L.; Jun, Q.; Yang, G.; Xu, Z. Improvement of manganese phytoremediation by Broussonetia papyrifera with two plant growth promoting (PGP) Bacillus species. Chemosphere 2020, 260, 127614. [Google Scholar] [CrossRef] [PubMed]
  108. Wyszkowska, J.; Borowik, A.; Kucharski, M.; Kucharski, J. Effect of cadmium, copper and zinc on plants, soil microorganisms and soil enzymes. J. Elem. 2013, 18, 769–796. [Google Scholar] [CrossRef]
  109. Silva, M.A.; Silva, J.A.G.D.; Enciso, J.; Sharma, V.; Jifon, J. Yield componentes as indicators of drought tolerance of sugarcane. Sci. Agric. 2008, 65, 620–627. [Google Scholar] [CrossRef]
  110. Suandara, B.; Natarajan, V.; Hari, K. Influence of phosphorus solubilizing bacteria on the changes in soil available phosphorus and sugarcane and sugar yields. Field Crops Res. 2002, 77, 43–49. [Google Scholar] [CrossRef]
  111. Betiol, O.; Valochi, R.; Michelotto, M.D.; Angeli, C.E.; Bolonhezi, D. Pod yield and aflatoxin in peanut cultivated in different soil tillage under sugarcane renovation in the MEIOSI system. S. Am. Sci. 2021, 2, e21136. [Google Scholar]
  112. Segato, S.V.; Mattiuz, C.F.M.; Mozambani, A.E. Aspectos fenológicos da cana-de- açúcar. In Atualização Em Produção de Cana-de-açúcar; Segato, S.V., Pinto, A.S., Jendiroba, E., Nóbrega, J.C.M., Eds.; CP 2: Piracicaba, Brazil, 2006; 415p. [Google Scholar]
Figure 1. Rainfall (mm), average, maximum, and minimum temperatures (°C), and solar irradiance (MJ m–2 day–1) from August 2021 to April 2022.
Agriculture 14 00189 g001
Figure 2. Sugarcane pre-sprouted seedlings survival in the field under different water regimes and with or without inoculation of Bacillus licheniformis and B. subtilis at 30 DAT. Different letters indicate differences for inoculation by Student’s t-test (p ≤ 0.05). The error bars express the standard deviation of the mean (n = 4). The regression equations and R2 include the water regimes at the 1% significance level (**).
Agriculture 14 00189 g002
Figure 3. Stalk height (a), stalk diameter (b), number of tillers (c), and shoot dry biomass (d) of sugarcane pre-sprouted seedlings in the field under different water regimes and with or without inoculation of Bacillus licheniformis and B. subtilis at 63 DAT. Different letters indicate differences for inoculation by Student’s t-test (p ≤ 0.05). The error bars express the standard deviation of the mean (n = 4). The regression equations and R2 include the water regimes; * and ** indicate significance at 5% (p ≤ 0.05) and 1% (p ≤ 0.01), respectively.
Agriculture 14 00189 g003
Figure 4. Water use efficiency (WUE) of sugarcane pre-sprouted seedlings in the field with or without inoculation of Bacillus licheniformis and B. subtilis under different water regimes at 63 DAT. Different letters indicate differences for inoculation within water regimes by Student’s t-test (p ≤ 0.05). In (a), the error bars express the standard deviation of the mean (n = 4), and in (b), the error bars represent the minimum significant difference. The regression equations and R2 include the water regimes at the 1% significance level (**).
Agriculture 14 00189 g004
Figure 5. Crop growth rate (CGR) of sugarcane pre-sprouted seedlings with or without inoculation of Bacillus licheniformis and B. subtilis under the 0% (a), 33% (b), 66% (c), and 100% (d) water regimes.
Agriculture 14 00189 g005
Figure 6. Relative growth rate (RGR) of sugarcane pre-sprouted seedlings with or without inoculation of Bacillus licheniformis and B. subtilis under the 0% (a), 33% (b), 66% (c), and 100% (d) water regimes.
Agriculture 14 00189 g006
Figure 7. Net assimilation rate (NAR) of sugarcane pre-sprouted seedlings with or without inoculation of Bacillus licheniformis and B. subtilis under the 0% (a), 33% (b), 66% (c), and 100% (d) water regimes.
Agriculture 14 00189 g007
Figure 8. Leaf area ratio (LAR) of sugarcane pre-sprouted seedlings with or without inoculation of Bacillus licheniformis and B. subtilis under the 0% (a), 33% (b), 66% (c), and 100% (d) water regimes.
Agriculture 14 00189 g008
Figure 9. Specific leaf area (SLA) of sugarcane pre-sprouted seedlings with or without inoculation of Bacillus licheniformis and B. subtilis under the 0% (a), 33% (b), 66% (c), and 100% (d) water regimes.
Agriculture 14 00189 g009
Figure 10. Specific leaf weight (SLW) of sugarcane pre-sprouted seedlings with or without inoculation of Bacillus licheniformis and B. subtilis under the 0% (a), 33% (b), 66% (c), and 100% (d) water regimes.
Agriculture 14 00189 g010
Figure 11. Nitrogen (a) and phosphorus contents (b) in leaves of sugarcane pre-sprouted seedlings with or without inoculation of Bacillus licheniformis and B. subtilis under different water regimes at 63 DAT. Different letters indicate differences for inoculation within water regimes by Student’s t-test (p ≤ 0.05 or p ≤ 0.01). The error bars express the standard deviation of the mean (n = 4).
Agriculture 14 00189 g011
Figure 12. Manganese (a) and zinc (b) contents in leaves of sugarcane pre-sprouted seedlings with or without inoculation of Bacillus licheniformis and B. subtilis under different water regimes at 63 DAT. Error bars represent the minimum significant difference. The regression equations and R2 include the water regimes. ** indicates the significance of the regression of water regimes at 1% (p ≤ 0.01).
Agriculture 14 00189 g012
Figure 13. Number of stalks per meter (NSM) (a), tons of stalks per hectare (TSH) (b), and multiplication rate (MR) (c) of sugarcane pre-sprouted seedlings under different water regimes and with or without inoculation of Bacillus licheniformis and B. subtilis. Error bars represent the minimum significant difference. The regression equations and R2 include the water regimes. * and ** indicate significance at 5% (p ≤ 0.05) and 1% (p ≤ 0.01), respectively. NS not significant.
Agriculture 14 00189 g013
Figure 14. Pearson’s linear correlation coefficient (p ≤ 0.05 * and p ≤ 0.01 **) between variables influenced by inoculation with Bacillus licheniformis and B. subtilis. PS: plant survival; WUE: water use efficiency; LA: leaf area; SDB: shoot dry biomass; CGR: crop growth rate; RGR: relative growth rate; NAR: net assimilatory rate; LAR: leaf area rate; SLW: specific leaf weight; SA: root surface area; RV: root volume; N: nitrogen content; P: phosphorus content; Mn: manganese content; Zn: zinc content; NSM: number of stalks for meter; NN: number of nodes; TSH: ton of stalks per hectare; MR: multiplication rate.
Agriculture 14 00189 g014
Table 1. Initial soil chemical analysis from the soil of the experimental area.
DepthpH 1OM 2Al3+H + AlKCaMgSB 3CEC 4V 5Presin 6SCuFeMnZnB
cmCaCl2g dm–1mmolc dm–3%mg dm–3
00–204.812.8020.52.310416.337432290.4646.10.40.28
20–404.69.9017.92.17312.130401270.3635.10.30.31
1 hydrogenionic potential; 2 organic matter; 3 sum of bases; 4 cation exchange capacity; 5 base saturation; 6 method in which phosphorus (P) from a soil sample is extracted using anion exchange resins.
Table 2. Interpretation of the correlation coefficient.
R-Value (+ or −)Interpretation
0–0.25Weak correlation
0.26–0.50Moderate correlation
0.51–0.75Strong correlation
0.76–0.89Very strong correlation
Table 3. Potassium (K), calcium (Ca), magnesium (Mg), and sulfur (S) contents in leaves of sugarcane pre-sprouted seedlings under different water regimes and with or without inoculation of Bacillus licheniformis and B. subtilis at 63 DAT.
TreatmentsKCaMgS
g kg–1
InoculationWith22.743.582.481.43
Without22.273.552.481.34
Water Regimes0%22.473.512.421.33
33%21.533.602.511.41
66%23.433.532.441.38
100%22.573.632.531.41
Table 4. Boron (B), iron (Fe), and copper (Cu) contents in leaves of sugarcane pre-sprouted seedlings under different water regimes and with or without inoculation of Bacillus licheniformis and B. subtilis at 63 DAT.
TreatmentsBFeCu
mg kg–1
InoculationWithout25.9235.587.3
With26.0236.177.05
Water regimes0%25.4035.237.88
33%25.5435.567.64
66%26.3636.456.11
100%26.5836.257.17
R2 − RLNS0.47 **0.11 *
* and ** indicate significance at 5% (p ≤ 0.05) and 1% (p ≤ 0.01), respectively. NS not significant. RL: linear regression. R2: determination coefficient.
Table 5. Nitrogen (N), phosphorus (P), potassium (K), calcium (Ca), magnesium (Mg), and sulfur (S) accumulation in leaves of sugarcane pre-sprouted seedlings under different water regimes and with or without inoculation of Bacillus licheniformis and B. subtilis at 63 DAT.
TreatmentsNPKCaMgS.
mg plant–1
InoculationWithout138.0116.68103.6816.4611.346.25
With179.9421.72127.1620.4614.387.71
Water regimes0%59.687.7370.7111.247.793.99
33%142.5215.08109.9518.6412.937.18
66%145.8022.60122.0018.3912.657.18
100%287.9131.39159.0125.5818.089.58
R2 − RL0.56 **0.57 **0.32 **0.29 **0.28 **0.35 **
** indicates significance at 1% (p ≤ 0.01). RL: linear regression. R2: determination coefficient.
Table 6. Boron (B), manganese (Mn), zinc (Zn), iron (Fe), and copper (Cu) accumulation in leaves of sugarcane pre-sprouted seedlings under different water regimes and with or without inoculation of Bacillus licheniformis and B. subtilis at 63 DAT.
TreatmentsBMnZnFeCu
mg plant–1
InoculationWithout0.120.470.581.641.73 B
With0.150.690.771.982.20 A
Water regimes0%0.090.310.391.000.02
33%0.130.500.661.640.04
66%0.140.640.701.710.03
100%0.190.870.962.910.02
R2 − RL0.29 **0.41 **0.30 **0.42 **0.27 **
Different letters indicate differences for inoculation by Student’s t-test (p ≤ 0.05). ** indicates significance at 1% (p ≤ 0.01). RL: linear regression. R2: determination coefficient.
Table 7. Root length (RL), surface area (SA), area projection (AP), root volume (RV), average root diameter (RD), and number of bifurcations (NBif) of sugarcane pre-sprouted seedlings under different water regimes and with or without inoculation of Bacillus licheniformis and B. subtilis at four depths (0–20, 20–40, 40–60, and 60–80 cm) at 243 DAT.
TraitsTreatments0–2020–4040–6060–80
RL (cm2 cm–3)InoculationWithout3.491.160.380.30
With3.841.660.520.45
Water regimes0%3.871.860.590.67
33%3.811.250.400.33
66%3.701.310.440.28
100%3.261.220.380.22
R2 − RLNSNSNS0.33 **
SA (cm2 cm–3)InoculationWithout0.40 B0.210.070.04
With0.45 A0.220.090.07
Water regimes0%0.470.320.100.10
33%0.390.180.090.05
66%0.430.160.060.04
100%0.410.210.070.03
RL − R2NSNSNS0.26 **
AP (cm2 cm–3)InoculationWithout0.13 B0.060.020.02
With0.14 A0.070.030.02
Water regimes0%0.150.100.030.03
33%0.130.060.030.02
66%0.140.050.020.01
100%0.130.070.020.01
RL − R2NSNSNS0.25 **
RV (cm3 cm–3)InoculationWithout3.7 × 10−4 B4.4 × 10−41.1 × 10−47.2 × 10−4
With4.3 × 10−4 A2.5 × 10−40.00159.0 × 10−5
Water regimes0%4.5 × 10−47.3 × 10−41.7 × 10−41.2 × 10−4
33%3.4 × 10−42.0 × 10−41.9 × 10−41.4 × 10−3
66%4.1 × 10−41.6 × 10−46.0 × 10−56.0 × 10−5
100%4.2 × 10−42.8 × 10−41.0 × 10−44.0 × 10−5
RL − R2NSNSNSNS
SD (cm)InoculationWithout1.8 × 10−41.3 × 10−41.2 × 10−41.0 × 10⁻⁴
With1.9 × 10−41.1 × 10−41.3 × 10−41.1 × 10⁻⁴
Water regimes0%1.9 × 10−41.4 × 10−41.3 × 10−41.2 × 10−4
33%1.7 × 10−41.1 × 10−41.5 × 10−41.0 × 10−4
66%1.8 × 10−41.0 × 10−49.0 × 10−51.0 × 10−4
100%1.9 × 10−41.3 × 10−41.3 × 10−41.1 × 10−4
RL − R2NSNSNSNS
NBif (un cm–3)InoculationWithout24.568.162.651.88
With27.6811.884.043.45
Water regimes0%26.3912.864.374.65
33%31.008.743.092.66
66%25.9410.003.271.97
100%21.148.482.641.39
RL − R2NSNSNS0.27 *
Different letters indicate differences for inoculation by Student’s t-test (p ≤ 0.05). * and ** indicate significance at 5% (p ≤ 0.05) and 1% (p ≤ 0.01), respectively. NS not significant. RL: linear regression. R2: determination coefficient.
Table 8. Stalk length (SL), stalk diameter (SD), number of nodes (NN), internode length (IL), and mass of 10 stalks (M10) of sugarcane pre-sprouted seedlings under different water regimes and with or without inoculation of Bacillus licheniformis and B. subtilis at 245 DAT.
TreatmentsSLSDNNILM10
mMmun stalk–1cmkg
InoculationWithout1.2127.8011.4610.657.58
With1.1727.8210.7510.977.31
Water regimes0%1.1126.6711.099.997.77
33%1.2028.7012.019.957.59
66%1.1827.4111.2710.616.81
100%1.2728.4710.0512.707.61
R2 − RLNSNS0.12 *0.44 **NS
* and ** indicate significance at 5% (p ≤ 0.05) and 1% (p ≤ 0.01), respectively. NS not significant. RL: linear regression. R2: determination coefficient.
Disclaimer/Publisher’s Note: The statements, opinions and data contained in all publications are solely those of the individual author(s) and contributor(s) and not of MDPI and/or the editor(s). MDPI and/or the editor(s) disclaim responsibility for any injury to people or property resulting from any ideas, methods, instructions or products referred to in the content.

