Article

Unmanned Aerial Vehicle-Scale Weed Segmentation Method Based on Image Analysis Technology for Enhanced Accuracy of Maize Seedling Counting

1
Jiangsu Key Laboratory of Crop Genetics and Physiology/Jiangsu Key Laboratory of Crop Cultivation and Physiology, Agricultural College of Yangzhou University, Yangzhou 225009, China
2
Jiangsu Co-Innovation Center for Modern Production Technology of Grain Crops, Yangzhou University, Yangzhou 225009, China
3
Precision Agriculture Lab, TUM School of Life Sciences, Technical University of Munich, 85354 Freising, Germany
4
Key Laboratory of Agricultural Blockchain Application, Ministry of Agriculture and Rural Affairs & Agricultural Information Institute, Chinese Academy of Agricultural Sciences, Beijing 100081, China
*
Author to whom correspondence should be addressed.
Agriculture 2024, 14(2), 175; https://doi.org/10.3390/agriculture14020175
Submission received: 21 December 2023 / Revised: 14 January 2024 / Accepted: 22 January 2024 / Published: 24 January 2024

Abstract

:
The number of maize seedlings is a key determinant of maize yield. Thus, timely, accurate estimation of seedlings helps optimize and adjust field management measures. Differentiating “multiple seedlings in a single hole” of maize accurately using deep learning and object detection methods presents challenges that hinder effectiveness. Multivariate regression techniques prove more suitable in such cases, yet the presence of weeds considerably affects regression estimation accuracy. Therefore, this paper proposes a maize and weed identification method that combines shape features with threshold skeleton clustering to mitigate the impact of weeds on maize counting. The threshold skeleton method (TS) ensured that the accuracy and precision values of eliminating weeds exceeded 97% and that the missed inspection rate and misunderstanding rate did not exceed 6%, which is a significant improvement compared with traditional methods. Multi-image characteristics of the maize coverage, maize seedling edge pixel percentage, maize skeleton characteristic pixel percentage, and connecting domain features gradually returned to maize seedlings. After applying the TS method to remove weeds, the estimated R2 is 0.83, RMSE is 1.43, MAE is 1.05, and the overall counting accuracy is 99.2%. The weed segmentation method proposed in this paper can adapt to various seedling conditions. Under different emergence conditions, the estimated R2 of seedling count reaches a maximum of 0.88, with an RMSE below 1.29. The proposed approach in this study shows improved weed recognition accuracy on drone images compared to conventional image processing methods. It exhibits strong adaptability and stability, enhancing maize counting accuracy even in the presence of weeds.

1. Introduction

Maize, as one of the most important food crops, has an irreplaceable position in national food security, and its output is affected by genetic factors, cultivation methods, and environmental impacts [1,2]. One of the common problems in farmland is that weeds have a negative impact on crop growth and output [3,4,5], especially in maize planting, where a large number of weeds significantly impacts the seedling quality of maize [6,7], an important determinant of seedling growth and development. Therefore, the evaluation of maize seedlings in the presence of weeds is of great significance [8]. The competition of weeds can lead to limitations in light, moisture, and nutrients, which affect normal seedling growth and development. The existence of weeds also puts seedlings at greater risk of mechanical damage and pest infestation, which further reduces the seedling quality of maize [4,9]. Therefore, the quality of maize seedlings depends on accurately evaluating the occurrence of maize, which has important guiding significance for farmers’ reasonable formulation of prevention and control measures and maize production improvement [6,10]. The quantity of seedlings is the most direct and effective evaluation indicator of seedlings, and no efficient seedling counting methods exist in actual production. Moreover, traditional manual investigation is time consuming and laborious, and the operability is poor [11].
Currently, image analysis technology is a crucial tool for quantitative phenotypic research in crops. The study of these quantitative traits includes, but is not limited to, aspects such as the number of seedlings, the number of tillers, and the number of panicles [12,13,14]. For example, automatic counting of the number of wheat seedlings was performed using RGB images; the average accuracy rate in different agricultural processes reached 89.94% [15]. The identity R2 of the number of maize seedlings was 0.89 [16]; the average RMSE of the stems in the wheat multi-birth period was less than nine tillers per square meter [17], the accuracy of the ears of wheat was higher than 90%, and the standard deviation was less than 5% [18]. In another investigation, Liu et al. [19] first cleaned up weeds in a maize field and then obtained images, which reduced the difficulty of counting maize seedlings and limited the scope of the model applicable. Subsequently, Liu et al. [20] used the drone image binding depth to learn the model and efficiently evaluate the number of maize seedlings, the spacing and uniformity of the seedlings, and the seedling status. However, the impact of weeds was not considered. As such, in the number of traits of identification, including soil, water, and especially weeds, the impact on identification accuracy was clear. Thus, how to effectively identify and eliminate weeds is the focus and challenge of quantitative trait research [21,22,23,24].
In an environment where crops and weeds coexist, there are notable similarities in color, texture, and spectral characteristics, making it challenging to distinguish between the two based on singular features [25,26,27,28]. Additionally, the aforementioned features exhibit limited generalizability to other datasets, resulting in significant variation in performance when applied to different datasets. Tang et al. [29], in order to solve the instability of the artificial design characteristics and the problem of weak generalization ability, proposed a miscellaneous mixed model with a combination of characteristic learning and convolutional neural networks. The weed recognition model was applied to soybean and its accompanying weed recognition, and the accuracy rate of recognition reached 92.89%, proving the superiority of the convolutional characteristics. Moreover, Espejo-Garcia et al. [23] proposed a method that combines agricultural transfer learning with artificial images created by generative adversarial networks (GANs) to solve the problem of accurate weed identification in the absence of data sets; Jiang et al. [30] proposed a convolutional neural network (CNN)-based graphics convolution network (GCN) method. The method performed well on four different weed datasets, and its running time was greatly shortened compared with that of other deep learning models; compared with dry land weeds, the environment of aquatic weeds brought more interference factors. Further, Peng et al. [31] proposed a model based on RetinaNet named Weeddet. This model improves the feature extraction capabilities of the main network, characteristic pyramid network, and detection head to process complex information in the image. It also reduces the structure of the characteristic pyramid and the detection head and improves the detection speed. The model achieved 94.1% of the high MAP and a 24.3 FPS reasoning time, which are better values than those achieved by other rice and weed detection models. Further, Yu et al. [32] used multi-spectrometer information to build a vegetation index to effectively distinguish the rice fields and weeds; the accuracy of recognition reached 93.47%, and the Kappa coefficient was 0.859. This method can provide theoretical support for the rational spraying of herbicides and reduce damage to the environment. Compared with the conventional feature method, the deep learning network has obvious advantages in weed identification accuracy, but its huge computational load and early database preparation make it ineffective [33,34]. Further, it is not easy to promote in actual production, so image processing methods based on conventional features are also constantly improving. Similarly, Zamani and Baleghi [35] optimized and screened morphological characteristics, spectral characteristics, texture characteristics, and thermal symbols through genetic algorithms and using extreme learning machines (ELM). The network realized high-precision identification of rice and weeds with 98.08% accuracy.
Currently, in the actual production of maize, to ensure germination rates, the phenomenon of “multiple seedlings in one single hole” still exists with high frequency. The counting of seedlings in this situation is a challenge, primarily because two seedlings overlap, making it difficult to separate seedlings through deep learning or semantic segmentation. Therefore, in our research, we have attempted to find relevant features for regression-based counting. However, this method’s accuracy is highly susceptible to the influence of weeds.
Against this background, this paper proposes a method that combines shape features with threshold skeleton clustering to mitigate the impact of weeds. We utilize these features to achieve regression counting for maize. Additionally, by increasing the flight height of unmanned aerial vehicles (UAVs) to improve the efficiency of image data acquisition while ensuring the accuracy of weed segmentation, we achieve an efficient and precise evaluation of maize germination status. This approach provides a scientific basis for corn field management.

2. Material and Methods

2.1. Experimental Site

The field experiment was conducted at the experimental base of Yangzhou University in Yangzhou City, Jiangsu, China (32°30′ N, 119°25′ E, elevation 21 m). The region is characterized by a subtropical monsoon-influenced humid climate, with an average annual temperature ranging from 14.8–15.3 °C and an average annual precipitation of 961–1048 mm. The experimental plot was a maize breeding field consisting of 310 subplots. Each subplot contained 12 holes, with two seeds planted per hole. The row spacing was 0.6 m, and the plant spacing was 0.4 m. Conventional high-yield cultivation methods were applied for other aspects of water and fertilizer management. To investigate maize seedling counting under weed occurrence conditions, we did not apply herbicide during the seedling stage.

2.2. Image Acquisition

Image collection was divided into near-ground manual image acquisition and route-planning collection. Near-ground manual image acquisition was carried out using a DJI Mavic 3E (DJI, Shenzhen, China). The drone was equipped with a 1/2 CMOS telephoto camera with an equivalent focal length of 162 mm, in addition to 12 million px, supported 56× hybrid zoom, and an RTK module; this could provide centimeter-level positioning. We flew the drone to a height of 10 m and used 7× optical zoom to acquire images of each community, obtaining a total of 310 images.
Route planning and collection were also carried out using the DJI Mavic 3E (DJI, Shenzhen, China). The drone platform uses the autopilot system to perform scheduled tasks. The flight mission was created and uploaded through the DJI Pilot 2 ground control station. The flight altitude of this mission was 12 m, the heading overlap rate was 70%, and the side overlap rate was 70%. The image was acquired in clear weather from 11:00 to 13:00 on 7 May 2023. In this study, DJI Terra (V3.6) was used for image splicing. The software provides centimeter-level reconstruction, which can effectively avoid image distortion and accurately present the details of maize and weeds, improving recognition accuracy (Figure 1a).
In the experimental design, 310 plots had the same planting area. ArcGIS 10.7 (Environmental Systems Research Institute, Inc., Redlands, CA, USA) was used to mark the maize planting area, and ENVI 5.6 (Exelis Visual Information Solutions, Inc., Boulder, CO, USA) was used for clipping. The cropped planting area data were small and easy to process and could effectively improve the extraction efficiency of seedling counting parameters (Figure 1a).

2.3. Image Processing Workflow

At the seedling stage of maize growth, the predominant weeds encountered in maize fields included Digitaria sanguinalis and Plantago asiatica. The distribution of these weeds exhibited irregular patterns, as illustrated in Figure 2. This study focused on maize as the target of detection and broadly categorized the weed distribution into two types: (1) discrete weeds, located at a distance from the maize plants, and (2) weeds found in close proximity or adhering to the maize plants. Consequently, before performing maize counting, we had to segment and eliminate weeds belonging to these two scenarios. In this study, a method was developed for detecting the presence of weeds, while the maize detection and counting approach is presented in Figure 1.

2.3.1. Method for Removing Discrete Weeds

To enhance the accuracy of background removal in the maize planting plot images, we employed a specific method in this study. Initially, the plot images were converted from the RGB color space to the L*A*B color space. Subsequently, K-means clustering was applied as an image segmentation technique to eliminate the soil background. Owing to the similarity in color features between weeds and maize, solely relying on color features cannot ensure the complete removal of all weeds. In this growth stage, weeds exhibit distinct differences in appearance and size compared with maize seedlings. Therefore, shape features such as MajorAxisLength and Area were utilized to differentiate and identify weeds from maize. This method effectively eliminates isolated weeds from the images.

2.3.2. Method for Removing Attached Weeds

After the elimination of discrete weeds, certain weeds remained connected to the maize plants, forming a unified entity. To fully extract the maize seedlings, we performed additional processing steps to address the issue of weed–maize adhesion. This section primarily encompasses the following procedures: (1) contour extraction of maize seedlings; (2) skeleton extraction; (3) application of the Harris corner detection algorithm to identify the inflection points of the skeleton, where the centroids were subsequently marked based on the characteristics of the connected domain; (4) removal of short branches in the original skeleton based on the distance between the branching points and centroids (DC, Equation (1)), as well as the lengths of the skeleton branches (BL, Equation (2)) (Equation (3)); (5) employing K-means clustering on all the pixels within the connected domains of maize and weeds, as well as the pixels within the skeleton (Equation (4)); and (6) color restoration of the clustered results.
D C = x 2 x 1 2 + y 2 y 1 2
B L = x 4 x 3 2 + y 4 y 3 2
{ D C   >   100 ,   I n f l e c t i o n   p o i n t   r e t e n t i o n B L     85 ,   B r a n c h   d e l e t i o n
E u c l i d e a n   D i s t a n c e = sqrt ( x 1 y 1 ) 2 + ( x 2 y 2 ) 2 + + ( x n y n ) 2
Here, x1, y1; x2, y2; …; xn, yn represent the corresponding point coordinates in the binary image.

2.3.3. Evaluation of the Weed Removal Effect

In this study, the weed removal effect was evaluated using parameters such as accuracy, precision, false positive rate (FPR), and false negative rate (FNR). The evaluation equations are as follows:
A c c u r a c y   =   T P   + T N /   N
P r e c i s i o n   =   T P   /   T P   +   F P
F P R   =   F P     F P   +   T N
F N R   =   F N     F N   +   T P
where TP is the number of pixels correctly identified as maize (true positive); FP is the number of pixels incorrectly identified as maize when they were actually weeds (false positive); TN is the number of pixels correctly identified as weeds (true negative); FN is the number of pixels incorrectly identified as weeds when they were actually maize (false negative); and N is the total number of pixels in the image region containing both weeds and maize.

2.3.4. Counting of Maize Seedlings

Owing to the field management requirements of maize planting, maize plant spacing is relatively large, and maize leaves are smaller in the seedling stage. Overlapping and adhesion of different plants rarely occur. However, in actual production, differences exist in sowing quality, which results in differences in the number of seedlings per hole. It is not unique, and there will be overlap and adhesion, so it is difficult to count only through a certain image feature. To compare the impact of weeds on maize seedling number detection, this study used four shape parameters as a multivariate linear model to estimate the number of seedlings: the number of connected domains (NC), maize coverage (Mc), maize seedling edge pixel percentage (Me), and maize skeleton feature pixel percentage (Ms). Equations (9)–(11) were used to extract maize morphological information for each subregion:
M c i = P c i P s m
M s i = P s i P s m
M e i = P e i P s m
where Pc(i) is the number of pixels in the maize region of subregion i; Ps(i) is the number of pixels in the maize skeleton of subregion I; Pe(i) is the number of pixels in the maize edge feature of subregion i; Psm is the size of the subregion image; Mc(i) is the maize coverage for subregion i; Ms(i) is the percentage of a skeleton image feature for subregion i; and Me(i) is the percentage of edge image features for subregion i.
M c = M c i M c m i n M c m a x M c m i n
M s = M s i M s m i n M s m a x M s m i n
M e = M e i M e m i n M e m a x M e m i n
Here, Mc(min) is the minimum value of the maize coverage parameter for each image; Ms(min) is the minimum value of the skeleton image feature parameter for each image; Me(min) is the minimum value of the edge image feature parameter for each image; Mc(max) is the maximum value of the maize coverage parameter for each image; Ms(max) is the maximum value of the skeleton image feature parameter for each image; and Me(max) is the maximum value of the edge image feature parameter for each image.
By utilizing the above parameters, we could employ a multivariate stepwise regression to estimate the number of maize seedlings.

2.3.5. Evaluation of Maize Seedling Counting Accuracy

The manual counts of maize seedlings in each plot were considered the ground truth data. The data were divided into two equal parts, with 50% used for modeling and the remaining 50% for validation. The evaluation metrics employed to assess the accuracy of different weed treatment methods were root mean squared error (RMSE), mean absolute error (MAE), coefficient of determination (R2), and accuracy rate. These metrics were calculated using Equations (15)–(20):
R M S E = 1 m i = 1 m ( p y i t y i ) 2
M A E = 1 m i = 1 m ( p y i t y i )
S S E = i = 1 m ( p y i ty i ) 2
S S T = i = 1 m ( ty i y ¯ ) 2
R 2   =   1   S S E S S T
Accuracy   rate   = 1 y ^ i y i y i 100 %
where m is the total number of plots; pyi is the predicted value by the model for the ith plot; tyi is the actual measured value for the ith plot; and y ¯ is the mean value of the actual measurements.
The aforementioned variables were used in the calculation of evaluation metrics such as RMSE, MAE, and R2.

3. Results and Analysis

3.1. Discrete Weed Segmentation Results

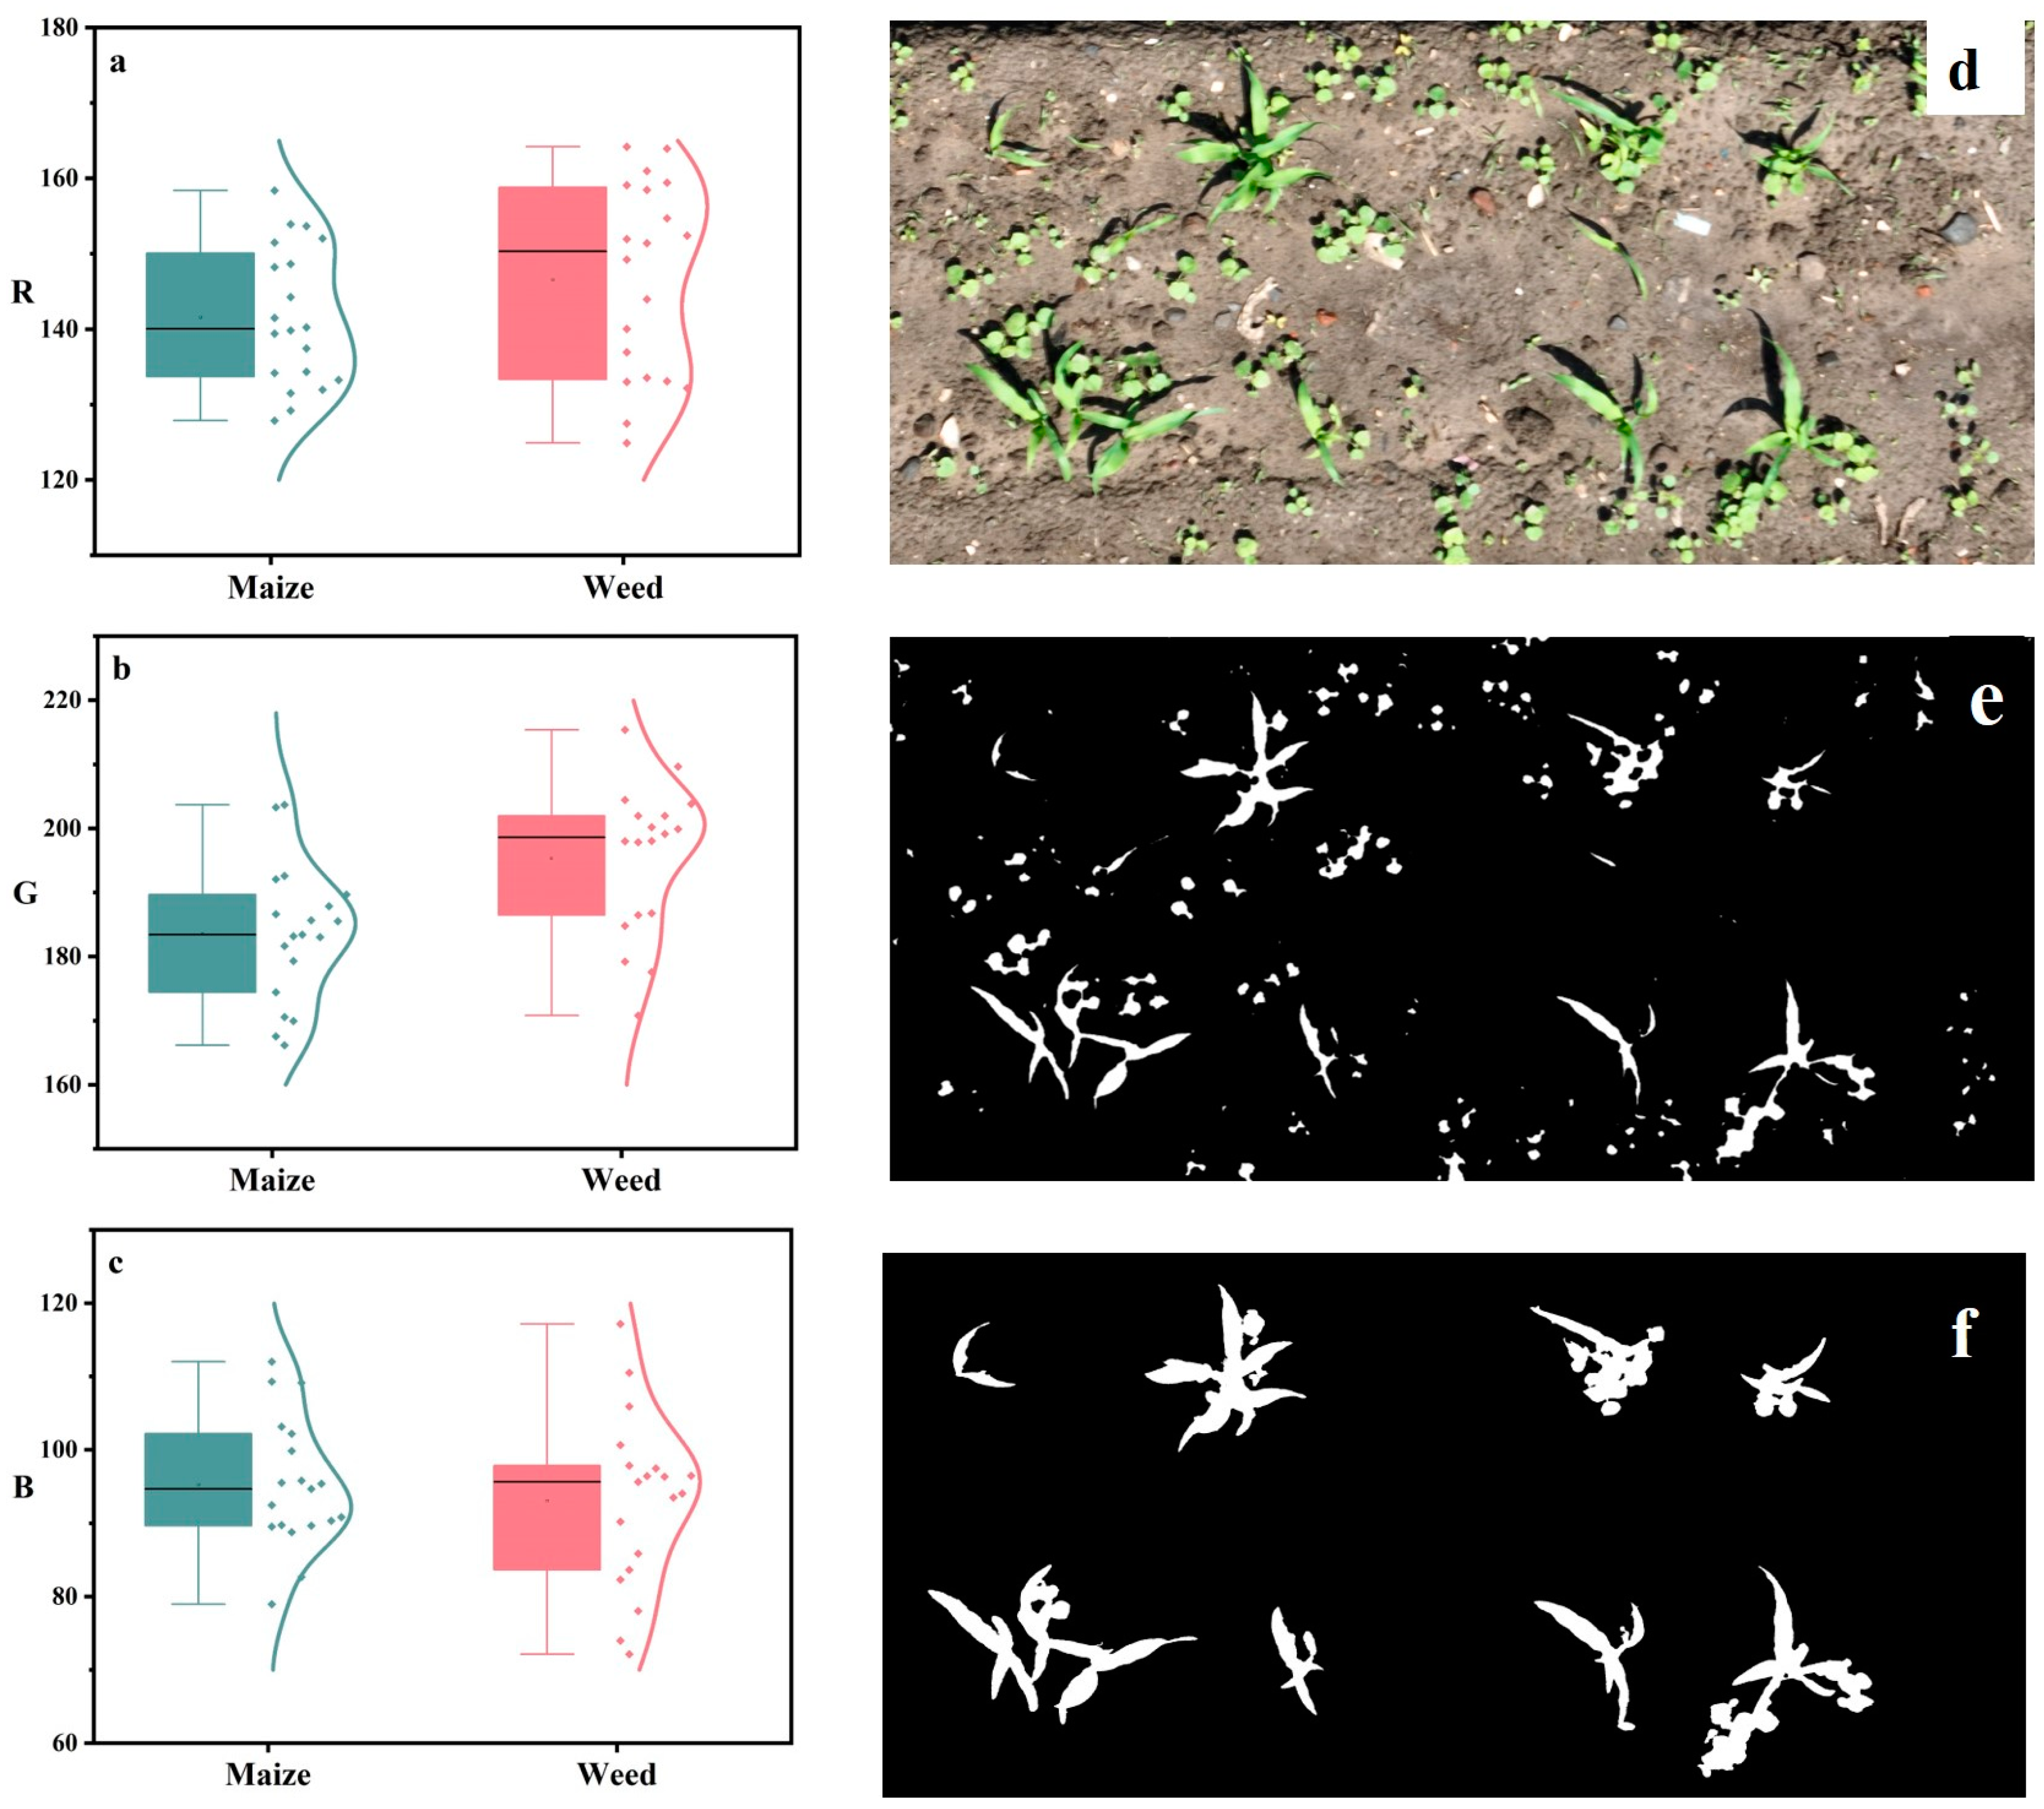
Weeds are the main interference that affects seedling counting, making it challenging to use conventional image analysis methods for maize seed counting. By comparing the color features of weeds and maize (Figure 3d), we observed a high overlap in the R color component (Figure 3a) between weeds and maize in the range of 120–160. The G color component (Figure 3b) for both weeds and maize fell within the range of 160–200. The B color component (Figure 3c) showed values between 70 and 110 for both weeds and maize. Consequently, we observed a limited color difference between maize leaves and weeds, making it difficult to effectively eliminate weeds based on color features alone (Figure 3e).
Some weeds, such as Digitaria sanguinalis, posed a greater challenge in terms of segmentation owing to their similar leaf morphology to maize. Both maize leaves and these weed species had elongated shapes. However, the projection area of these weeds in the image was significantly smaller than that of maize plants. Therefore, the “Area” feature could effectively distinguish between the elongated weeds and maize. Additionally, some weeds, like Plantago asiatica, had circular leaves. These weeds exhibited distinct overall contours compared with those of maize. Hence, differentiation could be achieved by utilizing the “MajorAxisLength” feature. By leveraging these specific shape-related features, we could discriminate between maize and weeds exhibiting similar leaf structures.
The key to using the “MajorAxisLength” feature and “Area” feature parameters for dividing maize and weeds was to determine the accurate threshold and sort the order of “MajorAxisLength” values in all representative communities. Accordingly, when the slope decrease between two points suddenly decreases, the two adjacent regions belong to different categories. Next, a comparison of multiple groups revealed that when the “MajorAxisLength” feature value was 30, the split effect was the best (Figure 3f). On this basis, adding the “Area” feature parameter to assisted weeds and maize segments could effectively reduce the effects of certain weed and maize shape similarity.

3.2. Segmentation Results for Adherent Weeds

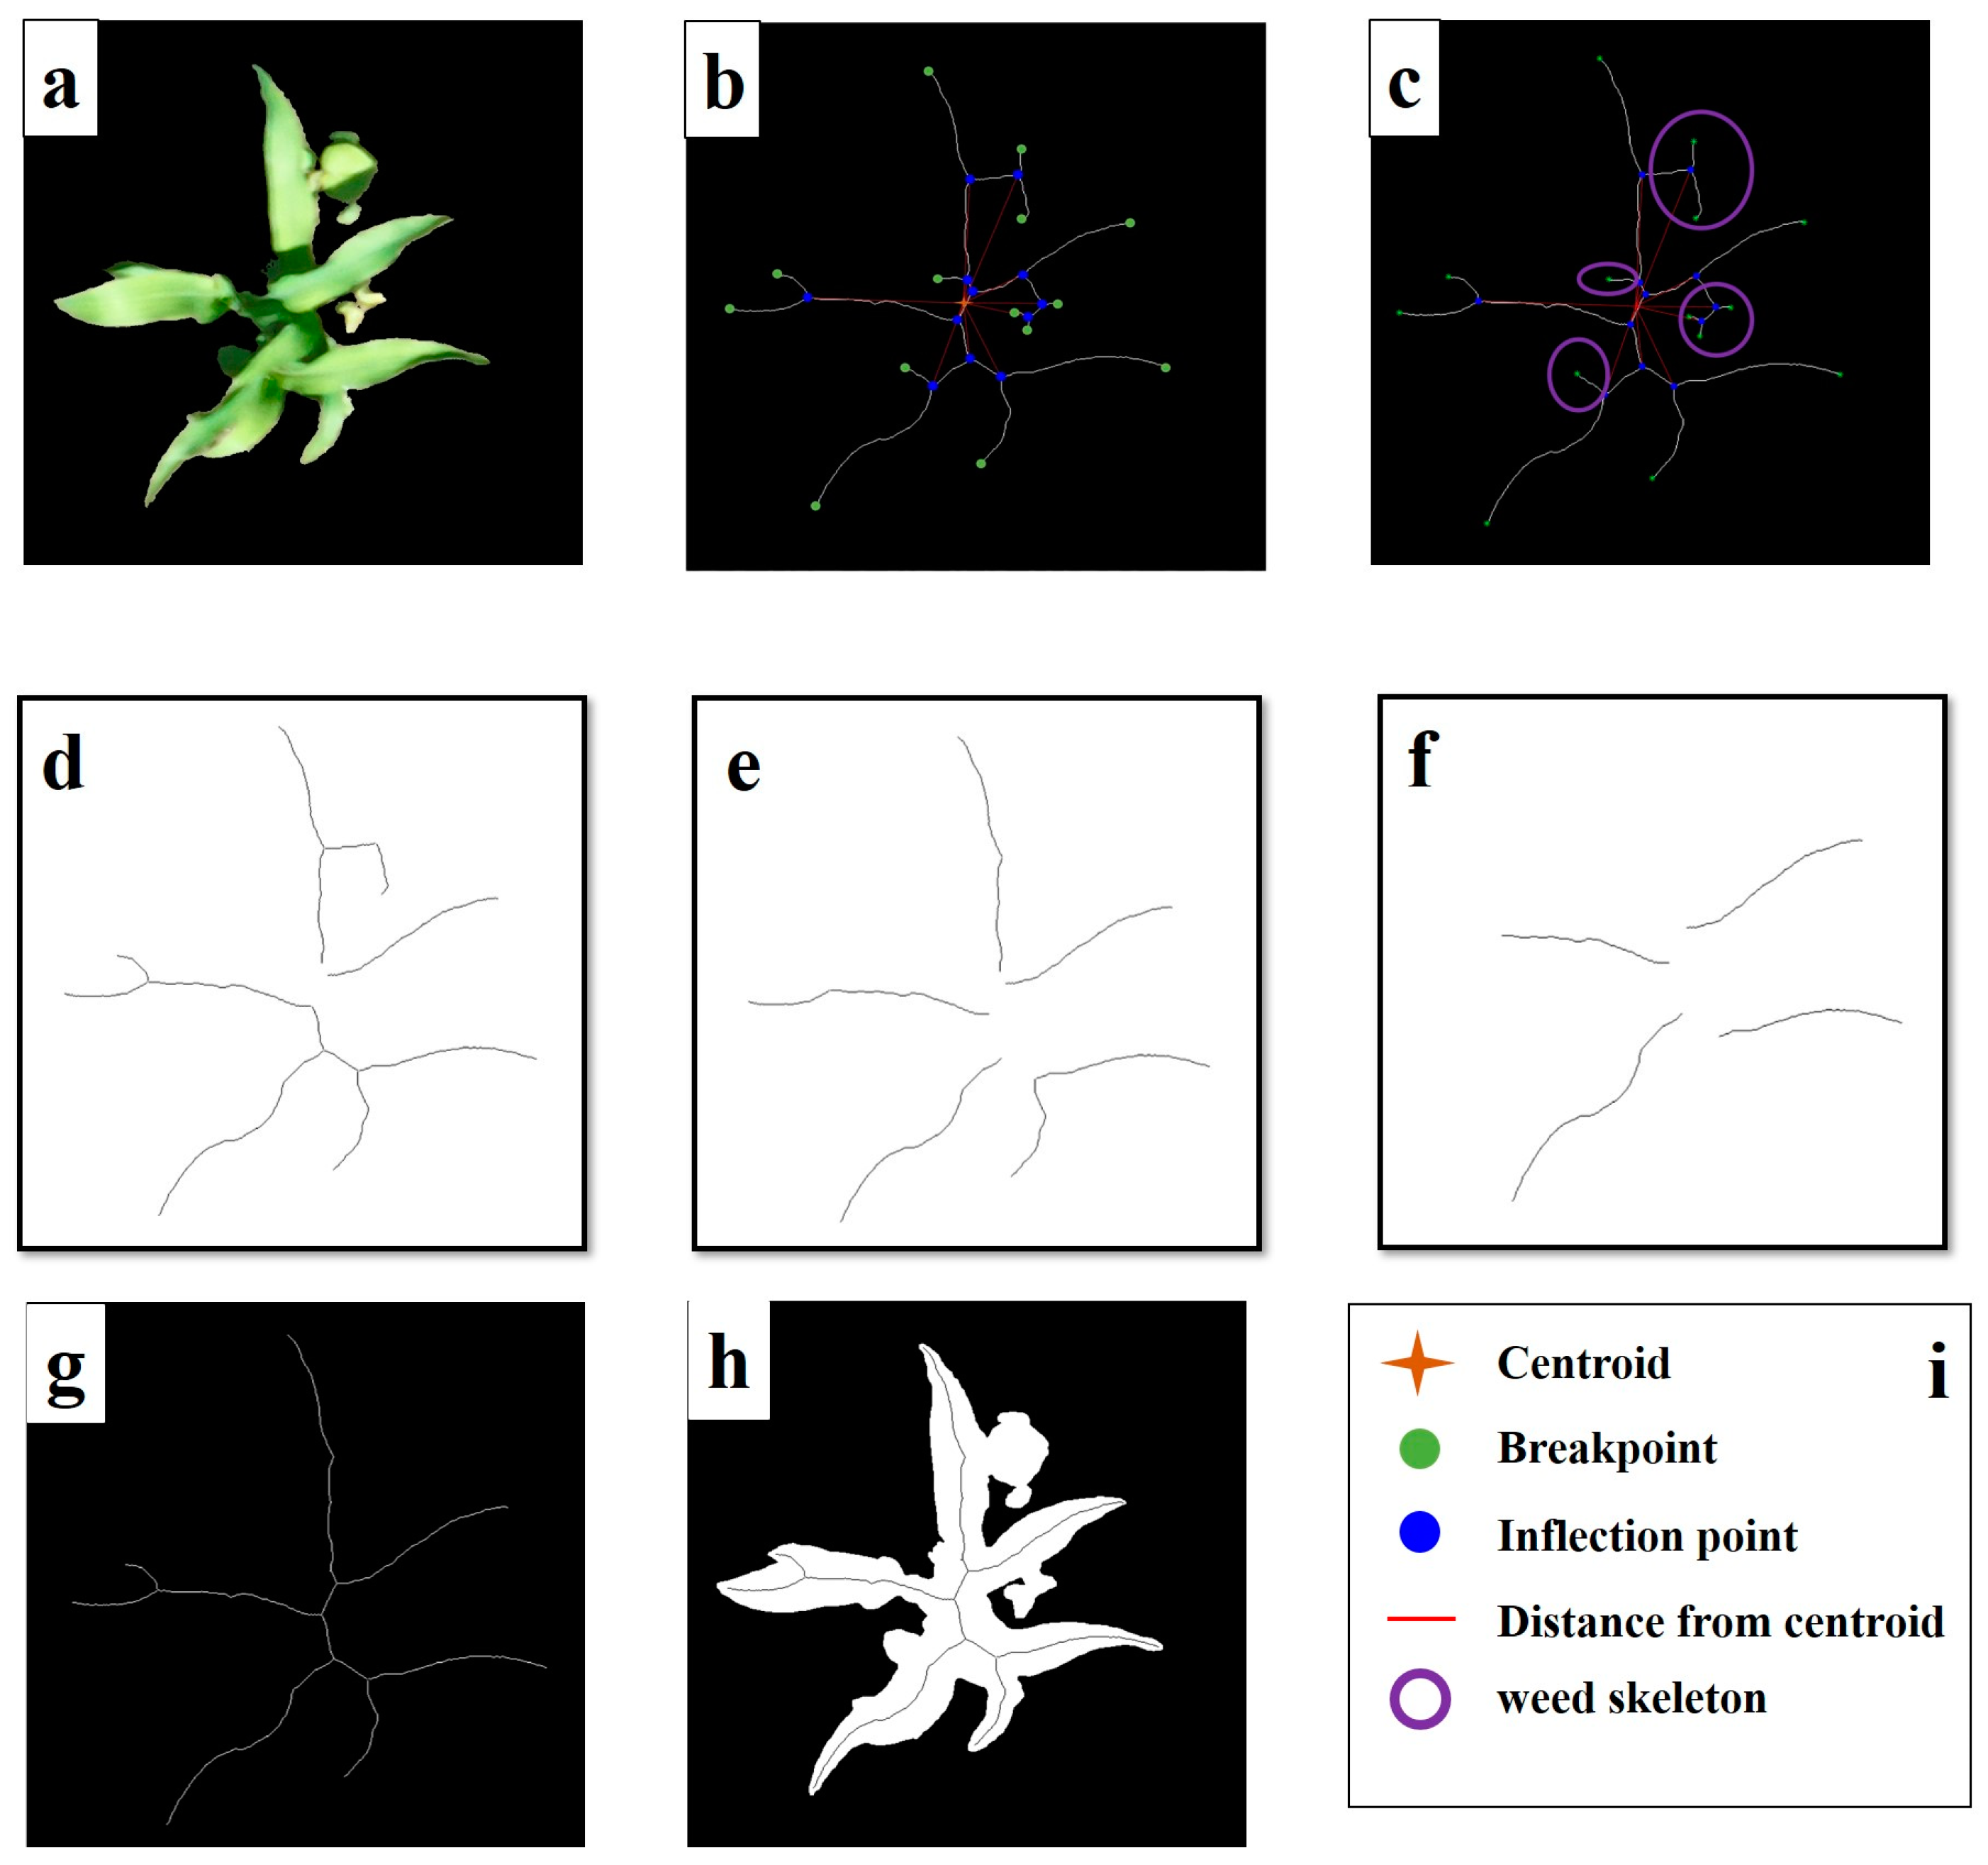
In Figure 4a, maize and weeds exhibit significant adhesion, which greatly affects the accurate counting of maize seedlings. To address this issue, we propose a skeleton-distance-based segmentation method, combined with distance clustering, to eliminate adherent weeds, hereafter referred to as the TS method.
In this study, the analysis focused on the skeleton of a single maize plant with adhesions, as depicted in Figure 4b. Within the image, the blue points represent inflection points in the skeleton, the green points indicate breakpoints, and the orange four-pointed star denotes the center of mass of the entire skeleton. Notably, the skeleton belonging to weeds within the overall structure was characterized by a shorter length. Consequently, by disconnecting the entire skeleton at the coordinates of the inflection points, we could separate the weed and maize skeletons. Note that the shorter skeleton closer to the center of mass did not pertain to the weed skeleton but to the center of the maize plant where new blades were extending. Hence, when eliminating the short skeleton, this specific portion of the skeleton had to be retained. The skeletons connected to breakpoints and possessing a shorter length were indicative of weed skeletons (as highlighted by the skeletons in the purple circle, Figure 4c). By appropriately selecting a threshold, we could effectively remove the weed skeletons. The procedure started by connecting each inflection point to the center of mass, calculating the distance (referred to as DC) between the two points, and sorting all DCs in descending order. The inflection point corresponding to the shorter DC was considered the internal position of the maize skeleton. When disconnecting the skeleton at the coordinates of the inflection points, we had to disregard the corresponding inflection points (Figure 4c), while the remaining inflection points were used to cut the skeleton. By sorting the lengths of the broken skeletons (referred to as BL) in descending order, we found that shorter BL values represented the weed skeleton and had to be discarded. However, when DC = 50 and BL = 50 (Figure 4d), a portion of the weed skeleton was still retained and had not been completely eliminated. Similarly, for the cases where DC = 50 and BL = 80 (Figure 4e) and where DC = 50 and BL = 200 (Figure 4f), the skeleton at the center of the maize and the skeleton corresponding to the maize leaf position were eliminated, respectively. Based on an analysis of multiple sets of adherent weed images, we set the segmentation threshold for DC to 100 and the threshold for BL to 85. By applying these thresholds, we could obtain a segmented skeleton representative of the maize plant’s skeleton (Figure 4g). At this stage, successful extraction of the complete maize skeleton had been achieved.
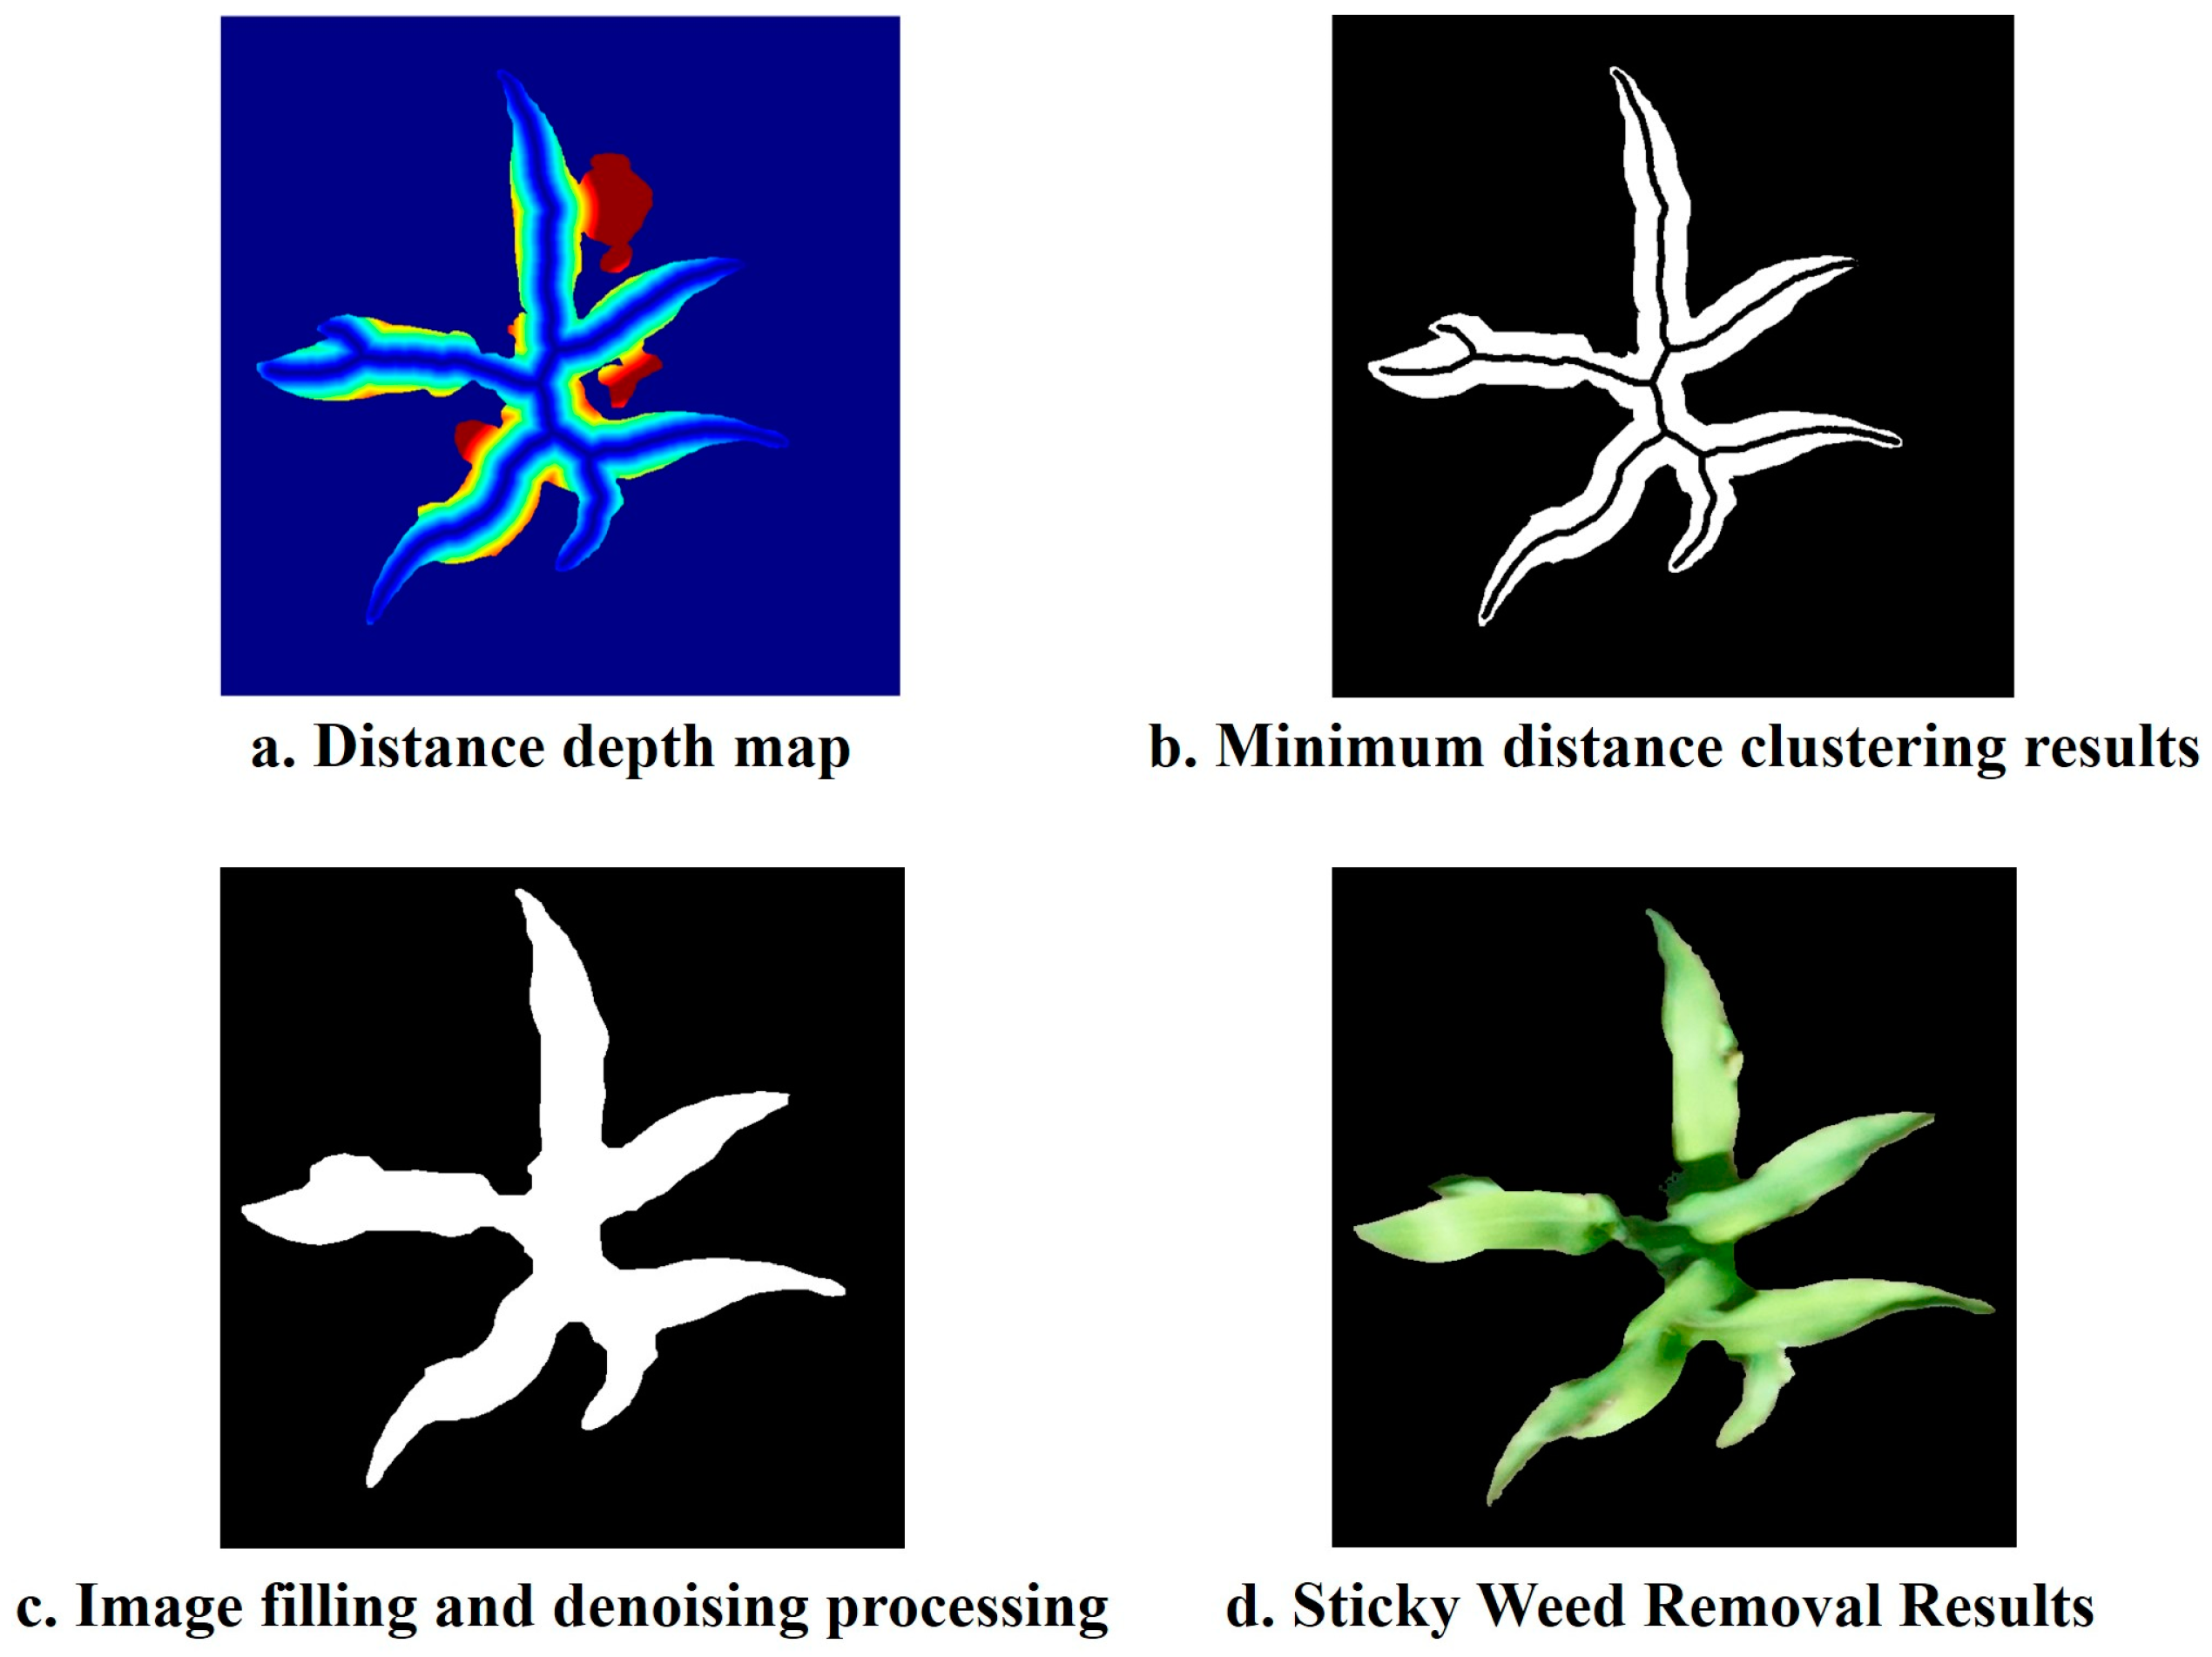
In Figure 4h, the black lines represent the maize skeleton, while the white regions represent the connected components of weeds and maize. The shortest distance between each pixel in the white regions and the skeleton was calculated, and the colors in Figure 5a represent the magnitude of the distances, with red indicating greater distances. The weed regions generally appeared red, while the maize regions appeared blue, indicating a noticeable distinction between the two. To remove the adherent weed regions from the maize regions, we used the K-means clustering algorithm to classify the minimum distances. This led to the extraction of connected weed regions from the maize regions (Figure 5b). The resulting clustered image was then filled and denoised to create a masked image of the maize plants (Figure 5c). Finally, the weed-adherent maize plants were segmented by applying the mask to color the respective areas (Figure 5d).
The presented approach effectively and accurately removed weeds and adherent weeds, as demonstrated by the segmentation results of four representative adhesive scenarios in Figure 6. Cases 1 and 2 represent mild adhesion, while cases 3 and 4 depict severe adhesion. From the obtained results, it can be observed that the method proposed in this study exhibited high applicability across different levels of adhesion. Therefore, it proved to be an efficient weed segmentation method.

3.3. Comparison of Different Weed Removal Methods

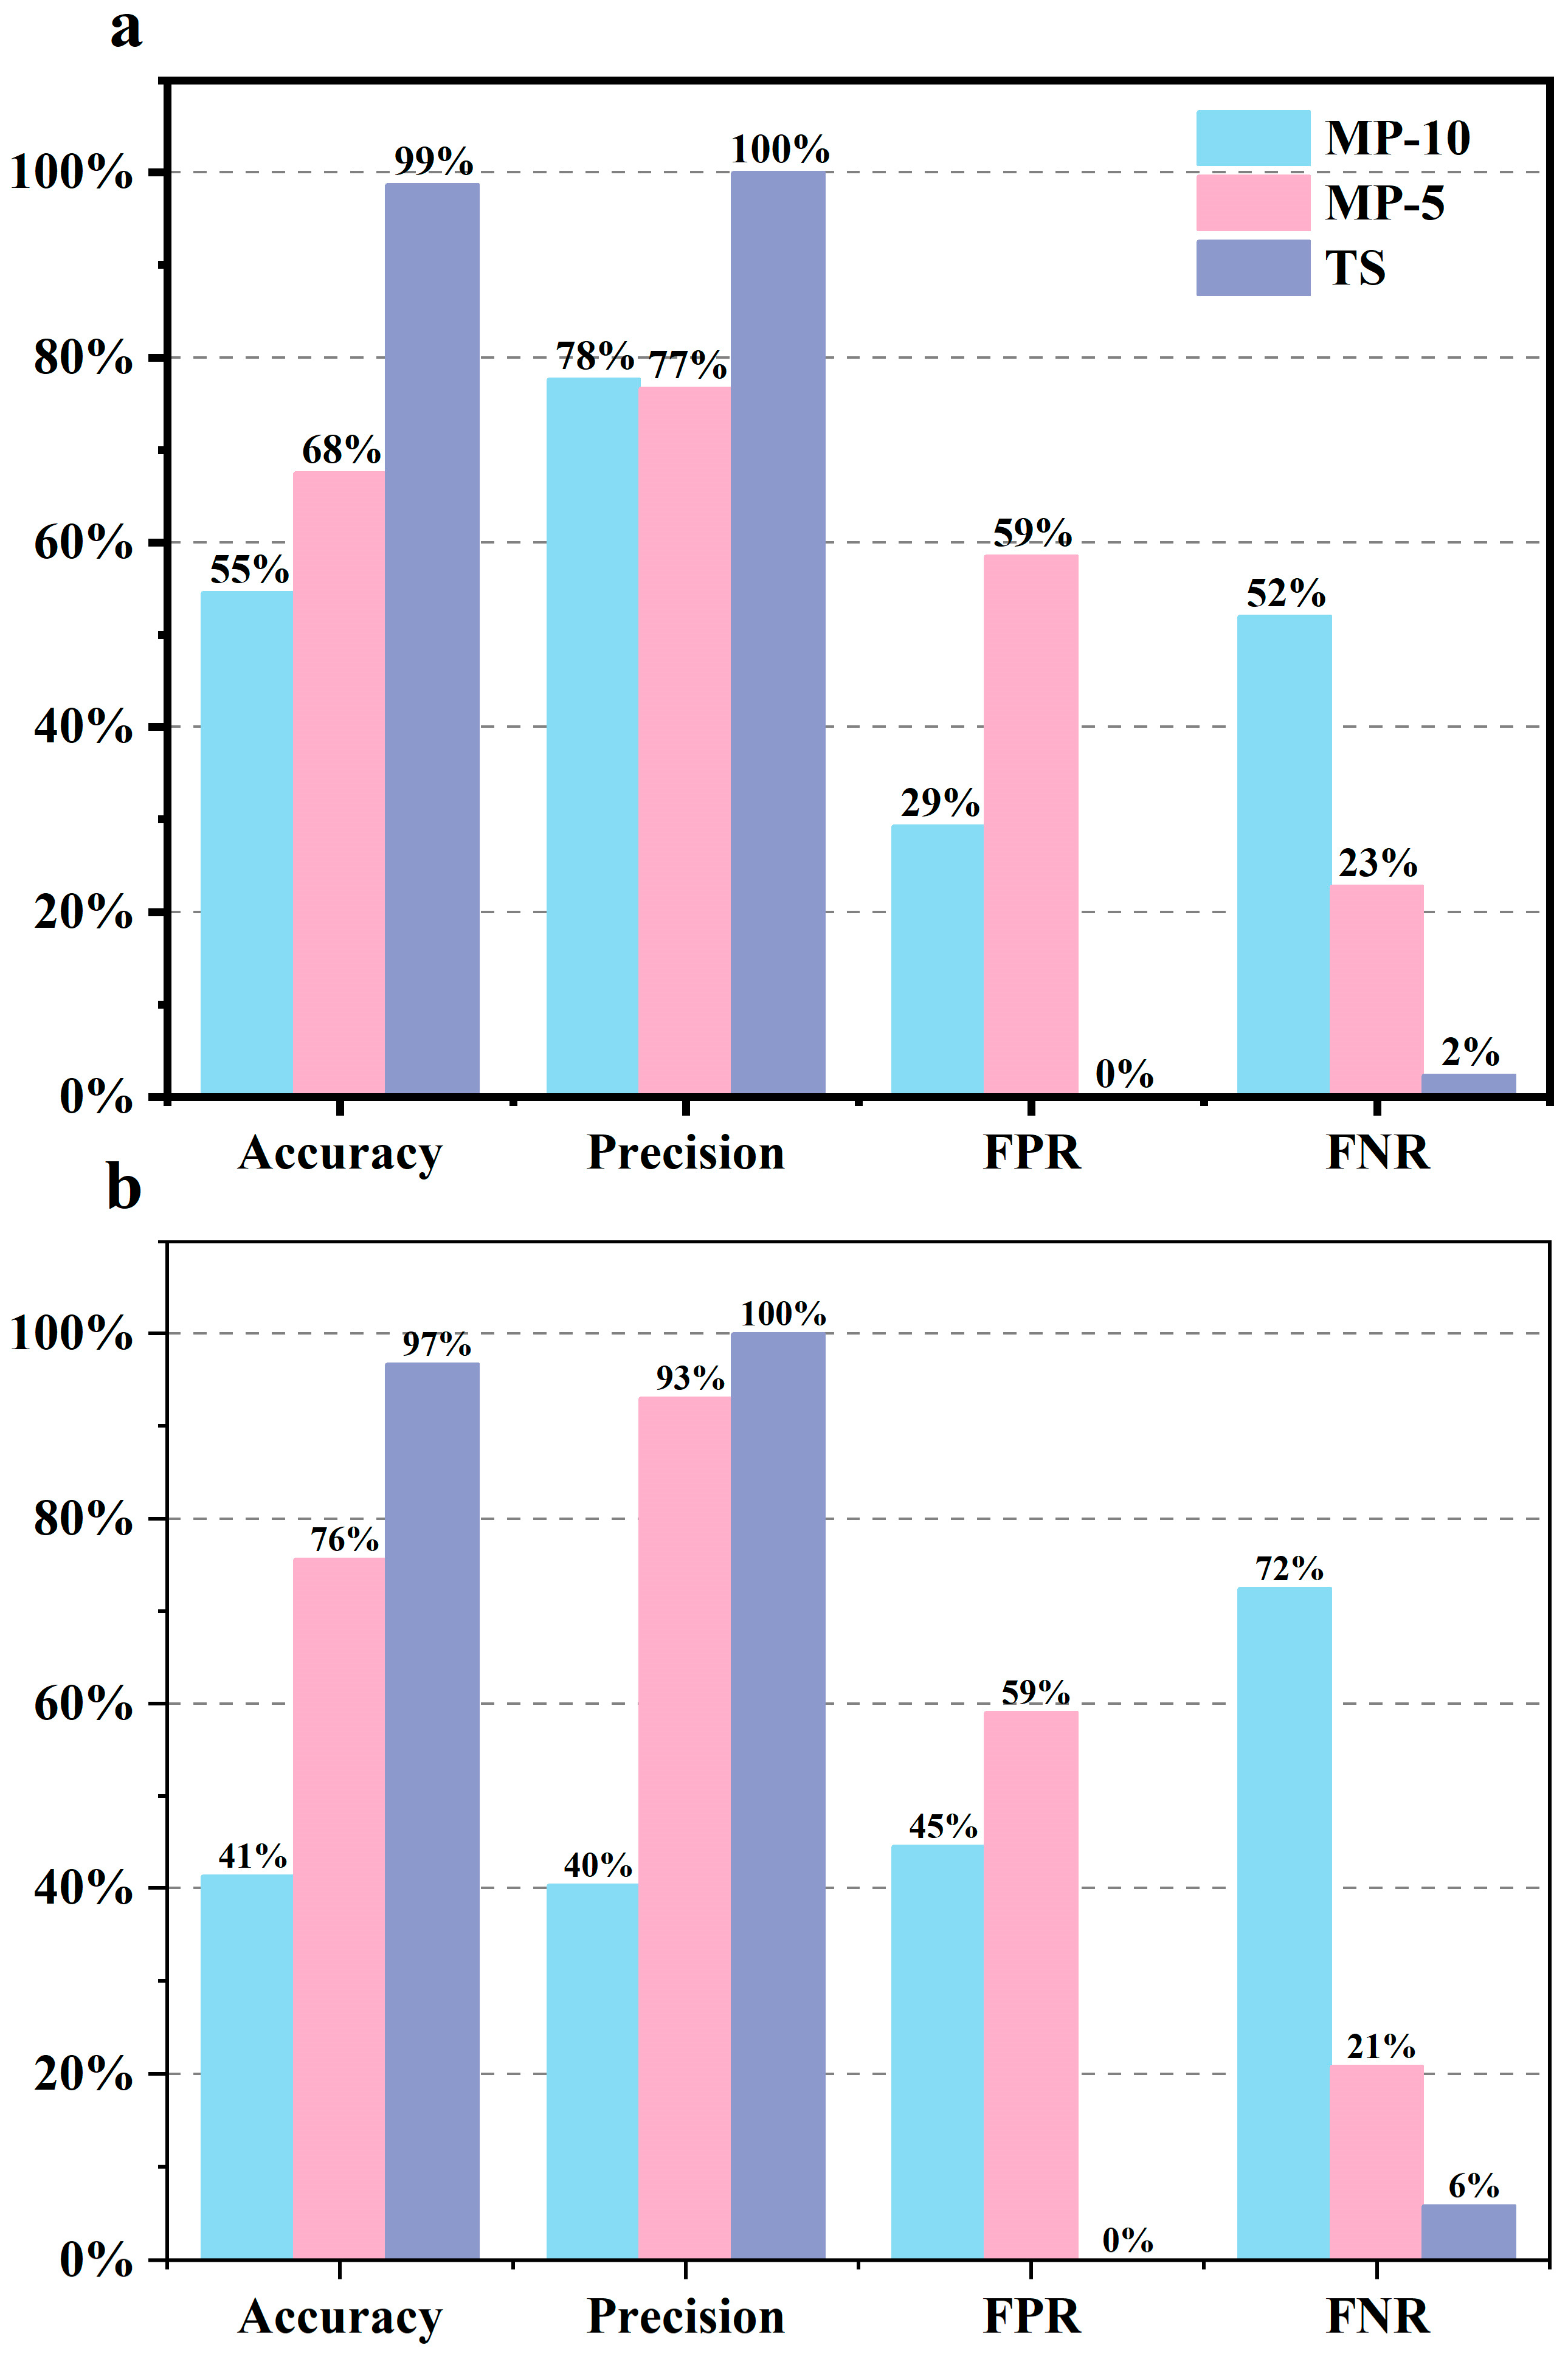
To assess the impact of weeds on seedling counting during the early stages of maize growth, we employed three methods to process the images of maize plots: (1) morphological processing with a structural element size of 10 (referred to as MP-10); (2) morphological processing with a structural element size of 5 (referred to as MP-5); and (3) the TS method. The morphological processing involved erosion and dilation operations with different structural element sizes (5 and 10) to remove weeds, and the results were compared with those of the TS method. Figure 7a shows the outcomes of the three methods after weed removal. When the structural element size was set to 10, the accuracy of weed removal was relatively low, at only 55%. The false detection rate was 29%, indicating that a significant number of weeds remained undetected. Moreover, the false negative rate was as high as 52%, indicating that more maize plants were mistakenly treated as weeds. In contrast, when the structural element size was set to 5, the erosion process became more refined. This led to a noticeable improvement in accuracy compared with that of MP-10, with similar precision values. However, the false detection rate increased by 30% compared with that if MP-10, meaning that smaller structural elements resulted in less erosion in weed areas, preserving large weed regions. In contrast, the false negative rate decreased by 29% compared with that of MP-10. Compared with those of MP-10 and MP-5, the TS method exhibited significant improvements in both accuracy and precision, achieving values above 99%. Moreover, the false negative rate and false detection rate were both below 2%. These results indicate that the TS method, based on shape features, is a more effective approach for weed removal.
Building upon the previous analysis, we further compared the performance of the three methods in removing adherent weeds (Figure 7b). Evidently, both MP-10 and MP-5 failed to accurately remove adherent weeds, as their false positive rates (FPR) exceeded 45%. Particularly, MP-10 exhibited a significantly higher false negative rate (FNR) of 72%. In contrast, owing to the inclusion of a separate method specifically designed for removing adherent weeds, the TS method demonstrated the same excellent performance in eliminating adherent weeds as it did for overall weed removal.

3.4. Counting of Maize Seedlings

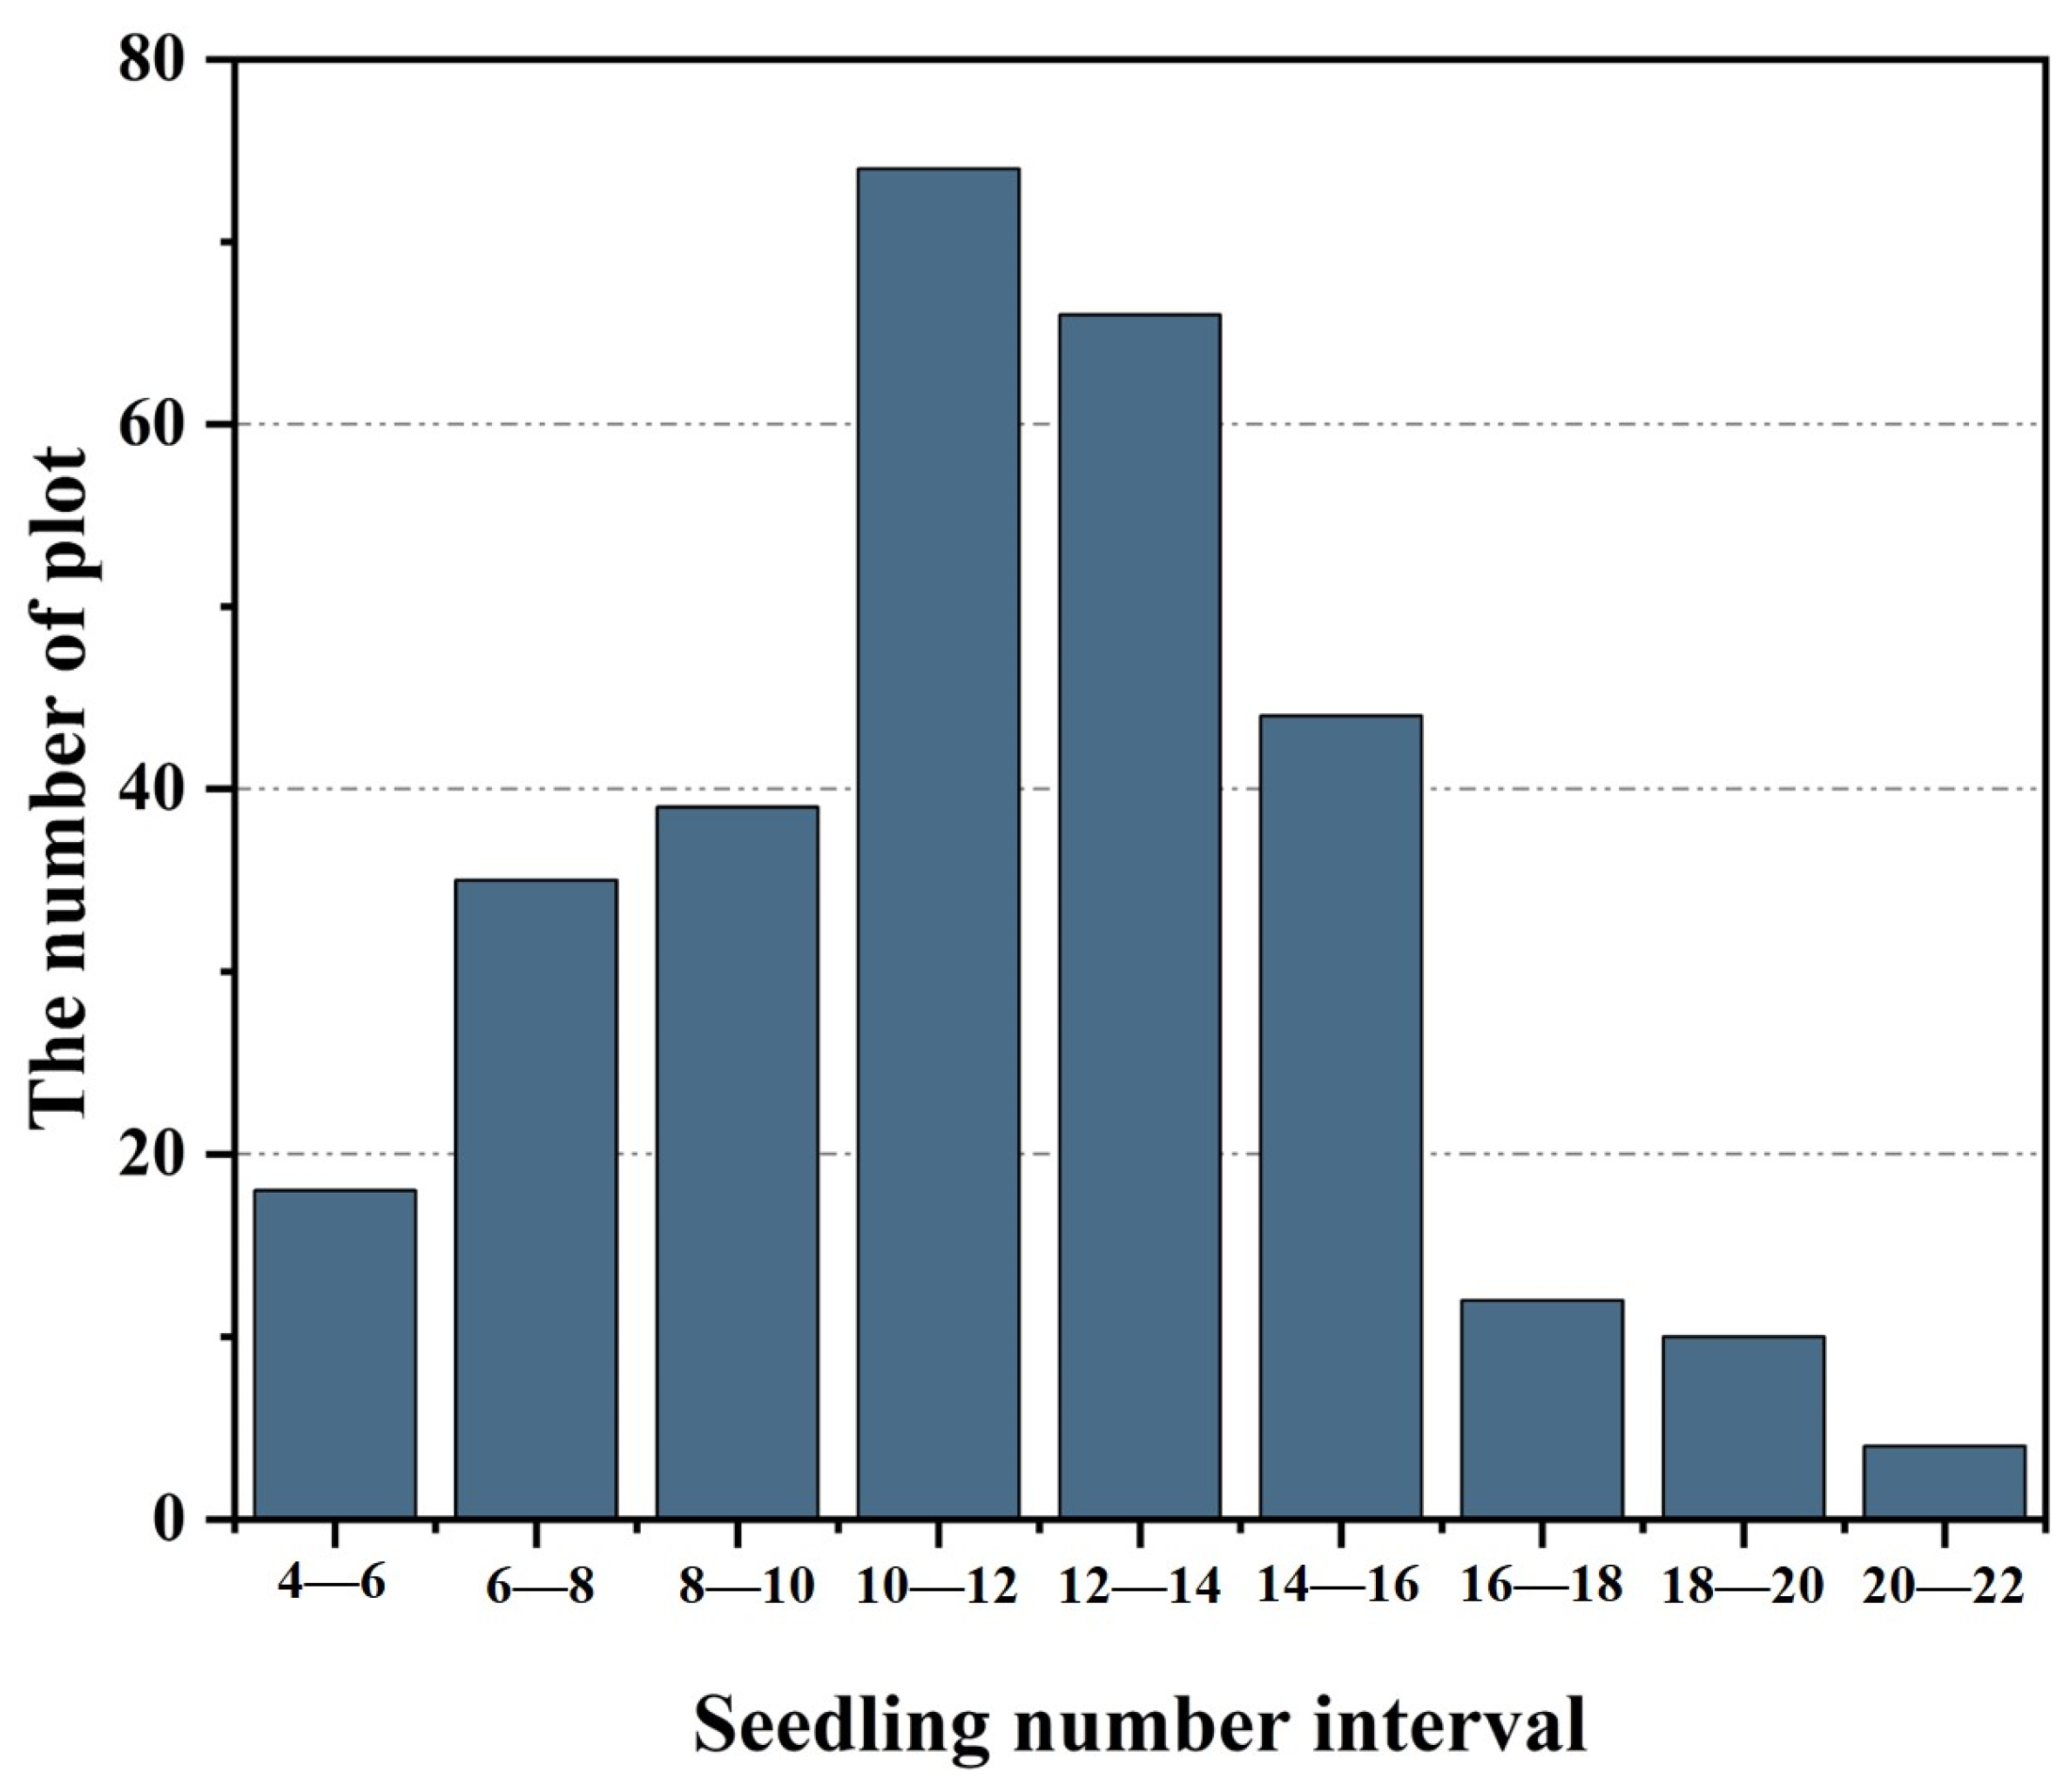
A total of 310 plots were planted in the experiment, among which five plots did not have any seedlings emerge. The remaining 305 plots exhibited a primarily distributed seedling count ranging from 10 to 16 (Figure 8). By extracting features from the images, we constructed a seedling counting model to assess the accuracy of seedling counting considering the influence of weeds. Previous studies have shown that a combination of three features—maize coverage (Mc), the percentage of maize seedling edge pixels (Me), and the percentage of maize skeleton feature pixels (Ms)—can effectively estimate the number of maize seedlings [19]. Building upon this foundation, this study further revealed that during the early stages of maize seedling growth, maize plants exhibited compact body structures, with limited adhesion between plants. Therefore, the number of connected domains (NC) can serve as a reliable indicator of the count of maize seedlings. Consequently, four feature parameters (i.e., Mc, Me, Ms, and NC) were utilized for seedling counting.
When considering only three features (i.e., Mc, Me, and Ms) for seedling counting, the presence of weeds significantly impacted the accuracy of the count. Figure 9a presents the count of maize seedlings in each plot with no weeding. The R2 value for the training set was 0.34. However, the validation set exhibited a notably lower R2 value of 0.09, indicating the difficulty in accurately counting seedlings under weed interference. Under the MP-5 treatment (Figure 9b), we observed an improvement in the R2 value, with a remarkable 255.6% increase in the validation set R2. Additionally, both the RMSE and MAE decreased. These improved results highlight the crucial nature of effective weed treatment in enhancing the accuracy of seedling counting. By utilizing the proposed TS method for image processing prior to counting (Figure 9c), we found that the R2 value for the training set increased to 0.57. Furthermore, the R2 value for the validation set also demonstrated improvement compared with the values for other treatments. The RMSE of the validation set showed a reduction of 3.4%, while the MAE was decreased by 20.7%. These outcomes collectively emphasize the necessity of weed removal during maize seedling counting, affirming the feasibility of the segmentation method introduced in this study.
The study also examined the effect of weeds on seedling counting when incorporating the NC feature. Without weed removal, the NC feature showed limited improvement in counting accuracy (Figure 9d). However, when applying the MP-5 treatment to preprocess the plot images before counting, we observed a significant increase in the R2 value for the training set, accompanied by a notable reduction in the RMSE and MAE (Figure 9e). Furthermore, after utilizing the TS method to preprocess the images, followed by counting, the validation set exhibited an improvement of 118.42% in R2, a 52.49% increase in RMSE, and a 54.94% increase in MAE. The incorporation of the NC feature significantly enhanced counting precision (Figure 9f). However, in conventional methods, the inclusion of the NC feature does not yield noticeable improvements. This can be attributed to the fact that remaining weeds and adhered weeds both contribute to higher NC values, thereby reducing counting accuracy. These results emphasize that the utilization of the NC feature must be accompanied by a highly accurate weed removal method to leverage its advantages in counting accuracy.
In the statistical analysis of the estimation results, different combinations of image processing methods and linear regression feature parameters led to significant variation in counting accuracy. For the NW and MP-5 treatments, the inclusion of the NC feature resulted in a minor improvement in accuracy, averaging around 0.3%. Comparatively, the TS method exhibited an overall counting accuracy improvement of 3% compared with that of the NW and MP-5 treatments. The combination of TS and NC achieved the highest accuracy among all combinations, reaching up to 99.20% (Table 1).

3.5. Results of Maize Seedling Counts under Different Seedling Proportions

The number of weeds and the number of seedlings are both important factors that determine the accuracy of seedling counting. Therefore, the proposed weed elimination method was used to detect plots with few and many maize seedlings and plots with few and many weeds in the experimental fields. Treatments and seedling enumeration used multiple stepwise regression. The results show that when the seedlings were few (Figure 10a), the R2 of the seedlings could reach 0.73, and the RMSE was 1.07; with more seedlings (Figure 10b), the seedling count R2 decreased to 0.69, and the RMSE increased to 1.29, indicating that the more seedlings produced, the more the accuracy of the count is affected. By analyzing the original image, we speculated that the impact is mainly obstructed by maize blades; in addition, in a small area with few weeds, the counting R2 could reach 0.88 (Figure 10c); in a community with a large number of weeds (Figure 10d), the accuracy of counting was greatly reduced, and the R2 was only 0.61. From this result, we can see that the accuracy of counting is affected by weeds. As such, the proposed weed removal method can improve the accuracy of the seedling counting under different seedlings.

3.6. Application of Weed Division Method to Drone Images

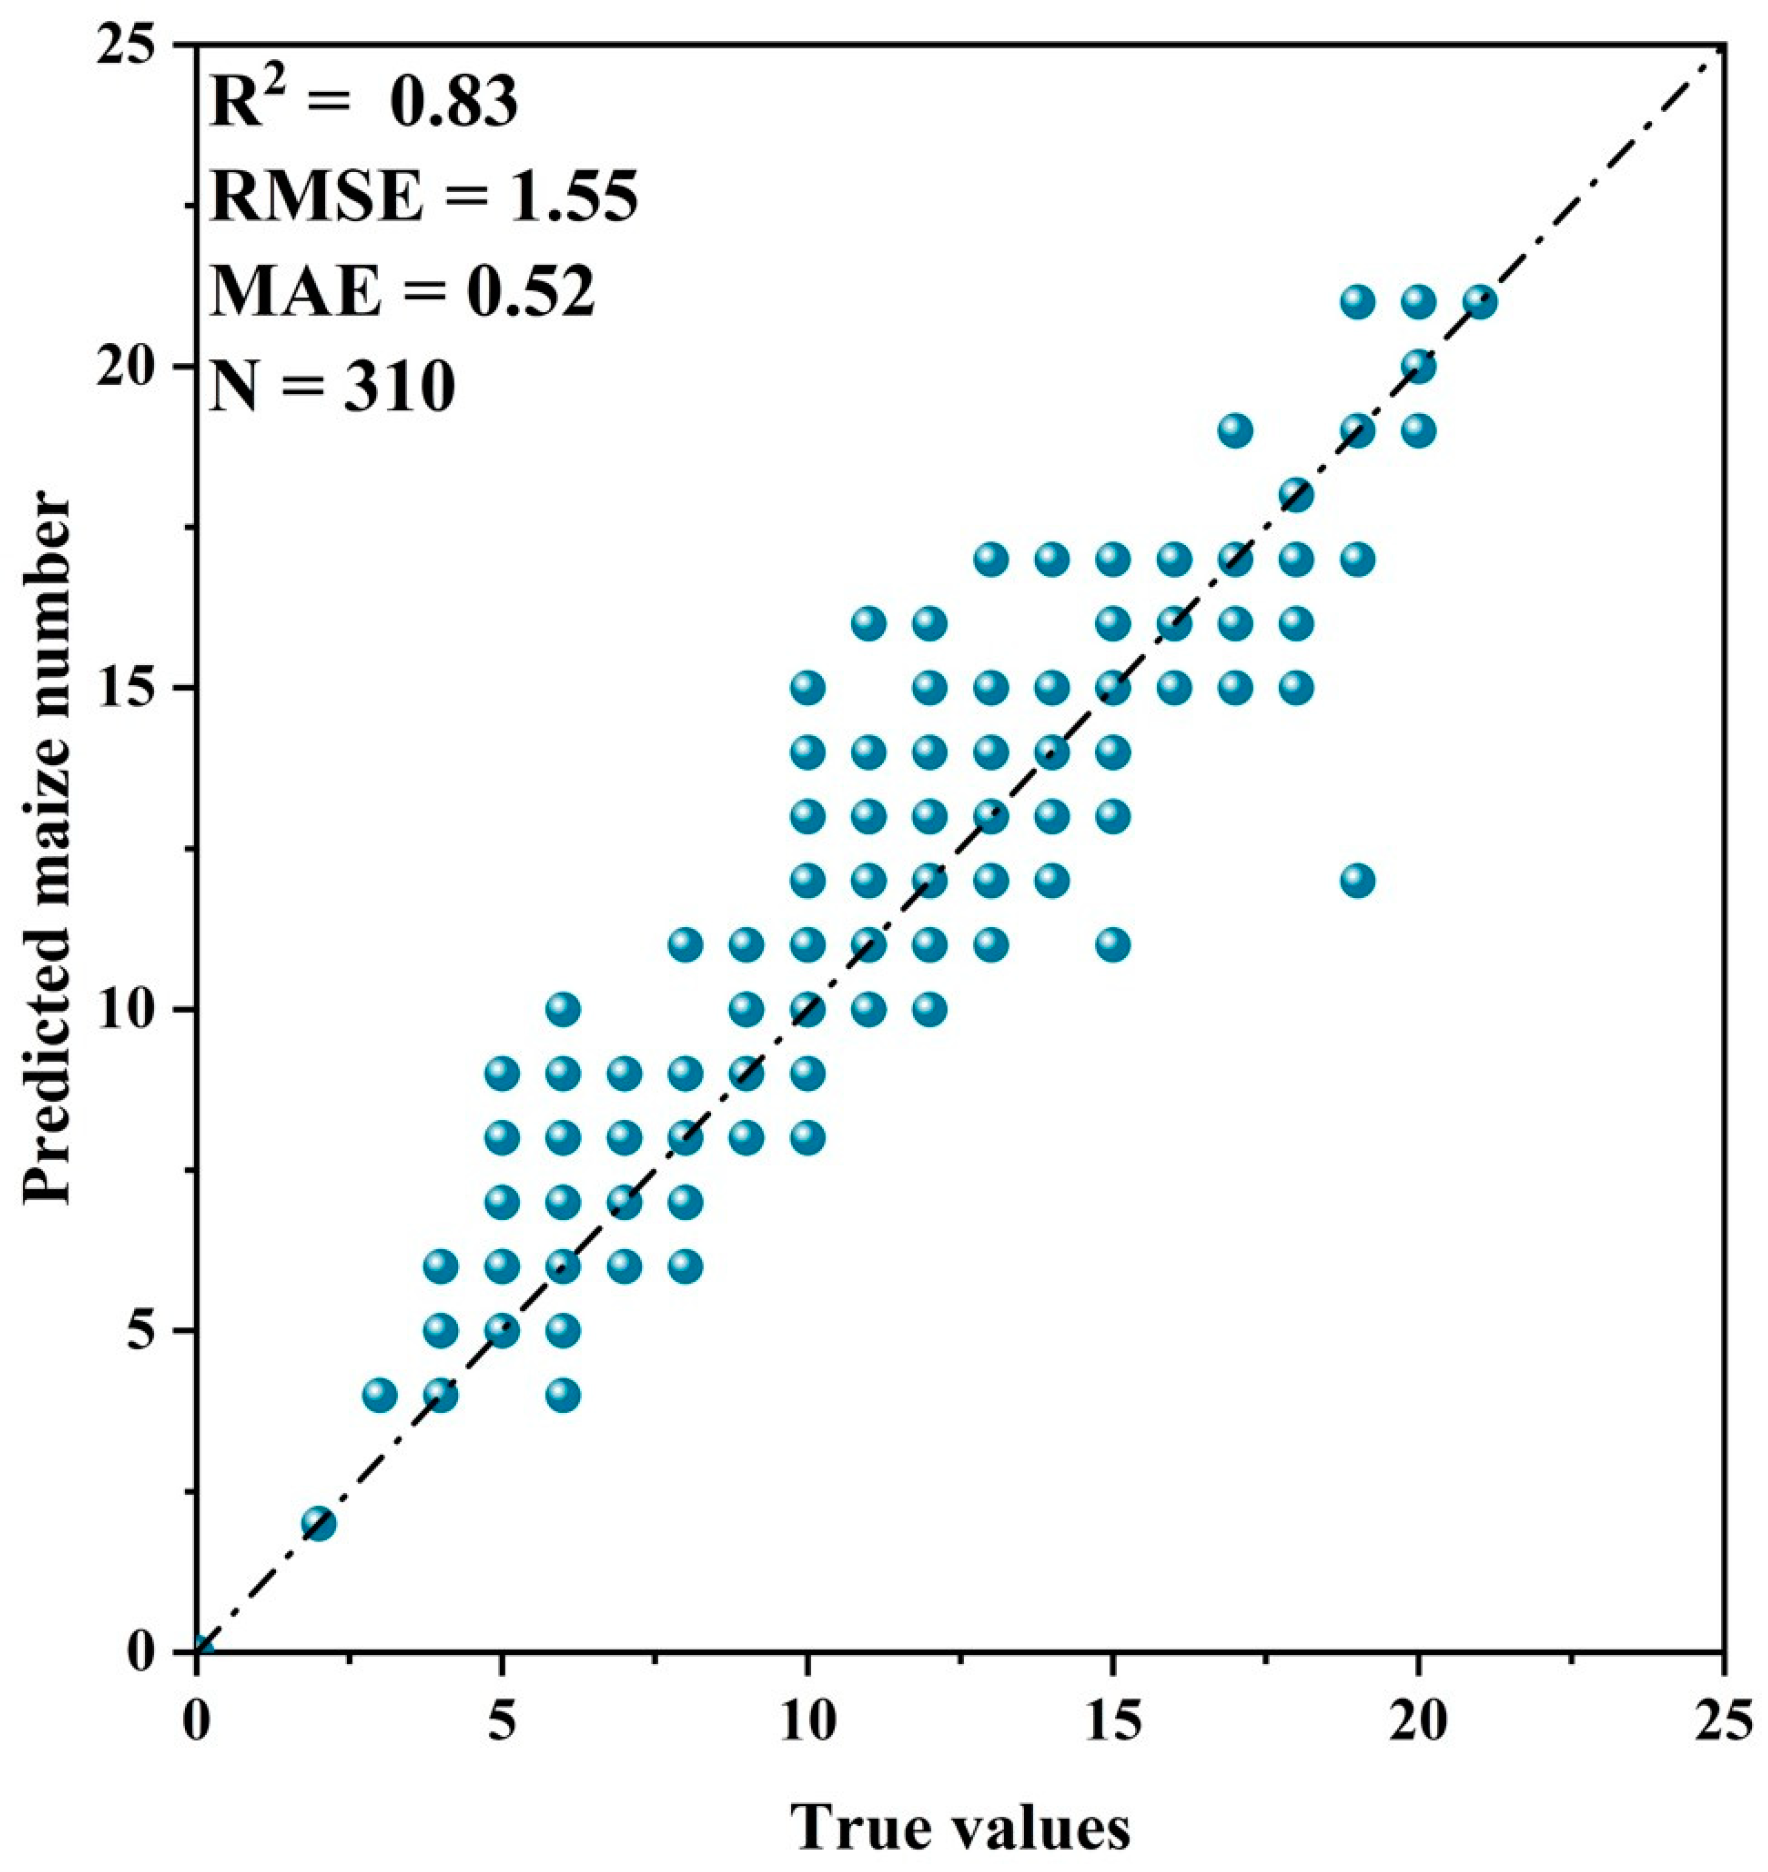
The method proposed in this paper was applied to batch process UAV images of 310 plots, estimating the number of maize seedlings in different zones, as illustrated in Figure 11. The counting of maize seedlings using UAV images yielded an R2 of 0.83 and an RMSE of 1.55. Compared with the accuracy of the estimated results of near-ground images, this value is still acceptable. These findings suggest that the weed removal method proposed in this paper can be effectively applied to UAV data sources. The applicability of the method is primarily influenced by image quality, indicating its feasibility for large-scale production fields and potential for widespread adoption.

4. Discussion

4.1. Impact of Weeds on the Monitoring of Maize Seedlings

The monitoring of maize seedlings is essential for the subsequent growth and development of maize, but the occurrence of weeds is one of the main factors that affect maize, especially the growth of seedlings, and untimely weeding operations can reduce nutrients, slow development, and invite diseases and insect pests. Weeding is a necessary measure to ensure the stable and increased production of crops. At present, the key point for the monitoring of maize seedlings is to perform seedling detection. Common seedling detection mainly uses three methods in terms of color, texture, and vegetation index. Machine learning algorithms including machine (SVM), random forest (RF), and K average pool classification are classified [36,37]. Second, through computer vision technology, the obtained images are processed, and the seedlings are detected in combination with edge detection, threshold division, and other methods. The third is the most popular target detection and semantic segmentation method based on deep learning [38,39]. However, different seedling detection methods are affected by weeds when monitoring the seedling period. Figure 12 is a characteristic comparison between the seedling period of maize and weeds. Whether it was a multi-spectrum reflectance (Figure 12A) or the vegetation index (Figure 12B), the difference between maize and weeds was not obvious. Features (Figure 12C–E) and texture characteristics (Figure 12F–M) had a high degree of weight and could not be directly used in the division of maize and weeds. Moreover, for the accuracy of the sensor, the differences between the two were not enough to perform accurate threshold segmentation, which led to the use of the above characteristics to detect or count maize plants. Certainly, previous studies have identified numerous features that can differentiate between weeds and crops, canopy temperature, hyperspectral characteristics, and shape features, among others, and can achieve crop and weed segmentation under certain conditions. However, these features are predominantly utilized for qualitative descriptions, leading to poorer segmentation results when dealing with crop–weed adhesion situations. Given the aforementioned challenges, an increasing number of researchers are directing their focus on deep learning approaches, specifically the utilization of various networks—such as R-CNN, MSFCA-Net, and U-Net—to facilitate feature learning and accomplish the segmentation of maize and weeds. However, when a multitude of weed species exists in maize fields, this technique requires an extensive sample size to fulfill the training requirements. Consequently, the practical application thereof in actual production settings is limited in terms of flexibility. Therefore, when monitoring during the seedling period, we must prioritize the weed problem. Weeding treatment beforehand can reduce the impact of weeds on image processing, but the extraction of maize seedlings without weeding is more significant.

4.2. Division Method of Adhesive Weeds

For crops and weed adhesions, the image segmentation of machine vision technology or the target detection and semantic segmentation through the use of deep learning technology are commonly used solutions. Bakhshipour et al. [22] used small waves of texture characteristics to achieve effective segmentation of crops and weeds under mild adhesion, but this method cannot adapt to complex adhesion. Moreover, Yang et al. [40] proposed a multidimensional convolutional network with weeds to pay attention to the network, called MSFCA-NET, which showed strong robustness and generalization capabilities on soybean, beet, carrot, and rice datasets and could realize the rapid removal of non-adhesive weeds. Furthermore, the agglomeration method based on the skeleton distance could effectively achieve different degrees of adhesion and division. Compared with the conventional texture characteristics, the shape characteristics are more conducive to solving the adhesion problem, and compared with deep learning methods, this method does not require a lot of data sample training, making it more efficient.

4.3. Effect of Different Flight Heights on the Recognition of Maize Plant

The altitude of flight plays a crucial role in determining the quality of captured images. An excessive flying height leads to a loss of image details, resulting in insufficient information. Blurred images also pose challenges for the segmentation of maize and weeds. Flying at a low altitude can impact the quality of image acquisition due to the airflow generated by the rotation of drone propellers, thereby reducing counting accuracy. Additionally, lower flight altitudes necessitate capturing a greater quantity of images to ensure complete coverage of the plots, leading to decreased efficiency in image processing. Table 2 presents the outcomes of maize seedling counting using the weed treatment method at varying flight altitudes. The results show a gradual decrease in the R2 value as the flight height increased. Beyond 20 m, a significant reduction in R2 was observed. This decline reveals that when the ground sampling distance (GSD) exceeded 1 cm/pixel, the differentiation between maize and weeds diminished, making it difficult to accurately capture the distinguishing skeletal and shape characteristics of maize and weeds. Restrictions imposed by aircraft necessitated a minimum altitude of 12 m for route-mode flight. Consequently, flying at lower altitudes consumed considerably more time compared with route flights. By considering counting accuracy and flight efficiency, we found that it became possible to monitor the status of maize emergence without being influenced by weeds. The optimal flying height was within the range of 12–20 m. Moreover, the time and weather conditions during image acquisition by the drone also impacted the results. Images obtained between 10:00 a.m. and 2:00 p.m. exhibited higher modeling accuracy, and sunny weather yielded higher modeling accuracy than cloudy conditions.

4.4. Application of the Weed Division Method to Drone Images

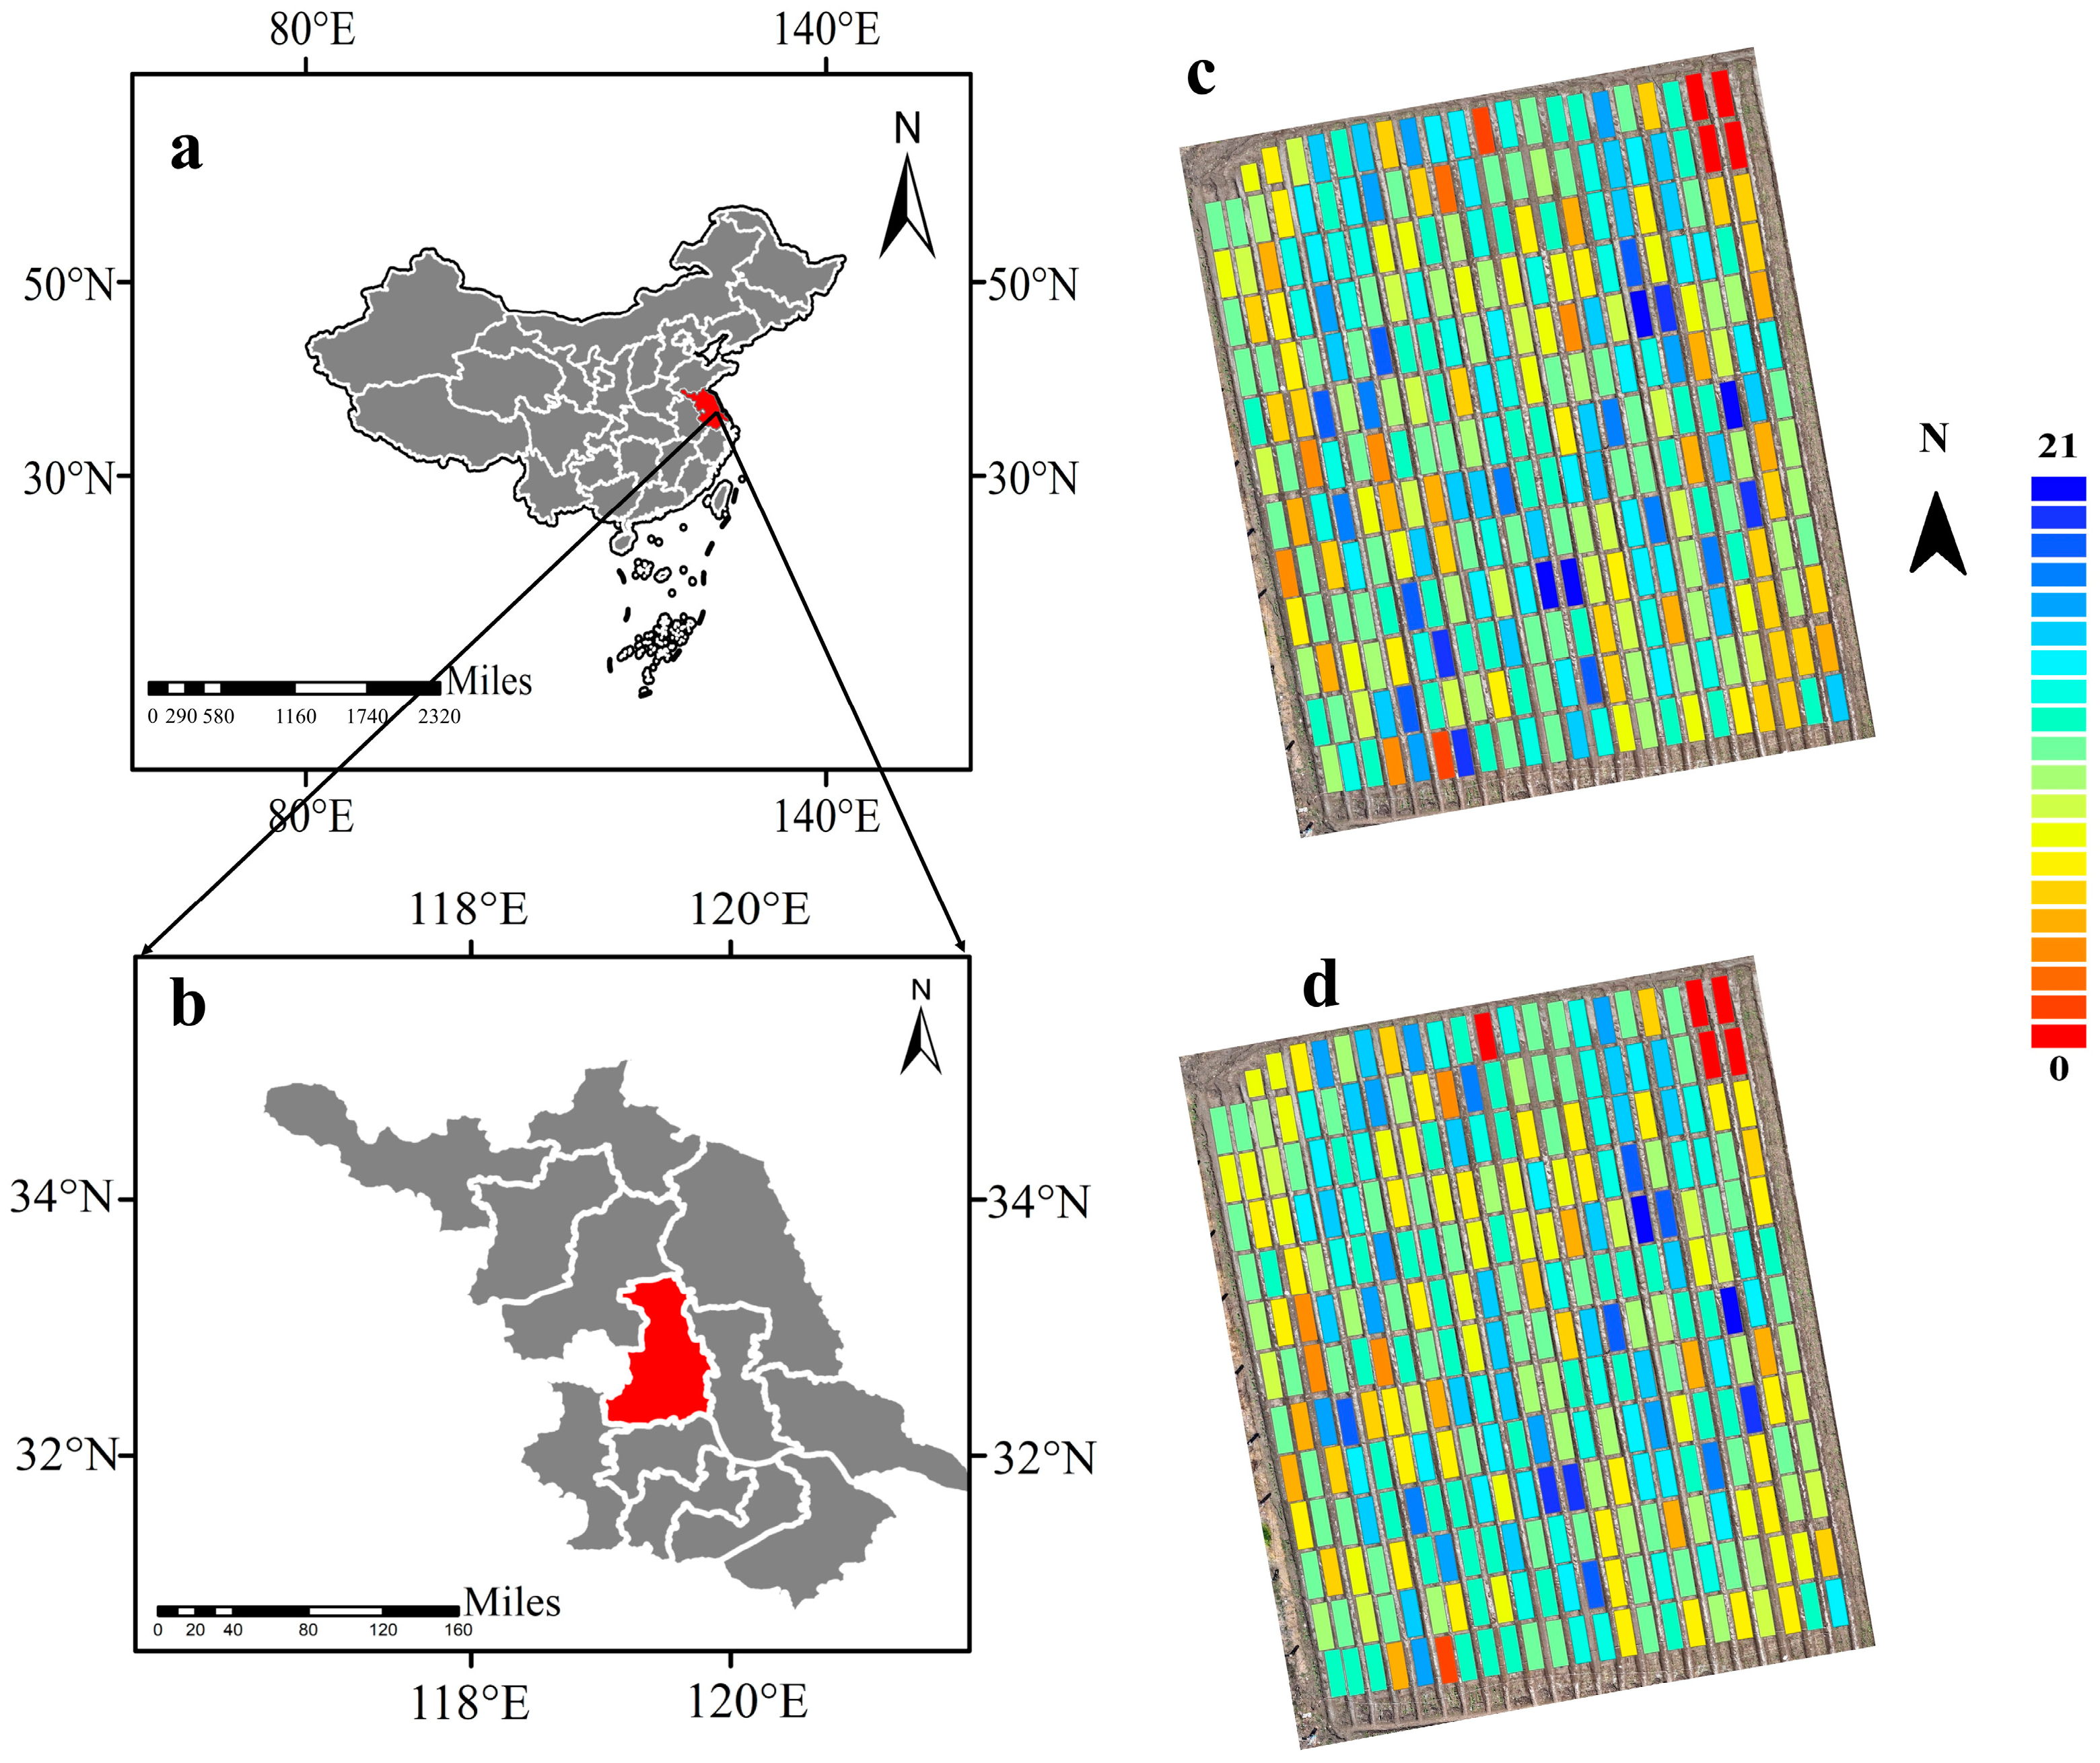
The method proposed in this paper enables accurate counting of maize seedlings. Unmanned aerial vehicles (UAVs) can provide extensive and efficient image information. The combination of these two aspects allows for the precise counting of emerged seedlings and the creation of distribution maps. This integrated approach is valuable in practical agricultural production. Figure 13a illustrates the actual number of seedlings in each plot as measured, while Figure 13b represents the estimated number of seedlings using the method proposed in this study. Different colors represent different counts. The significant variability in seedling emergence across 310 plots of the entire field is apparent. However, the estimated results closely align with the actual values. The use of distinct colors visually highlights areas with insufficient or excessive seedlings. This aids agricultural practitioners in promptly assessing the seedling situation and formulating management measures accordingly.

4.5. Comparison of the Efficiency of Different Models

We compared three image processing methods for estimating seedling counts (Table 3). The time required for the K-means clustering method and corner detection model is higher than the method proposed in this article under the same sample size. More importantly, the clustering method shows a significant issue of misclassifying weeds and maize seedlings, leading to highly inaccurate seedling counts. Similarly, the corner detection model also identifies many corners belonging to weeds, resulting in a substantial counting error. Although the faster R-CNN model is close in accuracy to the method discussed in this paper, it requires the annotation of samples before training and a sufficient number of samples to ensure accuracy, and it also takes a longer time to train. The running environment configuration of the above model is shown in Table 4.

5. Conclusions

In response to the challenge of counting maize seedlings in the presence of weeds, this paper presented a precise segmentation method that combines shape features with skeleton-distance clustering to effectively distinguish between maize plants and attached weeds. We utilized the extracted data of maize plant features such as Mc, Me, Ms, and NC, which we quantified for regression analysis. The profound impact of weed occurrence on the estimation of maize seedling quantities was thoroughly explored, and the accuracy of the counting method was compared across varying levels of weed occurrence.
The following conclusions were derived:
(1) The threshold segmentation method based on image shape characteristics in this article could effectively remove most of the discrete weeds among the maize field seedlings. The optimized clustering method based on the skeleton distance could achieve maize plant detection and extraction of the maize from weed adhesion. This provided a basis for precision estimation of the number of seedlings.
(2) Based on the results of maize seedling counts, the best parameters for the estimated number of maize seedlings were Mc, Me, Ms, and NC. The accuracy of the number of maize seedlings under different weed removal methods clarified the number of weeds. We observed an adverse effect on the estimation of the number of maize seedlings. After removing weeds, the accuracy of the number of seedlings could reach 99.20%, which was significantly improved compared with no weeding. Comparing the accuracy of the number of seedlings under different proportions of weeds and seedlings, the occurrence of weeds was found to have a greater impact on the estimation of the number of seedlings. Thus, precise weed removal could be a necessary prerequisite for accurate counting.
(3) UAV imagery was employed to quantify the number of maize seedlings across various seedling conditions. Both single indicators and comprehensive indicators were utilized to assess the emergence status of maize in the presence of weeds. A comprehensive analysis was conducted on the emergence status of 310 plots within the experimental site. The evaluation results serve as a scientific foundation for informed decision making regarding variety selection and effective farmland management practices.
The results indicated that the proposed method demonstrated the capability to discern maize plants amidst weed-infested surroundings; enhance the precision of maize segmentation; and (3) determine the count of seedlings emerging across diverse seedling conditions. Nonetheless, this method possessed inherent constraints. In scenarios where numerous seedlings coexisted within a single cavity or in areas densely populated with weeds, the accuracy of estimating the quantity of seedlings was notably compromised. These concerns represent pivotal focal points for future investigations, which could refine the counting precision and adaptability of this approach in varying environmental settings.

Author Contributions

T.Y.: Conceptualization, Methodology, Data Curation, Writing—Original Draft, Funding acquisition; S.Z.: Formal analysis, Data Curation, Investigation; W.Z.: Formal analysis, Data Curation, Investigation; Y.Z.: Data Curation, Writing—review & editing; X.S.: Resources, Writing—review & editing; G.Y.: Writing—review & editing; Z.Y.: Writing—review & editing; W.W.: Funding acquisition, Writing—review & editing; T.L.: Supervision, Writing—review & editing, Funding acquisition; C.S.: Supervision, Writing—review & editing; Z.Z.: Supervision, Writing—review & editing, Funding acquisition. All authors have read and agreed to the published version of the manuscript.

Funding

This work was supported by the National Natural Science Foundation of China (321722110, 32071945), the National Key Research and Development Program of China (2018YFD0300805), the Special Funds for Scientific and Technological Innovation of Jiangsu province, China (BE2022425), the Priority Academic Program Development of Jiangsu Higher Education Institutions (PAPD), and the Jiangsu Provincial Postgraduate Scientific Research Innovation Program (KYCX21_3240).

Data Availability Statement

The data presented in this study are available upon request from the corresponding author. The data are not publicly available because the data used in this article need to be further studied and are currently not easy to share.

Conflicts of Interest

The authors declare that they have no known competing financial interests or personal relationships that could have appeared to influence the work reported in this paper.

References

  1. Sylvester, G. E-Agriculture in Action: Drones for Agriculture; Food and Agriculture Organization ofn the United Nations and International: Roma, Italy, 2018. [Google Scholar]
  2. Steinwand, M.A.; Ronald, P.C. Crop Biotechnology and the Future of Food. Nat. Food 2020, 1, 273–283. [Google Scholar] [CrossRef]
  3. Gallandt, E.R.; Weiner, J. Crop–Weed Competition. In eLS; John Wiley & Sons, Ltd., Ed.; Wiley: Hoboken, NJ, USA, 2015; pp. 1–9. ISBN 978-0-470-01617-6. [Google Scholar]
  4. Korav, S.; Dhaka, A.K.; Singh, R.; Premaradhya, N.; Reddy, G.C. A Study on Crop Weed Competition in Field Crops. J. Pharmacogn. Phytochem. 2018, 7, 3235–3240. [Google Scholar]
  5. Horvath, D.P.; Clay, S.A.; Swanton, C.J.; Anderson, J.V.; Chao, W.S. Weed-Induced Crop Yield Loss: A New Paradigm and New Challenges. Trends Plant Sci. 2023, 28, 567–582. [Google Scholar] [CrossRef] [PubMed]
  6. Lou, Z.; Quan, L.; Sun, D.; Li, H.; Xia, F. Hyperspectral Remote Sensing to Assess Weed Competitiveness in Maize Farmland Ecosystems. Sci. Total Environ. 2022, 844, 157071. [Google Scholar] [CrossRef] [PubMed]
  7. Tadiello, T.; Potenza, E.; Marino, P.; Perego, A.; Torre, D.D.; Michelon, L.; Bechini, L. Growth, Weed Control, and Nitrogen Uptake of Winter-Killed Cover Crops, and Their Effects on Maize in Conservation Agriculture. Agron. Sustain. Dev. 2022, 42, 18. [Google Scholar] [CrossRef]
  8. Gao, X.; Zan, X.; Yang, S.; Zhang, R.; Chen, S.; Zhang, X.; Liu, Z.; Ma, Y.; Zhao, Y.; Li, S. Maize Seedling Information Extraction from UAV Images Based on Semi-Automatic Sample Generation and Mask R-CNN Model. Eur. J. Agron. 2023, 147, 126845. [Google Scholar] [CrossRef]
  9. Olsen, A.; Konovalov, D.A.; Philippa, B.; Ridd, P.; Wood, J.C.; Johns, J.; Banks, W.; Girgenti, B.; Kenny, O.; Whinney, J.; et al. DeepWeeds: A Multiclass Weed Species Image Dataset for Deep Learning. Sci. Rep. 2019, 9, 2058. [Google Scholar] [CrossRef]
  10. Bai, Y.; Nie, C.; Wang, H.; Cheng, M.; Liu, S.; Yu, X.; Shao, M.; Wang, Z.; Wang, S.; Tuohuti, N.; et al. A Fast and Robust Method for Plant Count in Sunflower and Maize at Different Seedling Stages Using High-Resolution UAV RGB Imagery. Precis. Agric. 2022, 23, 1720–1742. [Google Scholar] [CrossRef]
  11. Pang, Y.; Shi, Y.; Gao, S.; Jiang, F.; Veeranampalayam-Sivakumar, A.-N.; Thompson, L.; Luck, J.; Liu, C. Improved Crop Row Detection with Deep Neural Network for Early-Season Maize Stand Count in UAV Imagery. Comput. Electron. Agric. 2020, 178, 105766. [Google Scholar] [CrossRef]
  12. Jin, X.; Liu, S.; Baret, F.; Hemerlé, M.; Comar, A. Estimates of Plant Density of Wheat Crops at Emergence from Very Low Altitude UAV Imagery. Remote Sens. Environ. 2017, 198, 105–114. [Google Scholar] [CrossRef]
  13. Kumar, A.; Desai, S.V.; Balasubramanian, V.N.; Rajalakshmi, P.; Guo, W.; Balaji Naik, B.; Balram, M.; Desai, U.B. Efficient Maize Tassel-Detection Method Using UAV Based Remote Sensing. Remote Sens. Appl. Soc. Environ. 2021, 23, 100549. [Google Scholar] [CrossRef]
  14. Chen, Y.; Wu, Z.; Zhao, B.; Fan, C.; Shi, S. Weed and Corn Seedling Detection in Field Based on Multi Feature Fusion and Support Vector Machine. Sensors 2020, 21, 212. [Google Scholar] [CrossRef]
  15. Liu, T.; Wu, W.; Chen, W.; Sun, C.; Zhu, X.; Guo, W. Automated Image-Processing for Counting Seedlings in a Wheat Field. Precis. Agric. 2016, 17, 392–406. [Google Scholar] [CrossRef]
  16. Gnädinger, F.; Schmidhalter, U. Digital Counts of Maize Plants by Unmanned Aerial Vehicles (UAVs). Remote Sens. 2017, 9, 544. [Google Scholar] [CrossRef]
  17. Liu, T.; Zhao, Y.; Wu, F.; Wang, J.; Chen, C.; Zhou, Y.; Ju, C.; Huo, Z.; Zhong, X.; Liu, S.; et al. The Estimation of Wheat Tiller Number Based on UAV Images and Gradual Change Features (GCFs). Precis. Agric. 2022, 24, 353–374. [Google Scholar] [CrossRef]
  18. Fernandez-Gallego, J.A.; Lootens, P.; Borra-Serrano, I.; Derycke, V.; Haesaert, G.; Roldán-Ruiz, I.; Araus, J.L.; Kefauver, S.C. Automatic Wheat Ear Counting Using Machine Learning Based on RGB UAV Imagery. Plant J. 2020, 103, 1603–1613. [Google Scholar] [CrossRef]
  19. Liu, S.; Yin, D.; Feng, H.; Li, Z.; Xu, X.; Shi, L.; Jin, X. Estimating Maize Seedling Number with UAV RGB Images and Advanced Image Processing Methods. Precis. Agric. 2022, 23, 1604–1632. [Google Scholar] [CrossRef]
  20. Liu, M.; Su, W.-H.; Wang, X.-Q. Quantitative Evaluation of Maize Emergence Using UAV Imagery and Deep Learning. Remote Sens. 2023, 15, 1979. [Google Scholar] [CrossRef]
  21. Alchanatis, V.; Ridel, L.; Hetzroni, A.; Yaroslavsky, L. Weed Detection in Multi-Spectral Images of Cotton Fields. Comput. Electron. Agric. 2005, 47, 243–260. [Google Scholar] [CrossRef]
  22. Bakhshipour, A.; Jafari, A.; Nassiri, S.M.; Zare, D. Weed Segmentation Using Texture Features Extracted from Wavelet Sub-Images. Biosyst. Eng. 2017, 157, 1–12. [Google Scholar] [CrossRef]
  23. Espejo-Garcia, B.; Mylonas, N.; Athanasakos, L.; Vali, E.; Fountas, S. Combining Generative Adversarial Networks and Agricultural Transfer Learning for Weeds Identification. Biosyst. Eng. 2021, 204, 79–89. [Google Scholar] [CrossRef]
  24. Ahmad, A.; Saraswat, D.; Aggarwal, V.; Etienne, A.; Hancock, B. Performance of Deep Learning Models for Classifying and Detecting Common Weeds in Corn and Soybean Production Systems. Comput. Electron. Agric. 2021, 184, 106081. [Google Scholar] [CrossRef]
  25. Lin, F.; Zhang, D.; Huang, Y.; Wang, X.; Chen, X. Detection of Corn and Weed Species by the Combination of Spectral, Shape and Textural Features. Sustainability 2017, 9, 1335. [Google Scholar] [CrossRef]
  26. Pott, L.P.; Amado, T.J.; Schwalbert, R.A.; Sebem, E.; Jugulam, M.; Ciampitti, I.A. Pre-planting Weed Detection Based on Ground Field Spectral Data. Pest. Manag. Sci. 2020, 76, 1173–1182. [Google Scholar] [CrossRef] [PubMed]
  27. Xu, X.; Wang, L.; Shu, M.; Liang, X.; Ghafoor, A.Z.; Liu, Y.; Ma, Y.; Zhu, J. Detection and Counting of Maize Leaves Based on Two-Stage Deep Learning with UAV-Based RGB Image. Remote Sens. 2022, 14, 5388. [Google Scholar] [CrossRef]
  28. Xu, B.; Meng, R.; Chen, G.; Liang, L.; Lv, Z.; Zhou, L.; Sun, R.; Zhao, F.; Yang, W. Improved Weed Mapping in Corn Fields by Combining UAV-Based Spectral, Textural, Structural, and Thermal Measurements. Pest. Manag. Sci. 2023, 79, 2591–2602. [Google Scholar] [CrossRef]
  29. Tang, J.; Wang, D.; Zhang, Z.; He, L.; Xin, J.; Xu, Y. Weed Identification Based on K-Means Feature Learning Combined with Convolutional Neural Network. Comput. Electron. Agric. 2017, 135, 63–70. [Google Scholar] [CrossRef]
  30. Jiang, H.; Zhang, C.; Qiao, Y.; Zhang, Z.; Zhang, W.; Song, C. CNN Feature Based Graph Convolutional Network for Weed and Crop Recognition in Smart Farming. Comput. Electron. Agric. 2020, 174, 105450. [Google Scholar] [CrossRef]
  31. Peng, H.; Li, Z.; Zhou, Z.; Shao, Y. Weed Detection in Paddy Field Using an Improved RetinaNet Network. Comput. Electron. Agric. 2022, 199, 107179. [Google Scholar] [CrossRef]
  32. Yu, F.; Jin, Z.; Guo, S.; Guo, Z.; Zhang, H.; Xu, T.; Chen, C. Research on Weed Identification Method in Rice Fields Based on UAV Remote Sensing. Front. Plant Sci. 2022, 13, 1037760. [Google Scholar] [CrossRef]
  33. Krestenitis, M.; Raptis, E.K.; Kapoutsis, A.C.; Ioannidis, K.; Kosmatopoulos, E.B.; Vrochidis, S.; Kompatsiaris, I. CoFly-WeedDB: A UAV Image Dataset for Weed Detection and Species Identification. Data Brief. 2022, 45, 108575. [Google Scholar] [CrossRef] [PubMed]
  34. Wang, F.; Yang, M.; Ma, L.; Zhang, T.; Qin, W.; Li, W.; Zhang, Y.; Sun, Z.; Wang, Z.; Li, F.; et al. Estimation of Above-Ground Biomass of Winter Wheat Based on Consumer-Grade Multi-Spectral UAV. Remote Sens. 2022, 14, 1251. [Google Scholar] [CrossRef]
  35. Zamani, S.A.; Baleghi, Y. Early/Late Fusion Structures with Optimized Feature Selection for Weed Detection Using Visible and Thermal Images of Paddy Fields. Precis. Agric. 2023, 24, 482–510. [Google Scholar] [CrossRef]
  36. Wang, Z.; Li, H.; Zhu, Y.; Xu, T. Review of Plant Identification Based on Image Processing. Arch. Comput. Methods Eng. 2017, 24, 637–654. [Google Scholar] [CrossRef]
  37. Zhou, C.; Yang, G.; Liang, D.; Yang, X.; Xu, B. An Integrated Skeleton Extraction and Pruning Method for Spatial Recognition of Maize Seedlings in MGV and UAV Remote Images. IEEE Trans. Geosci. Remote Sens. 2018, 56, 4618–4632. [Google Scholar] [CrossRef]
  38. Ma, J.; Li, Y.; Liu, H.; Du, K.; Zheng, F.; Wu, Y.; Zhang, L. Improving Segmentation Accuracy for Ears of Winter Wheat at Flowering Stage by Semantic Segmentation. Comput. Electron. Agric. 2020, 176, 105662. [Google Scholar] [CrossRef]
  39. Majeed, Y.; Zhang, J.; Zhang, X.; Fu, L.; Karkee, M.; Zhang, Q.; Whiting, M.D. Deep Learning Based Segmentation for Automated Training of Apple Trees on Trellis Wires. Comput. Electron. Agric. 2020, 170, 105277. [Google Scholar] [CrossRef]
  40. Yang, Q.; Ye, Y.; Gu, L.; Wu, Y. MSFCA-Net: A Multi-Scale Feature Convolutional Attention Network for Segmenting Crops and Weeds in the Field. Agriculture 2023, 13, 1176. [Google Scholar] [CrossRef]
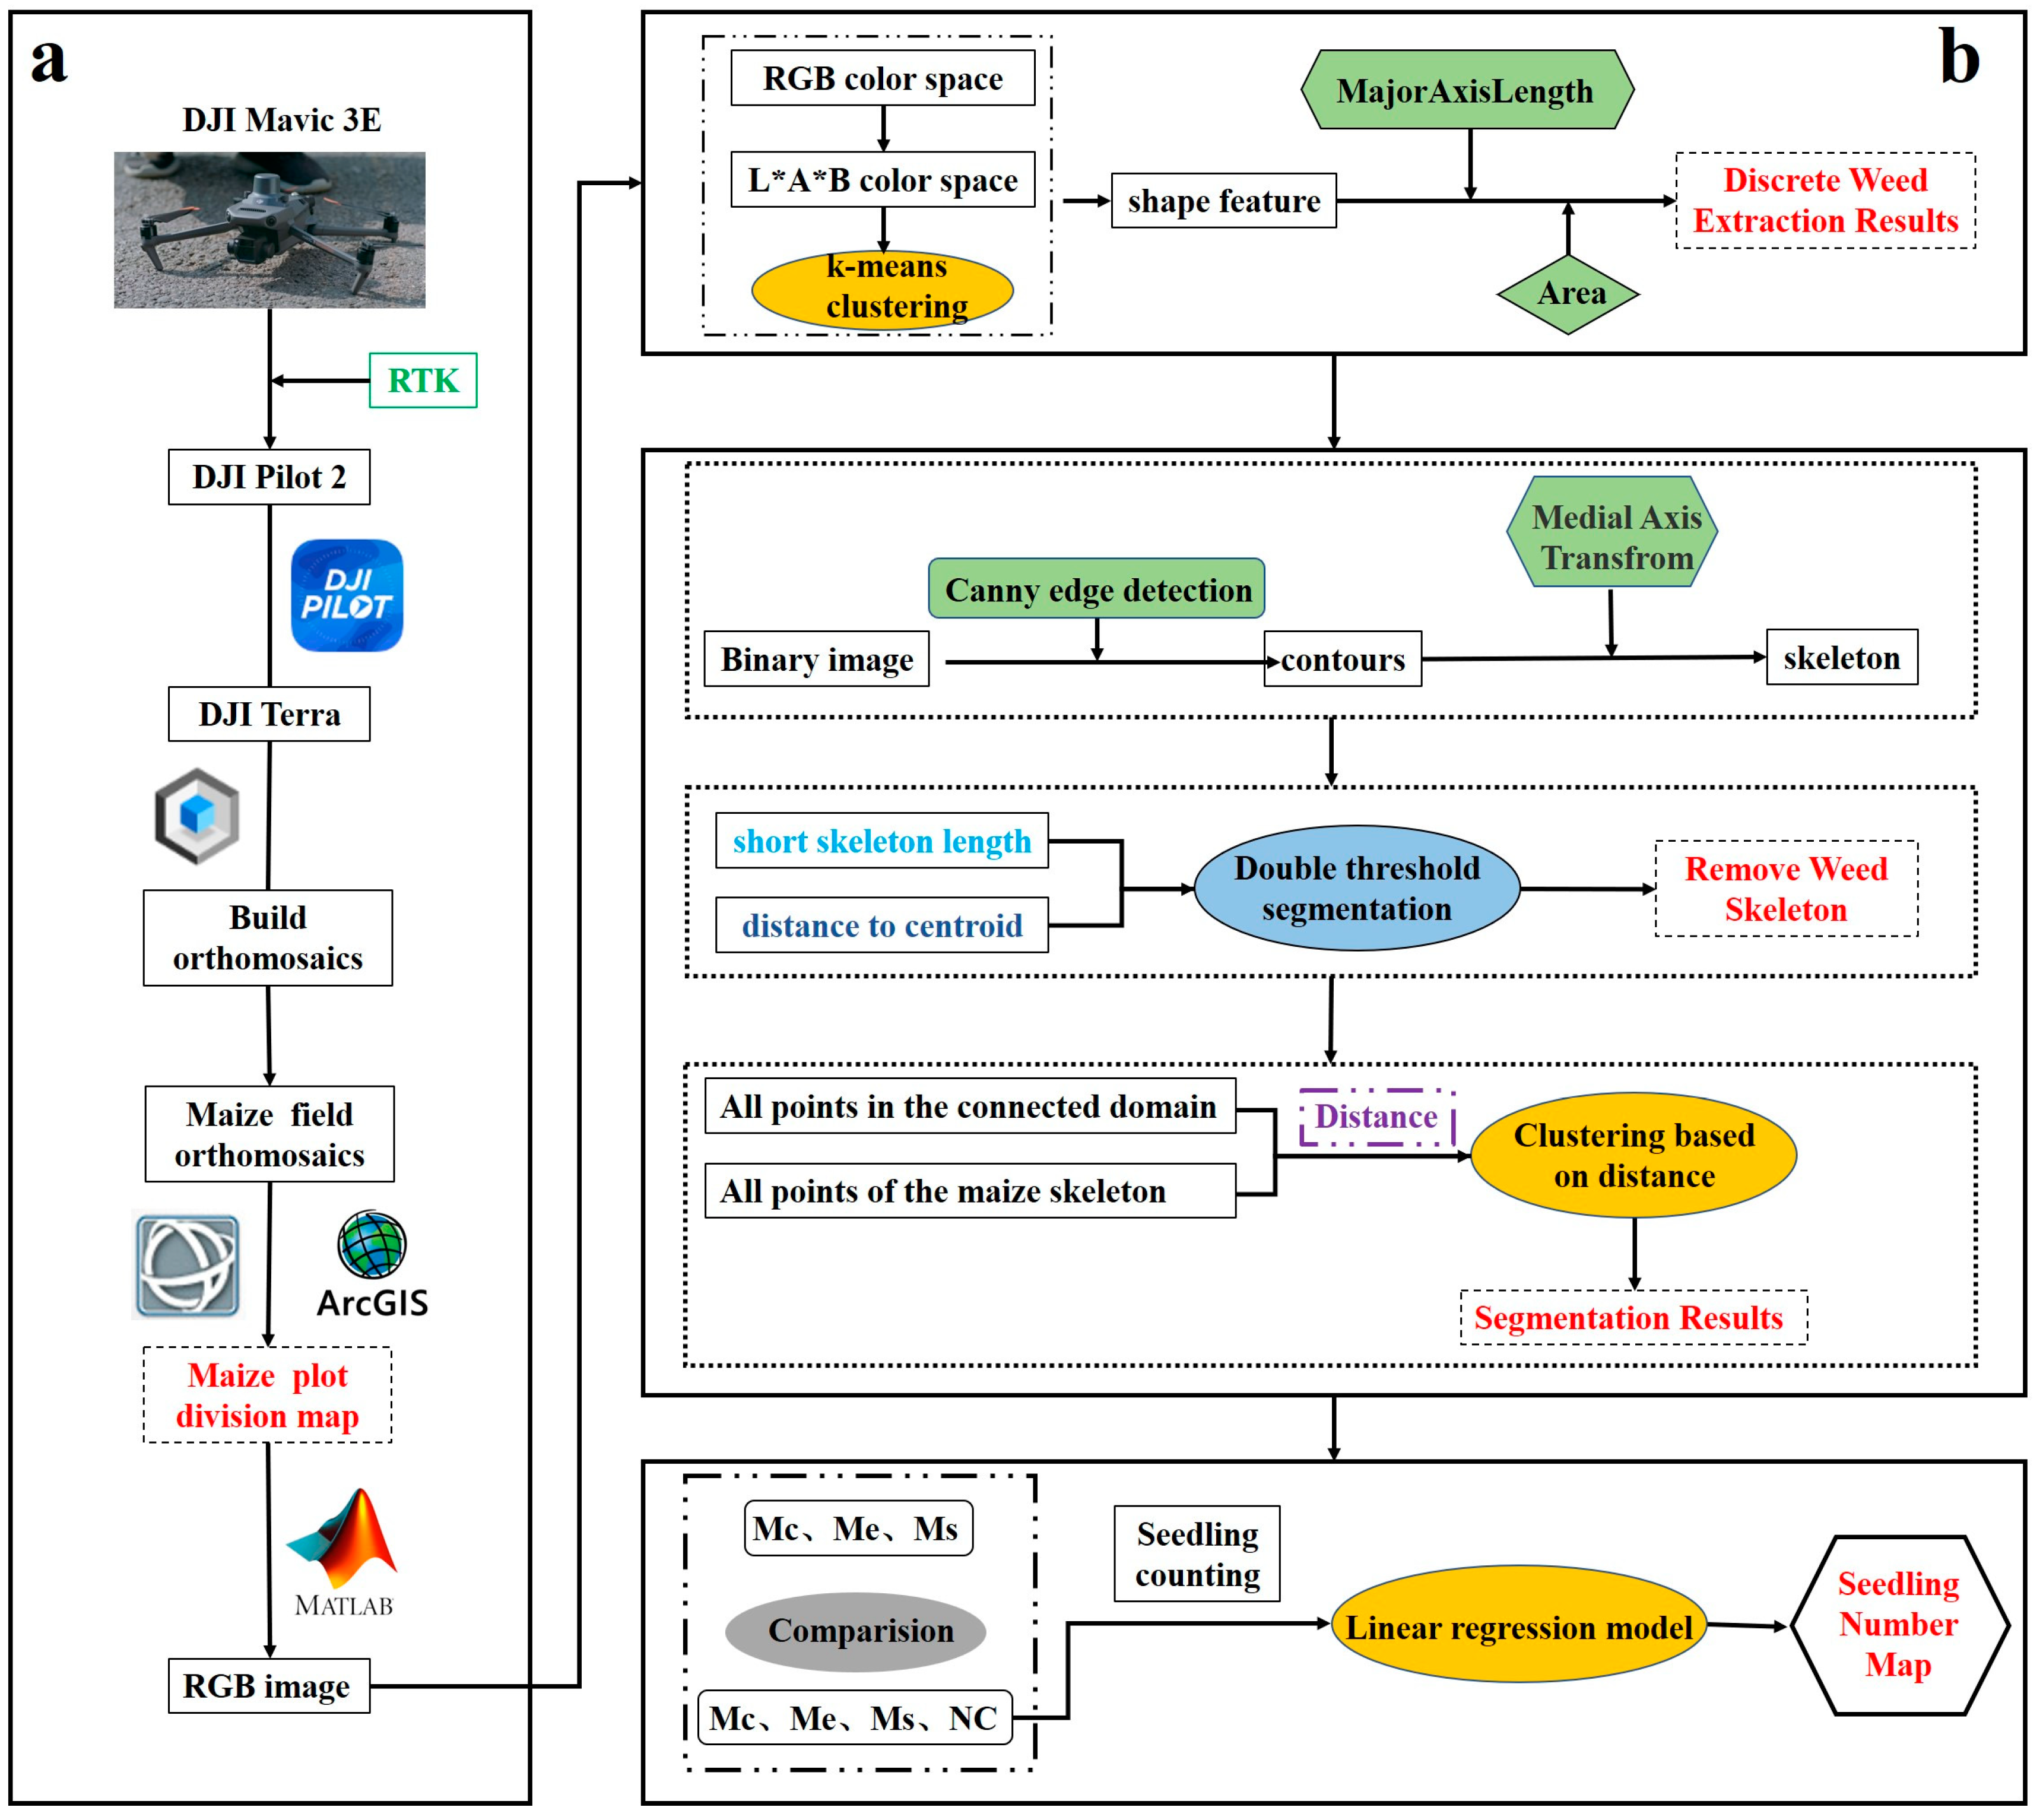
Figure 1. The workflow diagram of this study, including data acquisition, image processing and data analysis, model construction, and validation. ((a) Image acquisition and preprocessing process; (b) Maize counting process).
Agriculture 14 00175 g001
Figure 2. Distribution of weeds and maize in the experimental area.
Agriculture 14 00175 g002
Figure 3. Different methods to remove discrete weeds and segmentation threshold illustration ((a) Color feature: R; (b) color feature: G; (c) color feature: B; (d) original image; (e) image erosion method to remove the weed results; (f) shape feature weed removal results).
Agriculture 14 00175 g003
Figure 4. Adhesive weed segmentation combining skeleton thresholding and centroid distance ((a) Sticky weed image; (b) original skeleton; (c) skeleton classification; (d) DC = 50, BL = 50; (e) DC = 50, BL = 80; (f) DC = 50, BL = 200; (g) maize skeleton (DC = 100, BL = 85); (h) skeleton and coverage; (i) legend for parts (b,c)).
Agriculture 14 00175 g004
Figure 5. Weed area segmentation using the distance clustering method.
Agriculture 14 00175 g005
Figure 6. Flowchart of weed segmentation with different degrees of adhesion.
Agriculture 14 00175 g006
Figure 7. Comparison of results of different weed-control methods. ((a) Discrete weed removal effect; (b) Sticky weed removal effect).
Agriculture 14 00175 g007
Figure 8. The real number distribution of maize seedlings in the plot.
Agriculture 14 00175 g008
Figure 9. The results of estimating the number of seedlings (three characteristics: (a) no weeding (NW), (b) MP-5, (c) TS; four characteristics: (d) NW, (e) MP-5, (f) TS).
Agriculture 14 00175 g009
Figure 10. Maize seedling counting results under different seedling conditions. ((a) Few seedlings; (b) Many seedlings; (c) Few weeds; (d) Many weeds).
Agriculture 14 00175 g010
Figure 11. Estimation results of drone images.
Agriculture 14 00175 g011
Figure 12. Comparison of characteristics of maize and weeds at the seedling stage. ((A) Multispectral reflectance; (B) Vegetation index; (CE) Color characteristics; (FM) Texture characteristics; (N) Plant height).
Agriculture 14 00175 g012
Figure 13. Maize seedling number estimation results ((a,b) Jiangsu, China; (c) distribution map of measured maize seedling numbers; (d) distribution map of estimated maize seedling numbers).
Agriculture 14 00175 g013
Table 1. Estimation accuracy under different methods and feature combinations.
TreatmentCombination of FeaturesTrue ValuesPredictedAccuracy (%)
NWMc, Me, Ms1670158795.02
Mc, Me, Ms, NC1670159095.21
MP-5Mc, Me, Ms1687162496.27
Mc, Me, Ms, NC1687163096.62
TSMc, Me, Ms1620158998.09
Mc, Me, Ms, NC1620160799.20
Table 2. Experimental parameters at different flight heights.
Flight Height (m)GSD (cm/px)Flight DurationR2
120.5510 min 41 s0.83
150.698 min 28 s0.76
200.926 min 15 s0.72
251.154 min 45 s0.55
301.384 min 1 s0.49
Table 3. Time required for training and prediction by different methods.
Model Training + Prediction Time
Number of samples501001502003001000
K-means23.62 s44.25 s65.64 s84.98 s128.08 s-
Corner detection model25.13 s48.76 s72.65 s95.24 s139.47 s-
Methods in this article15.22 s30.08 s43.73 s57.45 s86.37 s-
Faster R-CNN-----3 h 25 min
Table 4. Model running environment.
Detailed Configuration
CPUIntel(R) Core (TM) i7-10700K
RAM16 GB
GPUNVIDIA GeForce GTX 1660 SUPER
Disclaimer/Publisher’s Note: The statements, opinions and data contained in all publications are solely those of the individual author(s) and contributor(s) and not of MDPI and/or the editor(s). MDPI and/or the editor(s) disclaim responsibility for any injury to people or property resulting from any ideas, methods, instructions or products referred to in the content.