1. Introduction
Wheat is one of the three major food crops in the world, and it is also the main crop, commodity grain, and reserve grain variety in China. Therefore, guaranteeing the production of wheat is of great significance to China’s food security. Disease is the most important factor affecting wheat production, and Wheat Scab, one of the major and frequently occurring diseases in the main wheat-producing areas, is also called wheat cancer [
1,
2].
In general epidemic years, Wheat Scab can cause a 10–20% yield loss of wheat; in a pandemic year, it can lead to no harvest. In addition, Wheat Scab breaks out rapidly, it is extremely difficult to cure the disease after it occurs, and pesticide pollution easily occurs during the control process. Therefore, the detection and prevention of Wheat Scab is of great significance to current wheat production.
Wheat Scab is a disease caused by a variety of Fusarium species. The diversity of Fusarium species on wheat ears in twenty-six regions of eight provinces in China was investigated, and it was found that
Fusarium graminearum (Fg) and
Fusarium asiaticum (Fa) were the two main pathogens causing Wheat Scab in wheat-producing areas in China [
3]. The two Fusarium spore pathogens come in the form of hyphae, conidia, or ascus, which are saprophytic in wheat over summer and winter, and then spread and infect wheat ears through wind and rain, resulting in an outbreak of Wheat Scab [
4].
The conventional monitoring methods for Wheat Scab can be divided into three kinds: manual detection, meteorological prediction, and pathogen source detection. The manual detection method refers to the visual investigation of wheat in the field by experienced professionals during the outbreak of disease to evaluate the severity of the disease. Although this method is simple and easy to use, it has the disadvantages of strong subjectivity and easy misjudgment. The meteorological prediction method uses a corresponding model to diagnose and grade the Wheat Scab disease based on meteorological factors. Although this method has a high accuracy, the key shortcoming of the prediction model is that it is difficult to determine the results and they need to be verified over a long period. The method of detecting the pathogen source refers to the manual collection of spore samples in the field and the observation of the type and quantity of scab spores under a microscope to determine the degree of disease. Although this method is accurate, more efficient than other disease detection methods, and can quickly classify and diagnose wheat scab, the Wheat Scab spore targets are too small and the number of them is too large, and intra-class and inter-class differences in pathogenic spores are difficult to distinguish, so the process is complicated and time-consuming.
Aimed at the problem that it is difficult to distinguish between the same and different species of two pathogenic spores of wheat fusarium spores, we propose a lightweight decoupled Wheat Scab spore detection network based on Yolov7-tiny (GSD-YOLO). The network adopts an improved Spore-Copy data augmentation strategy, and uses decoupled head and GSConv modules to achieve a balance between algorithm accuracy and speed. In addition, the algorithm also takes into account the limitations of the storage space and power consumption of the actual field detection equipment, which can efficiently and quickly detect the microscopic image of pathogenic spores of Wheat Scab, and can also provide some technical support to the prevention of scab disease.
2. Related Work
With the development of agricultural machine vision, domestic and foreign scholars have made some progress in target detection in the field of pathogen spore imaging. In traditional machine learning, Qi et al. used distance transform and an improved watershed algorithm to detect adhesion spores based on morphological features such as ovality and complexity, and the accuracy of their method reached 98.5%, but the feature extraction process was more complicated [
5]. Wang et al. proposed an additive cross-kernel support vector machine (IKSVM) method for rice blast spore detection by extracting the HOG features of spore images, which achieved a detection rate of 98.2%, but the detection took too long [
6]. In deep learning, Dai et al. assessed RGB images of Wheat Scab based on image processing and the Deeplabv3+ model and obtained an average accuracy of 0.969 [
7]. Tahir et al. proposed new detection architectures based on a CNN and obtained a 94.8% accuracy on 40,800 images of five fungal spores [
8]. Zhang et al. proposed a multi-layer fusion structure network based on FSNet and achieved an average detection accuracy of 91.6% on the fungal data set through measures such as anchor optimization and regional sampling strategy improvement [
9]. In summary, the machine vision method must extract features from the image in advance to detect, but the process is not efficient and is time-consuming and laborious. In deep learning, the detection of Wheat Scab is mostly based on macroscopic disease detection, and there are few studies on the detection of internal microscopic spores. In comparison, our method for the prevention of Wheat Scab disease is faster and more efficient.
3. Materials and Methods
3.1. Spore Microscopic Image Acquisition
The pictures of Wheat Scab spores used in the experiment were taken by the Anhui Academy of Agricultural Sciences. The strains used in the experiment were the two main pathogenic spores of Wheat Scab in China,
Fusarium asiaticum (strain number fa) and
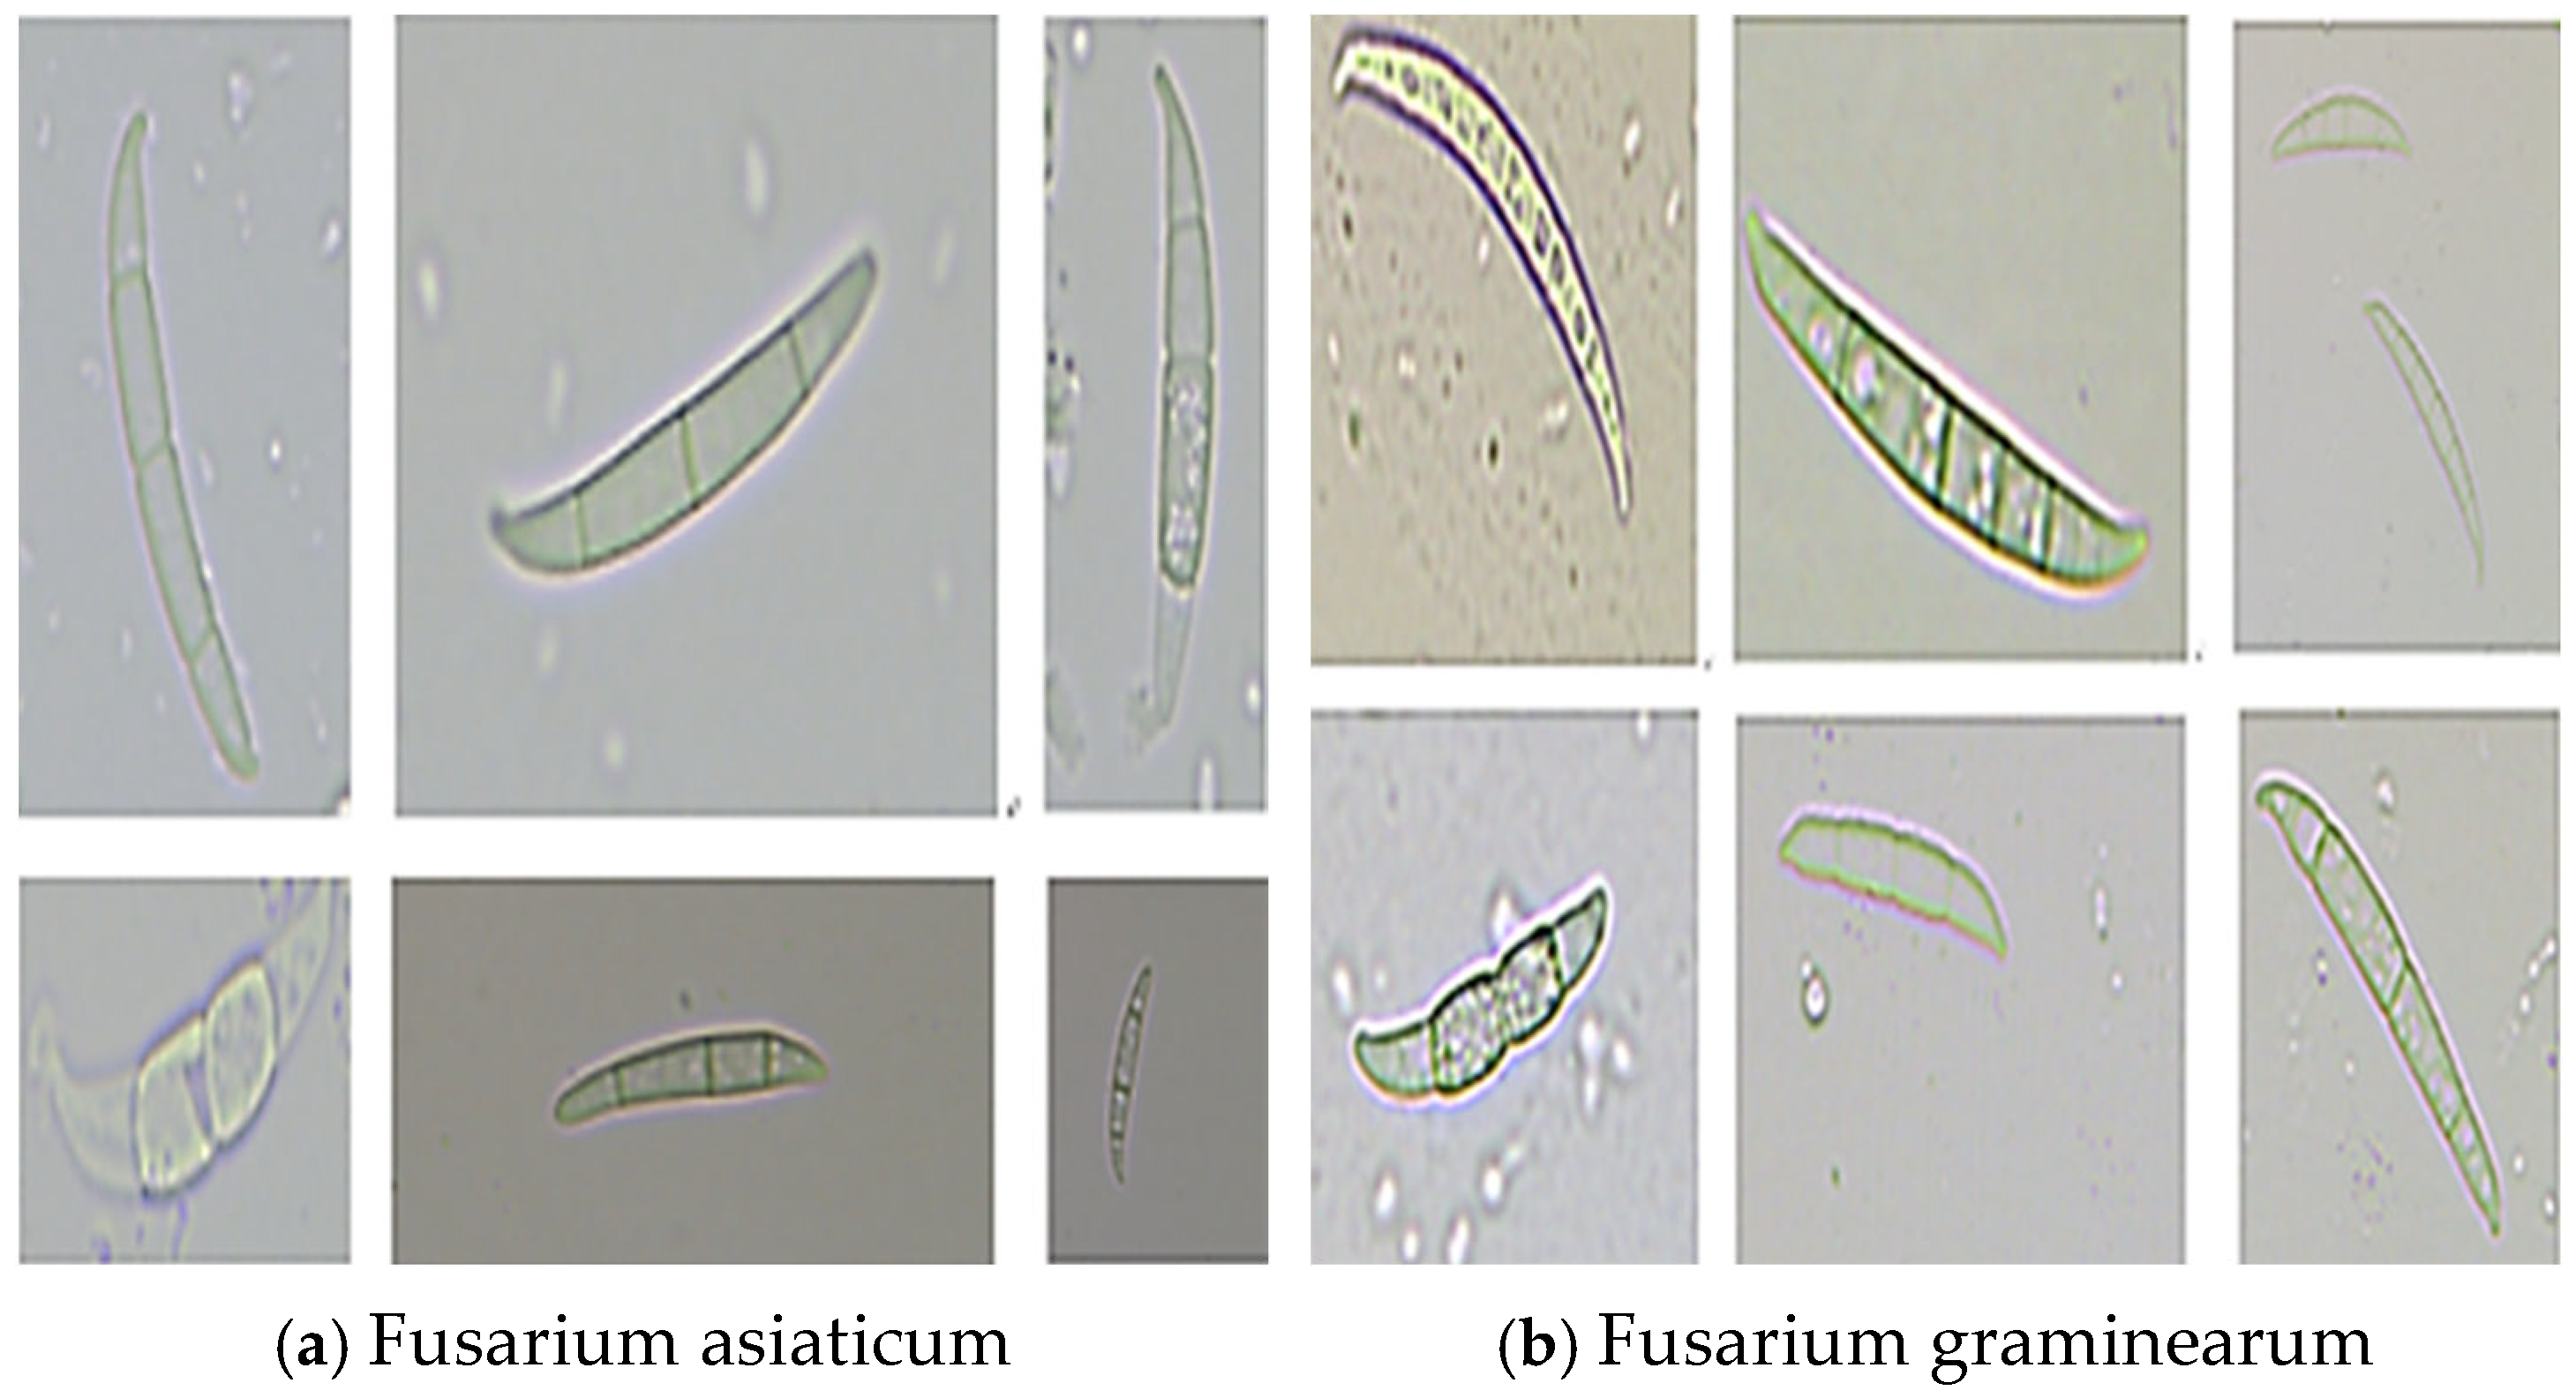
Fusarium graminearum (strain number fg). At the same time, to fit the actual farmland environment, other hybrid spores were randomly added. The two pathogenic spores are shown in
Figure 1. It can be seen from the picture that the two pathogenic spores Fa and Fg are generally sickle-like, long, and narrow in size, with multiple transverse cell membranes in the body, and random mottling. There is no obvious distinction between the other two types of spores, and the morphology and size of single species spores are also different, showing polymorphism.
3.2. Spore-Copy Data Augmentation
In the data collection process for the two main pathogenic spores of Wheat Scab, the spores obtained by laboratory culture and actual farmland capture will have different impurities, light, noise, dust, and spore integrities. Therefore, an improved data enhancement method (Spore–Copy) based on Copy–Paste is proposed, which can reduce the error caused by the actual situation of laboratory fitting.
Copy–Paste was originally used as an enhancement technique to diversify the sample space in the field of segmentation. It mainly splits the target from the source image to create a target image to obtain new data samples. In this paper, an improved Copy–Paste data augmentation strategy (Spore–Copy) is proposed for the characteristics of small and polymorphic pathogenic spores of Wheat Scab. Based on the microscopic images of pathogenic spores in the laboratory, a large amount of training data was automatically generated to fit the actual field conditions. In addition, Spore–Copy is also an effective method to expand the sample size, which can enhance the generalization ability of the model [
4].
The specific steps of Spore–Copy are as follows: (1) Prepare the data set and labels to be segmented; (2) cut the ROI image of the target spore according to the label, and record the spore species category and save the image; (3) randomly disrupt the ROI image and set the spore replication threshold of the data set to be enhanced. (4) Gaussian noise injection (simulating natural conditions), brightness change (simulating field illumination), image scaling (simulating spore polymorphism), random interception (simulating field spore breakage), and other operations were performed on all cut ROI spore images to fit the actual field conditions. (5) Coordinate transformation was performed, and the target ROI image was randomly embedded into the spore image to be enhanced by Poisson fusion.
The calculation formulae for Gaussian blur and the scaling of ROI spore images are shown in (1) (2); the calculation formula for the Poisson fusion of ROI spore images is shown in (3) [
10].
The initial data set of the two main pathogenic spores of Wheat Scab included 7000 images, and the image size was 640 ∗ 640. Then, the data set was expanded to 20,000 images by using the above Spore–Copy enhancement algorithm (7000 images consisted of fa single-species spores and fg single-species spores, while the rest consisted of mixed fa and fg spore images obtained by Spore–Copy data enhancement). In addition, the data set was divided into training, test, and validation sets at a ratio of 8:1:1.
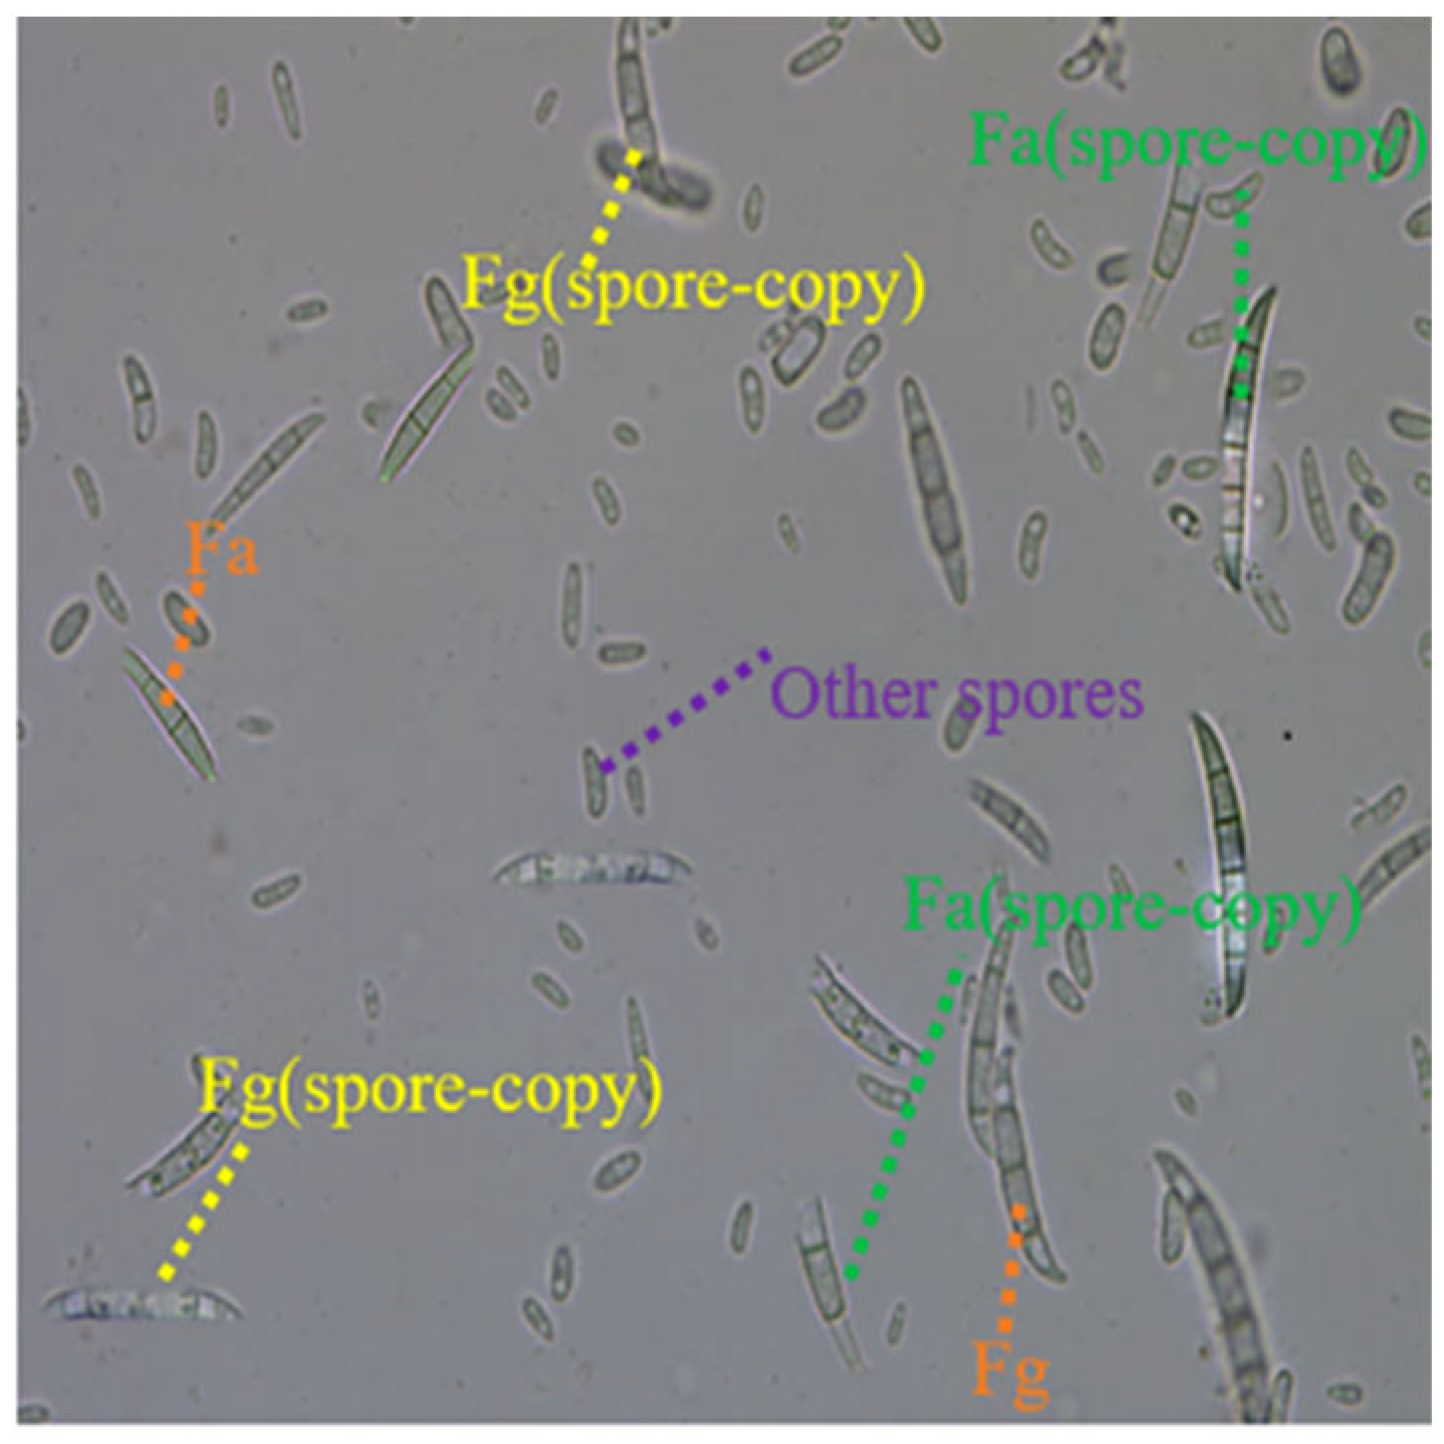
The data set of Wheat Scab spores treated by Spore–Copy is shown in
Figure 2. It can be seen from the diagram that the two pathogenic spores fused by the Spore–Copy operation are not much different from the pathogenic spores in the original data set, and the newly embedded spores are more diverse and more suitable for real natural conditions than the original spores.
In the formula,
G(
x,
y) is the pixel value of the ROI image, and
σ is the standard deviation of normal distribution.
In the formula, (
x,
y) is the coordinate before image pixel scaling, (
sx,
sy) is the coordinate after image pixel scaling, sx and sy are scaling factors.
In the formula, V is the image to be fused, f^* is the target image, and f is the fused image; Ω represents the region to be fused, and ∂Ω represents the edge part of the fusion region.
4. GSD-YOLO
4.1. GSD-YOLO General Framework
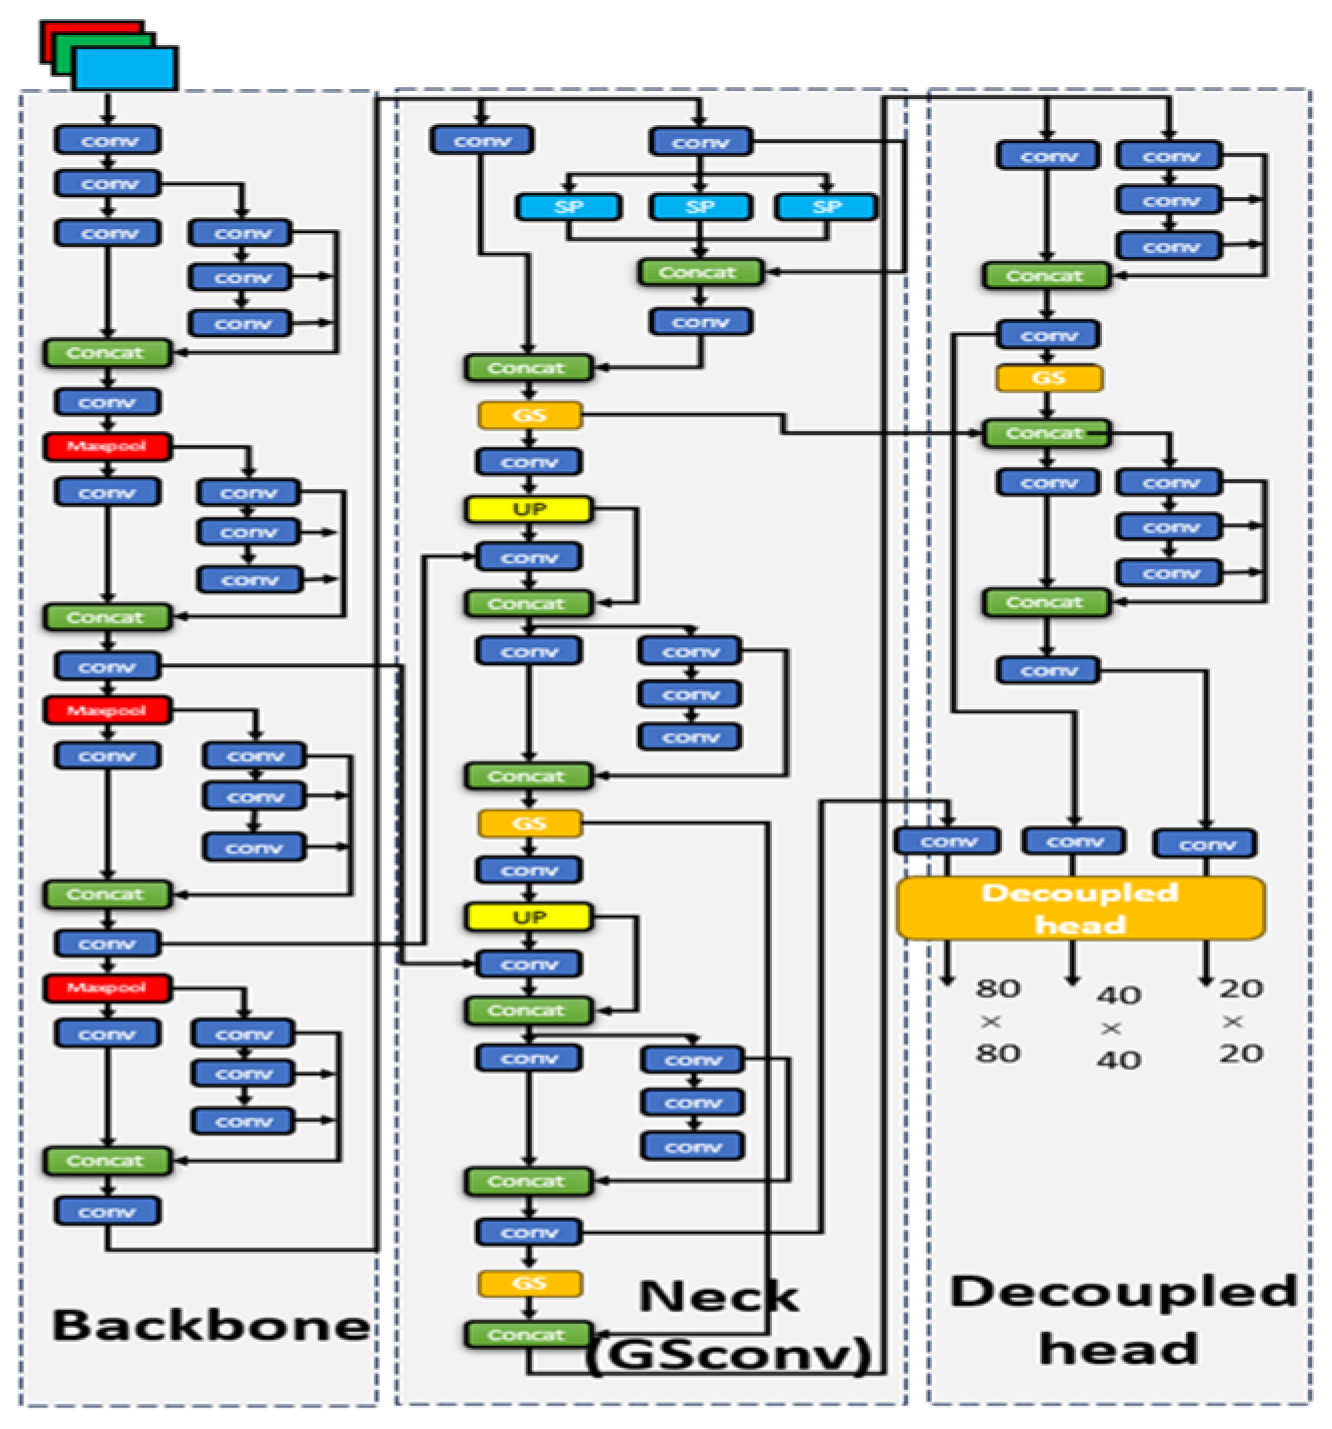
The GSD-YOLO network structure is mainly composed of three modules: Backbone, Neck, and Head. The Backbone module follows the feature extraction layer of the Baseline network Yolov7-tiny, which is mainly composed of Conv, E-ELAN, and MPConv. E-ELAN is an efficient network design method, which solves the problem of a low utilization of model parameters [
11,
12]. The Neck module mainly uses the “FPN+PAN” structure to realize the mutual transmission of high-dimensional and low-dimensional information. In addition, the lightweight GSConv module is embedded into the maximum channel information dimension and the minimum spatial information dimension to reduce the number of model parameters [
10]. At the same time, a balance between model accuracy and speed is realized. It is worth mentioning that the original paper that established GSConv found through experiments that, if GSConv is used throughout the network, the network depth will be greatly deepened and the model inference speed will be reduced. It is a better choice to use GSConv only in the Neck where the channel information dimension is the largest and the spatial information dimension is the smallest. Finally, in the Head module, a decoupled head is added to improve the detection performance and accelerate the network convergence speed [
13]. The overall structure of the GSD-YOLO network is shown in
Figure 3.
4.2. Decoupled Head
The Yolov7-tiny head is a typically coupled head, and its detection module sends the feature map output by the convolution layer directly into several fully connected layers or convolution layers to generate the desired target location and category. However, due to the different regions focused on during localization and classification, if the two tasks use the same feature map, it will lead to a spatial misalignment problem [
14,
15]. At the same time, this coupled detection concept requires a large number of parameters and computing resources and is prone to overfitting.
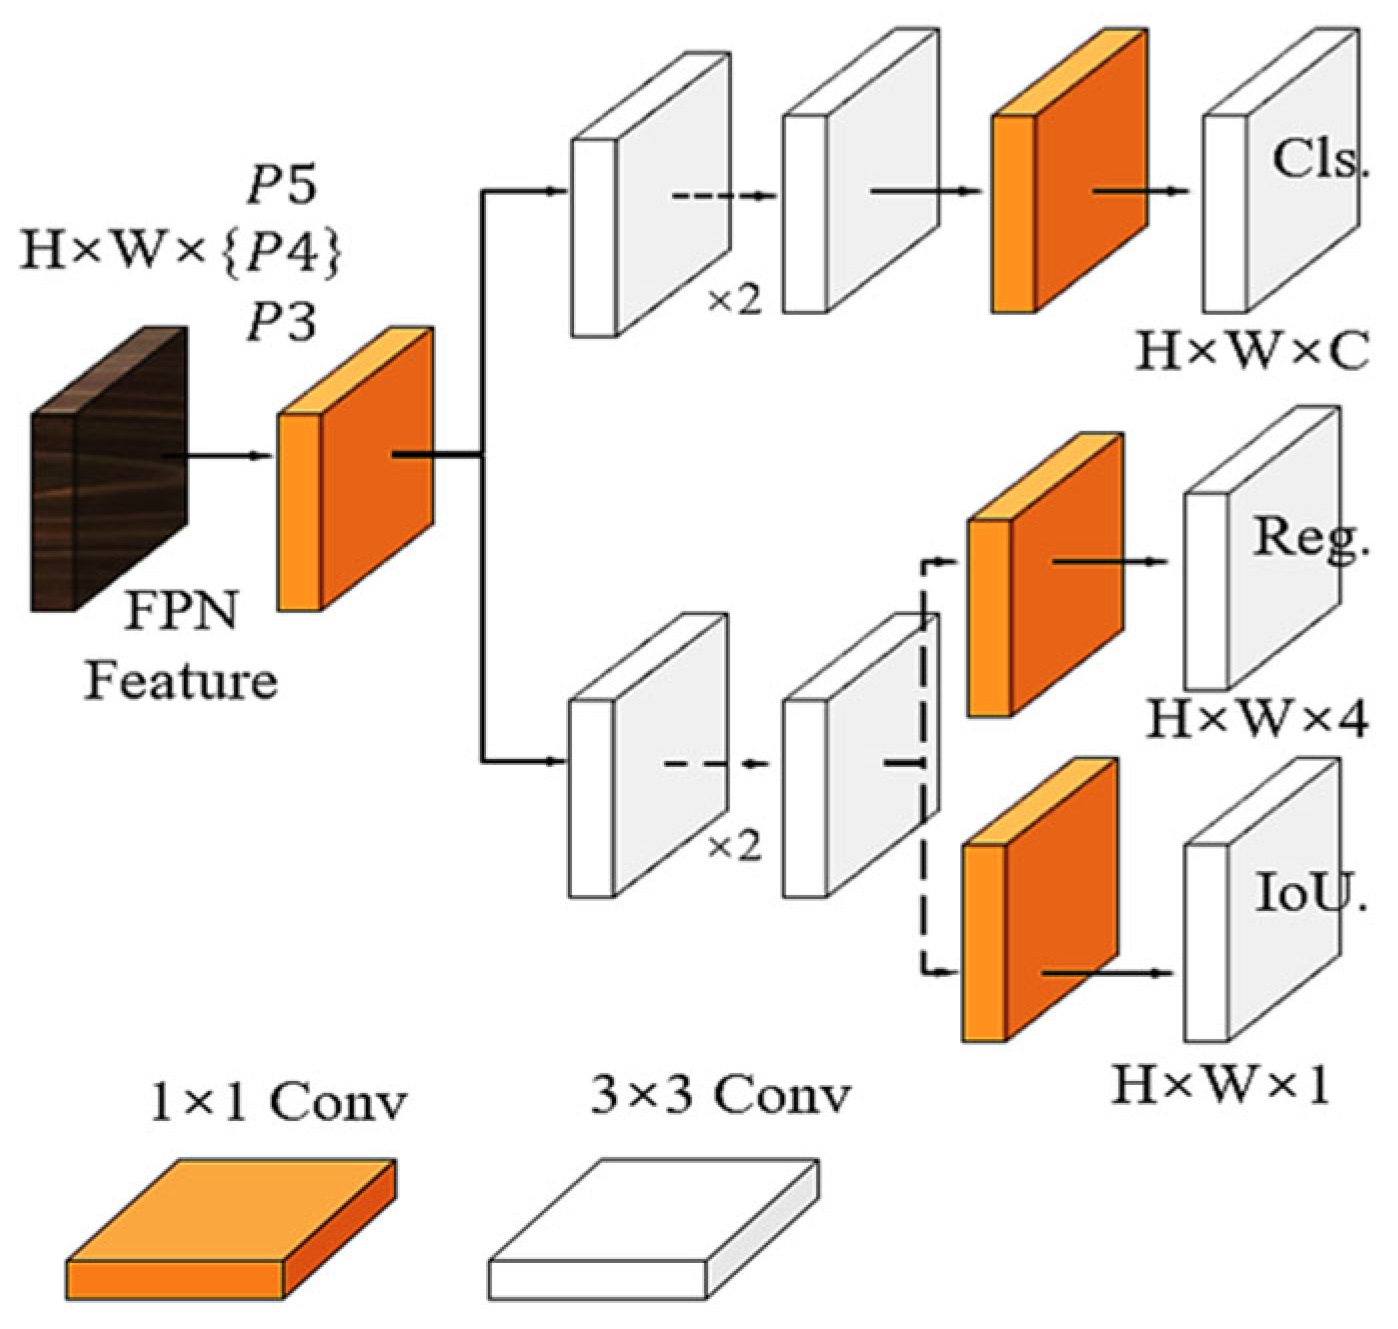
Therefore, we adopted a decoupled head structure to separate the information needed for localization and classification tasks, and finally fused them, which can improve the detection accuracy and accelerate the network convergence speed.
The specific structure of the decoupled head is shown in
Figure 4. It can be seen from the diagram that after the decoupled head separates the feature map with different branches, the classification task can better compare the extracted features, while the localization task can pay more attention to the bounding box parameters.
4.3. GSConv Lightweight Module
In the field of detecting Wheat Scab spores in actual agricultural fields, the deployment of equipment results in storage space and power consumption limitations, so it is necessary to carry out lightweight processing on the network model.
Although the traditional ordinary lightweight model can improve the speed of the detector, it lacks detection accuracy. Therefore, this paper uses a new lightweight module GSConv to optimize the model, so as to achieve the balance between model accuracy and speed [
16,
17].
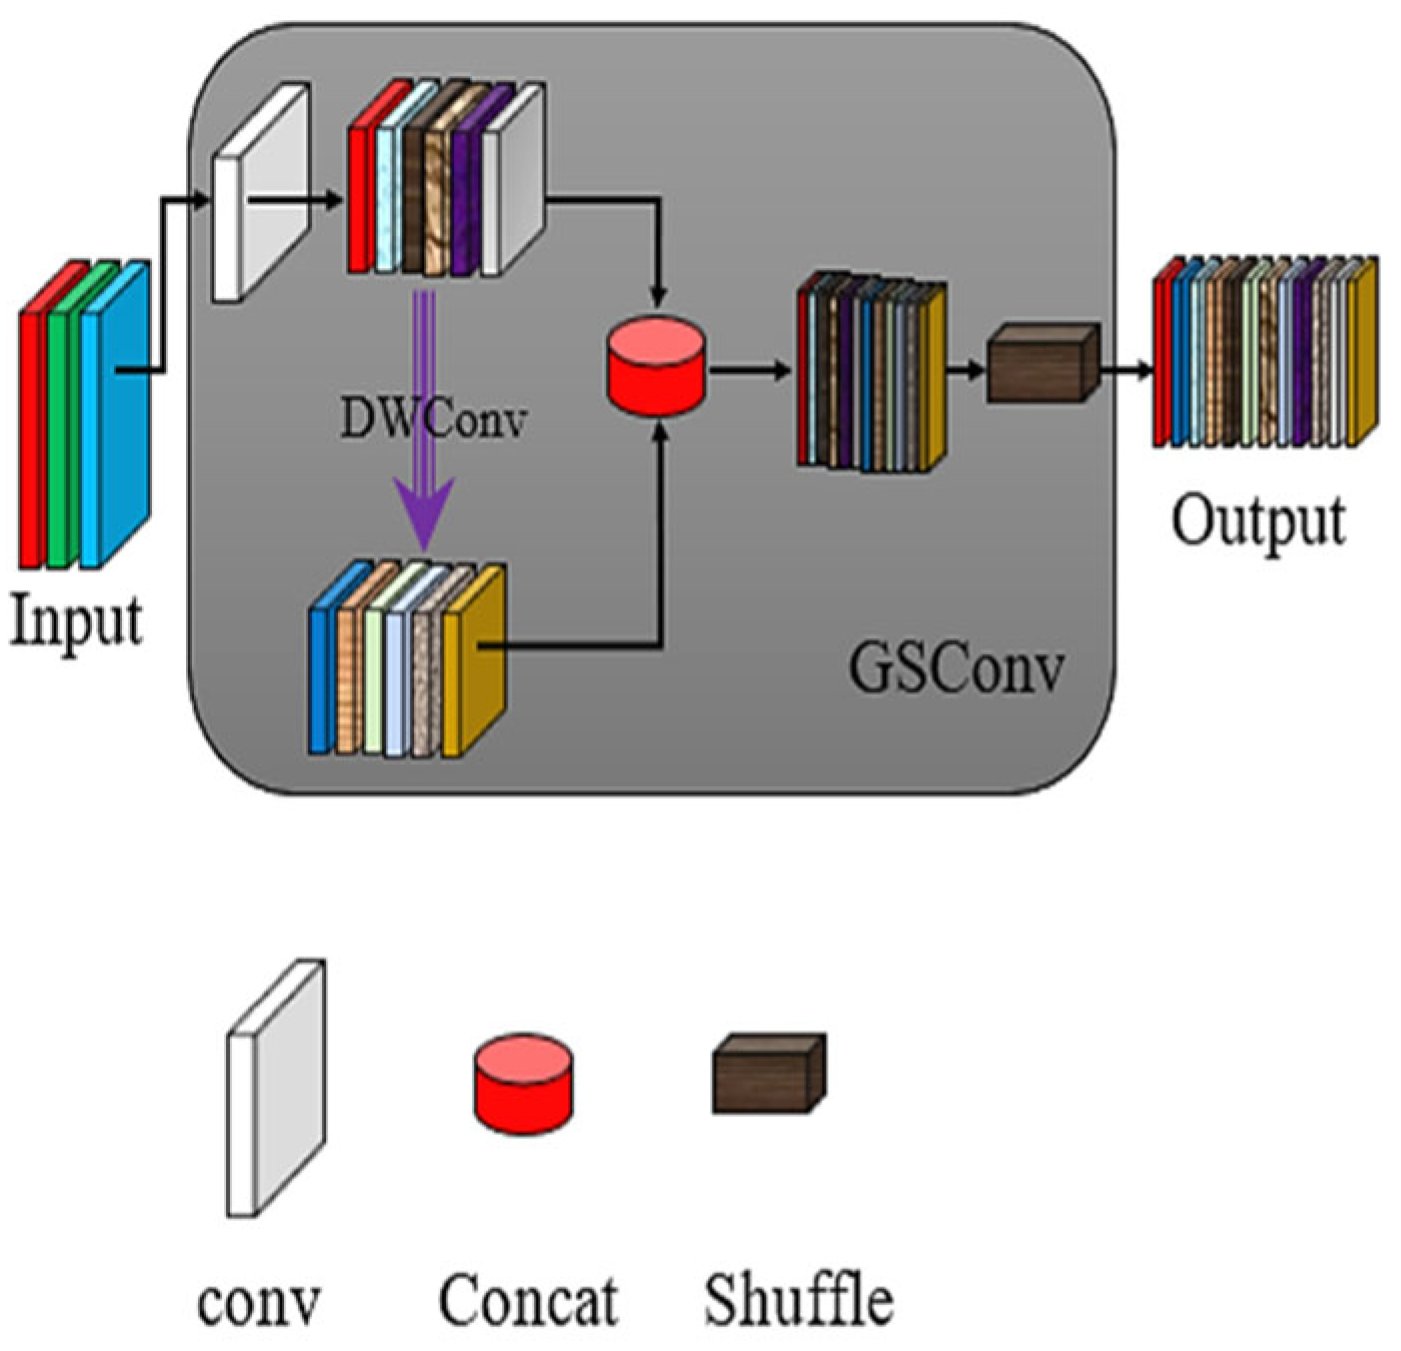
The specific structure of the GSConv module is shown in
Figure 5. It can be seen from the diagram that GSConv combines standard convolution, deep separable convolution, and shuffle mixed convolution to construct a new convolution layer to meet the requirements of both accuracy and speed.
In addition, embedding GSConv will deepen the depth of the network and reduce the speed of model reasoning, so only the lightweight module GSConv is used at a key point in the neck layer of the network model.
5. Experiments
5.1. Experimental Environment and Parameter Settings
The experiment was carried out under the PyTorch framework. The equipment used was NVIDIA GeForce RTX 3070 (NVIDIA Corporation, 2788 San Tomas Expressway, Santa Clara, CA 95051, USA). According to the characteristics of pathogenic spores of wheat head blight, the following training parameters were set: the training batch included 16 images; the training iteration period was 300 s; the target confidence threshold was 0.5; the initial learning rate was 0.01; and the weight attenuation coefficient was set to 0.0005.
5.2. Comparisons with Existing Methods and Evaluation Indicators
In order to verify the performance of the GSD-YOLO (CNN core, one-stage) network proposed in this paper, the comparison network was selected from several different options, namely the baseline network Yolov7-tiny, the traditional one-stage detection algorithm SSD [
18], the classic two-stage detection network Faster-RCNN [
19], and the Detr network (Transformer core) [
20].
In addition, mAP50, Precision, Recall, and other parameters were selected as model evaluation indicators. Some of the test evaluation index calculation formulae are as follows:
In the formula, TP represents the number of objects detected in the data set. FP represents the error in the number of objects detected by the detection model. FN represents the number of objects missed by the detection model.
5.3. Experimental Results and Analysis
A comparison of the detection results between the GSD-YOLO model and the above-mentioned network model is shown in
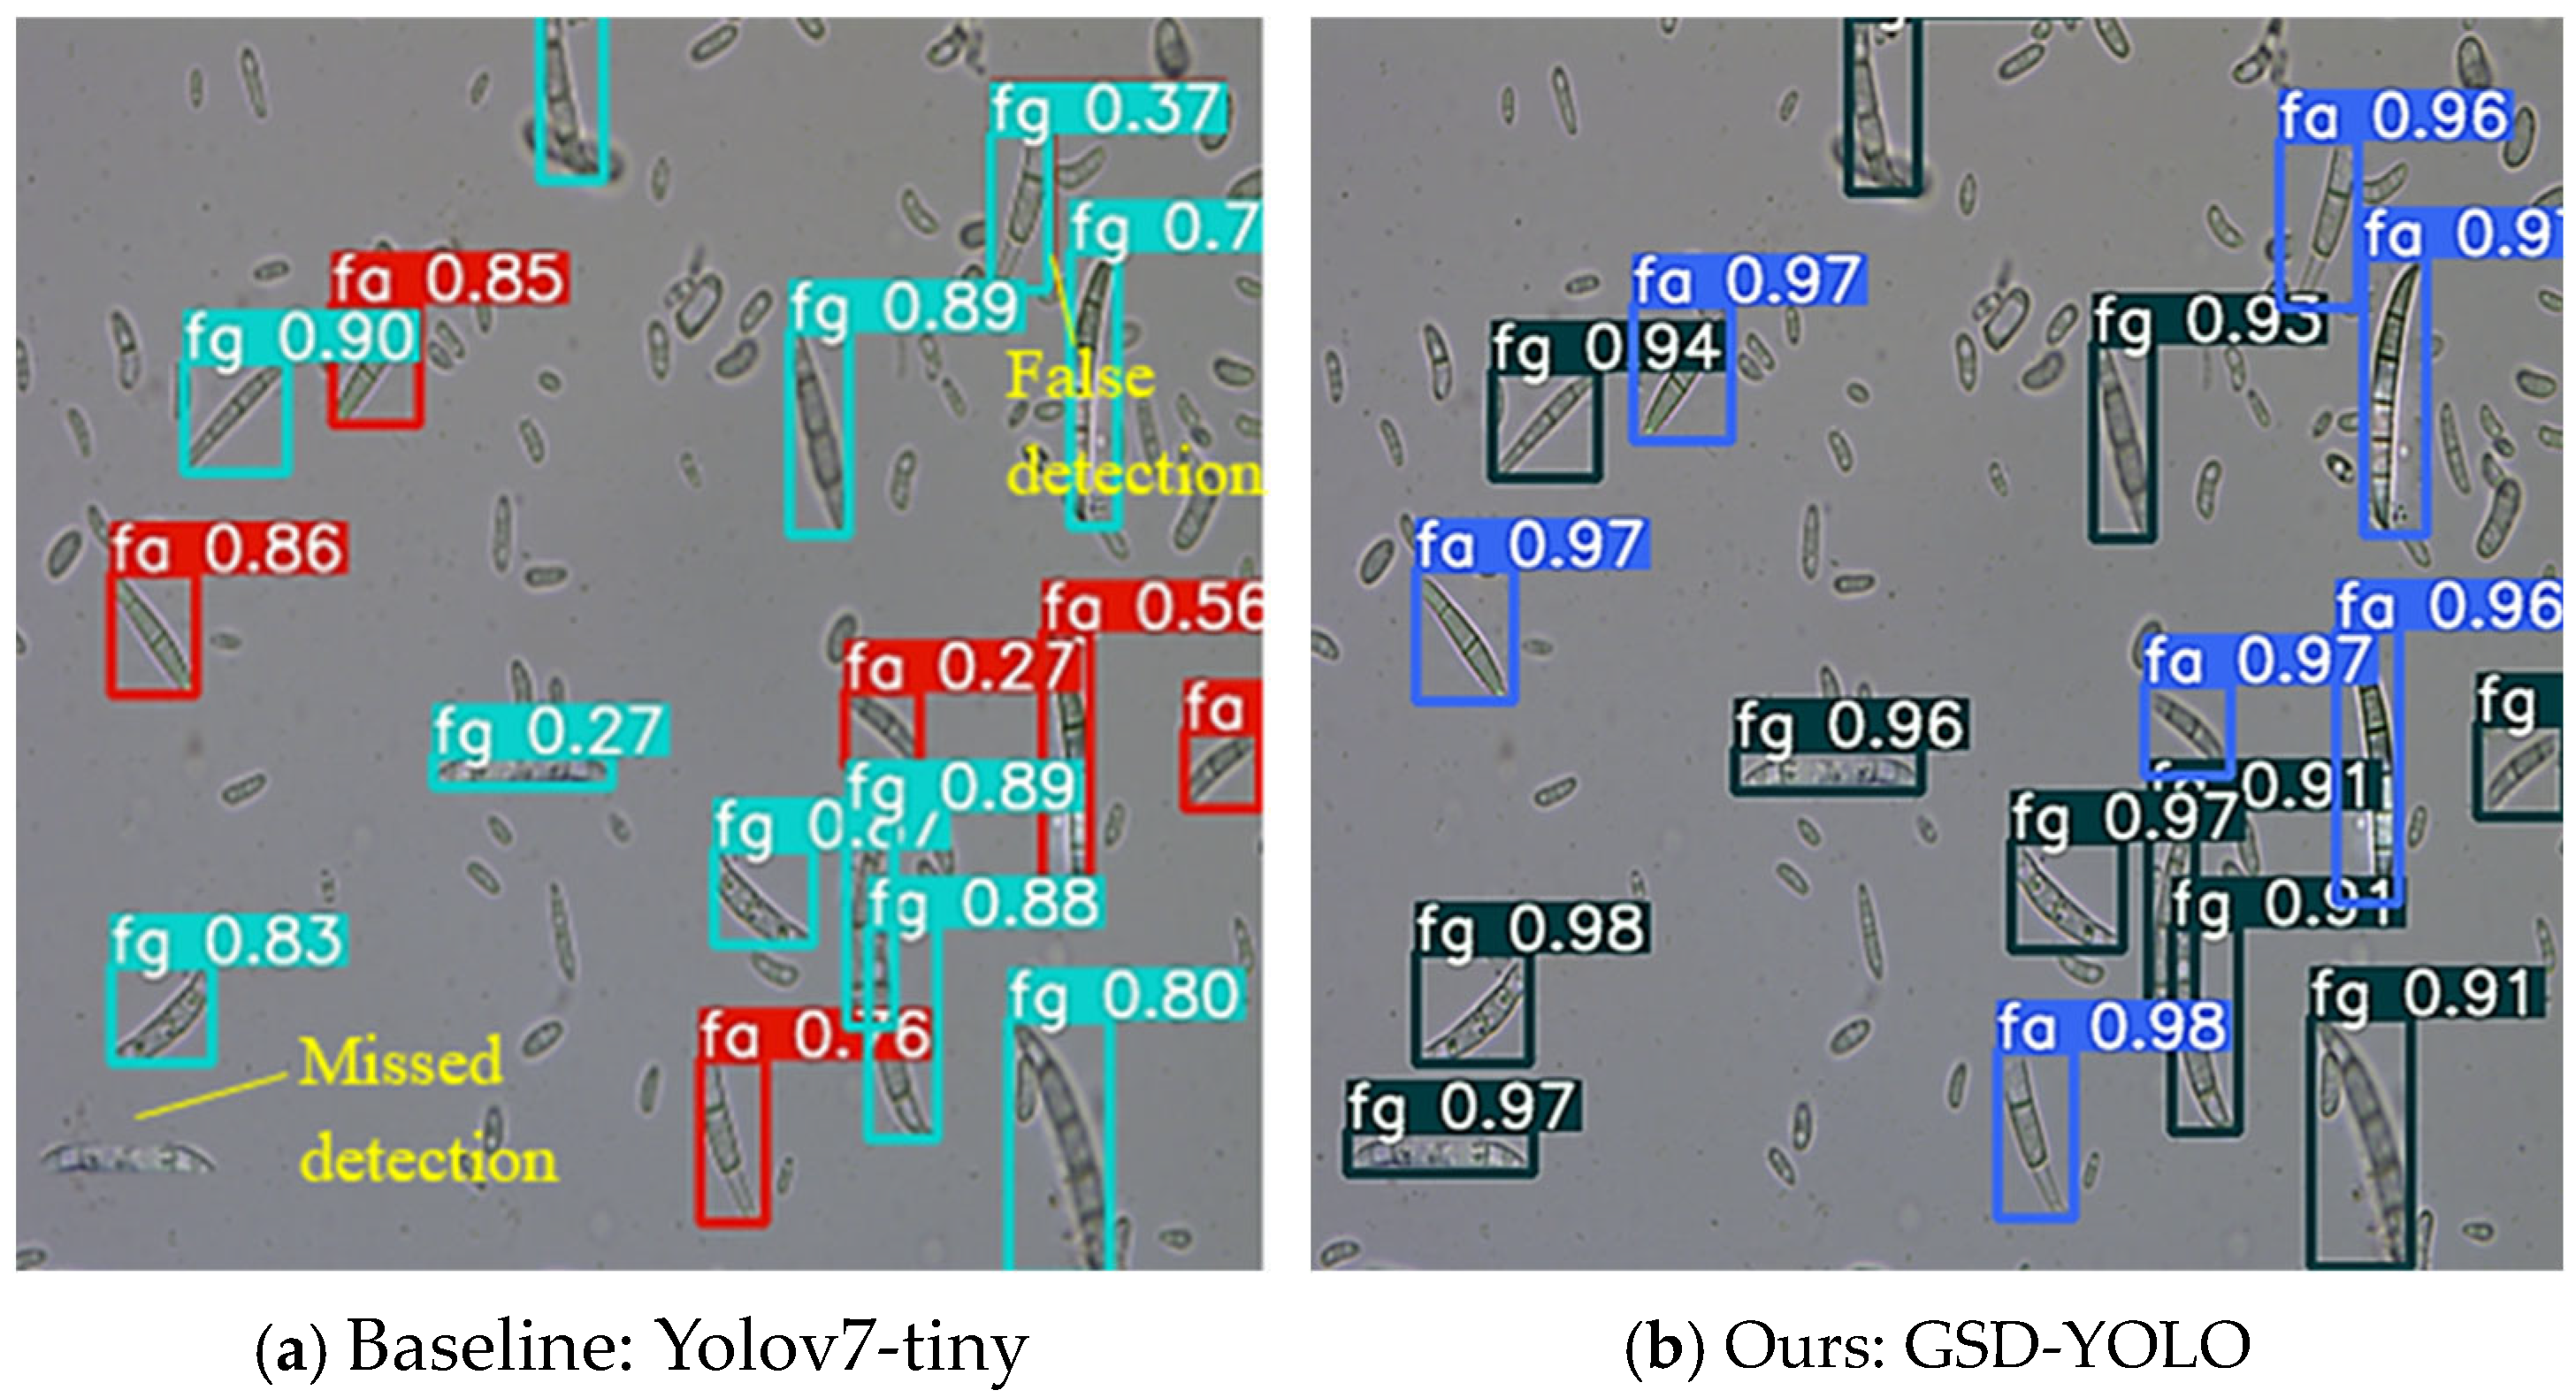
Table 1, and the detection effect diagram is shown in
Figure 6. It can be seen from
Table 1 that GSD-YOLO has a 3.9% improvement in mAP compared with the original baseline network Yolov7-tiny, and the accuracy and regression rate have been greatly improved. Although the network computing inference time and network parameters are affected to some extent after embedding the decoupled head and the lightweight module GSConv, compared with the other network models, GSD-YOLO still has an advantage, which meets the application requirements of hardware deployment and real-time detection.
From
Figure 6, compared with the baseline network Yolov7-tiny, GSD-YOLO has a more detailed feature extraction of the two pathogenic spores, which solves the problem of the two spores being difficult to distinguish. At the same time, GSD-YOLO can also correct the problem of missed detection and false detection in the baseline network; that is, the network has stronger localization and classification performances for the two pathogenic spores.
In addition, in order to explore the role of the components of the GSD-YOLO network, we performed ablation experiments. The experimental results are shown in
Table 2. It can be seen from the results in the table that the role of the decoupled head is to improve the detection accuracy and the number of floating-point operations, but as the network becomes deeper, its network parameters and detection speed are affected. The function of the GSConv module is to reduce the number of network parameters while maintaining detection accuracy and speed [
21,
22].
5.4. Model Generalization Experiment
In the setting of detecting spores of Wheat Scab in the field, due to the influence of various environmental factors such as wind, rain, and the atmosphere, microscopic images of spores obtained usually have complex backgrounds and many impurities. At the same time, if other wheat diseases break out, other disease spores will be mixed into the image, and these factors will have a certain impact on the detection. Therefore, the generalization performance of the GSD-YOLO proposed in this paper was tested.
Firstly, a batch of new spore data sets was obtained, and pollen, dust, and other disease bacteria were added. Then, Spore–Copy was used to fit the actual data in the data set from the field. Finally, two experiments were set up. In experiment 1, the spore data set was divided into three types: single fa pathogenic spores, single fg pathogenic spores, and mixed fa + fg pathogenic spores. In experiment 2, the spore data set was divided into four gradients according to the number of spores for the density of pathogenic spores (the number of spores in the image is enhanced by the Spore–Copy pre-control). The experimental results are shown in
Table 3 and
Table 4 (the number of experimental images in each group is 2000).
As can be seen from the results in
Table 3, GSD-YOLO’s detection accuracy decreases in the face of new data that are more fitting with reality. In addition, comparing the two pathogenic spores of Fg and Fa, the characteristics of Fg are clearer than those of Fg, and it can be more easily identified by the network in the polymorphic fungal environment.
From the results in
Table 4, it can be seen that the density of F.graminearum spores has a certain influence on the detection accuracy of GSD-YOLO, and the greater the density, the greater the influence. This is because, when the source density increases, the two main pathogenic spores are altered due to polymorphism, and the growth cycle leads to false detections in the model network; at the same time, the increase in the density of the bacterial source will also lead to adhesion and coverage of the target spores, and these factors will make the neural network miss detections. To sum up, the detection accuracy of the network model will decrease to a certain extent.
6. Conclusions
Aimed at the problem that the distinguishing intra-class and inter-class characteristics of the two main pathogenic spores of Wheat Scab are not clear, we proposed a lightweight decoupled Wheat Scab detection network based on Yolov7-tiny (GSD-YOLO).
The network adopts an improved Spore–Copy data augmentation strategy to fit the actual data and improve the detection performance and generalization ability of the algorithm. At the same time, based on the Yolov7-tiny network, a decoupled head and GSConv lightweight module were added to improve the detection accuracy of the algorithm and reduce the number of parameters in the network model. The experimental results show that the detection accuracy of the algorithm in this paper reaches 98.0%, which is 3.9 percentage points higher than that of the original Yolov7-tiny model. In addition, the detection speed of the algorithm is 114 f/s and the memory is 13.1 MB, which meets the actual needs of hardware deployment and real-time detection. In addition, according to the actual farmland situation, the generalization test of the algorithm is carried out to deduce the feasibility of the algorithm in actual farmland disease detection.
In subsequent research, to make the algorithm more realistic, the laboratory simulation strategy will be optimized to train the network strategy with actual field spore data. Furthermore, in order to make the detection performance of the algorithm more powerful, other common wheat disease spores such as stripe rust and powdery mildew spores will be considered and added to the scab spores that can be detected in the future. It is expected that this will allow us to construct a rapid monitoring model for multiple wheat diseases and provide technical support for monitoring wheat diseases in farmland.
Author Contributions
D.Z.: Formal analysis, Conceptualization, Methodology, Writing—original draft, Funding acquisition. W.T.: Visualization, Writing—original draft. T.C.: Visualization, Writing—original draft. X.Z.: Writing—original draft, Writing—review & editing. G.H.: Visualization, Writing—original draft. H.Q.: Writing—review and editing. W.G.: Writing—review & editing. Z.W.: Visualization. C.G.: Writing—review and editing, Supervision, Funding acquisition. All authors have read and agreed to the published version of the manuscript.
Funding
This work was supported by the National Natural Science Foundation of China [grant number 42271364], the Transformation and Application Special Project in Agricultural Scientific and Technological Achievements of Anhui Province [grant number 2024ZH004] and the Henan Province Key Research and Development Project [grant number 241111110800].
Data Availability Statement
The original contributions presented in this study are included in the article. Further inquiries can be directed to the corresponding author.
Conflicts of Interest
The authors declare that they have no known competing financial interests or personal relationships that could have appeared to influence the work reported in this paper.
References
- Zhou, F.; Li, D.X.; Hu, H.Y.; Song, Y.L.; Fan, Y.C.; Guan, Y.Y.; Song, P.W.; Wei, Q.C.; Yan, H.F.; Li, C.W. Biological Characteristics and Molecular Mechanisms of Fludioxonil Resistance in Fusarium Graminearum in China. Plant Dis. 2020, 104, 2426–2433. [Google Scholar] [CrossRef] [PubMed]
- Fei, X.; Wei, L.; Yuli, S.; Yilin, Z.; Xiangming, X.; Qiang, Y.G.; Junmei, W.; Jiaojiao, Z.; Lulu, L. The Distribution of Fusarium Graminearum and F. Asiaticum Causing Fusarium Head Blight of Wheat in Relation to Climate and Cropping System. Plant Dis. 2021, 105, 2830–2835. [Google Scholar]
- Cheng, T.; Zhang, D.; Gu, C.; Zhou, X.-G.; Qiao, H.; Guo, W.; Niu, Z.; Xie, J.; Yang, X. YOLO-CG-HS: A Lightweight Spore Detection Method for Wheat Airborne Fungal Pathogens. Comput. Electron. Agric. 2024, 227, 109544. [Google Scholar] [CrossRef]
- Ghiasi, G.; Cui, Y.; Srinivas, A.; Qian, R.; Lin, T.-Y.; Cubuk, E.D.; Le, Q.V.; Zoph, B. Simple Copy-Paste Is a Strong Data Augmentation Method for Instance Segmentation. In Proceedings of the 2021 IEEE/CVF Conference on Computer Vision and Pattern Recognition, CVPR 2021, Nashville, TN, USA, 19–25 June 2021; IEEE Computer Society: Washington, DC, USA, 2021; pp. 2917–2927. [Google Scholar]
- Qi, L.; Jiang, Y.; Li, Z.; Ma, X.; Zheng, Z.; Wang, W. Automatic detection and counting method for spores of rice blast based on micro image processing. Trans. Chin. Soc. Agric. Eng. Trans. CSAE 2015, 31, 186–193. [Google Scholar] [CrossRef]
- Wang, Z.; Chu, G.; Wang, J.; Huang, X.; Gao, F.; Ding, X. Spores Detection of Rice Blast by IKSVM Based on HOG Features. Trans. Chin. Soc. Agric. Mach. 2018, 49, 387–392. [Google Scholar]
- Dai, Y.; Zhong, X.; Sun, C.; Yang, J.; Liu, T.; Liu, S. Identification of fusarium head blight in wheat-based on image processing and Deeplabv3+ model. J. Chin. Agric. Mech. 2021, 42, 209–215. [Google Scholar] [CrossRef]
- Tahir, M.W.; Zaidi, N.A.; Rao, A.A.; Blank, R.; Vellekoop, M.J.; Lang, W. A Fungus Spores Dataset and a Convolutional Neural Network Based Approach for Fungus Detection. IEEE Trans. Nanobioscience 2018, 17, 281–290. [Google Scholar] [CrossRef] [PubMed]
- Zhang, Y.; Li, J.; Tang, F.; Zhang, H.; Cui, Z.; Zhou, H. An Automatic Detector for Fungal Spores in Microscopic Images Based on Deep Learning. Appl. Eng. Agric. 2021, 37, 85–94. [Google Scholar] [CrossRef]
- Li, H.; Li, J.; Wei, H.; Liu, Z.; Zhan, Z.; Ren, Q. Slim-Neck by GSConv: A Lightweight-Design for Real-Time Detector Architectures. arXiv 2022, arXiv:2206.02424[cs.CV]. [Google Scholar] [CrossRef]
- Giakoumoglou, N.; Pechlivani, E.M.; Sakelliou, A.; Klaridopoulos, C.; Frangakis, N.; Tzovaras, D. Deep Learning-Based Multi-Spectral Identification of Grey Mould. Smart Agric. Technol. 2023, 4, 100174. [Google Scholar] [CrossRef]
- Sun, K.; Zhang, Y.-J.; Tong, S.-Y.; Tang, M.-D.; Wang, C.-B. Study on Rice Grain Mildewed Region Recognition Based on Microscopic Computer Vision and YOLO-v5 Model. Foods 2022, 11, 4031. [Google Scholar] [CrossRef] [PubMed]
- Ge, Z.; Liu, S.; Wang, F.; Li, Z.; Sun, J. YOLOX: Exceeding YOLO Series in 2021. arXiv 2021, arXiv:2107.08430[cs.CV]. [Google Scholar]
- Song, G.; Liu, Y.; Wang, X. Revisiting the Sibling Head in Object Detector. In Proceedings of the IEEE/CVF Conference on Computer Vision and Pattern Recognition, Seattle, WA, USA, 19 June 2020. [Google Scholar]
- Wu, Y.; Chen, Y.; Yuan, L.; Liu, Z.; Wang, L.; Li, H.; Fu, Y. Rethinking Classification and Localization for Object Detection. In Proceedings of the IEEE/CVF Conference on Computer Vision and Pattern Recognition, Seattle, WA, USA, 19 June 2020. [Google Scholar]
- Hu, J.; Wang, Z.; Chang, M.; Xie, L.; Xu, W.; Chen, N. PSG-Yolov5: A Paradigm for Traffic Sign Detection and Recognition Algorithm Based on Deep Learning. Symmetry 2022, 14, 2262. [Google Scholar] [CrossRef]
- Zou, X.; Wu, Z.; Zhou, W.; Huang, J. YOLOX-PAI: An Improved YOLOX Version by PAI. arXiv 2022, arXiv:abs/2208.13040[cs.CV]. [Google Scholar]
- Liu, W.; Anguelov, D.; Erhan, D.; Szegedy, C.; Reed, S.E.; Fu, C.-Y.; Berg, A.C. SSD: Single Shot MultiBox Detector. In Proceedings of the Computer Vision–ECCV 2016: 14th European Conference, Amsterdam, The Netherlands, 11–14 October 2016. [Google Scholar]
- Sun, X.; Wu, P.; Hoi, S.C.H. Face Detection Using Deep Learning: An Improved Faster RCNN Approach. Neurocomputing 2018, 299, 42–50. [Google Scholar] [CrossRef]
- Zhu, X.; Su, W.; Lu, L.; Li, B.; Wang, X.; Dai, J. Deformable DETR: Deformable Transformers for End-to-End Object Detection. arXiv 2020, arXiv:2010.04159[cs.CV]. [Google Scholar]
- Yu, M.; Wan, Q.; Tian, S.; Hou, Y.; Wang, Y.; Zhao, J. Equipment Identification and Localization Method Based on Improved YOLOv5s Model for Production Line. Sensors 2022, 22, 10011. [Google Scholar] [CrossRef] [PubMed]
- Luo, M.; Xu, L.; Yang, Y.; Cao, M.; Yang, J. Laboratory Flame Smoke Detection Based on an Improved YOLOX Algorithm. Appl. Sci. 2022, 12, 12876. [Google Scholar] [CrossRef]
| Disclaimer/Publisher’s Note: The statements, opinions and data contained in all publications are solely those of the individual author(s) and contributor(s) and not of MDPI and/or the editor(s). MDPI and/or the editor(s) disclaim responsibility for any injury to people or property resulting from any ideas, methods, instructions or products referred to in the content. |
© 2024 by the authors. Licensee MDPI, Basel, Switzerland. This article is an open access article distributed under the terms and conditions of the Creative Commons Attribution (CC BY) license (https://creativecommons.org/licenses/by/4.0/).
