Article

Estimation of Biophysical Parameters of Forage Cactus Under Different Agricultural Systems Through Vegetation Indices and Machine Learning Using RGB Images Acquired with Unmanned Aerial Vehicles

by
Gabriel Italo Novaes da Silva
1,
Alexandre Maniçoba da Rosa Ferraz Jardim
2,
Wagner Martins dos Santos
1,
Alan Cézar Bezerra
3,
Elisiane Alba
3,
Marcos Vinícius da Silva
4,
Jhon Lennon Bezerra da Silva
5,
Luciana Sandra Bastos de Souza
3,
Gabriel Thales Barboza Marinho
1,
Abelardo Antônio de Assunção Montenegro
1 and
Thieres George Freire da Silva
1,3,*
1
Department of Agricultural Engineering, Federal Rural University of Pernambuco, Dom Manoel de Medeiros Avenue, s/n, Dois Irmãos, Recife 52171-900, PE, Brazil
2
Department of Biodiversity, Institute of Biosciences, São Paulo State University—UNESP, Avenue 24A, 1515, Rio Claro 13506-900, SP, Brazil
3
Academic Unit of Serra Talhada, Federal Rural University of Pernambuco, Gregório Ferraz Nogueira Avenue, s/n, Serra Talhada 56909-535, PE, Brazil
4
Department of Forest Engineering, Federal University of Campina Grande—UFCG, Patos 58708-110, PB, Brazil
5
Cerrado Irrigation Graduate Program, Goiano Federal Institute—Campus Ceres, GO-154, km 218–Zona Rural, Ceres 76300-000, GO, Brazil
*
Author to whom correspondence should be addressed.
Agriculture 2024, 14(12), 2166; https://doi.org/10.3390/agriculture14122166
Submission received: 13 October 2024 / Revised: 21 November 2024 / Accepted: 26 November 2024 / Published: 28 November 2024

Abstract

:
The objective of this study was to correlate the biophysical parameters of forage cactus with visible vegetation indices obtained by unmanned aerial vehicles (UAVs) and predict them with machine learning in different agricultural systems. Four experimental units were conducted. Units I and II had different plant spacings (0.10, 0.20, 0.30, 0.40, and 0.50 m) with East–West and North–South planting directions, respectively. Unit III had row spacings (1.00, 1.25, 1.50, and 1.75 m), and IV had cutting frequencies (6, 9, 12 + 6, and 18 months) with the clones “Orelha de Elefante Mexicana”, “Miúda”, and “IPA Sertânia”. Plant height and width, cladode area index, fresh and dry matter yield (FM and DM), dry matter content, and fifteen vegetation indices of the visible range were analyzed. The RGBVI and ExGR indices stood out for presenting greater correlations with FM and DM. The prediction analysis using the Random Forest algorithm, highlighting DM, which presented a mean absolute error of 1.39, 0.99, and 1.72 Mg ha−1 in experimental units I and II, III, and IV, respectively. The results showed potential in the application of machine learning with RGB images for predictive analysis of the biophysical parameters of forage cactus.

1. Introduction

There has been great concern about the quantity and quality of food production in recent decades due to constant population growth, the effect of climate change, and the reduction in arable land [1,2]. In semiarid areas, this concern tends to increase due to intrinsic characteristics of the area, such as high temperatures, low rainfall, and irregular rainfall distribution, which harm agricultural activities [3]. One of the predominant activities in this area is livestock, which plays an important role in the economy; however, forage production is affected. Therefore, to face these challenges and increase food security, it is necessary to use adapted crops [4]. Among these crops, forage cactus (Nopalea spp. and Opuntia spp.) has stood out for presenting adaptation to environments with water deficit, resulting in greater water use efficiency, as a result of crassulacean acid metabolism (CAM), in addition to characteristics such as high digestibility and high levels of soluble carbohydrates, important for animal feed [3,4,5]. In conjunction with the use of adapted crops, the adoption of agricultural management practices that help mitigate adverse conditions and ensure full growth and development of crops are used [6,7]. This includes different densities, planting orientation, and cutting management [6,7,8,9,10,11].
The most accurate monitoring of forage biomass and quality is performed destructively, although it is the most laborious method. Therefore, automated technologies and procedures are used to monitor the growth and development of agricultural crops, aiding in decision-making and planning more accurately [2,12]. Remote sensing, based on the interaction between the electromagnetic radiation of the plant and the sensor, has proven efficient for monitoring crops and estimating biophysical factors in agrometeorological models [1,13,14,15]. This monitoring can be carried out using images from satellites or manned aircraft. However, these technologies are limited by their low temporal resolution, which prevents daily information from being obtained in real time from production systems [16].
Unmanned aerial vehicles (UAVs) have become increasingly popular in the agricultural sector [15,17], as they can capture aerial images with high spatial resolution, due to the low altitude of the flight, as well as high temporal resolution, enabling more accurate crop assessments [16,17,18,19]. The UAV consists of a remote pilot station, pilot link, and other components necessary for its operation [20]. When equipped with optical sensors, UAVs become valuable tools in precision agriculture that offer several benefits in precision agriculture, such as monitoring natural resources, plant growth, and crop yield prediction [17,21,22]. The most common sensors for obtaining images are those that obtain data in the visible spectrum band (RGB sensors). However, there is a great diversity of sensors, such as those that obtain information in the near, mid, or thermal infrared spectrum band, as well as multispectral and hyperspectral sensors [2,23,24,25].
Vegetation indices (VIs) are mathematical models that are based on the spectral reflectance characteristics of vegetation, captured in different spectral bands and wavelengths of the electromagnetic spectrum, especially in the visible (RGB) and near-infrared (NIR) ranges [15,26,27,28]. These indices are used to estimate vegetation biophysical/biochemical attributes (e.g., chlorophyll, water, and nitrogen content), biomass, leaf area index, and other intrinsic plant factors [17,28]. Vegetation shows greater reflectance in the NIR spectral band, but sensors that show this spectral band are more expensive to obtain. As a result, several studies have focused on using vegetation indices composed of the visible spectrum bands [16,17,29].
Arantes et al. [16] concluded that the use of visible spectrum vegetation indices enabled the monitoring of water stress in orange trees. Barbosa et al. [12] studied emerald grass and obtained good results when monitoring the plant using visible spectrum vegetation indices. Meanwhile, Andrade et al. [17] evaluated the intercropping with forage cactus and the RGB images produced satisfactory results for crop classification. However, there are few studies in the literature that show the use of vegetation indices with RGB sensors obtained by UAVs in forage cactus cultivation. With this, the authors highlight that the different management methods employed in the crop can present different spectral responses and, consequently, in the monitoring of structural and agronomic characteristics. Therefore, our study is promising for this crop and aims to improve producers’ planning and decision-making for forage production.
These indices can be obtained using different modeling techniques [2,30]. Among these, the machine learning model has become a powerful tool in the agricultural sector because it can predict biomass, forage quality, and physiological characteristics of plants, such as chlorophyll content [19,30,31,32,33]. This technique consists of developing different algorithms through a large data set, which can perform identifications and predictions based on the data provided [31]. The Random Forest (RF) algorithm has been constantly applied because it presents excellent accuracy in classification and regression tasks. However, it presents complexity in interpretation [30]. Andrade et al. [17] used algorithms to classify intercropped forage cactus, while Santos et al. [30] used different algorithms in an agroforestry system and concluded that the vegetation indices (normalized green-red difference index—NGRDI and visible atmospheric resistance index—VARI) can be used to predict biomass and leaf area index in forage plants.
The hypothesis of this study was that modifying the spacing, whether between plants or rows, the planting direction, and the cutting frequency, alters the interception of solar radiation by the plant and produces different spectral responses in vegetation indices in the visible range. With the use of machine learning, it will be possible to model structural and agronomic characteristics of forage cactus, these variables being important for planning and decision-making for farmers. Finally, the aim of this study was to correlate in situ data on forage cactus with vegetation indices in the visible range in four different experimental units, with different spacing between plants and planting directions (East–West (I), North–South (II)), different spacing between rows (III) and different cutting frequencies (IV), in addition to using machine learning, with a Random Forest algorithm, to predict the structural and agronomic characteristics of forage cactus.

2. Materials and Methods

2.1. Site Description

The experimental area is located at the Federal Rural University of Pernambuco, Serra Talhada Academic Unit (UFRPE-UAST), more specifically at the International Center for Agrometeorological Studies of Cactus and Other Forage Plants, in the municipality of Serra Talhada, Pernambuco, Brazil (Figure 1). According to the Köppen climate classification, the climate is hot semiarid (i.e., BSh), with a dry winter and rainy season in summer [34]. The reference evapotranspiration exceeds 1800 mm year−1, with an average temperature of 24.8 ºC, relative humidity of 63%, and annual precipitation of 642.0 mm, concentrated in the months of January to April [35,36].
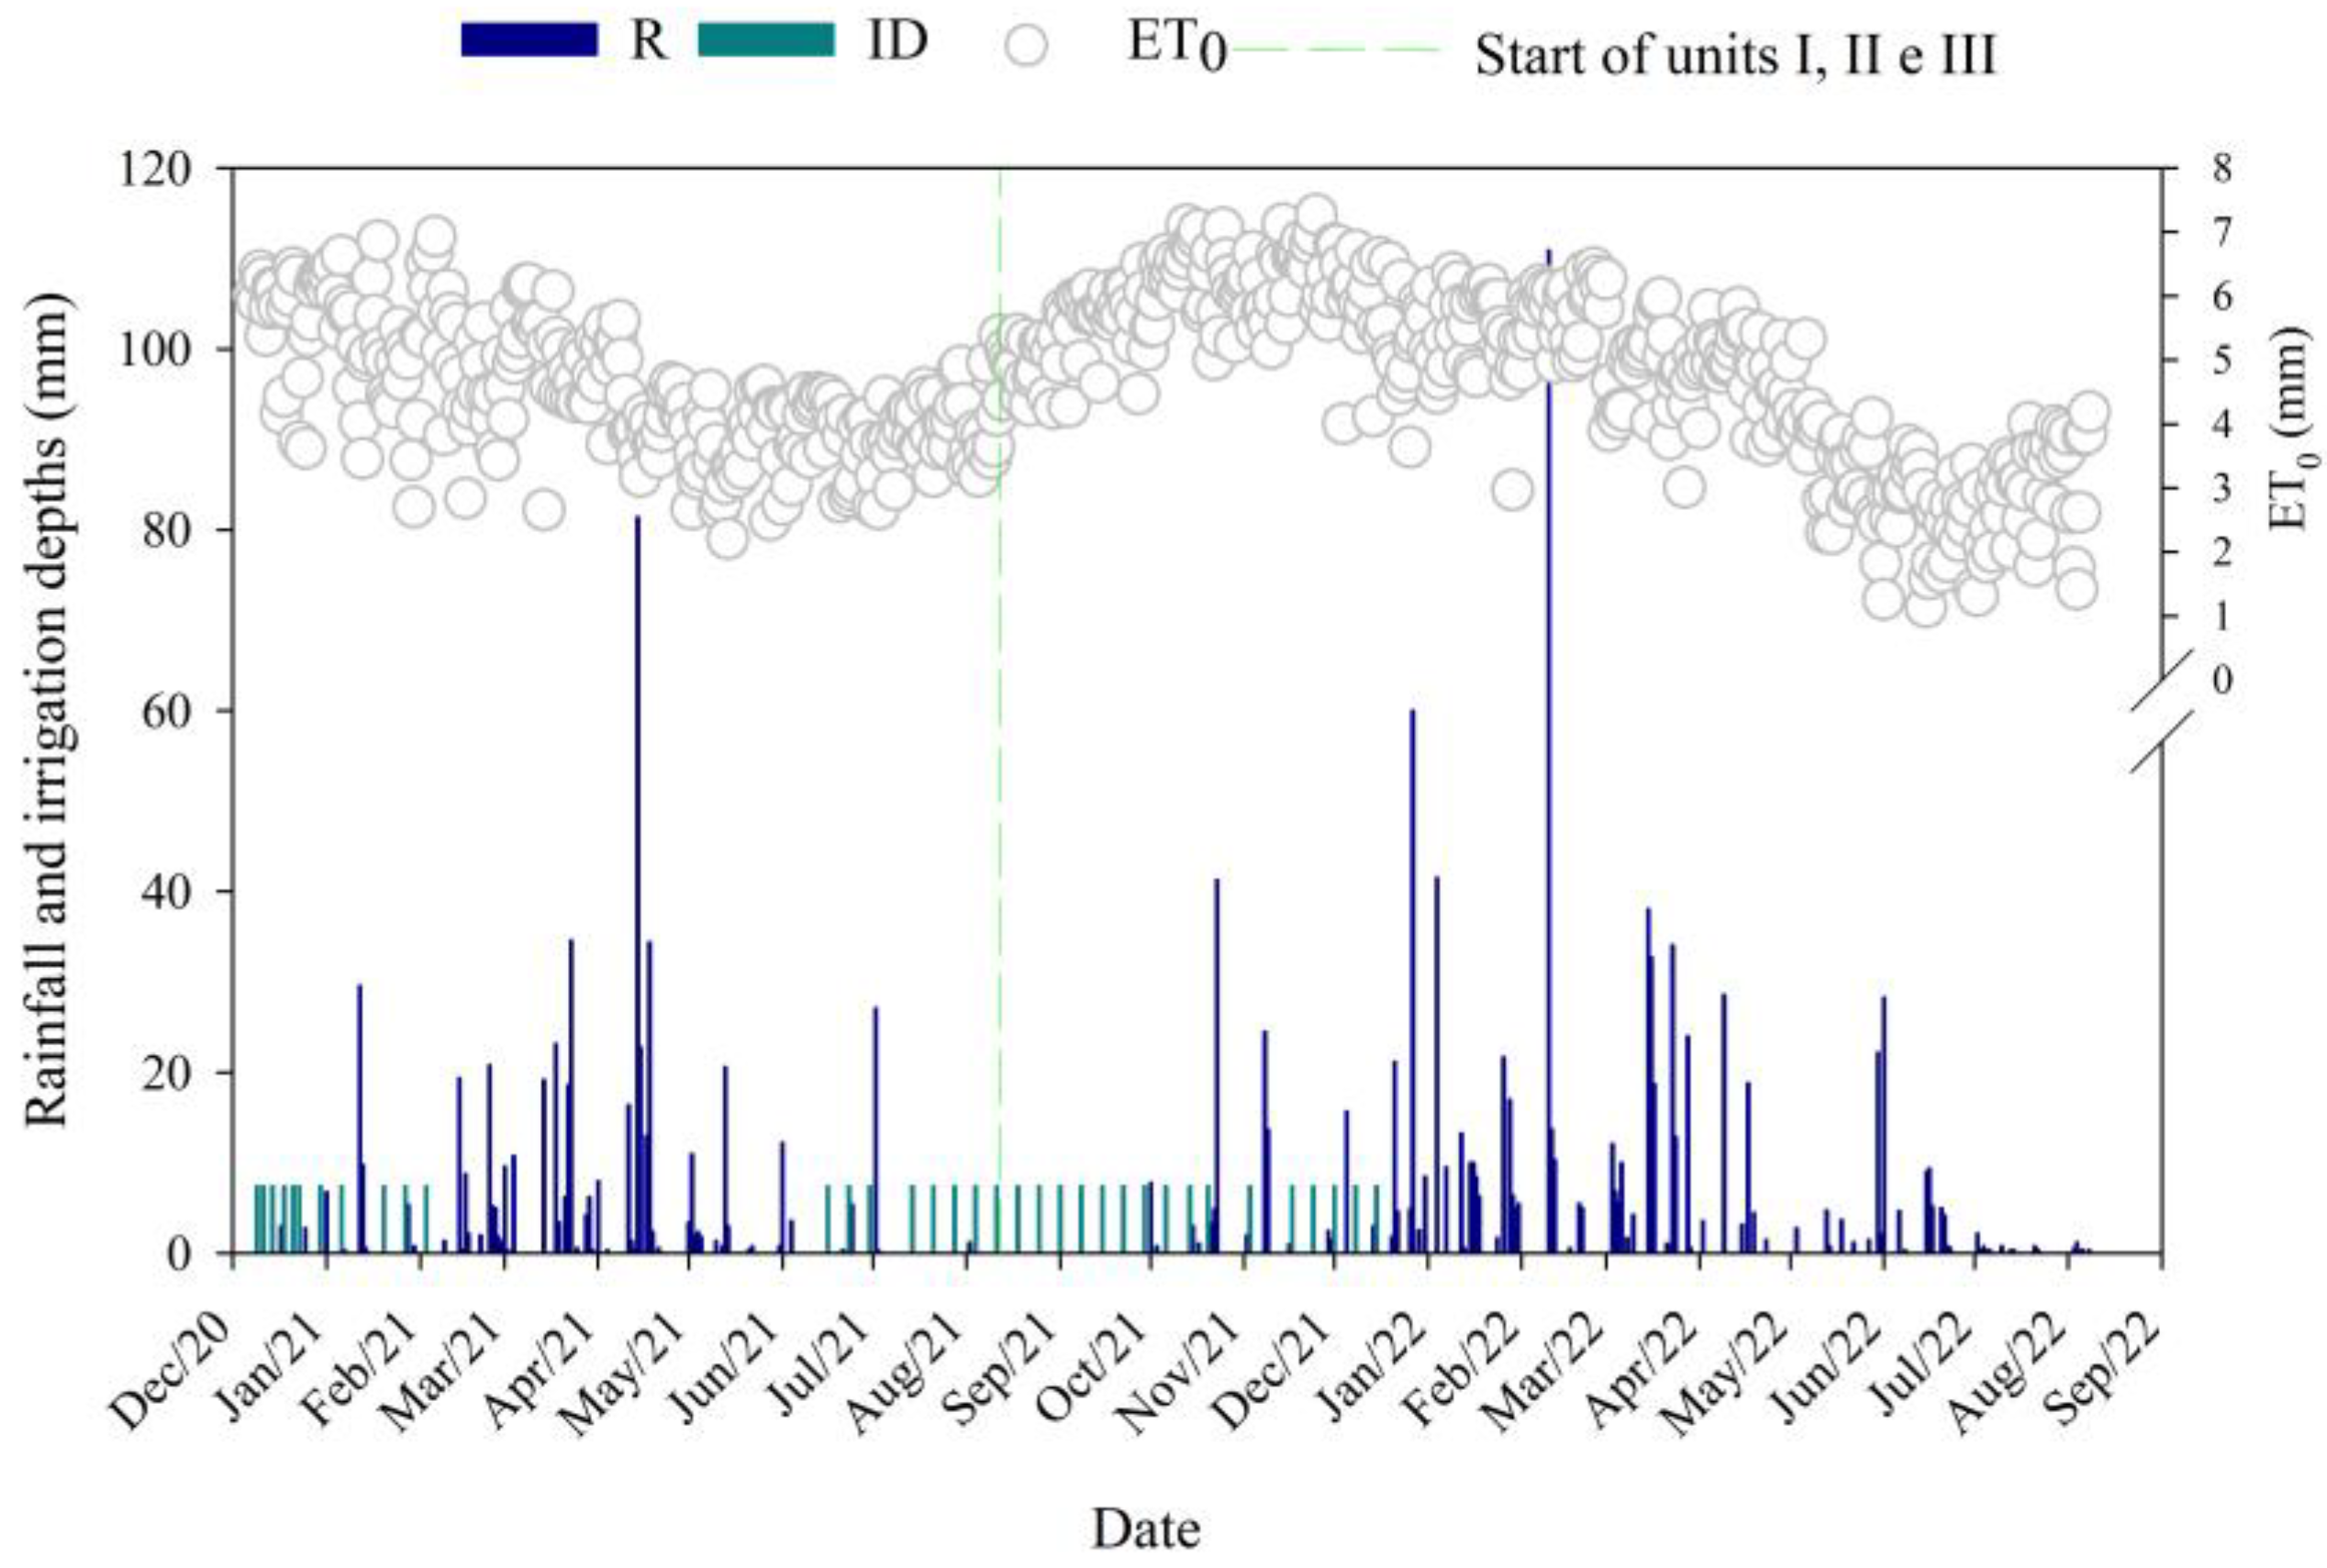
This experimental site had four experimental units, with different planting spacing and planting orientation (I and II) and different row spacing (III), where the cycle was conducted from August 2021 to August 2022 (approximately 12 months), with a total rainfall (R) and irrigation (ID) of 1041.0 mm. The reference evapotranspiration (ET0) was 1740.1 mm, showing a water deficit during the experimental period. The fourth experimental unit was of different cutting frequencies (IV). The cycle lasted approximately 18 months (October 2020 to May 2022), with a total R of 1457.9 mm, ID of 275.6 mm, and total ET0 of 2923.1 mm (5.07 mm day−1) (Figure 2).

2.2. Experimental Design and Crop Management

The design used was a randomized block design with four replications. The soil was initially prepared by tillage, harrowing, and plowing. The forage cactus clone used was “Orelha de Elefante Mexicana” [Opuntia stricta (Haw.) Haw.], planted in furrows in August 2018, burying 50% of the total length of the cladode. This experiment was conducted in the third production cycle of the forage cactus, in experimental units I, II, and III. Experimental unit IV used the clones “Orelha de Elefante Mexicana” of the genus Opuntia and “Miúda” and “IPA Sertânia” of the genus Nopalea, planted in January 2016.
Irrigation was performed using a drip system with 0.20 mm spacing between drippers, with a flow rate of 1.59 L h−1 and an operating pressure of 1 atm. The water used for irrigation had an electrical conductivity of 1.62 dS m−1. Irrigation management was based on 80% of crop evapotranspiration (ETc), using ET0 calculated by the Penman–Monteith method parameterized by FAO56 [37], based on meteorological data obtained from the automatic station of the National Institute of Meteorology (INMET) and the onset meteorological station model: HOBO U30 installed 10 m from the experimental area. The crop coefficient used was 0.52 according to the methodology of Queiroz et al. [38].
Fertilization was carried out in August 2021 for units I, II, and III, while the fourth experimental unit took place in October 2020. It was carried out in rows, with recommended doses of 200 kg ha−1 of urea as a nitrogen source, 80 kg ha−1 of P2O5 as a phosphorus source and 130 kg ha−1 of KCl as a potassium source [5]. Spontaneous plants were also controlled manually when necessary.

2.2.1. Experimental Unit I and II: Different Planting Densities with East–West and North–South Orientation

Experimental unit I had different plant spacings with East–West planting orientation. The forage cactus was planted with a simple spacing of 1.0 m between rows and with five different plant spacings: 0.10 m (100,000 plants ha−1), 0.20 m (50,000 plants ha−1), 0.30 m (33,333 plants ha−1), 0.40 m (25,000 plants ha−1), and 0.50 m (20,000 plants ha−1). The experimental unit had a total area of 240 m2, with plots composed of four 3 m long rows, totaling 12 m2. The useful area of the plot was defined by the two central rows, excluding the first and last plants of each row. The second experimental unit had the same area dimensions, changing only the planting direction, which in this case was North–South.

2.2.2. Experimental Unit III: Different Rows Spacings

Experimental unit three was conducted with fixed spacing of 0.20 m between plants, modifying the spacing between rows as follows: 1.00 m (50,000 plants ha−1), 1.25 m (40,000 plants ha−1), 1.50 m (33,000 plants ha−1), and 1.75 m (28,571 plants ha−1). This area had a total area of 264 m2, with useful areas of 12, 15, 18, and 21 m2 for the respective treatments. The useful portion for data collection was the two central rows of each plot.

2.2.3. Experimental Unit VI: Cutting Frequencies

The fourth experimental unit evaluated different cutting frequencies: 6, 9, 12 + 6, and 18 months (these frequencies were determined from previous studies on irrigated forage cactus) and three forage cactus clones: “Orelha de Elefante Mexicana”, “Miúda”, and “IPA Sertânia”. It had a total area of 960 m2 and each plot a total of 20 m2. The two central rows of each plot were considered the useful plot, excluding one plant from each end, resulting in an area of 9.20 m2 with 12 treatments and 48 experimental units, arranged in a 4 × 3 factorial scheme (four cutting frequencies and three forage cactus clones).

2.3. Unmanned Aerial Vehicle Flight Pattern

The flight to obtain the image was carried out only once at the end of the cycle when collection should be carried out in each experimental unit. Experimental units I, II, and III were carried out in August 2022, while the fourth unit was in May 2022. The drone used was a DJI Phantom 3 Advanced (DJI, Shenzhen, China), a quadcopter with a GPS/GNSS (Global Positioning System/Global Navigation Satellite System), with a camera that captures images in RGB (Red, Green, Blue) and a 1/2.3” 12.76-megapixel CMOS sensor (Tokyo Electron Ltd., Tokyo, Japan) to capture the image. The flight plan was executed using the free DroneDeploy software (version 5.31.0), and the flight was carried out around noon (12:00 p.m.), in clear and sunny conditions (i.e., constant lighting conditions), to avoid shading interference in the image capture, and with low wind speed. The flight speed was 2 m s−1, with height maintained at 100 m above the ground surface, depending on the size of the area and the imaging capability to maintain 80% lateral and frontal overlap, minimizing information loss [30].

2.4. Orthomosaic and Vegetation Indices

The images collected during the flight were imported into the WebODM software (version 1.9.15), where processing involved several photogrammetry steps, including control point matching, dense point cloud reconstruction, mesh modeling, and generation of the final orthomosaic. The entire process was performed using the default WebODM configuration, selecting the high-resolution orthomosaic processing. After generating the orthomosaic in WebODM, georeferencing was performed in QGIS (version 3.20) using the LF Tools plugin to correct discrepancies in the control points. The correction involved selecting and adjusting easily identifiable reference points present in all images, such as access pipes, structures, and fixed objects [30,39]. This process allowed improving the geospatial accuracy of the final orthomosaic, ensuring its compliance with the specified coordinate system and reducing displacement or scale errors in the georeferenced product. Subsequently, fifteen vegetation indices (Table 1) based on the visible spectrum (RGB) were calculated for the image generated and applied to the different production systems.

2.5. Obtaining Data In Situ

2.5.1. Structural Characteristics of Forage Cactus

The structural characteristics of the forage cactus were determined at the end of the cycle of each experimental unit. The measurements were taken from representative plants per plot, and the variables were plant height (HEI, cm), obtained from the soil surface to the apex of the largest cladode, plant width (PW, cm), two measurements of the greatest distances between the cladodes, total number of cladodes (TNC, units), and their respective orders (first-, second-, and third-order cladodes—CN1, CN2, and CN3, respectively).
Measurements were also performed on a cladode of each respective order, obtaining cladode length, cladode width, cladode thickness, and cladode perimeter according to Jardim et al. [50]. Once the structural characteristics were obtained, the cladode area of the OEM, MIU, and IPA clones and the cladode area index (CAI) were calculated using Equations (1)–(4) [51,52].
CA OEM = 0.7086 × ( 1     exp ( 0.000045765 × CL × CW ) ) 0.000045765
CA IPA = 1.6691 × ( 1     exp ( 0.0243 × CP ) ) 0.0243
CAMIU = 0.7198 × CL × CW
CAI = n i = 1 CA 10 , 000 S 1   ×   S 2
where CA—cladode area (cm2); CL—cladode length (cm); CW—cladode width (cm); CP—cladode perimeter; 10,000—conversion to m2; S1 and S2—spacing between rows and between plants.

2.5.2. Agronomic Characteristics of Forage Cactus

The productivity of forage cactus was determined at the end of the cycle. Two central rows, excluding two plants from each end, were selected to determine the number of plants and, consequently, obtain the final density of each plot. The fresh matter (FM) was obtained from five representative plants, which were cut and weighed on an electronic scale, keeping the basal and first-order cladodes. The fresh matter of the cladodes was obtained from a representative plant, where the cladodes were harvested and weighed. The cladodes of each order were weighed, fractionated, packed in fully identified paper bags, and placed in a forced-air circulation oven at 55 ºC until they reached a constant weight [10]. Afterwards, they were weighed on a semi-analytical scale to obtain the dry matter (DM). The ratio between the fresh and dry matter of the cladode was used to determine the dry matter content.
Finally, fresh matter was extrapolated to Mg ha−1, based on the average weight data of the five plants and the number of plants per hectare. Dry matter content (DMC) was determined by dividing DM by FM. Meanwhile, dry matter production (DM, Mg ha−1) was obtained by multiplying the average fresh weight and DMC.

2.6. Statistical Analysis

Descriptive statistics analysis was performed, such as maximum, minimum, mean, and standard deviation of vegetation indices. Spearman correlation analysis was also applied between the structural and agronomic characteristics of forage cactus and vegetation indices of forage cactus. The correlation was classified as very strong positive correlation (r ≥ 0.8), strong (0.6 ≤ r < 0.8), moderate (0.4 ≤ r < 0.6), weak (0.2 ≤ r < 0.4), and insignificant (0.2 < r); this same categorization corresponds to negative correlation.
The reference data were generated by averaging the multitemporal pixel values of each spectral band (blue, green, and red, respectively). To determine the vegetation indices, the ‘FIELDimageR’ package [53] in the R software (version 4.1.3) was used. Using data on structural and agronomic characteristics, models were developed to correlate these with vegetation indices through a machine learning technique, specifically the RF algorithm, using the ‘randomForest’ package [54]. The RF algorithm tested the contribution of each variable and selected them for modeling. To ensure more robust modeling, the following hyperparameters were optimized: the number of trees, which controls how many decision trees will be built, with a range of 500 to 1000; the number of variables per split (mtry), which defines how many variables are tested to choose the best split at each node, set in the range from 2 to 8; and the minimum leaf size (min_n), which determines the minimum number of observations at each terminal node of the tree, ranging from 2 to 40 [54]. A search was performed using a maximum entropy-tuned search grid with 500 hyperparameters, ensuring an efficient exploration of the parameter space, using the dials package [55]. Model performance was evaluated using analyses such as mean absolute error (MAE), root mean squared error (RMSE), and coefficient of determination (R²), ensuring that the hyperparameter tuning optimizes both accuracy and visualization between orientations and observed values [56]. At this stage, computational costs were added, which were relatively low due to the data set used for training and the use of several trees to improve the accuracy of the models.

3. Results

3.1. Spearman’s Correlation Analysis of Biophysical Parameters and Vegetation Indices

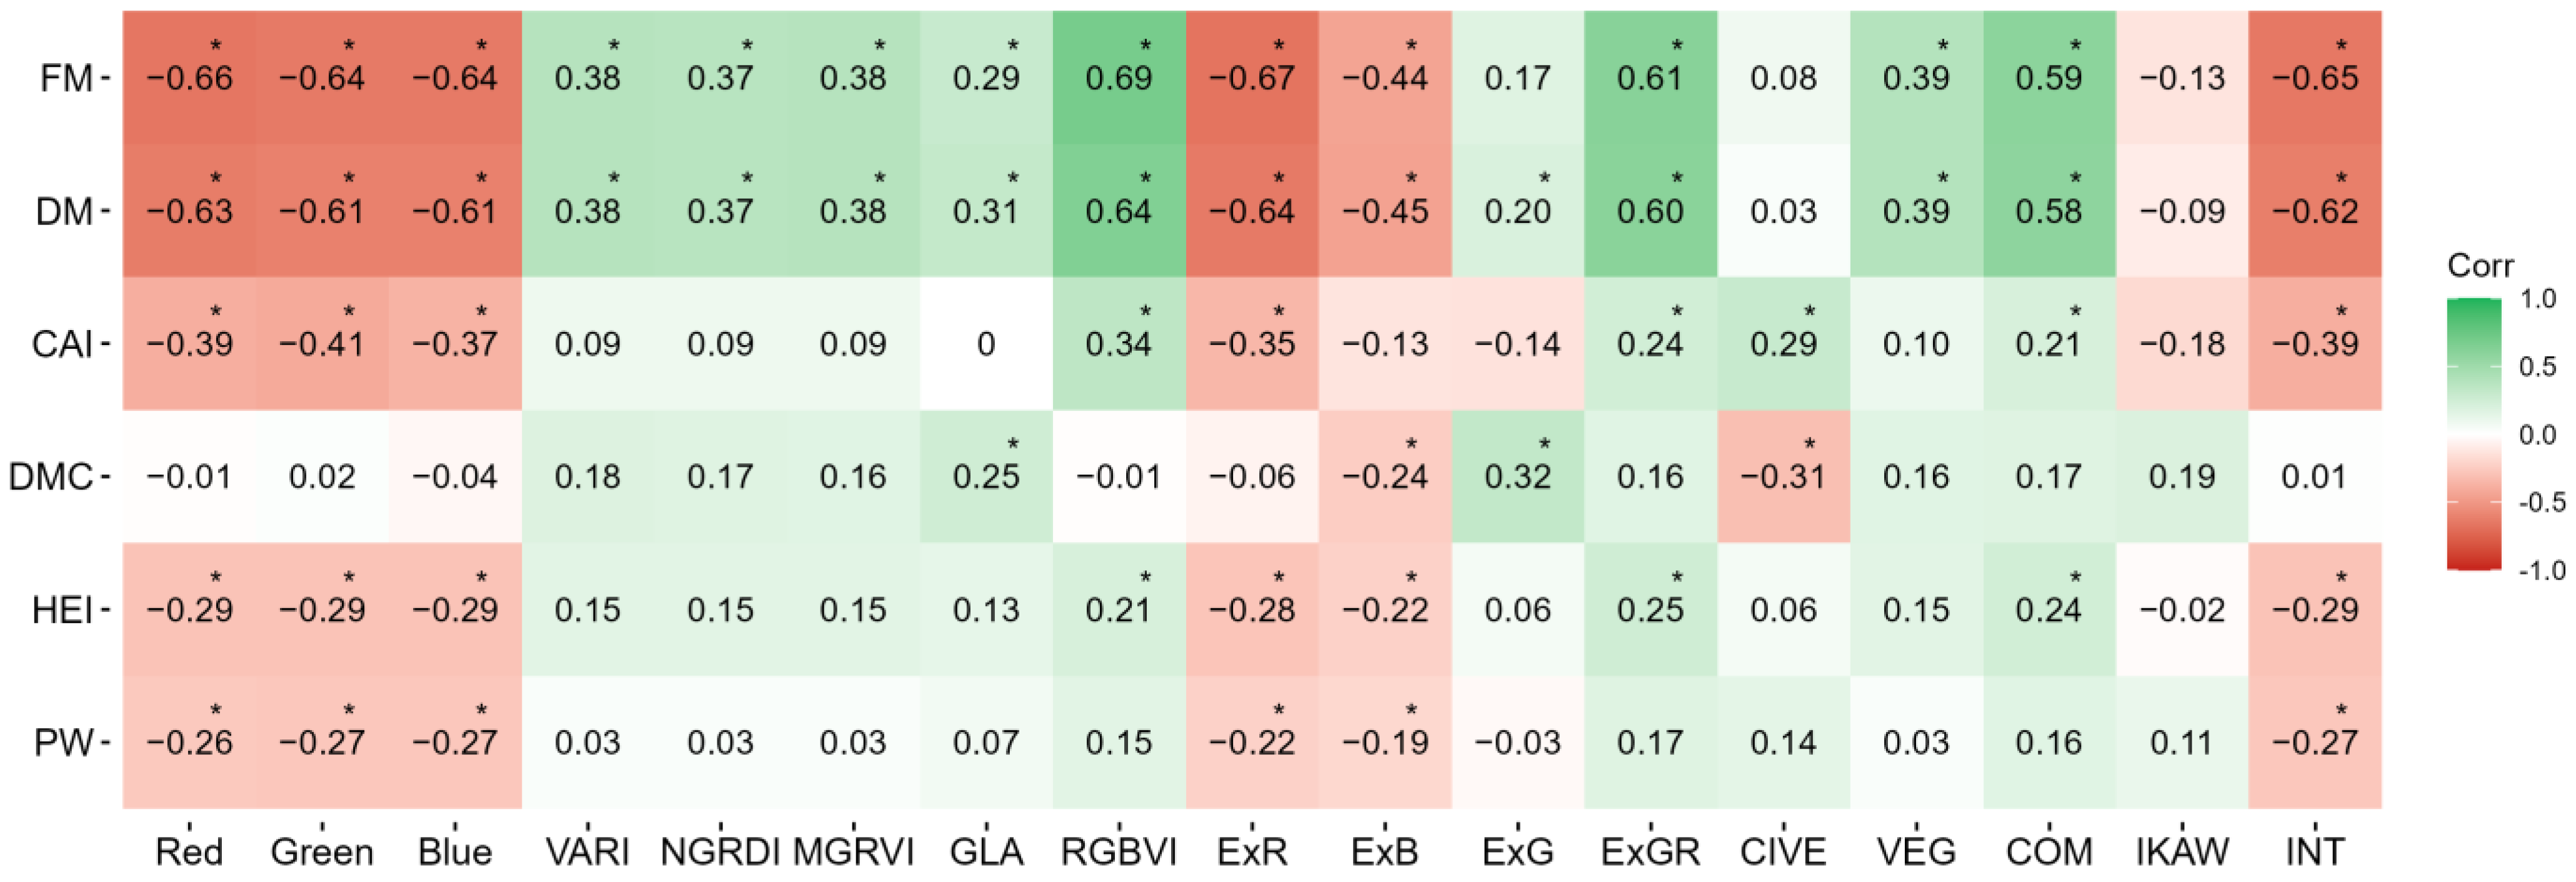
Among structural characteristics of forage cactus, plant height (HEI) and plant width (PW) showed a weak negative correlation with the ExR (r = −0.28 and −0.22, p < 0.05; mean value = 49.6 ± 16.0, Table 2), ExB (r = −0.22 and −0.19, p < 0.05; mean value = 16.7 ± 7.36, Table 2) and INT (r = −0.29 and −0.27, p < 0.05; mean value = 89.9 ± 22.4, Table 2) indices (Figure 3). On the other hand, the cladode area index (CAI) showed the opposite behavior, with a weak positive correlation for the ExGR (r = 0.24, p < 0.05; mean value = −44.6 ± 20.4, Table 2), CIVE (r = 0.29, p < 0.05; mean value = 12.3 ± 1.75, Table 2), and COM (r = 0.21, p < 0.05; mean value = −7.94 ± 6.97, Table 2) indices. For the agronomic characteristics, fresh (r = −0.67 and −0.65, p < 0.05) and dry (r = −0.64 and −0.62, p < 0.05) matter showed a moderate negative correlation with the ExR and INT vegetation indices, while ExGR (r = 0.61 and 0.60, p < 0.05) and RGBVI (r = 0.69 and 0.64, p < 0.05) showed a significant strong positive correlation. Dry matter content (DMC) showed a weak negative correlation with the ExB (r = −0.24, p < 0.05) and CIVE (r = −0.31, p < 0.05) indices, and a positive correlation with GLA (r = 0.25, p < 0.05; mean value = 0.02 ± 0.01, Table 2) and ExG (r = 0.32, p < 0.05; mean value = 5.0 ± 5.9, Table 2). The IKAW index showed non-significant occurrences.

3.2. Model Prediction Analysis

The analysis for the Random Forest model was performed with hyperparameters adjusted for each experimental unit and variations verified (Table 3). The number of decision trees varies from 597 to 839 between experiments and variables and the use of 3 to 4 variables per division.

3.2.1. Different Planting Densities with East–West and North–South Orientation

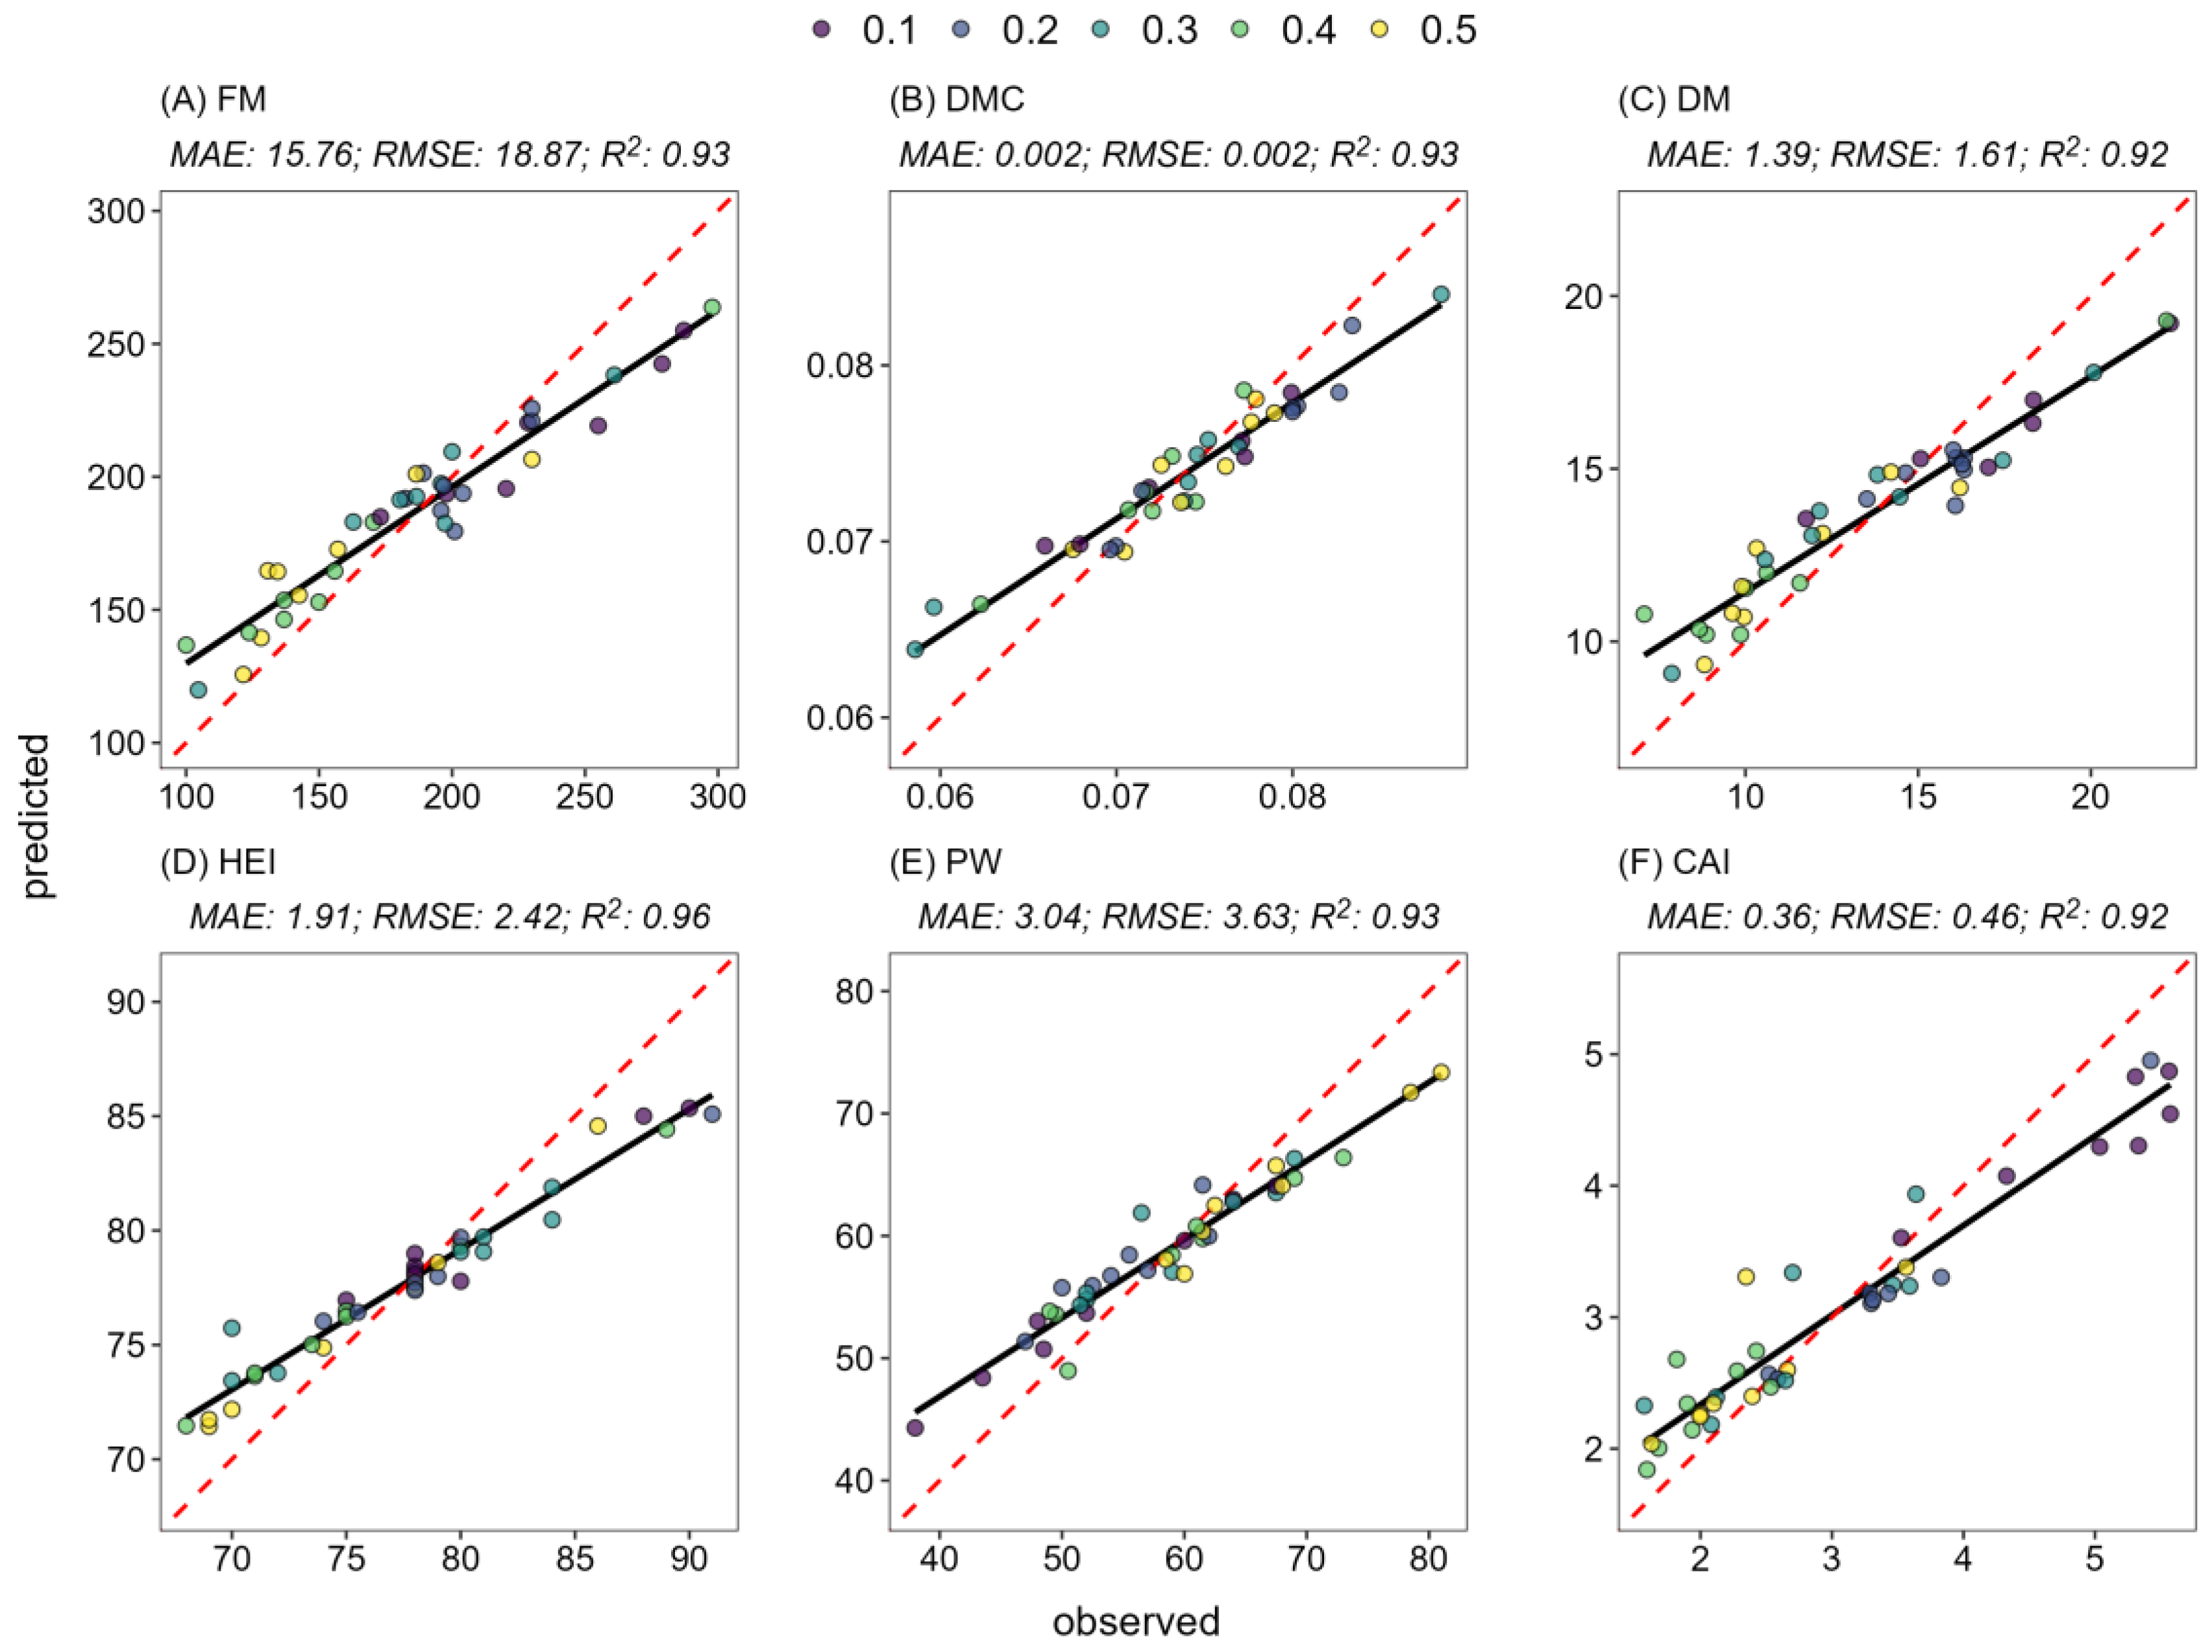
The RF machine learning algorithm established models for the structural characteristics and yield of forage cactus, considering different plant spacings and planting orientations (East–West and North–South), based on 18 independent variables, 3 spectral bands, and 15 vegetation indices (Figure 4). For forage yield (FM, DM and DMC), the variability of the observed data was greater than 90% (R2 > 0.90). However, for FM, accuracy was lower, with high MAE and RMSE of 15.76 and 18.87 Mg ha−1, respectively (Figure 4A–C). The HEI, PW, and CAI variables showed an R2 greater than 0.92, representing 92% of field variability and indicating high model accuracy. The accuracy of this model can also be confirmed by the RMSE values in this order which were 2.42 cm, 3.63 cm, and 0.46 m2 m−2, while the MAE was 1.91 cm, 3.04 cm, and 0.36 m2 m−2, respectively (Figure 4C–E).

3.2.2. Different Planting Densities (Row Spacing)

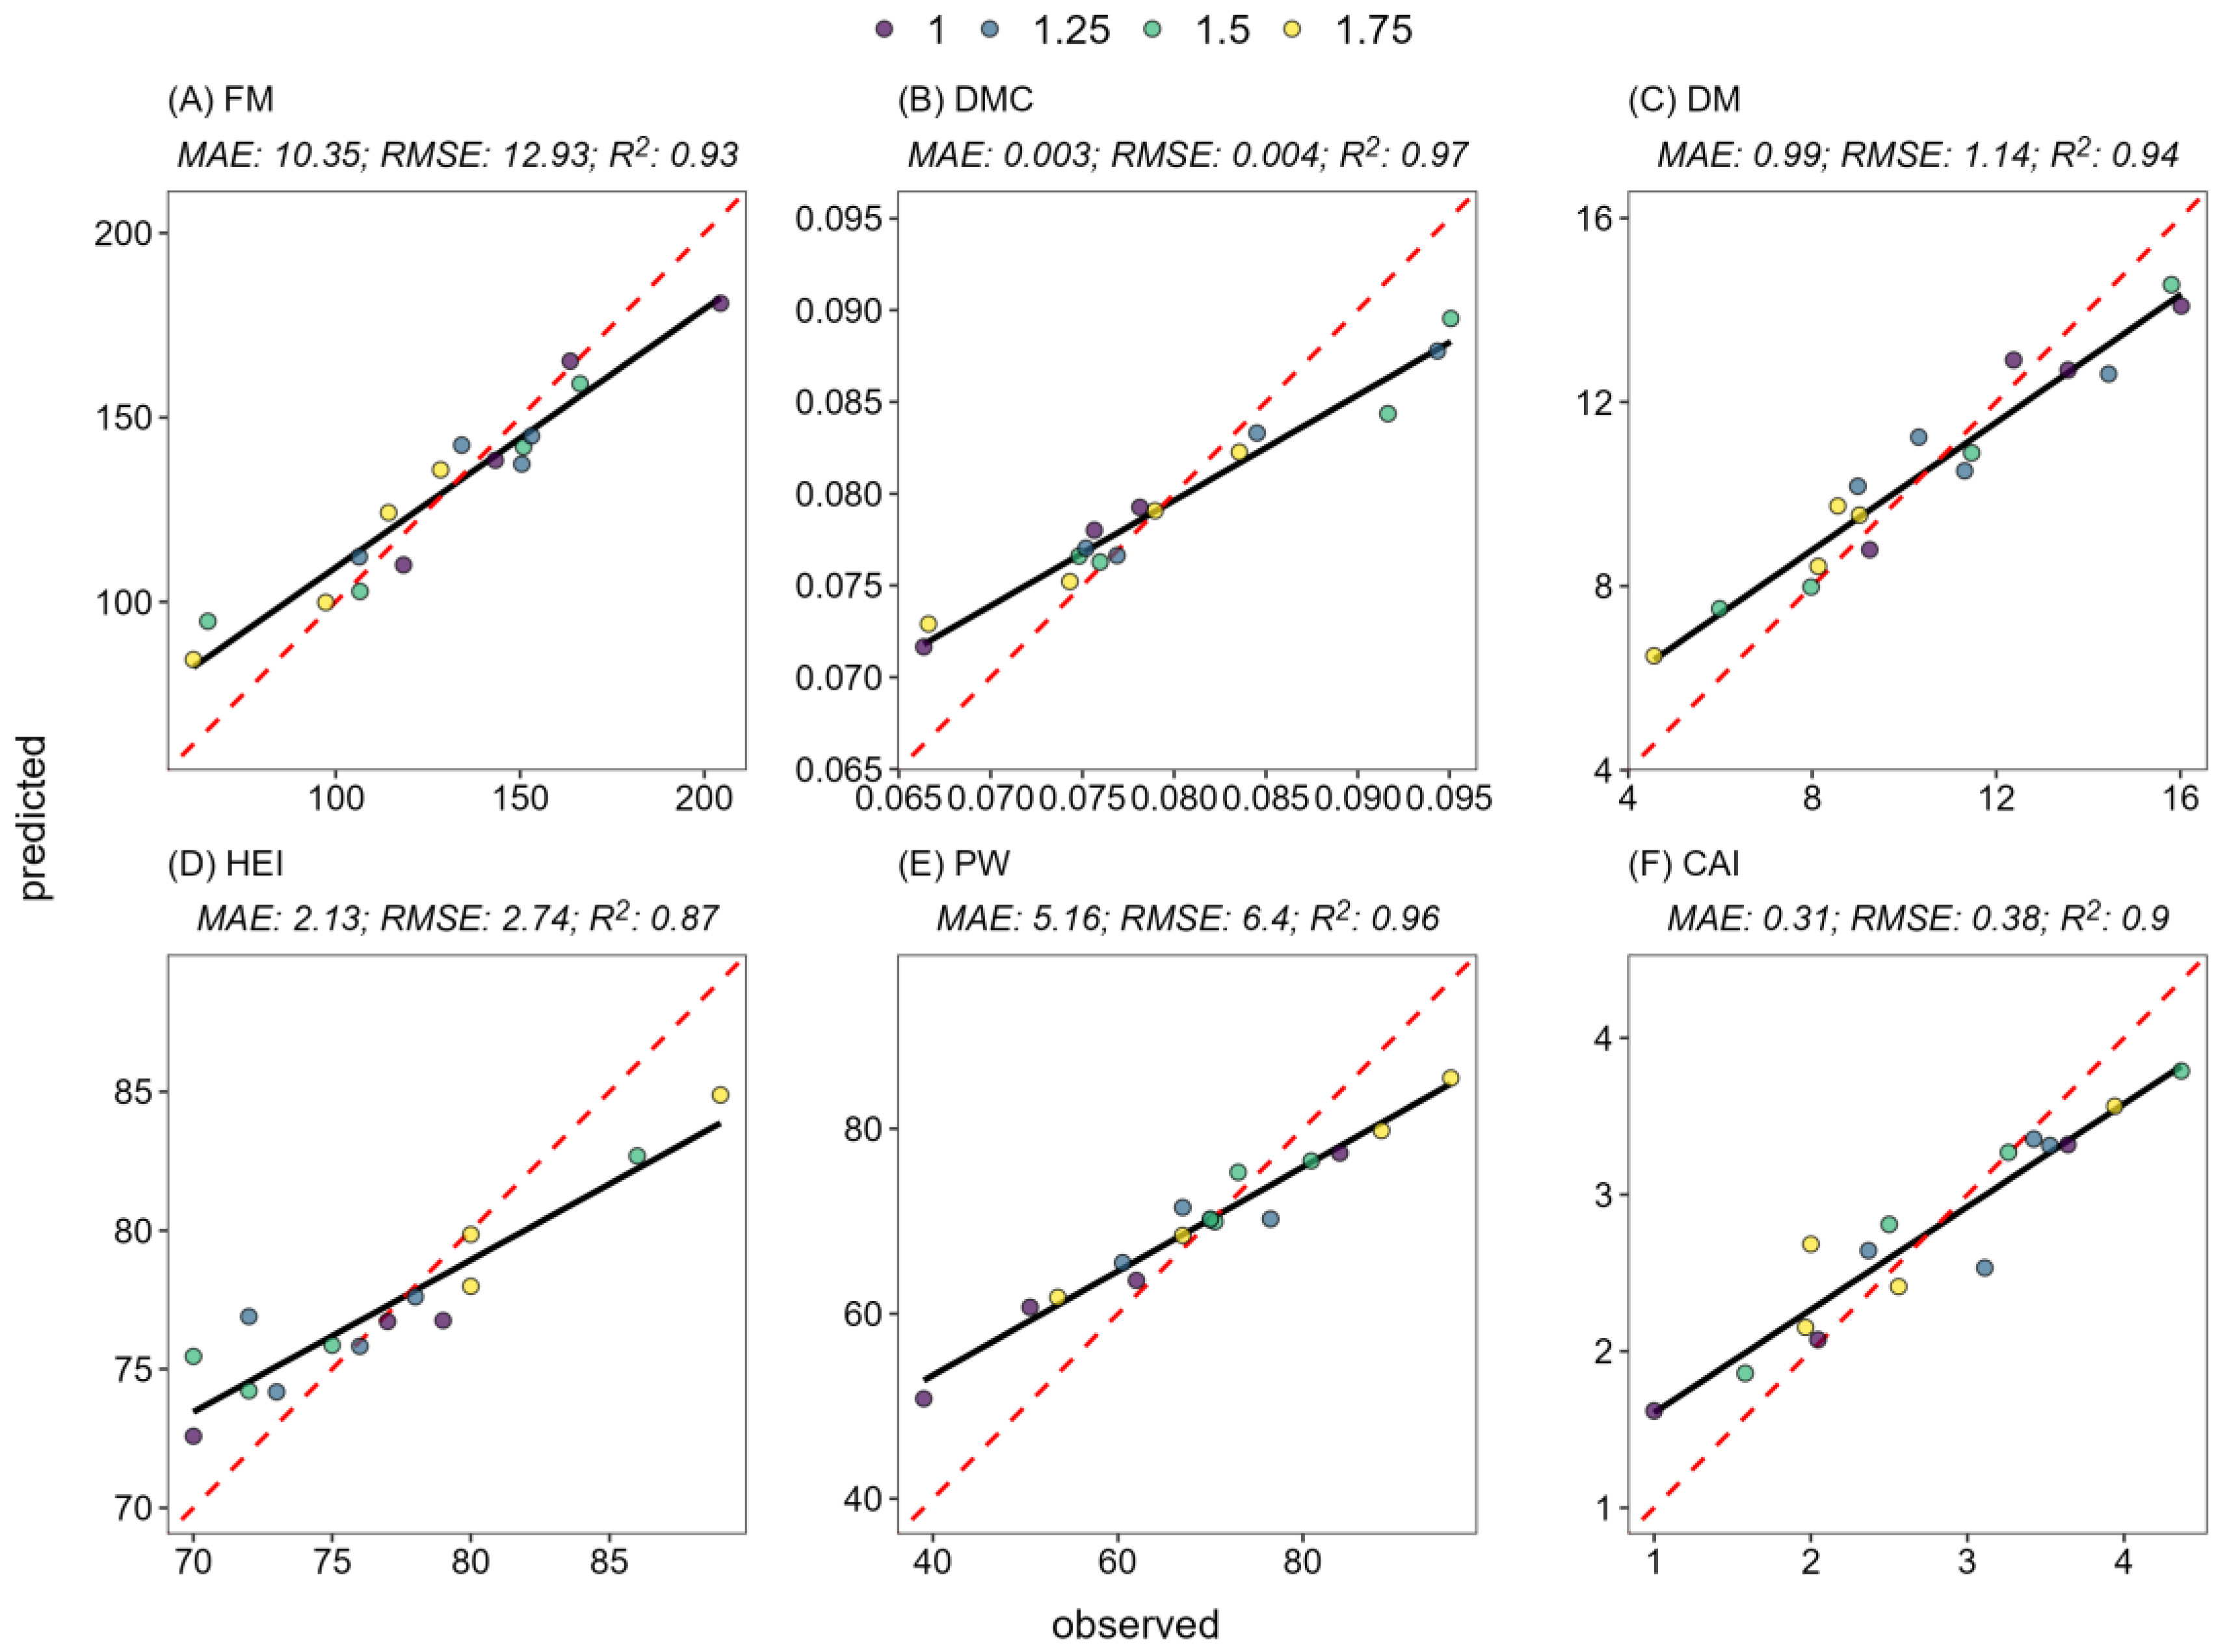
In terms of modeling performance, the RF algorithm for the different row spacings explained 87% and 97% of the variation in forage yield and structural traits in the obtained data set (Figure 5). Thus, the model prediction performed well for the variables DMC (RMSE = 0.00 and MAE = 0.003 Mg ha−1), DM (RMSE = 1.14 and MAE = 0.99 Mg ha−1), and CAI (RMSE = 0.38 and MAE = 0.31 m2 m−2), as they presented the lowest errors. For the variables FM, HEI, and PW, an average explanation of 92% of the variation in the data was presented; however, these variables presented higher RMSE and MAE values observed in the data sets (Figure 5A,D,E). However, these errors were considered satisfactory, as they were not influenced by outliers and did not significantly affect the RMSE, which tends to be higher than the MAE.

3.2.3. Cutting Frequencies and Different Forage Cactus Clones

The application of machine learning to the different forage cactus clones showed accurate models for forage yield and the crop’s structural characteristics, explaining more than 92% of the variability in the data set (Figure 6). Although FM showed a high coefficient of determination (R2 = 0.92), the errors were higher (MAE = 15.69 and RMSE = 22.54 Mg ha−1). This same behavior was observed when estimating the HEI and PW variables (Figure 6D,E), resulting in lower model accuracy.

4. Discussion

The main objective of this study was to evaluate the efficiency of crop indices (VIs) obtained with RGB images, via UAV, with the structural and agronomic characteristics of forage cactus, and predict them, using machine learning. First, we analyzed the correlation of biophysical parameters with visible vegetation indices and found a strong positive correlation with FM and DM data with the RGBVI index (r = 0.69 and 0.64, respectively) in forage cactus. This same index also showed a positive correlation for determining dry matter and plant height in areas of grasses planted in temperate and humid climates [57,58,59]. Unlike Lussem et al. [60] who studied different nitrogen doses in pasture and obtained images with a flight height of 50 m, they did not observe a correlation between the RGBVI index and dry matter production. These correlations differ from the visible band indices due to the different phenological phases, that is, they tend to correlate better with biomass in early phenological stages compared to late growth stages [41,61], due to the high reflectance saturation in dense vegetation sites at the end of the cycle [62]. This was also highlighted by Pan et al. [63], who observed how the vegetation growth state is reflected in specific spectral characteristics and spatial heterogeneity, influencing the amount of aboveground biomass. However, this saturation could not be observed in this study since only one image was taken at the end of the forage cactus cycle in the different production systems. The use of RGB images is a simple and economical method to estimate the structural characteristics and aboveground biomass of crops [62,64], and the magnitude of the bands exerts important effects on the variability of light absorption and reflection. Thus, different spacing between plants or rows and different cutting frequencies and forage cactus clones influence the response of solar radiation on the characteristics of the crop canopy [11,65].
The vegetation index ExGR, which is determined by the excess green (ExG) minus the excess red (ExR) [45,46], had a strong positive correlation with the fresh and dry matter yield of forage cactus (r = 0.61 and 0.60, respectively). However, in studies for wheat [59], maize [65], and other forage grasses [66], there was no correlation with above-ground biomass data. In forage cactus plants, this positive response regarding the ExR index may be related to the morphological characteristics of the crop, such as the presence of a thick cuticle on the edge of the cladodes, causing a change in the spectral response of the crop [18,67]. Meanwhile, data on structural characteristics, such as HEI, PW, and CAI, were not related to the VIs. This may be related to the architecture of the forage cactus canopy, with shading of the lower cladodes. Another factor that may also affect this is the conditions for obtaining the image, such as the flight height (distance between the camera and the crop canopy) [68,69]. This was also observed by Alves et al. [70] in their study of leaf disease severity in tomato crops, which showed no relationship with VIs, and may be related to the influence of environmental and physical conditions during image acquisition. Coswosk et al. [71], in turn, observed the relationship between vegetation indices in the visible range and the structural characteristics of maize crops in different phenological phases, highlighting that the concentration of leaf pigments and photosynthetic capacity can influence plant morphology.
The model based on the Random Forest (RF) algorithm demonstrated superior predictive performance for biophysical parameters, such as structural and biomass characteristics of forage cactus, regardless of the management adopted. However, it presented variations in predictions because 14 vegetation indices and the three spectral bands of the visible region (RGB) were used, which positively impacted the predictive accuracy of the model, with R2 ≥ 0.87. This algorithm uses a large number of decision trees to improve accuracy in classifications and regressions [58,71] and is particularly effective in large data sets [72,73,74], in addition to being resistant to noise and can effectively suppress overfitting [75]. According to Ruwanpathirana et al. [61], the large number of these variables can reduce the predictive performance of the model. However, this was not observed in our findings (Table 3), where the number of trees used was greater than 597, and the RMSE and MAE errors in the structural and agronomic characteristics were low, as was the coefficient of determination. Santos et al. [30], in the prediction of biomass and leaf area index in forage grasses such as Urochloa mosambicensis and Cenchrus ciliaris in agroforestry systems, used only the NGRDI and VARI indices separately, and the algorithms tested were efficient in predicting the variables. The use of machine learning was also consistent in other research in the semiarid region and with different crops, such as in the classification of forage cactus in systems intercropped with gliricidia and moringa with and without mulch [17], the Random Forest algorithm showed good performance in crop classification. This algorithm has also been shown to be efficient in estimating dry matter production in temperate pastures (e.g., Lolium perenne, Alopecurus sp., and Festuca sp.) [76]. This technique can assist farmers in forage management, allowing strategic decisions such as adjusting the number of animals according to forage availability [77], thus improving management practices. These models can also optimize crop management and increase resource use efficiency due to a more detailed and predictive analysis of factors that impact cultivation, such as irrigation and nutrient requirements, climate data, and early detection of pests and diseases [78,79,80].
Although this study achieved promising results in predicting the biophysical parameters of forage cactus under different agricultural systems, some limitations still need to be considered. First, this study was restricted to a single collection at the end of the crop cycle (12 months for experimental units I, II, and III; and 18 months for experimental unit IV), which limits the analysis of different scenarios, since growth stages influence the accuracy of predictions due to spatial variability. In addition, it would be important to compare imaging methods and other machine learning techniques. Thus, future research with RGB images at different growth stages is necessary to deepen the understanding of the relationship between structural and agronomic characteristics and spectral responses.

5. Conclusions

In this study, we analyzed the spectral response of forage cactus through vegetation indices (VIs) extracted from RGB images captured with an unmanned aerial vehicle (UAV), correlating them with the biophysical configurations of the plant in different agricultural production systems. The results showed that the vegetation indices RGBVI and ExGR presented a stronger brightness with the yields of fresh and dry matter, while the variables related to the structural characteristics did not demonstrate good correlations with the VIs. The Random Forest algorithm was effective in predicting structural (plant height, width, and cladode area index) and agronomic (fresh and dry matter and dry matter content) characteristics of forage cactus in different production systems. Therefore, the use of UAVs offers a fast and relatively low operational cost solution to monitor crops and solve potential problems.

Author Contributions

Conceptualization, A.C.B., G.I.N.d.S. and W.M.d.S.; methodology, A.C.B., A.M.d.R.F.J., E.A., G.I.N.d.S., L.S.B.d.S., M.V.d.S. and T.G.F.d.S.; software, A.C.B., E.A. and W.M.d.S.; validation, A.A.d.A.M., G.I.N.d.S., J.L.B.d.S., T.G.F.d.S. and W.M.d.S.; investigation, A.M.d.R.F.J., G.I.N.d.S., J.L.B.d.S., M.V.d.S. and T.G.F.d.S.; resources, A.A.d.A.M., A.C.B. and T.G.F.d.S.; data curation, A.C.B., A.M.d.R.F.J., E.A., G.I.N.d.S., J.L.B.d.S., L.S.B.d.S., M.V.d.S., T.G.F.d.S. and W.M.d.S.; writing—original draft preparation, A.A.d.A.M., G.I.N.d.S., G.T.B.M., L.S.B.d.S. and T.G.F.d.S.; writing—review and editing, A.A.d.A.M., A.M.d.R.F.J., G.I.N.d.S., G.T.B.M., J.L.B.d.S., L.S.B.d.S., M.V.d.S. and T.G.F.d.S.; visualization, A.C.B., E.A., G.I.N.d.S., G.T.B.M., M.V.d.S., T.G.F.d.S. and W.M.d.S., supervision, A.A.d.A.M. and T.G.F.d.S.; project administration, A.A.d.A.M., A.C.B. and T.G.F.d.S.; funding acquisition, A.A.d.A.M. and T.G.F.d.S. All authors have read and agreed to the published version of the manuscript.

Funding

The authors wish to thank National Council for Scientific and Technological Development—CNPq (421003/2018-9, 309421/2018-7, 403622/2020-4, 402622/2021-9, 309558/2021-2), the Fundação de Amparo à Ciência e Tecnologia de Pernambuco—FACEPE (APQ-1159-1.07/14, APQ-0300-5.03/17, APQ-0414-5.03/20 and APQ-0639-5.01/21), the São Paulo State Research Foundation—FAPESP (2017/22269-2, 2023/05323-4) and the Brazilian Agricultural Research Corporation—Embrapa Semiárido (10.18.03.039.00.02.00) to for the financial support, to FACEPE itself for awarding the scholarship (BCT-0221-5.03/21).

Institutional Review Board Statement

Not applicable.

Data Availability Statement

The original contributions presented in this study are included in the article. Further inquiries can be directed to the corresponding author.

Acknowledgments

The authors would like to thank the Semiarid Agrometeorology Group (GAS) and the Laboratory of Geotechnologies Applied to the Semiarid (LAGAS) for all the development of the research. Finally, we thank anonymous reviewers for their time and fruitful comments.

Conflicts of Interest

The authors declare no conflicts of interest.

References

  1. Omia, E.; Bae, H.; Park, E.; Kim, M.S.; Baek, I.; Cho, B.-K. Remote sensing in field crop monitoring: A comprehensive review of sensor systems, data analyses and recent advances. Remote Sens. 2023, 15, 354. [Google Scholar] [CrossRef]
  2. Killlen, P.; Kiringa, I.; Yeap, T.; Branco, P. Corn grain yield prediction using UAV-Based high spatiotemporal resolution imagery, machine learning, and spatial cross-validation. Remote Sens. 2024, 16, 683. [Google Scholar] [CrossRef]
  3. Júnior, G.N.A.; Jardim, A.M.d.R.F.; Silva, M.J.; Alves, C.P.; Souza, C.A.A.d.; Costa, S.A.T.; Cunha, M.V.; Simões, A.d.N.; Silva, J.R.I.; Souza, L.S.B.d.; et al. Growth dynamics and accumulation of forage mass of forage cactus clones as affected by meteorological variables and water regime. Eur. J. Agron. 2021, 131, 126375. [Google Scholar] [CrossRef]
  4. Jardim, A.M.d.R.F.; Souza, L.S.B.d.; Alves, C.P.; Araújo, J.F.N.d.; Souza, C.A.A.d.; Pinheiro, A.G.; Araújo, G.G.L.d.; Campos, F.S.; Tabosa, J.N.; Silva, T.G.F.d. Intercropping forage cactus with sorghum affects the morphophysiology and phenology of forage cactus. Afr. J. Range Forage Sci. 2021, 40, 129–140. [Google Scholar] [CrossRef]
  5. Alves, C.P.; Jardim, A.M.d.R.F.; Araújo Júnior, G.d.N.; de Souza, L.S.B.; Araújo, G.G.L.; de Souza, C.A.A.; Salvador, K.R.d.S.; Leite, R.M.C.; Pinheiro, A.G.; da Silva, T.G.F. How to enhance the agronomic performance of cactus-sorghum intercropped system: Planting configurations, density and orientation. Ind. Crops Prod. 2022, 184, 115059. [Google Scholar] [CrossRef]
  6. Silva, N.M.G.; Santos, M.V.F.; Dubeux Júnior, J.C.B.; Cunha, M.V.; Lira, M.A.; Ferraz, I. Effects planting density and organic fertilization doses on productive efficiency of cactus pear. Rev. Caatinga 2016, 29, 976–983. [Google Scholar] [CrossRef]
  7. Souza, T.C.; Santos, M.V.F.; Dubeux Júnior, J.C.B.; Lira, M.A.; Santos, D.C.d.; Cunha, M.V.; Lima, L.E.; Silva, R.R. Productivity and nutrient concetration in spineless cactus under different fertilizations and plant densities. Rev. Bras. Ciências Agrárias 2017, 12, 555–560. [Google Scholar] [CrossRef]
  8. Peixoto, M.J.A.; Carneiro, M.S.S.; Amorim, D.S.; Edvan, R.L.; Pereira, E.S.; Costa, M.R.G.F. Caracteristicas agronômicas e composição química da palma forrageira em função de diferentes sistemas de plantio. Arch. Zootec. 2018, 67, 35–39. [Google Scholar] [CrossRef]
  9. Alves, H.K.M.N.; Silva, T.G.F.d.; Jardim, A.M.d.R.F.; Souza, L.S.B.d.; Araújo Júnior, G.N.; Souza, C.A.A.d.; Moura, M.B.S.d.; Araújo, G.G.L.d.; Campos, F.S.; Cruz Neto, J.F. The use of mulch in cultivating the forage cactus optimizes yield in less time and increases the water use efficiency of the crop. Irrig. Drain 2023, 72, 75–89. [Google Scholar] [CrossRef]
  10. Souza, M.d.S.; Silva, T.G.F.d.; Souza, L.S.B.d.; Alves, H.K.M.N.; Leite, R.M.C.; Souza, C.A.A.d.; Araujo, G.G.L.d.; Campos, F.S.; Silva, M.J.d.; Souza, P.J.D.O.p.d. Growth, phenology and harvesting time of cactus-millet intercropping system under biotic mulching. Arch. Agron. Soil Sci. 2022, 68, 764–778. [Google Scholar] [CrossRef]
  11. Silva, G.I.N.d.; Morais, J.E.F.d.; Souza, C.A.A.d.; Jardim, A.M.d.R.F.; Salvador, K.R.d.S.; Souza, L.S.B.d.; Simões, A.d.N.; Campos, F.S.; Steidle Neto, A.J.; Silveira, A.V.M.; et al. Do different densities ans planting orientations of forage cactus alter agronomic, morphophysiological characteristics, and soil water dynamics in a semiarid region? Eur. J. Agron. 2024, 159, 127271. [Google Scholar] [CrossRef]
  12. Barbosa, B.D.S.; Ferraz, G.A.S.; Gonçalves, L.M.; Marin, D.B.; Maciel, D.T.; Ferraz, P.F.P.; Rossi, G. RGB vegetation indices applied to grass monitoring: A qualitative analysis. Agronomy 2019, 17, 349–357. [Google Scholar] [CrossRef]
  13. Caron, M.L.; Minuzzi, R.B. Estimativa de produtividade da soja com uso de perfis temporais de índices de vegetação do sensor MODIS em Sapezal, Mato Grosso. Rev. Bras. Geogr. Física 2022, 15, 1660–1675. [Google Scholar] [CrossRef]
  14. Sobrinho Neto, F.S.; Danelichen, V.H.M. Estudo do uso de índices de vegetação nas culturas do Brasil. Uniciências 2022, 26, 100–107. [Google Scholar] [CrossRef]
  15. Oliveira, H.F.E.d.; Castro, L.E.V.; Sousa, C.M.; Alves Júnior, L.R.; Mesquita, M.; Silva, J.A.O.S.; Faria, L.C.; Silva, M.V.d.; Giongo, P.R.; Oliveira Júnior, J.F.; et al. Geotechnologies in biophysical analysis through the applicability of the UA Vans Sentinel-2A/MSI in irrigated area of common beans: Accuracy and spatial dynamics. Remote Sens. 2024, 16, 1254. [Google Scholar] [CrossRef]
  16. Arantes, L.R.; Arantes, B.H.T.; Giongo, P.R.; Ceccato, G.Z.; Moraes, V.H.; Saito, Y.K.; Gomes, L.F.; Oliveira-Castro, A.C. Comportamento espectral e detecção de laranjeiras (Citrus sinensis L. Osbeck) com estresse hídrico, por meio de drone. Rev. Bras. Geogr. Física 2020, 13, 3625–3635. [Google Scholar] [CrossRef]
  17. Andrade, O.B.; Montenegro, A.A.A.; Silva Neto, M.A.; Sousa, L.B.; Almeida, T.A.B.; Lima, J.L.M.P.; de Carvalho, A.A.; da Silva, M.V.; Medeiros, V.W.C.; Soares, R.G.F.; et al. UAV-Based classification of intercropped forage cactus: A comparison of RGB and multispectral sample spaces using machine learning in an irrigated area. AgriEngimeering 2024, 6, 509–525. [Google Scholar] [CrossRef]
  18. Shao, G.; Han, W.; Zhang, H.; Zhang, L.; Wang, Y.; Zhang, Y. Prediction of maize crop coefficient from UAV multisensor remote sensing using machine learning methods. Agric. Water Manangement 2023, 276, 108064. [Google Scholar] [CrossRef]
  19. Cao, X.; Liu, Y.; Yu, R.; Han, D.; Su, B. A comparison of UAV RGB and multispectral imaging in phenotyping for stay green of wheat population. Remote Sens. 2021, 13, 5173. [Google Scholar] [CrossRef]
  20. Agência Nacional de Aviação Cívil (ANAC). Regulamento Brasileiro da aviação civil (RBAC-E) N° 94. Diário Of. União 2021, 117, 1–34. [Google Scholar]
  21. Shanmugapriya, P.; Rathika, S.; Ramesh, T.; Janaki, P. Applications of remote sensing in agriculture–a review. Int. J. Curr. Microbiol. Appl. Sci. 2019, 8, 2270–2283. [Google Scholar] [CrossRef]
  22. Istiak, M.d.A.; Syeed, M.M.M.; Hossaim, M.d.S.; Uddin, M.F.; Hasan, M.; Khan, R.H.; Azad, N.S. Adoption of unmanned aerial vehicle (UAV) imagery in agricultural management: A systematic literature review. Ecol. Inform. 2023, 78, 102305. [Google Scholar] [CrossRef]
  23. Iqbal, I.M.; Balzter, H.; Bareen, F.; Shabbir, A. Mapping Lantana camara and Leucaena leucocephala in protected areas of Pakistan: A geo-spatial approach. Remote Sens. 2022, 15, 1020. [Google Scholar] [CrossRef]
  24. Lourenço, V.R.; Montenegro, A.A.d.A.; de Carvalho, A.A.; Souza, L.B.; Almeida, T.A.B.; Almeida, T.F.S.; Vilar, B.P. Spatial variability of biophysical multiespectral index under heterogeneity and anisotropy for precision monitoring. Rev. Bras. Eng. Agrícola E Ambient. 2023, 27, 848–857. [Google Scholar] [CrossRef]
  25. Vigneault, P.; Lafond-Lapalme, J.; Deshaies, A.; Khun, K.; La Sablonniere, S.; Filion, M.; Longchamps, L.; Mimee, B. An integrated data-driven approach to monitor and estimate plant-scale growth using UAV. Open J. Photogramm. Remote Sens. 2024, 11, 100052. [Google Scholar] [CrossRef]
  26. Freire-Silva, J.; Paz, Y.M.; Lima-Silva, P.P.; Pereira, J.P.A.; Candeias, A.L.B. Remote sensing vegetation index for processing images in the visible band (RGB). J. Hyperpectral Remote Sens. 2019, 9, 228–239. [Google Scholar] [CrossRef]
  27. Andrade, M.; Teodoro, L.P.R.; Baio, F.H.R.; Campos, C.N.S.; Roque, C.G.; Silva Júnior, C.A.; Coradi, P.C.; Teodoro, P.E. High-throughput phenotyping of soybean genotypes under base saturation stress conditions. J. Agron. Crop Sci. 2021, 207, 163–169. [Google Scholar] [CrossRef]
  28. Adar, S.; Sternberg, M.; Paz-Kagan, T.; Henkin, Z.; Dovrat, G.; Zaady, E.; Argaman, E. Estimation of aboveground biomass production using an unmanned aerial vehicle (UAV) and VENuS satellite imagery in Mediterranean and semiarid rangelands. Remote Sens. Appl. Soc. Environ. 2022, 26, 100753. [Google Scholar] [CrossRef]
  29. Sapkota, B.; Singh, V.; Neely, C.; Rajan, N.; Bagavathinannan, M. Detection of italian ryegrass in wheat and prediction of competitive interactions using remote-sensing and machine-learning techniques. Remote Sens. 2020, 12, 2977. [Google Scholar] [CrossRef]
  30. Santos, W.M.; Costa, C.J.P.; Medeiros, M.L.S.; Jardim, A.M.d.R.F.; Cunha, M.V.; Dubeux Junior, J.C.B.; Jaramillo, D.M.; Bezerra, A.C.; Souza, E.J.O. Can unmanned aerial vehicle imagens be used estimate forage production parameters in agroforestry systems in the caatinga? Appl. Sci. 2024, 14, 4896. [Google Scholar] [CrossRef]
  31. Jamshidi, E.J.; Yusup, Y.; Hooy, C.W.; Kamaruddin, M.N.; Hassan, H.M.; Muhammad, S.A.; Shafri, H.Z.M.; Then, K.H.; Norizan, M.S.; Tan, C.C. Prediction oil palm yield usin a comprehensive agronomy dataset and 17 machine learning and deep learning models. Ecol. Inform. 2024, 81, 102595. [Google Scholar] [CrossRef]
  32. Gómez, D.; Salvador, P.; Sanz, J.; Casanova, J.L. Potato yield prediction using machine learnig techniques and Sentinel 2 data. Remote Sens. 2019, 11, 1745. [Google Scholar] [CrossRef]
  33. van Klompenburg, T.; Kassahun, A.; Catal, C. Crop yield prediction using machine learnig: A systematic literature review. Comput. Electron. Agric. 2020, 177, 105709. [Google Scholar] [CrossRef]
  34. Alvares, C.A.; Stape, J.L.; Sentelhas, P.C.; Gonçalves, J.L.d.M.; Sparovek, G. Köppen’s climate classification map for Brazil. Meteorol. Z. 2013, 22, 711–728. [Google Scholar] [CrossRef]
  35. Pereira, P.D.C.; da Silva, T.G.F.; Zolnier, S.; de Morais, J.E.F.; dos Santos, D.C. Morfogênese da palma forrageira irrigada por gotejamento. Rev. Caatinga 2015, 28, 184–195. [Google Scholar] [CrossRef]
  36. Silva, G.I.N.d.; Jardim, A.M.d.R.F.; Souza, M.d.S.; Araújo Júnior, G.d.N.; de Souza, L.S.B.; de Souza, C.A.A.; Alves, C.P.; de Araújo, G.G.L.; Montenegro, A.A.d.A.; Lima, B.L.d.C.; et al. Combined agricultural practices in millet and cactus: Phyllochron, structural characteristics and relations with yield. Sci. Agrícola 2023, 80, e20220046. [Google Scholar] [CrossRef]
  37. Allen, R.G.; Pereira, L.S.; Raes, D.; Smith, M. Crop Evapotranspiration: Guidelines for Computing Crop Water Requirements; Food and Agriculture Organization of The United Nations: Rome, Italy, 1998. [Google Scholar]
  38. Queiroz, M.G.; da Silva, T.G.F.; Zolnier, S.; Silva, S.M.S.; de Souza, C.A.A.; Carvalho, H.F.d.S. Relações hídrico-econômicas da palma forrageira cultivada em ambiente semiárido. Irriga 2016, 1, 141–154. [Google Scholar] [CrossRef]
  39. Jain, A.; Mahajan, M.; Saraf, R. Standardizitation of the Shape Ground control point (GCP) and the methodology for its detection in images for UAV-based mapping applications. In Proceedings of the Advances in Computer Vision; Arai, K., Kapoor, S., Eds.; Springer International Publishing: Cham, Switzerland, 2020; pp. 459–476. [Google Scholar]
  40. Gitelson, A.A.; Kaufman, Y.J.; Stark, R.; Rundquist, D. Novel algorithms for remote estimation of vegetation fraction. Remote Sens. Environ. 2002, 80, 76–87. [Google Scholar] [CrossRef]
  41. Bendig, J.; Yu, K.; Aasen, H.; Bolten, A.; Bennertz, S.; Broscheit, J.; Gnyp, M.L.; Bareth, G. Combining UAV-Based Plant Heightfrom Crop Surface Models, Visible, and near Infrared Vegetation Indices for Biomass Monitoring in Barley. Int. J. Appl. Earth Obs. Geoinf. 2015, 39, 79–87. [Google Scholar] [CrossRef]
  42. Louhaichi, M.; Borman, M.M.; Johnson, D.E. Spatially Located Platform and Aerial Photography for Documentation of GrazingImpacts on Wheat. Geocarto. Int. 2001, 16, 65–70. [Google Scholar] [CrossRef]
  43. Tucker, C.J. Red and photographic infrared linear combinations for monitoring vegetation. Remote Sens. Environ. 1979, 8, 127–150. [Google Scholar] [CrossRef]
  44. Meyer, G.E.; Camargo Neto, J. Verification of color vegetation indices for automated crop imaging applications. Comput. Electron. Agric. 2008, 63, 282–293. [Google Scholar] [CrossRef]
  45. Guijarro, M.; Pajares, G.; Riomoros, I.; Herrera, P. Automatic segmentation of relevant textures in agricultural images. Comput. Electron. Agric. 2011, 75, 75–83. [Google Scholar] [CrossRef]
  46. Camargo Neto, J. A Combined Statistical—Soft Computing Approach for Classification and Mapping Weed Species in Minimum Tillage Systems. Ph.D. Dissertation, University of Nebraska, Lincoln, NE, USA, 2004. [Google Scholar]
  47. Kataoka, T.; Kaneko, T.; Okamoto, H.; Hata, S. Crop growth estimation system using machine vision. In Proceedings of the 2003 IEEE/ASME International Conference on Advanced Intelligent Mechatronics, Kobe, Japan, 20–24 July 2003. [Google Scholar]
  48. Hague, T.; Tillett, N.D.; Wheeler, H. Automated crop and weed monitoring in widely spaced cereals. Precis. Agric. 2006, 7, 21–32. [Google Scholar] [CrossRef]
  49. Kawashima, S.; Nakatani, M. An algorithm for estimating chlorophyll content in leaves using a video camera. Ann. Bot. 1998, 81, 49–54. [Google Scholar] [CrossRef]
  50. Jardim, A.M.d.R.F.; da Silva, T.G.F.; de Souza, L.S.B.; Araújo Júnior, G.d.N.; Alves, H.K.M.N.; Souza, M.d.S.; de Araújo, G.G.L.; de Moura, M.S.B. Intercropping forage cactus and sorghum in a semi-arid environment improves biological efficiency and competitive ability through interspecific complementarity. J. Arid Environ. 2021, 188, 104464. [Google Scholar] [CrossRef]
  51. Pinheiro, K.M.; da Silva, T.G.F.; Carvalho, H.F.d.S.; Santos, J.E.O.; de Morais, J.E.F.; Zolnier, S.; dos Santos, D.C. Correlações do índice de área do cladódio com características morfogênicas e produtivas da palma forrageira. Pesqui. Agropecu. Bras. 2014, 49, 939–947. [Google Scholar] [CrossRef]
  52. Silva, T.G.F.; Araújo Primo, J.T.; de Morais, J.E.F.; Diniz, W.J.S.; de Souza, C.A.A.; Silva, M.C. Crescimento e produtividade de clones de palma forrageira no semiárido e relações com variáveis meteorológicas. Rev. Caatinga 2015, 28, 10–18. [Google Scholar]
  53. Matias, F.I.; Caraza-Harter, M.V.; Endelman, J.B. FIELDimageR: Na R package to analyze orthoosaic images from agricultural field trials. Plant Phenome J. 2020, 2, 190004. [Google Scholar] [CrossRef]
  54. Liaw, A.; Wiener, M. Classification and regression by randomForest. R News 2002, 2, 18–22. [Google Scholar]
  55. Kuhn, M.; Frick, H.H. Dials: Tools for Creating TUNING Parameter Values; R Package Version 1.3.0.9000; Posit Software, PBC: Boston, MA, USA, 2022; Available online: https://github.com/tidymodels/dials (accessed on 1 July 2024).
  56. Qiao, L.; Tang, W.; Gao, D.; Zhao, R.; An, L.; Li, M.; Sun, H.; Song, D. UAV-based chlorophyll content estimation by evaluating vegetation index responses under different crop coverages. Comput. Electron. Agric. 2022, 196, 106775. [Google Scholar] [CrossRef]
  57. Bareth, G.; Bolten, A.; Gnyp, M.L.; Reusch, S.; Jasper, J. Comparison of uncalibrated RGBVI with spectrometer-based NDVI derived from UAV sensing systems on field scale. Int. Arch. Photogramm. Remote Sens. Spat. Inf. Sci. 2016, 41, 837–843. [Google Scholar] [CrossRef]
  58. Possoch, M.; Bieker, S.; Hoffmeister, D.; Bolten, A.; Schellberg, J.; Bareth, G. Multi-Temporal Crop Surface Models Combined with the Rgb Vegetation Index from Uav-Based Images for Forage Monitoring in Grassland. Int. Arch. Photogramm. Remote Sens. Spat. Inf. Sci. 2016, 41, 991–998. [Google Scholar] [CrossRef]
  59. Lu, N.; Zhou, J.; Han, Z.; Li, D.; Cao, Q.; Yao, X.; Tian, Y.; Zhu, Y.; Cao, W.; Cheng, T. Improved estimation of aboveground biomass in wheat from RGB imagery and point cloud data acquired with a low-cost unmanned aerial vehicle system. Plant Methods 2019, 15, 17. [Google Scholar] [CrossRef]
  60. Lussem, U.; Bolten, A.; Gnyp, M.L.; Jasper, J.; Bareth, G. Evaluation of RGB-based vegetation indices from UAV imagery to estimate forage yield in Grassland. Int. Arch. Photogramm. Remote Sens. Spat. Inf. Sci. 2018, 42, 1215–1219. [Google Scholar] [CrossRef]
  61. Ruwanpathirana, P.P.; Sakai, K.; Jayasinghe, G.Y.; Nakandakari, T.; Yuge, K.; Wijekoon, W.M.C.J.; Priyankara, A.C.P.; Samaraweera, M.D.S.; Madushanka, P.L.A. Evaluation of Sugarcane Crop Growth Monitoring Using Vegetation Indices Derived from RGB-Based UAV Images and Machine Learning Models. Agronomy 2024, 14, 2059. [Google Scholar] [CrossRef]
  62. Hernandez, A.; Jensen, K.; Larson, S.; Larsen, R.; Rigby, C.; Johnson, B.; Spickermann, C.; Sinton, S. Using Unmanned Aerial Vehicles and Multispectral Sensors to Model Forage Yield for Grasses of Semiarid Landscapes. Grasses 2024, 3, 84–109. [Google Scholar] [CrossRef]
  63. Pan, T.; Ye, H.; Zhang, X.; Liao, X.; Wang, D.; Bayin, D.; Safafov, M.; Okhonniyozov, M.; Majid, G. Estimating aboveground biomass of grassland in central Asia mountainous areas using unmanned aerial vehicle vegetation indices and image textures—A case study of typical grassland in Tajikistan. Environ. Sustain. Indic. 2024, 22, 100345. [Google Scholar] [CrossRef]
  64. Bazzo, C.O.G.; Kamali, B.; Hütt, C.; Bareth, G.; Gaiser, T. A Review of Estimation Methods for Aboveground Biomass in Grasslands Using UAV. Remote Sens. 2023, 15, 639. [Google Scholar] [CrossRef]
  65. Defalque, G.; Santos, R.; Bungenstab, D.; Echeverría; Dias, A.; Defalque, C. Machine learning models for dry matter and biomass estimates on cattle grazing systems. Comp. Electron. Agric. 2024, 216, 108250. [Google Scholar] [CrossRef]
  66. Swaef, T.d.; Maes, W.H.; Aper, J.; Baert, J.; Cougnon, M.; Reheul, D.; Steppe, K.; Roldán-Ruiz, I.; Lootens, P. Applying rgb-and thermal-based vegetation indices from UAVs for high-throughput field phenotyping of drought tolerance in forage grasses. Remote Sens. 2021, 13, 147. [Google Scholar] [CrossRef]
  67. Souza, J.T.A.; Ribeiro, J.E.d.S.; Araújo, J.S.; Ramos, J.P.d.F.; do Nascimento, J.P.; de Medeiros, L.T.V. Gas exchanges and water-use efficiency of Nopalea cochenillifera intercropped under edaphic practices. Comun. Sci. 2020, 11, e3035. [Google Scholar] [CrossRef]
  68. Kior, A.; Yudina, L.; Zolin, Y.; Sukhov, V.; Sukhov, E. RGB imaging as a tool for remote sensing of characteristics of terrestrial plants: A review. Plants 2024, 13, 1262. [Google Scholar] [CrossRef]
  69. Ranđelović, P.; Đorđević, V.; Milić, S.; Balešević-Tubić, S.; Petrović, K.; Miladinović, J.; Đukić, V. Predection of soybean plant density using machine learning model and vegetation indices extracted from RGB images taken with a UAV. Agronomy 2020, 10, 1108. [Google Scholar] [CrossRef]
  70. Alves, K.S.; Guimarães, M.; Ascari, J.P.; Queiroz, M.F.; Alfenas, R.F.; Mizubiti, E.S.G.; Del Ponte, E.M. RGB-based phenotyping of foliar disease severity under controlled conditions. Trop. Plant Pathol. 2022, 47, 105–117. [Google Scholar] [CrossRef]
  71. Coswosk, G.C.; Gonçalves, V.M.L.; Lima, V.J.d.; Souza, G.A.R.d.; Amaral Júnior, A.T.d.; Pereira, M.G.; Oliveira, E.C.d.; Leite, J.T.; Kamphorst, S.H.; Oliveira, U.A.d.; et al. Utilizing visible ban vegetation indices from Unmanned Aerial Vehicle Images for maize phenotyping. Remote Sens. 2024, 16, 3015. [Google Scholar] [CrossRef]
  72. Breiman, L. Random Forest. Mach. Learn 2021, 45, 5–32. [Google Scholar] [CrossRef]
  73. Bai, T.; Sun, K.; Deng, S.; Li, D.; Li, W.; Chen, Y. Multi-scale hierarchical sampling change detection using Random Forest for high-resolution satellite imagery. Int. J. Remote Sens. 2018, 39, 7523–7546. [Google Scholar] [CrossRef]
  74. Ji, Y.; Chen, Z.; Cheng, Q.; Liu, R.; Li, M.; Yan, X.; Li, G.; Wang, D.; Fu, L.; Ma, Y.; et al. Estimation of plant height and yield based on UAV imagery in faba bean (Vicia faba L.). Plant Methods 2022, 18, 26. [Google Scholar] [CrossRef]
  75. Wang, N.; Guo, Y.; Wei, X.; Migtong, Z.; Wang, H.; Bai, Y. UAV – based remote sensing using visible and multispectral indices for the estimation of vegetation cover in an oasis of a desert. Ecol. Indic. 2022, 141, 109155. [Google Scholar] [CrossRef]
  76. Lussem, U.; Bolten, A.; Kleppert, I.d.; Jasper, J.; Gnyp, M.L.; Schellberg, J.; Bareth, J. Herbage mass, N concentration, and N uptake of temperature grasslands can adequately be estimated from UAV-based image data using machine learnig. Remote Sens. 2022, 14, 3066. [Google Scholar] [CrossRef]
  77. Grüner, E.; Astor, T.; Wachendorf, M. Biomass prediction of heterogeneus temperate grasslands using an SfM aproach based UAV imaging. Remote Sens. 2019, 9, 54. [Google Scholar] [CrossRef]
  78. García-Martínez, H.; Flores-Magdaleno, H.; Ascencio-Hernández, R.; Khalil-Gardezi, A.; Tijerina-Chávez, L.; Mancilla-Villa, O.R.; Vázquez-Peña, M.A. Corn grain yield estimation from vegetation índices, canopy cover, plant density, and a neural networking using multispectral and RGB images acquired with Unmanned Aerial Vehicles. Agriculture 2020, 10, 277. [Google Scholar] [CrossRef]
  79. Domingues, T.; Brandão, T.; Ferreira, J.C. Machine learning for detection and prediction of crop diseases and pets: A comprehensive survery. Agriculture 2022, 12, 1350. [Google Scholar] [CrossRef]
  80. Zhang, Z.C.; Xin, Q.; Li, W. Machine learning-based modeling of vegetation leaf area index and gross primary productivity across North America and comparison with a process-based model. J. Adv. Model. Earth Syst. 2021, 13, e2021MS002802. [Google Scholar] [CrossRef]
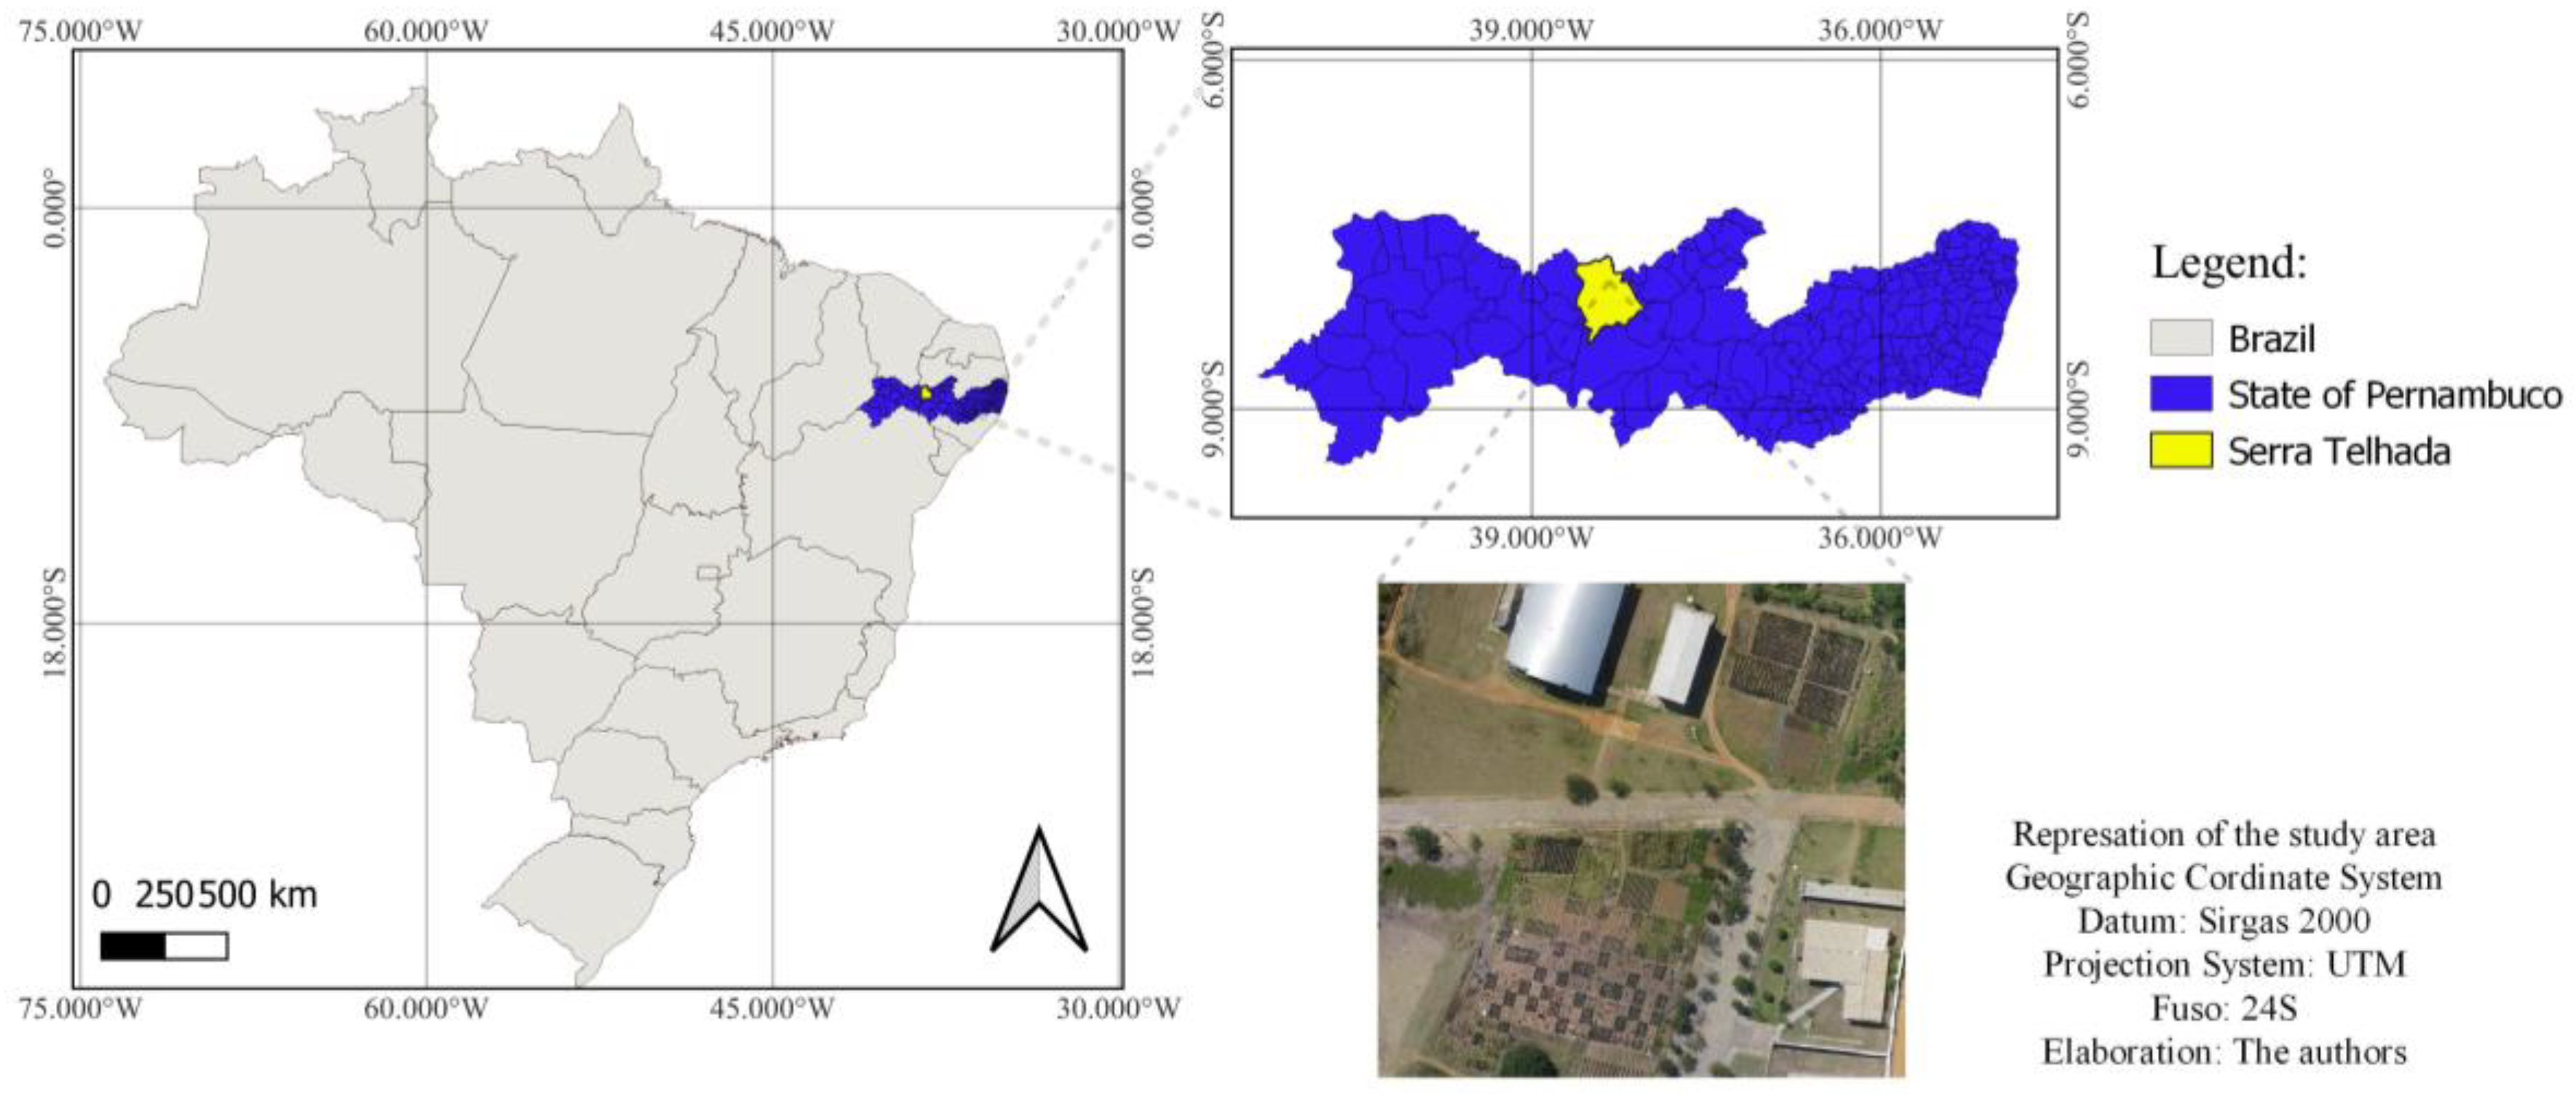
Figure 1. Location of the experimental site, Serra Talhada, Pernambuco, Brazil.
Agriculture 14 02166 g001
Figure 2. Reference evapotranspiration (ET0, mm day−1), water availability via rainfall (R, mm day−1), and irrigation depths (ID, mm day−1) of forage cactus in a semiarid environment, cultivated under different spacing between plants and rows and East–West and North–South cultivation orientation and different cutting frequencies.
Agriculture 14 02166 g002
Figure 3. Spearman correlation coefficients ranging from +1 (positive correlation) to −1 (negative correlation) for the relationship between structural characteristics (cladode area index—CAI; plant height—HEI; and plant width—PW) and forage cactus yields (fresh matter—FM; dry matter—DM; and dry matter content—DMC) with vegetation indices. (*) represents a statistically significant difference (p < 0.05).
Agriculture 14 02166 g003
Figure 4. Relationship between observed (x-axis) and predicted (y-axis) values for fresh matter (FM, Mg ha−1) (A), dry matter content (DMC, Mg ha−1) (B), dry matter (DM, Mg ha−1) (C), plant height (HEI, cm) (D), plant width (PW, cm) (E), and cladode area index (CAI, m2 m−2) (F) of the “Orelha de Elefante Mexicana” forage cactus clone, subjected to different densities (plant spacing) and East–West and North–South planting orientation. The dashed red line is the 1:1 line.
Agriculture 14 02166 g004
Figure 5. Observed (x-axis) and estimated (y-axis) values for fresh matter (FM, Mg ha−1) (A), dry matter content (DMC, Mg ha−1) (B), dry matter (DM, Mg ha−1) (C), plant height (HEI, cm) (D), plant width (PW, cm) (E), and cladode area index (CAI, m2 m−2) (F) of the “Orelha de Elefante Mexicana” forage cactus clone, subjected to different row spacings. The dashed red line is the 1:1 line.
Agriculture 14 02166 g005
Figure 6. Relationship between observed (x-axis) and predicted (y-axis) values of fresh matter (FM, Mg ha−1) (A), dry matter content (DMC, Mg ha−1) (B), dry matter (DM, Mg ha−1) (C), plant height (HEI, cm) (D), plant width (PW, cm) (E), and cladode area index (CAI, m2 m−2) (F) of forage cactus (“IPA Sertânia”—IPA, “Miúda”—MIU, and “Orelha de Elefante Mexicana”—OEM) under different cutting frequencies and forage cactus clones. The dashed red line is the 1:1 line.
Agriculture 14 02166 g006
Table 1. Visible spectrum vegetation indices, acronyms and equations of use.
IndexAcronymEquationReference
Visible Atmospherically Resistant IndexVARI(G − R)/(G + R − B)[40]
Modified Green–Red Vegetation IndexMGRVI(G2 − R2)/(G2 + R2)[41]
Green Leaf AlgorithmGLA((2 × G) − R − B)/((2 × G) + R + B)[42]
Red–Green–Blue Vegetation IndexRGBVI(G2 − B × R)/(G2 + B × R)[43]
Green–Red Vegetation IndexGRVI(G − R)/(G + R)[43]
Excess Red Vegetation IndexExR1.4 × R − G [44]
Excess Blue Vegetation IndexExB1.4 × B – G[45]
Excess Green Vegetation IndexExG2 × G − R − B[45]
Excess Green Red Vegetation IndexExGRExG – ExR[46]
Color Index of VegetationCIVE0.441 × R − 0.881 × G + 0.385 × B + 18.78745[47]
VegetativeVEGG/(R0.667 × B0.333)[48]
CombinationCOM0.25 × ExG + 0.3 × ExGR + 0.33 × CIVE + 0.12 × VEG[44]
Kawashima IndexIKAW(R − B)/(R + B)[49]
Color Intensity IndexINT(R + G + B)/3[49]
R—red visible spectral band; G—green visible spectral band; B—blue visible spectral band.
Table 2. Descriptive statistical analysis of the vegetation indices studied, Serra Talhada, Pernambuco, Brazil.
Vegetation IndicesMaximumMinimumMeanStandard Deviation
VARI0.031−0.139−0.0760.033
NGRDI0.018−0.085−0.0460.019
MGRVI0.036−0.168−0.0920.039
GLA0.071−0.0140.0180.018
RGBVI−0.940−0.987−0.9700.012
ExR80.7224.1349.6016.00
ExB35.155.21616.727.364
ExG17.39−6.5945.0005.397
ExGR−9.130−84.90−44.6020.45
CIVE16.357.7512.301.750
VEG1.0300.8900.9400.025
COM4.210−21.67−7.9436.976
IKAW0.1810.0860.1390.020
INT133.258.2989.9822.44
Table 3. Hyperparameters adjusted for the Random Forest models of each experimental unit and variables analyzed.
ExperimentExperiment NumbermtryTreesmin_nVariable
Plant spacing and orientationI and II38382FM
46692DMC
36632DM
46692HEI
48592PW
35972CAI
Different row spacingsIII38443FM
48592DMC
46692DM
35972HEI
48592PW
36632CAI
Different cutting frequencies and forage cactus clonesIV48592FM
46692DMC
38382DM
48592HEI
35972PW
48592CAI
Disclaimer/Publisher’s Note: The statements, opinions and data contained in all publications are solely those of the individual author(s) and contributor(s) and not of MDPI and/or the editor(s). MDPI and/or the editor(s) disclaim responsibility for any injury to people or property resulting from any ideas, methods, instructions or products referred to in the content.