Article

Nitrogen Residual Effect of Winter Cover Crops on Maize in Uruguay: Conventional and Isotopic Evaluation

by
Cristina Mori Alvez
*,
Carlos Perdomo Varela
and
Amabelia del Pino Machado
Soil and Water Department, Agronomy College, University of the Republic, Av. Garzon 780, Montevideo 12900, Uruguay
*
Author to whom correspondence should be addressed.
Agriculture 2024, 14(12), 2123; https://doi.org/10.3390/agriculture14122123
Submission received: 24 October 2024 / Revised: 18 November 2024 / Accepted: 21 November 2024 / Published: 23 November 2024
(This article belongs to the Special Issue Benefits and Challenges of Cover Crops in Agricultural Systems)

Abstract

:
This study aimed to evaluate the nitrogen (N) residual effects of winter cover crops (CCs) on soil N availability and corn (Zea mays L.) performance over two growing seasons and at two sites in Uruguay. Both conventional and isotopic methods were used to assess the N residual effects of two legume monocultures, a legume–grass mixture, an oat monoculture, and a control without CCs. The experimental design was a randomized block with split plots, where CCs were applied to main plots and N rates (0 and 100 kg ha⁻1) to subplots. An isotopic trial with 15N was included to measure fertilizer N use efficiency (NUE). Results varied between sites: at Site 1, legume monocultures enhanced soil N availability and, along with N rate, significantly increased corn yield and N uptake. At Site 2, only the N rate affected these variables. Site 1 had a low crop 15N recovery, averaging 9.5% due to weeds and heavy rainfall, while Site 2 showed higher recovery, notably when corn succeeded lupine (35%) and mixture CCs (40%). The soil’s top layer and corn grain showed the highest 15N concentration. The study suggests that specific CC combinations tailored to site conditions may optimize corn yield and NUE.

1. Introduction

Rainfed agricultural systems have experienced significant shifts in Uruguay since the early 2000s [1,2]. At the time, introducing new actors in the sector led to a simplified approach to system management, primarily marked by cropping sequences such as wheat–soybean and a reduction in perennial pastures inclusion into agricultural rotations. This shift extended the annual cropping phase and facilitated the expansion of farming activities into soils less suited for agriculture [1,3]. However, these changes have gradually negatively impacted soil nitrogen (N) balance and carbon (C) sequestration, affecting soil quality and the system’s sustainability [3,4,5]. Simulation results for three agricultural production systems indicated that continuous cropping leads to low and negative partial N balances, with values ranging from −40 to −30 kg N ha⁻1 [5]. Since 2015, livestock and crop production have increasingly been managed as part of a unified farming system, fostering greater integration and interconnection [1]. Such current management has reintroduced pasture phases and expanded the presence of double cropping to enhance crop diversity and utilization efficiency of production factors while protecting natural resources [6,7,8]. This shift has promoted an eco-sustainable approach, driven mainly by implementing Uruguay’s legal framework (Law 19.355, Article 76) for regulating land use and soil management [9], which has played a crucial role in this transformation. In this context, the sequence and type of crops in rotation, along with the amount of remaining residue (both aboveground and belowground), are critical factors in maintaining the balance of C [10], N [11], and other soil nutrients. Including CCs, also known as “service crops,” in crop rotations is essential for sustainable agriculture, as they enhance soil health and contribute to a more balanced and resilient agricultural system. Due to their role in erosion prevention, this practice also aligns with Uruguay’s legal framework, which requires the submission of Soil Use and Conservation Plans (Law 19.355, Article 76). Cover crops are essential for controlling water erosion, improving the soil’s physical properties, and conserving and recycling nutrients [12,13]. Therefore, it is crucial to understand and assess different CC options to select those most suitable for specific soil and climate conditions, offering advantages within a given rotation scheme [14,15]. This technological measure requires knowledge of the agronomic performance of various species across different soils, years, and production systems to identify those that provide greater productive, economic, and environmental benefits [16,17,18]. The benefits of using legumes as CCs include N inputs through biological N fixation (BNF), improved soil quality and fertility, increased crop productivity, C sequestration, and protein-rich grain and forage for animal feed. The role of CCs in mitigating N losses is particularly important in today’s agricultural systems, where intensification demands more nutrients, increasing fertilizer use, and raising the risk of nitrate-N contamination in surface and groundwater [19,20]. This agronomic practice can help mitigate N losses, increase soil N reserves, and improve nutrient use efficiency [16,19,20,21].
The N recovery efficiency from crop residues depends on the synchronization between N supply, fertilizer management, and the crop’s demand for the nutrient. According to several studies [11,22,23,24,25], the recovery efficiencies of N fixed by legume cover crops were relatively inconsistent, ranging from 3% to 56%. Nitrogen recovery efficiency (NRE) can be estimated using conventional or isotopic trial data. In conventional trials, apparent NRE (apNRE) is calculated. In isotopic trials, 15NRE is directly measured by the ratio of 15N absorbed by the crop to the amount of N applied. The term “apparent” is used because the N recovery is indirectly estimated through plant analysis. This method assumes that the soil supplies the same amount of N to both treatments, with and without residue, attributing the difference in N absorption between the two to the N derived from the residue [11].
Several legume cover crop species and their subsequent use as green manure has been evaluated in Uruguay under both tilled and no-till systems [11,26,27]. However, more research on using CCs in Uruguayan agricultural production is needed, emphasizing the importance of developing soil and nutrient management strategies that enhance sustainability and reduce environmental pollution. In this context, CCs present a viable option to minimize the degenerative effects caused by continuous no-till farming and soybean monoculture [28]. Understanding and quantifying the effects of CCs is especially important now, as fertilizer use significantly impacts production systems’ profitability and poses environmental risks, a growing concern for society.
Our study was driven by the practical implications of understanding how CCs can influence soil fertility for the subsequent cash crop. The N provided by CC biomass can be a valuable resource for the next crop in the short term and, in the long term, can contribute to increasing soil N content and reducing fertilization costs. However, the soil N availability is not straightforward, as it depends on residual N (mineral N already present in the soil) and mineralized N (released from soil organic matter and previous crop residues). The dynamics of CC decomposition, influenced by environmental and management factors, make it challenging to consistently and accurately predict the amount of N available and when it will be accessible to the following crop. The studied winter CCs included a grain legume, blue lupine (Lupinus angustifolius L.), a forage legume, berseem clover (Trifolium alexandrinum L.), a grass, black oats (Avena strigosa L.), and blue lupine grown in mixture with black oats (L-O mixture). The objectives of this study were (i) to assess the effect of those CCs on N availability derived from the mineralization of their residues by measuring changes in soil mineral N; (ii) to evaluate the impact of CCs as predecessor crops on the performance of a maize crop measuring grain yield, N uptake, and the relative response in plant N uptake to N fertilization, and estimating N recovery in the crop using a conventional method; and (iii) to analyze how the residue quality (C:N ratio, biochemical composition) of the preceding crop affects N use efficiency (NUE) by measuring N recovery in the crop and soil from fertilizer applied at sowing and other stages (V6 and V10) of the corn crop using isotopic methods.

2. Materials and Methods

2.1. Experimental Sites Description

The experiments for this study were conducted in farmers’ fields. The first site was established in Libertad, San José Department, at 34°36′27.5″ S, 56°32′57.4″ W (Site 1) during the 2018/2019 growing season. The second site was set up in Ombúes de Lavalle, Colonia Department, at 33°58′56.9″ S, 57°50′57.1″ W (Site 2) during the 2019/2020 season. According to the local soil classification, soil in both sites was classified as Li1 (Libertad) unit. The parent material in Site 1 was silty clay sediments, while for Site 2, it was a combination of silty clay sediments and crystalline rock. According to the USDA International Soil Taxonomy, the soils at Site 1 were classified as Typic Argiaquolls and Site 2 as Typic Argiudolls [29]. Both suborders belong to the Mollisol order and share characteristics such as an argillic horizon (Bt horizon) with clay accumulation and a surface layer rich in organic matter (OM). However, they differ in their moisture regimes, which influence their physical and chemical properties: Argiudolls have a udic moisture regime, while Argiaquolls have an aquic regime [29,30].
In the top 20 cm, Site 1 soil had lower total organic C (TOC) content, exchangeable bases, and pH than Site 2 (Table 1). The soil texture in both studied layers (the top 7 cm and from 7 to 15 cm) was heavier at Site 2, which also had a higher C content (Table 2) and lower bulk density (1.2 vs. 1.4 Mg m3).
Meteorological data, including rainfall and air temperature, were collected on-site by a Meter-Group weather station, which recorded hourly data. This station was installed during Phase 2 of the experiment, during the growth period of the corn crop at both sites.

2.2. Treatments and Experimental Design

The experiment was conducted on soybean crop stubble at both sites. The activities at each site were carried out in two phases (Supplementary Materials, Table S1).
In Phase 1, CCs were established, and the biomass production and BNF rates of the legume cover crops were estimated. The species sown at both sites included two legume CCs—Lupinus angustifolius L. and Trifolium alexandrinum L.—a non-legume species as a reference (Avena strigosa L.), and L-O mixture culture in a 60:40 ratio in Site 1 and 70:30 ratio in Site 2. The experimental design for this phase followed a randomized complete block design with three replications. Each experimental unit covered an area of 380 m2 (10 m wide × 38 m long), resulting in a total area of 0.57 ha across 15 plots.
The CCs were sown using a seed-drill Semeato brand model SHM 17-13-Germany (with 13 rows and 17 cm row spacing). The sowing density for each species is presented in Supplementary Materials, Table S1. The legumes were inoculated with commercially recommended inoculants specific to each species, following the manufacturer’s instructions (NITRASEC, Lage y Cía S.A., Montevideo, Uruguay). Since no particular inoculant was available for lupine, Bradyrhizobium sp. strains U-612 + U-620, typically recommended for Ornithopus compressus, were used. After soil sampling simultaneously with sowing, base fertilization was applied across the entire experimental area with non-limiting doses of phosphorus (P) and potassium (K).
The CCs at Site 1 were sown earlier, within the optimal sowing window, compared to Site 2. This difference in sowing dates resulted in a total growth cycle of 164 days at Site 1, while Site 2 had a shorter cycle of 119 days, giving Site 1 an additional 45 days for biomass production.
Phase 2 began with the corn sowing in the same experimental units where the winter CCs had been grown 60 days after terminating them with herbicide at Site 1 and 58 days after herbicide application at Site 2. Corn was sown using no-till planting with a mechanical plate planter at a depth of 3.5 cm, with 0.7 m row spacing and 0.2 m between plants, aiming for a density of 65,000–70,000 plants ha−1 [31].
At this phase, the main plots were divided to introduce an additional study factor: N rate. As a result, the experimental design for this phase followed a randomized complete block design with a split-plot arrangement and three replications. The main plots (33 m × 21 m) were randomly assigned one of five “preceding crop” treatments: (1) lupine, (2) lupine grown in mixture with black oat, (3) black oat, (4) berseem clover, and (5) no CC (control). The subplots (6.6 m × 10.5 m) were assigned the “N rate” factor for maize cultivation with two levels: (1) 0 kg N ha⁻1 and (2) 100 kg N ha⁻1. The N rate was applied to the maize crop in two stages: one-third at the time of seeding and the remaining two-thirds when the maize reached the phenological stage, equivalent to V6 at Site 1 and V10 at Site 2, according to the Ritchie and Hanway growth scale (see Supplementary Materials, Table S2) [32].
Alongside the conventional experiment, an isotopic trial was carried out to evaluate the fertilizer’s NUE, measuring the recovery 15N in both the plant and soil. Isotopic microplots were carefully established within each subplot of the conventional trial, with dimensions of 2.25 m2 (1.5 m wide and 1.5 m long). Each microplot contained three rows, each with seven plants. Urea enriched with 15N at 6% and 3% atom excess was applied at the same phenological stages of maize and using the same N rate as in the fertilized treatment of the conventional trial but split across two applications in the corn growth cycle, with only one application using labeled urea (Supplementary Materials, Table S2). The labeled urea was dissolved in distilled water (300 mL per microplot) and sprayed to the soil to ensure uniform 15N distribution. This isotopic trial allowed us to independently evaluate NUE from the fertilizer at each application time without interacting with the N rate used [33]. The experimental design followed the same structure as the conventional experiment, with three replications.

2.3. Soil and Plant Sampling

Soil sampling was conducted at both experimental sites at the start of the experiment in Phase 1 to characterize the soils. Composite soil samples were obtained from each plot at 0 to 20 cm depth to assess mineral N concentration. Additionally, samples were collected from the 0–7 cm and 7–15 cm layers to evaluate physical properties such as texture and bulk density.
In Phase 1, soil sampling was performed at three points in time: sowing, harvest, and post-harvest of the CCs to evaluate soil N concentration. Additionally, three sampling times were implemented for soil water content determination using the gravimetric method [34], recording the difference between the weight of soil at field moisture and the weight after drying at 105 °C in an oven for 48 h until a constant weight (Equation (1)).
S o i l   w a t e r   c o n t e n t   g   w a t e r   g   d r y   s o i l 1 = s o i l   w e t   w e i g h t   s o i l   d r y   w e i g h t   s o i l   d r y   w e i g h t  
In Phase 2, soil sampling was conducted at two points in time: corn sowing at both sites and at the V6 in Site 1 and V10 stages of the corn in Site 2, to assess nitrate (NO3-N) and ammonium (NH4-N) concentrations. Fifteen subsamples were collected from each plot using a sharpened stainless-steel probe with a diameter of 2 cm. In Phase 2, soil sampling within the isotopic microplots, conducted after the corn harvest, was carefully carried out to avoid cross-contamination of 15N between soil layers. The sampling was performed in two steps: first, the top 15 cm of the soil profile was collected and divided into three intervals (0–5, 5–10, and 10–15 cm) to quantify the remaining 15N from fertilization (sowing and V6 stage). Next, a second sampling was obtained from the same hole, collecting the subsequent 15–30 cm soil depth layer. Each layer was processed and analyzed separately.
The first plant sampling was conducted during Phase 1, the day before the CC termination, defined by the lupine reaching the beginning of grain filling. The area harvested for each CC’s aboveground biomass was 4.6 m2 (1.15 m × 4 m), and the fresh weight of each sample was recorded in the field. Simultaneously, subsamples were taken to the laboratory to estimate the dry matter of each CC and to perform the relevant chemical analyses for this study.
In Phase 2, at physiological maturity and during the harvest of the corn from the conventional experiment, the corn grain yield was calculated based on the ears harvested from the two central rows of 8 m long. Another plant sampling was conducted at physiological maturity, cutting three rows of 1 m each at ground level. Each sample was separated into different components: stems, leaves, cobs, and grain. The grain from the ears was threshed using experimental equipment, and its moisture content was measured with a Model MC2000 moisture meter (OHAUS Europe GmbH, Greifensee, Switzerland). The grain yield was then corrected to a baseline moisture level of 14.5%. The total aboveground biomass yield per hectare was calculated based on the number of plants harvested and the planting spacing. Additionally, during Phase 2, corn plants were sampled at physiological maturity from the isotopic plots. Three corn plants were harvested from the central row of each microplot and separated into three components: stems–leaves, cobs, and grain, for independent processing and analysis. The first two components were referred to as stubble to distinguish them from the harvested product, which is the grain component.

2.4. Sample Processing and Analytical Determinations

2.4.1. Soil Samples from Conventional and Isotopic Experiments

Soil samples were dried in a forced-air oven at 40 °C for at least 48 h and were ground through a 2 mm sieve after removing any visible plant residue. The following properties were determined to characterize the soils of each experimental site: OM, pH, available phosphorus (PBray1), mineral N (nitrate and ammonium), exchangeable cations (Ca, Mg, K, and Na), and granulometric composition. The OM content was determined by the Walkley–Black method [35], while exchangeable cations Ca and Mg were determined by atomic absorption, and K and Na by flame spectrophotometry, after extraction with 1 M ammonium acetate at pH 7 [36]. Soil pH was measured in water (1:2.5 soil/water ratio) with Orion Research 701 pH electrode (Massachusetts, USA). Available P content was measured by Bray extraction method No. 1 [37], the most used technique in Uruguay. The Griess–Ilosvany method [38] was used to determine the concentration of NO3-N after extraction with 2 M KCl, while the concentration of N-NH4 was determined in the same extract using a colorimetric method based on the Berthelot reaction [39]. The soil granulometric composition was analyzed by the hydrometer method according to Gee and Bauder [40]. Each soil’s water retention curve was determined in the 0–15 cm layer, for which the water potential at different soil water contents was measured with a WP4-C Dew Point Potentiometer (Decagon Brand, Pullman, WA, USA).
Soil samples collected from the isotopic microplots were processed differently in the laboratory. For each sample, the recorded volume and fresh and dry weight at 105 °C were used to estimate the bulk density at each sampling depth and the equivalent N mass, allowing for the expression of 15N concentrations in each soil layer in kg N ha⁻1. Bulk density data were obtained by dividing the total dry weight of each soil layer by the total volume (the volume of each soil sample at the specified depth multiplied by the number of subsamples in the composite sample). The soil grinding for isotopic analysis was carried out in two steps: first, a coarse grinding using a blade mill, followed by finer grinding in a rotary mill (SampleTek Model 200 Vial Rotator, Lincoln, NE, USA) to produce a fine powder with a consistency similar to talcum powder, which is necessary for 15N analysis via mass spectrometry. The concentrations of total C and N and the 15N/14N ratios of the soil samples from each layer in the isotopic plots were determined using an elemental analyzer (Flash EA 112) connected to an isotope ratio mass spectrometer (DeltaPLUS, Finnigan MAT, Bremen, Germany).
The 15N recovery at each soil depth layer and the total for the combined layers (Ndff 0–30 cm) were determined using isotopic data. To achieve this, estimating the fraction of N derived from the fertilizer (Ndff) and the total N content in each soil layer was necessary. For example, the calculation for the 0–5 cm layer was performed as follows [41]:
N d f f ( % ) = % a t . e x c 15 N s o i l   s a m p l e 0 5 c m % a t .   e x c 15 N f e r t i l i z e r × 100
N 0 5 c m k g h a 1 = ( s o i l   m a s s 0 5 c m ) × N 0 5 c m ( % ) 100
N d f f   k g h a 1 = N 0 5 ( k g h a 1 ) × N d f f 0 5 c m ( % ) 100

2.4.2. Plant Samples from Conventional and Isotopic Experiments

All samples of maize plant components (grain, leaf + stem, and cobs) were dried in a forced air oven at 65 °C until a constant weight. Then, the samples were ground in a mill with fixed and mobile blades (Model MA-580, Marconi Equipments, Piracicaba, SP, Brazil) until being passed through a 0.5 mm mesh. The samples analyzed by mass spectrometry were newly ground in a rotary mill (SampleTek Model 200 Vial Rotator, Lincoln, NE, USA) until achieving the granulometry required for the analyses of C and total N concentration and 15N/14N composition of the plant samples (at the natural abundance level and the enriched level).
The Kjeldahl method determined the N content in all plant and grain samples from the conventional experiment. The total amount of N absorbed was defined as the product of the accumulated dry matter (DM) expressed in kg ha−1 and the DM’s N concentration expressed in percentage (%N), as shown in Equation (5) [41].
T o t a l   N   U p t a k e     ( k g   h a 1 ) = D M   ( k g   h a 1 ) ×   N ( % ) 100
The relative response of N absorption to fertilization according to N supply (Rs) was estimated as the difference between 1 minus the ratio between soil N supply and crop N demand using the following equation [42]:
R s = 1   T o t a l   N   U p t a k e T 0 N T o t a l   N   U p t a k e T 100 N
Total N UptakeT0N is the N absorbed in the control treatment and constitutes a measure of the soil N supply, and the total N uptakeT100N is an estimate of the N demand of the crop in the treatment with N addition. The values close to 1 indicate a greater demand for fertilizer N (sites with N response), while values close to 0 represent flat response curves, that is, cases without response to N (when the soil N supply satisfies the crop’s demand).
The apparent N recovery efficiency derived from CC residues (apNRECC) was estimated from the 0 N treatments as the difference in N uptake between corn sown on CC residues and without CCs (control) [11].
a p N R E C C ( % ) = N   U p t a k e   o n   C C N U p t a k e   o n   C o n t r o l N   a t   C C   t e r m i n a t i o n     × 100  
Furthermore, the apparent N recovery efficiency derived from fertilizer (apNREFert) was estimated from the 0 N and 100 N treatments as the difference in N uptake between corn sown on fertilized CC and unfertilized CC [11].
a p N R E F e r t ( % ) = N U p t a k e   o n     C C 100 N N U p t a k e   o n     C C 0 N N r a t e   f e r t i l i z e r × 100
The estimation of apNRECC (Equation (7)) and apNREFert (Equation (8)) assumes that the rates of N mineralization in the soil are similar in plots with and without the contribution of CC or fertilizer, respectively.
Using the natural abundance method, the 15N isotopic composition of the CC was used to estimate BNF for berseem clover and lupine in monoculture and L-O mixture culture [43]. Oats served as the reference crop. Another important parameter for estimating BNF is the B value, which was determined using the same legume variety and rhizobium strain as in the field experiment but grown in an N-free medium under greenhouse conditions. The estimated B values were −0.8‰ for lupine and −0.5‰ for berseem clover.
B N F % = δ 15 N   r e f e r e n c e δ 15 N   l e g u m e δ 15 N   r e f e r e n c e B   v a l u e × 100
From the data of kg DM ha−1, the sample’s N concentration, and the 15N enrichment(% atom 15N excess, the fraction of Ndff in each plant component (grain, stem + leaves, and cob) at each fertilization time (Supplementary Materials, Table S2) with 15N was determined [41,44].
N d f f ( % ) = % a t o m 15 N e x c   f o l i a r   s a m p l e % a t o m 15 N   e x c   f e r t i l i z e r × 100
The amount of Ndff in each plant component was estimated using Equations (5) and (10) [41].
N d f f k g   h a 1 = N   u p t a k e × N d f f % 100
Then, based on the kg ha−1 of Ndff in the plant components, the crop’s N recovery efficiency (15NREcrop) was calculated [41], expressed as a percentage of the 15N fertilizer added. On the other hand, N recycling was calculated as the sum of Nddf remaining in the crop’s residue and the soil at harvest, and the unaccounted-for N was estimated as the difference between the total N applied minus the N exported by the grain and recycled N (N remaining in the soil plus N in wheat stubble).
N R E % = N d f f k g h a 1 N   r a t e k g h a 1 × 100
The weighted average 15NRE of the crop was estimated based on the amount of N and the 15N enrichment used at each N fertilization time (Supplementary Materials, Table S2). The amount of Ndff in the crop fertilized at each fertilization time was estimated, and then the sum of these amounts was divided by the total N rate applied (100 kg N ha−1).
The biochemical composition of CC (non-fibrous carbohydrates, cellulose, and lignin, expressed as a percentage of total C) was determined at the Agricultural and Environmental Service Laboratory of the University of Georgia, USA, using near-infrared reflectance spectroscopy (NIRS) equipment.

2.5. Statistical Analysis

The results were analyzed using ANOVA with the MIXED procedure in the SAS statistical program (SAS® Studio on Demand for Academics, Cary, NC, USA). The predecessor crops (cover crops), N treatments, and their interactions were treated as fixed effects in the statistical model, while the block × species interaction was considered a random effect. To assess mineral N dynamics over time in the non-fertilized treatments, the model included predecessors, sampling time, and their interaction as fixed effects, with the block effect (plot) treated as random. A Tukey test with a 95% confidence level was employed to determine the statistical significance of the fixed effects within each experimental site (and year effect). The Shapiro–Wilk and Levene tests were conducted to check for data normality and the homogeneity of variance assumptions. The variables analyzed from the conventional experiments included mineral N concentration at sowing and the V6 stage, yield, nitrogen concentration, absorbed N in grain, and the relative response of N absorption to fertilization. In the isotopic experiment, the study focused on variables related to the recovery 15N in both plant and soil. Measurements from the WP4-C Dewpoint Potentiometer were plotted, and nonlinear regression analysis of water potential (WP in MPa) and gravimetric water content (GWC in g H2O g oven dry soil−1) was performed using SigmaPlot v. 14.0 (Systat Software).

3. Results

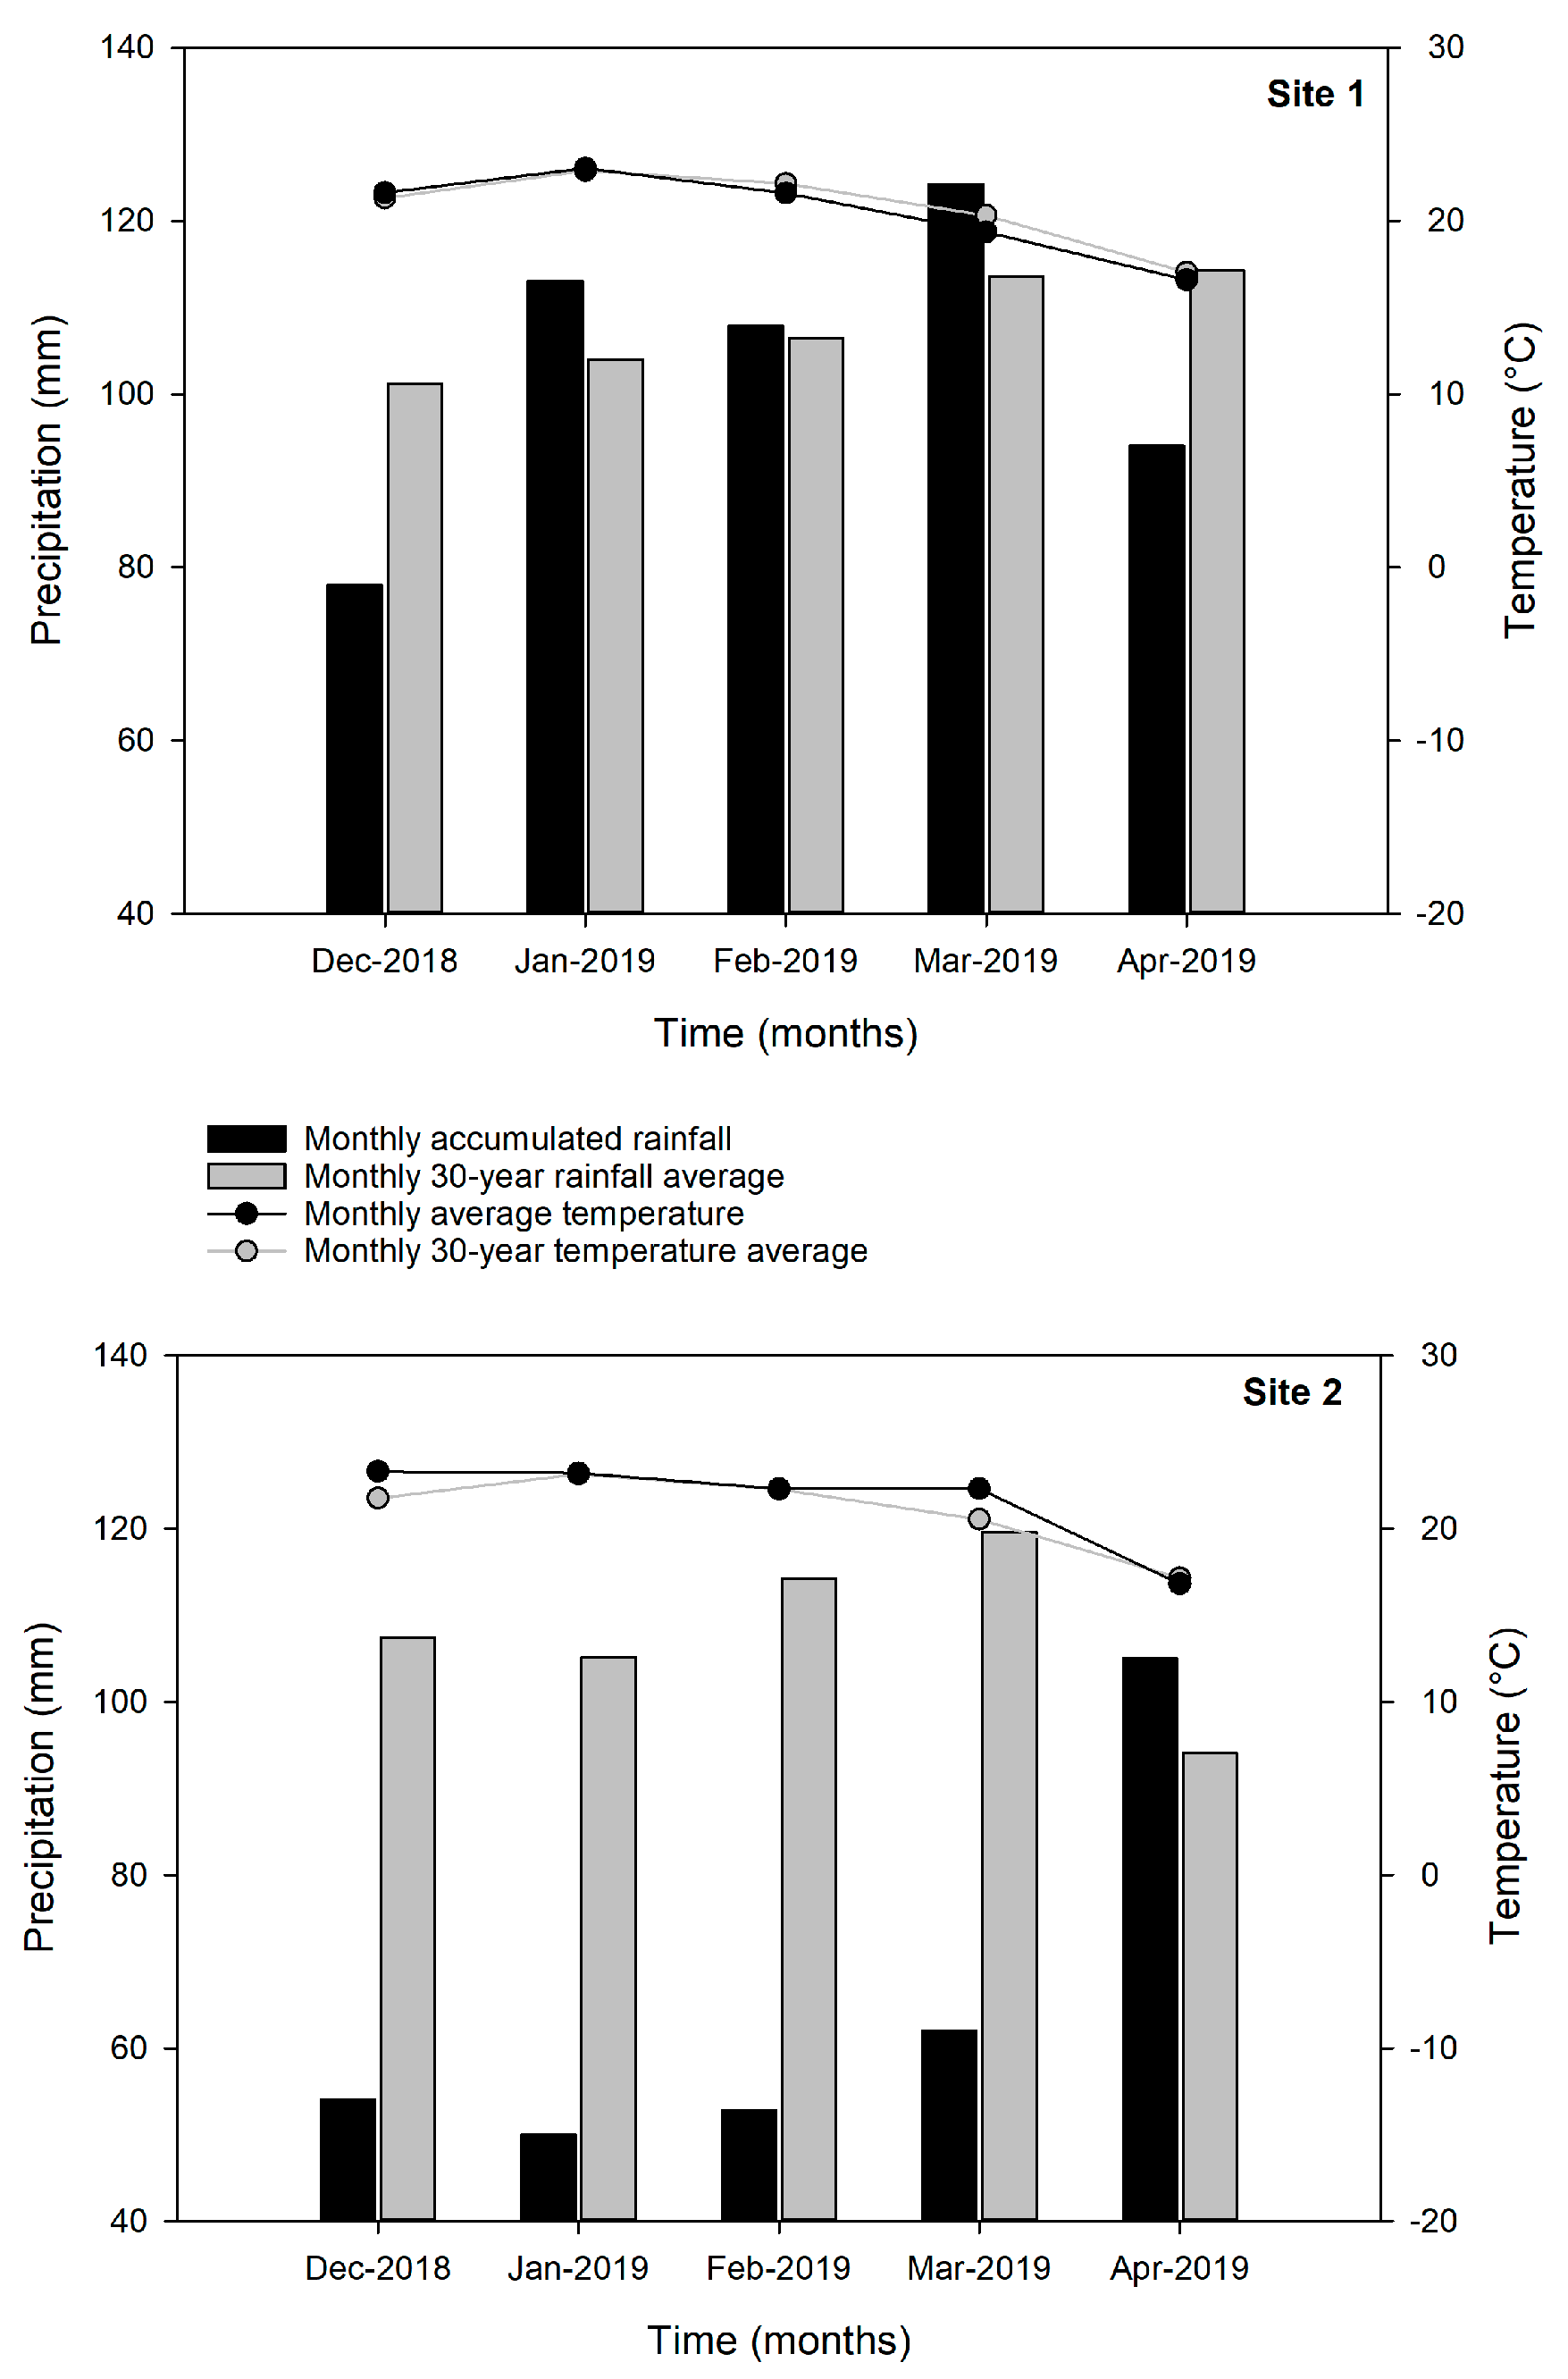
3.1. Weather Conditions During the Study Period

The total precipitation from sowing to physiological maturity of the corn was 517 mm at Site 1 and 324 mm at Site 2. Meanwhile, the average temperatures for the same period were 21.3 °C at Site 1 and 21.8 °C at Site 2. From chemical fallow to corn sowing, accumulated rainfall was 85 mm at Site 1 and 60 mm at Site 2, with average temperatures of 17.8 °C and 21.7 °C, respectively. At the time of corn sowing, there were no differences in soil water content between cover crop treatments (Supplementary Materials, Table S3).
Based on the weather data in Figure 1, the water supply for the summer crop at Site 2 was deficient, as the monthly rainfall throughout the corn cycle was consistently below the 30-year average. The most significant deviation from the historical rainfall pattern occurred between December and March at Site 2. In contrast, at Site 1, rainfall was lower than the historical average in December but exceeded the average during the rest of the crop cycle, including the critical growth period.
Regarding temperature records, the monthly average temperature during the crop’s critical period defined as the 15 days before and after female flowering [45] was 21.6 °C at Site 1 and 21.9 °C at Site 2. These temperatures were similar to the historical averages for the same growth period (Figure 1).

3.2. Phase 1: Aboveground Biomass Yield and Chemical and Biochemical Traits of CC

Regarding biochemical composition of CC, aerial biomass of legumes had a higher concentration of non-fibrous carbohydrates and a lower concentration of cellulose than grasses, whether grown in monoculture or mixture (Table 3). In this dataset, there was a strong linear correlation between the soluble carbohydrates concentration and total N concentration in the residues (r = 0.9, p < 0.0001), which was influenced by the species and the maturity stage at which the crop residues were harvested. No clear association was observed between lignin concentration and specific species; however, a trend showed higher lignin levels in the CCs from Site 2.
At Site 1, the biomass yield was the highest for oats grown in monoculture, while at Site 2, the L-O mixture yielded more (Table 3). Overall, CCs produced more at Site 1, except for the mixture culture, where Site 2 produced a greater biomass. Regarding the legumes evaluated, the yield of berseem clover was comparable at both sites. However, the yield of lupine monoculture was significantly higher at Site 1, quadrupling the yield reached at Site 2.
The results concerning legumes’ BNF rates were similar across sites. At Site 2, a notable increase in N fixation by lupine was observed in the mixed culture compared to the monoculture, while no differences were found at Site 1 (Table 3). Coinciding with the higher biomass yield, the highest AG N yield of legumes in monoculture was produced in Site 1 because the CC was sown earlier than in Site 2, giving Site 1 further time for both biomass production and N fixation.

3.3. Phase 2: Conventional Experiment

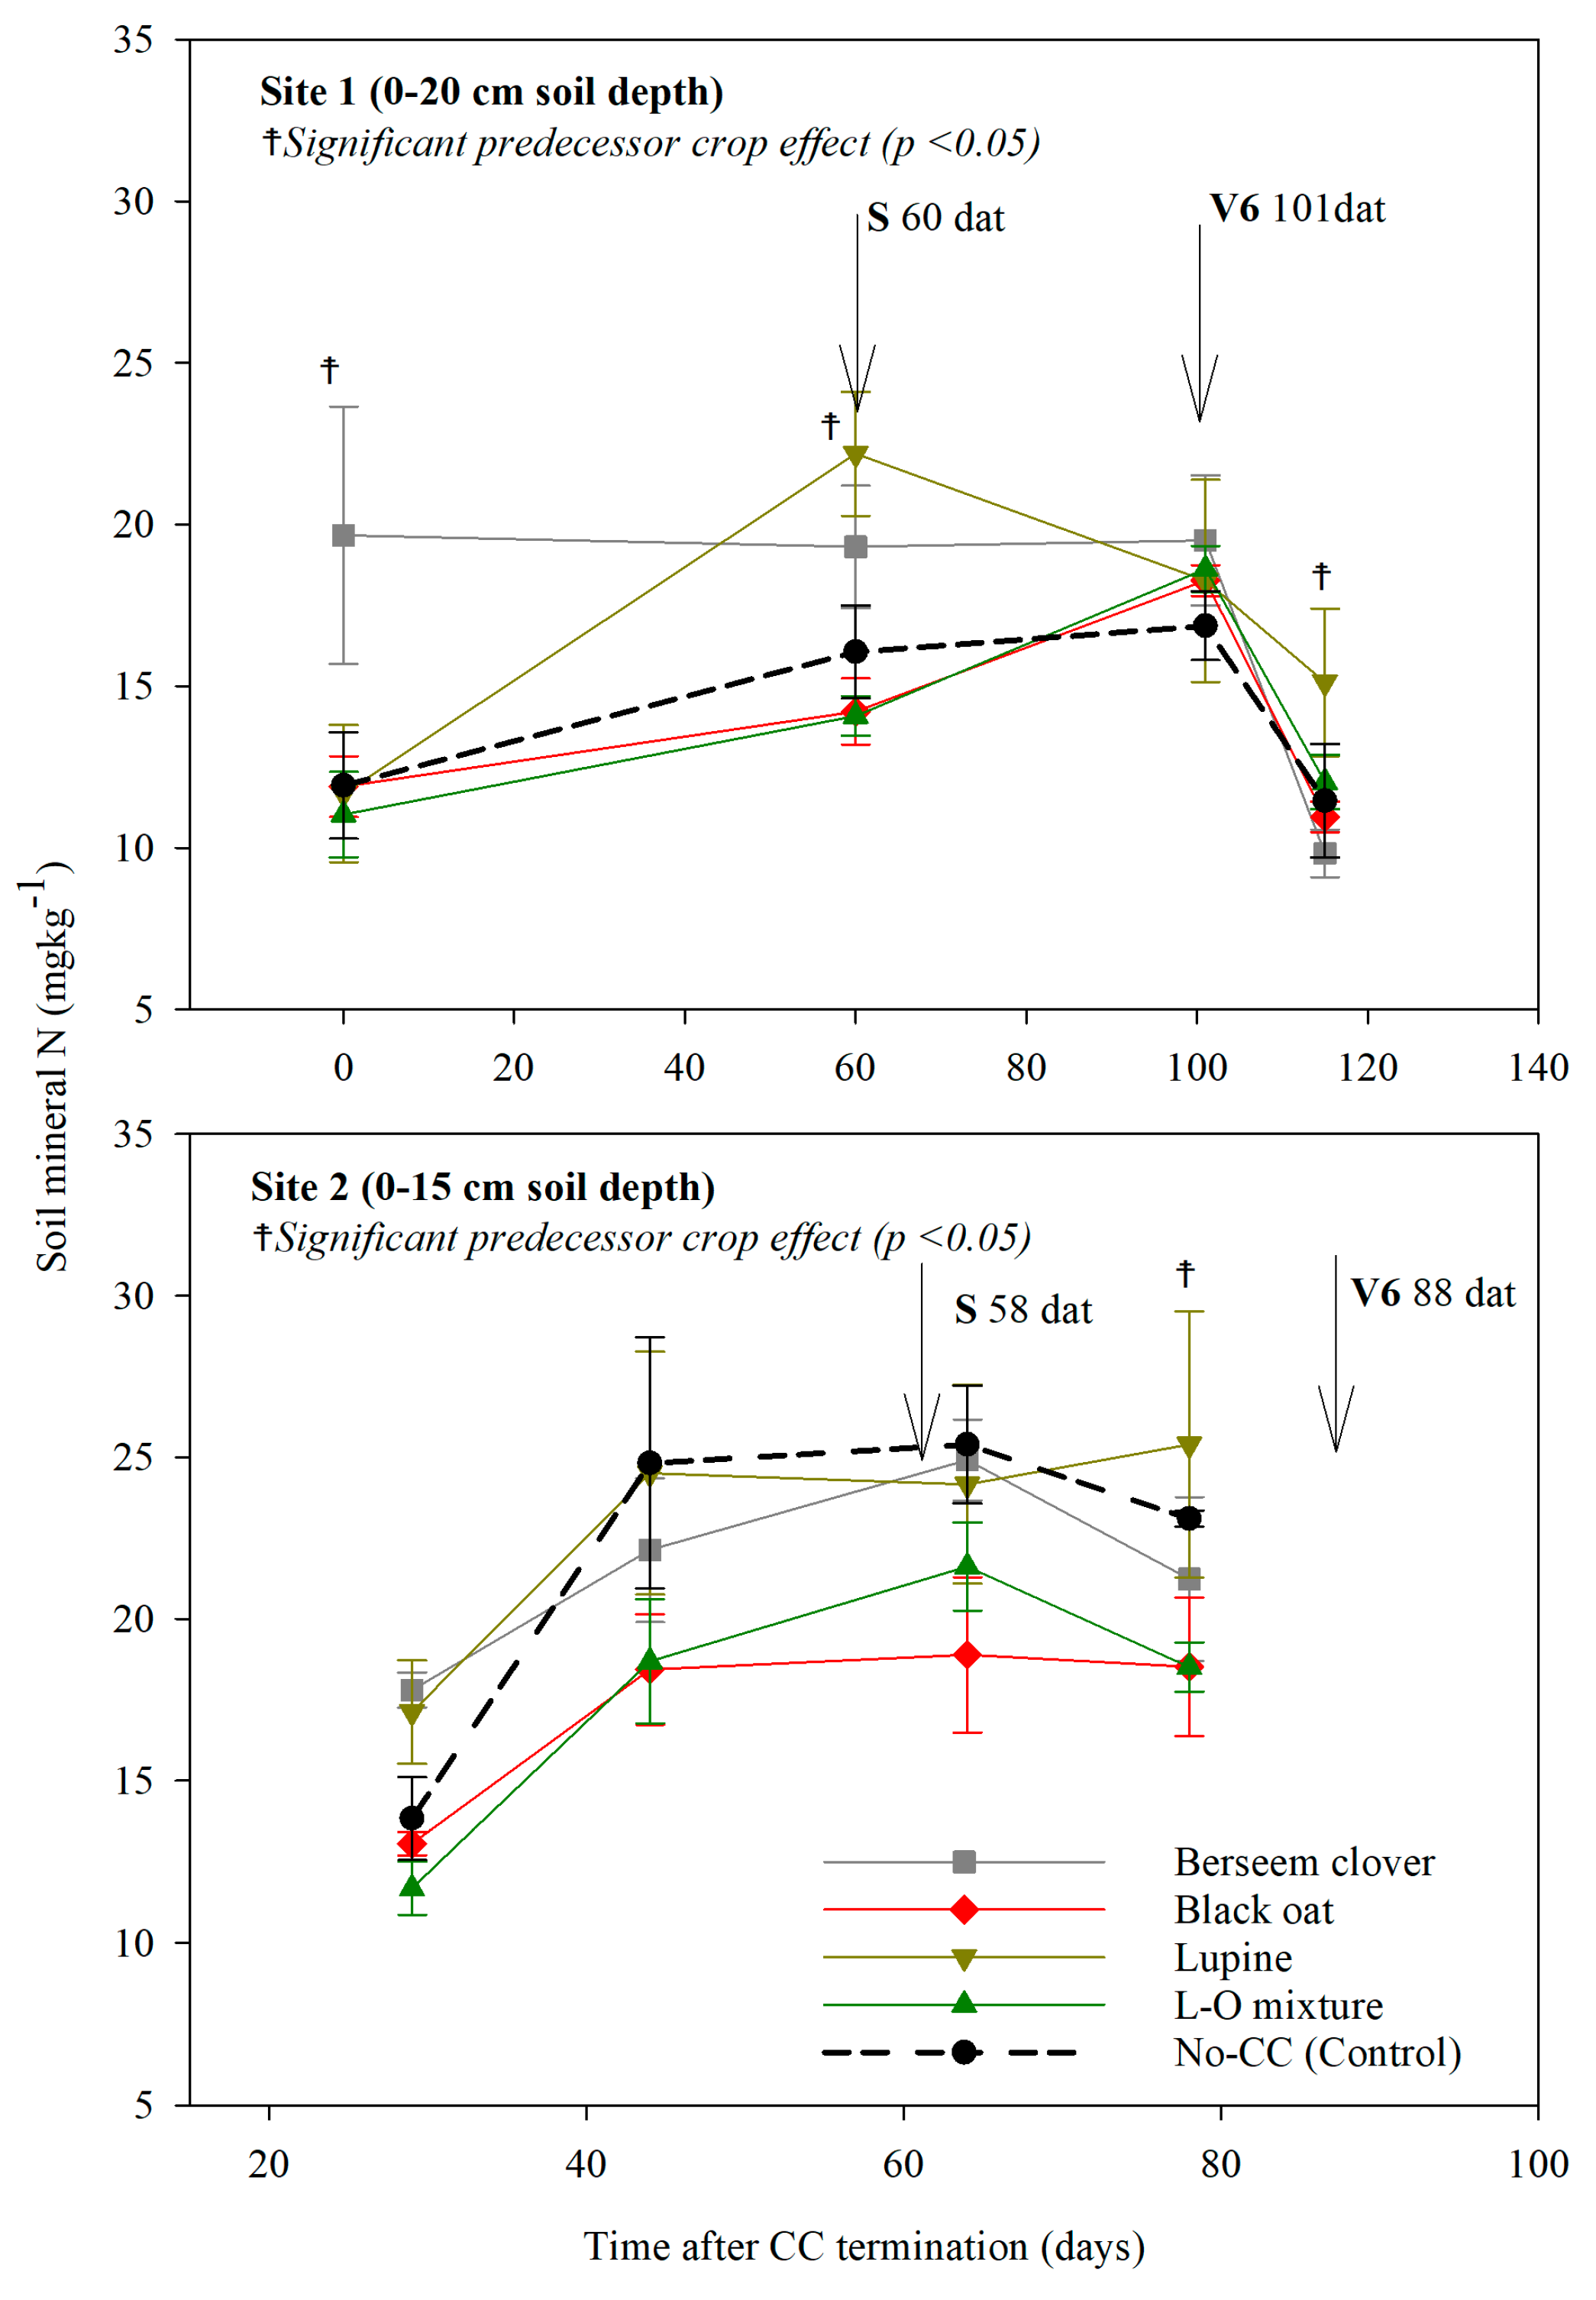
3.3.1. Soil Mineral N Dynamics After CC Termination

Although the fallow period was similar at both sites (Table S2), the predecessor crop effect on the soil N availability at corn sowing at Site 1 was statistically significant (p = 0.0006). In contrast, Site 2 showed no differences among CCs (Table 4). At Site 1, soil mineral N availability varied among CCs, with higher concentrations of NO3 -N associated with legume monocultures like lupine and berseem clover. The other treatments (oats in monoculture and L-O mixture) had similar N concentrations to the control (with no CC). At Site 2, while no statistically significant effect of the predecessor crops was observed, the control treatment tended to have higher N availability than CCs. Ammonium (N-NH4) largely accounted for a smaller proportion of the available mineral N in both sites.
Since the interaction between the predecessor crop and sampling time was not significant (Figure 2), the average mineral N concentration across all points in time was analyzed. For this variable, the ranking of the predecessor crops from highest to lowest concentration for Site 1 was berseem clover, lupine, control, L-O mixture, and oats. In contrast, for Site 2, the ranking was lupine, control, berseem clover, L-O mixture, and oats (Figure 2).
The predecessor crop significantly affected N availability at V6 and V10 stages in Site 2 but not in Site 1 (Table 5), dissimilar to what was observed at corn sowing (Table 4). When comparing soil NO3-N concentration at sowing and V6 or V10 in the non-fertilized treatment and without a CC, it was found that the concentration remained stable at Site 1 but decreased at Site 2 (Table 4 and Table 5). At Site 1, none of the evaluated effects on soil mineral N were significant. However, at Site 2, there was a significant interaction between the N rate and the predecessor crop.

3.3.2. Grain Yield and Plant N Uptake by Maize Cropping

The ANOVA results for the variables measured in corn showed that the main effects (N rate and predecessor crop) were significant for grain yield and grain N content at Site 1. At Site 2, only the N rate significantly affected those variables and grain N concentration (Table 6). At Site 1, the interaction between the N rate and predecessor crop was also significant for grain yield and whole plant N content. Additionally, for the relative response in whole plant N content (N absorbed in grain plus N absorbed in the remaining aerial biomass), the predecessor crop effect was significant only at Site 1.
In Site 1, the highest grain yield and N uptake were recorded in the fertilized corn plots without CCs. In contrast, among the 0 N plots, the highest yield was observed in the berseem clover treatment. At Site 2, the response was similar across CCs, making the effect of the predecessor crop non-significant (Table 6). At both sites, the response to N fertilization in grain yield was significant for oats and lupine as predecessor crops. In Site 1, the N absorbed in grain was high for those CCs, while in Site 2, it was significant for all CCs treatments, as grain N concentration increased significantly in all fertilized treatments. However, when whole plant N content was analyzed, the response to N fertilization was significant across all treatments, except for berseem clover in Site 1. In contrast, in Site 2, the response to applied N in this variable did not differ between CCs, like the response observed for grain N content (Table 6).
Another noteworthy finding was that in the 0 N treatments, grain yield with no CC in Site 1 was higher and statistically different from that of the lupine and oat monocultures. However, it was not significantly different from the yields with berseem clover and the mixture culture, although the difference with the mixture was nearly 2000 kg ha⁻1 (Table 6). In contrast, in Site 2, the grain yield without a CC did not show significant differences compared to any evaluated CC.

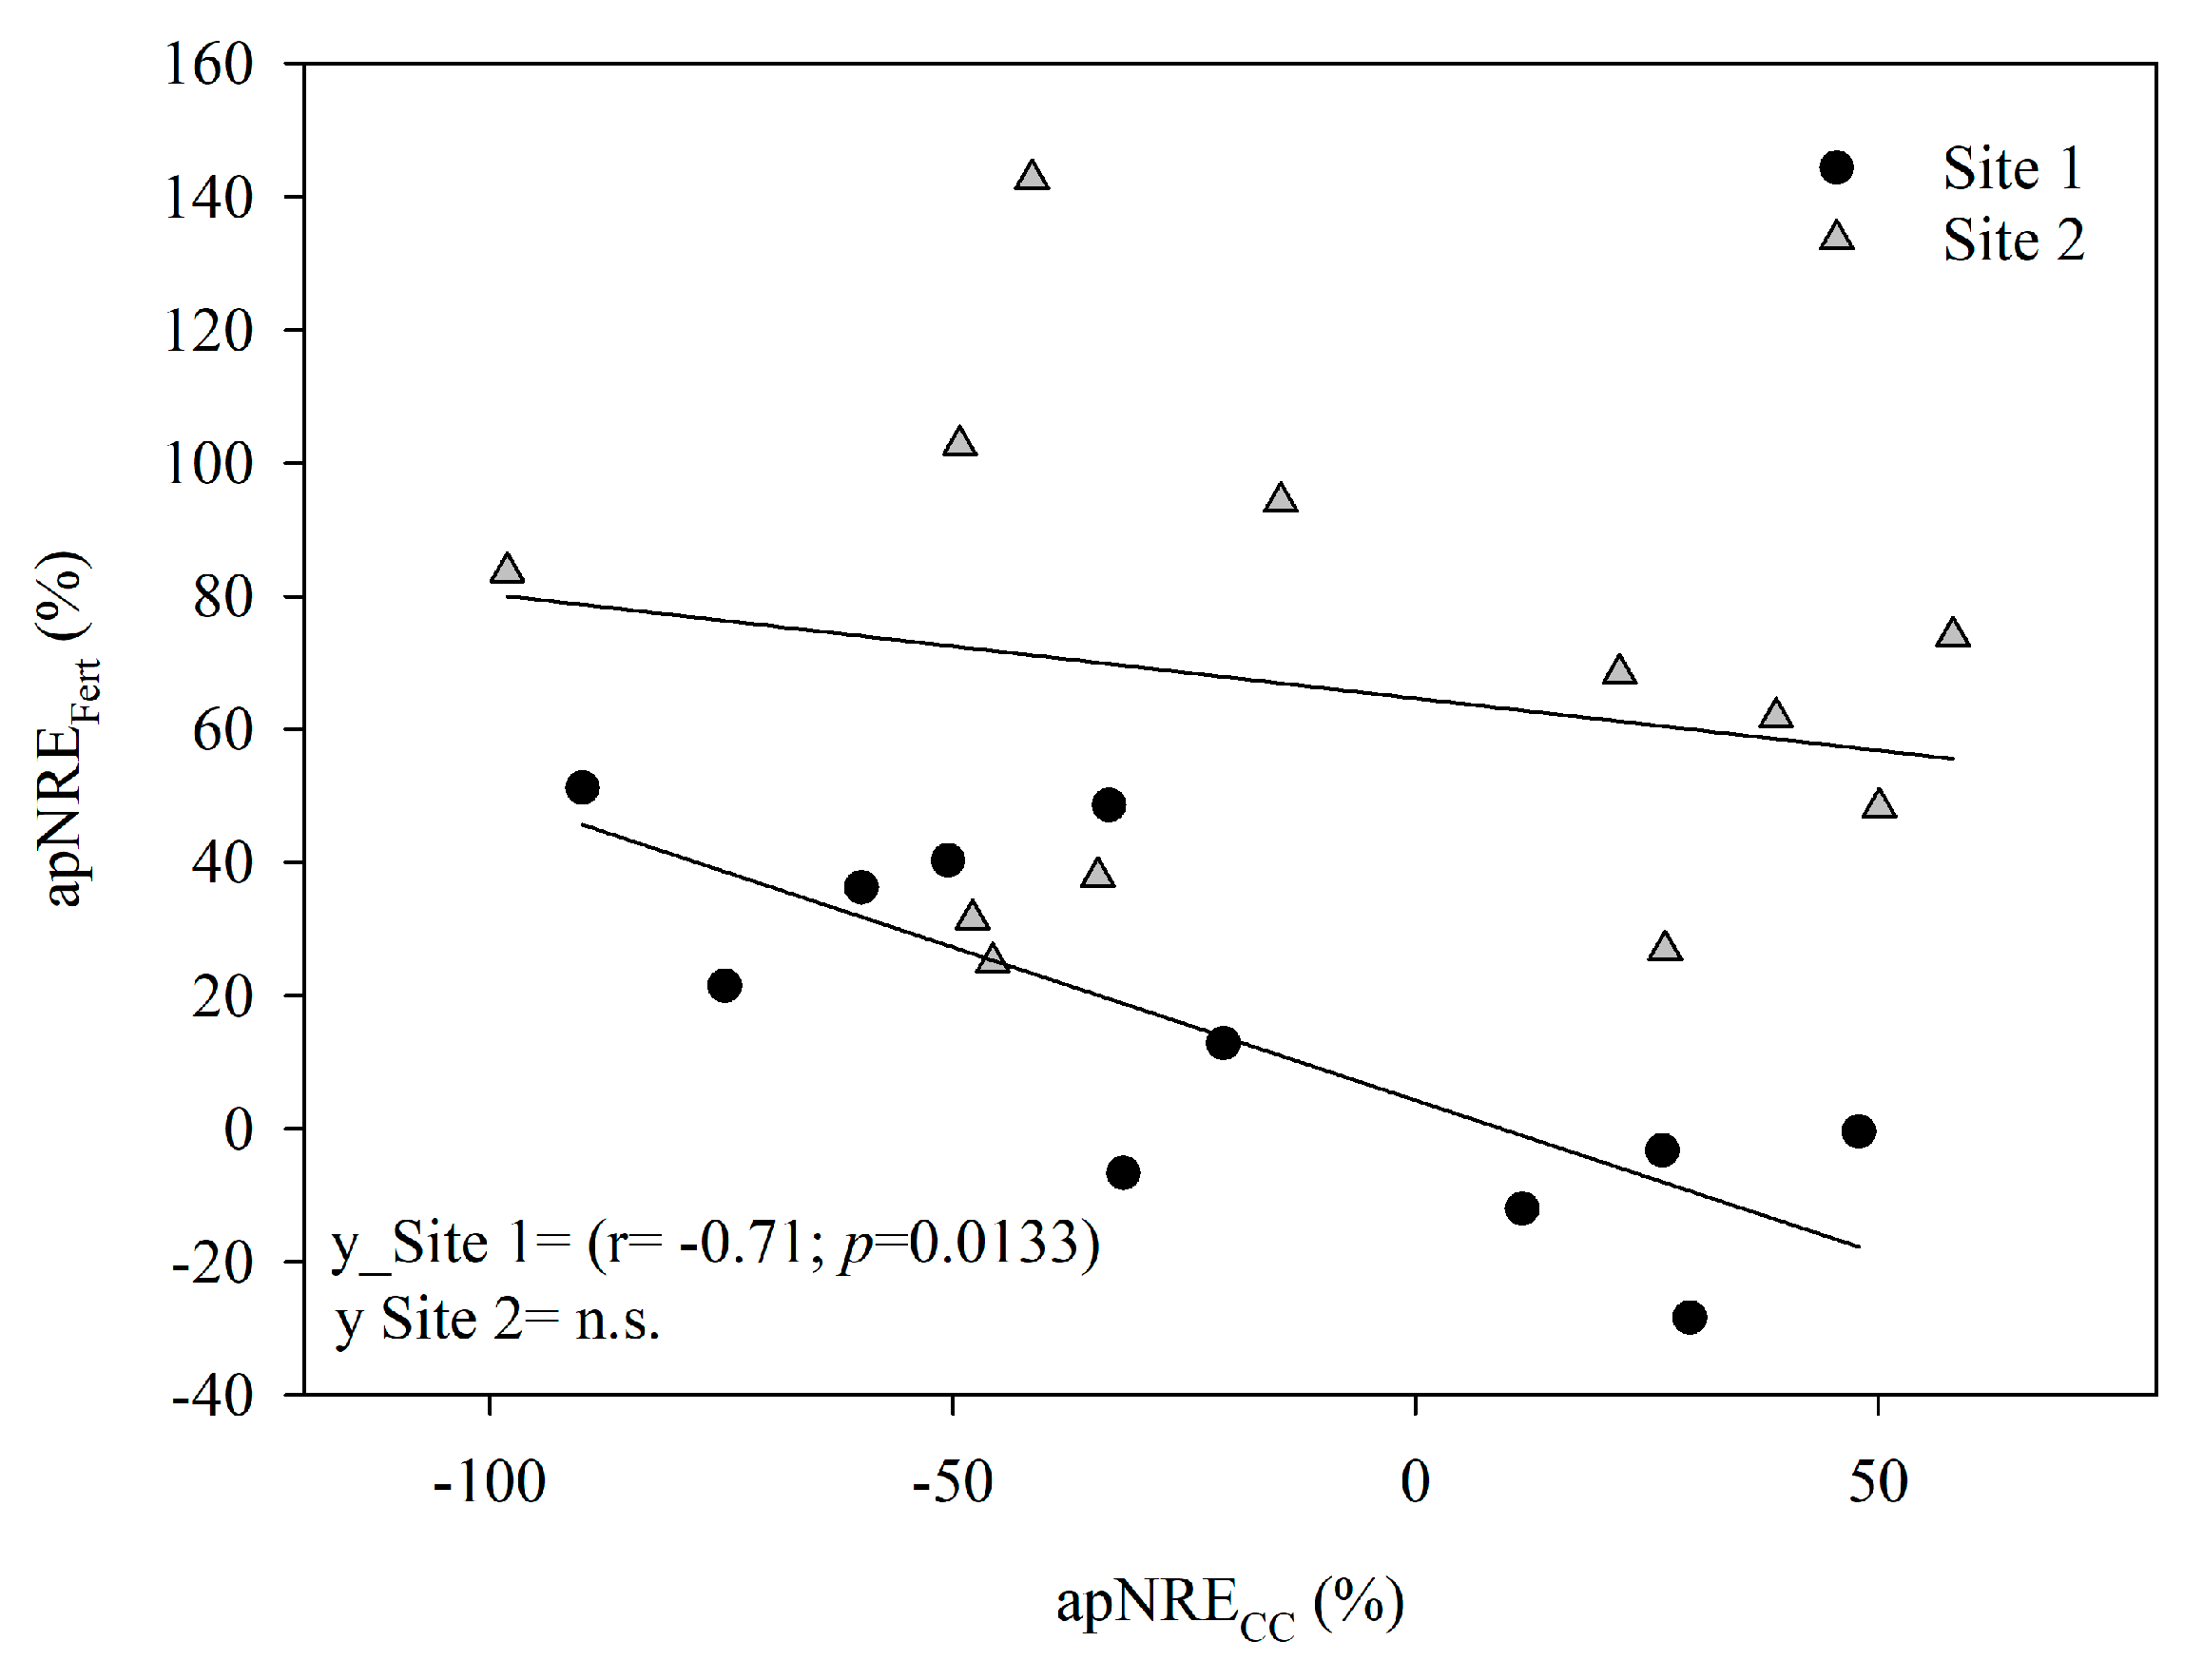
3.3.3. Apparent Nitrogen Recovery Efficiency from CCs and Fertilizer

The average apNRECC was negative and similar at both sites, with values of −13% at Site 1 and −11% at Site 2. However, excluding oats, which always had negative values, the average apNRECC was 0 and 3% in Site 1 and 2, respectively. In contrast, apNREFert was consistently positive and varied between sites, reaching an average of 20% at Site 1 and 66% at Site 2. As shown in Figure 3, apNREFert exhibited more significant variability among CCs at Site 1 than Site 2, which was also reflected in the Rs values, with a significant effect from the predecessor crop (Table 6). At Site 1, a considerable negative correlation was found between apNRECC and apNREFert, suggesting that when corn received an adequate N supply from the CC (such as berseem clover), there was no significant response to N fertilization. In contrast, a positive response to fertilization was observed when the CC immobilized N, as seen with oats. Therefore, there was a positive correlation between apNREFert and the C:N ratio of the CC.

3.4. Isotopic Experiment

3.4.1. Plant 15N Recovery in the Maize Cropping

The 15N recovery of the entire plant resulted from the 15N recovery of each corn plant component (Table 7), confirming the differences observed in the conventional experiment. The crop’s 15NRE was significantly lower at Site 1, likely due to competition for N between the crop and weeds (Table 7). At Site 2, only the estimator of 15NRE of corn grown on berseem clover stubble did not differ between the timing of 15N labeling (at sowing and V10 stages), whereas, in the other treatments, 15NRE was significantly higher in V10 than sowing time. At Site 1, the differences in 15NRE between 15N application timings were significant, especially in the berseem clover and mixture CC treatments.
Regarding the predecessor crop effect, in Site 1, the 15NRE of N fertilizer applied at sowing was similar across all predecessors. However, at the V6 stage, legume CCs or the mixture of lupine and oats showed higher 15NRE. At Site 2, the interaction between 15N application timing and predecessor crop significantly affected 15NRE. At sowing, 15NRE was higher in the berseem clover treatment and the control, while at the V10 stage, lupine monoculture and lupine–oat mixture treatments had the highest 15NRE. Although no significant differences in mineral N availability were found between treatments at Site 1 at the V6 stage, the soil N concentration was considerably lower at sowing with oats grown in monoculture or mixture (Table 4).

3.4.2. Soil 15N Recovery After Corn Harvest

At corn harvest, 15N recovery was measured across different soil layers (0–5, 5–10, 10–15, and 15–30 cm, Supplementary Materials, Figure S3) and evaluated as the total sum of Ndff from all layers, as well as specifically the top soil layer (Table 8). The highest proportion of 15N in the soil profile at both sites was found in the top 0–5 cm soil layer. Consequently, the association between these data and the Ndff (0–30 cm) was strong and significant (Supplementary Materials, Table S4). However, the CC biomass or its quality did not explain it but rather the soil C content and the increased rhizospheric and microbial activity in that top soil layer. It was also observed that residual 15N in the soil was highly related to the fertilizer N rate (Table 8).
The aboveground CC biomass did not explain the 15N recovery in the corn crop at either site (Supplementary Materials, Table S4); however, the C:N ratio did, as previously mentioned (Figure 4). Additionally, the amount of unaccounted-for N showed a significant negative association with crop N recovery (Supplementary Materials, Table S4). In other words, the higher the 15NRE of the crop (Figure 3, Table 7), the lower the proportion of unaccounted-for N (or N losses from the system) (Table 8).

4. Discussion

4.1. Soil Mineral N Dynamic as Affected by Chemical and Biochemical Traits of CCs

The effectiveness of CCs in delivering various agronomical and environmental services depends on the chemical and biochemical traits of CCs, which control N mineralization and the duration of the stubble’s soil coverage. During decomposition, the rate at which microorganisms assimilate C depends on both plant material quantity and quality and soil microorganisms’ carbon use efficiency [46]. Carbon that is not assimilated is released as CO2. The gross N mineralization process is linked to C assimilation and the microbial community’s C:N ratio. When N is present over microbial requirements, net N mineralization occurs, converting organic N into ammonium. However, if N is lacking, inorganic N is immobilized to maintain the microbial biomass [47]. In our study, the aboveground biomass of legume CCs exhibited higher levels of soluble carbohydrates and lower cellulose content than oats, whether grown in monoculture or mixture with oats. These chemical and biochemical traits of the CC legumes, together with high N content, may lead to net N mineralization in the soil, whereas for CC grasses, net immobilization occurs, decreasing soil N availability. These expected changes in soil N availability are in agreement with the findings obtained in our study. The soil mineral N results in Table 4 indicate that the predecessor crop effect was primarily driven by the amount of biomass produced; the higher the biomass production at Site 1, the more pronounced the differences compared to the no-CC treatment. In addition, the C:N ratio as an indicator of the residue quality also played a role. Crops like oats and the mixture treatment supply less N, lowering soil nitrate availability [48,49]. The significant difference in soil mineral N between these two treatments in Site 1 (Table 4) may be attributed to the differing proportions of oats and lupine seeded at each site. In Site 1, the mixture’s composition was similar to that of the oat monoculture treatment, prompting a decision to increase the proportion of lupine in the mix during the following cropping season, achieved in Site 2. This adjustment aimed to perform a CC with a more significant presence of lupine, which resulted in a higher N biomass concentration and a lower C:N ratio in Site 2, increasing the difference in AG N yield between CC’s oat and mixture, and consequently, the N supply for the succeeding crop (Table 3). We suggest this occurred because heterotrophic bacteria (microbial net immobilization of ammonium) out-compete nitrifiers for the available ammonium, meaning that nitrification requires a low C:N ratio to proceed effectively, i.e., when C availability is low [50]. In addition, the lupine yield and AG N yield were higher at Site 1, about quadrupling them concerning Site 2. This difference can mainly be attributed to the crops’ growth period, which was 45 days longer at Site 1 because the sowing date was two months earlier than at Site 2.
The more significant impact of the predecessor crop at Site 1 compared to Site 2 could not be attributed to climatic conditions during the fallow period because the minor differences in rainfall (25 mm higher in Site 1) and temperature (3.9 °C lower in Site 1) were unlikely to account for the higher mineral N levels at Site 1. Soil texture could also influence N mineralization given the lower clay content and a reduced soil water capacity retention of Site 1 (Supplementary Materials, Figure S1), which may have led to more favorable conditions for the N mineralization from the CC stubble [15]. Since the interaction between the predecessor crop and sampling time was not significant (Figure 2), the average mineral N concentration across all points in time was analyzed. For this variable, the ranking of the predecessor crops from highest to lowest concentration for Site 1 was berseem clover, lupine, no CC, L-O mixture, and oats. In contrast, for Site 2, the ranking was lupine, no CC, berseem clover, L-O mixture, and oats (Figure 2). These results suggest that the CC effect on soil mineral N was similar between sites, with no significant differences between the legume in monoculture (berseem clover and lupine) and the treatment without a CC, except in Site 1, where the soil mineral N concentration with berseem clover was higher than control. (Figure 2). Although oats in monoculture or mixture had the lowest soil mineral N concentration. These CCs did not differ from the control treatment, except in Site 2, where the soil mineral N concentration with oats was significantly lower than in the treatment without a CC. This lower N availability with oats is expected, as it presented a high C:N ratio, which generally leads to increased rates of N immobilization [48].
The lower NO3-N concentration at Site 2 obtained at the V10 stage can be partially explained by the more advanced corn physiological stage compared to Site 1. At the V6 stage, spike differentiation and stem elongation begin, while at V10, the spike determines the number of rows and grains per row. At the V10 stage, the corn plant starts rapidly accumulating nutrients and biomass, continuing into the reproductive stage [51]. At Site 1, these changes coincided with a humid period, with rainfall close to the historical average and no water excess. In contrast, Site 2 experienced an exceptionally dry cycle compared to the historical average (Figure 1), explaining the lower NO3-N values due to unfavorable conditions for nitrification. In treatments involving legumes, such as lupine monoculture and berseem clover, soil NO3-N concentrations at the V10 stage were higher in fertilized plots than in unfertilized ones, suggesting that there was residuality of the N fertilizer applied at sowing corn (Table 5), which remained available for plant uptake. In contrast, in other treatments, mainly with oats, NO3-N concentrations of the fertilized plots were similar or even lower. Additionally, although no significant differences in mineral N availability were found between unfertilized treatments at Site 2, the control treatment tended to have higher N availability, implying that CC may help to retain N in the soil, potentially reducing N losses.
While no distinct relationship between CC’s lignin concentration and particular species was identified, there was a tendency for CCs at Site 2 to have higher lignin levels (Table 3). This difference in lignin concentration between sites could be attributed to dissimilar climatic conditions and soil nutrient availability, particularly potassium (K) and phosphorus (P), which may have promoted more significant lignin biosynthesis. Liu et al. [52] highlighted that lignin metabolism is actively involved in responding to various environmental stresses (both abiotic and biotic) and can be influenced by management factors such as nutrient availability and plant density. Regarding the effect of climate, Site 1 experienced higher accumulated rainfall and average temperatures during the CC growth cycle, with 548 mm compared to 383 mm and 13.1 °C versus 12.8 °C, respectively. Numerous studies indicate that lignin biosynthesis tends to increase under drought stress. This enhanced accumulation of lignin, which serves as an adaptation mechanism to drought or high salinity, has also been observed in Leucaena, sweet potato (Ipomoea batatas), and soybeans [52]. Although scarce differences were found in SOM (5.2% at Site 1 and 5.7% at Site 2) and nutrient availability (Table 1 and Table 2), soil characterization revealed a lower concentration of exchangeable bases, particularly K, at Site 1. Research has shown that low K levels can lead to unregulated absorption of ammonium and inhibit K absorption, potentially resulting in decreased lignin biosynthesis [53]. Thus, the drier climatic conditions and greater K availability at Site 2 would account for the higher lignin content in the CCs. This biochemical fraction of the total C was linked to the water potential (ψ) of CC residues on the soil surface [54]. The ψ of cover crop residues is crucial for microbial survival and activity and, consequently, has a strong influence over crop decomposition and subsequent release of N in no-till systems [54]. That research demonstrated that the parameters “a” and “b” in a model describing water potential (ψ = a θg−b) in CC residues are influenced by lignin content. This study found that when lignin concentrations increase, the “a” parameter tends to increase (becoming less negative), indicating a decrease in the water retention capacity of the residue. Conversely, a decrease in the “b” parameter (becoming more negative) suggests a reduction in the water retention rate, meaning the residue dries out more quickly and loses moisture faster. Together, these changes imply that residues with higher lignin content may have a diminished ability to retain water, which could negatively impact microbial activity, decomposition rates, and nutrient cycling in the soil. In our study, the higher lignin content of oats may have contributed to the observed lower N release to the maize crop (Table 4 and Table 5).
The results for legumes’ BNF rates were consistent across sites. At Site 2, lupine in mixture culture increased N fixation compared to monoculture. At the same time, no differences were observed at Site 1 (Table 4). Previous studies have indicated that the proportion of N derived from BNF increases when legumes are sown alongside non-legumes like oats. This increment in N fixation occurs because grasses are generally more efficient at competing for available soil N than legumes [55,56]. However, the ability of legumes to absorb inorganic N during their growth cycle may also explain the variability in their N fixation response to soil inorganic N levels [55,57,58]. In a field experiment, Guinet et al. [40] classified ten legume species based on their efficiency in inorganic N uptake. They found that species such as broad bean, lupine, fenugreek, and pea exhibited efficiencies of less than 0.5. In contrast, chickpea, bean, vetch, lentil, pea, and soybean demonstrated efficiencies equal to or greater than 0.5. These findings suggest that, for the lupine genus, N fixation is minimally impacted by the availability of soil inorganic N compared to other legume species.

4.2. Cover Crops Effects on Succeeding Maize Crop

The substantial differences in CC biomass production and N content (Table 3) within each site suggest that the predecessor crop was an essential source of N for the succeeding corn, particularly in the case of berseem clover, but this was not true for lupine or oats. Moreover, the higher CC’s stubble biomass production at Site 1 likely promoted N immobilization, explaining the lower corn N uptake in treatments with CC (except for berseem clover) compared to those without CC. However, the ANOVA did not show significant differences between oats, lupine, and mixtures (Table 6). Additionally, the pedoclimatic conditions at Site 1, characterized by coarser-textured soils and a cropping season with rainfall levels higher than the historical average, could have led to some N losses, mainly through leaching and denitrification in areas prone to waterlogging within the experimental site. Moreover, weed control at this site was ineffective, and probably, part of the available N was absorbed by weeds. Although CCs generally suppress weeds, grasses like oats are more effective in early-season weed control than legumes because they rapidly establish roots and emerge [59,60]. In our study, the highest incidence of weeds was observed in Site 1 plots with berseem clover, where weed biomass was 3 to 8 times higher than in the plots with oats. This result confirms the more remarkable ability of CC grasses to reduce weed incidence.
Based on the model for corn N fertilization in Uruguay proposed by Perdomo and Cardellino [61], which predicts response to N fertilization when N-NO3 concentrations are below 20 mg kg−1 in the top 20 cm of soil at sowing, all treatments at both sites would meet the criteria for a positive N response of corn. This positive N response was particularly evident for lupine and oats in monoculture and mixture culture at Site 1 and in all treatments in Site 2. The significant response in N uptake in both grain and whole plant in Site 2 may be attributed to the corn phenological stage when N was applied at the V10 stage, a period of high N demand. On the other hand, in Site 1, it was used earlier, at the V6 stage. Applying N at that later stage allowed for better synchronization of N supply with the crop’s peak demand, improving the rate of N uptake by the corn [62].
Interestingly, in the 0 N treatments, the grain yield without a CC at Site 1 was significantly higher than that of lupine and oat monocultures but not substantially different from that of berseem clover. At Site 2, grain yield without a CC showed no significant differences compared to any evaluated CC. This suggests that a 100 kg N ha⁻1 fertilizer application was needed in the treatment without CC to match the grain yield of unfertilized CC treatments. At Site 1, only berseem clover achieved this yield, while at Site 2, no significant predecessor crop effect was observed, where the yield with 100 kg N ha⁻1 and no CC matched that of any unfertilized CC treatment. Maize grain yield and whole N plant content tend to be higher on legumes CC than oats (Table 6), which could be attributed to increased soil N supply, most likely due to the greater quantity of N-rich residues returned by these CC (Table 3). These results agree with Alvarez et al. [63], in a meta-analysis of 67 experiments across the Pampas region, reported that maize yield generally decreased by 8% following non-legume CC; however, it increased by 7% after legume CCs compared to fallow. In addition, they concluded that adopting legume CCs in the Pampas region is particularly recommended for optimizing corn production.

4.3. Cover Crops Effects on Nitrogen Recovery Indices from Conventional and Isotopic Experiments

Except for oats, which consistently showed negative values, the average apNRECC was roughly zero at both sites. This low value of apNRECC indicates that, in most cases, N derived from the other predecessor crops has contributed minimally as an N source for maize. Apparent NRECC was positively associated with N content of the CC biomass or low C:N ratio, while the opposite association with apparent NREFert was observed due to the negative association between apNRECC and apNREFert, but this was only observed at Site 1 (Figure 3). This finding indicates that a higher residue biomass of CCs, and consequently higher C contribution, was linked to more efficient use of fertilizer N, highlighting the crucial role of soil C inputs in enhancing crop productivity, especially in cropping seasons with a high risk of N losses, such as in Site 1, which experienced above-average rainfall and presented low soil water retention capacity (Supplementary Materials, Figure S1). At Site 2, the variation in apNRECC did not account for the variation in apNREFert, as the RS was similar across predecessor crops (Table 6). The lack of a significant predecessor crop effect may have been partly due to the drought during much of the corn growth cycle, which hindered residue decomposition. Lower CC biomass production at Site 2 could have also contributed to the reduced N input from CC residues.
Regarding the 15N application timing, as expected, 15NRE was higher when the N supply coincided with the periods of highest N demand by the crop (V6 and V10), which are stages of rapid growth and increased N uptake. The weighted 15NREcrop was linked to residue quality. At Site 1, the highest 15NREcrop was achieved with berseem clover, which had the lowest C:N ratio. At Site 2, the highest 15NREcrop was obtained with lupine grown in monoculture or mixture, which also had favorable C:N ratios for net N mineralization in the soil (Supplementary Materials, Figure S2). However, at Site 1, weeds may have also absorbed a significant portion of the N mineralized from berseem clover.
An unexpected outcome was the low recovery of 15N in both the crop and soil in the oat treatments, observed at both sites and for both N application times. Additionally, at Site 1, even though this treatment resulted in the lowest weed invasion, it also had the lowest 15N recovery (Table 7 and Table 8). These results may be linked to the biochemical characteristics of the oat CC residue, such as its high lignin content, which slowed down decomposition and affected N cycling. Despite no significant effect of the preceding crop (Table 8), maize following oats had greater 15N fertilizer losses (unaccounted-for N) than other CCs. The 15N losses ranged from 40 to 84 kg N ha−1 at Sites 2 and 1, respectively, accounting for 40–80% of the applied N. We propose that this high proportion of unaccounted-for N could be due to two factors: 1. the low water retention of oat residues results in increased N losses (through leaching, denitrification, or volatilization), mainly because the labeled N was applied in liquid form. Moreover, this effect would be more pronounced at Site 1 due to edaphic factors such as the soil’s lower cation exchange capacity and clay content. 2. the biochemical characteristics of oat stubble likely caused the added 15N urea fertilizer to be diluted by native soil N more significantly than with other CCs [41,64]. The dilution effect observed with oats aligns with the findings of Schmatz et al. [65], who, through measuring soil N dynamic with labeled residues, reported a significant decrease in 15N enrichment for wheat residue (which had a lower initial soluble C fraction). These authors suggested that some of the N measured in the remaining residue came from unlabelled soil N, which was assimilated by decomposers on the residue particles. In contrast, this effect was much less pronounced or absent in legume residues (Vicia sativa L., and Pisum sativum L.), where the labeled N was sufficiently available to meet microbial needs throughout the incubation period. The low soil 15N recovery in oats treatments could also be attributed to the effects of quality and quantity of oat stubble on the intensity and direction of the priming effect, i.e., the change in the rate bulk SOC mineralization induced by the input of fresh organic residues. In this regard, studies by Liang et al. [66,67] have shown that CC residues with low soluble C fraction and high productivity, such as oat residues, are not associated with positive priming, meaning that the residue’s decomposers microorganisms would be more dependent on N fertilizer, which would lead to have higher soil 15N dilution.
Including CCs in both sites had significant practical implications: it improved maize’s 15NUE from N fertilizer, but specifically with berseem clover and mixture in Site 1 and with lupine in monoculture and mixture with oats in Site 2 (Table 7). The predecessor crop effect on soil microbial activity may explain the higher plant 15N recovery [66]. Although this effect was statistically not significant on residual 15N remaining in the soil, this variable had higher values in plots with CC compared with treatments without CCs (Table 8).
A negative correlation was observed between the C:N ratio of the CC residues and the weighted 15NRE crop (Figure 4), suggesting that NUE improves with higher residue quality. This negative relationship arises because, with a high C:N ratio—such as in the case of oats—microorganisms likely immobilize some of the 15N from the fertilizer to decompose the stubble, leading to lower recovery of the applied 15N [68,69]. The strong negative association between the C:N ratio of CC residues and the weighted 15NREcrop at Site 1 is intriguing, as one would expect a higher C:N ratio to increase reliance on fertilizer N due to limited N release from the stubble, resulting in higher 15NREcrop. The lower N availability at Site 1 could explain the higher relative total N uptake by corn grown after oats, the highest among the CCs (Table 7). Therefore, the weighted 15NREcrop reflects the impact of CCs (especially its N biomass content) on the fate of 15N more than apNREFert, which showed a positive association with the C:N ratio of the CC. At Site 1, where the predecessor crop had a significant effect, apNREFert was higher in corn grown after oats and lower after berseem clover, opposite to the 15NRE estimated by the isotopic method (Table 7). At Site 2, although the predecessor crop effect was not significant (Table 6), the highest apNREFert was found in corn grown on the mixture treatment, aligning with the 15NRE results estimated by the isotopic method (Table 7). This outcome at Site 2 highlights the potential benefits of using a mixed CC; the more favorable C:N ratio in this mixed culture positioned it as one of the best treatments, achieving the highest yield and NRE (Table 6 and Table 7). This success resulted from a more balanced proportion of species in the mixture, maximizing the advantages of each CC’s species growing in mixture cultures [49,70,71,72]. These results agree with those obtained by Moreno-Cadena et al. [72], who assessed the performance of cereal rye and crimson clover mixture under varying soil N levels and sampling times, comparing it to monocultures. That study showed that the mixture offered advantages in maximizing CC performance and ecosystem services under different soil N conditions and termination times. In our study, the highest weighted 15NREcrop was observed with berseem clover at Site 1 and with lupine grown in monoculture or in mixed culture at Site 2 (Supplementary Materials, Figure S2), which coincides with the highest grain yields achieved in the corresponding site under fertilized treatments (Table 6).
It is also important to note that both conventional and isotopic methods may have evaluation errors, mainly due to the so-called “priming effect” or “interaction with added N” [65,73,74]. This phenomenon is linked to changes in SOM mineralization and potential interactions between the N from the mineralization of native organic N in the soil and the N added as fertilizer or from residues. In addition, this phenomenon could explain the discrepancies between findings derived from conventional and isotopic data, such as the negative association between the C:N ratio of CC residues and the weighted 15NREcrop at Site 1 or the low plant and soil 15N recovery in plots with oats stubble as was mentioned above.
Of the factors evaluated, only the timing of 15N application significantly affected soil 15N recovery. The findings suggest that weeds likely absorbed a substantial amount of the N applied to maize at Site 1. On average, 84% and 75% of the applied N at sowing and V6 or V10 stages were unaccounted for at Site 1, compared to 42% and 25% at Site 2. The high N losses at Site 1 may also be attributed to pedoclimatic conditions, such as higher rainfall and poorer soil structure and natural fertility than at Site 2.

5. Conclusions

The study was set up in two distinct agroecological zones and conducted during two cropping seasons, which allowed us to examine the CC residual effect on maize production and NUE under different conditions. At Site 1, oats in monoculture produced more biomass than at Site 2, while the oats grown in L-O mixture with lupine were more productive at Site 2. The biomass yield and the biochemical composition of the CCs also varied the soil mineral N dynamics, influencing the NRE and corn yield. At Site 1, the highest apNREFert value was associated with oats, while in Site 2, this was with lupine in L-O mixture culture. Differences in residue quality, such as C:N ratio, also impacted the fertilizer’s N use efficiency. Overall, corn yield was related to both the quantity and quality of the CC biomass, with oats excelling in weed control, berseem clover in its N supply capacity, and the mixed CCs performing well at Site 2. This CC mixture would provide enhanced benefits by contributing C biomass to the formation of SOM and supplying N comparable to berseem clover but with a more remarkable ability to mitigate potential N losses due to the higher C:N ratio provided by oats in the L-O mixture culture.
The study concluded that at Site 1, which had medium- to low-fertility soils and above-average rainfall, the best grain yield, N use efficiency, and lowest risk of N losses were associated with maize cultivated on berseem clover without fertilization or oats fertilized, providing this last one CC with superior weed control. Corn performed best at Site 2, where soils were more fertile than at Site 1, and rainfall was below the historical average, having greater N use efficiency when grown over CCs of lupine grown in monoculture or mixture with oats, with the latter providing a more substantial contribution of C. Thus, the impact of the predecessor crop on corn was linked to the quantity and quality of the CC residual biomass, the inherent soil characteristics of each site, and environmental conditions during each experimental period.

Supplementary Materials

The following supporting information can be downloaded at: https://www.mdpi.com/article/10.3390/agriculture14122123/s1, Figure S1: Each experimental site’s soil moisture curves (0–15 cm depth) (Site 1 and 2). The filled circles (Site 1) and triangles (Site 2) correspond to the data used for model fitting (the nonlinear regression functions). At the same time, the unfilled symbols indicate the data used for model validation represented by the equation ψ = a θgb; Figure S2: The weighted N recovery efficiency of the maize (15NREcrop) according to site and predecessor cover crop. Different letters indicate significant differences between predecessor crops within each site at a p-level of <0.05; Figure S3: Soil 15N recovery at the four depth layers (0–5, 5–10, 10–15, and 15–30 cm) from N fertilizer applied (100 kg ha−1) at two 15N application timings (sowing and vegetative stages), and four predecessor crops and one control treatment (no CC) at Site 1 (panels a–e) and Site 2 (panels f–j); Table S1: Overview of activities in the experiments installed at Sites 1 and 2, organized into two phases: 1—Cover crop establishment and 2—Maize establishment (including conventional and isotopic experiments); Table S2: Treatments evaluated in the isotopic experiment; Table S3: Soil gravimetric moisture at 0–15 cm depth layer according to each sampling time and predecessor crop at Site 1 (2018–2019) and Site 2 (2019–2020). Values are replicate averages for each site–time–predecessor crop ± standard error; Table S4: Pearson correlation coefficients (r) within each experimental site (1 and 2) and 15N application timing (sowing and vegetative stage) between variables related to plant and soil 15N recovery and AG CC biomass.

Author Contributions

Conceptualization, C.M.A. and C.P.V.; methodology, C.M.A.; formal analysis, C.M.A. and C.P.V.; investigation, C.M.A.; resources, C.M.A.; data curation, C.M.A., C.P.V. and A.d.P.M.; writing—original draft preparation, C.M.A. and A.d.P.M.; writing—review and editing, C.M.A., C.P.V. and A.d.P.M.; visualization, C.M.A.; supervision, A.d.P.M.; project administration, C.M.A.; funding acquisition, C.M.A., C.P.V. and A.d.P.M. All authors have read and agreed to the published version of the manuscript.

Funding

This research was funded by the National Research and Innovation Agency of Uruguay, Funds: María Viñas, grant number FMV 135487; University of Republic of Uruguay Funds: Fellowship CAP grants; and the APC was funded by the National Research of our Institution, the University of the Republic (UdelaR, Uruguay).

Data Availability Statement

The data presented in this study are available upon request from the corresponding author.

Acknowledgments

The authors thank the farmers for allowing us to set up experiments and sample their fields. Leticia Martínez helped with soil characterization and classification of the soil. Lucas Sosa, Nicola Di Muro, Bruno Romano, Andrea Bentos Guimaraes, and Ana Elhordoy helped us with their assistance throughout the field experiments and laboratory work. We also thank Juan P. Viera for their technical support during the entire period of this investigation work (2018–2020), and Jorge Foderé (FADISOL S.A Uruguayan Company) for their field assistance and collaboration in materials used for experiments (fertilizers, herbicides, and seeds).

Conflicts of Interest

The authors declare no conflicts of interest.

References

  1. Arbeletche, P. Agribusiness in Uruguay: Evolution and Its Changeant Estrategies in the 20th Century. Rev. Iberoam. Vitic. Agroind. Rural. 2020, 7, 109–129. [Google Scholar] [CrossRef]
  2. Vassallo, M. Dinámica y Competencia Intrasectorial En La Agricultura Uruguaya: Los Cambios En La Última Década. Agrociencia Uruguay. 2013, 17, 170–179. [Google Scholar] [CrossRef]
  3. Ernst, O.R.; Dogliotti, S.; Cadenazzi, M.; Kemanian, A.R. Shifting Crop-Pasture Rotations to No-Till Annual Cropping Reduces Soil Quality and Wheat Yield. Field Crop. Res. 2018, 217, 180–187. [Google Scholar] [CrossRef]
  4. Rubio, V.; Quincke, A.; Ernst, O. Deep Tillage and Nitrogen Do Not Remediate Cumulative Soil Deterioration Effects of Continuous Cropping. Agron. J. 2021, 113, 5584–5596. [Google Scholar] [CrossRef]
  5. Pravia, M.V.; Kemanian, A.R.; Terra, J.A.; Shi, Y.; Macedo, I.; Goslee, S. Soil Carbon Saturation, Productivity, and Carbon and Nitrogen Cycling in Crop-Pasture Rotations. Agric. Syst. 2019, 171, 13–22. [Google Scholar] [CrossRef]
  6. Xie, H.; Huang, Y.; Chen, Q.; Zhang, Y.; Wu, Q. Prospects for Agricultural Sustainable Intensification: A Review of Research. Land 2019, 8, 157. [Google Scholar] [CrossRef]
  7. Rubio, V.; Núñez, A.; Berger, A.; van Es, H. Biomass Inputs Drive Agronomic Management Impacts on Soil Health. Agric. Ecosyst. Environ. 2024, 378, 109316. [Google Scholar] [CrossRef]
  8. Mazzilli, S.R.; Ernst, O.R. Rapeseed-to-Wheat Yield Ratio in Different Production Environments and Effects on Subsequent Summer Crops Yields. Agrosyst. Geosci. Environ. 2019, 2, 1–7. [Google Scholar] [CrossRef]
  9. Rossini, G.F.I. Soil and Subsoil Conservation from an Environmental Perspective. Rev. Derecho 2022, 21, 41–52. [Google Scholar] [CrossRef]
  10. Mazzilli, S.R.; Kemanian, A.R.; Ernst, O.R.; Jackson, R.B.; Piñeiro, G. Greater Humification of Belowground than Aboveground Biomass Carbon into Particulate Soil Organic Matter in No-Till Corn and Soybean Crops. Soil Biol. Biochem. 2015, 85, 22–30. [Google Scholar] [CrossRef]
  11. Ernst, O. Efecto De Una Leguminosa Invernal Como Cultivo de Cobertura Sobre Rendimiento En Grano y Respuesta a Nitrógeno DE Maíz Sembrado Sin Laboreo. Agrociencia Uruguay. 2006, 10, 25–35. [Google Scholar] [CrossRef]
  12. Constantin, J.; Mary, B.; Laurent, F.; Aubrion, G.; Fontaine, A.; Kerveillant, P.; Beaudoin, N. Effects of Catch Crops, No Till and Reduced Nitrogen Fertilization on Nitrogen Leaching and Balance in Three Long-Term Experiments. Agric. Ecosyst. Environ. 2010, 135, 268–278. [Google Scholar] [CrossRef]
  13. Prieto, G.S.; Ernst, O. Effect of Legume or Grass Cover Crops and Nitrogen Application Rate on Soil Properties and Corn Productivity. Agrociencia Uruguay. 2012, 16, 294–301. [Google Scholar] [CrossRef]
  14. Kaye, J.P.; Quemada, M. Using Cover Crops to Mitigate and Adapt to Climate Change. A Review. Agron. Sustain. Dev. 2017, 37, 4. [Google Scholar] [CrossRef]
  15. Iqbal, A.; Aslam, S.; Alavoine, G.; Benoit, P.; Garnier, P.; Recous, S. Rain Regime and Soil Type Affect the C and N Dynamics in Soil Columns that are Covered with Mixed-Species Mulches. Plant Soil 2015, 393, 319–334. [Google Scholar] [CrossRef]
  16. Meisinger, J.J.; Randall, G.W. Estimating Nitrogen Budgets for Soil-Crop Systems. Manag. Nitrogen Groundw. Qual. Farm Profitab. 2015, 1, 85–124. [Google Scholar] [CrossRef]
  17. Moukanni, N.; Brewer, K.M.; Gaudin, A.C.M.; O’Geen, A.T. Optimizing Carbon Sequestration Through Cover Cropping in Mediterranean Agroecosystems: Synthesis of Mechanisms and Implications for Management. Front. Agron. 2022, 4, 844166. [Google Scholar] [CrossRef]
  18. Abdalla, M.; Hastings, A.; Cheng, K.; Yue, Q.; Chadwick, D.; Espenberg, M.; Truu, J.; Rees, R.M.; Smith, P. A Critical Review of the Impacts of Cover Crops on Nitrogen Leaching, Net Greenhouse Gas Balance and Crop Productivity. Glob. Chang. Biol. 2019, 25, 2530–2543. [Google Scholar] [CrossRef]
  19. Zhang, Z.; Wang, J.; Huang, W.; Chen, J.; Wu, F.; Jia, Y.; Han, Y.; Wang, G.; Feng, L.; Li, X.; et al. Cover Crops and N Fertilization Affect Soil Ammonia Volatilization and N2O Emission by Regulating the Soil Labile Carbon and Nitrogen Fractions. Agric. Ecosyst. Environ. 2022, 340, 108188. [Google Scholar] [CrossRef]
  20. Johnson, F.E.; Roth, R.T.; Ruffatti, M.D.; Armstrong, S.D. Cover Crop Impacts on Nitrogen Losses and Environmental Damage Cost. Agric. Ecosyst. Environ. 2024, 363, 108859. [Google Scholar] [CrossRef]
  21. Oberson, A.; Jarosch, K.A.; Frossard, E.; Hammelehle, A.; Fliessbach, A.; Mäder, P.; Mayer, J. Higher than Expected: Nitrogen Flows, Budgets, and Use Efficiencies Over 35 Years of Organic and Conventional Cropping. Agric. Ecosyst. Environ. 2024, 362, 108802. [Google Scholar] [CrossRef]
  22. Landriscini, M.R.; Galantini, J.A.; Martínez, J.M. Eficiencia de Recuperación de Nitrógeno Por Los Métodos de la Diferencia y de la Dilución Isotópica. Cienc. Suelo 2016, 34, 155–162. [Google Scholar]
  23. Ovalle, C.; del Pozo, A.; Peoples, M.B.; Lavín, A. Estimating the Contribution of Nitrogen From Legume Cover Crops to the Nitrogen Nutrition of Grapevines Using a 15N Dilution Technique. Plant Soil 2010, 334, 247–259. [Google Scholar] [CrossRef]
  24. Espinoza, S.; Ovalle, C.; Zagal, E.; Matus, I.; Tay, J.; Peoples, M.B.; Del Pozo, A. Contribution of Legumes to Wheat Productivity in Mediterranean Environments of Central Chile. Field Crop. Res. 2012, 133, 150–159. [Google Scholar] [CrossRef]
  25. Wang, J.; Sainju, U.M.; Zhang, S. A Mixture of Summer Legume and Nonlegume Cover Crops Enhances Winter Wheat Yield, Nitrogen Uptake, and Nitrogen Balance. Nitrogen 2024, 5, 871–890. [Google Scholar] [CrossRef]
  26. Sawchik, J.; Pérez-Bidegain, M.; García, C. Impact of Winter Cover Crops on Soil Properties Under Soybean Cropping Systems. Agrociencia Urug. 2012, 16, 288–293. [Google Scholar] [CrossRef]
  27. Sawchik, J.; Siri, G.; Ayala, W.; Barrios, E.; Bustamante, M.; Ceriani, M.; Gutierrez, F.; Mosqueira, J.; Otaño, C.; Perez, M.; et al. El Sistema Agrícola Bajo Amenaza: ¿Qué Aportanlos Cultivos de Cobertura y/o Laspasturas Cortas? IV Simp. Nac. Agric. 2015, 4, 149–168. [Google Scholar]
  28. Alvarez, S.; Ernst, O. Impact of Cropping Systems on Soil Quality. Eur. J. Agron. 2024, 158, 127197. [Google Scholar] [CrossRef]
  29. Durán, A.; Califra, A.; Molfino, J.H.; Lynn, W. Keys to Soil Taxonomy for Uruguay; USDA, Natural Resources Conservation Service (NRCS): Washington, DC, USA, 2006; p. 77.
  30. Durán, A.; Fernando, G.P. Suelos Del Uruguay, Origen, Clasificación, Manejo Y Conservación; Southern Hemisphere: Montevideo, Uruguay, 2007; Volume 2, ISBN 978-9974-674-02-8. [Google Scholar]
  31. Assefa, Y.; Carter, P.; Hinds, M.; Bhalla, G.; Schon, R.; Jeschke, M.; Paszkiewicz, S.; Smith, S.; Ciampitti, I.A. Analysis of Long Term Study Indicates Both Agronomic Optimal Plant Density and Increase Maize Yield per Plant Contributed to Yield Gain. Sci. Rep. 2018, 8, 1–11. [Google Scholar] [CrossRef]
  32. Ritchie, S.W.; Hanway, J.J. How a Corn Plant Develops; Iowa State University of Science and Technology: Ames, IA, USA, 1993; pp. 1–25. [Google Scholar]
  33. IAEA. Use of Nuclear Techniques in Studies of Soil-Plant Relationships. Training Course Series No 2; Hardarson, G., Ed.; International Atomic Energy Agency: Vienna, Austria, 1990; p. 223. [Google Scholar]
  34. Rayment, G.E.; Lyons, D.J. Soil Chemical Methods; CSIRO Publishing: Clayton, Australia, 2011; ISBN 978-0-643-06768-4. [Google Scholar]
  35. Nelson, D.W.; Sommers, L.E. Total Carbon, Organic Carbon, and Organic Matter. In Methods of Soil Analysis; Sparks, D.L., Page, A.L., Helmke, P.A., Loeppert, R.H., Soltanpour, P.N., Tabatabai, M.A., Johnston, C.T., Sumner, M.E., Eds.; SSSA: Madison, WI, USA, 1996. [Google Scholar]
  36. Thomas, G.W. Exchangeable Cations. In Methods of Soil Analysis; Page, A., Ed.; SSSA: Madison, WI, USA, 1983; pp. 159–165. [Google Scholar]
  37. Lajtha, K.; Driscoll, C.T.; Jarrell, W.M.; Elliott, E.T. Soil phosphorus: Characterization and total element analysis. In Standard Soil Methods for Long Term Ecological Research; Robertson, G.P., Coleman, D.C., Bledsoe, C.S., Sollins, P., Eds.; Oxford University Press: Oxford, UK, 1999; pp. 115–143. ISBN 0-19-512083-3. [Google Scholar]
  38. Mulvaney, R.L. Nitrogen-Inorganic Forms. In Methods of Soil Analysis, Part 3: Chemical Methods; Wiley: New Jersey, NJ, USA, 2018; pp. 1123–1184. ISBN 9780891188667. [Google Scholar]
  39. Rhine, E.D.; Mulvaney, R.L.; Pratt, E.J.; Sims, G.K. Improving the Berthelot Reaction for Determining Ammonium in Soil Extracts and Water. Soil Sci. Soc. Am. J. 1998, 62, 473–480. [Google Scholar] [CrossRef]
  40. Gee, G.W.; Bauder, J.W. Particle Size Analysis by Hydrometer: A Simplified Method for Routine Textural Analysis and a Sensitivity Test of Measurement Parameters. Soil Sci. Soc. Am. J. 1979, 43, 1004–1007. [Google Scholar] [CrossRef]
  41. Van Cleemput, O.; Zapata, F.; Vanlauwe, B. Guidelines on Nitrogen Management in Agricultural Systems. In Guidelines on Nitrogen Management in Agricultural System; Soil Science Unit: Seibersdorf, Austria, 2008; pp. 19–125. [Google Scholar]
  42. Tamagno, S.; Eagle, A.J.; McLellan, E.L.; van Kessel, C.; Linquist, B.A.; Ladha, J.K.; Pittelkow, C.M. Quantifying N leaching losses as a function of N balance: A Path to Sustainable Food Supply Chains. Agric. Ecosyst. Environ. 2022, 324, 107714. [Google Scholar] [CrossRef]
  43. Shearer, G.; Kohl, D.H. N2-Fixation in Field Settings: Estimations Based on Natural 15N Abundance. Aust. J. Plant Physiol. 1987, 13, 699–756. [Google Scholar] [CrossRef]
  44. Hardarson, G.; Danso, S.K.A. Methods for Measuring Biological Nitrogen Fixation in Grain Legumes. Plant Soil 1993, 152, 19–23. [Google Scholar] [CrossRef]
  45. Giménez, L. Producción de Maíz Con Estrés Hídrico Provocado En Diferentes Etapas de Desarrollo. Agrociencia 2012, 16, 92–102. [Google Scholar] [CrossRef]
  46. Soares, M.; Rousk, J. Microbial Growth and Carbon Use Efficiency in Soil: Links to Fungal-Bacterial Dominance, SOC-Quality and Stoichiometry. Soil Biol. Biochem. 2019, 131, 195–205. [Google Scholar] [CrossRef]
  47. Cabrera, M.L.; Kissel, D.E.; Vigil, M.F. Nitrogen Mineralization from Organic Residues. J. Environ. Qual. 2005, 34, 75–79. [Google Scholar] [CrossRef]
  48. Chaves, B.; Redin, M.; Giacomini, S.J.; Schmatz, R.; Léonard, J.; Ferchaud, F.; Recous, S. The Combination of Residue Quality, Residue Placement AND Soil Mineral N Content Drives C and N Dynamics by Modifying N Availability to Microbial Decomposers. Soil Biol. Biochem. 2021, 163, 108434. [Google Scholar] [CrossRef]
  49. Finney, D.M.; White, C.M.; Kaye, J.P. Biomass Production and Carbon/Nitrogen Ratio Influence Ecosystem Services from Cover Crop Mixtures. Agron. J. 2016, 108, 39–52. [Google Scholar] [CrossRef]
  50. Sun, L.; Xia, Z.; Sang, C.; Wang, X.; Peng, B.; Wang, C.; Zhang, J.; Müller, C.; Bai, E. Soil Resource Status Affects the Responses of Nitrogen Processes to Changes in Temperature and Moisture. Biol. Fertil. Soils 2019, 55, 629–641. [Google Scholar] [CrossRef]
  51. Çakir, R. Effect of Water Stress at Different Development Stages on Vegetative and Reproductive Growth of Corn. Field Crop. Res. 2004, 89, 1–16. [Google Scholar] [CrossRef]
  52. Liu, Q.; Luo, L.; Zheng, L. Lignins: Biosynthesis and Biological Functions in Plants. Int. J. Mol. Sci. 2018, 19, 335. [Google Scholar] [CrossRef] [PubMed]
  53. Kong, L.; Sun, M.; Wang, F.; Liu, J.; Feng, B.; Si, J.; Zhang, B.; Li, S.; Li, H. Effects of High Nh+4 on k+ Uptake, Culm Mechanical Strength and Grain Filling IN Wheat. Front. Plant Sci. 2014, 5, 703. [Google Scholar] [CrossRef] [PubMed]
  54. Dann, C.E.; Cabrera, M.L.; Thapa, R.; Mirsky, S.; Tully, K.; Reberg-Horton, C.; Hitchcock, R.; Morari, F. Modeling Water Potential of Cover Crop Residues on the Soil Surface. Ecol. Model. 2021, 459, 109708. [Google Scholar] [CrossRef]
  55. Guinet, M.; Nicolardot, B.; Revellin, C.; Durey, V.; Carlsson, G.; Voisin, A.S. Comparative Effect of Inorganic N on Plant Growth and N2 Fixation of Ten Legume Crops: Towards a Better Understanding of the Differential Response Among Species. Plant Soil 2018, 432, 207–227. [Google Scholar] [CrossRef]
  56. Schipanski, M.E.; Drinkwater, L.E. Nitrogen Fixation in Annual and Perennial Legume-Grass Mixtures Across a Fertility Gradient. Plant Soil 2012, 357, 147–159. [Google Scholar] [CrossRef]
  57. Evans, J.; O’Connor, G.E.; Turner, G.L.; Bergersen, F.J. Influence of Mineral Nitrogen on Nitrogen Fixation by Lupin (Lupinus angustifolius) as Assessed by 15N Isotope Dilution Methods. Field Crop. Res. 1987, 17, 109–120. [Google Scholar] [CrossRef]
  58. Liu, Y.; Wu, L.; Baddeley, J.A.; Watson, C.A. Models of Biological Nitrogen Fixation of Legumes. Sustain. Agric. 2009, 2, 883–905. [Google Scholar] [CrossRef]
  59. Williams, A.; Wells, M.S.; Dickey, D.A.; Hu, S.; Maul, J.; Raskin, D.T.; Reberg-Horton, S.C.; Mirsky, S.B. Establishing the Relationship of Soil Nitrogen Immobilization to Cereal Rye Residues in a Mulched System. Plant Soil 2018, 426, 95–107. [Google Scholar] [CrossRef]
  60. Koudahe, K.; Allen, S.C.; Djaman, K. Critical Review of the Impact of Cover Crops on Soil Properties. Int. Soil Water Conserv. Res. 2022, 10, 343–354. [Google Scholar] [CrossRef]
  61. Perdomo, C.; Cardellino, G. Respuesta de Maíz a Fertilizaciones Definidas con Diferentes Criterios de Recomendación. Agrociencia 2006, 10, 63–79. [Google Scholar] [CrossRef]
  62. De Oliveira, S.M.; De Almeida, R.E.M.; Ciampitti, I.A.; Junior, C.P.; Lago, B.C.; Trivelin, P.C.O.; Favarin, J.L. Understanding N Timing in Corn Yield and Fertilizer N Recovery: An Insight from an Isotopic Labeled-N Determination. PLoS ONE 2018, 13, e0192776. [Google Scholar] [CrossRef] [PubMed]
  63. Alvarez, R.; Steinbach, H.S.; De Paepe, J.L. Cover Crop Effects on Soils and Subsequent Crops in the Pampas: A Meta-Analysis. Soil Tillage Res. 2017, 170, 53–65. [Google Scholar] [CrossRef]
  64. Fillery, I.R.P.; Recous, S. Use of Enriched 15N Sources to Study Soil N Transformations. Curr. Plant Sci. Biotechnol. Agric. 2001, 9, 167–194. [Google Scholar] [CrossRef]
  65. Schmatz, R.; Recous, S.; Aita, C.; Tahir, M.M.; Schu, A.L.; Chaves, B.; Giacomini, S.J. Crop Residue Quality and Soil Type Influence the Priming Effect but Not the Fate of Crop Residue C. Plant Soil 2017, 414, 229–245. [Google Scholar] [CrossRef]
  66. Liang, X.; Yuan, J.; Yang, E.; Meng, J. Responses of Soil Organic Carbon Decomposition and Microbial Community to the Addition of Plant Residues with Different C:N Ratio. Eur. J. Soil Biol. 2017, 82, 50–55. [Google Scholar] [CrossRef]
  67. Liang, Z.; Rasmussen, J.; Poeplau, C.; Elsgaard, L. Priming Effects Decrease with the Quantity of Cover Crop Residues-Potential Implications for Soil Carbon Sequestration. Soil Biol. Biochem. 2023, 184, 109110. [Google Scholar] [CrossRef]
  68. Baijukya, F.P.; De Ridder, N.; Giller, K.E. Nitrogen Release from Decomposing Residues of Leguminous Cover Crops and Their Effect on Maize Yield on Depleted Soils of Bukoba District, Tanzania. Plant Soil 2006, 279, 77–93. [Google Scholar] [CrossRef]
  69. Asagi, N.; Ueno, H. Nitrogen Dynamics in Paddy Soil Applied with Various 15N-labelled Green Manures. Plant Soil 2009, 322, 251–262. [Google Scholar] [CrossRef]
  70. Dabney, S.M.; Delgado, J.A.; Collins, F.; Meisinger, J.J.; Schomberg, H.H.; Liebig, M.A.; Kaspar, T.; Mitchell, J. Using Cover Crops and Cropping Systems for Nitrogen Management. In Advances in Nitrogen Management; Soil and Water Conservation Society: Ankeny, SW, USA, 2010; pp. 230–281. [Google Scholar]
  71. Chapagain, T.; Lee, E.A.; Raizada, M.N. The Potential of Multi-Species Mixtures to Diversify Cover Crop Benefits. Sustainability 2020, 12, 2058. [Google Scholar] [CrossRef]
  72. Moreno-Cadena, P.; Salmeron, M.; Canisares, L.P.; Poffenbarger, H.J. Productivity Benefits of Cereal-Legume Cover Crop Mixtures Under Variable Soil Nitrogen and Termination Times. Eur. J. Agron. 2024, 155, 127114. [Google Scholar] [CrossRef]
  73. Jenkinson, D.S.; Fox, R.H.; Rayner, J.H. Interactions Between Fertilizer Nitrogen and Soil Nitrogen—The so-Called ‘Priming’ Effect. J. Soil Sci. 1985, 36, 425–444. [Google Scholar] [CrossRef]
  74. Kuzyakov, Y.; Friedel, J.K.; Stahr, K. Review of Mechanisms and Quantification of Priming Effects. Soil Biol. Biochem. 2000, 32, 1485–1498. [Google Scholar] [CrossRef]
Figure 1. Monthly average temperature and rainfall in 2018–2019 (Site 1) and 2019/2020 (Site 2) and the historical average (30 years including the experimental period) temperature and rainfall.
Agriculture 14 02123 g001
Figure 2. Soil mineral nitrogen concentration (Ammonium-N + Nitrate-N) by preceding crop in 0 N treatments at two soil depths and sites, during fallow and early corn growth stages (sowing to V6). The vertical bars indicate the standard error.
Agriculture 14 02123 g002
Figure 3. Relationship between the apparent N recovery efficiency derived from cover crops (apNRECC) and fertilizer (apNREFert) at each experimental site.
Agriculture 14 02123 g003
Figure 4. Relationship between the weighted N recovery efficiency of the corn crop (15NREcrop) and the C:N ratio of cover crops at each experimental site.
Agriculture 14 02123 g004
Table 1. Chemical characterization of the soils (at 0–20 cm soil depth) at each experimental site (Site 1—season 2018–2019 and Site 2—season 2019–2020).
SiteP Bray N°1CaMgKNapH
mg kg−1cmolckg−1
118.05.91.90.50.44.7
29.216.04.71.00.25.6
Table 2. Total organic C and N content in the soil and texture in 0–7 and 7–15 cm soil depth layers at each experimental site (Site 1—season 2018–2019 and Site 2—season 2019–2020).
Site Soil DepthTOCTNSandClaySiltTexture
cm%
10–73.00.38.335.556.1Silty clay loam
17–151.70.27.638.853.6Silty clay loam
20–73.30.38.853.637.6Clayey
27–152.20.28.055.037.0Clayey
Table 3. Initial chemical composition of the predecessor crop from Site 1 (cropping season 2018–2019) and Site 2 (cropping season 2019–2020). Values are replicate averages for each site–predecessor crop.
SitePredecessor CropAG BiomassCNC:NCARBCELLLIGBNFAG N Yield AG N Yield Fixed
kg ha−1% % of Total C%kg ha−1
1Berseem clover2444.442.23.014.254.538.96.682.872.964.1
Lupine4674.542.02.417.959.634.26.280.8110.060.1
L-O mixtureL+O3253.044.31.140.249.845.15.180.435.81.4
Oat4849.940.41.040.631.461.76.9n.c48.3n.c
2Berseem clover2183.840.52.715.255.837.56.779.359.847.4
Lupine1134.241.02.516.458.333.58.276.328.421.6
L-O mixtureL+O3619.741.21.828.244.448.96.793.865.113.5
Oat2621.441.91.040.235.856.47.8n.c27.4n.c
AG, aboveground; C, carbon; N, nitrogen; CARB, soluble carbohydrates; CELL, cellulose + hemicellulose; LIG, lignin; BNF, biological nitrogen fixation. n.c: means not corresponding.
Table 4. Soil nitrate, ammonium, and mineral N concentration in the soil (at 0–20 cm soil depth) at corn sowing according to predecessor crop at Site 1 (cropping season 2018–2019) and Site 2 (cropping season 2019–2020). Values are replicate averages for each site–predecessor crop ± standard error.
SitePredecessor CropNO3-NNH4-NMineral N
mg kg−1
1Berseem clover14.2 ± 1.5 a5.1 ± 0.419.3 ± 1.9 ab
Oat6.3 ± 1.0 b7.9 ± 0.314.2 ± 1.0 c
Lupine14.8 ± 0.9 a7.4 ± 1.222.2 ± 1.9 a
L-O mixture8.3 ± 0.1 b5.8 ± 0.614.1 ± 0.6 c
No CC (Control)7.9 ± 0.6 b8.1 ± 0.916.1 ± 1.4 bc
Significance of treatment effectp-value
Predecessor crop 0.0006n.s0.0187
2Berseem clover8.5 ± 1.26.9 ± 0.115.4 ± 1.3
Oat8.2 ± 0.97.4 ± 1.115.6 ± 1.8
Lupine9.4 ± 0.57.6 ± 0.517.0 ± 0.7
L-O mixture8.7 ± 0.88.9 ± 1.517.6 ± 2.3
No CC (Control)11.6 ± 0.27.4 ± 0.019.0 ± 0.2
Significance of treatment effect p-value
Predecessor crop n.sn.sn.s
Different letters within a column indicate differences between the predecessor crop within each site, being significant at a p-level of 0.05; n.s: means no significant difference.
Table 5. Soil nitrate, ammonium, and mineral N concentration (at 0–20 cm soil depth) in the stages between six leaves (Site 1) and ten leaves (Site 2) according to the N rate and predecessor crop at Site 1 (cropping season 2018–2019) and Site 2 (cropping season 2019–2020). Values are replicate averages for each site–N rate–predecessor crop ± standard error.
SiteN RatePredecessor CropNO3-N NH4-NMineral N
mg kg−1
10Berseem clover10.3 ± 0.79.1 ± 1.419.5 ± 2.0
Oat8.6 ± 0.79.7 ± 0.718.3 ± 0.5
Lupine8.5 ± 3.09.7 ± 0.718.3 ± 3.2
L-O mixture9.0 ± 2.09.7 ± 2.318.6 ± 0.7
No CC (control)7.3 ± 0.59.6 ± 1.416.9 ± 1.1
100Berseem clover12.6 ± 3.58.4 ± 0.620.9 ± 3.1
Oat11.9 ± 2.58.8 ± 0.620.8 ± 2.4
Lupine12.6 ± 1.98.3 ± 0.620.9 ± 2.4
L-O mixture7.9 ± 1.38.6 ± 0.116.5 ± 1.2
No CC (control)10.2 ± 0.38.4 ± 0.318.6 ± 0.2
Significance of treatment effectp-value
Nraten.sn.sn.s
Predecessor cropn.sn.sn.s
Nrate× Predecessor cropn.sn.sn.s
20Berseem clover4.4 ± 0.9 abB8.8 ± 1.013.2 ± 1.6 B
Oat2.6 ± 0.6 b9.5 ± 1.012.1 ± 1.0 A
Lupine4.4 ± 1 abB9.5 ± 0.613.8 ± 1.5 B
L-O mixture3.2 ± 0.7 b8.1 ± 1.011.2 ± 0.6
No CC (control)6.5 ± 2.0 a8.7 ± 1.015.3 ± 1.3
100Berseem clover11.6 ± 2.1 aA10.7 ± 1.522.3 ± 2.3 aA
Oat1.9 ± 0.5 c7.5 ± 0.69.4 ± 0.6 cB
Lupine11.0 ± 0.7 aA10.3 ± 2.221.3 ± 1.8 aA
L-O mixture3.9 ± 0.7 bc7.6 ± 0.811.5 ± 0.1 bc
No CC (control)8.4 ± 1.8 b6.8 ± 0.215.2 ± 2.0 b
Significance of treatment effectp-value
Nrate<0.0001n.s0.0002
Predecessor crop0.0036n.s0.0113
Nrate× Predecessor crop0.0014n.s<0.0011
Different lowercase letters within a column indicate differences between predecessor crops within each site and each N rate, and different capital letters within a column indicate differences between N rates within each site and predecessor crop, being significant at a p-level of 0.05; n.s: means no significant difference.
Table 6. Grain yield, grain N concentration, grain N content, plant N content, and relative N response in plant N content by the maize crop, according to predecessor crop, and N rate at Site 1 (cropping season 2018–2019) and Site 2 (cropping season 2019–2020) (Site 1—season 2018–2019 and Site 2—season 2019–2020). Values are replicate averages for each site–predecessor crop ± standard error.
SiteN RatePredecessor CropGrain YieldGrain N ConcentrationGrain N ContentWhole Plant N Content Relative N Response in Whole Plant N Content (Rs)
kg ha−1g kg−1 Dry Weightkg ha−1
10Berseem clover6439 ± 526 a10.3 ± 0.965.3 ± 1.1 a99.9 ± 8.2 a
Oat2785 ± 232 cB9.9 ± 0.327.5 ± 2.3 cB53.9 ± 3.6 bB
Lupine2437 ± 846 cB9.4 ± 0.623.8 ± 9.5 cB62.2 ± 14.0 bB
Mixture3744 ± 135 bc9.4 ± 0.635.9 ± 2.1 bc66.9 ± 3.8 bB
No CC (control)5542 ± 546 ab9.4 ± 0.552.5 ± 7.4 ab82.4 ± 13.7 abB
100Berseem clover5582 ±762 ab10.5 ± 0.258.3 ± 7.6 ab93.6 ± 11.4−0.08 ± 0.0 b
Oat5870 ±558 abA10.4 ± 0.761.4 ± 8.9 abA96.9 ± 13.1 A0.43 ± 0.1 a
Lupine4882 ± 629 bA10.4 ± 1.249.9 ± 7.2 bA82.7 ± 8.5 A0.26 ± 0.1 a
Mixture5124 ± 374 ab9.6 ± 0.549.2 ± 5.0 b80.4 ± 10.3 A0.25 ± 0.0 a
No CC (control)7148 ± 1040 a10.2 ± 0.573.8 ± 13.7 a101.2 ± 14.0 A0.19 ± 0.0 a
Significance of treatment effectp-value
Nrate0.0017n.s0.00280.0004
Predecessor crop0.0313n.s0.0399n.s.0.0197
Nrate× Predecessor crop0.0457n.sn.s0.0197
20Berseem clover7267 ±67611.3 ± 0.9 B81.3 ± 4.2 B149.3 ± 12.5 B
Oat6574 ± 405 B10.3 ± 1.0 B68.0 ± 9.9 B124.6 ± 11.7 B
Lupine7866 ± 745 B10.2 ± 0.3 B80.1 ± 6.8 B131.1 ± 7.1 B
Mixture8056 ± 977 10.4 ± 0.2 B84.2 ± 11.2 B125.8 ± 16.2 B
No CC (control)7121 ± 570 11.7 ± 0.5 B82.7 ± 3.8 B136.7 ± 10.4 B
100Berseem clover8707 ± 127516.3 ± 2.2 A136.9 ± 8.6 A214.3 ± 12.4 A0.30 ± 0.1
Oat8969 ± 815 A13.8 ± 0.4 A122.6 ± 8.2 A181.9 ± 18.0 A0.30 ± 0.1
Lupine10,116 ± 952 A13.8 ± 1.3 A140.7 ± 24.4 A203.1 ± 29.7 A0.26 ± 0.1
Mixture9583 ± 663 13.6 ± 0.3 A129.8 ± 7.1 A197.1 ± 11.0 A0.32 ± 0.1
No CC (control)7999 ± 610 15.0 ± 1.0 A120.6 ± 10.0 A186.1 ± 6.4 A0.37 ± 0.1
Significance of treatment effectp-value
Nrate0.0022<0.0001<0.0001<0.0001
Predecessor cropn.sn.sn.sn.sn.s
Nrate× Predecessor cropn.sn.sn.sn.s
Different lowercase letters within a column indicate differences between predecessor crops within each site and each N rate, and different capital letters within a column indicate differences between N rates within each site and predecessor crop, being significant at a p-level of 0.05; n.s: means no significant difference. Whole plant N content: grain N content + N content in the aboveground remanent biomass.
Table 7. Plant 15N recovery (en % y kg ha−1) from N fertilizer applied (100 kg ha−1) at two 15N application timings (sowing and vegetative stages), and four predecessor crop and one control treatment (No CC) at Site 1 (cropping season 2018–2019) and Site 2 (cropping season 2019–2020). Values are replicate averages for each site–N rate–predecessor crop ± standard error.
Site15N Application TimingPredecessor Crop15NREcropNdff GrainNdff GrainNdff Stubble Nddf Stubble
(%)kg ha−1%kg ha−1
1SowingBerseem clover7.4 ± 2.6 B2.3 ± 0.4 B1.4 ± 0.5 B1.2 ± 0.2 B0.4 ± 0.1 B
Oat3.9 ± 10.8 ± 0.20.7 ± 0.20.5 ± 0.1 B0.2 ± 0.1 B
Lupine7.2 ± 2.02.4 ± 0.5 B1.1 ± 0.3 B1.5 ± 0.30.6 ± 0.2 B
L-O mixture3.1 ± 0.1 B1.1 ± 0.1 B0.6 ± 0.1 B0.6 ± 0.0 B0.2 ± 0.0 B
No CC (control)7.3 ± 0.82.2 ± 0.21.5 ± 0.3 B0.9 ± 0.20.3 ± 0.0
V6 stageBerseem clover17.5 ± 2.0 aA12.3 ± 3.0 aA6.2 ± 0.7 aA6.7 ± 1.8 A2.0 ± 0.4 A
Oat7.0 ± 2.1 c4.6 ± 1.5 c2.8 ± 1.0 b6.7 ± 1.8 A1.9 ± 0.2 A
Lupine11.4 ± 2.4 bc9.2 ± 2.5 abA4.2 ± 1.1 bA4.3 ± 1.11.5 ± 0.3 A
L-O mixture12.6 ± 2.2 abA9.9 ± 2.6 abA4.5 ± 0.8 abA5.0 ± 1.3 A1.5 ± 0.5 A
No CC (control)8.9 ± 1.2 c5.4 ± 1.2 bc4.0 ± 0.9 bA3.0 ± 0.60.9 ± 0.1
Significance of treatment effectp-value
15N application timing0.00160.0001<0.00010.0001<0.0001
Predecessor crop0.0201n.sn.sn.sn.s
15N appl. timing × Predecessor cropn.sn.sn.sn.sn.s
2SowingBerseem clover34.4 ± 1.7 a8.6 ± 0.6 B7.4 ± 1.3 aB8.8 ± 1.04.0 ± 0.8
Oat19.6 ± 2.5 bB5.0 ± 0.2 B3.6 ± 0.5 bB8.5 ± 1.12.7 ± 0.4
Lupine21.4 ± 0.9 bB5.1 ± 0.4 B4.8 ± 0.2 bB6.5 ± 0.1 B2.3 ± 0.1 B
L-O mixture22.8 ± 3.7 bB6.2 ± 0.7 B5.0 ± 0.9 bB7.9 ± 0.8 B2.5 ± 0.4 B
No CC (control)30.7 ± 4.4 aB7.6 ± 1.6 B6.0 ± 1.1 abB10.5 ± 0.64.1 ± 0.5
V10 stageBerseem clover32.4 ± 2.0 b19.2 ± 3.5 cA16.2 ± 1.3 bA11.6 ± 2.2 b5.2 ± 1.1 ab
Oat30.4 ± 2.5 bA21.5 ± 4.1 bcA16.2 ± 1.8 bA11.7 ± 1.6 b3.9 ± 0.5 b
Lupine50.9 ± 3.0 aA25.6 ± 2.4 abA28.0 ± 2.1 aA14.5 ± 1.7 abA5.6 ± 0.7 abA
L-O mixture48.0 ± 2.3 aA30.9 ± 0.8 aA25.4 ± 0.8 aA18.3 ± 1.5 aA6.3 ± 0.9 aA
No CC (control)37.2 ± 1.4 bA24.3 ± 0.1 bcA19.4 ± 0.3 bA14.3 ± 1.3 ªb5.2 ± 0.9 ab
Significance of treatment effectp-value
15N application timing<0.0001<0.0001<0.0001<0.0001<0.0001
Predecessor crop0.0444n.s0.0009n.sn.s
15N appl. timing × Predecessor crop<0.00010.02840.00020.00910.0214
Different lowercase letters within a column indicate differences between predecessor crops within each site and each 15N application timing, and different capital letters within a column indicate differences between 15N application timing within each site and each predecessor crop being significant at a level p < 0.05. n.s: not significant. %Ndff stubble was estimated as the weighted sum of the N absorbed and the %at.exc. 15N for each plant component (stem + leaves + cob).
Table 8. Soil 15N recovery (en % y Kgha−1) at 0–30 cm and en 0–5 cm depth layer, and unaccounted-for N from N fertilizer applied (100 kg ha−1) at two 15N application timings (sowing and vegetative stages) and four predecessor crops and one control treatment (no CC) at Site 1 (cropping season 2018–2019) and Site 2 (cropping season 2019–2020). Values are replicate averages for each site–N rate–predecessor crop ± standard error.
Site15N Application TimingPredecessor CropNdff-0–30 cm
Soil Depth
Ndff-0–5 cm
Soil Depth
Unaccounted-for N
kg ha−1
1SowingBerseem clover2.9 ± 0.3 B1.2 ± 0.127.6 ± 1.0 B
Oat3.0 ± 0.31.4 ± 0.228.7 ± 0.4 B
Lupine4.2 ± 1.12.5 ± 0.926.4 ± 0.4 B
L-O mixture3.2 ± 0.2 B1.5 ± 0.2 B28.8 ± 0.2 B
No CC (control)2.9 ± 0.2 B1.5 ± 0.227.7 ± 0.1 B
V6 stageBerseem clover9.7 ± 2.8 A5.3 ± 1.844.8 ± 4.1 A
Oat6.2 ± 0.52.4 ± 0.255.2 ± 1.7 A
Lupine8.2 ± 1.25.3 ± 1.450.3 ± 1.7 A
L-O mixture11.1 ± 4.4 A6.6 ± 3.7 A46.6 ± 5.7 A
No CC (control)9.7 ± 3.1 A5.8 ± 3.050.4 ± 2.9 A
Significance of treatment effectp-value
15N application timing0.00080.0055<0.0001
Predecessor cropn.sn.sn.s
15N appl. timing × Predecessor cropn.sn.sn.s
2SowingBerseem clover12.0 ± 2.5 B5.6 ± 1.89.7 ± 3.0
Oat9.7 ± 0.9 B4.9 ± 1.116.8 ± 1.7
Lupine11.4 ± 1.1 B5.2 ± 1.214.5 ± 1.4
L-O mixture12.0 ± 3.2 B6.8 ± 2.513.5 ± 4.4
No CC (control)8.5 ± 1.1 B3.6 ± 0.9 B14.4 ± 1.9
V10 stageBerseem clover25.2 ± 4.7 A8.7 ± 0.719.5 ± 5.2 ab
Oat22.7 ± 2.2 A9.7 ± 2.023.2 ± 3.1 a
Lupine25.7 ± 3.6 A8.7 ± 1.16.7 ± 5.0 b
L-O mixture23.7 ± 1.8 A9.3 ± 1.110.7 ± 2.9 ab
No CC (control)19.8 ± 3.4 A8.9 ± 2.2 A21.7 ± 3.1 ab
Significance of treatment effectp-value
15N application timing<0.00010.0043n.s
Predecessor cropn.sn.sn.s
15N appl. timing × Predecessor cropn.sn.sn.s
Different lowercase letters within a column indicate differences between predecessor crops within each site and each 15N application timing, and different capital letters within a column indicate differences between 15N application timing within each site and each predecessor crop being significant at a level p < 0.05. Ndff, nitrogen derived from fertilizer; n.s, not significant.
Disclaimer/Publisher’s Note: The statements, opinions and data contained in all publications are solely those of the individual author(s) and contributor(s) and not of MDPI and/or the editor(s). MDPI and/or the editor(s) disclaim responsibility for any injury to people or property resulting from any ideas, methods, instructions or products referred to in the content.

